Embed Size (px)
Citation preview

2012.10.30.
1
COURSE FAQ
Forthcoming lectures:16. October – „IGT lecture”23. October – NO LECTURE, holiday30. October – MR Spectroscopy6. November – PET + Final Test
Test:- Basic imaging techniques, what are they- 5-10 easy, simple choice questions- If November 6. is not good for everyone, I will organize extra
time for getting the short test done
Study material:Lecture material will be distributed in PDF 2 wks before thetest.
In vivo MR spectroscopy
Ervin BerényiAndrás Jakab
Diagnostic neuroimaging modalities
CT – Computed TomographyBrain anatomyStereotactic reference frame
Structural MRIFine brain anatomyVascular structure
Diffusion, perfusion MRIFine pathologicalinformation
Intra-operative imagingmodalities, open MRI, low-field
Positron EmissionTomography PETBrain metabolismBrain function
Functional MR imaging fMRIBrain function
Electro encephalography, LORETTA, Magnetoencephalography
MR SpectroscopyBrain metabolismBiochemical mapping
Take home message about MR spectroscopy
• Performing NMR experiments for an image pixel
• Spectrum of brain chemicals, i.e. metabolites Diagnose their alterationsmetabolites. Diagnose their alterations.
• Display, measure:– Choline– Creatine– N-acetyl-aspartate– Lactate– Lipids

2012.10.30.
2
History of MR imaging
1973 Zeugmatography Lauterbur - Nobel, 2003
NMR FourierZeugmatography
1975
1977. Július 3. 4:45 First human MR image
Ernst – Nobel, 1991
Damadian1977 EPI Mansfield – Nobel prize, 2003
1946
60’s
Bloch, Purcell – Nobel 1952
Spectroscopy
NMR phenomenon
Ernst – Nobel, 1991
60’s-70’s Relaxometry of living tissue
Hazlewood, Damadian, Ling…
Cancer detectionwith NMR
Damadian, US Patent 3,789,832
g g p y ,
1972
Nobel prizes
• Isidor Isaac Rabi(1898-1988)
• 1944 – “developing a method to examine themagnetic properties of
b l
• Otto Stern (1988-1969)• 1943 – “proton magnetic
spin discovery”
protons by nuclearresonance”
The Birth of NMR
• 1952 – Felix Bloch & Edward Mills Purcell• “for the precision measurements on nuclear magnetic resonance”
(1905-1983) (1912-1997)Stanford Harvard
The The firstfirst 11H NMR H NMR spectrumspectrum of of waterwater
Bloch, F.; Hansen, W. W.; Packard, M. Bloch, F.; Hansen, W. W.; Packard, M. The nuclear induction experiment.The nuclear induction experiment. Physical Review (1946), 70 474Physical Review (1946), 70 474--85. 85.
NMR spectroscopy
• Richard Ernst • 1991 – “developing high
resolution NRM spectroscopy”
Magnetic resonance imaging(MRI !)
• 2003 – Paul Lauterbur & Sir Peter Mansfield
(1929-2007) (1933-)

2012.10.30.
3
Damadian’s pattern from 1972 Lauterbur’s 1973 Nature paper
Indomitable1977.0,05-0,1 TSzupravezető54,43 kg
Damadian, Minkoff, Goldsmith
Damadian and the coil
The first MR image of a human
1977. Július 3. 4:45, Minkoff
The first pathological case
Physiol. Chem. & Phys., 10:285-87, 1978.

2012.10.30.
4
First pathological case – lungcancer
Physiol. Chem. & Phys, 10:285-87, 1978.
Basics of MR spectroscopy
• Nuclei of atoms bear a physical propertycalled a spin.
• All moving charged bodies create aAll moving, charged bodies create a magnetic field around themselves
• Nuclei with spins act as small magnets
Basics of MR spectroscopy
• In the presence of a strong externalmagnetic field, nuclei spins are orientedand show precession with a well-defined frequencydefined frequency
• This is the Larmor frequency which isproportional to the strength of theexternal field
• This is the resonance frequency of thegiven nucleus
Basics of MR spectroscopy• If a nuclei is in a different
microenvironment, its resonantfrequency is altered
This means that atomic bonds and• This means that atomic bonds and neighbouring atoms determine theresonance frequencies (Chemical Shift)
• One can depict it using a spectrum, where each peak represents a specificatom is a specific bond
EthanolEthanol 11H NMR H NMR spectrumspectrum
Chemical shift1951
Modern ethanol spectrModern ethanol spectrumum
Arnold, J.T., S.S. Dharmatti, and M.E. Packard, J. Chem. Phys., 1951. Arnold, J.T., S.S. Dharmatti, and M.E. Packard, J. Chem. Phys., 1951. 1919: p. 507. : p. 507.

2012.10.30.
5
Free Induction Decay
FT
FT
Processing for MRS
Where can MRS be used?
• Proton MRS– Brain– Prostate– Liver
• Phosphorus MRS– Liver– Heart– Muscles
Different types of MRS• Volume selective MRS• MRS Imaging (MRSI) - metabolite mapping
– Proton (H1)• NAA map• Cho map• Cr map• Cr map• Lac map• Citrate map (prostate)
– Phosphor (P31)• Pi map• PCr map• ATP subtypes
– C13
• Pl. hyperpolarized imaging
Single Volume Localization
RF
Gx
Localized spectra is obtained from a single volume of interest (VOI)Localization is achieved by
RF
Gy
RF
Gz
ysequential selection of three orthogonal slicesThe size and location of VOI can be easily controlledAnatomic 1H images are used for localizing the VOI
Image selected in vivo spectroscopy, ISIS
Point resolved
Single Volume Localization
Po nt resolved spectroscopy, PRESS
Stimulated echo acquisition mode, STEAM

2012.10.30.
6
RF
GxGyGz
90°180° 180°
Point Resolved Spectroscopy, PRESS
(TE1+TE2)/2TE1/2Gz
TE2/2
A slice-selective 90o pulse is followed by two slice-selective 180o refocusing pulsesAchieves localization within a single acquisitionSuitable for signals with long T2 – 1H MRS
90° 90° 90°
RF
Gx
Gy
Gz
Stimulated Echo Acquisition Mode, STEAM
TE/2 TE/2TM
Gz
Three slice-selective 90o pulses form a stimulated echo from a single voxel.Achieves localization within a single acquisitionOnly half of the available signal is obtainedCan achieve shorter TE than PRESS
Effects of MR Parameters on PRESS spectra
Repetition Time, TRNumber of Signal AveragesEcho Time, TEVoxel Size
Single Voxel Spectroscopy: Overview
Simplicity
Flexibility in voxel size and position
Accurate definition of VOI
Excellent shim and spectral resolution
Many voxels within the same dataset
RF
90°
Chemical Shift Imaging
Multiple localized spectra are obtained simultaneously from a set of voxels spanning the region of interest
Gslice
G y
G z
Uses same phase-encoding principles as imaging
No gradient is applied during data collection, so spectral information is preserved
Display of all spectra
Underlying reference image shows voxel position
CSI Spectral Map
Individual spectra can be displayed enlarged
Spectral map can be archived together with the reference image and the CSI grid

2012.10.30.
7
CSI Data Analysis
Image showing voxel position
Spectrum from a voxel
MR spectroscopic imaging,Chemical shift imaging (CSI)
TumorNormal
Cho
Necrosis
NAA
CrtCho
Primer Progressiv Aphasia
NAA/Cho NAA
Cho Cre
CSI: Overview
Advantages
Acquisition of multiple voxels
Metabolite images, spectral maps, peak information maps, and results table
Many voxels within the same dataset
Disadvantages
Large volume – more difficult to shim
Voxel bleeding
Large datasets
Nucleus Spin γ, MHz/T Natural Abundance
Relative Sensitivity
1H 1/2 42.576 99.985 1002H 1 6.536 0.015 0.96
3He 1/2 32.433 .00013 44
Important Nuclei for Biomedical MR
13C 1/2 10.705 1.108 1.617O 3/2 5.772 0.037 2.919F 1/2 40.055 100 83.4
23Na 3/2 11.262 100 9.331P 1/2 17.236 100 6.639K 3/2 1.987 93.08 .05
1H – Neurotransmitters, amino acids, membrane constituents
2H – Perfusion, drug metabolism, tissue and cartilage structure.
13C – Glycogen, metabolic rates, substrate preference, drug metabolism etc
Important Nuclei for Biomedical MR
drug metabolism, etc.19F – Drug metabolism, pH, Ca2+ and other metal ion
concentration, pO2, temperature, etc23Na – Transmembrane Na+ gradient, tissue and cartilage
structure.31P – Cellular energetics, membrane constituents, pHi,
[Mg2+], kinetics of creatine kinase and ATP hydrolysis.
2012.10.30.
8
1H MR Spectroscopy
Brain 1-H MRS
CholineCreatine
N-acetyl aspartatewater
5.0 4.0 3.0 2.0 1.0ppm
Choline (lactate/lipid)
•NAA is a neuronal marker and indicates density and viability of neurons. •It is decreased in glioma, ischemia and degenerative diseases.
N-Acetyl aspartate (NAA)
CH3-C-NH-CH-CH2-COOHO
CH2-COOH
2.02, CH32.52, CH22.70, CH24.40, CH
Important 1H Signals
Creatine (Cr), phosphocreatine (PCr)
NH2-C-N-CH2-COOHCH3
NH3.04, CH33.93, CH2
•Cr is a marker of aerobic energy metabolism•Cr signal is constant even with pathologic changes and may be used as a control value• However, isolated cases of Cr deficiency may occur in children
•Cho compounds are involved in phospholipidmetabolism of cell membrane.•Increase Cho mark tumor tissue or multiple sclerosis plaques
Choline (Cho), choline compounds
3.24, CH33.56, CH24.07, CH2
CH3-N-CH2-CH2-OH
CH3
CH3
Important 1H Signals
plaquesGlutamate (Glu), glutamine (Gln)
2.1, CH22.4, CH23.7, CH
•Glu is a neurotransmitter, Gln a regulator of Glumetabolism•It is hardly possible to detect their signals sepratly. The signals are jointly designated “Glx”.
HOOC-CH2-CH2-CH-COOH
NH2
NH2-CH2-CH2-CH-COOH
NH2
•Lactate is the final product of glycolysis•It can be detected in ischemic/hypoxic tissue and tumors indicating lack of oxygen
Lactate (Lac)
1.33, CH34.12, CH
Taurine (Tau)•Cells examination indicates
CH3-CH-COOH
OH
Important 1H Signals
3.27, NCH23.44, SCH2
•Cells examination indicates taurine synthesis in astrocytes
NH2-CH2-CH2-S-OH
PO4-
PO4-
PO4- PO4
-
PO4-
PO4-
Myo-inositol (Ins)
3.56, CH
•Ins marks glia cells in brain •It is decreased in hepatic encephalopathy and elevated in Alzheimer’s disease.
Neurochemical pathways & neuro-MRS

2012.10.30.
9
A normal brain MR spectrum The effect of echo time on the spectra
Mitochondrial myopathy
TE 144 ms TE 288 ms
Quantitative MRS
• Metabolit ratios• Cr is stable, we compare metabolites to
this• Contralateral – CSI• Water as reference signal (proton cc ≈ 77-
88 M)• Water content• External reference (not so practical)
Proton spectrum metabolites Quantitativ MRS Fantom - QA
• Components:– 12,5 mM NAA– 10 mM Cr– 3 mM Cho, 12,5 mM Glu, ,– 7,5 mM mI– 5 mM Lac
• 50 mM-os foszfát pufferben (7,2 pH; 1% Magnevist; 0,1% Na-azide)
2012.10.30.
10
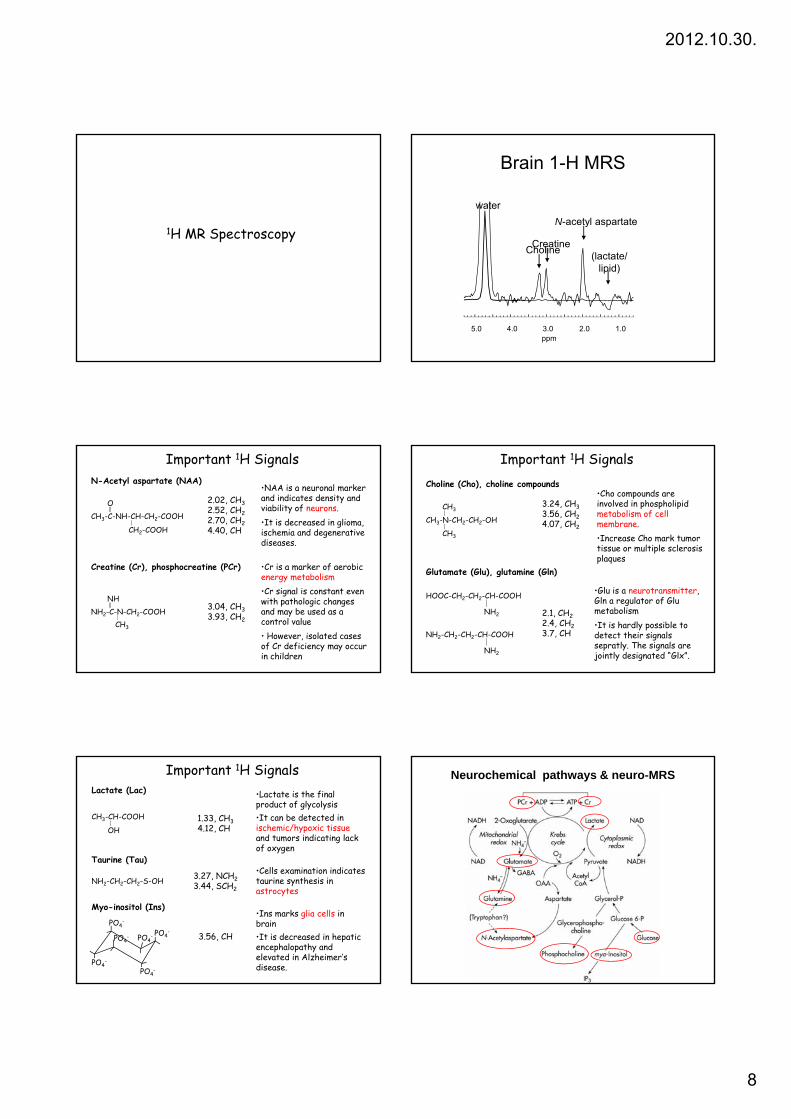
The proton MR spectrum variesby age
Age related changes of theproton spectrum
MRS indications for newborns
• Hypoxia, but normal UH, CT, MRI, SPECT, PET
• No contraindicationsNo contraindications• Lactate is elevated, NAA & Cr reduced• Sensitivity: high• Specificity: lower, developmental disorders
affect it as well
Neonatal hypoxia
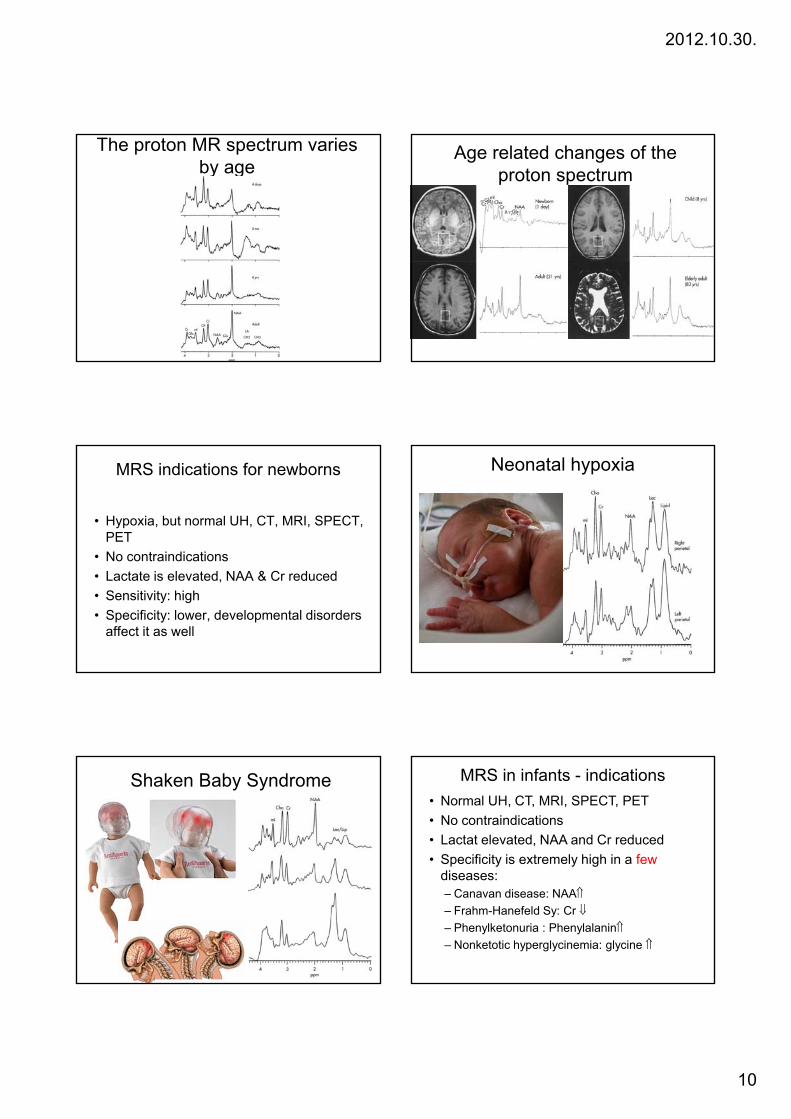
Shaken Baby Syndrome MRS in infants - indications• Normal UH, CT, MRI, SPECT, PET• No contraindications• Lactat elevated, NAA and Cr reduced• Specificity is extremely high in a few
diseases:– Canavan disease: NAA⇑– Frahm-Hanefeld Sy: Cr ⇓– Phenylketonuria : Phenylalanin⇑– Nonketotic hyperglycinemia: glycine ⇑
2012.10.30.
11
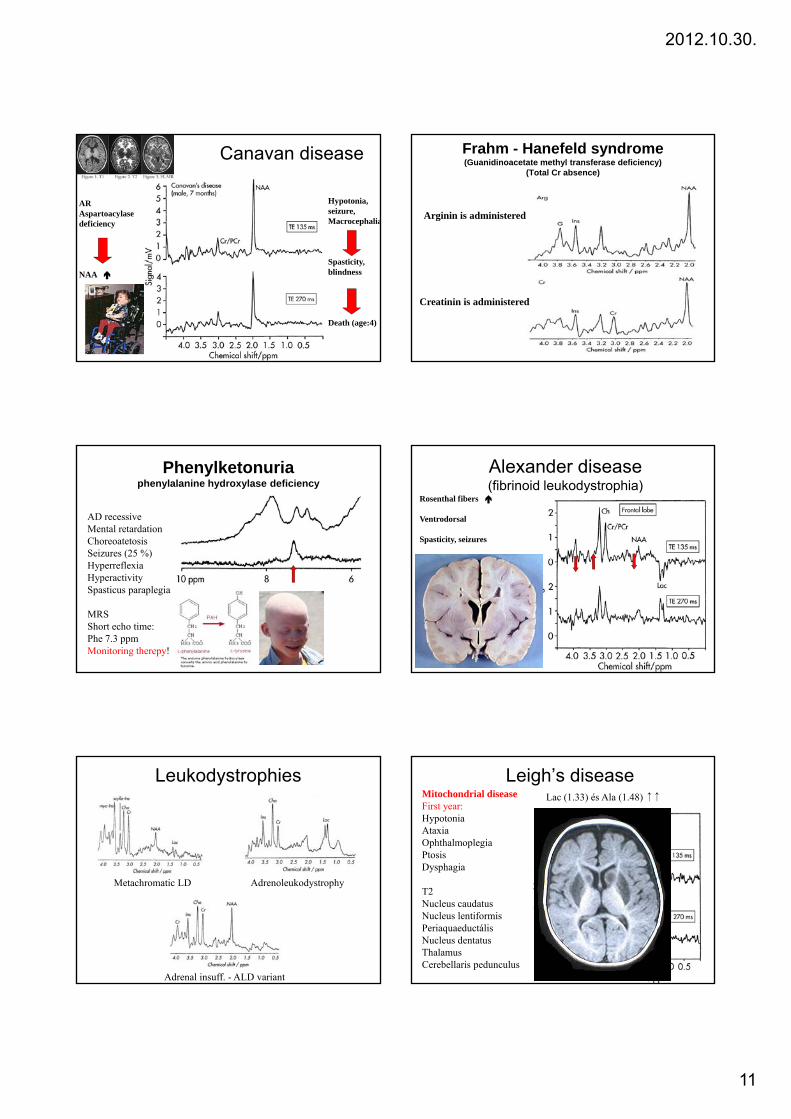
Canavan disease
ARAspartoacylasedeficiency
Hypotonia,seizure,Macrocephalia
NAA Spasticity,blindness
Death (age:4)
Frahm - Hanefeld syndrome(Guanidinoacetate methyl transferase deficiency)
(Total Cr absence)
Arginin is administered
Creatinin is administered
Phenylketonuriaphenylalanine hydroxylase deficiency
AD recessiveMental retardationChoreoatetosisSeizures (25 %)HyperreflexiaHyperactivitySpasticus paraplegia
MRSShort echo time:Phe 7.3 ppmMonitoring therepy!
Alexander disease(fibrinoid leukodystrophia)
Rosenthal fibers
Ventrodorsal
Spasticity, seizures
Leukodystrophies
Metachromatic LD Adrenoleukodystrophy
Adrenal insuff. - ALD variant
Leigh’s diseaseMitochondrial diseaseFirst year:HypotoniaAtaxiaOphthalmoplegiaPtosisDysphagia
Lac (1.33) és Ala (1.48) ↑↑
Dysphagia
T2Nucleus caudatusNucleus lentiformisPeriaquaeductálisNucleus dentatusThalamusCerebellaris pedunculus
2012.10.30.
12
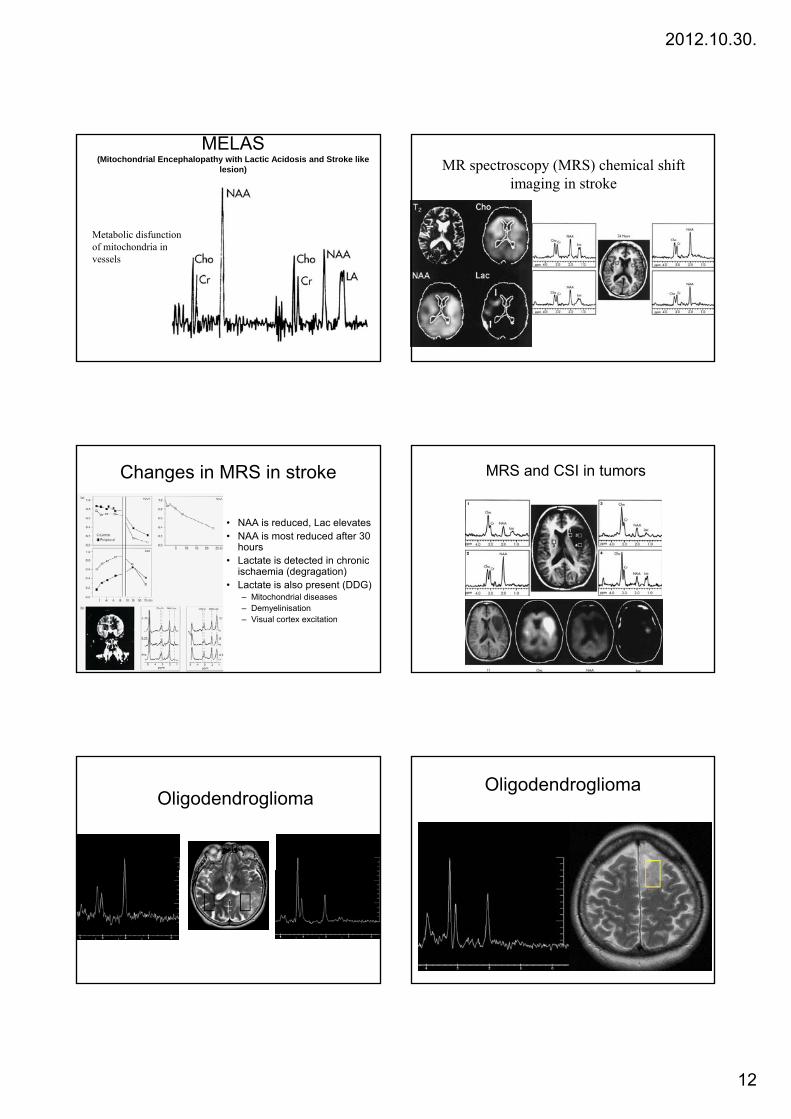
MELAS(Mitochondrial Encephalopathy with Lactic Acidosis and Stroke like
lesion)
Regionális variabilitás:legérintettebb az Occipitális lebeny
Metabolic disfunctionof mitochondria inof mitochondria invessels
MR spectroscopy (MRS) chemical shift imaging in stroke
Changes in MRS in stroke
• NAA is reduced, Lac elevates• NAA is most reduced after 30
hoursLactate is detected in chronic• Lactate is detected in chronicischaemia (degragation)
• Lactate is also present (DDG)– Mitochondrial diseases– Demyelinisation– Visual cortex excitation
MRS and CSI in tumors
OligodendrogliomaOligodendroglioma
2012.10.30.
13
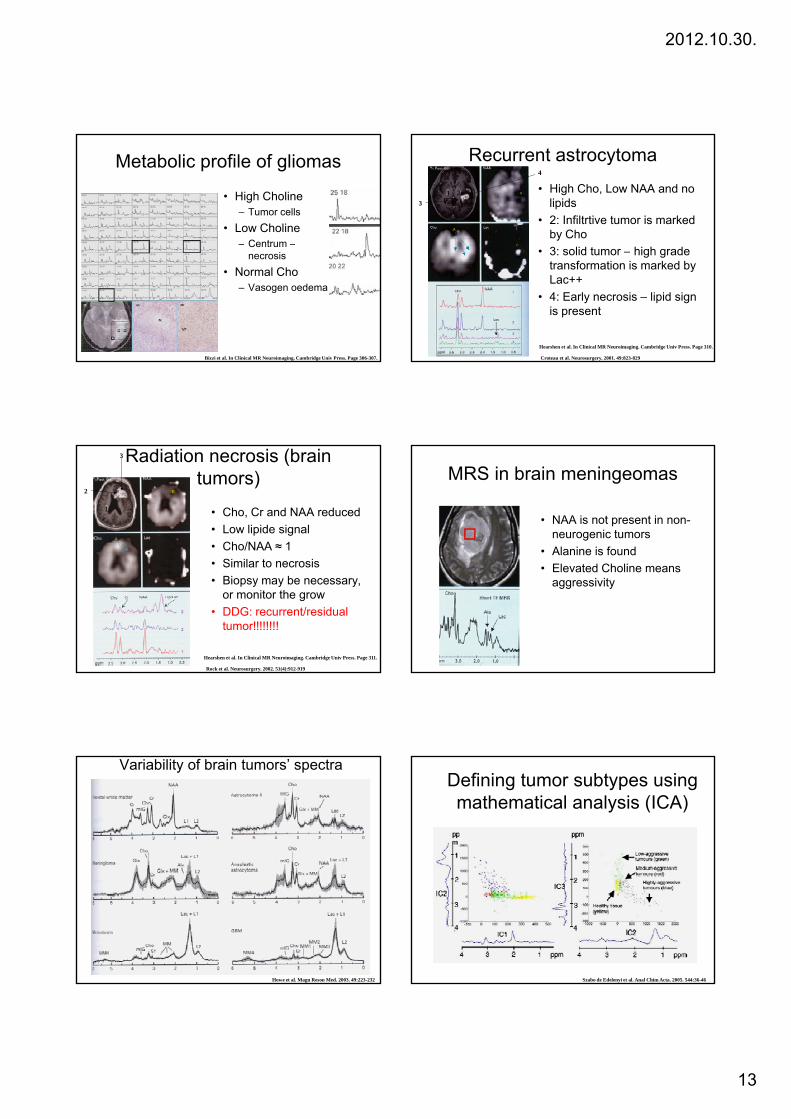
Metabolic profile of gliomas
• High Choline– Tumor cells
• Low Choline– Centrum –
necrosis• Normal Cho
– Vasogen oedema
Bizzi et al. In Clinical MR Neuroimaging. Cambridge Univ Press. Page 306-307.
Recurrent astrocytoma
• High Cho, Low NAA and no lipids
• 2: Infiltrtive tumor is markedby Cho3 lid t hi h d
1 23
4
• 3: solid tumor – high gradetransformation is marked byLac++
• 4: Early necrosis – lipid signis present
Croteau et al. Neurosurgery. 2001. 49:823-829
Hearshen et al. In Clinical MR Neuroimaging. Cambridge Univ Press. Page 310.
Radiation necrosis (braintumors)
• Cho, Cr and NAA reduced• Low lipide signal• Cho/NAA ≈ 1
Si il i
1
3
2
• Similar to necrosis• Biopsy may be necessary,
or monitor the grow• DDG: recurrent/residual
tumor!!!!!!!!
Rock et al. Neurosurgery. 2002. 51(4):912-919
Hearshen et al. In Clinical MR Neuroimaging. Cambridge Univ Press. Page 311.
MRS in brain meningeomas
• NAA is not present in non-neurogenic tumors
• Alanine is found• Elevated Choline means
aggressivity
Variability of brain tumors’ spectra
Howe et al. Magn Reson Med. 2003. 49:223-232
Defining tumor subtypes usingmathematical analysis (ICA)
Szabo de Edelenyi et al. Anal Chim Acta. 2005. 544:36-46

2012.10.30.
14
Nosologic imaging
Szabo de Edelenyi et al. Nature Medicine. 2000. 6:1287-89
INTERPRET(International Network for Pattern Recognition of Tumours
Using MR Spectroscopy)
• EU funded research formaking MRS diagnosticsimpler
• Protocoll (methodical) consent• 800 sample database• Automatic analysis• Computer aided diagnostic
tool
Arjan W. Simonetti PhD Thesis 2004.http://azizu.uab.es/INTERPRET/
Tumefact Mulitple Sclerosis
• Similar appearance to tumors, gliomas, BUT DD:Tu: NAA ↓↓, Perf ↑↑;MS: mI/Cr↑↑ Diff ↓↓MS: mI/Cr↑↑, Diff ↓↓
• Diffuse methabolic changes• Acute-chronic plaques• Recurrent remittent (RR) –
Progressive secondary (PR) form
Szabo de Edelenyi et al. Nature Medicine. 2000. 6:1287-89
Abscessus vs. tumorAbscessus GBM
Acetate
Nakaiso et al. Neurol Med Chir. 2002. 42:346-348
Ac: 1.92 ppmSuccinateSuc: 2.4 ppmAspartateAsp:2,6 ppm
Suc
Juvenile SLEPsychiatrical symptomsMRS early diagnosis, beforeMR lesions are apparent:Cho ↑; NAA/Cr ↓
Contralateral
Lesion
Steens et al. Ann Rheum Dis. 2003. 62:583-586
MRS in epilepsyCr/NAA map
Hetherington et al. Magn Reson Imaging. 1995. 13:1179

2012.10.30.
15
Mitocondrial myopathy
TE 144 ms TE 288 ms
Primer Progressiv Aphasia
NAA/Cho NAA
Cho Cre
Summary: the main advantagesof clinical MRS
• In vivo biochemical diagnosis• Patterns of metabolites help us to:
– Monitor therapyMonitor therapy– Progression-regression– Prognostic possibilities (i.e. tumors,
Alzheimer)
Problems of clinical MRS
• One must STANDARDIZE the– acquisition– reading– Radiological reports
• Reproducibility is not high• Absolute quantification is problematic• Sedation (pediatric or non-cooperative)• Team work is necessary (radiologist,
physicist, biochemist, etc.)