Embed Size (px)
Citation preview

Net Promoter - Ward Breakdown - June 2013 APPENDIX 4
WardWeek 1 1st-
7thWeek 2 8th-
14thWeek 3
15th-21stWeek 4
22nd-30thTOTAL
Princes 1 100.00 33.33 100.00 0.00 66.67
Princes 2 0.00 100.00 62.50
Codicote 100.00 90.00 66.67 77.78 81.82
5A 77.27 81.82 100.00 25.00 76.19
5B 90.91 81.82 46.67 66.67 69.77
7BN 54.55 45.00 61.11 66.67 55.17
8A 75.00 100.00 85.71
8B 76.92 100.00 100.00 88.89
11 BN 89.47 75.00 70.59 78.57
ITU/HDU NA
SURGERY 81.16 68.42 71.88 70.91 72.79
SSU 100.00 100.00 75.00 70.00 75.00
Digswell 85.71 85.71
Stanborough 100.00 75.00 100.00 94.12
6A 100.00 100.00 87.50 92.31
6B 100.00 80.00 100.00 92.86
9A 80.00 57.14 66.67 80.00 65.38
9B S&N 61.90 100.00 80.00 71.43 72.34
10B S&N 100.00 100.00 50.00 75.00
Pirton 66.67 100.00 100.00 66.67 81.82
Barley 100.00 75.00 100.00 80.00 83.33
MEDICINE 76.19 75.00 75.44 82.14 77.34
7A Gynae 85.71 100.00 100.00 100.00 95.00
WOMEN'S 85.71 100.00 100.00 100.00 95.00
Elizabeth House 100.00 100.00 100.00 100.00 100.00
CLINICAL SS 100.00 100.00 100.00 100.00 100.00
MSH 100.00 100.00 0.00 100.00 77.78
10 50.00 80.00 64.71 80.00 68.09
11 81.82 45.45 90.00 37.50 65.00
CANCER 69.57 68.97 68.97 60.00 67.71
TOTAL TRUST 79.75 73.02 75.60 77.62 76.32
Continued over page …
Cancer
Surgery
Women's
CSS

% Response rate by Ward for June 2013
Ward%
response rate
Princes 1 32.14Princes 2 25.00Codicote 55.005A 39.255B 52.447BN 58.008A 6.738B 34.1811 BN 64.04ITU/HDU NASURGERY 41.61SSU 30.88Digswell 14.00Stanborough 53.136A 32.506B 60.879A 75.369B S&N 39.1710B S&N 10.53Pirton 37.93Barley 75.00MEDICINE 41.387A Gynae 42.66WOMEN'S 42.66Elizabeth Suite 21.21CLINICAL SS 21.21MSH 75.0010 62.8211 64.52CANCER 64.47TOTAL TRUST 42.56
Breakdown of responses by week for June 2013 (Trust-wide)
1-7 June 135 23 5 0 0 5 163 2 79.75 338 48.817
8-14 June 144 39 3 3 0 6 189 0 73.02 328 57.622
15-21 June 130 35 2 0 1 3 168 4 75.60 443 38.826
22-30 June 113 28 2 0 0 2 143 0 77.62 463 30.886
TRUST TOTAL 522 125 12 3 1 16 663 6 76.32 1572 42.56
Un
lik
ely
Ex
t. u
nli
ke
ly
Ex
t. L
ike
ly
Lik
ely
Ne
ith
er
lik
ely
/ u
nli
ke
ly
No
. o
f D
isc
ha
rge
s
Re
sp
on
se
Ra
te
Do
n't
kn
ow
Net
Pro
mo
ter
To
tal
det
ract
ors
Re
sp
on
se
s

Mon
thly
Targ
et
Apr
il
May
June
July
Aug
ust
Sept
embe
rO
ctob
er
Nov
embe
r
Dec
embe
r
Janu
ary
Febr
uary
Mar
ch
Red>1Green=0Red>1Green=0Red>9Amber=8Green<7Red>1Green=0Red>1Green=0Red>2Amber=1-2Green=1Red>14Amber=13Green<12Red>28Amber27Green<26Red>45Amber 42-44Green<41Red>10Green<9Red>106Amber=97-105Green<96Red>43Amber40-42Green<39Red>7Amber=6Green<5Red>63Amber57-62Green<56Red>75Amber68-74Green<67Red>TBAAmber>TBAGreen>TBA
0.58
The
Wor
kfor
ce(In
clud
ing
Con
trac
tors
)Inc
iden
tsVi
sito
rInc
iden
tsPa
tient
Inci
dent
s
5.58 14
KeyPerformanceIndicatorsReportedToRAQC
5
13
41
0
19
Musculoskeletal injuries
8
4.67 3 8 2
20
Contactdermatitis/latex 0.42 0 0 0
25
Workplacestress 3.25 5 10 5
9 9 7
1Employerliabilityclaims 0.75 0 1 0
3.42 11 3 3
2 5 8
17Slips, Trips&Falls
1RIDDORincidents 2.17
0 0 0 0
1
0
H&Spublicliabilityclaims 0.08 0 0 1
0RIDDORincidents 0 0 0
0 0
Physical assault 0
0
0
0
0
H&Spublicliabilityclaims
0
0 0
Slips, Trips&Falls(notincludinginpatient falls)
0 0
2 3
2013/14 YearlyRAGThreshold
FinancialYear20132014
RIDDORincidents 0 0 0 0
YTD
TBCMandatorytraining
Slips, Trips&Falls 1
Sharpsincidents 8
Physical assault
11.6% 13.8% 15.2% 15.2%

Abc
Performance Exception Report – June 2013 Target/ Core Standard: Performance Appraisal
NB: In month performance for June 2013 (month 3) = Red The Issue In June the Trust’s appraisal rate fell to 65.48%. This gives an overall Trust red rating as appraisal rates have now fallen below the 70% threshold for the third consecutive month. With the exception of the Women and Children’s Division, all divisions are below the threshold.
Division May 2013 June 2013 Division Cancer Services 70.43% 68.09%Division Clinical Support Services 70.01% 65.75%Division Medicine 66.98% 66.21%Division Non Clinical Support Services 69.78% 67.04%Division Surgery 54.34% 56.82%Division Womens and Childrens 68.54% 73.45%Grand Total 66.25% 65.48%
To maintain our current appraisal rate, 8% of staff need to be appraised each month. To achieve a 90% appraisal rate by October 2013, an uplift of 7% of staff need to be appraised, in addition to the 8% maintenance rate. The trajectory being a monthly appraisal completed rate of 15% . Next Steps Each division has set an appraisal trajectory which they are working towards. These trajectories are based on their current vacancy rates and their current appraisal rates. The Surgery Division ‘appraisal front sheet amnesty’ pilot commenced in June. Managers report that appraisal data is not accurate due to missing data between the completion and sending front sheets to the OD team for recording in ESR and OD receiving completed front sheets. In an effort to easily capture any missing data, managers in the Surgery Division are sending a list of completed appraisals to OD for recording in ESR. The surgical division has seen an increase in their appraisal rates during June. The division expects to see a further increase in July as some appraisal compliance data did not reach the OD team prior to the deadline for inclusion in the July Board Report. The appraisal amnesty appears to be having a positive impact on appraisal rates, not only in terms of updating the data, but in terms of encouraging managers to carry out appraisals. Next steps If the appraisal amnesty continues to prove to be beneficial on appraisal compliance in the surgery division during July, the recommendation will be to roll out the appraisal amnesty to other divisions.
LEAD DIRECTOR – Director of Workforce and OD

Statutory and Mandatory Training Performance Exception Report – July 2013
Target / Core Standard:
Trust Target: The target for staff compliance in the 9 competencies of statutory and mandatory training is 90% by September 2014 Current Position and Progress: The month of June has seen another rise in staff compliance with all 9 competencies from 13.8%
to 15.17%. The attached dashboard identifies compliance by individual competency. The anticipated reduction in compliance in relation to Information Governance (due to a drive over the last 2 years in the months of June/July) was off set by an increase in additional training sessions and Trust wide communication.
Vital training is fully booked until the end of the year; this is due to the high profile of Statutory and Mandatory Training, with mangers and individuals taking responsibility for compliance.
The Training Needs Analysis (TNA) has been completed and feedback from Divisional Directors has been requested by July 12th. The upload of this information on to ESR will begin in August.
Communication following the above activity will go out to all staff which will identify individual ESR profiles for Statutory and Mandatory training. Individuals will be given a month to evidence any competencies they feel they are compliant with but which have not been captured on the system.
Compliance in Safeguarding Adults training (68.63%) and Safeguarding Children training (72.32%) continues to increase slowly against the target of 95%.
DNA (Did Not Attend) has reduced to 10.1% compared to May (13.8%), although it is recognised that the rate still remains high.
Capacity projection requires 114 non-medical clinical and 70 non-clinical places on Statutory and Mandatory Training a month. These places are distributed through the 3 main sites of the Trust. Medical and Dental training is delivered via The Medical Mandatory Update day, and reflects the 9 core competencies. In July and August a total of 518 places have been made available for non-medical clinical staff and 40 places for medical and dental staff.
Trajectory and Reporting of Statutory and Mandatory Compliance The attached dashboard (appendix 1) has been adopted as the monitoring tool alongside the trajectory for capacity for Statutory and Mandatory Training. This tool displays performance and key analytical messages and actions. The “forward look” statistics are being developed further to identify keys data that will further inform reporting and analysis. The dashboard will be available in this format to support divisional action plans to tackle compliance.
Statutory and Mandatory Training Performance Exception Report V3 July 2013 C.Fowler 1

The graph below shows the compliance figures for June 2013 against the trajectory.
ESR (July 2013) Taking into consideration the ’Our Changing Hospitals Programme’, staff compliance has been measured by site. The site with the lowest compliance is Mount Vernon Cancer Centre 3.1%, compared with QE11 14.45% and Lister 17.2%. The low compliance at MVCC was anticipated due to a sporadic training being delivered until the introduction of Vital this month. 238 places have been made available for staff during July and August. These sessions are fully booked. Medical and Dental staff compliance with training has been further analysed as this appears unexpectedly low. Discussion has taken place with the Medical Director and the Director of Medical Education. Some inaccuracies with regard to data reporting have been identified in addition to a lack of alignment with e-learning completion and ESR. It is expected these issues will be rectified following the gap mapping process and the August upload of the national competencies. Actions taken to increase compliance; To continue compliance growth rates a number of measures have been put in place;
Targeting staff non compliant with any competency (3%). Staff with only 1-2 competencies required and the remaining competencies compliant past
December 2013 are being targeted to reach full compliance. At present 36% of staff have 7 or more competencies.
Projecting competencies where high non-compliance is forecast over the next 12 months. In June and July Information Governance was forecast to drop significantly, a drive to raise staff awareness has ensured the compliance figures continue to grow.
The competencies with the lowest compliance levels remain the e-learning modules. A number of actions have been taken to action this: 1. Facilitated e-learning and SMART card support ‘drop in’ sessions twice a month commencing mid July. These will be the second Monday and fourth Friday of every month. 2. Face to face sessions to deliver Equality and Diversity and Information Governance training. 3. One to one sessions can be booked in the library.
Statutory and Mandatory Training Performance Exception Report V3 July 2013 C.Fowler 2

Statutory and Mandatory Training Performance Exception Report V3 July 2013 C.Fowler 3
4. The preceptorship programme for new Clinical Support workers now includes Equality and Diversity and Information Governance as face to face sessions.
Additional Vital training days have been arranged at Mount Vernon Cancer Centre, the Lister and QEII Hospitals as all current Vital programmes are at full capacity.
Additional Safeguarding Adults and Safeguarding Children sessions have been arranged. The Knowledge centre pages will be re-launched in August to make booking easier and give
individuals’ access to the TNA. Training capacity reconfigured monthly to reflect ongoing projections against compliance. Current competencies for a few staff may alter due to profiles on ESR being realigned and re-
set. In August a number of staff will find themselves non-compliant where they were compliant, due to competencies that were 3 yearly becoming 2 yearly. This requirement for training has been anticipated but may cause a reduction in compliance in the short term. Patient handling and conflict resolution have been identified as a particular issue.
Data inputting to be centralised where possible to reduce inaccuracies, a mapping matrix has been completed.
Data user group established to ensure standardisation of data processes. Plans to integrate the core competencies of training for clinical and non-clinical staff from
November 2013 will ensure effective use of resources including venues and trainers.
[End]

Statutory and Mandatory Training June 2013 data updateAssignments 5,329 5,255 (98.6%)
The Trust will reach 90% compliance by September 2014.
Change on Previous Period 1.5%Variance from Plan -8.0%
-0.6%0.1%2.0%
Enrolled Competencies TBCTBCTBC
Valid Frameworks
Predicted Compliance
Impact of StartersImpact of Leavers
Renewals Due
Like for Like Change
Forward Look
Performance
This report provides a month-end position.
Overall Compliance iscurrently 15.4% Nursing & Midwifery
Conflict Resolution (75%)
Equality & Diversity (62%)
Fire (62%)
General Health & Safety(73%)
Infection Prevention (73%)Information Governance(60%)
Moving and Handling (71%)
Safeguarding Adults (69%)
Safeguarding Children (73%)
Competency Framework
0% 10% 20% 30% 40% 50% 60% 70% 80% 90% 100%
All competencies
Eight Competencies
Seven Competencies
Six Competencies
Five Competencies
Four Competencies
Three Competencies
Two Competencies
One Competency
No competencies
Admin & Clerical
Other Clinical
Estates &Ancillary
Medical &Dental
All Staff who have...
Expected
Compliance byStaff Groups

def
Page no.
Appendix 1 Financial metrics 2
Appendix 2 Summary income and expenditure position 3
Appendix 3 Contract income by source 4
Appendix 4 Contract income by patient type 5
Appendix 5 Service line report 6
Appendix 6 Expenditure by Division 7
Appendix 7 Aged Debtors/Creditors and BPPC 8
Appendix 8 Balance sheet 9
Appendix 9 Capital Programme 10
Appendix 10 CIP delivery 11
Appendix 11 Agency Expenditure 12
Appendix 12 Phasing of FRR 13
FINANCE REPORT MONTH 3INDEX TO APPENDICES
Page 1 of 14

Appendix 1
0.6% 2 2
64.0% 2 5
-7.8% 1 1
-3.1% 1 1
30 4 3
2.1 2.2
Overriding rules
One financial criterion scored at '1' One financial criterion scored at '2'Two financial criteria scored at '2'Two financial criteria at '1' Less than 1 year as an Foundation Trust
Overriding rules rating 2 2
34Target
2% -0.5% -5% <-5%
<50%
Trust YTD figure
Score
Financial Risk rating is the weighted average of financial criteria scores after applying adjustment factors. This givesan indicative risk rating of:
5%
70%100%
250.25
Underlying performance
EBITDA % of plan achieved
I&E surplus margin
Maximum overall score
60
0.25 11%
2%3%
0.20
0.20
0.10
4
2321
>3%
9%
85%
Liquidity
2
<1%
WeightRating categories
5 1
1%
defFINANCE REPORT MONTH 3
FINANCIAL METRICS
Liquidity ratio (days)
Financial Criteria Metric to be scored
EBITDA margin %
Financial Efficiency
Achievement of plan
Net return after financing
50%
10 <10
1% -2% < -2%
15
Page 2 of 14

Appendix 2
def
Budget Actual Variance Budget Actual Variance Budget Forecast Variance£000 £000 £000 £000 £000 £000 £000 £000 £000
IncomeIncome from NHS activities 23,194 23,536 342 71,092 71,595 504 288,291 288,291 0Income from non NHS activities 440 515 76 1,305 1,380 75 5,818 5,818 0Other operating income 4,477 4,310 -167 13,472 13,047 -425 54,621 54,621 0Total Income 28,110 28,362 252 85,869 86,022 153 348,731 348,731 0
`Expenditure within DivisionsPay -18,524 -18,649 -125 -55,532 -56,222 -690 -220,065 -220,065 0Non-Pay -9,611 -9,875 -264 -29,309 -29,649 -340 -111,507 -111,507 0Unallocated Budgets -38 103 141 -188 387 575 -2,195 -2,195 0
Total expenditure within Divisions -28,173 -28,421 -248 -85,029 -85,484 -455 -333,767 -333,767 0
EBITDA -63 -59 4 840 538 -302 14,964 14,964 0
PDC Dividends payable -259 -259 0 -778 -778 0 -3,110 -3,110 0Depreciation & minor impairments -618 -618 0 -1,853 -1,853 0 -7,412 -7,412 0Investment Revenue 2 2 0 6 9 3 25 25 0Finance Costs -197 -197 0 -591 -591 0 -2,364 -2,364 0
NET SURPLUS / (DEFICIT) -1,134 -1,130 4 -2,375 -2,674 -299 2,103 2,103 0
EBITDA % delivered = 538/840 = 64.0%EBITDA margin = 538/86,022 = 0.63%I&E surplus margin = -2,674/86,022 = -3.1%
FINANCE REPORT MONTH 03TRUST INCOME AND EXPENDITURE
Current Month Year to Date F u l l Y e a r
Income and Expenditure Surplus 2013/14
-3,000
-2,000
-1,000
0
1,000
2,000
3,000
Apr May Jun Jul Aug Sep Oct Nov Dec Jan Feb Mar
2013/14 Actualsurplus /(deficit) cum
2012/13 Actualsurplus /(deficit) cum
2013/14Plannedsurplus /(deficit) cum
Page 3 of 14

Appendix 3
Plan Actual Variance Plan Actual Variance Plan Forecast Variance£000 £000 £000 £000 £000 £000 £000 £000 £000
Income from activities - NHSNational Commissioning Board 6,097 6,410 314 19,093 18,803 -290 76,989 76,989 0East & North Herts CCG 13,390 13,543 153 40,733 42,367 1,634 165,899 165,899 0Herts Valleys CCG 1,166 1,097 -70 3,456 3,141 -315 13,600 13,600 0Bedfordshire CCG 1,348 1,560 212 4,134 4,483 349 16,699 16,699 0Luton CCG 227 122 -104 697 701 4 2,820 2,820 0Cambridgeshire & Peterborough CCG 205 128 -77 503 265 -238 1,787 1,787 0West Essex CCG 21 29 8 66 82 16 266 266 0Hillingdon CCG 167 218 51 516 468 -48 2,089 2,089 0Brent CCG 21 7 -14 66 29 -37 268 268 0Harrow CCG 63 85 22 195 226 31 791 791 0Barnet CCG 26 36 10 80 61 -19 324 324 0Chiltern CCG 34 60 26 105 100 -5 425 425 0Other CCGs 21 39 18 81 83 2 363 363 0Non Contract Activity 179 207 29 658 654 -4 2,870 2,870 0NHSCB Public Health 229 -5 -234 710 133 -577 2,886 2,886 0Total income from activities - NHS 23,194 23,536 342 71,092 71,595 504 288,076 288,076 0
Income from non-NHS activitiesPrivate Patients 275 309 35 806 854 48 3,885 3,885 0Road Traffic Act 81 81 0 244 244 0 1,005 1,005 0Non NHS Other 84 125 41 256 282 27 928 928 0
Total income from non-NHS activities 440 515 76 1,305 1,380 75 5,818 5,818 0
Other operating incomeEducation, Training and Research 1,034 971 -63 3,163 3,093 -69 12,768 12,768 0Distinction / Merit Awards 72 72 0 239 239 0 889 889 0Hosted Services SLAs 295 292 -2 884 877 -7 3,538 3,538 0Non Patient Care Services 195 195 0 586 573 -13 2,644 2,644 0R&D Income 156 152 -4 740 715 -24 2,916 2,916 0Other Income 1,346 1,355 9 3,726 3,678 -48 15,330 15,330 0ISTC: SLAs 920 814 -106 2,759 2,496 -263 11,036 11,036 0ISTC: Transitional Relief 458 458 0 1,375 1,375 0 5,500 5,500 0
Total other operating income 4,477 4,310 -167 13,472 13,047 -425 54,621 54,621 0
Grand Total 28,110 28,362 252 85,869 86,022 153 348,515 348,515 0
def
Current Period Year to Date F u l l Y e a r
FINANCE REPORT MONTH 3ANALYSIS OF CONTRACT INCOME BY SOURCE
Page 4 of 14

Appendix 4
Plan Actual Variance Plan Actual Variance Plan Forecast Variance£000 £000 £000 £000 £000 £000 £000 £000 £000
Income from activities - NHS
Accident & emergency 1,176 1,053 -123 3,566 3,369 -197 14,302 14,302 0
Non-elective short stay 211 278 67 639 693 54 2,563 2,563 0Non-elective standard (incl excess bed days) 5,113 5,036 -78 15,511 15,780 269 62,616 62,616 0Total Non-Elective Inpatients 5,324 5,313 -11 16,150 16,473 323 65,179 65,179 0
Day Case 866 884 19 2,683 2,583 -100 11,029 11,029 0Elective standard (incl excess bed days) 1,396 1,448 52 4,324 4,176 -148 17,567 17,567 0Total Elective Inpatients/Day Case 2,262 2,332 71 7,007 6,759 -248 28,596 28,596 0
PbR outpatient consultant led first attendances 1,095 1,168 73 3,394 3,597 203 13,795 13,795 0PbR outpatient consultant led follow up attendances 1,324 1,292 -31 4,061 4,120 58 16,669 16,669 0Outpatient - other 732 863 131 2,243 2,472 229 9,271 9,271 0Outpatient procedures 437 366 -71 1,352 1,123 -229 5,492 5,492 0Total Outpatient 3,587 3,689 102 11,051 11,312 261 45,227 45,227 0
Direct access pathology 629 651 22 1,949 1,978 29 7,923 7,923 0Direct access radiology 257 390 134 796 963 167 3,234 3,234 0Renal dialysis services 982 929 -53 2,938 2,844 -94 13,276 13,276 0Neonatal & SCBU 324 336 12 984 1,137 153 3,946 3,946 0Intensive care 697 888 191 2,114 2,473 359 8,480 8,480 0Chemotherapy HCD 478 497 19 1,628 1,718 90 6,210 6,210 0PbR drug exclusions 400 379 -21 1,245 1,157 -87 5,104 5,104 0Ward attenders 290 271 -19 899 817 -82 3,655 3,655 0Maternity pathway 1,873 1,785 -87 5,680 5,640 -40 22,783 22,783 0Other Non-PbR Cost & volume services 740 690 -51 1,517 1,519 2 6,155 6,155 0Non-PbR block services 192 183 -10 1,371 1,371 0 5,573 5,573 0Total Non-PbR cost & volume 6,862 6,998 136 21,120 21,618 498 86,338 86,338 0
CQUIN 423 276 -146 1,311 1,026 -285 5,328 5,328 0
QIPP Savings Target 0 0 0 0 0 0 0 0 0Total Acute Services 19,634 19,663 29 60,205 60,556 351 244,970 244,970 0
Mount VernonPBR 1,975 2,206 230 6,091 6,366 274 24,775 24,775 0Non PBR 1,511 1,615 104 4,569 4,523 -46 17,622 17,622 0CQUIN 73 52 -21 227 151 -76 924 924 0Total Mount Vernon 3,560 3,873 313 10,887 11,040 152 43,321 43,321 0
Total income from activities - NHS 23,194 23,536 342 71,092 71,595 504 288,291 288,291 0 Income from non-NHS activitiesPrivate Patients 275 309 35 806 854 48 3,885 3,885 0Road Traffic Act 81 81 0 244 244 0 1,005 1,005 0Non NHS Other 84 125 41 256 282 27 928 928 0
Total income from non-NHS activities 440 515 76 1,305 1,380 75 5,818 5,818 0
Other operating incomeEducation, Training and Research 1,034 971 -63 3,163 3,093 -69 12,768 12,768 0Distinction / Merit Awards 72 72 0 239 239 0 889 889 0Hosted Services SLAs 295 292 -2 884 877 -7 3,538 3,538 0Non Patient Care Services 195 195 0 586 573 -13 2,644 2,644 0R&D Income 156 152 -4 740 715 -24 2,916 2,916 0Other Income 1,346 1,355 9 3,726 3,678 -48 15,330 15,330 0ISTC: SLAs 920 814 -106 2,759 2,496 -263 11,036 11,036 0ISTC: Transitional Relief 458 458 0 1,375 1,375 0 5,500 5,500 0
Total other operating income 4,477 4,310 -167 13,472 13,047 -425 54,621 54,621 0
Grand Total 28,110 28,362 252 85,870 86,021 153 348,731 348,731 0
def
Current Period Year to Date F u l l Y e a r
FINANCE REPORT MONTH 3ANALYSIS OF CONTRACT INCOME BY TYPE OF ACTIVITY
Page 5 of 14
Appendix 5
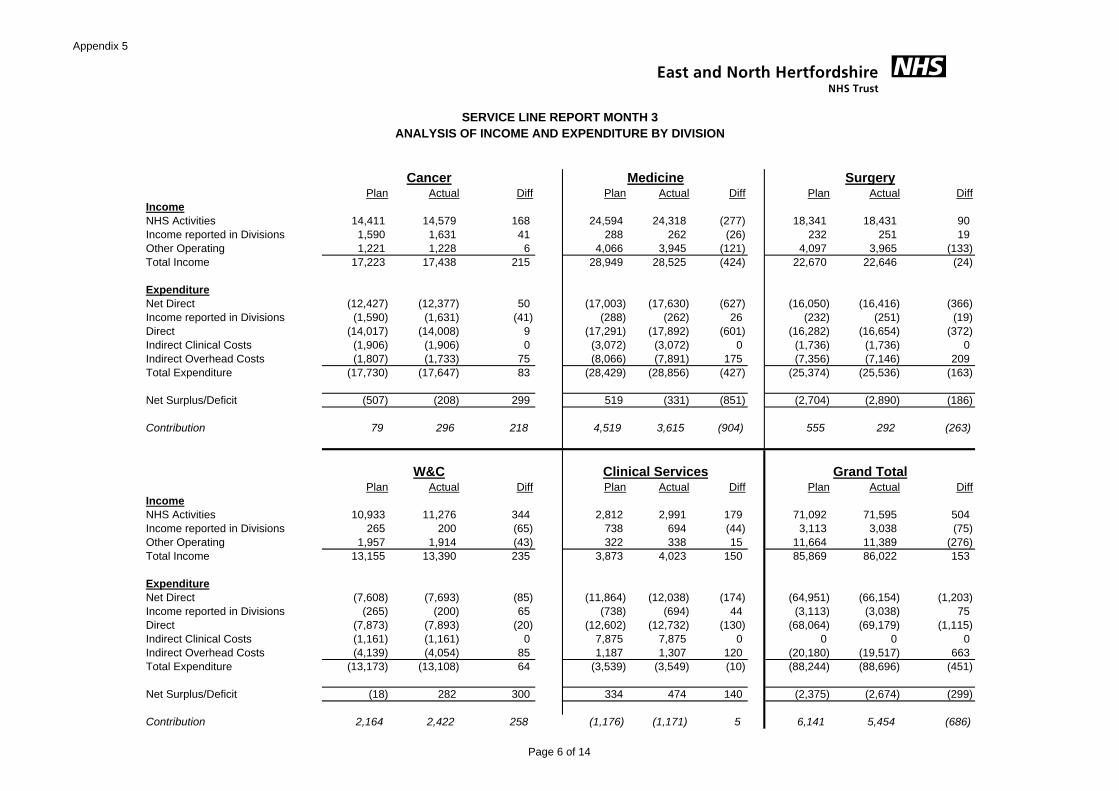
Plan Actual Diff Plan Actual Diff Plan Actual DiffIncomeNHS Activities 14,411 14,579 168 24,594 24,318 (277) 18,341 18,431 90 Income reported in Divisions 1,590 1,631 41 288 262 (26) 232 251 19 Other Operating 1,221 1,228 6 4,066 3,945 (121) 4,097 3,965 (133)Total Income 17,223 17,438 215 28,949 28,525 (424) 22,670 22,646 (24)
ExpenditureNet Direct (12,427) (12,377) 50 (17,003) (17,630) (627) (16,050) (16,416) (366)Income reported in Divisions (1,590) (1,631) (41) (288) (262) 26 (232) (251) (19)Direct (14,017) (14,008) 9 (17,291) (17,892) (601) (16,282) (16,654) (372)Indirect Clinical Costs (1,906) (1,906) 0 (3,072) (3,072) 0 (1,736) (1,736) 0 Indirect Overhead Costs (1,807) (1,733) 75 (8,066) (7,891) 175 (7,356) (7,146) 209 Total Expenditure (17,730) (17,647) 83 (28,429) (28,856) (427) (25,374) (25,536) (163)
Net Surplus/Deficit (507) (208) 299 519 (331) (851) (2,704) (2,890) (186)
Contribution 79 296 218 4,519 3,615 (904) 555 292 (263)
Plan Actual Diff Plan Actual Diff Plan Actual DiffIncomeNHS Activities 10,933 11,276 344 2,812 2,991 179 71,092 71,595 504 Income reported in Divisions 265 200 (65) 738 694 (44) 3,113 3,038 (75)Other Operating 1,957 1,914 (43) 322 338 15 11,664 11,389 (276)Total Income 13,155 13,390 235 3,873 4,023 150 85,869 86,022 153
ExpenditureNet Direct (7,608) (7,693) (85) (11,864) (12,038) (174) (64,951) (66,154) (1,203)Income reported in Divisions (265) (200) 65 (738) (694) 44 (3,113) (3,038) 75 Direct (7,873) (7,893) (20) (12,602) (12,732) (130) (68,064) (69,179) (1,115)Indirect Clinical Costs (1,161) (1,161) 0 7,875 7,875 0 0 0 0 Indirect Overhead Costs (4,139) (4,054) 85 1,187 1,307 120 (20,180) (19,517) 663 Total Expenditure (13,173) (13,108) 64 (3,539) (3,549) (10) (88,244) (88,696) (451)
Net Surplus/Deficit (18) 282 300 334 474 140 (2,375) (2,674) (299)
Contribution 2,164 2,422 258 (1,176) (1,171) 5 6,141 5,454 (686)
def
Grand Total
Cancer
Clinical Services
Medicine Surgery
W&C
SERVICE LINE REPORT MONTH 3ANALYSIS OF INCOME AND EXPENDITURE BY DIVISION
Page 6 of 14

Appendix 6
Budget Actual Variance Budget Actual Variance Budget Forecast VarianceDivision £000 £000 £000 £000 £000 £000 £000 £000 £000
Medical DivisionEmergency Care -2,434 -2,513 -79 -7,249 -7,639 -389 -28,124 -28,124 0A&E -1,021 -1,063 -42 -3,056 -3,189 -132 -11,834 -11,834 0Renal -1,228 -1,224 4 -3,666 -3,613 53 -15,200 -15,200 0Speciality Medicine -427 -415 13 -1,269 -1,272 -3 -5,252 -5,252 0Cardiology -586 -680 -94 -1,762 -1,902 -140 -6,991 -6,991 0
Total Medical Division -5,697 -5,894 -197 -17,003 -17,614 -611 -67,402 -67,402 0
Surgical DivisionGeneral Surgery & Urology & Gastroenterology -1,389 -1,446 -58 -4,162 -4,451 -288 -16,457 -16,457 0Orthopaedics -962 -978 -16 -2,901 -2,857 43 -11,541 -11,541 0Surgical Specialities -651 -730 -79 -1,960 -2,077 -117 -7,814 -7,814 0Anaesthetics & Theatres -1,484 -1,530 -46 -4,575 -4,574 1 -16,418 -16,418 0Critical Care -817 -772 45 -2,452 -2,457 -5 -9,793 -9,793 0
Total Surgical Division -5,302 -5,456 -154 -16,050 -16,416 -366 -62,022 -62,022 0
Women's & Children's DivisionObstetrics & Gynaecology -1,404 -1,418 -14 -4,278 -4,317 -39 -16,943 -16,943 0Paediatrics -1,097 -1,113 -16 -3,330 -3,376 -46 -13,090 -13,090 0
Total Women's & Children's Division -2,501 -2,530 -29 -7,608 -7,693 -85 -30,033 -30,033 0
Cancer Services DivisionMount Vernon Cancer Services -3,382 -3,305 77 -10,144 -10,074 70 -38,130 -38,130 0Oncology & Haematology -736 -734 2 -2,283 -2,303 -20 -8,743 -8,743 0
Total Cancer Services Division -4,118 -4,039 79 -12,427 -12,377 50 -46,873 -46,873 0
Clinical Support DivisionPathology & EBME & QC -1,521 -1,527 -6 -4,595 -4,618 -22 -17,305 -17,305 0Pharmacy -814 -813 1 -2,475 -2,461 14 -9,665 -9,665 0Radiology -1,013 -1,053 -40 -3,028 -3,104 -76 -11,887 -11,887 0Elizabeth House PP -3 -12 -9 -10 -80 -69 351 351 0Patient Access & Occupational Health -586 -597 -11 -1,754 -1,775 -21 -6,914 -6,914 0
Total Clinical Support Division -3,937 -4,002 -65 -11,864 -12,038 -174 -45,420 -45,420 0
ISTC 287 284 -3 861 888 27 3,443 3,443 0
Corporate DirectoratesFinance -707 -728 -21 -2,208 -2,220 -12 -8,507 -8,507 0Personnel -273 -264 10 -803 -794 9 -3,235 -3,235 0Estates & Strategic Development&Facilities -1,833 -1,846 -13 -5,578 -5,708 -129 -21,954 -21,954 0Trust Management -603 -629 -26 -1,864 -1,876 -12 -7,145 -7,145 0Nursing -866 -868 -2 -2,596 -2,591 5 -10,326 -10,326 0Education -140 -130 10 -421 -413 8 -1,686 -1,686 0
Total Corporate Departments -4,423 -4,465 -43 -13,470 -13,602 -132 -52,853 -52,853 0
ReservesR&D -62 -62 0 -187 -187 0 -750 -750 0Unallocated Budgets - general reserves -38 103 141 -188 387 575 -2,195 -2,195 0
Total Unallocated Budgets -100 41 141 -375 199 575 -2,945 -2,945 0
Income reported in Divisions -2,381 -2,358 23 -7,094 -6,829 265 -29,661 -29,661 0
Total Expenditure within Divisions -28,173 -28,421 -248 -85,029 -85,481 -452 -333,767 -333,767 0
defFINANCE REPORT MONTH 03
EXPENDITURE BY DIVISION AND SPECIALTY/DEPARTMENT
Current Month Year to Date F u l l Y e a r
Page 7 of 14

Appendix 7
Apr-13 May-13 Jun-13 Jul-13 Aug-13 Sep-13 Oct-13 Nov-13 Dec-13 Jan-14 Feb-14 Mar-14 Apr-14 May-14 TOTALActual Actual Actual Forecast Forecast Forecast Forecast Forecast Forecast Foreacst Forecast Forecast Forecast Forecast 13-14
BALANCE 10,099 5,654 5,888 7,438 6,500 6,481 13,579 7,098 5,615 4,132 4,000 4,000 4,021 3,980 10,099
RECEIPTS NHS ACUTE ACTIVITY INCOME 22,783 24,545 23,108 23,092 23,092 23,092 23,092 23,092 23,092 23,092 23,092 23,092 23,092 23,092 278,264EDUCATION/MERIT AWARDS/R&D 869 874 886 869 869 869 869 869 869 869 869 869 869 869 10,450OTHER INCOME 4,737 3,881 2,417 3,777 3,777 3,777 3,777 3,777 3,777 3,777 3,777 3,777 3,777 3,777 45,028INTEREST 4 3 2 2 2 2 2 2 2 2 2 2 2 2 27LOAN RECEIVED 0 0 7,220 6,412 7,470 2,064 23,166PDC RECEIVED 0 186 0 0 0 19,376 0 0 0 0 0 0 0 0 19,562
SUB-TOTAL RECEIPTS 28,393 29,489 33,633 27,740 27,740 53,528 27,740 27,740 35,210 27,740 27,740 29,804 27,740 27,740 376,497
PAYMENTSSALARIES & WAGES -TRUST 10,028 10,215 10,177 10,028 10,028 10,028 10,028 10,028 10,028 10,028 10,028 10,028 10,028 10,028 120,672SALARIES & WAGES - OTHER 149 145 143 149 149 149 149 149 149 149 149 149 149 149 1,778PAYE/ SUPERN/ NI - TRUST 7,034 7,272 7,363 7,034 7,034 7,034 7,034 7,034 7,034 7,034 7,034 7,034 7,034 7,034 84,975PAYE/ SUPN/ NI - OTHER 51 53 53 51 51 51 52 53 53 53 53 53 53 53 627CREDITORS 15,263 10,649 11,242 6,552 6,459 12,148 12,154 7,044 14,616 4,362 5,981 3,526 5,081 5,081 109,996CREDITORS- CAPITAL 313 921 3,105 4,864 4,038 13,895 4,804 4,915 4,813 6,246 4,495 5,436 5,436 5,436 57,845DIVIDEND PAID 0 0 0 0 0 1,555 0 0 0 0 0 1,555 0 0 3,110INTEREST ON DH LOANS 0 0 0 0 0 644 0 0 0 0 0 792 0 0 1,436DH LOAN REPAYMENTS 0 0 0 0 0 926 0 0 0 0 0 1,210 0 0 2,136 SUB-TOTAL PAYMENTS 32,838 29,255 32,083 28,678 27,759 46,430 34,221 29,223 36,693 27,872 27,740 29,783 27,781 27,781 382,575
Month end actual and forecast 5,654 5,888 7,438 6,500 6,481 13,579 7,098 5,615 4,132 4,000 4,000 4,021 3,980 3,939 4,021
Trust Cash plan 5,500 4,408 7,023 6,500 6,481 13,579 7,098 5,615 4,132 4,000 4,000 4,021 3,980 3,939 4,021
defFINANCE REPORT MONTH 03
ROLLING 12 MONTHS CASHFLOW
Page 8 of 14

Appendix 7
FINANCE REPORT MONTH 3CASHFLOW PERFORMANCE 2013/14
def
Prompt payment of invoices against target by volume (BPPC)
40%
45%
50%
55%
60%
65%
70%
75%
80%
85%
90%
95%
100%
Apr May Jun Jul Aug Sep Oct Nov Dec Jan Feb Mar
pa
id w
ith
in 3
0 d
ay
s
Target
Achieved -cumulative
Cashflow Performance 2013/14
0
2,000
4,000
6,000
8,000
10,000
12,000
14,000
16,000
Apr May Jun Jul Aug Sep Oct Nov Dec Jan Feb Mar
Period
£0
00
s
Planned month end balance
Actual cashflow
Forecast cashflow
Aged Creditors / Debtors at Mth 3
0
1000
2000
3000
4000
5000
6000
7000
8000
1 - 30 31 - 60 61 - 90 91 +
Days
£'0
00
s
Aged Creditors
Aged Debtors
Cashflow Performance Excl Capital
(4,000)
(2,000)
0
2,000
4,000
6,000
8,000
10,000
Apr May Jun Jul Aug Sep Oct Nov Dec Jan Feb Mar
Period
£0
00
s
Planned month end balance exc capActual cashflow excl capitalForecast excl capital
Page 9 of 14

Appendix 8
def
Opening Balance Balance Sheet Forecast as at 01/04/13 as at 30/06/13 as at 31/03/14
£000 £000 £000
FIXED ASSETSProperty, Plant Equipment 144,668 150,280 185,802Trade & Other Receivables N-Current 1,485 1,485 1,359
TOTAL FIXED ASSETS 146,153 151,765 187,161
CURRENT ASSETSInventories 4,864 4,864 4,864Cash & Cash Equivalents 10,099 7,438 4,021Trade & Other Receivables - Current 24,158 30,772 25,028
TOTAL CURRENT ASSETS 39,121 43,074 33,913
Creditors: Amounts Falling Due Within One Year (42,498) -47,379 (41,548)
NET CURRENT ASSETS / (LIABILITIES) (3,377) (4,305) (7,635)
FIXED & NET CURRENT ASSETS LESS CURRENT LIABILITIES 142,776 147,460 179,526
Creditors: Amounts Falling Due More Than One Year (50,799) -57,999 (70,297)Provisions For Liabilities & Charges (961) -933 (910)
NET ASSETS 91,016 88,528 108,319
FINANCED BY
TAXPAYERS EQUITY:Public Dividend Capital 151,139 151,325 170,701Revaluation Reserve 45,664 45,664 45,664Retained Earnings (105,787) (108,461) (108,046)
TOTAL TAXPAYERS EQUITY 91,016 88,528 108,319
FINANCE REPORT MONTH 3BALANCE SHEET 2013/14
Page 10 of 14

Appendix 9
Scheme Scheme Indicative Budget YTD Plan YTD Expenditure YTD Variance YE ForecastCode Description as at 01/05/2013 as at 30/6/2013 as at 30/6/2013 as at 30/6/2013 as at 30/6/2013
£000 £000 £000 £000 £0002012/13 Pre Commitments
Medical Equipment 12/13 93 93 143 (50) 143Decontamination 50 50 8 42 50IMT b/fwd 12/13 180 45 7 38 180MRI Enabling works 380 90 232 (142) 612Other 0 0 20 (20) 20
Total b/f 2012/13 703 278 410 -132 1,005
Additional capital allocation26741 Birthing Environment 186 45 21 24 186
Hertfordshire Partnership FT 8,990 0 0 0 8,990
Additional Allocation 9,176 45 21 24 9,176Essential Schemes
26900 Project Support 2,250 90 91 (1) 2,25026736 TPP 679 165 124 41 679
26501 HCH - PFI Asset 88 0 0 0 883,017 255 215 40 3,017
New Schemes 26754 Medical Equipment 1,000 270 21 249 1,000
IM&T 874 216 81 135 97426707 Maintenance 1,030 258 84 174 1,030
Site Strategy including Mount Vernon 372 93 4 89 372
Total New Schemes 3,276 837 190 647 3,376
OCH26625 Phase 4 - A&E 7,597 2,529 2,476 53 7,18126751 Phase 4 - non GMP ED 238 38 0 38 95new Phase 4 - ED Equipment 1,496 0 0 0 1,496
26651 Phase 4 - Ward 11a 0 0 -136 136 -13626663 Phase 4 - enabling 0 0 0 0 026744 Paeds Oph 90 93 3 90 9326743 Fracture Clinic 103 85 85 0 8526746 Social Services 94 0 0 0 026745 ED/Staff Relocation 4 0 0 0 026742 Office Moves 485 33 9 24 48526749 Mamography 20 0 0 0 20
Phase 4 1,008 0 0 026705 Phase 4 - Ward Block 11,259 1,605 1,601 4 11,442new Phase 4 - non GMP Ward Block 2,481 109 0 109 1,468new Phase 4 - New ward block equipment 142 0 0 0 142
26656 Phase 4 - Theatres 10,041 1,138 705 433 11,47526752 Phase 4 - non GMP Theatres 2,675 653 653 1,241
Phase 4 - Theatres equipment 1,434 0 0 0 1,43426653 Phase 4 - Chemo 2,059 229 140 89 2,06026724 Phase 4 - Pathology 1,549 9 9 0 60926661 Phase 4 - critical Care 0 0 -127 127 -12726665 Phase 4 - Medical Records 350 6 10 (4) 35026652 Phase 4 - Mortuary 0 0 0 026747 Decant Staff 0 0 0 0
Phase 4 - Ward 10a26658
Total OCH 43,125 6,527 4,775 1,752 39,413Planned slippage for OCH (2,411) 0 0 0 0
Programme Total 2013/14 56,886 7,942 5,611 2,331 55,987
Funding & CRLDepreciation 8,500Loan - Phase 4 23,165Additional PDC 10,386Internally Generated 1,727Donated 1,232HPT 8,990Sales proceeds on QE 2,700Improving Birthing Env 186
Total 56,886
FINANCE REPORT MONTH 3CAPITAL PROGRAMME 2013/2014
def
Page 11 of 14

Appendix 10
def
Plan Actual Variance Plan Actual Variance Plan Forecast Variance£000 £000 £000 £000 £000 £000 £000 £000 £000
Medical Division 130 96 -34 319 264 -55 2,900 2,900 0Surgical Division 198 99 -99 444 281 -163 3,959 3,959 0Women & Children's Division 84 60 -24 214 185 -29 1,879 1,879 0Cancer Services Division 122 110 -12 279 256 -23 2,731 2,731 0Clinical Support Division 157 149 -8 410 393 -17 2,792 2,792 0Corporate Directorates 263 239 -25 617 580 -38 3,939 3,939 0
Total 954 753 -202 2,283 1,959 -325 18,200 18,200 0
79% 86% 100%
M1 M2 M3 M4 M5 M6 M7 M8 M9 M10 M11 M12 TotalMedical Division 87 102 130 242 277 286 296 296 296 296 296 296 2900Surgical Division 99 148 198 324 362 380 372 415 415 415 415 415 3958Women & Children's Division 56 75 84 142 157 198 195 191 191 195 198 197 1879Cancer Services Division 72 84 122 200 218 222 296 300 302 303 305 307 2731Clinical Support Division 120 133 157 186 202 226 275 291 290 302 304 306 2792Corporate Directorates 166 188 263 297 299 372 383 384 391 397 399 402 3940
Total £000 600 730 954 1,391 1,515 1,684 1,817 1,877 1,885 1,908 1,917 1,923 18,200
Total % 3.3% 4.0% 5.2% 7.6% 8.3% 9.3% 10.0% 10.3% 10.4% 10.5% 10.5% 10.6% 100.0%
SUMMARY OF PHASING BY DIVISION
FINANCE REPORT MONTH 3SUMMARY OF CIP DELIVERY BY DIVISION
Current Period Year to Date F u l l Y e a r
Page 12 of 14

Appendix 11
def
Apr May Jun Jul Aug Sep Oct Nov Dec Jan Feb Mar2013/14 Agency expenditure 787 815 584 2013/14 Agency worked WTE 144 182 102 2012/13 Agency expenditure 628 714 613 541 455 310 311 490 400 587 684 709
FINANCE REPORT MONTH 32013/14 AGENCY EXPENDITURE AGAINST TRAJECTORY
Agency Expenditure 2013/14
-
200
400
600
800
1,000
Apr May Jun Jul Aug Sep Oct Nov Dec Jan Feb Mar
Month
£000
s 2013/14 Agency expenditure
2012/13 Agency expenditure
Page 13 of 14

Appendix 12
def
Plan Plan Plan Plan Plan Plan Plan Plan Plan Plan Plan Plan
3 1 2 2 2 2 2 2 2 2 2 2 2
5 5 5 5 5 5 5 5 5 5 5 5 5
3 1 1 1 2 2 2 3 3 3 3 3 3
3 1 1 1 2 2 2 2 2 2 2 2 2
3 3 3 3 4 4 4 4 4 4 3 3 3
3.2 1.9 2.2 2.2 2.8 2.8 2.8 3.0 3.0 3.0 2.8 2.8 2.8
Overriding rules rating 3 2 2 2 3 3 3 3 3 3 3 3 3
One financial criterion scored at '1' Yes, max =One financial criterion scored at '2' Yes, max = Two financial criteria scored at '2' Yes, max =Two financial criteria at '1' Yes, max =Less than 1 year as an Foundation Trust Yes. max =
Month 1 Month 11Month 10Month 7Month 5 Month 6 Month 9
<1%
FINANCE REPORT MONTH 32013/14 PLANNED FINANCIAL RISK RATING
Financial Criteria Metric to be scored Month 2 Month 3 Month 12
5%Underlying performance
13 2
EBITDA margin % 0.25 11%
Weight
1%
Month 8Month 4
9%
Target Rating categories
5 4
2%
50%
<-5%-5%
85%
-0.5%
70% <50%
Net return after financing 0.20 80%
Achievement of plan EBITDA % of plan achieved 0.10 100%
Liquidity ratio (days)
I&E surplus margin 0.20 2%
Financial Risk rating is the weighted average of financial criteria scores after applying adjustment factors. This gives an indicative risk rating of:
Liquidity 0.25
Financial Efficiency
1% -2% < -2%
60 <1025 1015
3%
Overriding rules - if answer is yes, then a maximum overall score is applied
4
2321
Page 14 of 14

East & North Hertfordshire NHS Trust :Board Performance Report (2013-14) - Month 3 - DRAFTPublication Date: 11/07/2013
Monitor Compliance Framework and SHA Provider Management Regime
Monitor Compliance Framework - Performance Thresholds for 2013-14
Achieve Under-achieve Fail Weighting Area IndicatorLead
Director
2011-12
Q4
2012-13
Q1
2012-13
Q2
2012-13
Q3
2012-13
Q4Apr-13 May-13 Month Year to date Qtr-end PF RR
14 >14 1.0 Safety Clostridium Difficile -(profiled as 1 per month) AT 2 5 4 1 3 1 2 4 7 0
0 3 >0 1.0 Safety MRSA AT 0 1 1 0 0 1 0 0 1 0
>96% - <96% 0.5 Quality *All Cancers: 31-day wait from diagnosis to treatment 96% (1month in arrears) JW 98.3% 97.5% 98.0% 98.4% 96.6% 96.7% 96.8% 97.5% 97.2% 0
Quality*All Cancers: 31-day wait for second or subsequent treatment - Surgery 94% (1month
in arrears)JW 97.7% 96.8% 98.1% 98.1% 96.6% 96.4% 96.4% 100.0% 98.3% 0
Quality*All Cancers: 31-day wait for second or subsequent treatment - Drug 98% (1month in
arrears)JW 99.7% 100.0% 99.7% 100.0% 99.2% 98.5% 98.4% 98.5% 98.5% 0
Quality*All Cancers: 31-day wait for second or subsequent treatment - Radiotherapy 94%
(1month in arrears)JW 99.3% 99.2% 99.6% 99.9% 95.7% 97.4% 94.6% 98.3% 96.5% 0
Quality*All Cancers: 62-day wait for first treatment - Urgent GP referral 85% (1month in
arrears)JW 87.6% 87.9% 86.7% 85.3% 82.7% 87.3% 85.3% 86.5% 86.4% 0
Quality*All Cancers: 62-day wait for first treatment - Consultant Screening Service 90%
(1month in arrears)JW 100.0% 94.7% 92.4% 90.3% 100.0% 85.7% 100.0% 91.7% 95.0% 0
Quality*Cancer 2-week wait from referral to date first seen - All cancers 93% (1month in
arrears)JW 99.2% 99.3% 98.3% 98.0% 98.3% 98.3% 98.4% 98.2% 98.2% 0
Quality*Cancer 2-week wait from referral to date first seen - Symptomatic breast patients
93% (1month in arrears)JW 99.6% 96.5% 96.3% 96.1% 98.5% 95.2% 97.1% 99.2% 98.1% 0
90% - < 90% 1.0 Patient Experience Maximum Waiting Time of 18-weeks from Referral to Treatment - Admitted JW 91.3% 91.8% 90.6% 92.1% 94.6% 91.7% 94.4% 92.0% 92.7% 0
95% - < 95% 1.0 Patient Experience Maximum Waiting Time of 18-weeks from Referral to Treatment - Non-Admitted JW 97.9% 97.8% 97.1% 96.7% 96.8% 96.5% 96.7% 96.9% 96.7% 0
92% - < 92% 1.0 Patient Experience Maximum Waiting Time of 18-weeks from Referral to Treatment - Incomplete JW 95.3% 96.5% 95.6% 94.9% 94.9% 95.2% 95.7% 95.9% 95.7% 0
95% - <95% 1.0 Quality A&E: Maximum Waiting Time of four hours from Arrival to Discharge or Admission JW 95.3% 97.4% 97.0% 94.6% 94.7% 94.0% 98.2% 96.7% 95.7% 0
Compliant - Non-compliant 0.5 Patient ExperienceCertification against compliance with requirements regarding
access to healthcare for people with a learning disabilityAT 0
*cancer performance figures are not finalised until 6-weeks after month-end and may therefore be subject to change.
Monitor Compliance Framework GRR - Quality Overrides
Level 2 MCF Override NHS Litigation Authority Level 1-3 JMc
Level 1 MCF Override CNST Level 1-3 (Against Plan Level 1 > April 2012) AT
MCF OverrideOther Certification - Financial Compliance, Cooperation with Other NHS Bodies &
Local Authorities, Information Governance, Cooperation & Competition PanelPT
Monitor Compliance Framework Quarterly Risk Rating (Q1) TBC 1.0
SHA Provider Management Regime Monthly Governance Risk Rating (GRR) TBC 1.0
Department of Health Operating Framework measures
Service Performance Indicators for 2012-13
Achieve Under-achieve Fail Weighting Area IndicatorLead
Director
2011-12
Q4
2012-13
Q1
2012-13
Q2
2012-13
Q3
2012-13
Q4Apr-13 May-13 Month Year to date Qtr-end
0 20 >20 Patient Experience
RTT Delivery in all Specialties
(Treatment Functions not delivered (average Admitted, Non-Admitted & Incomplete
Pathways)
JW 4.3 3.8 4.3 2.3 2 2 3 7
1% 5% >5% Patient Experience Diagnostic Test Waiting Times (patients waiting >6-weeks for 15 key diagnostic tests) JW 0.35% 1.9% 0.96% 0.81% 0.65% 0.97% 0.15% 0.00% 0.38%
3.5% 5% >5% Quality Delayed Transfers of Care - DTCs JW 2.4% 2.7% 2.4% 2.2% 4.0% 3.4% 3.8% 3.06% 3.41%
0% 0.5% >0.5% Patient Experience MSA breaches - Numbers of unjustified breaches AT 0 0 0 0 0 0 0 0 0
98% 93% <93% Safety VTE Risk Assessment JM 98.2% 99.6% 99.3% 99.4% 98.4% 97.9% 97.50% 96.61% 97.37%
Trust Clinical Efficiency KPIs
Performance Thresholds for 2012-13
Achieve Under-achieve Fail Weighting Area IndicatorLead
Director
2011-12
Q4
2012-13
Q1
2012-13
Q2
2012-13
Q3
2012-13
Q4Apr-13 May-13 Month Year to date Qtr-end
Plan Plan +1% Plan +1% Productivity DNA rate JW 8.2% 7.7% 6.9% 7.2% 7.7% 7.4% 7.5% 7.4% 7.3%
<=1.75 <=2.27 >2.27 Productivity New to Follow-up outpatient appointment ratio JW 1.76 2.12 2.22 2.33 2.16 2.02 1.96 2.00 2.13
<=6.0% <=12.0% >12% Productivity *Pre-op bed-days JW 4.0% 9.0% 6.3% 7.4% 4.0% 3.0% 1.6% 3.9% 5.5%
Within Plan >2% Variance >5% Variance Resources *Occupied Bed Days (OBDs) JW -30.8% 18.3% -26.1% -9.2% -11.2% TBC TBC TBC TBC
- - - Resources Spells JW -10.7% -2.7% -5.1% -2.4% -0.1% TBC TBC TBC TBC
<=4.5 <=6 >6 Resources Length of Stay (Overall) JW 5.17 4.54 4.28 4.58 5.12 5.50 4.09 4.23 4.36
>=87.5% >=75% <75% Productivity Theatre Utilisation (1month in arrears) JW 93.1% 93.8% 95.6% 95.3% 94.9% 91.9% 92.1% 97.4% 94.9%
<=9% <=13% >13% Productivity Readmissions (1mth in arrears - excluding Lister CDU, QEII CDU, HAU & PAU) JW TBC TBC TBC TBC 8.6% 8.4% 8.4% 7.1%
*Figures are provisional and are subject to change.
Both targets
met
1 or more target
failed1.0
1 or more target
failed0.5
All 3 targets
met- 1.0
(Excludes Indicators already covered above)
(Excludes Indicators already covered above)
1 or more target
failed
Both targets
met-
-
Amber / Green
Amber / Green

East & North Hertfordshire NHS Trust :Board Performance Report (2013-14) - Month 3 - DRAFTPublication Date: 11/07/2013
Key Contract Requirements
Performance Thresholds for 2012-13
Achieve Under-achieve Fail Weighting Area IndicatorLead
Director
2011-12
Q4
2012-13
Q1
2012-13
Q2
2012-13
Q3
2012-13
Q4Apr-13 May-13 Month Year to date Qtr-end
4-hours Quality A&E Quality Indicator - Total Time in A&E (95th percentile) JW
15 minutes Quality A&E Quality Indicator - Time to initial assessment (95th percentile) JW
60 minutes Quality A&E Quality Indicator - Time to treatment decision (median) JW
5% Quality A&E Quality Indicator - Unplanned reattendance rate JW
5% Quality A&E Quality Indicator - Left without being seen JW
15 minutes > 15 minutesQuality
Ambulance Turnaround (To Apply from Q2)JW 72.7% 72.2% 66.6% 75.5% 76.0% 84.6% 76.3%
<5% >5 % <EoE >EoE Avg Quality Choose & Book Slot issues under 5% JW 8.5% 12.20% 11.90% 9.17% 10.49% 16.40% 16.40% 11.30% 14.60%
<0.8% >0.8% <1.5% >1.5% Quality Cancelled Operations - on the day JW 0.78% 0.64% 0.34% 0.40% 0.80% 1.19% 0.94% 0.44% 0.63%
100% >98% <98% Quality Cancelled Operations - readmitted <28-days JW 100.0% 97.7% 100.0% 100.0% 100.0% 100.00% 100.00% 100.00% 100.0%
Quality Cancelled Operations - on the day (No of Patients) JW NYE 43 23 28 56 25 4 8 39
Quarterly
target*<90%
Quality
Admissions to a Stroke Bed <4-hours from Arrival at A&E (1 month in arrears)*
(*Q1 – 50% pts, Q2 – 70% pts, Q3 – 90% pts, Q4 - 90% pts)JW 40.0% 53.7% 47.1% 40.4% 40.3% 51.3% 76.3% 63.6%
*As at 02/12/2012
Local Priorities
Performance Thresholds for 2012-13
Achieve Under-achieve Fail Weighting Area IndicatorLead
Director
2011-12
Q4
2012-13
Q1
2012-13
Q2
2012-13
Q3
2012-13
Q4Mar-13 Apr-13 Month Year to date Qtr-end
>=80% <70% Local Priority
Stroke Care - % of patients spending 90% of hospital stay on a specialist stroke unit
(1mth in arrears) JW 80.2% 83.2% 81.7% 78.8% 70.0% 75.6% 73.2% 73.8% 73.5%
>=60% <54% Local PriorityStroke Care - % patients with high risk TIA seen and scanned/treated within 24 hours
(1mth in arrears) JW 33.3% 62.5% 54.5% 37.8% 55.3% 62.5% 61.9% 81.0% 71.4%
>=80% <75% Local Priority PPCI – 150 minute call to balloon time JW 100.0% 85.7% 87.5% 90.0% 90.5% 88.9% 100.0% 100.0% 96.0%
>=98% <98% Local Priority Two-week wait access for Rapid Access Chest Pain Clinics. JW 100.0% 100.0% 100.0% 100.0% 100.0% 100.0% 100.0% 100.0% 100.0%
100% >=99% <99% Local Priority MRSA Elective screening AT 99.7% 99.96% 99.9% 100.0% 100.0% 100.0% 100.0% 100.0% 99.9%
100% >=95% <95% Local Priority MRSA Emergency screening (*provisional figures) AT 90.2% 88.8% 93.3% 91.0% 92.4% 91.9% 90.5% 91.9%
From Q2 1
Timeliness indicator to
be achieved
1 'Impact'
indicator
achieved
1.0 (failing
3 or more)
OR
0.5 (failing
2 or
less)From Q2 1 'Impact'
indicator achieved
0
'Timeliness'
indicator
achieved
'Timeliness'
indicator
achieved
1 'Impact'
indicator achieved
1 'Timeliness'
indicator achieved
1 'Impact'
indicator
achieved
1 'Impact'
indicator achieved
'Timeliness'
indicator achieved
'Timeliness'
indicator
achieved
'Timeliness'
indicator
achieved
1 'Impact'
indicator
achieved
1
'Timeliness'
indicator
achieved
1 'Impact'
indicator
achieved
1 'Impact'
indicator
achieved
1 'Impact'
indicator
achieved
(Excludes Indicators already covered above)
(Excludes Indicators already covered above)
From Q2 1
'Impact' indicator
achieved
1 'Timeliness'
indicator
achieved
'Timeliness'
indicator achieved
From Q2 1
Timeliness
indicator to be
achieved
1 'Impact'
indicator achieved

CQC Outcomes Summary
Outcome Regulation CQC ESSENTIAL STANDARDS OF QUALITY & SADIRECTOR
LEAD
Lister QEII MVCC Hertford Bedford
renal
C C 1 17 Respecting and involving people who use services Director of
Nursing C C C C C Compliant ‐ No compliance conditions
C C 2 18 Consent to care and treatment Medical DirectorC C C C C Compliant ‐ No compliance conditions
C C 3 21 Fees etc. (applies to people how pay for their care) Director of
FinanceC C C C C Compliant ‐ (No declaration required)
C C 4 9
Care and welfare of people who use services
Director of
Nursing C C C C C Compliant ‐ No compliance conditions
C C 5 14 Meeting nutritional needs Director of
NursingC C C C C Compliant ‐ No compliance conditions
C C 6 24 Cooperating with other providers Director of
OperationsC C C C C Compliant ‐ No compliance conditions
C x 3 sites
Lister site ‐ Minor concern Q4
only
C C 8 12 Cleanliness and infection control Director of
Nursing C C C C C Compliant ‐ No compliance conditions
C C 9 13 Management of medicines Medical Director C C C C C Compliant ‐ No compliance conditions
C C 10 15 Safety and suitability of premises Director of
Strategic C C C C C Compliant ‐ No compliance conditions
C C 11 16 Safety, availability and suitability of equipment Director of
Nursing C C C C C Compliant ‐ No compliance conditions
C C 12 21 Requirements relating to workers Director of HR C C C C C Compliant ‐ No compliance conditions
C C 13 22 Staffing Director of HR C C C C C Compliant ‐ No compliance conditions
C x 3 sites
Lister site ‐ Minor concern Q4
only
C C 15 8 Statement of Purpose Director of
Finance Compliant
C C 16 9 Assessing and monitoring the quality of service
provision
Medical DirectorC C C C C
Compliant ‐ No compliance conditions
C C 17 Complaints Director of
Nursing C C C C C
Compliant ‐ No compliance conditions
C C 18 17 Notification of Death of a Service User Director of
Nursing C C C C CCompliant
C C 19 18 Notification of death or unauthorised absence of a
service user who is detailed or liable to be detailed
under the Mental Health Act 1983
Director of
Nursing C C C C C
Compliant
C C 20 29 Notification of other incidents Diector of Nursing C C C C C
Compliant
C C 21 20 Records Director of
OperationsC C C C C
Compliant ‐ No compliance conditions
N/A 22 4 Requirements where the service provider is an
individual of partnership
Not applicable to
NHS
N/A
C C 23 5 Requirement where the service provider is a body
other than a partnership (nominated individual)
Director of HR
Compliant
N/A 24 6 Requirements relating to registered managers Not applicable to
NHS
N/A
C C 25 7 Registered Person: training Director of HR
Compliant
N/A 26 12 Financial position Not applicable to
NHS N/A
C C 27 14 Notice of absence Director of
FinanceC C C C C
Compliant
C C 28 15 Notice of changes Director of
FinanceC C C C C
Compliant
From 1st April 2010 the Trust has been formally registered with the CQC under the Health and Social Care Act 2008 to provide the following regulated activities at the specified locations.
Section 1: Involvement and Communication
Section 2: Personalised Care Treatment and Support
Compliant ‐ No compliance conditions CC
C
Registration Position
11/12
Trust Nominated Individual is the Chief Executive
C
Section 6: Suitability of management
Compliant
Section 4: Suitability of Staffing
Section 3: Safeguarding and Safety
Anticipated Full Year Position 2012/ 13‐ All locations
/Regulatory Activities
Section 5: Quality and management
Current Registration Position ‐ April ʹ13
11 Safeguarding vulnerable service users Director of
Nursing C
C
C
C
Compliant ‐ No compliance conditions C
Registration position
12/13
C
C
C
2314
7
C
Director of HR Supportng workers
LOCATIONS REGULATORY ACTIVITY LISTER
HOSPITAL QEII MVCC HERTFORD
BEDFORD RENAL
Treatment of disease, disorder or injury
Registered Registered Registered Registered Registered
Surgical procedures
Registered Registered Registered
Diagnostic and screening procedures
Registered Registered Registered Registered Registered
Maternity and midwifery services
Registered Registered Registered
Termination of pregnancies
Registered Registered
Family Planning Services
Registered Registered Registered
Assessment or medical treatment of people detained under the Mental Health Act 1983
Registered Registered Registered

Risk rating Outcome
Outcome 21: Records
Outcome 8: Cleanliness and infection control
Outcome 1:Respecting and involving people who use services Outcome 2: Consent to care and treatment Outcome 4: Care and welfare of people who use services Outcome 5: Meeting nutritional needs Outcome 6: Cooperating with other providers Outcome 7: Safeguarding people who use services from abuse Outcome 9: Management of medicines Outcome 10:Safety and suitability of premises Outcome 11: Safety, availability and suitability of equipment Outcome 12: Requirements relating to workers Outcome 13: Staffing Outcome 14: Supporting workers Outcome 16: Assessing and monitoring the quality of service provision Outcome 17: Complaints
Nil
Nil
Nil
Nil since March 2011

Information to inform discussion meeting
Unit Jul-12 Aug-12 Sep-12 Oct-12 Nov-12 Dec-12 Jan-13 Feb-13 Mar-13 Apr-13 May-13 Jun-13 Board Action
1 SHMI - latest data Score 117.7 117.7 113.6 113.6 113.6 114.1 114.1 114.1 110.8 110.8 110.8 111.4Period: October 11 - September 2012
2Venous Thromboembolism (VTE)
Screening % 99.70% 99.59% 99.45% 99.2% 99.3% 99.3% 99.5% 99.5% 98.7% 98.3% 97.9% 96.6%
97.37% YTD
3a Elective MRSA Screening % 100% 99.86% 99.89% 99.8% 100.0% 100.0% 99.9% 100.0% 100.0% 100.0% 100.0% 100.0% 99.91% YTD
3b Non Elective MRSA Screening % 92.40% 90.50% 87.69% 88.7% 91.8% 93.5% 95.3% 91.6% 90.1% 92.4% 93.4% 90.5% 91.93% YTD
4Single Sex Accommodation
BreachesNumber 0 0 0 0 0 0 0 0 0 0 0 0
5Open Serious Incidents Requiring
Investigation (SIRI)Number 3 4 2 24 25 17 17 14 16 10 9 9
Progressing on time
6 "Never Events" occurring in month Number 0 0 0 0 0 0 1 0 0 0 0 0
7 CQC Conditions or Warning Notices Number 0 0 0 0 0 0 0 0 0 0 0 0Lister Hospital CQC report received from December 2012
inspection - compliant with standards inspected
8Open Central Alert System (CAS)
AlertsNumber 8 11 2 8 8 6 6 2 5 11 4 14 Actioned appropriately
9RED rated areas on your maternity
dashboard?Number 2 1 2 0 4 2 2 2 4 2 2 1 Red flag: IOL: RCA's in progress
10Falls resulting in severe injury or
deathNumber 1 0 1 0 3 1 2 1 2 0 1 1
11 Grade 3 or 4 pressure ulcers Number 10 2 3 1 7 4 4 5 0 4 4 2 2 x G3 (I waiting unaviodable status) & 0 x G4
12100% compliance with WHO
surgical checklistY/N N N N N N N N Y Y Y Y Y
100% for March 2013, in main theatres & maternity. New
methodology checking 100% WHO checklist to commenced
13 Formal complaints received Number 97 71 74 78 75 84 91 64 99 79 81 60
14Agency as a % of Employee Benefit
Expenditure% 3.30% 3.00% 2.50% 1.70% 1.70% 2.80% 2.80% 2.30% 2.70% 3.60% 4.30% 3.20% 4.00% YTD
15 Sickness absence rate % 3.27% 3.30% 3.40% 3.50% 3.60% 3.50% 3.50% 3.90% 4.00% 3.60% 3.50% 3.32% 3.32% YTD
16Consultants which, at their last
appraisal, had fully completed their
previous years PDP
% N/A N/A N/A N/A N/A N/A N/A N/A N/A N/A N/A N/A
New database to support revalidation in place - will be fully
operational by April 2013; will enable capture of fully
completed PDP's as revalidation is rolled out ; trajectory to
be agreed
East and North Hertfordshire NHS Trust
Insert Performance in Month
QUALITY
Criteria
See 'Notes' for further detail of each of the below indicators
Area Ref Indicator Sub SectionsThresh-
old
Weight-
ing
Qtr to
Sep-12
Qtr to
Dec-12
Qtr to
Mar-13Apr-13 May-13 Jun-13
Qtr to
Jun-13Board Action
Referral to treatment information 50%
Referral information 50%
Treatment activity information 50%
Patient identifier information 50% N/a N/a N/a N/a N/a N/a N/a
Patients dying at home / care home 50% N/a N/a N/a N/a N/a N/a N/a
1c Data completeness: identifiers MHMDS 97% 0.5 N/a N/a N/a N/a N/a N/a N/a
1cData completeness: outcomes for patients
on CPA50% 0.5 N/a N/a N/a N/a N/a N/a N/a
2aFrom point of referral to treatment in
aggregate (RTT) – admittedMaximum time of 18 weeks 90% 1.0 Yes Yes Yes Yes Yes Yes Yes
2bFrom point of referral to treatment in
aggregate (RTT) – non-admittedMaximum time of 18 weeks 95% 1.0 Yes Yes Yes Yes Yes Yes Yes
2c
From point of referral to treatment in
aggregate (RTT) – patients on an
incomplete pathway
Maximum time of 18 weeks 92% 1.0 Yes Yes Yes Yes Yes Yes Yes
2d
Certification against compliance with
requirements regarding access to
healthcare for people with a learning
disability
N/A 0.5 Yes Yes Yes Yes Yes Yes Yes
Surgery 94%
Anti cancer drug treatments 98%
Radiotherapy 94%
From urgent GP referral for
suspected cancer85%
From NHS Cancer Screening
Service referral90%
3cAll Cancers: 31-day wait from diagnosis to
first treatment96% 0.5 Yes Yes Yes Yes Yes Yes Yes
all urgent referrals 93%
for symptomatic breast patients
(cancer not initially suspected)93%
3eA&E: From arrival to
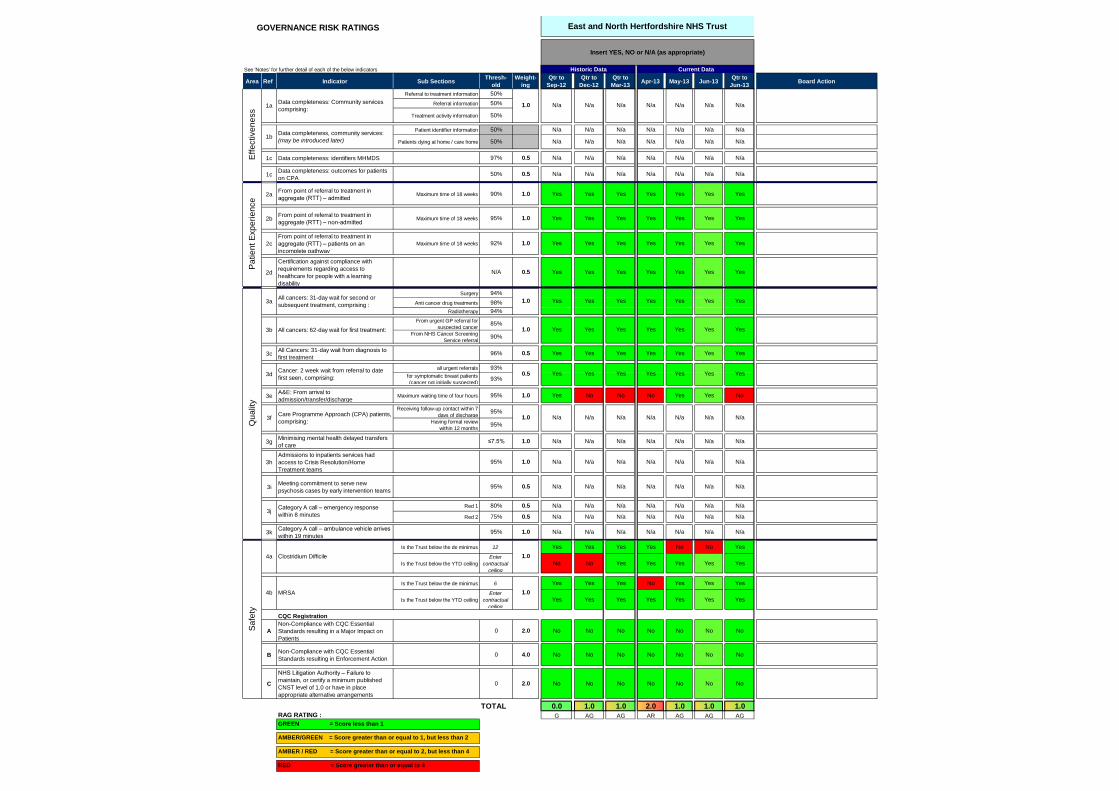
admission/transfer/dischargeMaximum waiting time of four hours 95% 1.0 Yes No No No Yes Yes No
Receiving follow-up contact within 7
days of discharge95%
Having formal review
within 12 months95%
3gMinimising mental health delayed transfers
of care≤7.5% 1.0 N/a N/a N/a N/a N/a N/a N/a
3h
Admissions to inpatients services had
access to Crisis Resolution/Home
Treatment teams
95% 1.0 N/a N/a N/a N/a N/a N/a N/a
3iMeeting commitment to serve new
psychosis cases by early intervention teams95% 0.5 N/a N/a N/a N/a N/a N/a N/a
Red 1 80% 0.5 N/a N/a N/a N/a N/a N/a N/a
Red 2 75% 0.5 N/a N/a N/a N/a N/a N/a N/a
3kCategory A call – ambulance vehicle arrives
within 19 minutes95% 1.0 N/a N/a N/a N/a N/a N/a N/a
Is the Trust below the de minimus 12 Yes Yes Yes Yes No No Yes
Is the Trust below the YTD ceiling
Enter
contractual
ceiling
No No Yes Yes Yes Yes Yes
Is the Trust below the de minimus 6 Yes Yes Yes No Yes Yes Yes
Is the Trust below the YTD ceiling
Enter
contractual
ceiling
Yes Yes Yes Yes Yes Yes Yes
CQC Registration
A
Non-Compliance with CQC Essential
Standards resulting in a Major Impact on
Patients
0 2.0 No No No No No No No
BNon-Compliance with CQC Essential
Standards resulting in Enforcement Action0 4.0 No No No No No No No
C
NHS Litigation Authority – Failure to
maintain, or certify a minimum published
CNST level of 1.0 or have in place
appropriate alternative arrangements
0 2.0 No No No No No No No
TOTAL 0.0 1.0 1.0 2.0 1.0 1.0 1.0RAG RATING : G AG AG AR AG AG AG
GOVERNANCE RISK RATINGS
Insert YES, NO or N/A (as appropriate)
RED = Score greater than or equal to 4
1.0MRSA4b
1.0
1a
Yes
All cancers: 62-day wait for first treatment:
Eff
ective
ne
ss
Pa
tie
nt
Exp
eri
en
ce
Qu
alit
y
0.5
1bData completeness, community services:
(may be introduced later)
3fCare Programme Approach (CPA) patients,
comprising:
Yes
Yes Yes Yes
Sa
fety
Yes
Yes
3d
Historic Data Current Data
1.0
Yes Yes
Yes
Yes
Data completeness: Community services
comprising:
All cancers: 31-day wait for second or
subsequent treatment, comprising :
Cancer: 2 week wait from referral to date
first seen, comprising:
3jCategory A call – emergency response
within 8 minutes
3a
3b
YesYes
1.0
Yes Yes
Yes Yes
N/a
GREEN = Score less than 1
AMBER/GREEN = Score greater than or equal to 1, but less than 2
AMBER / RED = Score greater than or equal to 2, but less than 4
N/a N/a N/a
Yes
Yes
Yes
N/aN/aN/a
Yes
N/a
1.0
1.0
N/aN/a
4a Clostridium Difficile
East and North Hertfordshire NHS Trust
N/aN/a N/a
N/a

See 'Notes' for further detail of each of the below indicators
Area Ref Indicator Sub SectionsThresh-
old
Weight-
ing
Qtr to
Sep-12
Qtr to
Dec-12
Qtr to
Mar-13Apr-13 May-13 Jun-13
Qtr to
Jun-13Board Action
GOVERNANCE RISK RATINGS
Insert YES, NO or N/A (as appropriate)
1a
Eff
ective
ne
ss
Historic Data Current Data
1.0Data completeness: Community services
comprising:N/aN/aN/aN/aN/aN/a
East and North Hertfordshire NHS Trust
N/aOverriding Rules - Nature and Duration of Override at SHA's Discretion
i) Meeting the MRSA Objective No No No No No No
iv) A&E Clinical Quality Indicator No No No No No No
viii) Any other Indicator weighted 1.0 No No No No No No
Adjusted Governance Risk Rating 0.0 1.0 1.0 2.0 1.0 1.0 1.0
G AG AG AR AG AG AG
ii) Meeting the C-Diff Objective
Greater than six cases in the year to date, and breaches the
cumulative year-to-date trajectory for three successive quarters
The admitted patients 18 weeks waiting time measure for a
third successive quarter
The non-admitted patients 18 weeks waiting time measure for
a third successive quarter
The incomplete pathway 18 weeks waiting time measure for a
third successive quarter
Reports important or signficant outbreaks of C.difficile, as
defined by the Health Protection Agency.
iii) RTT Waiting Times
Fails to meet the A&E target twice in any two quarters over a
12-month period and fails the indicator in a quarter during the
subsequent nine-month period or the full year.
Breaches the cumulative year-to-date trajectory for three
successive quarters
Greater than 12 cases in the year to date, and either:
v) Cancer Wait Times
Breaches either:
the 31-day cancer waiting time target for a third successive
quarter
Breaches:
NoNoNo
No No
No
N/a
No
No
No
No
N/aN/a
Breaches the indicator for three successive quarters.
referral to treatment information for a third successive quarter;
service referral information for a third successive quarter, or;
treatment activity information for a third successive quarter
Fails to maintain the threshold for data completeness for:
the category A 8-minute response time target for a third
successive quarter
the 62-day cancer waiting time target for a third successive
quarter
Breaches:
N/a N/a
N/a N/athe category A 19-minute response time target for a third
successive quarter
No
N/a
N/a
No
vii) Community Services data completeness N/a N/a
No
No
Ambulance Response Times
N/a
No No
vi)
No
No
either Red 1 or Red 2 targets for a third successive quarter

3
Trust Medicine Surgery Women & ChildrenClinical support
servicesCancer
Total Beds (Based on wards in this report)
815 411 243 87 15 59
Bed occupancy % TBC TBC TBC TBC TBC TBC
Funded WTE 2345.91 794.76 605 473.39 89.28 195.21
Actual WTE 2014.88 695.52 496.32 426.4 85.28 195.71
Vacancy rate % 14.11% 12.49% 17.96% 9.93% 4.48% -0.26%
Sickness % 4.20% 4.21% 4.29% 3.81% 5.75% 5.31%
Agency usage % 4.7% 7.7% 4.2% 0.6% 5.4% 0.9%
Bank usage % 9.2% 12.0% 7.2% 6.9% 25.7% 5.8%
Appraisal % 63.91% 64.87% 49.90% 74.07% 64.71% 67.84%
Mandatory training %
(Nursing Based)75.92% 75.98% 78.42% 78.65% 85.32% 54.57%
Average length of stay 4.23 5.74 4.51 1.64 12.00 0.33
No. Outliers (Based on
wards in this report)90 0 90 0 0 0
No. Delayed discharges
(Based on wards in this 53 35 18 0 0 0
No. Inpatient falls 41 31 7 1 0 2
No. Inpatient falls resulting in
serious harm1 0 1 0 0 0
No. Pressure ulcers ≥2 6 6 0 0 0 0
EWS % score 96% 90% 98% 100% 100% 94%
Response to trigger % 97% 94% 99% 95% 100% N/A
No. Medication administration
errors7 3 0 1 1 2
No. Safety Thermometer harms 26 20 4 1 0 1
WHO Check List 100% 100% 100%
Practice Standard Scores 99% 99% 100%
Net promoter 76.32 77.34 72.79 95.00 100.00 67.71
Meridian Score 86.39 85.84 84.41 85.96 85.74 90.02
No.of Complaints
(Based on wards in this report)32 20 6 5 0 1
KEY DESCRIPTION
N/P NOT PROVIDED Green TBC/NA/NP
N/A NOT APPLICABLE Amber None
TBC TO BE CONFIRMED Red
RAG RATING KEY
2013/14 NURSING & MIDWIFERY QUALITY INDICATORS : MONTH 3
NURSING & MIDWIFERY QUALITY INDICATORS : JUNE 2013/14 - DRAFT
Pa
tie
nt
Ex
pe
rie
nc
eL
oS
Pa
tie
nt
Sa
fety
Jun-13B
ed
sS
taff
ing

Clinical Support Services
Elizabeth House - 11AS
Total beds 15
Bed occupancy % TBC
Funded WTE 16.17
Actual WTE 12.54
Vacancy rate % 22.45%
Sickness % 19.69%
Agency usage % 5.40%
Bank usage % 25.70%
Appraisal % 36.36%
Mandatory training % 72.65%
Average length of stay 12.00
No. Outliers 0.00
No. Delayed discharges 0
No. Inpatient falls 0
No. Inpatient falls resulting in serious harm 0
No. Pressure ulcers ≥2 0
EWS % score 100.00%
Response to trigger % 100.00%
No. Medication administration errors 1
No. Safety Thermometer harms 0
Net promoter 100.00
Meridian Score 85.74
Number of complaints 0
KEY DESCRIPTION RAG RATING KEY
N/P NOT PROVIDED Green
N/A NOT APPLICABLE Amber
TBC TO BE CONFIRMED Red
TBC / NA / NP
None
Lo
SP
ati
en
t S
afe
tyS
taff
ing
Pa
tie
nt
Ex
pe
rie
nc
e
NURSING & MIDWIFERY QUALITY INDICATORS : JUNE 2013/14 - DRAFT
Jun-13
Ward
Be
ds

Ward 10 Ward 11 Marie CurieMichael Sobell
House
Total beds 23 200
(no overnight beds)16
Bed occupancy % TBC TBC TBC TBC
Funded WTE 30.92 25.33 15.02 20.59
Actual WTE 27.36 21.33 13.55 18.51
Vacancy rate % 11.51% 15.79% 9.79% 10.10%
Sickness % 5.58% 5.61% 1.86% 8.25%
Agency usage % 0.50% 0.00% 0.00% 2.60%
Bank usage % 3.90% 9.70% 0.00% 7.60%
Appraisal % 78.57% 73.91% 61.54% 34.78%
Mandatory training % 46.30% 59.42% 34.92% 51.39%
Average length of stay 20.30 17.26 0.00 23.21
No. Outliers 0 0 0 0
No. Delayed discharges 0 0 0 0
No. Inpatient falls 1 1 0 0
No. Inpatient falls resulting in serious
harm0 0 0 0
No. Pressure ulcers ≥2 0 0 0 0
EWS % score 100% 88% N/A N/A
Response to trigger % N/A N/A N/A N/A
No. Medication administration errors 0 1 0 0
No. Safety Thermometer harms 0 1 0 0
Net promoter 68.09 65.00 N/A 77.78
Meridian Score 82.25 86.91 96.97 93.94
Number of complaints 1 0 0 0
KEY DESCRIPTION
N/P NOT PROVIDED Green TBC / NA / NP
N/A NOT APPLICABLE Amber None
TBC TO BE CONFIRMED Red
RAG RATING KEY
Pa
tie
nt
Ex
pe
rie
nc
eS
taff
ing
Lo
SP
ati
en
t S
afe
ty
NURSING & MIDWIFERY QUALITY INDICATORS : JUNE 2013/14 - DRAFTCancer
Ward
Bed
s
Jun-13

Barley Pirton Stanborough 6A/HASU-6 10BN 10BS 9A Digswell Knebworth 9B/CCU AAU SSU 6B
MAU
(formerly
Ayot)
A&E Lister (assessment)/
11A
A&E QEII HAU
Dialysis
unit
Lister (stations)
Dialysis
Unit St
Albans (stations)
Dialysis
Unit
L&D (stations)
Cardiology
Fixed Cath
Lab (Trollies)
Total beds 28 28 28 24 14 15 30 29 26 28 28 24 28 6 N/A N/A 25 16 23 11
Bed occupancy % TBC TBC TBC TBC TBC TBC TBC TBC TBC TBC TBC TBC TBC TBC TBC TBC TBC TBC TBC TBC
Funded WTE 28.64 28.56 30.55 30.19 N/A 35.3 31.87 34.01 37.74 32.42 35.19 35.46 29.65 70.77 29.34 31.38 41.24 31.12 33.03 17.73
Actual WTE 25.05 27.04 24.9 28.69 N/A 32.76 30.74 28.05 37.28 30.85 34.58 34.25 25.05 56.39 30.64 13.41 38.82 25.55 32.65 13.33
Vacancy rate % 11.42% 5..32% 18.49% 4.97% 7.20% 3.55% 17.52% 1.22% 4.84% 1.73% 3.41% 15.51% 20.32% -4.43% 57.27% 5.87% 17.90% 1.15% 24.82%
Sickness % 8.01% 4.13% 3.65% 9.27% 0.73% 6.39% 1.29% 1.62% 6.79% 4.08% 5.89% 4.75% 2.39% 4.98% 1.44% 5.07% 5.17% 2.70% 1.41%
Agency usage % 4.50% 3.90% 0.00% 4.40% 0.00% 2.60% 5.10% 2.80% 3.30% 5.40% 4.00% 1.70% 18.90% 14.70% 2.80% 0.00% 0.00% 0.00% 0.00% 0.00%
Bank usage % 10.70% 4.90% 8.60% 10.30% 0.00% 11.80% 10.80% 13.70% 7.80% 15.50% 7.40% 3.40% 16.90% 20.20% 8.30% 0.00% 9.60% 3.20% 10.00% 9.70%
Appraisal % 94.12% 63.64% 62.50% 48.15% 74.29% 83.87% 47.83% 35.14% 61.29% 77.78% 82.86% 38.89% 83.33% 75.76% 71.43% 29.41% 58.33% 65.52% 61.54%
Mandatory training % 88.89% 75.93% 79.84% 67.05% 77.14% 74.29% 83.14% 57.22% 64.98% 76.19% 88.58% 73.50% 67.55% 58.17% 76.64% 76.96% 92.59% 93.44% 82.10%
Average length of stay 34.88 32.27 33.75 19.42 24.15 20.95 16.18 29.34 22.76 39.80 24.60 19.90 27.11 20.00 2.66 6.54 N/A N/A N/A 1.00
No. Outliers 0 0 0 0 0 0 0 0 0 0 0 0 0 0 0 0 0 0 0 0
No. Delayed discharges 5 9 3 5 2 1 2 2 1 1 0 0 4 0 0 0 0 0 0 0
No. Inpatient falls 1 5 2 2 0 3 6 3 1 1 3 2 2 0 0 0 0 0 0 0
No. Inpatient falls
resulting in serious harm0 0 0 0 0 0 0 0 0 0 0 0 0 0 0 0 0 0 0 0
No. Pressure ulcers ≥2 0 1 1 0 1 0 1 0 0 0 0 0 2 0 0 0 0 0 0 0
EWS % score 100% 100% 100% 100% N/A 100% 100% 80% 81% 65% 83% 83% 80% 87% 94% N/A N/A N/A N/A N/A
Response to trigger % 100% 80% 100% 100% N/A 100% 100% 100% 100% 83% 100% 100% 80% 67% 100% N/A N/A N/A N/A N/A
No. Medication
administration errors0 0 0 0 0 0 0 0 1 2 0 0 0 0 0 0 0 0 0 0
No. Safety Thermometer
harms0 3 5 3 2 1 0 4 0 0 1 0 1 N/A N/A N/A N/A N/A N/A N/A
Net promoter 83.33 81.82 94.12 92.31 65.38 85.71 72.34 N/A 75.00 92.86 N/A 66.56 79.91 N/A N/A N/A N/A N/A
Meridian Score 73.59 86.80 90.50 71.30 83.33 79.17 85.42 85.62 83.98 86.66 83.40 88.68 80.24 94.44 94.44 N/A 93.38 91.58 92.50 N/A
Number of complaints 0 0 1 0 0 0 0 1 1 3 0 0 1 9 3 0 0 1 0 0
KEY
Green TBC / NA / NP N/P
Amber None N/A
Red TBC
NOT PROVIDED
NOT APPLICABLE
TO BE CONFIRMED
RAG RATING KEY
C
l
o
s
e
d
DESCRIPTION
NURSING & MIDWIFERY QUALITY INDICATORS : JUNE 2013/14 - DRAFT
Pa
tie
nt
Ex
pe
rie
nc
e
Jun-13
Ward
Be
ds
Sta
ffin
gL
oS
Pa
tie
nt
Sa
fety
Medicine
75.00

`
8A 8B Codicote 11B 7BN 5A 5B Princes ITU/HDU ASCU
Day
Surgery
QEII
Theatres
QEII
Theatres
Lister
Endoscopy
QEII
Endoscopy
ListerEAU POA
Total beds 30 24 28 15 15 30 29 46 20 6 0 0 0 0 0 0 0
Bed occupancy % TBC TBC TBC TBC TBC TBC TBC TBC TBC TBC TBC TBC TBC TBC TBC TBC TBC
Funded WTE 30.53 29.14 31.72 31.13 22.36 31.13 31.28 55.57 112.09 12.90 37.99 34.97 94.16 16.56 17.19 7.99 18.22
Actual WTE 29.16 30.25 23.25 26.76 21.76 27.78 24.61 47.62 93.29 12.29 31.72 31.62 81.99 16.21 15.01 6.77 15.92
Vacancy rate % 4.49% -3.81% 26.70% 14.04% 2.68% 10.76% 21.32% 14.31% 16.77% 4.73% 16.48% 9.58% 12.92% 2.11% 12.68% 15.27% 12.62%
Sickness % 5.53% 2.07% 5.87% 13.25% 9.70% 2.78% 3.87% 5.92% 5.45% 3.33% 4.01% 3.27% 3.27% 2.58% 0.76% 0.00% 15.62%
Agency usage % 5.30% 3.00% 18.00% 2.50% 2.20% 2.90% 9.00% 13.00% 3.50% 4.00% 0.00% 0.30% 0.00% 0.00% 0.00% 0.00% 0.00%
Bank usage % 11.90% 10.60% 13.80% 16.60% 12.10% 15.00% 26.70% 6.50% 2.40% 5.70% 0.00% 0.00% 0.30% 3.50% 3.60% 1.10% 7.80%
Appraisal % 41.67% 73.91% 80.95% 21.00% 70.00% 50.00% 42.86% 27.45% 32.18% 90.91% 42.42% 42.86% 83.15% 41.18% 76.92% 87.50% 33.33%
Mandatory training % 54.12% 73.40% 84.72% 63.10% 84.72% 83.51% 56.92% 71.37% 77.00% 75.76% 72.67% 76.47% 77.01% 86.03% 92.16% 95.83% 88.89%
Average length of stay 14.17 14.36 24.82 21.06 23.26 16.50 24.50 20.74 15.50 5.33 0.00 0.00 0.00 0.00 1.50 0.00 N/A
No. Outliers 26 20 0 8 4 25 7 0 0 0 0 0 0 0 0 0 0
No. Delayed discharges 2 0 7 0 0 4 0 5 0 0 0 0 0 0 0 0 0
No. Inpatient falls 2 0 1 0 1 3 0 0 0 0 0 0 0 0 0 0 0
No. Inpatient falls
resulting in serious harm0 0 0 0 1 0 0 0 0 0 0 0 0 0 0 0 0
No. Pressure ulcers ≥2 0 0 0 0 0 0 0 0 0 0 0 0 0 0 0 0 0
EWS % score 100% 100% 100% 86% 100% 100% 100% N/A N/A 100% N/A N/A N/A N/A N/A 100% N/A
Response to trigger % N/A 100% 100% 95% 100% 100% 100% N/A N/A 100% N/A N/A N/A N/A N/A N/A N/A
No. Medication
administration errors0 0 0 0 0 0 0 0 0 0 0 0 0 0 0 0 0
No. Safety Thermometer
harms1 0 0 0 0 0 0 2 0 0 N/A 0 1 N/A N/A N/A N/A
WHO Check List 100% 100% 100%
Practice Standard Scores 99% 98% 99%
Net promoter 85.71 88.69 81.82 78.57 55.17 76.19 69.72 64.71 N/A N/A N/A N/A N/A N/A N/A N/A N/A
Meridian Score 86.20 85.66 82.79 86.70 85.29 84.39 81.83 74.42 89.20 87.63 N/A N/A N/A N/A N/A N/A N/A
Number of complaints 2 0 1 1 1 0 0 0 0 0 1 0 0 0 0 0 0
KEY
Green TBC / NA / NP N/P
Amber None N/A
Red TBC
DESCRIPTION
NOT PROVIDED
NOT APPLICABLE
TO BE CONFIRMED
Be
ds
Sta
ffin
gL
oS
Pa
tie
nt
Sa
fety
Pa
tie
nt
Ex
pe
rie
nc
e
RAG RATING KEY
Ward
NURSING & MIDWIFERY QUALITY INDICATORS : JUNE 2013/14 - DRAFT
SURGERY DEPARTMENTSURGERY WARDSJun-13

MLU CLU Dacre Gloucester ED CAU
Total beds 15 22 TBC 16 34
Bed occupancy % TBC TBC TBC
Funded WTE 36.18 22.06 146.64 N/A N/A N/A N/A 21.70 58.92
Actual WTE 25.69 18.94 135.40 N/A N/A N/A N/A 23.65 55.37
Vacancy rate % 28.99% 14.14% 7.67% N/A N/A N/A N/A -8.99% 6.03%
Sickness % 1.99% 0.18% 6.60% N/A N/A N/A N/A 8.26% 2.81%
Agency usage % 0.90% N/A N/A 1.00% 0.00%
Bank usage % 4.90% N/A N/A 1.00% 9.00%
Appraisal % 96.30% 73.08% 71.97% N/A N/A N/A N/A 96.30% 81.63%
Mandatory training % 68.58% 84.62% 82.91% N/A N/A N/A N/A 93.59% 73.82%
Average length of stay 16.86 16.20 5.50 15.14 2.42 N/A 9.42 15.05 25.31
No. Outliers 0 0 0 0 0 0 0 0 0
No. Delayed discharges 0 0 0 0 0 0 0 0 0
No. Inpatient falls 0 0 0
No. Inpatient falls
resulting in serious harm0 0 0
No. Pressure ulcers ≥2 0 0 0 0 0 0 0
EWS % score 100% N/A N/A N/A N/A 100% 100% 100% N/A
Response to trigger % 100% N/A N/A N/A N/A 100% 80% 100% N/A
No. Medication
administration errors0 0 0 0 1 0 0
No. Safety Thermometer
harms1 0 0 0 0 0 0
WHO Check List
Practice Standard Scores
Net promoter 95.00 N/A N/A
Meridian Score 89.26 94.47 91.13 84.98 68.10 92.89 80.88
Number of complaints 0 1 0
KEY DESCRIPTION
N/P NOT PROVIDED Green TBC/NA/NP
N/A NOT APPLICABLE Amber None
TBC
TO BE
CONFIRMED Red
1
0
NURSING & MIDWIFERY QUALITY INDICATORS : JUNE 2013/14 - DRAFT
Women & ChildrenJun-13
BluebellWard NICUED/CAUGynaecology Diamond Jubilee Maternity Unit
0.10%
8.10%
3.40%
3.40%
0
Bed
sS
taff
ing
Lo
S
TBCTBC
Pati
en
t S
afe
tyP
ati
en
t E
xp
eri
en
ce
0
0
N/A
13
100%
N/A
RAG RATING KEY
0
N/A
N/A
100%

Method of
MeasurementNumerator Denominator Metric Data Source
Total beds Nursing Only Count Sitreps
Bed occupancy % To be confirmed TBC TBC Percentage Sitreps
Funded WTE Nursing Only Count ESR
Actual WTE Nursing Only Count ESR
Vacancy rate % Nursing Only Percentage ESR
Sickness % Nursing Only Percentage ESR
Agency usage % Nursing Only Percentage ESR
Bank usage % Nursing Only Percentage ESR
Appraisal % Nursing Only Percentage ESR
Mandatory training % Nursing Only Percentage ESR
Average length of stay Excludes Day CasesLength of Spell based
on daysTotal number of Spells Count PAS /Data Warehouse
No. OutliersMichael Harper to
confirmCount Sitreps
No. Delayed dischargesBased on Monthly
Unify SubissionCount Sitreps
No. Inpatient fallsBernadette Herbert/Jill
Calandar to confirmCount
No. Inpatient falls
resulting in serious harm
Bernadette Herbert/Jill
Calandar to confirmCount
No. Pressure ulcers ≥2 Heidi Guy to confirm Count
EWS % scoreClare Thorogood to
confirmPercentage
Response to trigger %Clare Thorogood to
confirmPercentage
No. Medication
administration errors
Philomena James to
confirm
No. Safety Thermometer
harms
Jenny Pennel to
confirm
WHO Check ListTracey Radnall to
confirm
Practice Standard ScoresTracey Radnall to
confirm
Net promoterJenny Pennel to
confirmCount Meridian
Meridian ScoreJenny Pennel to
confirmPercentage
Number of complaintsJackie Martin/Jan
Shrieves to confirm Count
Pati
en
t E
xp
eri
en
ce
NURSING & MIDWIFERY QUALITY INDICATORS : JUNE 2013/14 - DRAFT
Pati
en
t S
afe
ty
Jun-13
INDICATOR
Be
d
sS
taff
ing
Lo
S

Green
rating
Amber
rating
Red
ratingMetric Data Source Responsible Officer / Dept Comments
Total beds Count Sitreps
Michael Harper/Sheelagh
Malloy/ Keith Saunders
(MVCC )
Jennifer Kearney /
Sharn Elton
Bed occupancy % <= 91% < 93% > 93% Percentage Sitreps
Michael Harper/Sheelagh
Malloy/ Keith Saunders
(MVCC )
Jennifer Kearney /
harn Elton
Funded WTE Count ESR Lindsay Freeston Lindsey Freeston
Actual WTE Count ESR Lindsay Freeston Lindsey Freeston
Vacancy rate % <= 7% <= 9% > 9% Percentage Finance Ledger Lisa Potter Katrina Doyle
Sickness % <= 3.5% <= 5% > 5% Percentage ESR Lindsay Freeston Lindsey Freeston
Agency usage % < 2% < 5% > 5% Percentage ESR Lindsay Freeston Lindsey Freeston
Bank usage % < 4% < 7% > 7% Percentage ESR Lindsay Freeston Lindsey Freeston
Appraisal % > 90% > 70% < 70% Percentage ESR Lindsay Freeston Lindsey Freeston
Mandatory training % >= 90% < 90% Percentage ESR Lindsay Freeston Lindsey Freeston
Average length of stay < 4.5 < 6 >= 6 Count PAS /Data Warehouse Information
No. Outliers Count Sitreps Michael HarperJennifer Kearney /
Sharn Elton
No. Delayed discharges Count Sitreps Discharge TeamLeanne Welch
No. Inpatient falls <= 972 > 972Count Per
YearBernadette Herbert
Bernadette Herbert
No. Inpatient falls
resulting in serious harm<= 24 <= 36 > 36
Count Per
YearBernadette Herbert
Bernadette Herbert
No. Pressure ulcers ≥2 <= 8 > 8 > 10Count Per
monthDianne Brett/ Heidi Guy
Diance Brett
EWS % score >= 98% > 89% <= 89% Percentage Clare Thorogood Clare Thorogood
Response to trigger % >= 98% > 89% <= 89% Percentage Clare ThorogoodClare Thorogood
No. Medication
administration errors< 145 <= 161 > 161 Philomena James
Philomena James
No. Safety Thermometer
harms<= 589 < 619 >= 619 Jenny Pennell Jenny Pennell
WHO Check List >= 95% < 95% Percentage Tracey Radnall Tracey Radnall
Practice Standard Scores >= 90% < 90% < 75% Percentage
Tracey Radnall
Karen Weddell
Maria Williams
Tracey Radnall
Helen Brittain
Net promoter >= 71 < 71 Count Meridian Jenny Pennell Jenny Pennell
Meridian Score >= 95 75 < 75 Percentage Jenny Pennell Jenny Pennell
Number of complaints <=858
<=942
>942 Count
Jackie Martin /
Jan Shrieves
Jackie Martin /
Jan ShrievesPati
en
t E
xp
eri
en
ce
NURSING & MIDWIFERY QUALITY INDICATORS : JUNE 2013/14 - DRAFT
Pati
en
t S
afe
ty
Jun-13
INDICATOR
Be
ds
Sta
ffin
gL
oS

1
Appendix 1
Graph 1: Trust Staffing V LTFM and Establishment
Graph 2: Sickness Rates Based On In Month Position

2
Graph 3: Customer Excellence Training, Attendance and Booking
Customer Care Training Trajectory
0
500
1000
1500
2000
2500
3000
3500
4000
4500
Feb-
13
Mar
-13
Apr-
13
May
-13
Jun-
13
Jul-1
3
Aug-
13
Sep-
13
Oct
-13
Nov
-13
Dec
-13
Jan-
14
Feb-
14
Mar
-14
Apr-
14
May
-14
Jun-
14
Date
Trai
ning
plac
es
Rolling total Capacity (Jan-Jun 2014projected av.)Rolling total Actuals
Rolling total Actuals & bookings
75% (Stat&Mand attendance rate)
Appendix 2
Table 2: Resourcing Data
Source:ESR/NHS jobs
TrustMth
TrustYTD Surgery Medicine CS W & C Cancer Corporate
Jobs advertised– WTE 57.77 7.37 33.6 0.8 5.47 3.6 6.93
Number ofcandidates
undergoing pre-employment
checks
141.75 46.01 27.87 19.85 19.87 20.35 7.8
Number ofstarters – 12 mth
(rolling figure)Not inc Jnr Docs
34.07 602.15 5(108.86)
15.19(168.47)
4(80.81)
1.52(99.93)
5.60(50.33)
2(67.63)
Number ofleavers – 12 mth
(rolling figure)Not inc Jnr Docs
38.34 548.674.33
(116.37) 14.65(109.89)
4.14(104.51)
4.76(63.46) 1
(52.33)4.56
(82.07)

3
Table 5: NHSP Performance
ProfessionalGroup
Number ofShiftsRequested
Numberof BankShiftsFilled
Bank FillRate
NumberofAgencyShiftsFilled
Agency FillRate
% latebookingrequests
Total Fill Rate
Nursing 4961 3322 67.0% 1153 23.2% Data will beavailable fornext report
90.2%
Medical 843 447 53% 314 37.2% Data will beavailable fornext report
90.3%
AHP 77 39 50.6% 37 48.1% Data will beavailable fornext report
98.7%
A&C 1921 1618 84.2% 152 7.9% Data will beavailable fornext report
92.1%
HCS 259 128 49.4% 88 34.0% Data will beavailable fornext report
83.4%
Support 681 590 86.6% 20 2.9% Data will beavailable fornext report
89.6%
Total 8742 6144 70.3% 1764 20.2% Data will beavailable fornext report
90.5%

1
Infection Prevention and Control Board ReportJune 2013
PurposeThe purpose of this report is to provide the Trust Board with an overview of Infection Prevention & Control performance for period of 1st of June 2013 to 30th June 2013
Performance
There have been 0 cases of hospital acquired MRSA Bacteraemia in June 2013. There has been 4 cases of hospital acquired C.difficile in June 2013Target 2013/14 = 0 avoidable YTD= 1 Target 2013/14 =14 YTD= 7
There has been 1 case of hospital acquired MSSA bacteraemia post 48 hours in June 2013. Elective MRSA Screening Compliance in June 2013 N/AvailTarget 2012-2013 = (No Target) YTD =4 Target 2013/14 = 100% YTD= N/Avail
There has been 5 cases of hospital acquired E.Coli Bacteraemia in June 2013. Emergency MRSA Screening Compliance in June 2013 N/Avail
Target 2013/14 = (No Target) YTD = 9 Target 2013/14 =100% YTD = N/Avail
There have been 0 cases of hospital acquired Vancomycin Resistant Enterococci in June 2013.
Target 2013/14 = (No Target) YTD = 2
Clinical IssuesThe management of the VRE Outbreak declared on 6B on 30th May continues. With no further cases of bacteraemia since 1st May 2013, and 3 clinical infections since outbreakdeclared on ward.
High Impact InterventionsAll above 95% compliance with the exception of urinary catheter continuing care at 94%. Local action plan in place
DH-Deep Clean Program 2013 – 2014Gloucester & Dacre wards were partially deep cleaned in June and will be completed the last week in July.
Summary1. No further MRSA bacteraemia.2. Increase in cases of CDT above annual trajectory - see exception report.3. Elective MRSA Screening compliance – not available at time of report4. Emergency MRSA screening compliance - not available at time of report - See exception report5. Surgical Site Infection – continued improvement. Now within national boundaries for both knee replacement and #NOF surgery - see report

2
MRSA BACTERAEMIA
NHS Year2007-08 33
2008-09 18No. of MRSA Bacteraemia 1 2009-10 10No. of Occupied Bed Days 86,900 2010-11 5MRSA Bacteraemia per 1,000 beddays 0.01 2011-12 3
2012-13 22013-14 1
Division2012-13
YTD Jul-12 Aug-12 Sep-12 Oct-12 Nov-12 Dec-12 Jan-13 Feb-13 Mar-13 Apr-13 May-13 Jun-13Cancer 0 0 0 0 0 0 0 0 0 0 0 0 0Medicine 1 1 0 0 0 0 0 0 0 0 1 0 0Surgical 0 0 0 0 0 0 0 0 0 0 0 0 0Women & Children 1 0 0 0 0 0 0 0 0 0 0 0 0Grand Total 2 1 0 0 0 0 0 0 0 0 1 0 0
MRSA bacteraemia by Division
MRSA bacteraemia Apr13 - Mar14
0
2
4
6
8
10
12
Jul-1
2
Aug
-12
Sep
-12
Oct
-12
Nov
-12
Dec
-12
Jan-
13
Feb-
13
Mar
-13
Apr
-13
May
-13
Jun-
13
MRSA Bacteraemia Monthly Performance 2012-14 YTD 33
18
10
53 2 1
0
5
10
15
20
25
30
35
2007-08 2008-09 2009-10 2010-11 2011-12 2012-13 2013-14
MR
SA
Bac
tera
emia
s
NHS Year
MRSA bacteraemias by year

3
Elective AdmissionsMRSA Screens Jul-12 Aug-12 Sep-12 Oct-12 Nov-12 Dec-12 Jan-13 Feb-13 Mar-13
Total12-13 Apr-13 May-13 Jun-13 YTD
% Compliance 100% 100% 100% 100% 100% 100% 100% 100% 100% 100% 100% 100% TBC 100%
Emergency AdmissionsMRSA Screens Jul-12 Aug-12 Sep-12 Oct-12 Nov-12 Dec-12 Jan-13 Feb-13 Mar-13
Total12-13 Apr-13 May-13 Jun-13 YTD
% Compliance 88% 89% 92% 94% 95% 92% 90% 90% 92% 91% 93% 92% TBC 93%
* Not available at time of report
Screening Compliance (rounded to nearest % point)

4
CLOSTRIDIUM DIFFICILE
2007-08 354Clostridium difficile Apr 13 - Mar 14 2008-09 108No. of C.diff. Cases 7 2009-10 82No. of General admissions 53,579 2010-11 56C.diff. Cases per 1,000 general admissions 0.13 2011-12 12
2012-13 13C-DIFF via Division 2013-14 7
DivisionTotal 12-
13 Jul-12 Aug-12 Sep-12 Oct-12 Nov-12 Dec-12 Jan-13 Feb-13 Mar-13 Apr-13 May-13 Jun-13 YTDCancer 2 0 0 0 0 0 0 0 0 0 0 0 0 0Medicine 6 0 0 1 0 0 0 2 0 1 1 2 2 5Surgical 5 2 0 1 0 1 0 0 0 0 0 0 2 2Women & Children 0 0 0 0 0 0 0 0 0 0 0 0 0 0Grand Total 13 2 0 2 0 1 0 2 0 1 1 2 4 7
02468
1012141618202224
Jul-1
2
Aug-
12
Sep-
12
Oct
-12
Nov-
12
Dec-
12
Jan-
13
Feb-
13
Mar
-13
Apr-1
3
May
-13
Jun-
13
Clostridium Difficile for year 2012-14 YTD354
108 8256
12 13 70
50100150200250300350400
2007-08 2008-09 2009-10 2010-11 2011-12 2012-13 2013-14
No.o
fC.d
iffic
ileca
ses
NHS Year
Clostridium difficile by year

5
CLOSTRIDIUM DIFFICILE
C.diff Specimen Testing (All Specimens Received Including Community)Criteria for testing DH (2008) Bristol Stool Chart types 5-7
SamplesTotal12-13 Jul-12 Aug-12 Sep-12 Oct-12 Nov-12 Dec-12 Jan-13 Feb-13 Mar-13 Apr-13 May-13 Jun-13 YTD
No. of Specimens for CDT to lab 1483 191 178 155 158 175 162 173 151 152 174 152 478No. Tested 1191 131 125 133 151 126 103 117 103 106 110 97 106 313No. Not tested for lab reasons 248 40 40 14 24 23 22 29 25 9 20 21 11 52No. Not tested as advised by the ICT 223 20 13 8 23 26 37 27 16 36 22 51 35 108% of Specimen's tested 80.3% 68.6% 70.2% 85.8% 95.6% 72.0% 63.6% 67.6% 78.6% 70.2% 72.4% 55.7% 69.7% 65.48%Stools samples from GPs from <65 yrs are no longer tested for C diff , unless explicitly requested by the GP.* Not available until month is complete

6
High Impact Intervention Key Performance Indicators
High Impact InterventionsTotal 12-
13RAGrate Jul-12 Aug-12 Sep-12 Oct-12 Nov-12 Dec-12 Jan-13 Feb-13 Mar-13 Apr-13 May-13 Jun-13 YTD
RAGrate
Hand Hygiene 99.17
98.98 99.13 99.80 99.46 98.52 99.16 99.61 99.85 99.63 99.82 99.88 99.72 99.64
Surgical Site ObservationTool 98.74
99.21 100.00 99.30 99.69 94.52 98.43 99.46 99.20 98.93 98.29 99.31 97.30 98.40
PVC(Insertion)96.31
97.69 96.12 94.68* 95.89 94.15 95.98 97.51 89.21 97.92 97.66 97.10 96.08 96.83
PVC(Continuing Care) 97.79
98.43 98.57 96.83 97.43 97.48 97.79 98.03 95.69 98.05 97.23 97.10 95.07 96.49
Urinary Catheter(Insertion) 98.90
99.62 97.27 98.10 99.89 100.00 99.70 99.07 100.00 87.74 98.63 97.71 99.21 98.56
Urinary Catheter (ContinuingCare) 98.10
99.90 99.03 98.45 98.21 99.00 98.94 98.09 97.21 96.34 99.78 97.83 94.09 96.98
Renal Dialysis CatheterInsertion 100.00
100.00 100.00 100.00 100.00 100.00 100.00 100.00 100.00 100.00 100.00 N/A 100.00 100.00
Renal Dialysis(ContinuingCare) 98.54
96.00 100.00 97.50 100.00 100.00 93.75 100.00 100.00 100.00 100.00 100.00 100.00 100.00
Environment and Safety 97.59
97.79 97.59 97.66 98.19 97.15 97.69 98.01 97.88 98.15 97.59 97.74 97.31 97.58
Ventilator Catheter Insertion 98.91
100.00 100.00 100.00 100.00 100.00 100.00 100.00 92.50 100.00 100.00 100.00 100.00 100.00
Ventilator(Continuing Care) 98.33
100.00 100.00 100.00 100.00 100.00 100.00 95.14 100.00 87.25 100.00 100.00 100.00 100.00
Central Venous CatheterInsertion 99.51
100.00 100.00 100.00 100.00 100.00 100.00 100.00 95.88 98.06 100.00 96.80 99.26 98.71
Central Venous CatheterCare 99.11
96.43 100.00 95.60 97.22 100.00 100.00 100.00 100.00 100.00 100.00 97.35 95.35 96.67

7
MSSA BACTERAEMIA
HospitalacquiredMSSA byDivision
Total12-13YTD Jul-12 Aug-12 Sep-12 Oct-12 Nov-12 Dec-12 Jan-13 Feb-13 Mar-13 Apr-13 May-13 Jun-13
Total 13-14 YTD
Cancer 2 0 0 0 0 0 0 0 0 0 0 0 0 0Medicine 10 2 1 0 1 1 1 0 1 0 2 0 1 3Surgical 3 0 0 0 0 0 0 0 0 0 0 0 0 0Women & C 1 0 0 0 0 0 0 0 0 0 1 0 0 1Grand Tota 16 2 1 0 1 1 1 0 1 0 3 0 1 4
02468
1012141618202224
Jul-1
2
Aug-
12
Sep-
12
Oct-1
2
Nov-1
2
Dec-1
2
Jan-
13
Feb-
13
Mar-1
3
Apr-1
3
May-1
3
Jun-
13
MSSA Monthly Performance July 2012 onwards

8
Contaminated Blood Culture Samples (All Specimens) Internal Target <3%
Samples
Total 12-13 YTD Jul-12 Aug-12 Sep-12 Oct-12 Nov-12 Dec-12 Jan-13 Feb-13 Mar-13 Apr-13 May-13 Jun-13 YTD
Specimen Receivedin Lab 3081 803 723 763
* * * * * * * * *
No. Contaminated 131 29 30 32 * * * * * * * * *% Contaminated 4.3% 3.6% 4.1% 4.2% * * * * * * * * ** not available at time of report

9
E.COLI BACTERAEMIA
986,900
MSSA Bacteraemia per 1,000 bed days 0.10
Hospital Acquired E.Coli by Division
DivisionTotal 12-13 YTD Jul-12 Aug-12 Sep-12 Oct-12 Nov-12 Dec-12 Jan-13 Feb-13 Mar-13 Apr-13 May-13 Jun-13 YTD
Cancer 1 0 0 1 0 0 0 0 0 0 0 0 0Medicine 25 1 1 3 0 4 1 1 1 4 2 1 3 6Surgical 13 1 2 1 1 2 1 0 2 0 0 0 2 2Women & Children 4 0 0 0 1 1 0 0 0 1 0 1 0 1Grand Total 43 2 3 5 2 7 2 1 3 5 2 2 5 9
E.Coli Bacteraemia April 2013 OnwardsE.Coli BacteraemiaNo. of Occupied Bed Days
0
1
2
3
4
5
6
7
8
Jul-12 Aug-12 Sep-12 Oct-12 Nov-12 Dec-12 Jan-13 Feb-13 Mar-13 Apr-13 May-13 Jun-13
E.Coli Monthly Performance July 2012 Onwards

10
EMERGENCY MRSA SCREENING
EXCEPTION REPORT: COMPLIANCE & CLINICAL EFFICIENCY JUNE 2013Target /Core Standard:
MRSA (Meticillin resistant Staphylococcus aureus) – Emergency. DH Gateway ref. document 13482, Operational guidance No. 3
Target Definition:Screening of all ‘relevant’ patients admitted through the emergency pathway for Meticillin resistant Staphylococcus aureus from 31 December 2010
The Issue:• Reduction in compliance on previous month - still not achieving 95% or above• Patients being missed particularly in Emergency Department• Missed patients not always being followed up by ward• Swabs taken discarded by laboratory as not adequately labelled• Increased use of bank and agency staff in the Emergency Dept. may be a contributing factor of lapses in failure to follow policy with
regard to swabbing all relevant emergency admissions• ICE forms not being generated as planned by admin staff.
Actions Taken:• Quality Standard document produced by the ED given to all bank and agency staff to sign stating they know
and understand the Trust procedures and requirements in relation to MRSA screening• ED Matron monitoring compliance with policy• Matron for Womens’ & Children and Matron for Surgery meeting with infomatics to ensure all loop holes have been
identified and data is robust
Next Steps:• ED Matron to contact Laboratory Manager to be clear regarding reasons for swabs being discarded in lab• ADIPC to arrange audit of process of emergency admissions following swab pathway to identify omissions
and difficulties in process preventing compliance.• Continue with actions already in place
Lead Director Angela Thompson 4.7.13

11
MANDATORY ORTHOPAEDIC SURGICAL SITE SURVEILLANCE
Issues: Above national trajectory for total hip replacement surgery
OperationPeriod 41 Oct-31 Dec 2012
Period 11Jan-31Mar 2013
Period 21Apr-31June2013
Period 31Jul-30 Sept 2013
Period 41 Oct-31 Dec2013
Total No .ofinfectionsYtd
National averageytd
Total Knee Rep. 1 (4.7%) 0 (0.0%) 0 (0.0%) 0 (0.0%) 0.5-0.6%Total Hip Rep. 3 (7.5%) 2 (3.5%) 1 (2.2%) 3 (2.9%) 0.7-0.8%#NOF 3 (2.3%) 2 (1.9%) 2 (1.6%) 4 (1.7%) 1.5-1.8%
Actions taken:
• RCAs continue and findings addressed as per action plan• Reviews of RCAs undertaken in Surgicentre almost complete (1 RCA to be completed).• Competency assessments underway in gloving and gowning techniques for all senior nursing theatre staff• Work on revising Trust documentation taking place to assist compliance of recording temperatures and capillary blood glucose monitoring
intra operatively and post operatively in compliance with NICE• Progress presented at Trust annual Infection Prevention Conference 18th June 2013
Next Steps:
• Retraining in use of skin prep across all theatres to recommence throughout month• Work through second stage action plan• Attendance at RCAs to include consultant anaesthetists and a member of theatre staff• Follow up observational audit of skin prep. Maternity Theatres• Continue competency assessments for all surgeons commencing with T&O in gloving and gowning
Lead Director Angela Thompson 4.7.13

12
CLOSTRIDIUM DIFFICILLE
EXCEPTION REPORT: COMPLIANCE & CLINICAL EFFICIENCY JUNE 2013
Target /Core Standard:Clostridium difficile ceiling target of 14 for 2013/14
Target Definition:All cases of Clostridium difficile identified 72 hours post admission up to and no more than 14 cases in the year 2013/14
The Issue: 7 cases of Clostridium difficile have been reported year to date. 2 community acquired cases were identified post 72 hours. 1 case was diagnosed on sigmoidoscopy, the patient was toxin negative but case still requires reporting 1 case post RCA deemed as colonised on admission (previously known positive) 1 unavoidable due to antibiotic treatment Latest case RCA planned for 5/6/13 3 positive patients have been on Barley ward at some point in current hospital episode
Actions Taken:• RCAs undertaken for all cases within 10 days• Findings of RCAs shared with wards and divisions through divisional IP&C meetings.• Newsletter for ward staff with feedback on RCA findings and learning points• Monthly Quick Pics flyer to all staff planned for July focuses on C.diff. diarrhoea and informing the IP&C Team of all patients with diarrhoea
in a timely manner etc.• Medical Monthly note to all doctors focus on C.diff. diarrhoea and algorithm for testing• All wards have checked that algorithm to manage patients with diarrhoea is in every patient folder• Hand out which includes the algorithm produced for dissemination by NHS Professionals. Also given to all ward Managers for local use with
bank and agency staff• IPCNs visiting Barley Ward daily, performing three times a week audits feeding back to Ward staff compliance issues as necessary• Antimicrobial rounds by Consultant Microbiologist continue weekly both at Lister and QEII• Side room ward round weekly by Infection Control Doctor and Infection Control Nurse• Daily follow-up of all patients made known to the IP&C Nursing Team• Screensaver planned for 17th July 2013• July link Practitioner meeting focus on the management of patients with diarrhoea, focusing on C.diff.

13
• Stool samples sent off for typing to identify any links between patients• Deep clean schedule in place with priority for wards with cases of C. diff.
Next Steps:• Follow up all actions above - reporting back to DIPC weekly
Lead Director Angela Thompson 4.7.13