Embed Size (px)
Citation preview

I
website : www.schooleducation.kar.nic.inwww.dise.in. www.schoolreportcards.inwww.ssakarnataka.gov.in

II
Title : EDUCATION in KARNATAKA, 2010-11
A State – level, District-Wise Analytical Report.
Publication : July 2011
Pages : 108+4
Copies : 1500
Published by : Commissioner of Public Instruction, Department of Education
Copy right : State Project Director, Sarva Shiksha Abhiyan, Nrupathunga Road, K.R.Circle, Bangalore – 560001
Basic Source : DISE, 2010-11 (as on 30th September, 2010)
Printed by : DATACON TECHNOLOGIES # 79, Ist Floor, Industrial Town Magadi Main Road, Bangalore-560 044

III
EDUCATIONAL MAP OF KARNATAKA

IV

V
ForewordAn imposing system of education has evolved over a period of time in Karnataka Sate as is evident from the dataof schools, teachers and students.
In order to provide infrastructure facilities and teachers for schools of the State, organize capacity buildingprogrammes for teachers, provide stimulating incentives such as free textbooks, uniforms and mid-day meals tostudents in comprehensive and efficient ways, there is a need for basic data about the school system. It would notbe possible to provide a meaningful school support system, for all the schools within the jurisdiction of 34 educationaldistricts, 202 educational blocks and 2708 cluster resource centers without the availability of such basic data. It isthe responsibility of the ‘Educational Management Information System’ unit of the Department of Education, theEMIS unit, to collect, process, consolidate and publish educational data which are of foundational value for thesystem of education in the State.
The EMIS unit has been functional since 2004-05. It has been publishing educational data every year which havebeen useful to the government for educational planning, implementation of programmes, monitoring, supervisionand evaluation of efforts. These data are invaluable in appraisal of status and direction of education in the State andfor realization of goals of universalisation of elementary education. Educational data for the year 2010-11 arecurrently available. It is proposed to publish them in a series of volumes : a hand book of complete data on thetotality of the educational system on our web-site ; an analytical report of significant parameters and concerns ofthe system of education in the State ; an update on status of education in the districts; and a detailed district-wiseupdate on the status of education in the blocks. The current volume being published is the analytical report onsignificant parameters and concerns of education in the state.
The analytical report, the district / block level reports are being extensively used in preparation of Annual DistrictPlans for Sarva Shiksha Abhiyan, submission of reports to Joint Review Missions, preparation of regional plans,sampling design for research studies and reviews of progress in the State.
‘Progress of education’ section of 2009-10 reported on the status of progress of education in the State from2006-07 to 2009-10. This is updated for 2010-11.
The analytical report for 2010-11 includes information on drop-out rates. There is also a section on Literacy Ratesin the State as reported by the Census of India, 2011. Sex-wise, district-wise literacy rates, variations in numberof illiterates across 2001 and 2011 are highlights herein.
The current EMIS volume for 2009-10 is being sent to all those persons who are concerned and interested aboutthe system of education in the State as well as the Department of Education of the State government. It would alsobe of value to educational policy-makers, planners, administrations, researchers, statisticians and enlightenedpublic. We eagerly look forward to feedback and constructive suggestions on this volume so that the EMIS unitmay function in a more efficient and meaningful way in future.
Sri Tushar Giri Nath, I.A.SCommissioner of Public Instruction
Department of Education
Mr. Harsh Gupta, I.A.SState Project Director,Sarva Shiksha Abhiyana

VI

VII
CONTENTS PAGES
EDUCATIONAL MAP OF KARNATAKA III
GENERAL INFORMATION 01
EDUCATION IN THE STATE – A BRIEF PROFILE 02
SCHOOLS OF THE STATE 03-10
ENROLMENTS IN THE STATE 11-21
INFRASTRUCTURE FACILITIES 22-33
TEACHERS 34-39
PROGRESS OF EDUCATION IN THE STATE 40-56
ANNEXURES 57-100

VIII

1
Table 1
Basic Administrative Units
1 BAGALKOT 6 6 6 126 623 1340 191
2 BANGALORE RURAL 4 4 4 90 1298 1298 98
3 BANGALORE URBAN 4 9 9 163 693 990 210
4 BELGAUM 10 14 14 296 1495 1942 553
5 BELLARY 7 8 8 128 543 1034 189
6 BIDAR 5 5 5 130 717 960 176
7 BIJAPUR 5 7 7 178 823 1614 199
8 CHAMARAJANAGARA 4 5 5 71 464 1031 121
9 CHIKKABALLAPURA 6 6 6 121 1102 2045 164
10 CHIKKAMANGALORE 7 8 8 127 861 4514 232
11 CHITRADURGA 6 6 6 152 1358 1799 189
12 DAKSHINA KANNADA 5 7 7 114 379 1734 214
13 DAVANAGERE 6 7 7 131 2117 1288 230
14 DHARWAD 5 7 7 84 407 542 135
15 GADAG 5 6 6 84 4232 564 106
16 GULBARGA 7 8 8 168 1360 1889 385
17 HASSAN 8 8 8 208 393 3470 288
18 HAVERI 7 7 7 110 1747 988 209
19 KODAGU 3 3 3 42 1149 721 105
20 KOLAR 5 6 6 145 1392 2783 168
21 KOPPAL 4 4 4 84 1324 789 137
22 MANDYA 7 8 8 152 1395 2351 246
23 MYSORE 7 9 9 176 5284 2032 235
24 RAICHUR 5 5 5 128 636 1434 164
25 RAMANAGARA 4 4 4 106 2137 2305 138
26 SHIMOGA 7 7 7 168 5284 5284 260
27 TUMKUR 10 10 10 281 2537 4417 321
28 UDUPI 3 5 5 79 255 2406 145
29 UTTARA KANNADA 11 11 11 182 1149 6186 219
30 YADAGIRI 3 3 3 79 676 1134 129
Total 176 203 203 4103 43830 60884 6156
Source: (1) Karnataka at a Glance, 2009-10, B of E & S, GoK. (2) SSA, 2010-11
S.No. District
No. ofEducational
BlocksNo. of BRC /
URC CRCNo. of
villages/Wards*
No. ofHabitation
No. ofPanchayaths
No. ofRevenue
Blocks

2
Table 2
A Brief Profile of the Education in the state - 2010-11
Schools (in Numbers)
1 Lower Primary Schools 23,109 184 239 2,761 9 26,3022 Higher Primary Schools 22,568 539 2,418 7,491 110 33,1263 Total Primary Schools 45,677 723 2,657 10,252 119 59,4284 High Schools 4,278 448 3,367 5,259 95 13,4475 Total Schools 49,955 1,171 6,024 15,511 214 72,875
Enrolment (in Lakshs)6 Class 1st to 7th 43.92 0.63 6.95 22.36 0.39 74.257 Class 8th to 10th 10.62 0.50 8.34 6.40 0.18 26.048 Total (Class 1 to 10) 54.54 1.13 15.29 28.76 0.57 100.29
Teachers
9 Elementary Schools Sanction 202483 4305 21291 84679 2001 31475910 Elementary Schools Position 189451 3765 17229 82787 1830 29506211 Secondary Schools Sanction 42854 3439 32450 53210 1789 13374212 Secondary Schools Position 37752 2941 28348 51738 1622 122401
Source : DISE 2010-11
Sl. No Facility Elementary Schools High Schools
SlNo.
Details EducationDept
SocialWelfare +local Bady
Aided Un -Aided Central+Others
StateTotal
Table 3Proportion of Provision of 8 Basic Facilities: Education Dept
Infrastructure Indicators (%)1 Common Toilets 91.97 69.472 Girls’ Toilets 74.26 68.093 Electricity 91.89 73.494 Play Ground 54.42 74.755 Ramps 72.95 24.996 Library 91.86 92.947 Compound Wall 66.61 58.168 Drinking Water 93.60 86.77
COMPOSITE INDEX 79.69 63.26Access Indicators (%)
Sl.No Indicator Primary Upper Primary9 Access Ratio 100.00 100.0010 Gross Enrolment Ratios (GER) 107.53 103.9211 Net Enrolment Ratios (NER) 98.86 93.5712 Drop-out Rates of Children 2.09 5.47
Out of School Children13 Out-of School Children (7 to 14 years) Total 39841
Never Enrolled 5720Drop-out 34121
Literacy Rates 2011 Census14 Literacy Rate Total 75.6
Male 82.8Female 68.1
Source : DISE 2010-11, OOSC, Census 2011
Schools :
Enrolment :
Teachers :

3
A Brief Profile of SCHOOLSSchool is the fundamental and a foundational unit of an educational system. Number of schools is indicative of the
size of a system. There are 72875 schools in the State of which 26302 are lower primary, 33126 are higher primary and13447 are high schools. The ratio between lower and higher primary schools is 1: 1.26; like-wise, the ratio betweenhigher primary and high schools is 2.46:1.
Schools have been classified under 5 heads as follows: Management - Wise
Standards of Instruction Covered (LPS / HPS / High Schools)
Region (Rural / Urban)
As per Medium of Instruction
Sex - Wise (Girls only / Boys only / Co-Education).
Schools of the State are run by 17 types of Managements. Some of the prominenttypes are mentioned here.
Department of Education
Department of Social Welfare
Local Self - Government Institutions
Private Aided
Private Un-Aided
Others [Jawahar Navodaya, Central, Sainik, NRI, Madarasas, Arabic, etc; are included here].
Schools run by the Department of Education, Department of Social Welfare and by the Local Self GovernmentInstitutions are classified as Government Schools.
Table 4
Details of Number of Schools by Management
1 Lower Primary Schools 23,109 184 239 2,761 9 26,302
2 Higher Primary Schools 22,568 539 2,418 7,491 110 33,126
3 Total Primary Schools 45,677 723 2,657 10,252 119 59,428
4 High Schools 4,278 448 3,367 5,259 95 13,447
5 Total Schools 49,955 1,171 6,024 15,511 214 72,875
Source : DISE 2010-11
SlNo. Details
EducationDept
SocialWelfare +local Bady
Aided Un -Aided Central+Others
StateTotal

4
Graph 1 (for TABLE 4)Comparison of Number of Schools by Managements
Note:- Go to annexures 1,2,3 and 4 for details of District-wise / Management – wise break - up of Schools.
TABLE 5
School Facilities and their relative proportions in the State
Education Dept 23109 87.86 22568 68.13 45677 76.86 4278 31.81 49955 68.55
Social Welfare + Local bady 184 0.70 539 1.63 723 1.22 448 3.33 1171 1.61
Aided 239 0.91 2418 7.30 2657 4.47 3367 25.04 6024 8.27
Un-Aided 2761 10.50 7491 22.61 10252 17.25 5259 39.11 15511 21.28
Others + Central 9 0.03 110 0.33 119 0.20 95 0.71 214 0.29
Total 26302 100 33126 100 59428 100 13447 100 72875 100
Source : DISE 2010-11Notes:-
Nearly 4 out of every 5 elementary schools in the State are either run by the Government or supported bythe Government.
Nearly 9 out of 10 lower primary schools are managed by the Government.
It is only at the high school level that private participation is considerable. Still it is observed that nearly 3 outof 5 high schools are either managed or supported by the Government.
CategoryLower Primary
SchoolsUpper Primary
SchoolsElementary
SchoolsSecondary
SchoolsTotal (Elementary
+ Secondary)
No. % No. % No. % No. %No. %

5
Sl.No. Category
Lower PrimarySchools
Upper PrimarySchools
ElementarySchools
SecondarySchools
Total (Elementary+ Secondary)
No. % No. % No. % No. %
Table 6
School Facilities in the 04 revenue divisions of the State
BANGALORE DIVISION
1 Education Dept. 9,350 91.34 6,646 59.43 15,996 74.68 1,160 22.76 17,156 64.70
2 SW + LB 48 0.47 144 1.29 192 0.90 141 2.77 333 1.26
3 Aided 73 0.71 812 7.26 885 4.13 1,232 24.18 2,117 7.98
4 Un-Aided 762 7.44 3,533 31.59 4,295 20.05 2,528 49.61 6,823 25.73
5 Other and Central 3 0.03 48 0.43 51 0.24 35 0.69 86 0.32
6 Total 10,236 100.00 11,183 100.00 21,419 100.00 5,096 100.00 26,515 100.00
7 % to the TotalSchools in State 38.92 33.76 36.04 37.90 36.38
BELGAUM DIVISION
1 Education Dept. 4,817 83.83 6,387 76.47 11,204 79.47 954 31.28 12,158 70.90
2 SW + LB 45 0.78 121 1.45 166 1.18 107 3.51 273 1.59
3 Aided 70 1.22 503 6.02 573 4.06 1,131 37.08 1,704 9.94
4 Un-Aided 812 14.13 1,311 15.70 2,123 15.06 830 27.21 2,953 17.22
5 Other and Central 2 0.03 30 0.36 32 0.23 28 0.92 60 0.35
6 Total 5,746 100.00 8,352 100.00 14,098 100.00 3,050 100.00 17,148 100.00
7 % to the Total Schoolsin State 21.85 25.21 23.72 22.68 23.53
GULBARGA
1 Education Dept. 3,488 81.04 4,370 70.67 7,858 74.92 981 42.82 8,839 69.17
2 SW + LB 28 0.65 112 1.81 140 1.33 93 4.06 233 1.82
3 Aided 43 1.00 438 7.08 481 4.59 338 14.75 819 6.41
4 Un-Aided 741 17.22 1,254 20.28 1,995 19.02 868 37.89 2,863 22.40
5 Other and Central 4 0.09 10 0.16 14 0.13 11 0.48 25 0.20
6 Total 4,304 100.00 6,184 100.00 10,488 100.00 2,291 100.00 12,779 100.00
7 % to the Total Schools in State 16.36 18.67 17.65 17.04 17.54
MYSORE DIVISION
1 Education Dept. 5,454 90.66 5,165 69.73 10,619 79.11 1,183 39.30 11,802 71.82
2 SW + LB 63 1.05 162 2.19 225 1.68 107 3.55 332 2.02
3 Aided 53 0.88 665 8.98 718 5.35 666 22.13 1,384 8.42
4 Un-Aided 446 7.41 1,393 18.81 1,839 13.70 1,033 34.32 2,872 17.48
5 Other and Central 0 0.00 22 0.30 22 0.16 21 0.70 43 0.26
6 Total 6,016 100.00 7,407 100.00 13,423 100.00 3,010 100.00 16,433 100.00
7 % to the Total Schools in State 22.87 22.36 22.59 22.38 22.55
Total State 26,302 33,126 59,428 13,447 72,875
Source : DISE 2010-11
No %

6
Note: - Schools of the DoE are relatively in higher proportion in Bangalore & Mysore divisions at the LPS stage.This proportion is quite high in Belgaum division at HPS stage. Highest proportion of DoE high schools are inGulbarga division. Proportion of private Unaided schools are 25.73, 22.40, 17.48 and 17.22 percent respectively inBangalore, Gulbarga, Mysore and Belgaum divisions. Lowest proportions of aided schools are in Gulbarga division.
Table 7
Distribution of schools by Rural/Urban
Sl. No. Level Urban Rural Total
1 Lower Primary Schools 2983 23319 26302
2 Upper Primary Schools 9560 23566 33126
3 Secondary Schools 5642 7805 13447
Total 18185 54690 72875
In % 24.95 75.05 100Source : DISE 2010-11
The proportions of schools in rural and urban areas out of the total number of schools of all managements in theState are 75.05 and 24.95 percent respectively. There is a marginal gain of 1.05 percent schools from rural to urbanareas during the year.
A comparison of availability of facilities for lower primary, higher primary and secondary education reveals thattheir proportion in rural areas is 88.65, 71.14 and 58.04 percent respectively. This data indicates that there is a greaterneed for secondary schools in rural areas. It is also noted that the proportion of HPS in rural areas has gone up by 5.21percent during 2010-11.
Graph-2
Graph-3

7
Table 8
Schools in Urban areas by Management
Category DOE SW+ LB Aided Un-Aided Others Total
Lower Primary 1689 57 122 1108 7 2983
Upper Primary 3216 182 1491 4610 61 9560
Elementary 4905 239 1613 5718 68 12543
Secondary 724 171 1318 3380 49 5642
Total 5629 410 2931 9098 117 18185
Source : DISE 2010-11
There are 18185 schools in urban areas of which 12543and 5642 are elementary and high schools respectively.39.14 percent of elementary schools in urban areas belong to the Department of Education while the proportion of aidedschools is 12.87 percent. 45.62 percent of schools are constituted by un-aided and other category schools. In case ofhigh schools, proportions of schools in urban areas that belong to Department of Education, Aided and Un-Aided andothers categories are 12.83, 23.36 and 59.90 respectively. It is noted that while a high proportion of elementary schoolsare run in urban areas by the department of education, a high proportion of high schools in urban areas is run by privateun-aided managements.
Table 9
Schools in Urban areas by Management - number. and percentage
Sl No. Level Edu. Dept SW + LB Aided Un-Aided Others Total
1 Primary Schools 1689 57 122 1108 7 2983
2 % to Total Primary 56.62 1.91 4.09 37.14 0.23 100.00
3 Upper Primary Schools 3216 182 1491 4610 61 9560
4 % to Total Upper Primary 33.64 1.90 15.60 48.22 0.64 100.00
5 Secondary Schools 724 171 1318 3380 49 5642
6 % to Total Secondary 12.83 3.03 23.36 59.91 0.87 100.00
Total 5629 410 2931 9098 117 18185
30.95 2.25 16.12 50.03 0.64 100.00
Source: DISE 2010-11
Graph-4

8
Notes:- It is observed that while the figure of total schools in urban areas was 16911 during 2009-10, thecorresponding figure for 2010-11 is 18185. The increase in urban areas between the years 2009-10 and 2010-11 is1274 schools, which works out to be 7.53 percent. It is noted that the increase of 1274 schools, is accounted by 5.63percent (669) at the elementary level and 12.01 percent (605), at the secondary school level.
Table 10
Distribution of Rural Schools by Management
Sl No. Level Edu. Dept SW + LB Aided Un-Aided Others Total
1 Primary Schools 21,420 127 117 1,653 2 23,319
3 Upper Primary Schools 19,352 357 927 2,881 49 23,566
4 Total (Elementary) 40772 484 1044 4534 51 46885
5 Secondary Schools 3,554 277 2,049 1,879 46 7,805
6 Total (Elementary +Secondary) 44326 761 3093 6413 97 54690
Source: DISE 2010-11
There are 54690 schools in rural areas, of which 46885 are elementary schools and 7805 are high schools. 86.96percent of total number of elementary schools in rural areas belongs to the Department of Education, while private aidedand private un-aided schools constitute 2.23 and 9.67 percent respectively. In case of high schools 45.53 percent of suchschools in rural areas belong to the Department of Education while the proportions for aided and unaided managementsare 26.25 and 24.07 respectively. It is to be noted that a great majority of schools in rural areas, especially theelementary schools, are managed by the Department of Education.
Graph-5

9
Table 11
Percentage of Distribution of Rural Schools by Management
Sl No. Level Edu. Dept SW + LB Aided Un-Aided Others Total
1 Primary Schools 21,420 127 117 1,653 2 23,319
2 % to Total Primary 91.86 0.54 0.50 7.09 0.01 100.00
3 Upper Primary Schools 19,352 357 927 2,881 49 23,566
4 % to Total Upper Primary 82.12 1.51 3.93 12.23 0.21 100.00
5 Secondary Schools 3,554 277 2,049 1,879 46 7,805
6 % to Total Secondary 45.53 3.55 26.25 24.07 0.59 100.00
Total 44326 761 3093 6413 97 54690
Percentage 81.05 1.39 5.66 11.73 0.18 100.00
Source: DISE 2010-11
Even though the proportion of schools run by the Department of Education in the State is 81.05 percent, it goesup to 91.86 percent in case of lower primary schools. The participation of private players both in regard to aided andunaided managements is quite low in rural areas. It is marginally visible only in case of high schools which arenormally located in big villages. It is clear that commercial designs overweigh concerns of rural development
among private players.
By and large, schools in the State are either LPS, LPS with HPS, LPS with HPS and HS or HPS with HS.Independent HPS without LPS and HS are there and figure is 397. Also Independent HS are 9593.
Schools by Medium of Instruction:-Majority of students are pursuing their studies in schools which have adopted Kannada, English, Urdu, Marathi,
Telugu, and Tamil as Medium of Instruction. Information about number of schools by the Medium of Instructionadopted by them is given in the following tables.
Table 12
Distribution of Schools by Media of Instruction
Sl.No. Category Kannada English Urdu Tamil Telugu Marathi Hindi Total
1 Lower Primary 23432 386 2333 27 27 370 8 26583
2 Upper Primary 27412 4971 2341 81 50 707 31 35593
3 Secondary 10043 4421 485 5 20 266 85 15325
Total 60,887 9,778 5,159 113 97 1,343 124 77,501
Source: DISE 2010-11
Note:-
Sum of all schools by Medium will not tally with Total Schools in the State at LPS / HPS / HS, as one schoolwill get counted under different Medium. For instance, A school with Kannada and Marathi mediumsections will get counted under two columns, one for Kannada and the other for Marathi.
English Medium schools (sections) are increasing. The figure was 4467 in 2007-08 and 9778 in 2010-11.
Tamil and Telugu sections / schools are decreasing. Perhaps, they have shifted to English medium. This istrue of Hindi medium sections / schools also. There is harmony in Hindi medium data across 2007-08,2008-09 and 2010-11. There was misclassification of Hindi medium schools / sections in 2009-10. This isrectified in 2010-11.

10
Table 12A
Percentage of Distribution of Schools by Medium of Instructions
Sl . No. Category Kannada English Urdu Tamil Telugu Marathi Hindi Total
1 Lower Primary 88.15 1.45 8.78 0.10 0.10 1.39 0.03 100.00
2 Upper Primary 77.02 13.97 6.58 0.23 0.14 1.99 0.09 100.00
3 Secondary 65.53 28.85 3.16 0.03 0.13 1.74 0.55 100.00
Total 78.56 12.62 6.66 0.15 0.13 1.73 0.16 100.00
Source: DISE 2010-11
Note: - The figures of total schools in this table will not tally with the figure of total schools in the State as givenin Table 4. This is because of the possibility of a school adopting more than one medium of instruction.
Note: - Others = Tamil + Telugu + Marathi + Hindi
Table 13
Distribution of Schools By Type( Boys/Girls/Co-Education)
Sl No. Type of School Total Schools Boys only Girls only Co-Education
1 Lower Primary Schools 26302 43 71 26188
2 Upper Primary Schools 33126 535 772 31819
3 Secondary Schools 13447 197 667 12583
Total 72875 775 1510 70590
Source: DISE 2010-11
96.86 percent of schools in the State practice co-education. Single sex schools are hardly 3.14 percent inproportion of which 2.07 percent are girls - only schools. This practice of co-education is popular in both rural andurban areas.
Graph-6

11
ENROLMENTS IN THE STATETotal Enrolments, Gross Enrolment Ratios, Net Enrolment Ratios, Number and proportion of children who leave the
school mid-way, Repetition Rate, and Enrolments by sex, Social category, School grades, Transition Rates, CompletionRates are the prominent indexes of Enrolments. Some of them are measured against school-age population. It is notedthat total enrolments in 1 to 10 standards in the State, during 2010-11, continues to be above the 10 million mark.
Table 14
Enrolment by CategoryGroup Total Enrolments 1st to 10th Enrolments in
percentagesBoys Girls Total Boys Girls Total
Scheduled Castes 971144 893776 1864920 18.71 18.47 18.59 Scheduled Tribes 405932 374103 780035 7.82 7.73 7.78 Other Backward Castes 1955020 1833134 3788154 37.67 37.88 37.77 General 1029179 915662 1944841 19.83 18.92 19.39 Muslims (Separately) 722661 724292 1446953 13.92 14.97 14.43 Other Minority (Separately) 105878 98588 204466 2.04 2.04 2.04Total 5189814 4839555 10029369 100.00 100.00 100.00Source: DISE 2010-11
1) Categories included in other backwards castes are: OBC, Category 1. Percentages of enrolment ofScheduled Caste and Scheduled Tribe children out of a total enrolment of all children in 1 to 10 Standardsduring 2009-10 are 18.84 and 7.68 respectively.
2) Except in case of Muslims, OBCs and other Minorities proportion of boys in 1 to 10 classes out of total boysin 1 to 10 classes is higher than that of girls.
Management - Wise / Standard - Wise / Social Category Wise / Sex - Wise / Enrolment of students are given inAnnexure numbers 4 A-H, 5 A-B and 6 A-B.
Table 15
Enrolment and Class wise Percentage to total EnrolmentSl. No. Class Enrolment in Lakhs Percentage to the Total Enrolment
Boys Girls Total1 1st Std. 5.82 5.38 11.19 11.162 2nd Std. 5.47 5.09 10.56 10.533 3rd Std. 5.50 5.16 10.66 10.634 4th Std. 5.63 5.27 10.89 10.865 5th Std. 5.60 5.24 1084 10.817 6th Std. 5.37 5.05 10.42 10.398 7th Std. 5.01 4.67 9.68 9.659 8th Std. 4.99 4.58 9.57 9.5410 9th Std. 4.51 4.14 8.65 8.6211 10th Std. 4.01 3.82 7.83 7.8112 1th to 5th Std. 28.02 26.13 54.15 53.9913 6th to 7th Std. 10.38 9.73 20.11 20.0514 6th to 8th Std. 15.37 14.31 29.67 29.5915 1th to 7th Std. 38.39 3586 74.25 74.0316 1th to 8th Std. 43.38 40.44 83.82 83.5717 8th to 10th Std. 13.51 12.54 26.04 25.9718 1st to 10th Std. 51.90 48.40 100.29 100.00
Source : DISE 2010-11

12
There are 100.29 lakhs children in 1st to 10th standards in the State. Of this total, 54.15 lakhs children are in 1stto 5th standards, 20.10 lakhs children are in 6th to 7th standards and 26.04 lakhs children are in 8th, 9th and 10thstandards of the high school section.
It may be observed from Graph 8 that the heights of the individual bars in the bar graph are comparable from 1st to5th standards. There is a marginal fall at 6th standard and 8th standards. The fall is clearly perceptible from 8th to 9thand 9th to 10th standards. Perhaps the complete success at LPS stage up-gradation of a large number of 1 to 7 HPS to1 to 8 HPS has arrested the fall at 6th and 8th standards. The fall at the secondary stage needs better attention. Perhapsthe Rashtriya Madhyamika Shiksha Abhiyan may address this problem.
Table 16
Distribution of Enrolment by Medium of Instruction
Sl. Category Kannada English Urdu Tamil Telugu Marathi Hindi Others TotalNo.
1 Lower Primary 3945293 15104 322480 3475 5147 98938 471 249 4391157
2 Upper Primary 1635423 1232795 121640 5501 2969 21871 5622 8145 3033966
3 Secondary 1850642 598870 92313 361 2915 52049 5359 1737 2604246
Total 7,431,358 1,846,769 536,433 9,337 11,031 172,858 11,452 10,131 10,029,369
Source: DISE 2010-11
Level Wise Enrolment in Lakhs
1st to 5th6th to 8th
1st to 7th1st to 8th
Graph-7
Graph-8

13
Table 16A
Percentage of Distribution of Enrolment by Medium of Instruction
Sl. Category Kannada English Urdu Tamil Telugu Marathi Hindi Others TotalNo.
1 Lower Primary 89.85 0.34 7.34 0.08 0.12 2.25 0.01 0.01 100.00
2 Upper Primary 53.90 40.63 4.01 0.18 0.10 0.72 0.19 0.27 100.00
3 Secondary 71.06 23.00 3.54 0.01 0.11 2.00 0.21 0.07 100.00
Total 74.10 18.41 5.35 0.09 0.11 1.72 0.11 0.10 100.00
Source: DISE 2010-11
Table 12 A & 16A reveals that in 12.62 percent of schools, 18.41 percent of children are studying through theEnglish Medium. As per population census, proportion of people whose mother tongue is English is far below thispercentage. Hence it is understood that either children whose mother-tongue is not Kannada and at the same timefacility for schooling in their mother-tongue is not available at their place of stay or others who do not prefer to pursue theirstudies in their mother tongue may opt for English as Medium of Instruction.
There is an insignificant decline of children from other media of Instruction also in favour of English MediumSchools. English medium schools have gone up from 11.09 percent in 2009-10 to 12.61 percent in 2010-11 (Total 77501schools by Medium). At the same time, there is no notable decrease in Kannada medium schools.
Graph-9
Graph-10

14
Table 17
District - Wise Enrolment of Children at different levels of SchoolingSl. . District Class 1 to 5 Class 1 to 7 Class 1 to 8 Class 8 to 10 Class 1 to 10No
1 BAGALKOT 202167 3.73 269692 3.63 299896 3.58 82017 3.15 351709 3.51
2 BANGALORE RURAL 71857 1.33 101606 1.37 116055 1.38 40865 1.57 142471 1.42
3 BANGALORE U NORTH 286820 5.30 395065 5.32 447615 5.34 146093 5.61 541158 5.40
4 BANGALORE U SOUTH 403949 7.46 548863 7.39 619910 7.40 193196 7.42 742059 7.40
5 BELGAUM 193130 3.57 267653 3.60 304462 3.63 101046 3.88 368699 3.68
6 BELGAUM CHIKKODI 249330 4.60 340945 4.59 385715 4.60 120114 4.61 461059 4.60
7 BELLARY 242588 4.48 322658 4.35 358113 4.27 90893 3.49 413551 4.12
8 BIDAR 230434 4.26 307631 4.14 338653 4.04 80395 3.09 388026 3.87
9 BIJAPUR 283638 5.24 372466 5.02 409009 4.88 98808 3.79 471274 4.70
10 CHAMARAJANAGARA 72909 1.35 102094 1.37 116864 1.39 40308 1.55 142402 1.42
11 CHIKKABALLAPURA 99295 1.83 139076 1.87 159274 1.90 55288 2.12 194364 1.94
12 CHIKKAMANGALORE 83670 1.55 120170 1.62 139509 1.66 52717 2.02 172887 1.72
13 CHITRADURGA 140102 2.59 198346 2.67 225921 2.70 76368 2.93 274714 2.74
14 DAKSHINA KANNADA 164781 3.04 235570 3.17 273555 3.26 104294 4.00 339864 3.39
15 DAVANAGERE 180030 3.32 248572 3.35 281348 3.36 88716 3.41 337288 3.36
16 DHARWAD 178716 3.30 247905 3.34 281084 3.35 89214 3.43 337119 3.36
17 GADAG 100527 1.86 138158 1.86 155904 1.86 48048 1.84 186206 1.86
18 GULBARGA 298943 5.52 395746 5.33 435052 5.19 105165 4.04 500911 4.99
19 HASSAN 125908 2.33 180110 2.43 208495 2.49 78821 3.03 258931 2.58
20 HAVERI 147023 2.72 203132 2.74 229984 2.74 70363 2.70 273495 2.73
21 KODAGU 45258 0.84 64421 0.87 74307 0.89 27287 1.05 91708 0.91
22 KOLAR 127588 2.36 178210 2.40 203532 2.43 69886 2.68 248096 2.47
23 KOPPAL 153319 2.83 204933 2.76 226700 2.70 55341 2.13 260274 2.60
24 MANDYA 127883 2.36 180280 2.43 207751 2.48 78311 3.01 258591 2.58
25 MYSORE 232904 4.30 329421 4.44 377328 4.50 132866 5.10 462287 4.61
26 RAICHUR 214183 3.96 278466 3.75 303344 3.62 65284 2.51 343750 3.43
27 RAMANAGARA 77426 1.43 109392 1.47 125529 1.50 46163 1.77 155555 1.55
28 SHIMOGA 148232 2.74 208907 2.81 240338 2.87 84480 3.24 293387 2.93
29 TUMKUR 122428 2.26 175898 2.37 203820 2.43 80933 3.11 256831 2.56
30 TUMKUR MADHUGIRI 76050 1.40 107776 1.45 124493 1.49 47986 1.84 155762 1.55
31 UDUPI 80721 1.49 115989 1.56 134795 1.61 54092 2.08 170081 1.70
32 UTTARA KANNADA 53979 1.00 76949 1.04 89414 1.07 34017 1.31 110966 1.11
33 UTTARA KANNADA SIRSI 60859 1.12 86240 1.16 98337 1.17 31332 1.20 117572 1.17
34 YADAGIRI 137927 2.55 172783 2.33 185912 2.22 33539 1.29 206322 2.06
Total 5414574 100.00 7425123 100.00 8382018 100.00 2604246 100.00 10029369 100.00
Source: DISE 2010-11
Note :- Children as a proportion to State total goes on decreasing in certain districts such as Yadgir, Bidar,Koppal, Raichur, Gulbarga, Bijapur, Bellary and Bagalkot. In certain other districts viz : Dakshina Kannada,Davanagere, Bangalore Rural, Shimoga and Uttara Kannada, enrolments as a proportion to State total, go onincreasing at higher stages. There are 20 districts in this category.
Enr
olm
ent
% to
Sta
teTo
tal
Enr
olm
ent
% to
Sta
teTo
tal
Enr
olm
ent
% to
Sta
teTo
tal
Enr
olm
ent
% to
Sta
teTo
tal
Enr
olm
ent
% to
Sta
teTo
tal

15
Table 18
District-wise Enrolment of children at different levels of Schooling - 2010-11
(In Descending Order)
1 BANGALORE SOUTH 7.46 1 BANGALORE SOUTH 7.39 1 BANGALORE SOUTH 7.40 1 BANGALORE SOUTH 7.42 1 BANGALORE SOUTH 7.40
2 GULBARGA 5.52 2 GULBARGA 5.33 2 BANGALORE NORTH 5.34 2 BANGALORE NORTH 5.61 2 BANGALORE NORTH 5.40
3 BANGALORE NORTH 5.30 3 BANGALORE NORTH 5.32 3 GULBARGA 5.19 3 MYSORE 5.10 3 GULBARGA 4.99
4 BIJAPUR 5.24 4 BIJAPUR 5.02 4 BIJAPUR 4.88 4 CHIKKODI 4.61 4 BIJAPUR 4.70
5 CHIKKODI 4.60 5 CHIKKODI 4.59 5 CHIKKODI 4.60 5 GULBARGA 4.04 5 MYSORE 4.61
6 BELLARY 4.48 6 MYSORE 4.44 6 MYSORE 4.50 6 DAKSHINA KANNADA 4.00 6 CHIKKODI 4.60
7 MYSORE 4.30 7 BELLARY 4.35 7 BELLARY 4.27 7 BELGAUM 3.88 7 BELLARY 4.12
8 BIDAR 4.26 8 BIDAR 4.14 8 BIDAR 4.04 8 BIJAPUR 3.79 8 BIDAR 3.87
9 RAICHUR 3.96 9 RAICHUR 3.75 9 BELGAUM 3.63 9 BELLARY 3.49 9 BELGAUM 3.68
10 BAGALKOT 3.73 10 BAGALKOT 3.63 10 RAICHUR 3.62 10 DHARWAD 3.43 10 BAGALKOT 3.51
11 BELGAUM 3.57 11 BELGAUM 3.60 11 BAGALKOT 3.58 11 DAVANAGERE 3.41 11 RAICHUR 3.43
12 DAVANAGERE 3.32 12 DAVANAGERE 3.35 12 DAVANAGERE 3.36 12 SHIMOGA 3.24 12 DAKSHINA KANNADA 3.39
13 DHARWAD 3.30 13 DHARWAD 3.34 13 DHARWAD 3.35 13 BAGALKOT 3.15 13 DAVANAGERE 3.36
14 DAKSHINA KANNADA 3.04 14 DAKSHINA KANNADA 3.17 14 DAKSHINA KANNADA 3.26 14 TUMKUR 3.11 14 DHARWAD 3.36
15 KOPPAL 2.83 15 SHIMOGA 2.81 15 SHIMOGA 2.87 15 BIDAR 3.09 15 SHIMOGA 2.93
16 SHIMOGA 2.74 16 KOPPAL 2.76 16 HAVERI 2.74 16 HASSAN 3.03 16 CHITRADURGA 2.74
17 HAVERI 2.72 17 HAVERI 2.74 17 KOPPAL 2.70 17 MANDYA 3.01 17 HAVERI 2.73
18 CHITRADURGA 2.59 18 CHITRADURGA 2.67 18 CHITRADURGA 2.70 18 CHITRADURGA 2.93 18 KOPPAL 2.60
19 YADAGIRI 2.55 19 MANDYA 2.43 19 HASSAN 2.49 19 HAVERI 2.70 19 HASSAN 2.58
20 MANDYA 2.36 20 HASSAN 2.43 20 MANDYA 2.48 20 KOLAR 2.68 20 MANDYA 2.58
21 KOLAR 2.36 21 KOLAR 2.40 21 TUMKUR 2.43 21 RAICHUR 2.51 21 TUMKUR 2.56
22 HASSAN 2.33 22 TUMKUR 2.37 22 KOLAR 2.43 22 KOPPAL 2.13 22 KOLAR 2.47
23 TUMKUR 2.26 23 YADAGIRI 2.33 23 YADAGIRI 2.22 23 CHIKKABALLAPURA 2.12 23 YADAGIRI 2.06
24 GADAG 1.86 24 CHIKKABALLAPURA 1.87 24 CHIKKABALLAPURA 1.90 24 UDUPI 2.08 24 CHIKKABALLAPURA 1.94
25 CHIKKABALLAPURA 1.83 25 GADAG 1.86 25 GADAG 1.86 25 CHIKKAMANGALORE 2.02 25 GADAG 1.86
26 CHIKKAMANGALORE 1.55 26 CHIKKAMANGALORE 1.62 26 CHIKKAMANGALORE 1.66 26 GADAG 1.84 26 CHIKKAMANGALORE 1.72
27 UDUPI 1.49 27 UDUPI 1.56 27 UDUPI 1.61 27 MADHUGIRI 1.84 27 UDUPI 1.70
28 RAMANAGARA 1.43 28 RAMANAGARA 1.47 28 RAMANAGARA 1.50 28 RAMANAGARA 1.77 28 MADHUGIRI 1.55
29 MADHUGIRI 1.40 29 MADHUGIRI 1.45 29 MADHUGIRI 1.49 29 BANGALORE RURAL 1.57 29 RAMANAGARA 1.55
30 CHAMARAJANAGARA 1.35 30 CHAMARAJANAGARA 1.37 30 CHAMARAJANAGARA 1.39 30 CHAMARAJANAGARA 1.55 30 BANGALORE RURAL 1.42
31 BANGALORE RURAL 1.33 31 BANGALORE RURAL 1.37 31 BANGALORE RURAL 1.38 31 UTTARA KANNADA 1.31 31 CHAMARAJANAGARA 1.42
32 SIRSI 1.12 32 SIRSI 1.16 32 SIRSI 1.17 32 YADAGIRI 1.29 32 SIRSI 1.17
33 UTTARA KANNADA 1.00 33 UTTARA KANNADA 1.04 33 UTTARA KANNADA 1.07 33 SIRSI 1.20 33 UTTARA KANNADA 1.11
34 KODAGU 0.84 34 KODAGU 0.87 34 KODAGU 0.89 34 KODAGU 1.05 34 KODAGU 0.91
Total 100 Total 100 Total 100 Total 100 Total 100
SlNo.
District%
1st
to
5th
SlNo.
District
% 1
st t
o 7t
h
SlNo.
District
% 1
st t
o 8t
h
SlNo.
District
%
8th
to 1
0th
%
(1st
to
10th
)
SlNo.
Notes:-
1) There are 08 out of 34 educational districts in the State which belong to North Eastern Karnataka and identifiedas backward districts. 29.74 percent of enrolments in the State are in these 08 districts.
2) Percentage share of districts is comparable across districts for 1 to 5 and 1 to 7 enrolments. When 1 to 8enrolments and 1 to 10 enrolments are considered, the relative positions of districts receive a juggling.Enrolments at 8th standard and beyond that stage make a difference.

16
Table 18A
Drop-out Rates in STATE, 2010-11
Category Lower Primary Higher Primary ( In %ages)
All Children 2.09 5.47
Boys (All) 2.03 5.34
Girls (All) 2.15 5.60
SC (All) 4.05 8.79
SC (Boys) 3.22 8.52
SC (Girls) 4.94 9.08
ST (All) 1.95 7.06
ST (Boys) 1.95 6.21
ST (Girls) 1.95 8.01
Drop-out rates in the State have nose-dived to 2.09 percent at LPS stage. That is, taking first standardadmissions of 2006-07, 2007-08, 2008-09, 2009-10 and 2010-11, taking a sum of I standard admissions for all thesefive years and taking out (difference) 1 to 5 admissions in 2010-11, we get a figure which is 2.09 percent of admissionsof standard I of 05 years. Drop-out rates at LPS of ST children is very much lower than State average while that of SCsis slightly higher. STs are focused social groups in terms of their location while SCs are part of general population.Highest drop-out rate is the system is among SC girls, which is also marginal in magnitude. This should be broughtdown to zero, in a year or two, which is possible.
Drop-out rate at HPS stage in considerable, at 5.47 percent. Compared to previous years it is low and falling.Trend is positive while concern is deep. Drop-out rates among SC Boys and Girls as well as ST Girls have crossed 08percent.

17
Table 19
Transition Rates of SC, ST and OBC in the State 2009-10 5th to 2010-11 6th(All Management)
Note:-
1. Transition loss is higher than 10 percent in 05 districts of the State. It is so in case of girls in 08 districts.
2. Negative signs are due to marginal volume of inter-district migration of children.
Boys Grils Total 1 BAGALKOT 97.96 91.90 92.49 96.82 80.78 78.26 93.40 93.38 93.392 BANGALORE RURAL 84.14 95.21 102.60 99.00 80.63 162.33 94.89 95.49 95.183 BANGALORE U NORTH 83.82 99.96 115.72 205.66 90.99 100.85 100.77 99.37 100.084 BANGALORE U SOUTH 123.19 87.77 91.35 100.69 74.15 66.99 103.02 101.30 102.175 BELGAUM 106.09 96.88 90.00 77.85 104.75 97.12 97.54 99.96 98.716 BELGAUM CHIKKODI 89.73 94.27 79.26 98.25 95.28 103.10 93.92 94.55 94.227 BELLARY 93.88 82.84 91.93 86.14 86.48 146.71 87.98 88.57 88.268 BIDAR 81.75 91.69 104.64 105.72 95.03 47.33 94.38 93.52 93.969 BIJAPUR 49.59 84.22 102.00 92.99 93.25 123.59 87.24 88.58 87.88
10 CHAMARAJANAGARA 74.38 93.80 95.10 96.81 87.65 73.98 93.73 93.94 93.8311 CHIKKABALLAPURA 71.74 96.68 98.15 92.52 96.71 175.81 93.31 94.45 93.8712 CHIKKAMANGALORE 73.68 97.32 102.85. 109.53 100.59 104.98 101.26 100.82 101.0413 CHITRADURGA 50.17 97.39 98.54 109.48 92.62 43.01 98.18 98.45 98.3114 DAKSHINA Kr,\NNADA 92.17 101.56 108.87 101.32 99.58 99.53 100.54 100.14 100.3515 DAVANAGERE 56.93 96.73 99.03 146.51 97.24 50.38 97.51 95.65 96.6116 DHARWAD 94.38 103.18 107.70 105.90 96.30 112.58 99.94 101.12 100.5217 GADAG 45.85 89.91 95.05 112.41 92.28 87.61 91.90 93.57 92.7118 GULBARGA 65.16 84.95 96.47 116.59 85.84 40.44 93.24 92.15 92.7119 HASSAN 84.80 97.22 97.56 98.50 91.72 46.33 95.77 96.04 95.9020 HAVERI 52.65 95.80 101.14 109.92 91.85 154.36 96.09 97.02 96.5421 KODAGU 106.42 97.55 85.71 99.91 96.94 88.92 98.85 97.14 98.0022 KOLAR 77.32 94.53 101.18 99.6O 87.82 100.41 94.08 95.14 94.60,23 KOPPAL 71.82 90.94 100.26 100.08 88.09 40.50 94.70 93.01 93.8824 MANDYA 67.53 100.02 102.04 103.36 100.43 56.46 99.35 99.49 99.42·25 'MYSORE 95.26 98.71 97.24 104.90 78.38 113.16 98.13 99.39 98.7526 RAICHUR 88.85 91.30 89.61 117.30 95.49 131.75 98.28 99.36 98.7927 RAMANAGARA 68.25 93.19 95.45 103.10 93.75 72.04 97.63 97.78 97.7028 SH/MOGA 72.17 100.60 97.64 113.31 106.58 101.21 99.07 97.59 98.3529 TUMKUR 79.74 99.54 104.90 102.74 93.83 100.00 99.56 97.38 98.5130 TUMKUR MADHUGIRI 72.93 92.36 101.30 104.36 89.68 11.76 95.53 95.28 95.4131 UDUPI 91.13 97.30 99.21 101.59 99.24 95.23 99.94 99.05 99.5132 UTTARA KANNADA 78.56 95.09 95.44 106.12 98.16 99.86 99.44 97.68 98.5934 YADAG/RI 73.44 81.42 81.43 91.79 88.55 20.36 87.04 83.40 85.39
Total 88.09 92.93 96.30 104.14 91.57 89.22 96.20 96.09 96.15
SINo General (ALL)
SC (ALL)
ST (ALL)
Enrolment during 2010-11 Total District OBC
(ALL)Muslims (ALL)
Other Minority

18
Note:-
1. Transition loss is higher than 10 percent in 05 districts of the State. It is so in case of girls in 08 districts.
2. Negative signs are due to marginal volume of inter-district migration of children.
Table 19A
TRANSITION LOSS of Children from 7th standard 2009-10 to 8th Standard in 2010-11.
1 YADAGIRI 15,587 13,129 2,458 15.77 1 BIJAPUR 19,994 16,597 3,397 16.99
2 BIJAPUR 42,699 36,543 6,156 14.42 2 YADAGIRI 6,670 5,540 1,130 16.94
3 BIDAR 36,176 31,022 5,154 14.25 3 BELLARY 19,019 16,224 2,795 14.70
4 BELLARY 40,839 35,455 5,384 13.18 4 KOPPAL 11,584 9,971 1,613 13.92
5 KOPPAL 24,756 21,767 2,989 12.07 5 BAGALKOT 15,902 13,999 1,903 11.97
6 GULBARGA 43,467 39,306 4,161 9.57 6 GULBARGA 20,962 18,673 2,289 10.92
7 DAVANAGERE 36,228 32,776 3,452 9.53 7 BIDAR 17,561 15,693 1,868 10.64
8 GADAG 19,605 17,746 1,859 9.48 8 DAVANAGERE 17,598 15,744 1,854 10.54
9 BAGALKOT 33,110 30,204 2,906 8.78 9 GADAG 9,385 8,496 889 9.47
10 RAICHUR 27,082 24,878 2,204 8.14 10 BELGAUM CHIKKODI 23,214 21,034 2,180 9.39
11 BELGAUM CHIKKODI 48,721 44,770 3,951 8.11 11 CHITRADURGA 14,347 13,181 1,166 8.13
12 BANGALORE RURAL 15,680 14,449 1,231 7.85 12 BANGALORE RURAL 7,497 6,948 549 7.32
13 CHITRADURGA 29,626 27,575 2,051 6.92 13 RAICHUR 12,423 11,526 897 7.22
14 HAVERI 28,211 26,852 1,359 4.82 14 BELGAUM 18,611 17,403 1,208 6.49
15 BELGAUM 38,498 36,809 1,689 4.39 15 CHAMARAJANAGARA 7,514 7,081 433 5.76
16 CHAMARAJANAGARA 15,368 14,770 598 3.89 16 HAVERI 13,859 13,153 706 5.09
17 CHIKKABALLAPURA 20,992 20,198 794 3.78 17 KOLAR 13,070 12,433 637 4.87
18 KOLAR 26,300 25,322 978 3.72 18 RAMANAGARA 8,181 7,820 361 4.41
19 RAMANAGARA 16,642 16,137 505 3.03 19 MYSORE 24,472 23,421 1,051 4.29
20 MYSORE 49,321 47,907 1,414 2.87 20 UTTARA KANNADA 12,007 11,598 409 3.41
21 MANDYA 28,212 27,471 741 2.63 21 CHIKKABALLAPURA 10,148 9,803 345 3.40
22 TUMKUR MADHUGIRI 17,012 16,717 295 1.73 22 MANDYA 13,603 13,274 329 2.42
23 UTTARA KANNADA 24,664 24,562 102 0.41 23 TUMKUR MADHUGIRI 8,242 8,140 102 1.24
24 TUMKUR 27,858 27,922 -64 -0.23 24 TUMKUR 13,073 12,913 160 1.22
25 HASSAN 28,060 28,385 -325 -1.16 25 KODAGU 4,751 4,756 -5 -0.11
26 SHIMOGA 31,041 31,431 -390 -1.26 26 HASSAN 13,861 13,878 -17 -0.12
27 DHARWAD 32,754 33,179 -425 -1.30 27 BANGALORE U NORTH 25,874 25,950 -76 -0.29
28 BANGALORE U NORTH 51,764 52,550 -786 -1.52 28 DHARWAD 15,934 16,038 -104 -0.65
29 UDUPI 18,359 18,806 -447 -2.43 29 UDUPI 8,949 9,070 -121 -1.35
30 KODAGU 9,644 9,886 -242 -2.51 30 DAKSHINA KANNADA 17,457 17,800 -343 -1.96
31 DAKSHINA KANNADA 36,431 37,985 -1,554 -4.27 31 SHIMOGA 15,066 15,395 -329 -2.18
32 CHIKKAMANGALORE 18,331 19,339 -1,008 -5.50 32 CHIKKAMANGALORE 8,955 9,352 -397 -4.43
33 BANGALORE U SOUTH 66,134 71,047 -4,913 -7.43 33 BANGALORE U SOUTH 33,018 34,864 -1,846 -5.59
Total 999,172 956,895 42,277 4.23 Total 482,801 457,768 25,033 5.18
Sl.No. District
All Children Girls Children
Enrolmentin Class
7th During2009-10
Enrolmentin Class
8th During2010-11
Decreasein
Enrolment
Lassin %
Sl.No. District
Enrolmentin Class
7th During2009-10
Enrolmentin Class
8th During2010-11
Decreasein
Enrolment
Lass
in %

19
Table 20
District - Wise Gender Parity in Enrolments, 1 to 5 and 6 to 8 Standards
When the enrolment of boys in 1st to 5th standards is compared with that of girls to examine Gender Parity, a ratioof 0.93 gets on surface. Likewise, this ratio, again, works out to be 0.93 for 6th to 8th standards. It is clear that the indexof gender parity is more than 0.90. This is a welcome development, as compared with national level update. TheDepartment is on the right path in reducing sex-wise disparities in enrolments, though there is a need for intensifyingthe efforts in future and arriving at a figure of unity after netting out sex-ratio effects in 6-14 age population.
Govt. + Aided
UnaidedTotal In
Desc.orderGovt. + Aided
UnaidedTotal In
Desc.order1 DHARWAD 1.03 0.81 0.96 1 BIDAR 1.05 0.76 0.972 HASSAN 1.00 0.86 0.96 2 CHIKKABALLAPURA 1.04 0.79 0.973 HAVERI 1.01 0.77 0.96 3 KOLAR 1.08 0.74 0.974 KODAGU 1.00 0.89 0.96 4 BANGALORE U SOUTH 1.09 0.90 0.965 MYSORE 1.04 0.84 0.96 5 CHIKKAMANGALORE 1.00 0.79 0.966 BANGALORE RURAL 1.04 0.82 0.95 6 DHARWAD 1.02 0.77 0.967 KOLAR 1.08 0.77 0.95 7 HASSAN 1.00 0.82 0.968 SHIMOGA 1.00 0.87 0.95 8 HAVERI 0.99 0.74 0.969 UDUPI 0.96 0.92 0.95 9 KODAGU 1.01 0.87 0.9610 BANGALORE U SOUTH 1.05 0.90 0.94 10 MYSORE 1.04 0.80 0.9611 CHAMARAJANAGARA 0.99 0.78 0.94 11 BANGALORE RURAL 1.03 0.80 0.9512 CHIKKABALLAPURA 1.03 0.79 0.94 12 CHAMARAJANAGARA 0.98 0.81 0.9513 CHIKKAMANGALORE 0.99 0.84 0.94 13 RAMANAGARA 0.98 0.85 0.9514 CHITRADURGA 0.99 0.77 0.94 14 CHITRADURGA 0.97 0.73 0.9415 DAKSHINA KANNADA 0.96 0.91 0.94 15 MANDYA 0.99 0.76 0.9416 GADAG 0.99 0.80 0.94 16 SHIMOGA 0.99 0.82 0.9417 RAMANAGARA 1.00 0.81 0.94 17 DAVANAGERE 0.99 0.75 0.9318 UTTARA KANNADA 0.96 0.85 0.94 18 GADAG 0.97 0.71 0.9319 BELLARY 1.02 0.73 0.93 19 UDUPI 0.95 0.86 0.9320 BIDAR 1.03 0.73 0.93 20 BELGAUM 0.97 0.68 0.9221 DAVANAGERE 1.00 0.79 0.93 21 DAKSHINA KANNADA 0.93 0.87 0.9222 KOPPAL 0.98 0.77 0.93 22 GULBARGA 0.99 0.72 0.9223 TUMKUR 0.98 0.80 0.93 23 UTTARA KANNADA 0.94 0.80 0.9224 BAGALKOT 1.01 0.69 0.92 24 BAGALKOT 0.96 0.68 0.9125 GULBARGA 0.99 0.72 0.92 25 TUMKUR 0.93 0.79 0.9026 MANDYA 0.99 0.79 0.92 26 BELLARY 0.94 0.72 0.8927 RAICHUR 0.99 0.70 0.92 27 BIJAPUR 0.93 0.69 0.8928 BELGAUM 1.01 0.69 0.91 28 KOPPAL 0.91 0.73 0.8929 BIJAPUR 0.96 0.70 0.90 29 RAICHUR 0.92 0.72 0.8830 YADAGIRI 0.92 0.64 0.88 30 YADAGIRI 0.78 0.66 0.76
Total 1.00 0.81 0.93 Total 0.98 0.80 0.93
DistrictSl
No.Sl
No.District
HPSLPS

20
Table 21
Distribution of SC / ST Students in Schools of the State by Managements (In Lakhs)
Enrolments of SC/ST at Elementary Stage :- There are 54.16 lakh children who are studying in the lower primary stage of 1st to 5th standards. This stage
included enrolments in 1st to 5th standards in 1st to 5th lower primary and 1st to 7th or 1st to 8th higherprimary schools as well as 1st to 10th high schools or 1st to 12th higher primary schools [see TABLE 21].
Like-wise, there are 20.09 lakh children in 6th & 7th standards, in the State. They may bedistributed in HPS/ HS or HSc schools.
It may be observed from Table 21 that there are 20.10 lakh children from the SC / ST categories among 74.25lakh children in 1st to 7th standards in the State. Of them, 14.16 lakh are SC while 5.94 lakh are ST students.That is, the proportion of SC / ST children in 1st to 7th standards in the State is 26.04 percent.
20.10 lakh children from SC / ST categories are in 1st to 7th standards in the system of schooling in the State.An analysis of location of these 20.10 lakh children in the schools of the State by management reveals that73.73 percent of SCs and 76.09 percent of STs in 1st to 7th standards are in schools run by the Departmentof Public Instruction. Proportion of SC / ST students in State and State supported schools that are schools runby Education Dept, by Department of Social Welfare, Local Self Government Institutions and Private AidedInstitutions is 85.17 percent.
SC / ST proportion in un-aided schools of the State at 1st to 7th standards is quite low as they cannot affordto pay fees charged by such institutions. Their total proportion is just 14.83 percent.
Enrolments of SC / ST at High Schools Stage :- There are 26.04 lakh children (Table 21) in 8th, 9th & 10th standards in the State. 3.98 lakh SCs and 1.86 lakh
STs are out of this total constituting 5.84 lakh children or 22.43 percent.
Analysis of distribution of SCs and STs in high school stage by management reveals that 53.77 percent ofSCs and 52.15 percent of STs are in high schools belonging to the Department of Education.
Class 1-5 SC 7.76 74.26 0.07 0.69 0.95 9.07 1.64 15.69 0.03 0.30 10.46 100.00
ST 3.34 76.17 0.07 1.48 0.26 5.91 0.71 16.09 0.01 0.34 4.38 100.00
Class 6-7 SC 2.68 72.42 0.15 3.94 0.41 11.00 0.45 12.13 0.02 0.51 3.70 100.00
ST 1.18 75.85 0.06 3.82 0.12 7.65 0.19 11.92 0.01 0.76 1.56 100.00
Class 1-7 SC 10.45 73.78 0.22 1.54 1.36 9.57 2.09 14.76 0.05 0.35 14.16 100.00
ST 4.52 76.09 0.12 2.10 0.38 6.37 0.89 15.00 0.03 0.45 5.94 100.00
Class 8-10 SC 2.14 47.57 0.16 3.64 1.51 33.71 0.65 14.57 0.02 0.52 4.49 100.00
ST 0.97 52.24 0.04 2.40 0.57 30.49 0.26 13.97 0.02 0.90 1.86 100.00
Total(1 to 10) SC 12.58 67.47 0.38 2.05 2.87 15.39 2.74 14.71 0.07 0.39 18.65 100.00
ST 5.49 70.41 0.17 2.17 0.95 12.12 1.15 14.75 0.04 0.56 7.80 100.00
Source : DISE 2010-11
LevelsC
ateg
ory Education
Dept SW + LSG Pvt. Aided Pvt. Un-Aided Others Total
No. % No. % No. % No. % No. % No. %

21
Table 22
ENROLMENTS by MANAGEMENT
Classes 1 to 5 Total 5414574 3171239 473967 1723322 20725
All Others 4466901 2912985 399632 1124856 18344
% Total 82.50 91.86 84.32 65.27 88.51
Classes 6 to 7 Total 2010549 1219918 221335 513682 41890
All Others 1,656,549 1,108,887 181,675 319,427 39427
% Total 82.39 90.90 82.08 62.18 94.12
Classes 1 to 7 Total 7425123 4391157 695302 2237004 62615
All Others 6,123,450 4,021,872 639,456 1,444,283 57771
% Total 82.47 91.59 91.97 64.56 92.26
Classes 8 to 10 Total 2604246 1062568 834356 639663 50042
All Others 1,961,078 899,436 626,524 383,350 42198
% Total 75.30 84.65 75.09 59.93 84.33
Total 10029369 5453725 1529658 2876667 112657
All Others 8,084,528 4,921,308 1,265,980 1,827,633 99,969
% Total 80.61 90.24 82.76 63.53 88.74
Notes:- All others include SC / ST / OBC / Muslims / Other Minority; that is except General Category students.
'Others' in Management includes Social Welfare + Local Bodies+ Others.
Nearly 4 out of every 5 students in school education in the State, at the lower and higher primary stageswho belong to SC/ST/OBC and Minorities Categories, are in schools across all managements. Out of themnearly 18 percent are in un-aided schools rest of the 62 percent is in Govt. and Govt. supported schools.However this proportion is reduced at the High School stage.
Stages CategoriesAll Manage-
mentsDepartment of
Education Aided Unaided Others
Classes 1 to 10

22
INFRASTRUCTURE FACILITIES
The Sarva Shiksha Abhiyan accorded special significance and weightage for the provision of infrastructurefacilities to schools. School buildings, additional classrooms, maintenance and repairs of school buildings areincluded herein. There is recognition of 8 facilities as Basic Facilities for schools comprising of Common Toilets, Girls'Toilets, Electricity, Play Ground, Ramps, Library, Compound and Drinking water. A review of progress of schooling inthe light of provision of infrastructure facilities to schools reveals that there has been notable improvements inenrolments of children, enrolment ratios, retention rates, student - classroom ratios, teacher-pupil ratios, transitionrates and gender parity in enrolments.
An update on provision of infrastructure facilities in the State is provided in this section.
School Buildings45677 out of a total of 59428 elementary schools in the State belong to the Department of Education. 97.52
percent of schools of the Department possess / own the buildings. Rent need not be paid to 0.80 percent of schoolsowned by the Department. Another 0.70 percent of schools are run in rented buildings. 0.44 percent of schools arerun without any building facility. In 0.20 percent schools, the buildings are in dilapidated condition. Buildings are underconstruction in 0.03 percent cases (11 schools) while in 0.31 percent cases the schools are running in privatebuildings.
Table 23
Classification of Elementary Schools by type of ownership of buildings - EducationDepartment Schools only
Category Govt. Rented Rent NoBuilding Free Building Others Total
ElementarySchools 44545 319 364 202 247 45677
Percentageto to TotalSchools 97.52 0.70 0.80 0.44 0.54 100.00
Source : DISE 2010-11
Graph-11 (for Table 23)
Classification of Elementary Schools by type of ownership of buildings, 2010-11.

23
Table 24
Classification of Secondary Schools by type of ownership of buildings - EducationDepartment Schools only
Category Govt. Rented Rent NoBuilding Free Building Others Total
Secondary Schools 3547 19 398 121 193 4278
Percentage to to TotalSchools 82.91 0.44 9.30 2.83 4.51 100.00
Source : DISE 2010-11
Graph 12 (for Table 24)
Classification of Secondary Schools by type of ownership of buildings.
The Department of Education runs 4278 high schools. 121 (2.83%) schools in this set do not have a building oftheir own. 3547 (82.91%) of schools possess the building while 19 (0.44%) percent of high schools are run in rentedbuildings.398 (9.30%) percent of schools do not need to pay rent for the buildings in which they are functioning. Theyare rent-free. There are 193 (4.51%) schools whose buildings are under construction. They are run under transitoryarrangements.
164 schools have reported that their buildings are not fit for use. There are 21 government schools which are runin private buildings.
The number of building less schools (own building) decreased from 191 in 2009-10 to 121 during 2010-11.
Classrooms :-There are 198415 classrooms in 45677 elementary schools of the Department of Education 68.04 percent of
classrooms are in good condition. 20.78 percent of classrooms need minor repairs, while 11.18 percent of classroomsare waiting for major repairs. It is to be noted that the position regarding to classrooms which are in good conditionand that require minor repairs has not changed much. However the percentage of classrooms which require majorrepairs has marginally increased from 9.52 percent during 2009-10 to 11.18 percent during 2010-11.
24
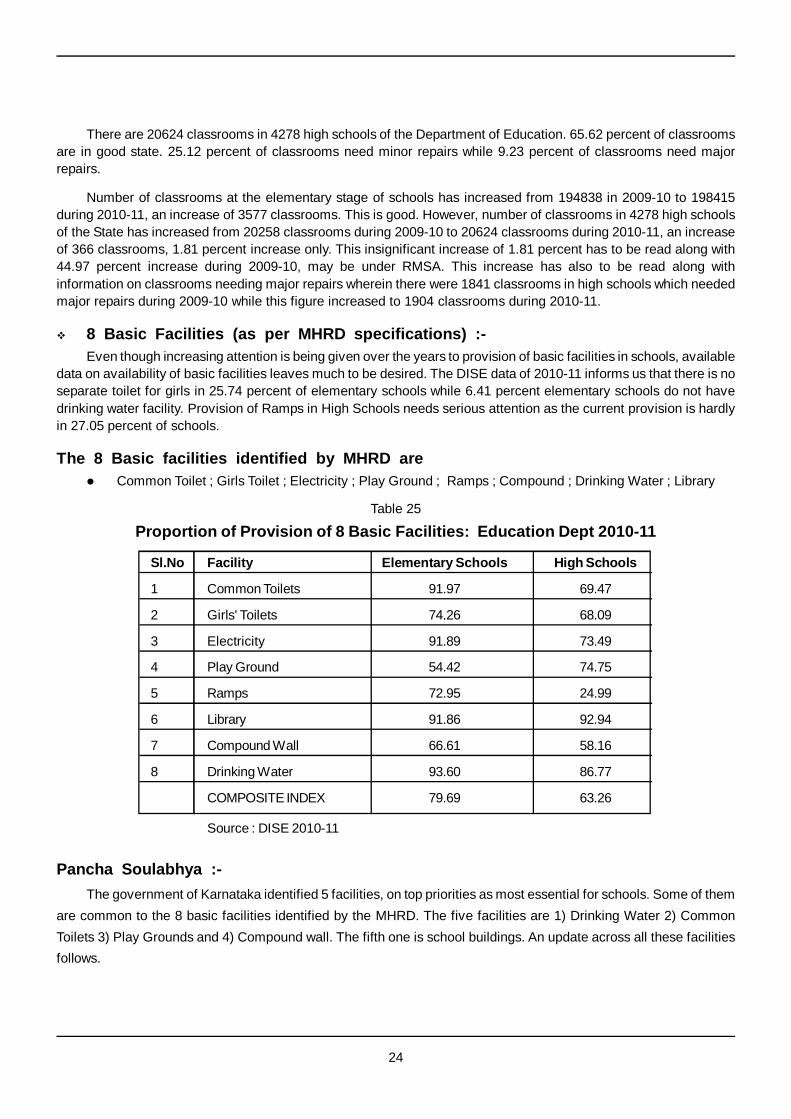
There are 20624 classrooms in 4278 high schools of the Department of Education. 65.62 percent of classroomsare in good state. 25.12 percent of classrooms need minor repairs while 9.23 percent of classrooms need majorrepairs.
Number of classrooms at the elementary stage of schools has increased from 194838 in 2009-10 to 198415during 2010-11, an increase of 3577 classrooms. This is good. However, number of classrooms in 4278 high schoolsof the State has increased from 20258 classrooms during 2009-10 to 20624 classrooms during 2010-11, an increaseof 366 classrooms, 1.81 percent increase only. This insignificant increase of 1.81 percent has to be read along with44.97 percent increase during 2009-10, may be under RMSA. This increase has also to be read along withinformation on classrooms needing major repairs wherein there were 1841 classrooms in high schools which neededmajor repairs during 2009-10 while this figure increased to 1904 classrooms during 2010-11.
8 Basic Facilities (as per MHRD specifications) :-Even though increasing attention is being given over the years to provision of basic facilities in schools, available
data on availability of basic facilities leaves much to be desired. The DISE data of 2010-11 informs us that there is noseparate toilet for girls in 25.74 percent of elementary schools while 6.41 percent elementary schools do not havedrinking water facility. Provision of Ramps in High Schools needs serious attention as the current provision is hardlyin 27.05 percent of schools.
The 8 Basic facilities identified by MHRD are Common Toilet ; Girls Toilet ; Electricity ; Play Ground ; Ramps ; Compound ; Drinking Water ; Library
Table 25
Proportion of Provision of 8 Basic Facilities: Education Dept 2010-11
Sl.No Facility Elementary Schools High Schools
1 Common Toilets 91.97 69.47
2 Girls' Toilets 74.26 68.09
3 Electricity 91.89 73.49
4 Play Ground 54.42 74.75
5 Ramps 72.95 24.99
6 Library 91.86 92.94
7 Compound Wall 66.61 58.16
8 Drinking Water 93.60 86.77
COMPOSITE INDEX 79.69 63.26
Source : DISE 2010-11
Pancha Soulabhya :-The government of Karnataka identified 5 facilities, on top priorities as most essential for schools. Some of them
are common to the 8 basic facilities identified by the MHRD. The five facilities are 1) Drinking Water 2) CommonToilets 3) Play Grounds and 4) Compound wall. The fifth one is school buildings. An update across all these facilitiesfollows.

25
Provision of 8 Basic facilities in schools during 2010-11 as compared to 2010-11.Table 26
Infrastructure Provision in Elementary Schools of the State
2008-09 82.95 50.23 84.44 49.00 52.10 68.20 80.54 86.44
2009-10 88.01 64.66 87.55 52.05 64.62 59.59 88.12 86.97
% Increase /Decrease +5.06 +14.43 +3.11 +3.05 +12.52 -8.61 +7.58 +0.53
20010-11 91.97 74.26 91.89 54.41 72.95 66.61 93.59 91.86
% Increase /Decrease +4.50 +14.84 +4.96 +4.53 +12.89 +11.78 +6.21 +5.62
Note :- There is an alround increase of facilities on all the eight components.
Graph 13 (for table 26)
Infrastructure Provision in Elementary Schools of the State
Table 27
Infrastructure Provision in High Schools of the State
2008-09 60.28 55.34 67.12 67.12 21.73 68.95 82.79 79.55
2009-10 65.91 66.12 64.56 73.44 17.54 51.90 79.13 87.52
% Increase /Decrease + 5.63 +10.78 -2.56 + 6.32 -4.19 -17.05 -3.66 + 7.97
2010-11 69.47 68.09 73.49 74.75 24.99 58.16 86.77 92.94
% Increase /Decrease +5.40 +2.98 +13.84 +1.79 +4.25 +12.05 +9.65 +6.19
Years Common Girls Electricity Play Ramps Compound Drinking Library
Years CommonToilet
GirlsToilet Electricity Play
Ground Ramps Compound DrinkingWater Library

26
Graph 14 (for table 27)
Infrastructure Provision in High Schools of the State
Notes:-
1) Sl. Nos. 1, 4, 7 and 8 are also included under the State Programme of Pancha Soulabhya. District-wise tallyis given in Annexure 4 A-D.
2) There is an alround increase of facilities at both elementary and high school stages on all 08 components..
3) The fifth item in Pancha Soulabhya Programme of the State Government is provision of School Buildings.This has been discussed under the section on School Buildings.
Provision of Infrastructure facilities was given increased attention during 2010-11 both at the Elementary andHigh School stages. The overall provision went up from 73.95 percent in 2009-10 to 79.69 percent during 2010-11 atthe Elementary stage while it went up from 63.26 percent during 2009-10 to 68.58 percent at the High School stage.There was a gain of 5.74 and 5.32 percentage points respectively at the Elementary and High School stages, at theState level while some of the districts like Haveri and Uttara Kannada got a hike of over 10 percent and beyond at theElementary stage, districts such as Dharwad, Gulbarga, Haveri, Madhugiri and Uttara Kannada got a hike of over 10percent at the High School stage (see tables 33 and 34). Considerable attention was received by the followingfacilities ; construction of Girls Toilet ,Ramps and Compound Wall at the Elementary stage : Electricity, Ramps andDrinking Water at the High School stage..

27
Table 28
Student - Classroom Ratios in Schools
* includes 1 to 10 standard school enrolment
In sum it is observed that Student-Classroom ratio at the lower, higher and in schools of the DoE are much lowerthan similar ratios at central / other category schools, unaided, SW+LB and Aided schools. The SCR in aided schoolsand SW+LB schools is above 30:1 which ratio exceeds the RTE norm. It is at the high school stage that SCR value isquite high in the schools of the DoE.
Education Dept 52171 777917 14.91 146244 3727000 25.48 198415 4504917 22.70 20624 963247 46.71
SW + LSG 714 13995 19.60 2646 85846 32.44 3360 99841 29.71 2511 84478 33.64
Aided 1029 29678 28.84 20268 716941 35.37 21297 746619 35.06 19286 861977 44.69
Un-Aided 14094 218805 15.52 83307 2277292 27.34 97401 2496098 25.63 52534 1438746 27.39
Central and OtherManagement schools 50 1090 21.80 1976 52176 26.40 2026 53266 26.29 1794 47799 26.64
Total 68058 1041485 15.30 254441 6859255 26.96 322499 7900741 24.5 96749 3396247 35.10
ManagementLower Primary Schools Upper Primary Schools Elementary Schools Secondary Schools
Classrooms Enrolment SCR Classrooms Enrolment SCR ClassroomsEnrolment SCR Classrooms Enrolment SCR

28
Notes :- There are 45677 elementary schools in the State, under the Department of Education, of them, 97.52 schools
function in own buildings. In Haveri District, all schools own their buildings. There are 16 more districts in theState morethan 98% schools have own buildings.
Position in regard to ownership needs attention in Raichur, Bangalore city, Yadgir and Belgaum districtswhose deficit in more than 5 percent.
There are 198415 classrooms in 45677 schools of the DoE, More than 03 out of 10 classrooms in the schoolsof the DoE are not in 'good' condition. Bangalore city district fares well compartively. That is, 63415classrooms which need minor / major repairs.
Districts which have at least 3 out of 4 classrooms in good condition are Bidar, Raichur, Bijapur, Bellary,Gulbarga and Koppal.
Not even 02 out of 05 classrooms are in good condition in Hassan, Tumkur, Chitradurga, Shimoga, Mandyaand Ramanagara districts.
No. of classrooms which need major repairs are 22184, 11.18 percent of total. It needs to be noted that there are 56896 rooms in DoE elementary schools which are currently used for non-
instructional purposes such as HT room, staff room, and lab-cum-library room.
Table 29-30
Building Status and Condition of Classrooms Elementary at Education Department
1 HAVERI 1,166 1,166 100.00 1 BANGALORE U NORTH 2,669 2,173 81.422 CHIKKAMANGALORE 1,513 1,508 99.67 2 BANGALORE U SOUTH 4,128 3,343 80.983 SHIMOGA 1,921 1,910 99.43 3 BIDAR 6,762 5,354 79.184 UTTARA KANNADA SIRSI 1,166 1,158 99.31 4 RAICHUR 7,196 5,637 78.345 CHITRADURGA 1,708 1,693 99.12 5 BIJAPUR 10,174 7,942 78.066 TUMKUR 2,252 2,231 99.07 6 BELLARY 8,054 6,267 77.817 KOLAR 1,886 1,868 99.05 7 GULBARGA 9,363 7,281 77.768 MANDYA 1,813 1,795 99.01 8 KOPPAL 4,981 3,814 76.579 CHIKKABALLAPURA 1,579 1,562 98.92 9 BELGAUM 7,570 5,648 74.6110 GADAG 618 611 98.87 10 YADAGIRI 4,357 3,220 73.9011 TUMKUR MADHUGIRI 1,314 1,299 98.86 11 DHARWAD 6,322 4,658 73.6812 HASSAN 2,597 2,567 98.84 12 GADAG 3,909 2,858 73.1113 DAKSHINA KANNADA 933 919 98.50 13 BAGALKOT 7,165 5,209 72.7014 KODAGU 406 399 98.28 14 BELGAUM CHIKKODI 8,626 6,266 72.6415 BANGALORE RURAL 1,138 1,117 98.15 15 KODAGU 2,016 1,372 68.0616 BIDAR 1,290 1,266 98.14 16 UTTARA KANNADA 3,630 2,420 66.6717 DAVANAGERE 1,377 1,351 98.11 17 CHIKKAMANGALORE 5,668 3,736 65.9118 RAMANAGARA 1,401 1,371 97.86 18 UTTARA KANNADA SIRSI 3,922 2,575 65.6619 GULBARGA 1,806 1,766 97.79 19 MYSORE ,239 5,396 65.4920 BIJAPUR 1,886 1,842 97.67 20 BANGALORE RURAL 3,668 2,387 65.0821 UDUPI 618 600 97.09 21 CHIKKABALLAPURA 4,989 3,238 64.9022 UTTARA KANNADA 995 966 97.09 22 CHAMARAJANAGARA 3,347 2,170 64.8323 BELGAUM CHIKKODI 1,858 1,803 97.04 23 KOLAR 5,953 3,817 64.1224 BELLARY 1,366 1,320 96.63 24 HAVERI 6,238 3,983 63.8525 CHAMARAJANAGARA 780 752 96.41 25 DAKSHINA KANNADA 5,325 3,366 63.2126 MYSORE 1,959 1,887 96.32 26 UDUPI 2,995 1,845 61.6027 KOPPAL 964 928 96.27 27 TUMKUR MADHUGIRI 4,467 2,693 60.2928 BAGALKOT 1,315 1,262 95.97 28 DAVANAGERE 6,690 4,025 60.1629 DHARWAD 773 741 95.86 29 RAMANAGARA 4,364 2,597 59.5130 BELGAUM 1,427 1,353 94.81 30 MANDYA 6,837 4,029 58.9331 YADAGIRI 935 885 94.65 31 SHIMOGA 7,136 4,137 57.9732 BANGALORE U SOUTH 904 827 91.48 32 CHITRADURGA 6,698 3,866 57.7233 BANGALORE U NORTH 516 468 90.70 33 TUMKUR 6,831 3,760 55.0434 RAICHUR 1,497 1,354 90.45 34 HASSAN 8,126 3,918 48.22
Total 45,677 44,545 97.52 Total 198,415 135,000 68.04
Table A Table B
Sl.No. District Schools
Building Status
Govt.Building
Status
Percentagesin
Des.order
Sl.No. District
Class Rooms in good condition
TotalRooms
GoodRooms
Percentagesin
Des.order
Source : DISE 2010-11

29
Govt. Building
Percentages in
Des.order
Total Rooms
Good Rooms
Percentages in
Des.order1 DAVANAGERE 152 148 97.37 1 BANGALORE U SOUTH 565 493 87.262 SHIMOGA 155 144 92.90 2 BANGALORE U NORTH 369 302 81.843 CHITRADURGA 109 100 91.74 3 GADAG 398 322 80.904 KODAGU 47 43 91.49 4 RAICHUR 858 679 79.145 CHIKKAMANGALORE 115 105 91.30 5 BELGAUM 542 428 78.976 BANGALORE U SOUTH 79 72 91.14 6 GULBARGA 1,209 924 76.437 CHIKKABALLAPURA 106 95 89.62 7 DHARWAD 495 376 75.968 KOLAR 115 103 89.57 8 BIDAR 613 454 74.069 GULBARGA 254 227 89.37 9 BELGAUM CHIKKODI 598 439 73.41
10 UDUPI 106 94 88.68 10 YADAGIRI 570 402 70.5311 BANGALORE U NORTH 52 46 88.46 11 BAGALKOT 629 438 69.6312 BIDAR 149 131 87.92 12 BELLARY 875 603 68.9113 HASSAN 241 208 86.31 13 UTTARA KANNADA SIRSI 313 213 68.0514 TUMKUR 133 113 84.96 14 CHIKKABALLAPURA 572 386 67.4815 UTTARA KANNADA 45 38 84.44 15 RAMANAGARA 491 322 65.5816 MANDYA 214 179 83.64 16 BIJAPUR 505 330 65.3517 KOPPAL 128 107 83.59 17 HAVERI 536 350 65.3018 HAVERI 131 109 83.21 18 DAVANAGERE 835 534 63.9519 BANGALORE RURAL 59 49 83.05 19 CHAMARAJANAGARA 387 246 63.5720 UTTARA KANNADA SIRSI 70 58 82.86 20 KOLAR 657 414 63.0121 MYSORE 216 177 81.94 21 KOPPAL 575 360 62.6122 TUMKUR MADHUGIRI 94 77 81.91 22 MYSORE 1,047 652 62.2723 YADAGIRI 116 92 79.31 23 UTTARA KANNADA 204 127 62.2524 DAKSHINA KANNADA 160 125 78.13 24 CHITRADURGA 478 286 59.8325 BELLARY 172 134 77.91 25 SHIMOGA 744 439 59.0126 BIJAPUR 121 94 77.69 26 CHIKKAMANGALORE 573 337 58.8127 BAGALKOT 146 112 76.71 27 DAKSHINA KANNADA 694 408 58.7928 RAMANAGARA 106 81 76.42 28 TUMKUR 644 376 58.3929 GADAG 83 61 73.49 29 MANDYA 1,069 617 57.7230 BELGAUM 123 90 73.17 30 UDUPI 549 307 55.9231 RAICHUR 162 117 72.22 31 TUMKUR MADHUGIRI 429 236 55.0132 CHAMARAJANAGARA 84 59 70.24 32 BANGALORE RURAL 347 185 53.3133 BELGAUM CHIKKODI 146 101 69.18 33 KODAGU 201 96 47.7634 DHARWAD 89 58 65.17 34 HASSAN 1,053 454 43.11
Total 4,278 3,547 82.91 Total 20,624 13,535 65.63Source : DISE 2010-11
Sl.No. District Schools
Table AClass Rooms in good conditionBuilding Status
Sl.No.
Table B
District
Table 31-32 - Building Status and Condition of Classrooms at High Schools of theEducation Department
Notes :-
3547 out 4278 high schools of the DoE, 82.91 percent of total, own the building in which they function.
Building status-ownership is relatively better in Davanagere, Shimoga, Chitradurga, Kodagu, Chikamangaloreand Bangalore South district.
Ownership of buildings is lower than the State average figure in 15 districts of the State.
There are 4278 high schools in the State run by the DoE. They have 20624 classrooms and 13307 otherrooms. 13535 out of 20624 classrooms, 65.63 percent, are in good condition.
3 out of 4 classrooms are in 'good' condition in Bangalore city, Gadag, Raichur, Belgaum, Gulbarga andDharwad districts.
Less than every alternate room is in bad condition in Kodagu and Hassan districts.
19 districts of the State have classrooms in bad condition whose number is lower than State average.
1974 out of 20624 classrooms, 9.57 percent, need major repairs.

30
Table 33Basic Facilities in Elementary Schools in Education Department in 2008-09,
2009-10 and 2010-11
1 BAGALKOT 67.43 71.45 1,315 78.94 1 KOLAR 29.23
2 BANGALORE NORTH 75.00 78.82 516 84.86 2 UTTARA KANNADA 19.83
3 BANGALORE RURAL 71.90 75.28 1,138 78.91 3 CHITRADURGA 18.11
4 BANGALORE SOUTH 77.82 79.89 904 84.89 4 SHIMOGA 16.81
5 BELGAUM 67.74 71.75 1,427 75.44 5 MANDYA 16.29
6 BELLARY 70.56 72.64 1,366 73.40 6 GULBARGA 15.04
7 BIDAR 54.38 62.35 1,290 65.90 7 CHIKKABALLAPURA 14.37
8 BIJAPUR 75.79 77.35 1,886 81.22 8 DHARWAD 13.31
9 CHAMARAJANAGARA 65.17 75.41 780 74.50 9 KOPPAL 11.66
10 CHIKKABALLAPURA 57.95 62.39 1,579 72.32 10 BIDAR 11.53
11 CHIKKAMANGALORE 75.06 76.73 1,513 80.24 11 BAGALKOT 11.50
12 CHIKKODI 66.10 68.06 1,858 71.60 12 MADHUGIRI 11.30
13 CHITRADURGA 68.34 81.62 1,708 86.45 13 DAVANAGERE 11.25
14 DAKSHINA KANNADA 83.03 87.53 933 90.96 14 HAVERI 10.29
15 DAVANAGERE 69.83 78.75 1,377 81.08 15 GADAG 10.19
16 DHARWAD 75.81 84.74 773 89.12 16 RAICHUR 10.14
17 GADAG 75.85 81.43 618 86.04 17 BANGALORE NORTH 9.86
18 GULBARGA 59.40 67.69 1,806 74.43 18 CHAMARAJANAGARA 9.34
19 HASSAN 69.18 71.47 2,597 73.33 19 TUMKUR 8.44
20 HAVERI 75.47 75.15 1,166 85.76 20 DAKSHINA KANNADA 7.93
21 KODAGU 87.01 86.36 406 92.58 21 BELGAUM 7.69
22 KOLAR 66.08 68.17 1,886 95.31 22 BANGALORE SOUTH 7.07
23 KOPPAL 69.97 72.90 964 81.63 23 BANGALORE RURAL 7.01
24 MADHUGIRI 70.45 75.35 1,314 81.75 24 YADAGIRI 6.77
25 MANDYA 69.67 76.92 1,813 85.96 25 RAMANAGARA 5.67
26 MYSORE 80.72 81.53 1,959 82.92 26 KODAGU 5.57
27 RAICHUR 59.51 64.16 1,497 69.66 27 CHIKKODI 5.50
28 RAMANAGARA 69.60 71.51 1,401 75.28 28 BIJAPUR 5.43
29 SHIMOGA 66.62 76.92 1,921 83.43 29 CHIKKAMANGALORE 5.17
30 TUMKUR 68.51 74.65 2,252 76.95 30 HASSAN 4.15
31 UDUPI 82.27 84.17 618 84.79 31 BELLARY 2.84
32 UTTARA KANNADA 67.16 74.29 995 86.98 32 UDUPI 2.51
33 YADAGIRI 59.90 63.71 935 66.67 33 MYSORE 2.20
34 UTTARA KANNADA SIRSI 0.00 0.00 1,166 82.10
Total 69.24 73.95 45,677 79.69 Total 10.45
DistrictSlNo.
CompositeIndex ofProvision
in %2008-09
CompositeIndex of
Provision in %2009-10
2010-11No. of
Schools
CompositeIndex ofProvision
in %2010-11
DistrictSlNo.
Diff. in (10-11) - (08-09) CI
In Descending Order

31
Note :-
Negative values do not indicate decrease in provisions. They are due to definitional variations across the years.e.g.: compound wall included even fence around school in 2008-09
DistrictSlNo.
CompositeIndex ofProvision
in %2008-09
CompositeIndex of
Provision in %2009-10
2010-11No. of
Schools
CompositeIndex ofProvision
in %2010-11
DistrictSlNo.
Diff. in (10-11) - (08-09) CI
In Descending Order
Table 34
Basic Facilities in High Schools in Education Department in 2008-09,2009-10 and 2010-11
1 BAGALKOT 59.09 62.50 146 68.32 1 UTTARA KANNADA 25.55
2 BANGALORE NORTH 81.12 80.36 52 85.34 2 DHARWAD 16.03
3 BANGALORE RURAL 73.09 72.63 59 74.79 3 MADHUGIRI 14.45
4 BANGALORE SOUTH 77.63 75.97 79 81.17 4 MANDYA 12.55
5 BELGAUM 58.73 57.58 123 59.55 5 CHAMARAJANAGARA 12.02
6 BELLARY 55.29 59.29 172 61.70 6 CHITRADURGA 11.52
7 BIDAR 61.81 54.25 149 57.63 7 KOLAR 10.30
8 BIJAPUR 69.14 48.78 121 54.34 8 RAMANAGARA 9.58
9 CHAMARAJANAGARA 53.16 58.59 84 65.18 9 TUMKUR 9.43
10 CHIKKABALLAPURA 60.66 63.81 106 67.92 10 BAGALKOT 9.23
11 CHIKKAMANGALORE 70.80 68.92 115 75.22 11 GULBARGA 8.91
12 CHIKKODI 58.36 56.04 146 57.02 12 YADAGIRI 8.46
13 CHITRADURGA 58.90 74.53 109 70.41 13 GADAG 8.29
14 DAKSHINA KANNADA 65.44 69.03 160 70.47 14 HAVERI 7.54
15 DAVANAGERE 73.99 72.32 152 80.02 15 CHIKKABALLAPURA 7.26
16 DHARWAD 49.70 53.13 89 65.73 16 BELLARY 6.41
17 GADAG 62.20 65.12 83 70.48 17 RAICHUR 6.40
18 GULBARGA 54.72 51.03 254 63.63 18 DAVANAGERE 6.02
19 HASSAN 62.81 63.10 241 67.74 19 KOPPAL 5.43
20 HAVERI 69.66 58.77 131 77.19 20 SHIMOGA 5.38
21 KODAGU 77.50 69.29 47 73.94 21 DAKSHINA KANNADA 5.03
22 KOLAR 64.05 66.70 115 74.35 22 HASSAN 4.93
23 KOPPAL 59.03 61.11 128 64.45 23 CHIKKAMANGALORE 4.42
24 MADHUGIRI 60.81 61.28 94 75.27 24 BANGALORE NORTH 4.22
25 MANDYA 63.56 69.70 214 76.11 25 BANGALORE SOUTH 3.54
26 MYSORE 70.22 67.57 216 68.46 26 UDUPI 3.14
27 RAICHUR 51.32 53.85 162 57.72 27 BANGALORE RURAL 1.69
28 RAMANAGARA 57.28 58.70 106 66.86 28 BELGAUM 0.82
29 SHIMOGA 67.68 69.33 155 73.06 29 CHIKKODI -1.34
30 TUMKUR 65.29 71.35 133 74.72 30 MYSORE -1.76
31 UDUPI 72.45 71.03 106 75.59 31 KODAGU -3.56
32 UTTARA KANNADA 60.28 62.39 45 85.83 32 BIDAR -4.18
33 YADAGIRI 56.62 66.89 116 65.09 33 BIJAPUR -14.80
34 UTTARA KANNADA SIRSI 0.00 0.00 70 63.57
Total 62.86 63.26 4,278 68.58 Total 5.72

32
Table 34A
Top & Bottom 10 Districts in basic facilities in Elementary & High SchoolsEducation Department in 2010-11-Common List
Sl.No.
District(Elementary)
CompositeIndex of
Provision in% 2010-11
inDesc. order
DistrictHigh Schools
Sl.No.
CompositeIndex of
Provision in% 2010-11
inDesc. order
1 KOLAR 95.312 KODAGU 92.58
3 DAKSHINA KANNADA 90.96
4 DHARWAD 89.125 UTTARA KANNADA 86.98
6 CHITRACURGA 86.45
7 GADAG 86.048 MADHUGIRI 85.06
9 HAVERI 85.76
10 BANGALORE SOUTH 84.8911 BANGALORE NORTH 84.86
12 UDUPI 84.79
13 RAMANAGARA 83.43
14 MANDYA 82.9215 UTTARA KANNADA SIRSI 82.10
16 TUMKUR 81.75
17 KOPPAL 81.6318 BIJAPUR 81.22
19 DAVANGERE 81.08
20 CHIKKAMANGALORE 80.2421 BAGALKOTE 78.94
22` BANGALORE RURAL 78.91
23 SHIMOGA 76.9524 BELGAUM 75.44
25 RAICHUR 75.28
26 CHAMARAJANAGARA 74.5027 GULBARGA 74.43
28 BELLARY 73.40
29 HASSAN 73.3330 CHIKKABALLAPURA 72.32
31 CHIKKODI 71.60
32 MYSORE 69.6633 YADAGIRI 66.67
34 BIDAR 65.90
Total 79.69
1 UTTARAKANNADA 85.832 BANGALORE NORTH 85.34
3 BANGALORE SOUTH 81.17
4 DAVANGERE 80.025 HAVERI 77.19
6 MANDYA 76.11
7 UDUPI 75.598 MADHUGIRI 75.27
9 CHIKKAMANGALORE 75.22
10 BANGALORE RURAL 74.7911 TUMKUR 74.72
12 KOLAR 74.35
13 KODAGU 73.94
14 SHIMOGA 73.0615 GADAG 70.48
16 DAKSHINA KANNADA 70.47
17 CHITRADURGA 70.4118 MYSORE 68.46
19 BAGALKOT 68.32
20 CHIKKABALAPURA 67.9221 HASSAN 67.74
22` RAMANAGARA 66.86
23 DHARWAD 65.7324 CHAMARAJANAGARA 65.18
25 YADAGIRI 65.09
26 KOPPAL 64.4527 GULBARGA 63.63
28 UTTARA KANNADA SIRSI 63.57
29 BELLARY 61.7030 BELGAUM 59.55
31 RAICHUR 57.72
32 BIDAR 57.6333 CHIKKODI 57.02
34 BIJAPUR 54.34
Total 68.58

33
Method of Calculation and Interpretation of Indexes of Basic Facilities in Schools of theState in Tables 33, 34 and 34A
8 Basic Facilities (as identified by the MHRD ) that need to be located in Elementary and High Schools are :Common Toilets, Girls' Toilets, Electricity, Playground, Drinking Water, Ramps, Library and Compound Wall.One score is earmarked for each one of these facilities. A school having all the eight facilities shall get 8scores. Otherwise, the school shall get as many scores as the number of facilities located in it.
In this way, total scores obtained by each one of the schools of a district are summated and divided by thetotal number of schools in that district. The product of the division is the index of current availability of 8basic facilities of the district.
Assuming that all schools of the District have all the 8 Basic Facilities, the number of schools is multipliedby the digit 8. The product is an index of total availability.
Index of current availability is divided by the (assumed) index of total availability and multiplied by 100. Theproduct is an index of percentage of availability of 8 basic facilities.
Illustration: There are 406 Primary schools in Kodagu District. If each one of the 406 schools were to haveall 8 basic facilities, the District would have recorded a maximum score of 3248. However, going by thecurrent availability of facilities in these 406 schools, the sum of scores obtained by the district is 2805.Hence, the percentage of availability of basic facilities in the district is 86.36; the figure arrived at by dividing2805 by 3248 and multiplying the product by 100.
Tables 33 and 34 provide indicative information about the provision of 8 Basic Facilities across the schoolsof the state in the various districts. They are enabling in identification of districts which are lagging behind inavailability of infrastructure facilities. This type of information would be quite useful in prioritization ofresource allocations across districts under plan schemes as well as projects in cases of provision ofinfrastructure facilities. However, one has to go beyond statistics in taking district specific decisions inregard to the provision of specific types of infrastructure facilities and prioritize them within the districts.
Performance of the State in regard to provision of 8 basic facilities at elementary and high school levels isrecorded as 79.69 and 68.58 percent respectively.
When the position in regard to provision of 8 basic facilities in the elementary schools is compared with thatin the high schools, it is observed that districts which are quite good or quite low in provision of facilities atthe elementary level need not also figure as such at the high school stage.
There are exceptions of districts to the foregoing generalization. Exceptional districts are identified here.
When the top 10 districts in provision of 8 basic facilities in the State at the elementary stage are juxtaposedwith top 10 districts on the same counts at the high school stage, it is observed that only 04 districts appearin both the lists. These districts are Uttarakannada, Madugiri, Haveri and Bangalore South.
District which are common in the lists of bottom ten districts in provision of infrastructure facilities at theelementary and high school stages are Yadgiri, Gulbarga, Bellary, Raichur, Bidar and Chikkodi
There are 06 districts in top 10 lists of elementary and high school stages as well as 06 districts in bottom 10districts of similar lists in regard to provision of infrastructure facilities. The 6 districts which appear in bottom10 tally of both the lists need immediate special attention.

34
TEACHERS IN THE SYSTEMNumber of teachers who are working at the lower primary, higher primary and high school stages in the schools
of the Department of Education are 50765, 151288 and 42854 respectively. In sum 227203 teachers are working in theDepartment of Education.
TABLE 35
Management-wise Number of Sanctioned Teachers in the State at LPS / HPS / HS
Management LPS HPS LPS + High1 to 5 1 to 7/8 HPS School Total
DoE 50765 151288 202053 42854 244907
% 78.96 60.56 64.33 32.04 54.70
SW 560 3414 3974 2879 6853
% 0.87 1.36 1.26 2.15 1.53
LB 39 292 331 560 891
% 0.06 0.12 0.11 0.42 0.20
Total Govt. 51364 154994 206358 46293 252651
% 79.89 62.04 65.70 34.61 56.43
Aided 938 20353 21291 32450 53741
% 1.46 8.13 6.76 24.26 11.98
Un-Aided 11980 72699 84679 53210 137889
% 18.59 29.04 26.90 39.79 30.74
Others 25 1621 1646 1547 3193
% 0.04 0.65 0.52 1.16 0.71
Central 16 339 355 242 597
% 0.02 0.14 0.11 0.18 0.13
Total 64323 250006 314329 133742 448071
Graph 15 ( for Table 35 )
Percentage of Teachers Sanctioned at LPS/HPS/HS stages of schools of variousManagements
35
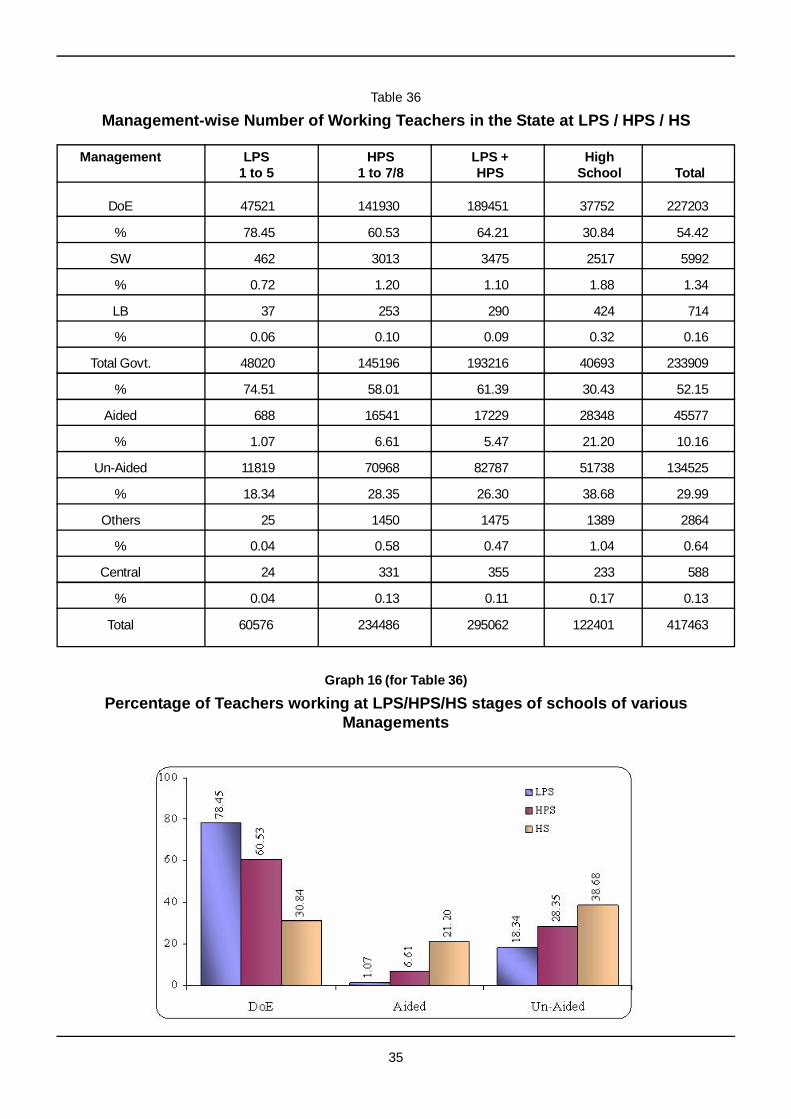
Table 36
Management-wise Number of Working Teachers in the State at LPS / HPS / HS
Management LPS HPS LPS + High1 to 5 1 to 7/8 HPS School Total
DoE 47521 141930 189451 37752 227203
% 78.45 60.53 64.21 30.84 54.42
SW 462 3013 3475 2517 5992
% 0.72 1.20 1.10 1.88 1.34
LB 37 253 290 424 714
% 0.06 0.10 0.09 0.32 0.16
Total Govt. 48020 145196 193216 40693 233909
% 74.51 58.01 61.39 30.43 52.15
Aided 688 16541 17229 28348 45577
% 1.07 6.61 5.47 21.20 10.16
Un-Aided 11819 70968 82787 51738 134525
% 18.34 28.35 26.30 38.68 29.99
Others 25 1450 1475 1389 2864
% 0.04 0.58 0.47 1.04 0.64
Central 24 331 355 233 588
% 0.04 0.13 0.11 0.17 0.13
Total 60576 234486 295062 122401 417463
Graph 16 (for Table 36)
Percentage of Teachers working at LPS/HPS/HS stages of schools of variousManagements

36
Note: Over 06 out of every 11 teachers working in the State therein including all levels of schooling belong to theDepartment of Education. If a tally is taken of only Elementary School level teachers this percentage goes upto nearly7 out of 11 teachers. If a tally of proportion of teachers whose salary is paid by the government, that is Department ofEducation plus schools run by the Department of Social Welfare and Local Bodies along with private schools gettinggrant in aid are considered then, the proportion of teachers maintained by it is nearly 72 percent at the elementarylevel, and 57 percent at the High School level.
Teacher Pupil ratios are in a satisfactory state in Government schools. This ratio is 23.18 at the elementaryschools. Still variations in this ratio are observed across districts of the state, blocks within districts and schools withinblocks. For instance, this ratio is 1 : 30.64. in Bijapur district while it is 1 : 14.86 in Chikmagalur district. A process ofrational deployment of teachers is in progress so as to set right such imbalances in teacher pupil ratios.
Table 37
Management-wise Number of Working Teachers in the State at LPS / HPS
Management 1 to 7 No. of PTRNo. of Students Teachers working
DOE 4391157 189451 23.18
SW + LB 62615 3765 16.63
AIDED 695302 17229 40.36
UN - AIDED 2237004 82787 27.02
OTHERS 8268 355 23.29
CENTRAL 30777 1475 20.86
TOTAL 7425123 295062 25.16
There being one teacher for every 25 students in the Department of Education, these ratios are observed to be42 and 28 in private aided and unaided schools.
District wise details of number of teachers and teacher- pupil ratios in elementary schools of the Statefor 2010- 11 are provided in annexure number 7 A-D and 8 A-B.
(I) TPR for Sanctioned Teachers Lower primary schools (1 to 5)
The average TPR for state being 15.29, a total of 15 districts record an average higher than the Stateaverage
Highest TPR is observed in Yadgiri district (25.62)
Lowest TPR is observed in Chikamagalur district (9.99)
Higher Primary schools(1 to 7/ 8) The average TPR for the State at higher primary level being 24.59, a total of 15 districts record an average
higher than the State average
Highest TPR is observed in Yadgiri district (31.71) (HPS)
Lowest TPR is observed in Chikmagalur district (15.69) (HPS)
TPR count when LPS and HPS are clubbed together is 25.16.
The average TPR for the State is 22.25 , 16 districts record an average TPR which is higher than the Stateaverage
Highest TPR is observed in Yadgiri district (30.20).- Elementary
Lowest TPR is observed in Chikmagalur district (14.06)-Elementary

37
TPR in (1-5) and (1-7/8) Following 07 districts appear in both (LPS & HPS) the lists in a tally of TPR of ( LPS & HPS) Top 10 districts,
with high TPR ; they are : Koppal, Yadagiri, Dharwad, Bellary, Bangalore South, Bijapur and Bagalkot.
Likewise, following 08 districts appear in both the lists in tally of TPR of bottom 10 districts,
[Highly favourable TPR] Chikamagalur. Hassan, Uttara Kannada, Tumkur, Bangalore Rural Kodagu,Shimoga and Ramanagara.
II TPR for working Teachers TPR for working Teachers at 1 to 5 LPS and 1 to 7/8 HPS stages Lower Primary (1 to 5)
The State average TPR is 16.37. 16 districts record an average higher than the state average. Highest TPR is recorded in Yadgiri district (27.56) Lowest TPR is recorded in Hassan district (10.88)
Higher Primary schools(1 to 7/8) The State average TPR is 26.26. 15 districts recorded an average higher than the State average. District with the Highest TPR is Yadgiri district (35.22) District with the Lowest TPR is Chikmagalur district (16.80)
Scenario when LPS and HPS are clubbed together
The State average TPR being is 23.78, 16 districts record an average TPR higher than the State average. Highest TPR is recorded by Yadgiri district (33.28) Lowest TPR is recorded by Chikmagalur district (15.17) Following 7 districts appear in both (LPS & HPS) the lists in a tally of TPR of top 10 districts that is having
high TPR they are Koppal, Yadagiri, Bellary, Dharwad, Bagalkot, Bijapur and Gulbarga. Likewise, following 9 districts in both the lists across the bottom 10 districts of TPR at total elementary stage
are Hassan, Tumkur, Chikmagalur, Uttara Kannada, Bangalore Rural, Kodagu Ramanagara Shimoga andChikkaballapura districts.
Female Teachers across ManagementsTable 37A [Processed from Annexure 9 A-D]
Proportion of Female Teachers in the State.
Sl No Level / Management Govt. Aided Unaided Total
1 Elementary 49.00 48.82 75.00 56.40
2 High Schools 38.95 23.89 64.08 46.33
Total 47.24 33.31 70.79 53.45
Notes:-
Government needs to improve the position in regard to proportion of female teachers. Private Aided high schools, located mostly in urban areas, big villages and block head quarters appear to
be friendly to male teachers. However, they appoint trained and qualified teachers, as per governmentstipulations.
Private unaided schools located by and large in urban areas apart from big villages and block headquarters are quite friendly to women teachers. There is no update on the qualifications and training statusof teachers of unaided schools. The RTE specifies appointment of qualified and trained teachers atelementary level and across all managements.

38
Table 38
District Wise Pupil Teacher Ratio in Education Department(Teachers Sanctioned) - Descending Order, 2010-11
Notes: - There are 03 districts in the State, Viz : Yadgiri, Bijapur and Dharwad where PTR in 2010-11, even forsanctioned teachers is above the RTE norm of 1:30. Overall, at elementary level, it is so only in Yadgiri district.School-wise position will be more critical.
1 YADAGIRI 25.62 YADAGIRI 31.71 YADAGIRI 30.20
2 KOPPAL 25.01 BIJAPUR 31.56 DHARWAD 29.88
3 BELLARY 21.32 DHARWAD 31.12 BIJAPUR 29.15
4 GADAG 21.27 KOPPAL 28.81 KOPPAL 28.12
5 DHARWAD 20.81 BANGALORE U NORTH 28.13 BAGALKOT 26.71
6 RAICHUR 20.66 BAGALKOT 28.12 BELLARY 26.05
7 BAGALKOT 19.70 BANGALORE U SOUTH 27.97 BANGALORE U SOUTH 25.85
8 BIJAPUR 19.53 BELGAUM CHIKKODI 27.17 BANGALORE U NORTH 25.84
9 GULBARGA 19.51 GULBARGA 27.10 GADAG 25.63
10 BANGALORE U SOUTH 18.75 BELGAUM 27.03 GULBARGA 25.55
11 BIDAR 17.63 BELLARY 26.97 BELGAUM CHIKKODI 25.25
12 BELGAUM CHIKKODI 17.40 HAVERI 26.49 BELGAUM 24.74
13 BANGALORE U NORTH 17.19 GADAG 26.38 HAVERI 24.66
14 HAVERI 16.57 BIDAR 25.59 RAICHUR 24.11
15 DAVANAGERE 15.87 RAICHUR 25.02 BIDAR 24.02
16 BELGAUM 15.20 DAKSHINA KANNADA 23.91 DAKSHINA KANNADA 22.74
17 DAKSHINA KANNADA 14.72 CHAMARAJANAGARA 23.48 DAVANAGERE 21.39
18 MYSORE 14.60 MYSORE 23.45 MYSORE 21.04
19 CHAMARAJANAGARA 14.04 DAVANAGERE 23.20 CHAMARAJANAGARA 21.02
20 MANDYA 13.86 CHITRADURGA 22.54 CHITRADURGA 20.38
21 KOLAR 13.85 TUMKUR MADHUGIRI 21.92 UDUPI 19.88
22 TUMKUR MADHUGIRI 13.66 MANDYA 21.68 MANDYA 19.28
23 CHITRADURGA 13.59 UDUPI 21.62 TUMKUR MADHUGIRI 19.10
24 UDUPI 13.17 UTTARA KANNADA SIRSI 21.36 SHIMOGA 18.06
25 SHIMOGA 13.01 CHIKKABALLAPURA 20.60 KODAGU 18.00
26 CHIKKABALLAPURA 12.73 TUMKUR 20.36 UTTARA KANNADA SIRSI 17.95
27 RAMANAGARA 12.54 KOLAR 20.36 KOLAR 17.60
28 KODAGU 11.84 SHIMOGA 20.02 CHIKKABALLAPURA 17.31
29 BANGALORE RURAL 11.62 RAMANAGARA 19.35 TUMKUR 16.55
30 UTTARA KANNADA SIRSI 11.45 KODAGU 19.20 RAMANAGARA 16.44
31 TUMKUR 11.32 HASSAN 17.93 BANGALORE RURAL 15.56
32 HASSAN 10.50 BANGALORE RURAL 17.65 UTTARA KANNADA 15.20
33 UTTARA KANNADA 10.45 UTTARA KANNADA 17.20 HASSAN 14.98
34 CHIKKAMANGALORE 9.99 CHIKKAMANGALORE 15.69 CHIKKAMANGALORE 14.06
Total 15.29 Total 24.59 Total 22.25
Sl.No District name LPS
PTRHPSPTR
District name District name ElementaryPTR

39
TABLE 38 A
District Wise Pupil Teacher Ratio in Education Department(Teachers Working) - Descending Order, 2010-11
Notes: - There are 06 districts in the State Viz : Yadgiri, Bijapur, Dharwad, Koppal, Bellary and Bagalkot wherein PTRfor working teachers crosses the RTE norm of 1:30. It is so at total elementary level in all these districts, exceptBagalkot districts.
1 YADAGIRI 27.56 YADAGIRI 35.22 YADAGIRI 33.28
2 KOPPAL 27.44 BIJAPUR 33.08 KOPPAL 31.19
3 BELLARY 23.38 DHARWAD 32.11 DHARWAD 30.91
4 GADAG 22.42 KOPPAL 32.02 BIJAPUR 30.60
5 BAGALKOT 22.01 BELLARY 31.41 BELLARY 30.03
6 DHARWAD 21.94 BAGALKOT 30.16 BAGALKOT 28.84
7 RAICHUR 21.78 BELGAUM CHIKKODI 29.83 BELGAUM CHIKKODI 28.09
8 GULBARGA 21.49 BANGALORE U NORTH 29.05 GULBARGA 27.44
9 BIJAPUR 20.65 BANGALORE U SOUTH 28.98 GADAG 26.87
10 BIDAR 20.63 GULBARGA 28.91 BANGALORE U SOUTH 26.74
11 BELGAUM CHIKKODI 20.45 BIDAR 27.90 BANGALORE U NORTH 26.61
12 BANGALORE U SOUTH 19.25 HAVERI 27.89 BIDAR 26.54
13 BANGALORE U NORTH 17.96 BELGAUM 27.83 RAICHUR 26.47
14 HAVERI 17.67 RAICHUR 27.77 HAVERI 26.02
15 DAKSHINA KANNADA 16.55 GADAG 27.63 BELGAUM 25.56
16 DAVANAGERE 16.47 DAKSHINA KANNADA 25.56 DAKSHINA KANNADA 24.46
17 BELGAUM 15.95 CHAMARAJANAGARA 25.21 CHAMARAJANAGARA 22.62
18 MYSORE 15.55 MYSORE 25.00 MYSORE 22.42
19 CHAMARAJANAGARA 15.22 DAVANAGERE 23.82 DAVANAGERE 22.02
20 MANDYA 14.47 UTTARA KANNADA SIRSI 23.73 CHITRADURGA 21.13
21 TUMKUR MADHUGIRI 14.30 CHITRADURGA 23.37 UDUPI 20.87
22 UTTARA KANNADA SIRSI 14.23 TUMKUR MADHUGIRI 22.98 UTTARA KANNADA SIRSI 20.71
23 KOLAR 14.21 MANDYA 22.80 MANDYA 20.23
24 CHITRADURGA 14.09 UDUPI 22.61 TUMKUR MADHUGIRI 20.00
25 UDUPI 14.04 CHIKKABALLAPURA 21.36 KODAGU 19.60
26 SHIMOGA 13.90 SHIMOGA 21.18 SHIMOGA 19.16
27 CHIKKABALLAPURA 13.61 TUMKUR 20.97 CHIKKABALLAPURA 18.18
28 RAMANAGARA 13.10 KODAGU 20.87 KOLAR 18.01
29 KODAGU 13.00 KOLAR 20.79 RAMANAGARA 17.35
30 BANGALORE RURAL 11.98 RAMANAGARA 20.56 TUMKUR 16.99
31 TUMKUR 11.56 BANGALORE RURAL 19.16 BANGALORE RURAL 16.59
32 UTTARA KANNADA 10.99 HASSAN 18.76 UTTARA KANNADA 15.86
33 CHIKKAMANGALORE 10.97 UTTARA KANNADA 17.89 HASSAN 15.61
34 HASSAN 10.88 CHIKKAMANGALORE 16.80 CHIKKAMANGALORE 15.17
Total 16.37 Total 26.26 Total 23.78
Sl.No District name LPS
PTRHPSPTR
District name District name ElementaryPTR

40
PROGRESS OF SCHOOL EDUCATION IN THE STATE(From 2006 - 07 to 2010 - 11)
Following facts are revealed in a comparison of data of DISE 2010-11 with that of DISE 2006 - 07.
Management wise enrolement in schools.
Overall enrolments in the State and in the Department of Education have marginally decreased during theperiod 2006-07 to 2010-11 at 1st standard, at LPS 1 to 5 HPS 1 to 7/8 and 1 to 10 standards.
Enrolments at 1st standard have marginally declined - overall in all management except in private unaidedschools ; the overall decline being a phenomenon of population declaration. There is a decrease of 71000students during the reference period. The enrolment at 1st standard in the State is 11.19 lakhs and it is 6.21lakhs in the Department of Education. Proportion of enrolments at 1st standard in the Department ofEducation is 55.50 percent of the total enrolments in the State.
Enrolments in 1 to 5 lower primary schools has marginally decreased from 57.24 lakhs to 54.15 lakhs.
Enrolments in 1 to 7 higher primary schools has marginally decreased from 78.26 lakhs to 74.25 lakhs.
Enrolments at the 8 to 10 high school stage has marginally decreased from 102.37 lakhs to 100.29 lakhs.
Enrolments have declined at all stages in schools of the Department of Education.
Enrolments at 6 to 8 standards have marginally appreciated at the Higher Primary Stage under allmanagements except at the Department of Education. There appears to be a marginal lateral shift from theschools of the Department of Education towards private unaided and aided schools.
Proportion of children in 1 to 5 , 6 to 8, 1 to 7 and 1 to 10 stages in the schools of the Department of Educationare 58.56, 55.38, 59.14 and 54.38 percent respectively, as a proportion of total enrolments at these stages inthe State.

41
TABLE 39
Enrolments in Schools by Management: Differential between 2006-07 and 2010-11
(in lakhs)
Source: DISE 2006-07, 2007-08, 2008-09, 2009-10.& 2010-11
Management Year 1st Std. 1 to 5 6 to 8 1 to 7 1 to 8 1 to 10
2006-07 7.69 38.48 18.73 53.05 57.21 63.312007-08 7.59 37.47 18.84 51.74 56.31 62.632008-09 7.02 35.62 18.01 48.96 53.63 60.012009-10 6.35 33.44 16.92 46.00 50.36 57.032010-11 6.21 31.71 16.43 43.91 48.14 54.54
1.48 6.77 2.30 9.14 9.07 8.772006-07 0.11 0.49 0.36 0.70 0.86 1.132007-08 0.08 0.39 0.34 0.59 0.73 0.952008-09 0.06 0.30 0.42 0.58 0.72 0.912009-10 0.04 0.21 0.49 0.53 0.70 0.942010-11 0.04 0.21 0.61 0.63 0.82 1.13
0.07 0.28 -0.25 0.07 0.04 0.002006-07 0.90 4.66 4.69 6.80 9.34 14.352007-08 0.87 4.48 4.47 6.50 8.95 14.042008-09 0.83 4.38 4.73 6.39 9.10 14.392009-10 0.91 4.73 4.91 6.90 9.63 15.152010-11 0.90 4.74 4.97 6.95 9.71 15.30
0.00 -0.08 -0.28 -0.15 -0.37 -0.952006-07 3.15 13.38 6.01 17.36 19.39 23.082007-08 3.01 13.20 6.09 17.23 19.28 23.082008-09 3.40 14.78 6.50 19.25 21.28 24.872009-10 3.72 15.97 6.95 20.77 22.92 26.682010-11 3.99 17.23 7.47 22.37 24.70 28.77
-0.84 -3.85 -1.46 -5.01 -5.31 -5.692006-07 0.05 0.23 0.17 0.35 0.40 0.502007-08 0.09 0.43 0.22 0.61 0.66 0.752008-09 0.07 0.35 0.25 0.52 0.60 0.742009-10 0.05 0.25 0.19 0.37 0.44 0.552010-11 0.05 0.25 0.20 0.39 0.45 0.57
0.00 -0.02 -0.03 -0.04 -0.05 -0.072006-07 11.90 57.24 29.96 78.26 87.20 102.372007-08 11.64 55.97 29.96 76.67 85.93 101.452008-09 11.38 55.43 29.91 75.70 85.33 100.922009-10 11.07 54.60 29.45 74.57 84.05 100.352010-11 11.19 54.15 29.69 74.25 83.82 100.29
0.71 3.09 0.27 4.01 3.38 2.08Increase / Decrease.
Unaided
Others
Total
Increase / Decrease.
Increase / Decrease.
Increase / Decrease.
Education Dept
Increase / Decrease.
S.W+LB
Aided
Increase / Decrease.
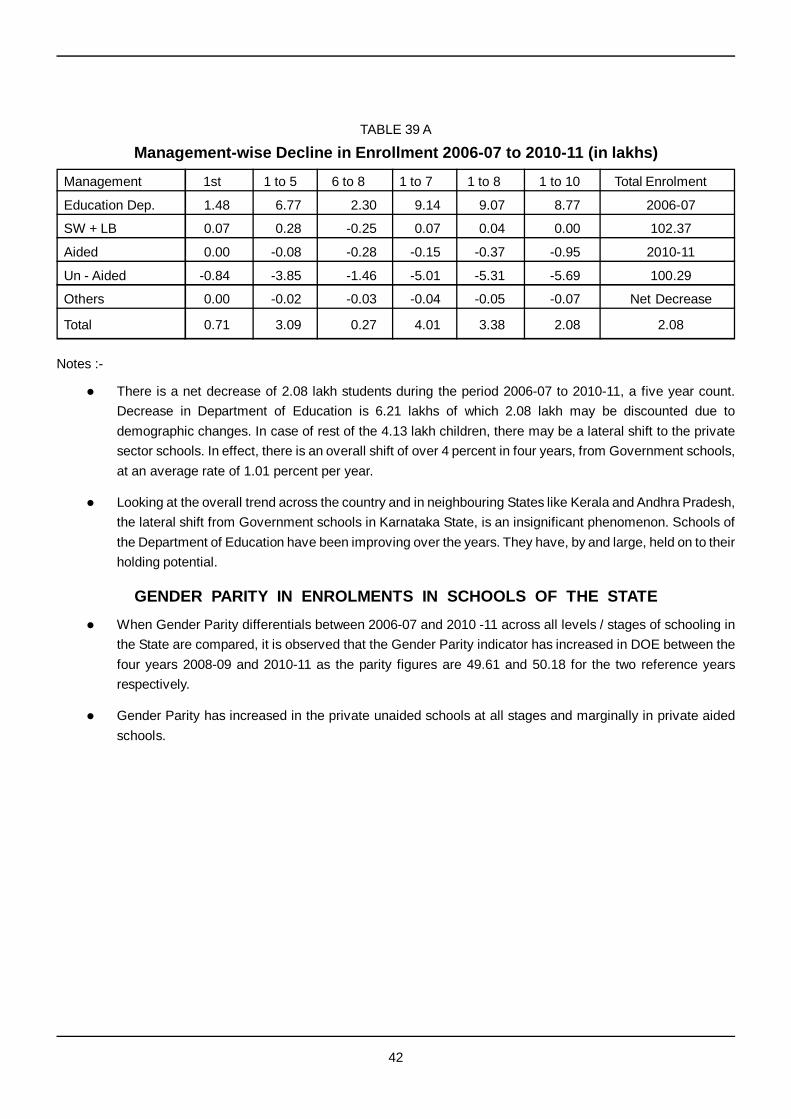
42
TABLE 39 A
Management-wise Decline in Enrollment 2006-07 to 2010-11 (in lakhs)
Management 1st 1 to 5 6 to 8 1 to 7 1 to 8 1 to 10 Total Enrolment
Education Dep. 1.48 6.77 2.30 9.14 9.07 8.77 2006-07
SW + LB 0.07 0.28 -0.25 0.07 0.04 0.00 102.37
Aided 0.00 -0.08 -0.28 -0.15 -0.37 -0.95 2010-11
Un - Aided -0.84 -3.85 -1.46 -5.01 -5.31 -5.69 100.29
Others 0.00 -0.02 -0.03 -0.04 -0.05 -0.07 Net Decrease
Total 0.71 3.09 0.27 4.01 3.38 2.08 2.08
Notes :-
There is a net decrease of 2.08 lakh students during the period 2006-07 to 2010-11, a five year count.Decrease in Department of Education is 6.21 lakhs of which 2.08 lakh may be discounted due todemographic changes. In case of rest of the 4.13 lakh children, there may be a lateral shift to the privatesector schools. In effect, there is an overall shift of over 4 percent in four years, from Government schools,at an average rate of 1.01 percent per year.
Looking at the overall trend across the country and in neighbouring States like Kerala and Andhra Pradesh,the lateral shift from Government schools in Karnataka State, is an insignificant phenomenon. Schools ofthe Department of Education have been improving over the years. They have, by and large, held on to theirholding potential.
GENDER PARITY IN ENROLMENTS IN SCHOOLS OF THE STATE When Gender Parity differentials between 2006-07 and 2010 -11 across all levels / stages of schooling in
the State are compared, it is observed that the Gender Parity indicator has increased in DOE between thefour years 2008-09 and 2010-11 as the parity figures are 49.61 and 50.18 for the two reference yearsrespectively.
Gender Parity has increased in the private unaided schools at all stages and marginally in private aidedschools.

43
Table 40
Enrolments of Girls in lakhs and Gender Parity in Percentages,2006- 07 to 2010-11.
Source: DISE 2006-07, 2007-08, 2008-09, 2009-10.& 2010-11
Notes :-
Gender-parity has crossed 50 percent within the Department of Education as reflected inenrolments at I, 1 to 5, 6 to 8, 1 to 7, 1 to 8 and1 to 10 standards. It is uniformly impressive.
Gender-Parity is lowest in private unaided schools on all counts. Minus sign indicates increase across the two reference years 2006-07 and 2010-11 while (no)
positive sign indicates decrease.
No. % No. % No. % No. % No. % No. %2006-07 3.80 49.41 19.13 49.71 9.23 49.28 26.32 49.61 28.37 49.59 31.41 49.612007-08 3.76 49.54 18.65 49.77 9.34 49.58 25.72 49.71 27.99 49.71 31.19 49.802008-09 3.50 49.82 17.77 49.88 8.94 49.63 24.39 49.82 26.71 49.79 29.93 49.882009-10 3.18 50.05 16.74 50.05 8.42 49.78 23.00 50.01 25.16 49.96 28.54 50.042010-11 3.11 50.05 15.92 50.21 8.20 50.01 22.02 50.16 24.13 50.12 27.37 50.18
0.69 -0.64 3.21 -0.50 1.03 -0.73 4.30 -0.55 4.24 -0.53 4.04 -0.572006-07 0.05 45.45 0.23 46.94 0.16 44.44 0.33 47.14 0.39 45.35 0.52 46.022007-08 0.04 50.00 0.18 46.15 0.17 49.12 0.27 45.76 0.34 46.58 0.46 48.422008-09 0.03 44.55 0.13 44.40 0.20 47.07 0.26 45.28 0.33 45.96 0.42 46.592009-10 0.02 46.37 0.10 44.75 0.23 47.61 0.25 46.53 0.33 46.76 0.44 47.312010-11 0.02 45.08 0.09 43.45 0.31 50.45 0.31 49.56 0.39 48.68 0.54 48.20
0.03 0.37 0.14 3.49 -0.15 -6.01 0.02 -2.42 0.00 -3.33 -0.02 -2.182006-07 0.44 48.89 2.30 49.36 2.21 47.12 3.33 48.97 4.51 48.29 6.86 47.802007-08 0.43 49.43 2.20 49.11 2.13 47.65 3.17 48.77 4.33 48.38 6.75 48.082008-09 0.41 49.35 2.15 49.08 2.26 47.85 3.13 48.95 4.41 48.44 6.90 47.932009-10 0.45 48.99 2.32 49.01 2.35 47.93 3.36 48.77 4.67 48.46 7.31 48.222010-11 0.44 48.93 2.31 48.67 2.38 47.94 3.37 48.40 4.69 48.29 7.40 48.39
0.00 -0.04 -0.01 0.69 -0.17 -0.82 -0.04 0.57 -0.18 0.00 -0.54 -0.592006-07 1.40 44.44 5.93 44.32 2.63 43.76 7.67 44.18 8.56 44.15 10.19 44.152007-08 1.34 44.52 5.88 44.55 2.70 44.33 7.67 44.52 8.57 44.45 10.25 44.412008-09 1.52 44.74 6.62 44.81 2.90 44.60 8.61 44.74 9.52 44.45 11.13 44.762009-10 1.67 44.80 7.13 44.65 30.78 44.29 9.26 44.57 10.92 47.65 11.87 44.482010-11 1.79 44.74 7.69 44.64 3.32 44.53 9.98 44.63 11.02 44.61 12.84 44.62
-0.39 -0.30 -1.76 -0.32 -0.69 -0.77 -2.31 -0.45 -2.46 -0.46 -2.65 -0.472006-07 0.02 40.00 0.11 47.83 0.07 41.18 0.16 45.71 0.18 45.00 0.22 44.002007-08 0.04 44.44 0.20 46.51 0.08 36.36 0.28 45.90 0.30 45.45 0.31 41.332008-09 0.03 45.18 0.16 44.65 0.11 43.70 0.23 44.00 0.27 44.25 0.33 44.552009-10 0.02 46.86 0.11 45.90 0.08 43.23 0.17 44.80 0.29 67.53 0.25 44.752010-11 0.02 45.67 0.12 46.10 0.08 42.29 0.18 44.85 0.20 44.42 0.25 43.93
0.00 -5.67 -0.01 1.73 -0.01 -1.11 -0.02 0.86 -0.02 0.58 -0.03 0.072006-07 5.71 47.98 27.70 48.39 14.30 47.73 37.81 48.31 42.01 48.18 49.20 48.062007-08 5.61 48.20 27.11 48.44 14.42 48.12 37.11 48.40 41.53 48.33 48.96 48.262008-09 5.49 48.21 26.82 48.40 14.41 48.17 36.62 48.38 41.24 48.32 48.71 48.272009-10 5.33 48.17 26.40 48.34 14.17 48.10 36.04 48.33 41.37 49.22 48.40 48.232010-11 5.38 48.03 26.13 48.26 14.31 48.21 35.86 48.29 40.44 48.24 48.40 48.25
0.33 -0.05 1.57 0.13 -0.01 -0.48 1.95 0.02 1.57 -0.06 0.80 -0.19
Class1 to 5 6 to 8 1 to 7 1 to 8 1 to 10Sl.
No. Management year Class 1
IIncr/Decr
IIncr/Decr
3 AIDED
Class Class Class Class
4
5 OTHERS
IIncr/Decr
IIncr/Decr
TOTAL6
1 DOE
SW+LB 2
IIncr/Decr
IIncr/Decr
UN-AIDED

44
Table 40 A
Decrease in Enrolments in the State from 2006-07 to 2010-11[Sex-wise and Total Tally]
All Management (Nos. in lakhs)
Ist Std. 1 to 5 1 to 7 1 to 10
2006-07 Boys 6.19 29.54 40.45 53.17
Girls 5.71 27.70 37.81 49.20
Total 11.90 57.24 78.26 102.37
2010-11 Boys 5.81 28.02 38.39 51.90
Girls 5.38 26.13 35.86 48.40
Total 11.19 54.15 74.25 100.30
Diff. 2006-07 to2010-11 (Nos.) Boys 0.38 1.52 2.06 1.27
Girls 0.33 1.57 1.95 0.80
Total 0.71 3.09 4.01 2.07
Percent Diff.2006-07 asBase Boys 6.14 5.15 5.09 2.39
Girls 5.78 5.67 5.16 1.63
Total 11.92 10.82 10.25 4.02
Notes :-
1. There is a decline everywhere. Hence, Minus sign is not used for the values
2. There have been steady decline in enrolments in the State over the years 2006-07 to 2010-11, a four yearcount. This is true at 1 to 10, 1 to 7, 1 to 5 stages and at Ist Standard. However it is at 1 to 5 stage that theproportion of decline is marginally higher for girls than for boys. Otherwise, decreases for girls are lowerthan that for boys everywhere and as compared to total enrolments. 1 to 5 reverse trend may be due to sex-related demographic incidence during 2000-01 to 2004-05, wherein number of girls ever born might havedeclined.

45
Tally of Schools in the State 2006-07 to 2010-11
Table 41 - Management increases / decreases in number of schools and theirpercentages
Between 2006-07 and 2010-11
Year Management LPS HPS Total HS Grand Total
2006-07 DOE 24547 19807 44354 3452 47806
AIDED 326 2173 2499 2633 5132
UNAIDED 3243 5468 8711 4133 12844
2007 - 08 DOE 24,877 19,972 44,849 4,138 48,987
AIDED 280 2,128 2,408 2,820 5,228
UNAIDED 3,361 5,050 8,411 4,567 12,978
2008 - 09 DOE 23,500 21,976 45,476 4,142 49,618
AIDED 272 2,177 2,449 2,997 5,446
UNAIDED 2,653 6,217 8,870 4,245 13,115
2009 - 10 DOE 23370 22278 45648 4168 49,816
AIDED 258 2343 2601 3273 5874
UNAIDED 2435 6842 9277 4579 13,856
2010-11 DOE 23109 22568 45677 4278 49955
AIDED 239 2418 2657 3367 6024
UNAIDED 2761 7491 10252 5259 15511
Diff. Incr. / Decr. 2006-07 to 2010-11 DOE -1438 2761 1323826 2149
AIDED -87 245 158 734 892
UNAIDED -482 2023 1541 1126 2667
Percentage Incr /Decr (2006-07to 2010-11) DOE -5.86 + 13.94 + 2.98 + 23.93 + 4.50
AIDED -26.69 + 11.27 + 6.32 + 27.88 + 17.38
UNAIDED -14.86 + 37.00 + 17.69 + 27.24 + 20.76
Source: DISE 2006-07, 2007-08, 2008-09, 2009-10 & 2010-11
Note :- Number of schools have increased in the State steadily over the years from 2006-07 to 2010-11. As of2010-11 there are 72875 schools across LPS / HPS / High Schools of all managements. 71490 schools are undermanagement of Department of Education as well as private aided and unaided managements. It is only at the LPSstage that there is a virtual decrease in number of schools. This may be because the LPS get upgraded into HPS. Inexceptional cases LPS schools have been closed because of less than 10 students in 1 to 5 standards due todemographic changes in certain remote habitations. This is a miniscule phenomenon.
" The private unaided schools have experienced a increase at the HPS & high school stage, while quite anumber of HS private unaided schools were brought under grant-in-aid during 2009-10.
" Overall the gain in number of schools inclusive of all schools is 4.50 percent 17.38 percent and 20.76percent respectively across DoE, Aided and Unaided managements.

46
Table 42
Tally of Number of Teachers- Sanctioned and working at Elementary and High schools byManagements between 2006-07 and 2010-11
Management Elementary school level 2006-07 2007-08 2008-09 2009-10 2010-11 Incr / Decr
DoE Sanctioned posts 187788 193600 200,621 201,109 202,483 1,374
Working 171473 180336 189,118 186,840 189,451 2,611
Vacant 16315 13264 11503 14,269 13,032 -1,237
Percent Gap 8.69 6.85 5.73 7.10 6.44 -0.66
SW + LB Sanctioned posts 3013 2540 3,161 3,699 4,305 606
Working 2547 2226 2,720 3,279 3,765 486
Vacant 466 314 441 420 540 120
Percent Gap 15.47 12.36 13.95 11.35 12.54 1.19
Aided Sanctioned posts 19387 17883 19,464 20,401 21,291 890
Working 16031 14586 15,236 16,521 17,229 708
Vacant 3356 3297 4228 3,880 4,062 182
Percent Gap 17.31 18.44 21.72 19.02 19.08 0.06
Total Sanctioned Teachers 210,188 214,023 223,246 225,209 228,079 2,870
Total Working Teachers 190,051 197,148 207,074 206,640 210,445 3,805
Total Vacant Teachers 20,137 16,875 16,172 18,569 17,634 -935
Management Secondary school level 2006-07 2007-08 2008-09 2009-10 2010-11 Incr / Decr
DoE Sanctioned posts 32247 35732 39,727 40,962 42,854 1,892
Working 27832 30459 33,933 34,767 37,752 2,985
Vacant 4,415 5,273 5,794 6,195 5,102 -1,093
Percent Gap 13.69 14.76 14.58 15.12 11.91 -3.22
SW + LB Sanctioned posts 1986 1659 2,054 2,711 3,439 728
Working 1647 1445 1,685 2,392 2,941 549
Vacant 339 214 369 319 498 179
Percent Gap 17.07 12.90 17.96 11.77 14.48 2.71
Aided Sanctioned posts 25055 24830 28,139 31,002 32,450 1,448
Working 22274 21833 24,045 26,771 28,348 1,577
Vacant 2,781 2,997 4,094 4,231 4,102 -129
Percent Gap 11.10 12.07 14.55 13.65 12.64 -1.01
Total Sanctioned Teachers 59,288 62,221 69,920 74,675 78,743 4,068
Total Working Teachers 51,753 53,737 59,663 63,930 69,041 5,111
Total Vacant Teachers 7,535 8,484 10,257 10,745 9,702 -1,043
Source: DISE 2006-07, 2007-08, 2008-09 ,2009-10. & 2010-11
There were 187788 teachers (sanctioned) in 2006-07 in Department of Education of the state. This figureincreased to 202483 during 2010-11, an increase of 14695 posts. Likewise this figure increased from32247 to 40962 in the state at the high school stage. There were 11503 vacancies of teachers during 2006-07 while it increased to 42854 during 2010-11. The percentage of gap between sanctioned and workingposts got decreased from 8.69 during 2006-07 to 6.44 during 2010-11, even after absorbing 2611additional posts during 2010-11.

47
708 additional posts were sanctioned for private aided schools during 2010-11. Coverage of additionalposts is for all eligible private schools which had been permitted (recognized) during the year 1993-94.
The number of vacant posts of teachers has decreased from 20137 during 2006-07 to 17634 during 2010-11 at the elementary stage across DoE, SW+LB and Aided schools.
There was already a gap of 6195 teachers that is the difference between sanctioned posts and workingteachers during 2009-10. Even after fresh recruitment of 1892 teachers during 2010-11 by the departmentof education at the high school stage, the number of vacancies stood at 5102. However the percentage gapbetween sanctioned and working teachers at the high school stage, Vacancies in department of educationdecreased from 15.12 percent to 11.40 percent even with absorption of 1892 additional sanctions during2010-11.
The government sanctioned 2863 additional teachers to private aided schools during 2010-11. With thisincrease and fresh recruitment for aided schools the percentage of gap between sanctioned posts andworking teachers at the high school stage decreased marginally from 13.65 percent during 2009-10 to12.64 percent during 2010-11.
Salary and other allowances from the state treasury was met for 272780 teachers working in governmentand aided schools at all levels during 2010-11. Such expenditures have been met for 270570 teachersduring 2009-10. An additional 2210 teachers came under government support during 2010-11.

48
PROGRESS of INFRASTRUCTURE FACILITIESClassroom in Elementary and High Schools 2008-09 and 2009-10
Table 43
Total Classrooms in Elementary Schools in descending order
1 BAGALKOT 6601 6,730 7,165 435 1 BAGALKOT 435
2 BANGALORE NORTH 2545 2,589 2,669 80 2 DHARWAD 390
3 BANGALORE RURAL 3822 3,763 3,668 -95 3 KOPPAL 331
4 BANGALORE SOUTH 3944 4,142 4,128 -14 4 KOLAR 289
5 BELGAUM 7250 7,612 7,570 -42 5 RAICHUR 253
6 BELLARY 7318 7,817 8,054 237 6 BELLARY 237
7 BIDAR 6310 6,609 6,762 153 7 DAKSHINA KANNADA 204
8 BIJAPUR 10108 10,100 10,174 74 8 GADAG 201
9 CHAMARAJANAGARA 3169 3,353 3,347 -6 9 MADHUGIRI 185
10 CHIKKABALLAPURA 4793 4,828 4,989 161 10 CHIKKABALLAPURA 161
11 CHIKKAMANGALORE 5611 5,535 5,668 133 11 BIDAR 153
12 CHIKKODI 8174 8,731 8,626 -105 12 DAVANAGERE 143
13 CHITRADURGA 6737 6,566 6,698 132 13 HAVERI 135
14 DAKSHINA KANNADA 5092 5,121 5,325 204 14 CHIKKAMANGALORE 133
15 DAVANAGERE 6190 6,547 6,690 143 15 CHITRADURGA 132
16 DHARWAD 5543 5,932 6,322 390 16 YADAGIRI 122
17 GADAG 3669 3,708 3,909 201 17 MANDYA 119
18 GULBARGA 8832 9,705 9,363 -342 18 SHIMOGA 100
19 HASSAN 7796 8,184 8,126 -58 19 RAMANAGARA 86
20 HAVERI 5746 6,103 6,238 135 20 BANGALORE NORTH 80
21 KODAGU 2000 2,009 2,016 7 21 BIJAPUR 74
22 KOLAR 5676 5,664 5,953 289 22 MYSORE 55
23 KOPPAL 4403 4,650 4,981 331 23 UDUPI 23
24 MADHUGIRI 4241 4,282 4,467 185 24 KODAGU 7
25 MANDYA 6584 6,718 6,837 119 25 CHAMARAJANAGARA -6
26 MYSORE 7970 8,184 8,239 55 26 BANGALORE SOUTH -14
27 RAICHUR 5758 6,943 7,196 253 27 TUMKUR -29
28 RAMANAGARA 4268 4,278 4,364 86 28 BELGAUM -42
29 SHIMOGA 6933 7,036 7,136 100 29 HASSAN -58
30 TUMKUR 6715 6,860 6,831 -29 30 BANGALORE RURAL -95
31 UDUPI 2905 2,972 2,995 23 31 CHIKKODI -105
32 UTTARA KANNADA 6470 7,332 3,630 -3,702 32 GULBARGA -342
33 YADAGIRI 5768 4,235 4,357 122 33 UTTARA KANNADA -3,702
34 UTTARA KANNADA SIRSI 0 0 3,922 3,922
TOTAL 188,941 194,838 198,415 3,577 Total -345
Sl.No.
District NameTotalClassrooms2008-09
TotalClassrooms2009-10
Total Classrooms2010-11
Increaseduring the
year2010-11
In Descending Order
Sl.No.
District NameIncrease
during theyear 2010-11

49
Table 44
Total Classrooms in High Schools in Descending order
1 BAGALKOT 388 606 629 23 1 DHARWAD 1152 BANGALORE NORTH 200 339 369 30 2 RAICHUR 1073 BANGALORE RURAL 248 369 347 -22 3 YADAGIRI 804 BANGALORE SOUTH 168 491 565 74 4 HAVERI 775 BELGAUM 242 744 542 -202 5 BANGALORE SOUTH 746 BELLARY 494 818 875 57 6 GADAG 697 BIDAR 325 621 613 -8 7 BELLARY 578 BIJAPUR 274 527 505 -22 8 DAVANAGERE 449 CHAMARAJANAGARA 195 395 387 -8 9 MADHUGIRI 3610 CHIKKABALLAPURA 270 586 572 -14 10 DAKSHINA KANNADA 3411 CHIKKAMANGALORE 367 580 573 -7 11 BANGALORE NORTH 3012 CHIKKODI 253 650 598 -52 12 BAGALKOT 2313 CHITRADURGA 330 508 478 -30 13 TUMKUR 1914 DAKSHINA KANNADA 428 660 694 34 14 KODAGU 1715 DAVANAGERE 404 791 835 44 15 RAMANAGARA 1416 DHARWAD 197 380 495 115 16 MANDYA 1117 GADAG 167 329 398 69 17 KOPPAL 718 GULBARGA 435 1,238 1,209 -29 18 MYSORE 519 HASSAN 791 1,123 1,053 -70 19 UDUPI 520 HAVERI 230 459 536 77 20 KOLAR -621 KODAGU 137 184 201 17 21 CHIKKAMANGALORE -722 KOLAR 307 663 657 -6 22 BIDAR -823 KOPPAL 301 568 575 7 23 CHAMARAJANAGARA -824 MADHUGIRI 213 393 429 36 24 SHIMOGA -925 MANDYA 642 1,058 1,069 11 25 CHIKKABALLAPURA -1426 MYSORE 570 1,042 1,047 5 26 BANGALORE RURAL -2227 RAICHUR 306 751 858 107 27 BIJAPUR -2228 RAMANAGARA 299 477 491 14 28 GULBARGA -2929 SHIMOGA 434 753 744 -9 29 CHITRADURGA -3030 TUMKUR 324 625 644 19 30 CHIKKODI -5231 UDUPI 379 544 549 5 31 HASSAN -7032 UTTARA KANNADA 252 496 204 -292 32 BELGAUM -20233 YADAGIRI 375 490 570 80 33 UTTARA KANNADA -29234 UTTARA KANNADA SIRSI 0 0 313 313
TOTAL 10945 20,258 20,624 366 TOTAL 53
Sl.No. District Name
TotalClass
rooms2008-09
TotalClass
rooms2009-10
TotalClassrooms2010-11
Increaseduring
the year2010-11
In Descending Order
Sl.No. District Name
Increaseduring the
year 2010-11
Notes:-There is an increase of 3577 classrooms at the elementary level and 366 classrooms at the high school level in the
State. In spite of this increase, there are a few districts where the number of classrooms have reduced during the year2010-11 as compared to that in 2009-10. This is because of carried over classrooms in dilapidated condition which wereultimately declared unfit for use.
Sirsi was not a district in 2009-10. It was part of Uttara Kannada district. Together, the Uttara Kannada (Karwar)and Sirsi districts have gained 220 classrooms. The minus sign of -3702 against Uttara Kannada in the last columnneeds to be ignored. This is true of high schools also.

50
Notes :- The Male, Female and Total Literacy Rates in India are 82.14, 65.46 and 74.04 percent respectively.
The Male, Female and Total Literacy Rates in Karnataka are 82.67, 68.13 and 75.60 percent, respectively.
Among 19 major States literacy rate rank of Karnataka is 09 in 2011.
Mal
ePe
rson
sRa
nkLi
tera
cyR
ate
Rank
Lite
racy
Rat
eRa
nkFe
mal
eLi
tera
cyR
ate
Stat
e /
UT
Cod
eIn
dia
/ Sta
te /
Uni
on T
errit
ory*
Indi
a / S
tate
/ U
nion
Ter
ritor
y*In
dia
/ Sta
te /
Uni
on T
errit
ory*
Indi
a / S
tate
/ U
nion
Ter
ritor
y*Li
tera
cy R
ate
Rank
2001
2011
2001
2011
Tabl
e 45
LITE
RA
CY
RAT
ES a
nd R
AN
KS
in IN
DIA
, 201
1 C
ENSU
S
1Ke
rala
93.9
11
Iaksh
adw
eep
96.11
1Ke
rala
91.9
8M
ajor
Sta
tes
2La
ksha
dwee
p92
.28
2Ke
rala
96.0
22
Miz
oram
89.4
01
Kera
la90
.86
93.9
11
1
3M
izor
am91
.58
3M
izor
am93
.72
3La
ksha
dwee
p88
.25
2N
CT
of D
elhi
*81
.67
86.3
46
9
4Tr
ipur
a87
.75
4G
oa92
.81
4Tr
ipur
a83
.15
3M
ahar
asht
ra76
.88
82.9
110
12
5G
oa87
.40
5Tr
ipur
a92
.18
5G
oa81
.84
4Ta
mil N
adu
73.4
580
.33
1214
6D
aman
&Diu
’87
.07
6Pu
duch
erry
*92
.12
6An
dam
an &
Nic
obar
Isla
nds*
81.8
45
Guj
arat
69.1
479
.31
1618
7Pu
duch
erry
86.5
57
Dam
an &
Diu
*91
.48
7C
hand
igar
h81
.38
6W
est B
enga
l68
.64
77.0
818
20
8C
hand
igar
h86
.43
8N
CTo
fDel
hi*
91.0
38
Pudu
cher
ry*
81.2
27
Punj
ab69
.65
76.6
815
21
9N
CTo
fDel
hi86
.34
9H
imac
hal P
rade
sh90
.83
9N
CT
of D
elhi
*80
.93
8H
arya
na67
.91
76.6
419
22
10An
dam
an &
Nic
obar
Isla
nds
86.2
710
Cha
ndig
arh
90.5
410
Dam
an&D
iu*
79.5
99
Karn
atak
a66
.64
75.6
021
23
11H
imac
hal P
rade
sh83
.78
11An
dam
an &
Nic
obar
Isla
nds*
90.11
11N
agal
and
76.6
910
Oris
sa63
.08
73.4
526
25
12M
ahar
asht
ra82
.91
12M
ahar
asht
ra89
.82
12H
imac
hal P
rade
sh76
.60
11As
sam
63.2
573
.18
2526
13Si
kkim
82.2
013
Utta
rakh
and
88.3
313
Sikk
im76
.43
12C
hhat
tisga
rh64
.66
71.0
423
27
14Ta
mil N
adu
80.3
314
Sikk
im87
.29
14M
ahar
asht
ra75
.49
13M
adhy
a Pr
ades
h63
.74
70.6
324
28
15N
agal
and
8O.11
15G
ujar
at87
.23
15Ta
milN
adu
73.8
614
Utta
r Pra
desh
56.2
769
.72
3129
16M
anip
ur79
.85
16Ta
mil N
adu
86.8
116
Meg
hala
ya73
.78
15Ja
mm
u &
Kash
mir
55.5
268
.74
3230
17U
ttara
khan
d79
.63
17M
anip
ur86
.49
17M
anip
ur73
.17
16An
dhra
Pra
desh
60.4
767
.66
2831
18G
ujar
at79
.31
18D
adra
& N
agar
Hav
eli*
86.4
618
Punj
ab71
.34
17Jh
arkh
and
53.5
667
.63
3432
19D
adra
& N
agar
Hav
eli
77.6
519
Har
yana
85.3
819
Wes
t Ben
gal
71.1
618
Raj
asth
an60
.41
67.0
629
33
20W
est B
enga
l77
.08
20N
agal
and
83.2
920
Guj
arat
70.7
319
Biha
r47
.00
63.8
235
35
21Pu
njab
76.6
821
Karn
atak
a82
.85
21U
ttara
khan
d70
.70
UN
ION
TER
RIT
OR
IES
& S
mal
l Sta
tes
22H
arya
na76
.64
22W
est B
enga
l82
.67
22Ka
rnat
aka
68.1
31
Laks
hadw
eep”
86.6
692
.28
32
23Ka
rnat
aka
75.6
023
Oris
sa82
.40
23As
sam
67.2
72
Miz
oram
88.8
091
,58
23
24M
egha
laya
75.4
824
Punj
ab81
.48
24H
arya
na66
.77
3Tr
ipur
a73
.19
87.7
513
4
25O
rissa
73.4
525
Chh
attis
garh
81.4
525
Dad
ra &
Nag
ar H
avel
i*65
.93
4G
oa82
.01
87.4
04
5
26As
sam
73.1
826
Mad
hya
Prad
esh
80.5
326
Oris
sa64
.36
5D
aman
& D
iu*
78.1
887
.07
96
27C
hhat
tisga
rh71
.04
27R
ajas
than
80.5
127
Chh
attis
garh
60.5
96
Pudu
cher
ry*
81.2
486
.55
87
28M
adhy
a Pr
ades
h70
.63
28U
ttar P
rade
sh79
.24
28M
adhy
a Pr
ades
h60
.02
7C
hand
igar
h*81
.94
86.4
35
8
29U
ttar P
rade
sh69
.72
29As
sam
78.8
129
Andh
ra P
rade
sh59
.74
8An
dam
an &
Nic
obar
IsIa
nds*
81.3
086
.27
710
30Ja
mm
u &
Kash
mir
68.7
430
Jhar
khan
d78
.45
30Ar
unac
hal P
rade
sh59
.57
9H
imac
hal P
rade
sh76
.48
83.7
811
11
31An
dhra
Pra
desh
67.6
631
Jam
mu
& Ka
shm
ir78
.26
31U
ttar P
rade
sh59
.26
10Si
kkim
68.8
182
.20
1713
32Jh
arkh
and
67.6
332
Meg
hala
ya77
.17
32Ja
mm
u &
Kash
mir
58.0
111
Nag
alan
d66
.59
80.11
2015
33R
ajas
than
67.0
633
Andh
ra P
rade
sh75
.56
33Jh
arkh
and
56.2
112
Man
ipur
69.9
379
.85
2216
34Ar
unac
hal P
rade
sh66
.95
34Ar
unac
hal P
rade
sh73
.69
34Bi
har
53.3
313
Utta
rakh
and
71.6
279
.63
1417
35Bi
har
63.8
235
Biha
r73
.39
35R
ajas
than
52.6
614
Dad
ra &
Nag
ar H
avel
i*57
.63
77.6
530
19
IND
IA74
.04
-82
.14
-65
.46
15M
egha
laya
62.5
675
.48
2724
16Ar
unac
hal P
rade
sh54
.34
66.9
533
34


53
Notes :-
Chikkaballapura, Ramanagara and Yadgiri were not districts in 2001. They were located in Kolar,Bangalore Rural and Gulbarga districts.
State’s average gain is 9.04 percent during the two reference years 2001 and 2011. 15 districts havegained above the State average. If base year 2001 figure is high, gain will be less. Districts like Gulbarga,Bagalkot, Raichur, Chamarajnagar, Bijapur and Bidar had recorded lower rates in 2001. Their gain isconsiderable.
Table 46
1 Gulbarga 65.65 50.01 15.642 Bangatore Rural 78.29 64.7 13.593 Bagalkot 69.39 57.3 12.094 Raichur 60.46 48.81 11.655 Kolar 74.33 62.84 11.496 Chamarajnagar 61.12 50.87 10.257 Bijapur 67.2 57.01 10.198 Bidar 71.01 60.94 10.079 Bellary 67.28 57.4 9.8810 Haveri 77.6 67.79 9.8111 Belgaum 73.94 64.42 9.5212 Chitraclurga 73.82 64.45 9.3713 Mandya 70.14 61.05 9.0914 Mysore 72.56 63.48 9.0815 Gadag 75.18 66.11 9.0716 Dharwad 80.3 71.61 8.6917 Uttara Kannada 84.03 76.6 7.4318 Tumkur 74.32 67.01 7.3119 Davangere 76.3 67.43 7.2620 Hassan 75.89 68.63 7.2621 Chikmagalur 79.24 72.2 7.0422 Shimoga 80.5 74.52 5.9823 Bangalore 88.48 82.96 5.5224 Dakshina Kannada 88.62 83.35 5.2725 Udupi 86.29 81.25 5.0426 Kodagu 82.52 77.99 4.5327 Chikkaballapur 70.08 0 028 Ramanagara 69.2 0 029 Yadgir 52.36 0 0
STATE 75.60 66.64 9.04
Districs by Literacy rates [ in percentages]GAIN ( in
Desc.order)
Districts LR 2011 LR 2001Sl No.


55
Table 47(all figures in lakhs)
Notes :-
Population of the State has increased from 528.51 to 611.31 lakhs during the 10 years following 2001.
There were 152.33 lakh illiterates in 2011. This figure has decreased to 132.46 lakh illiterates in 2011,recording a net decrease of 19.88 lakhs.
There is an insignificant decrease in population of Chikmagalur district.
There is an increase of illiterates in Bangalore Urban district. This may be accounted by in-migration ofunskilled, illiterate labour
1 BELGAUM 42.15 47.78 5.64 12.85 10.88 1.982 BAGALKOT 16.52 18.91 2.39 5.92 4.98 0.943 BIJAPUR 18.07 21.75 3.68 6.54 6.14 0.404 BIDAR 15.02 17.00 1.98 4.93 4.30 0.635 RAICHUR 16.70 19.25 2.55 7.10 6.53 0.576 KOPPAL 11.96 13.91 1.95 4.53 3.92 0.627 GADAG 9.72 10.65 0.93 2.83 2.33 0.508 DHARWAD 16.04 18.47 2.43 3.94 3.22 0.719 UTTARA KANNADA 13.54 14.37 0.83 2.76 2.06 0.7010 HAVERI 14.39 15.99 1.59 3.98 3.16 0.8211 BELLARY 20.27 25.32 5.05 7.28 7.04 0.2312 CHITRADURGA 15.18 16.60 1.42 4.66 3.88 0.7813 DAVANAGERE 17.91 19.47 1.56 5.05 4.12 0.9314 SHIMOGA 16.43 17.56 1.13 3.66 3.08 0.5815 UDUPI 11.12 11.78 0.66 1.87 1.48 0.4016 CHIKMAGALUR 11.41 11.38 -0.03 2.79 2.15 0.6317 TUMKUR 25.85 26.81 0.97 7.52 6.24 1.2918 BANGALORE 65.37 95.89 30.52 9.80 9.90 -0.1019 MANDYA 17.64 18.09 0.45 6.08 4.92 1.1620 HASSAN 17.22 17.76 0.55 4.78 3.91 0.8721 DAKSHINA KANNADA 18.98 20.84 1.86 2.77 2.14 0.6322 KODAGU 5.49 5.55 0.06 1.05 0.88 0.1823 MYSORE 26.41 29.95 3.54 8.46 7.43 1.0324 CHAMARAJANAGAR 9.65 10.21 0.56 4.17 3.60 0.5725 GULBARGA 21.75 25.65 3.90 12.98 7.60 5.3726 YADGIR 9.56 11.73 2.17 0.00 4.70 -4.7027 KOLAR 13.87 15.40 1.53 8.18 3.54 4.6528 CHIKKABALLAPURA 11.49 12.54 1.05 0.00 3.38 -3.3829 BANGALORE RURAL 8.51 9.87 1.36 5.84 1.92 3.9230 RAMANAGARA 10.31 10.83 0.52 0.00 3.02 -3.02
State Total 528.51 611.31 82.80 152.33 132.46 19.88
2001 2011 Diff.Population
2001Population
2011Diff.
No. of IlliteratesSl.No. State/District


57
ANNEXURES

58
Annexure - 1 A District wise / Management wise Elementary Schools (LPS+HPS) 59Annexure - 1 B District wise / Management wise Lower Primary Schools (LPS) 60Annexure - 1 C District wise / Management wise Higher Primary Schools (HPS) 61Annexure - 1 D District wise / Management wise Number of Upper Primary Schools having Class 8th 62Annexure - 1 E District wise / Management wise High Schools 63Annexure - 2 A Division wise /District wise / Management wise Elementary Schools (LPS+HPS) 64Annexure - 2 B Division wise / District wise / Management wise Lower Primary Schools (LPS) 65Annexure - 2 C Division wise / District wise / Management wise Upper Primary Schools (HPS) 66Annexure - 2 D Division Wise / District wise / Management wise Upper Primary Schools
(HPS) having Class 8th 67Annexure - 2 E Division wise / District wise / Management wise High Schools 68Annexure - 3 A District-wise Ration of Lower Primary Schools to Upper Primary Schools
(Govt and Aided Schools only) 69Annexure - 3 B District-wise Ration of Upper Primary Schools to High Schools (Govt and Aided Schools only) 70Annexure - 4 A Management wise/ Class wise/ Category wise/Sex wise Enrolment - All Management Schools 71Annexure - 4 B Management wise/ Class wise/ Category wise/Sex wise Enrolment -
Education Department Schools 72Annexure - 4 C Management wise/ Class wise/ Category wise/Sex wise Enrolment -
Social Welfare Department Schools 73Annexure - 4 D Management wise/ Class wise/ Category wise/Sex wise Enrolment - Local Body Schools 74Annexure - 4 E Management wise/ Class wise/ Category wise/Sex wise Enrolment - Aided Schools 75Annexure - 4 F Management wise/ Class wise/ Category wise/Sex wise Enrolment - Un-Aided Schools 76Annexure - 4 G Management wise/ Class wise/ Category wise/Sex wise Enrolment - Central Schools 77Annexure - 4 H Management wise/ Class wise/ Category wise/Sex wise Enrolment -
Other Management Schools 78Annexure - 5 A District wise / Class wise/ Sex wise Enrolment in all Management Schools 79Annexure - 5 B District wise / Level wise/ Sex wise Enrolment in all Management Schools 80Annexure - 6 A District wise / Class Wise Enrolment in All Management Schools 81Annexure - 6 B Distribution of Enrolment over the Class in All Management Schools 82Annexure - 7 A Management wise Sanctioned post and Working Teachers - Lower Primary Schools 83Annexure - 7 B Management wise Sanctioned post and Working Teachers - Upper Primary Schools 84Annexure - 7 C Management wise Sanctioned post and Working Teachers - Elementary Schools 85Annexure - 7 D Management wise Sanctioned post and Working Teachers - High Schools 86Annexure - 8 A District Wise Pupil Teacher Ratio in Education Department (Teachers Sanctioned) -
Descending Order 87Annexure - 8 B District Wise Pupil Teacher Ratio in Education Department (Teachers Working) -
Descending Order 88Annexure - 9 A Management wise / Geder wise Teachers Details - Lower Primary Schools 89Annexure - 9 B Management wise / Geder wise Teachers Details - Upper Primary Schools 90Annexure - 9 C Management wise / Geder wise Teachers Details - Elementary Schools 91Annexure - 9 D Management wise / Geder wise Teachers Details - High Schools 92Annexure - 10 A District wise Education Department Lower Primary Schools Infrastrature Facilities 93Annexure - 10 B District wise Education Department Upper Primary Schools Infrastrature Facilities 94Annexure - 10 C District wise Education Department Elementary Schools Infrastrature Facilities 95Annexure - 10 D District wise Education Department High Schools Infrastrature Facilities 96Annexure - 11 A Building Condition, Classrooms and other Rooms Details in Lower Primary Schools -
Education Department 97Annexure - 11 B Building Condition, Classrooms and other Rooms Details in Upper Primary Schools -
Education Department 98Annexure - 11 C Building Condition, Classrooms and other Rooms Details in Eelementary Schools -
Education Department 99Annexure - 11 D Building Condition, Classroomsand other Rooms Details in High Schools - Education Department 100
ANNEXURES
Annexure Details Page No.

59
Annexure - 1 A
District wise / Management wise Elementary Schools (LPS+HPS)
1 BAGALKOT 1,315 18 0 1,333 63 288 2 0 1,6862 BANGALORE RURAL 1,138 4 0 1,142 12 162 1 1 1,3183 BANGALORE U NORTH 516 4 7 527 202 902 6 12 1,6494 BANGALORE U SOUTH 904 7 8 919 217 1,328 5 11 2,4805 BELGAUM 1,427 13 1 1,441 54 248 4 0 1,7476 BELGAUM CHIKKODI 1,858 26 1 1,885 84 449 5 0 2,4237 BELLARY 1,366 28 0 1,394 68 427 4 0 1,8938 BIDAR 1,290 17 1 1,308 175 399 2 0 1,8849 BIJAPUR 1,886 24 0 1,910 152 439 3 1 2,50510 CHAMARAJANAGARA 780 30 0 810 39 112 3 0 96411 CHIKKABALLAPURA 1,579 17 0 1,596 34 246 4 0 1,88012 CHIKKAMANGALORE 1,513 32 0 1,545 26 185 2 1 1,75913 CHITRADURGA 1,708 26 0 1,734 76 200 1 0 2,01114 DAKSHINA KANNADA 933 23 0 956 229 266 3 0 1,45415 DAVANAGERE 1,377 22 0 1,399 137 348 2 0 1,88616 DHARWAD 773 12 5 790 93 254 4 0 1,14117 GADAG 618 13 2 633 36 143 2 1 81518 GULBARGA 1,806 33 0 1,839 156 468 3 0 2,46619 HASSAN 2,597 34 0 2,631 43 295 2 0 2,97120 HAVERI 1,166 27 9 1,202 47 190 3 0 1,44221 KODAGU 406 18 3 427 12 92 3 1 53522 KOLAR 1,886 16 0 1,902 39 273 2 1 2,21723 KOPPAL 964 20 0 984 15 217 2 1 1,21924 MANDYA 1,813 25 0 1,838 35 294 1 0 2,16825 MYSORE 1,959 45 4 2,008 109 477 5 0 2,59926 RAICHUR 1,497 28 0 1,525 37 341 2 0 1,90527 RAMANAGARA 1,401 23 0 1,424 31 171 0 0 1,62628 SHIMOGA 1,921 21 0 1,942 73 311 2 0 2,32829 TUMKUR 2,252 18 0 2,270 56 246 2 0 2,57430 TUMKUR MADHUGIRI 1,314 19 0 1,333 8 108 1 0 1,45031 UDUPI 618 10 1 629 225 118 1 0 97332 UTTARA KANNADA 995 4 0 999 28 64 3 2 1,09633 UTTARA KANNADA SIRSI 1,166 11 0 1,177 16 48 2 0 1,24334 YADAGIRI 935 13 0 948 30 143 0 0 1,121
TOTAL 45,677 681 42 46,400 2,657 10,252 87 32 59,428
Source: DISE 2010-11 E-Govenace Unit, SSA, Bangalore
Sl.No.
Government Schools GovernmentAided
Schools
OtherManagement
SchoolsCentralSchools
TotalSchoolsDoE
SocialWelfare
LocalBody TOTAL
Dsitrict Name Un-AidedSchools
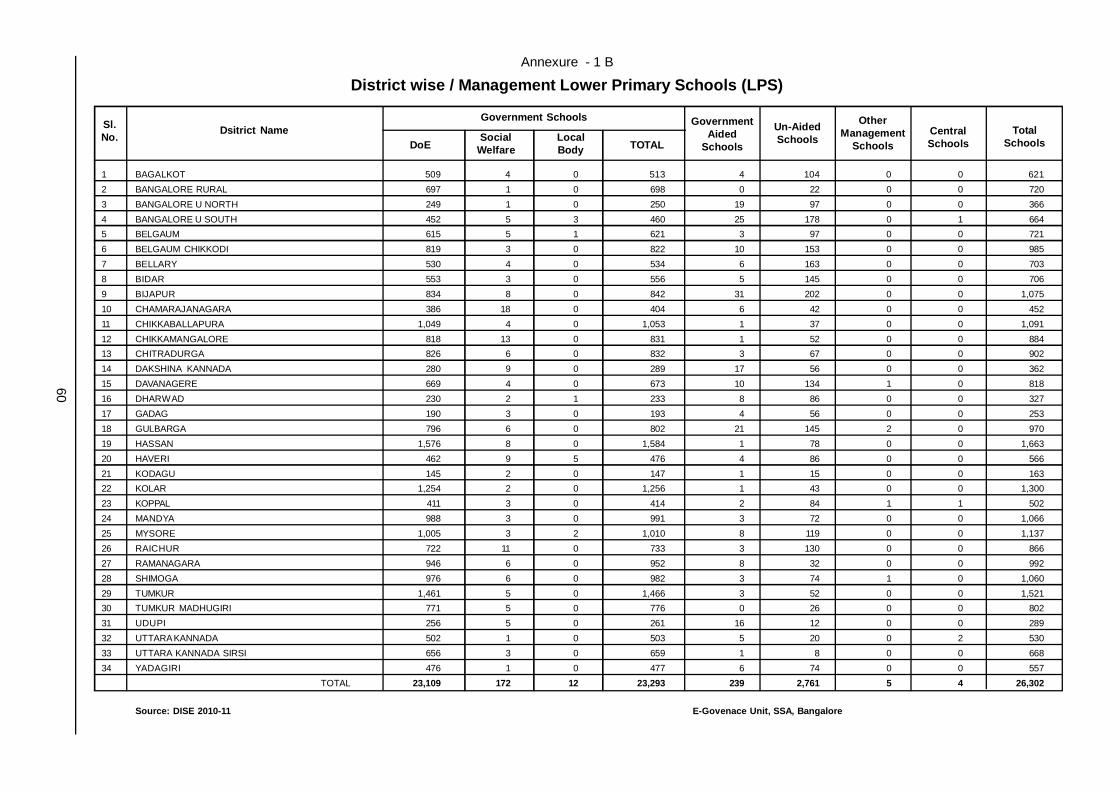
60
Annexure - 1 B
District wise / Management Lower Primary Schools (LPS)
E-Govenace Unit, SSA, BangaloreSource: DISE 2010-11
Sl.No.
Government Schools GovernmentAided
Schools
OtherManagement
SchoolsCentralSchools
TotalSchoolsDoE
SocialWelfare
LocalBody TOTAL
Dsitrict Name Un-AidedSchools
1 BAGALKOT 509 4 0 513 4 104 0 0 6212 BANGALORE RURAL 697 1 0 698 0 22 0 0 7203 BANGALORE U NORTH 249 1 0 250 19 97 0 0 3664 BANGALORE U SOUTH 452 5 3 460 25 178 0 1 6645 BELGAUM 615 5 1 621 3 97 0 0 7216 BELGAUM CHIKKODI 819 3 0 822 10 153 0 0 9857 BELLARY 530 4 0 534 6 163 0 0 7038 BIDAR 553 3 0 556 5 145 0 0 7069 BIJAPUR 834 8 0 842 31 202 0 0 1,07510 CHAMARAJANAGARA 386 18 0 404 6 42 0 0 45211 CHIKKABALLAPURA 1,049 4 0 1,053 1 37 0 0 1,09112 CHIKKAMANGALORE 818 13 0 831 1 52 0 0 88413 CHITRADURGA 826 6 0 832 3 67 0 0 90214 DAKSHINA KANNADA 280 9 0 289 17 56 0 0 36215 DAVANAGERE 669 4 0 673 10 134 1 0 81816 DHARWAD 230 2 1 233 8 86 0 0 32717 GADAG 190 3 0 193 4 56 0 0 25318 GULBARGA 796 6 0 802 21 145 2 0 97019 HASSAN 1,576 8 0 1,584 1 78 0 0 1,66320 HAVERI 462 9 5 476 4 86 0 0 56621 KODAGU 145 2 0 147 1 15 0 0 16322 KOLAR 1,254 2 0 1,256 1 43 0 0 1,30023 KOPPAL 411 3 0 414 2 84 1 1 50224 MANDYA 988 3 0 991 3 72 0 0 1,06625 MYSORE 1,005 3 2 1,010 8 119 0 0 1,13726 RAICHUR 722 11 0 733 3 130 0 0 86627 RAMANAGARA 946 6 0 952 8 32 0 0 99228 SHIMOGA 976 6 0 982 3 74 1 0 1,06029 TUMKUR 1,461 5 0 1,466 3 52 0 0 1,52130 TUMKUR MADHUGIRI 771 5 0 776 0 26 0 0 80231 UDUPI 256 5 0 261 16 12 0 0 28932 UTTARA KANNADA 502 1 0 503 5 20 0 2 53033 UTTARA KANNADA SIRSI 656 3 0 659 1 8 0 0 66834 YADAGIRI 476 1 0 477 6 74 0 0 557
TOTAL 23,109 172 12 23,293 239 2,761 5 4 26,302

61
Sl.No.
Government Schools GovernmentAided
Schools
OtherManagement
SchoolsCentralSchools
TotalSchoolsDoE
SocialWelfare
LocalBody TOTAL
Dsitrict Name Un-AidedSchools
Annexure - 1 C
District wise / Management wise Upper Primary Schools (HPS)
E-Govenace Unit, SSA, BangaloreSource: DISE 2010-11
1 BAGALKOT 806 14 0 820 59 184 2 0 1,0652 BANGALORE RURAL 441 3 0 444 12 140 1 1 5983 BANGALORE U NORTH 267 3 7 277 183 805 6 12 1,2834 BANGALORE U SOUTH 452 2 5 459 192 1,150 5 10 1,8165 BELGAUM 812 8 0 820 51 151 4 0 1,0266 BELGAUM CHIKKODI 1,039 23 1 1,063 74 296 5 0 1,4387 BELLARY 836 24 0 860 62 264 4 0 1,1908 BIDAR 737 14 1 752 170 254 2 0 1,1789 BIJAPUR 1,052 16 0 1,068 121 237 3 1 1,43010 CHAMARAJANAGARA 394 12 0 406 33 70 3 0 51211 CHIKKABALLAPURA 530 13 0 543 33 209 4 0 78912 CHIKKAMANGALORE 695 19 0 714 25 133 2 1 87513 CHITRADURGA 882 20 0 902 73 133 1 0 1,10914 DAKSHINA KANNADA 653 14 0 667 212 210 3 0 1,09215 DAVANAGERE 708 18 0 726 127 214 1 0 1,06816 DHARWAD 543 10 4 557 85 168 4 0 81417 GADAG 428 10 2 440 32 87 2 1 56218 GULBARGA 1,010 27 0 1,037 135 323 1 0 1,49619 HASSAN 1,021 26 0 1,047 42 217 2 0 1,30820 HAVERI 704 18 4 726 43 104 3 0 87621 KODAGU 261 16 3 280 11 77 3 1 37222 KOLAR 632 14 0 646 38 230 2 1 91723 KOPPAL 553 17 0 570 13 133 1 0 71724 MANDYA 825 22 0 847 32 222 1 0 1,10225 MYSORE 954 42 2 998 101 358 5 0 1,46226 RAICHUR 775 17 0 792 34 211 2 0 1,03927 RAMANAGARA 455 17 0 472 23 139 0 0 63428 SHIMOGA 945 15 0 960 70 237 1 0 1,26829 TUMKUR 791 13 0 804 53 194 2 0 1,05330 TUMKUR MADHUGIRI 543 14 0 557 8 82 1 0 64831 UDUPI 362 5 1 368 209 106 1 0 68432 UTTARA KANNADA 493 3 0 496 23 44 3 0 56633 UTTARA KANNADA SIRSI 510 8 0 518 15 40 2 0 57534 YADAGIRI 459 12 0 471 24 69 0 0 564
TOTAL 22,568 509 30 23,107 2,418 7,491 82 28 33,126

62
Sl.No.
Government Schools GovernmentAided
Schools
OtherManagement
SchoolsCentralSchools
TotalSchoolsDoE
SocialWelfare
LocalBody TOTAL
Dsitrict Name Un-AidedSchools
Annexure - 1 D
District wise / Management wise Number of Upper Primary Schools having Class 8th
E-Govenace Unit, SSA, BangaloreSource: DISE 2010-11
1 BAGALKOT 166 0 0 166 0 2 0 0 1682 BANGALORE RURAL 75 0 0 75 0 4 0 0 793 BANGALORE U NORTH 54 0 0 54 0 17 0 0 714 BANGALORE U SOUTH 77 0 0 77 0 20 0 1 985 BELGAUM 154 1 0 155 0 3 0 0 1586 BELGAUM CHIKKODI 214 1 0 215 2 1 0 0 2187 BELLARY 299 1 0 300 0 4 0 0 3048 BIDAR 274 0 0 274 4 11 0 0 2899 BIJAPUR 291 1 0 292 2 6 0 0 30010 CHAMARAJANAGARA 62 0 0 62 0 0 0 0 6211 CHIKKABALLAPURA 54 3 0 57 0 6 0 0 6312 CHIKKAMANGALORE 24 0 0 24 0 6 0 0 3013 CHITRADURGA 68 0 0 68 0 1 0 0 6914 DAKSHINA KANNADA 167 0 0 167 0 4 0 0 17115 DAVANAGERE 87 2 0 89 0 2 0 0 9116 DHARWAD 199 2 0 201 1 8 0 0 21017 GADAG 122 0 0 122 1 1 0 0 12418 GULBARGA 425 0 0 425 0 9 0 0 43419 HASSAN 14 0 0 14 0 2 0 0 1620 HAVERI 210 0 0 210 0 2 0 0 21221 KODAGU 17 0 0 17 0 1 0 0 1822 KOLAR 67 0 0 67 0 4 0 0 7123 KOPPAL 171 0 0 171 0 1 0 0 17224 MANDYA 16 1 0 17 0 3 0 0 2025 MYSORE 138 1 0 139 0 7 0 0 14626 RAICHUR 213 0 0 213 0 7 0 0 22027 RAMANAGARA 48 0 0 48 1 2 0 0 5128 SHIMOGA 112 1 0 113 0 3 0 0 11629 TUMKUR 27 0 0 27 0 0 0 0 2730 TUMKUR MADHUGIRI 28 0 0 28 0 5 0 0 3331 UDUPI 76 2 0 78 0 5 0 0 8332 UTTARA KANNADA 21 0 0 21 0 0 0 0 2133 UTTARA KANNADA SIRSI 32 1 0 33 1 2 0 0 3634 YADAGIRI 122 0 0 122 0 3 0 0 125
Total 4,124 17 0 4,141 12 152 0 1 4,306

63
Sl.No.
Government Schools GovernmentAided
Schools
OtherManagement
SchoolsCentralSchools
TotalSchoolsDoE
SocialWelfare
LocalBody TOTAL
Dsitrict Name Un-AidedSchools
Annexure - 1 E
District wise / Management wise High Schools
E-Govenace Unit, SSA, BangaloreSource: DISE 2010-11
1 BAGALKOT 146 15 1 162 104 97 2 0 3652 BANGALORE RURAL 59 2 0 61 37 102 1 0 2013 BANGALORE U NORTH 52 2 19 73 121 685 7 8 8944 BANGALORE U SOUTH 79 2 17 98 151 878 5 5 11375 BELGAUM 123 5 0 128 178 115 4 0 4256 BELGAUM CHIKKODI 146 20 1 167 132 161 4 0 4647 BELLARY 172 17 0 189 81 181 5 0 4568 BIDAR 149 9 0 158 95 177 2 0 4329 BIJAPUR 121 14 0 135 223 108 3 0 46910 CHAMARAJANAGARA 84 10 0 94 37 62 2 1 19611 CHIKKABALLAPURA 106 6 0 112 32 118 2 0 26412 CHIKKAMANGALORE 115 17 0 132 113 80 2 0 32713 CHITRADURGA 109 13 0 122 191 84 1 0 39814 DAKSHINA KANNADA 160 11 0 171 107 196 3 0 47715 DAVANAGERE 152 15 0 167 172 127 1 0 46716 DHARWAD 89 5 5 99 129 124 4 1 35717 GADAG 83 8 2 93 82 75 1 1 25218 GULBARGA 254 23 0 277 94 247 1 0 61919 HASSAN 241 22 0 263 127 124 2 0 51620 HAVERI 131 17 5 153 143 76 3 0 37521 KODAGU 47 6 0 53 48 62 3 1 16722 KOLAR 115 11 0 126 43 138 1 1 30923 KOPPAL 128 15 0 143 26 80 1 0 25024 MANDYA 214 19 0 233 68 136 1 0 43825 MYSORE 216 19 0 235 97 281 5 0 61826 RAICHUR 162 17 0 179 32 139 2 0 35227 RAMANAGARA 106 17 0 123 58 102 0 0 28328 SHIMOGA 155 12 0 167 129 126 1 0 42329 TUMKUR 133 13 0 146 200 114 2 0 46230 TUMKUR MADHUGIRI 94 12 0 106 98 54 0 0 25831 UDUPI 106 2 1 109 69 92 1 0 27132 UTTARA KANNADA 45 3 0 48 85 40 3 0 17633 UTTARA KANNADA SIRSI 70 6 0 76 55 34 2 0 16734 YADAGIRI 116 12 0 128 10 44 0 0 182
TOTAL 4,278 397 51 4,726 3,367 5,259 77 18 13,447
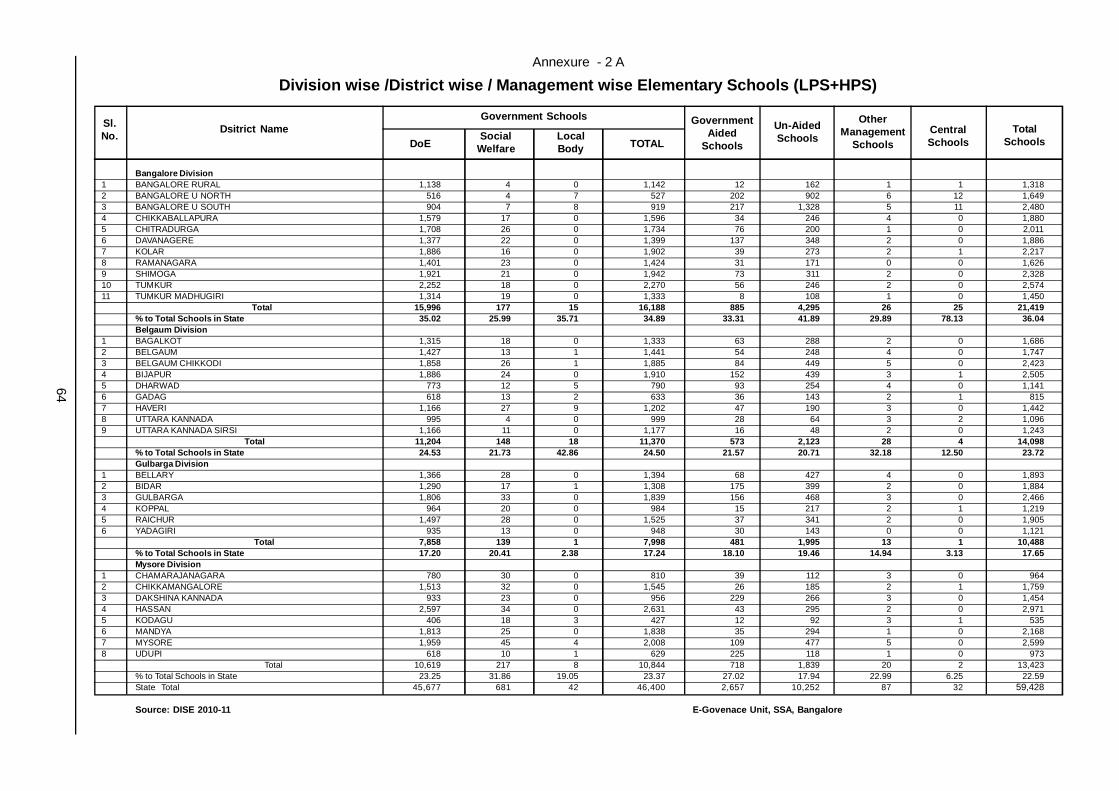
64
Sl.No.
Government Schools GovernmentAided
Schools
OtherManagement
SchoolsCentralSchools
TotalSchoolsDoE
SocialWelfare
LocalBody TOTAL
Dsitrict Name Un-AidedSchools
Annexure - 2 A
Division wise /District wise / Management wise Elementary Schools (LPS+HPS)
E-Govenace Unit, SSA, BangaloreSource: DISE 2010-11
Bangalore Division1 BANGALORE RURAL 1,138 4 0 1,142 12 162 1 1 1,3182 BANGALORE U NORTH 516 4 7 527 202 902 6 12 1,6493 BANGALORE U SOUTH 904 7 8 919 217 1,328 5 11 2,4804 CHIKKABALLAPURA 1,579 17 0 1,596 34 246 4 0 1,8805 CHITRADURGA 1,708 26 0 1,734 76 200 1 0 2,0116 DAVANAGERE 1,377 22 0 1,399 137 348 2 0 1,8867 KOLAR 1,886 16 0 1,902 39 273 2 1 2,2178 RAMANAGARA 1,401 23 0 1,424 31 171 0 0 1,6269 SHIMOGA 1,921 21 0 1,942 73 311 2 0 2,32810 TUMKUR 2,252 18 0 2,270 56 246 2 0 2,57411 TUMKUR MADHUGIRI 1,314 19 0 1,333 8 108 1 0 1,450
Total 15,996 177 15 16,188 885 4,295 26 25 21,419% to Total Schools in State 35.02 25.99 35.71 34.89 33.31 41.89 29.89 78.13 36.04Belgaum Division
1 BAGALKOT 1,315 18 0 1,333 63 288 2 0 1,6862 BELGAUM 1,427 13 1 1,441 54 248 4 0 1,7473 BELGAUM CHIKKODI 1,858 26 1 1,885 84 449 5 0 2,4234 BIJAPUR 1,886 24 0 1,910 152 439 3 1 2,5055 DHARWAD 773 12 5 790 93 254 4 0 1,1416 GADAG 618 13 2 633 36 143 2 1 8157 HAVERI 1,166 27 9 1,202 47 190 3 0 1,4428 UTTARA KANNADA 995 4 0 999 28 64 3 2 1,0969 UTTARA KANNADA SIRSI 1,166 11 0 1,177 16 48 2 0 1,243
Total 11,204 148 18 11,370 573 2,123 28 4 14,098% to Total Schools in State 24.53 21.73 42.86 24.50 21.57 20.71 32.18 12.50 23.72Gulbarga Division
1 BELLARY 1,366 28 0 1,394 68 427 4 0 1,8932 BIDAR 1,290 17 1 1,308 175 399 2 0 1,8843 GULBARGA 1,806 33 0 1,839 156 468 3 0 2,4664 KOPPAL 964 20 0 984 15 217 2 1 1,2195 RAICHUR 1,497 28 0 1,525 37 341 2 0 1,9056 YADAGIRI 935 13 0 948 30 143 0 0 1,121
Total 7,858 139 1 7,998 481 1,995 13 1 10,488% to Total Schools in State 17.20 20.41 2.38 17.24 18.10 19.46 14.94 3.13 17.65Mysore Division
1 CHAMARAJANAGARA 780 30 0 810 39 112 3 0 9642 CHIKKAMANGALORE 1,513 32 0 1,545 26 185 2 1 1,7593 DAKSHINA KANNADA 933 23 0 956 229 266 3 0 1,4544 HASSAN 2,597 34 0 2,631 43 295 2 0 2,9715 KODAGU 406 18 3 427 12 92 3 1 5356 MANDYA 1,813 25 0 1,838 35 294 1 0 2,1687 MYSORE 1,959 45 4 2,008 109 477 5 0 2,5998 UDUPI 618 10 1 629 225 118 1 0 973
Total 10,619 217 8 10,844 718 1,839 20 2 13,423% to Total Schools in State 23.25 31.86 19.05 23.37 27.02 17.94 22.99 6.25 22.59State Total 45,677 681 42 46,400 2,657 10,252 87 32 59,428

65
Sl.No.
Government Schools GovernmentAided
Schools
OtherManagement
SchoolsCentralSchools
TotalSchoolsDoE
SocialWelfare
LocalBody TOTAL
Dsitrict Name Un-AidedSchools
Annexure - 2 B
Division wise / District wise / Management wise Lower Primary Schools (LPS)
E-Govenace Unit, SSA, BangaloreSource: DISE 2010-11
Bangalore Division1 BANGALORE RURAL 697 1 0 698 0 22 0 0 7202 BANGALORE U NORTH 249 1 0 250 19 97 0 0 3663 BANGALORE U SOUTH 452 5 3 460 25 178 0 1 6644 CHIKKABALLAPURA 1,049 4 0 1,053 1 37 0 0 1,0915 CHITRADURGA 826 6 0 832 3 67 0 0 9026 DAVANAGERE 669 4 0 673 10 134 1 0 8187 KOLAR 1,254 2 0 1,256 1 43 0 0 1,3008 RAMANAGARA 946 6 0 952 8 32 0 0 9929 SHIMOGA 976 6 0 982 3 74 1 0 1,06010 TUMKUR 1,461 5 0 1,466 3 52 0 0 1,52111 TUMKUR MADHUGIRI 771 5 0 776 0 26 0 0 802
Total 9,350 45 3 9,398 73 762 2 1 10,236% to Total Schools in State 40.46 26.16 25.00 40.35 30.54 27.60 40.00 25.00 38.92Belgaum Division
1 BAGALKOT 509 4 0 513 4 104 0 0 6212 BELGAUM 615 5 1 621 3 97 0 0 7213 BELGAUM CHIKKODI 819 3 0 822 10 153 0 0 9854 BIJAPUR 834 8 0 842 31 202 0 0 1,0755 DHARWAD 230 2 1 233 8 86 0 0 3276 GADAG 190 3 0 193 4 56 0 0 2537 HAVERI 462 9 5 476 4 86 0 0 5668 UTTARA KANNADA 502 1 0 503 5 20 0 2 5309 UTTARA KANNADA SIRSI 656 3 0 659 1 8 0 0 668
Total 4,817 38 7 4,862 70 812 0 2 5,746% to Total Schools in State 20.84 22.09 58.33 20.87 29.29 29.41 0.00 50.00 21.85Gulbarga Division
1 BELLARY 530 4 0 534 6 163 0 0 7032 BIDAR 553 3 0 556 5 145 0 0 7063 GULBARGA 796 6 0 802 21 145 2 0 9704 KOPPAL 411 3 0 414 2 84 1 1 5025 RAICHUR 722 11 0 733 3 130 0 0 8666 YADAGIRI 476 1 0 477 6 74 0 0 557
Total 3,488 28 0 3,516 43 741 3 1 4,304% to Total Schools in State 15.09 16.28 0.00 15.09 17.99 26.84 60.00 25.00 16.36Mysore Division
1 CHAMARAJANAGARA 386 18 0 404 6 42 0 0 4522 CHIKKAMANGALORE 818 13 0 831 1 52 0 0 8843 DAKSHINA KANNADA 280 9 0 289 17 56 0 0 3624 HASSAN 1,576 8 0 1,584 1 78 0 0 1,6635 KODAGU 145 2 0 147 1 15 0 0 1636 MANDYA 988 3 0 991 3 72 0 0 1,0667 MYSORE 1,005 3 2 1,010 8 119 0 0 1,1378 UDUPI 256 5 0 261 16 12 0 0 289
Total 5,454 61 2 5,517 53 446 0 0 6,016% to Total Schools in State 23.60 35.47 16.67 23.69 22.18 16.15 0.00 0.00 22.87State Total 23,109 172 12 23,293 239 2,761 5 4 26,302

66
Sl.No.
Government Schools GovernmentAided
Schools
OtherManagement
SchoolsCentralSchools
TotalSchoolsDoE
SocialWelfare
LocalBody TOTAL
Dsitrict Name Un-AidedSchools
Annexure - 2 C
District wise / Management wise Upper Primary Schools (HPS)
E-Govenace Unit, SSA, BangaloreSource: DISE 2010-11
Bangalore Division1 BANGALORE RURAL 441 3 0 444 12 140 1 1 5982 BANGALORE U NORTH 267 3 7 277 183 805 6 12 1,2833 BANGALORE U SOUTH 452 2 5 459 192 1,150 5 10 1,8164 CHIKKABALLAPURA 530 13 0 543 33 209 4 0 7895 CHITRADURGA 882 20 0 902 73 133 1 0 1,1096 DAVANAGERE 708 18 0 726 127 214 1 0 1,0687 KOLAR 632 14 0 646 38 230 2 1 9178 RAMANAGARA 455 17 0 472 23 139 0 0 6349 SHIMOGA 945 15 0 960 70 237 1 0 1,26810 TUMKUR 791 13 0 804 53 194 2 0 1,05311 TUMKUR MADHUGIRI 543 14 0 557 8 82 1 0 648
Total 6,646 132 12 6,790 812 3,533 24 24 11,183% to Total Schools in State 29.45 25.93 40.00 29.39 33.58 47.16 29.27 85.71 33.76Belgaum Division
1 BAGALKOT 806 14 0 820 59 184 2 0 1,0652 BELGAUM 812 8 0 820 51 151 4 0 1,0263 BELGAUM CHIKKODI 1,039 23 1 1,063 74 296 5 0 1,4384 BIJAPUR 1,052 16 0 1,068 121 237 3 1 1,4305 DHARWAD 543 10 4 557 85 168 4 0 8146 GADAG 428 10 2 440 32 87 2 1 5627 HAVERI 704 18 4 726 43 104 3 0 8768 UTTARA KANNADA 493 3 0 496 23 44 3 0 5669 UTTARA KANNADA SIRSI 510 8 0 518 15 40 2 0 575
Total 6,387 110 11 6,508 503 1,311 28 2 8,352% to Total Schools in State 28.30 21.61 36.67 28.16 20.80 17.50 34.15 7.14 25.21Gulbarga Division
1 BELLARY 836 24 0 860 62 264 4 0 1,1902 BIDAR 737 14 1 752 170 254 2 0 1,1783 GULBARGA 1,010 27 0 1,037 135 323 1 0 1,4964 KOPPAL 553 17 0 570 13 133 1 0 7175 RAICHUR 775 17 0 792 34 211 2 0 1,0396 YADAGIRI 459 12 0 471 24 69 0 0 564
Total 4,370 111 1 4,482 438 1,254 10 0 6,184% to Total Schools in State 19.36 21.81 3.33 19.40 18.11 16.74 12.20 0.00 18.67Mysore Division
1 CHAMARAJANAGARA 394 12 0 406 33 70 3 0 5122 CHIKKAMANGALORE 695 19 0 714 25 133 2 1 8753 DAKSHINA KANNADA 653 14 0 667 212 210 3 0 1,0924 HASSAN 1,021 26 0 1,047 42 217 2 0 1,3085 KODAGU 261 16 3 280 11 77 3 1 3726 MANDYA 825 22 0 847 32 222 1 0 1,1027 MYSORE 954 42 2 998 101 358 5 0 1,4628 UDUPI 362 5 1 368 209 106 1 0 684
Total 5,165 156 6 5,327 665 1,393 20 2 7,407% to Total Schools in State 22.89 30.65 20.00 23.05 27.50 18.60 24.39 7.14 22.36State Total 22,568 509 30 23,107 2,418 7,491 82 28 33,126

67
Sl.No.
Government Schools GovernmentAided
Schools
OtherManagement
SchoolsCentralSchools
TotalSchoolsDoE
SocialWelfare
LocalBody TOTAL
Dsitrict Name Un-AidedSchools
Annexure - 2 D
Division Wise / District wise / Management wise Upper Primary Schools (HPS) having Class 8th
E-Govenace Unit, SSA, BangaloreSource: DISE 2010-11
Bangalore Division1 BANGALORE RURAL 75 0 0 75 0 4 0 0 792 BANGALORE U NORTH 54 0 0 54 0 17 0 0 713 BANGALORE U SOUTH 77 0 0 77 0 20 0 1 984 CHIKKABALLAPURA 54 3 0 57 0 6 0 0 635 CHITRADURGA 68 0 0 68 0 1 0 0 696 DAVANAGERE 87 2 0 89 0 2 0 0 917 KOLAR 67 0 0 67 0 4 0 0 718 RAMANAGARA 48 0 0 48 1 2 0 0 519 SHIMOGA 112 1 0 113 0 3 0 0 11610 TUMKUR 27 0 0 27 0 0 0 0 2711 TUMKUR MADHUGIRI 28 0 0 28 0 5 0 0 33
Total 697 6 0 703 1 64 0 1 769% to Total Schools in State 16.90 35.29 0.00 16.98 8.33 42.11 0.00 100.00 17.86Belgaum Division
1 BAGALKOT 166 0 0 166 0 2 0 0 1682 BELGAUM 154 1 0 155 0 3 0 0 1583 BELGAUM CHIKKODI 214 1 0 215 2 1 0 0 2184 BIJAPUR 291 1 0 292 2 6 0 0 3005 DHARWAD 199 2 0 201 1 8 0 0 2106 GADAG 122 0 0 122 1 1 0 0 1247 HAVERI 210 0 0 210 0 2 0 0 2128 UTTARA KANNADA 21 0 0 21 0 0 0 0 219 UTTARA KANNADA SIRSI 32 1 0 33 1 2 0 0 36
Total 1,409 6 0 1,415 7 25 0 0 1,447% to Total Schools in State 34.17 35.29 0.00 34.17 58.33 16.45 0.00 0.00 33.60Gulbarga Division
1 BELLARY 299 1 0 300 0 4 0 0 3042 BIDAR 274 0 0 274 4 11 0 0 2893 GULBARGA 425 0 0 425 0 9 0 0 4344 KOPPAL 171 0 0 171 0 1 0 0 1725 RAICHUR 213 0 0 213 0 7 0 0 2206 YADAGIRI 122 0 0 122 0 3 0 0 125
Total 1,504 1 0 1,505 4 35 0 0 1,544% to Total Schools in State 36.47 5.88 0.00 36.34 33.33 23.03 0.00 0.00 35.86Mysore Division
1 CHAMARAJANAGARA 62 0 0 62 0 0 0 0 622 CHIKKAMANGALORE 24 0 0 24 0 6 0 0 303 DAKSHINA KANNADA 167 0 0 167 0 4 0 0 1714 HASSAN 14 0 0 14 0 2 0 0 165 KODAGU 17 0 0 17 0 1 0 0 186 MANDYA 16 1 0 17 0 3 0 0 207 MYSORE 138 1 0 139 0 7 0 0 1468 UDUPI 76 2 0 78 0 5 0 0 83
Total 514 4 0 518 0 28 0 0 546% to Total Schools in State 12.46 23.53 0.00 12.51 0.00 18.42 0.00 0.00 12.68
State Total 4,124 17 0 4,141 12 152 0 1 4,306

68
Sl.No.
Government Schools GovernmentAided
Schools
OtherManagement
SchoolsCentralSchools
TotalSchoolsDoE
SocialWelfare
LocalBody TOTAL
Dsitrict Name Un-AidedSchools
Annexure - 2 E
Division wise / District wise / Management wise High Schools
E-Govenace Unit, SSA, BangaloreSource: DISE 2010-11
Bangalore Division1 BANGALORE RURAL 59 2 0 61 37 102 1 0 2012 BANGALORE U NORTH 52 2 19 73 121 685 7 8 8943 BANGALORE U SOUTH 79 2 17 98 151 878 5 5 1,1374 CHIKKABALLAPURA 106 6 0 112 32 118 2 0 2645 CHITRADURGA 109 13 0 122 191 84 1 0 3986 DAVANAGERE 152 15 0 167 172 127 1 0 4677 KOLAR 115 11 0 126 43 138 1 1 3098 RAMANAGARA 106 17 0 123 58 102 0 0 2839 SHIMOGA 155 12 0 167 129 126 1 0 42310 TUMKUR 133 13 0 146 200 114 2 0 46211 TUMKUR MADHUGIRI 94 12 0 106 98 54 0 0 258
Total 1,160 105 36 1,301 1,232 2,528 21 14 5,096% to Total Schools in State 27.12 26.45 70.59 27.53 36.59 48.07 27.27 77.78 37.90Belgaum Division
1 BAGALKOT 146 15 1 162 104 97 2 0 3652 BELGAUM 123 5 0 128 178 115 4 0 4253 BELGAUM CHIKKODI 146 20 1 167 132 161 4 0 4644 BIJAPUR 121 14 0 135 223 108 3 0 4695 DHARWAD 89 5 5 99 129 124 4 1 3576 GADAG 83 8 2 93 82 75 1 1 2527 HAVERI 131 17 5 153 143 76 3 0 3758 UTTARA KANNADA 45 3 0 48 85 40 3 0 1769 UTTARA KANNADA SIRSI 70 6 0 76 55 34 2 0 167
Total 954 93 14 1,061 1,131 830 26 2 3,050% to Total Schools in State 22.30 23.43 27.45 22.45 33.59 15.78 33.77 11.11 22.68Gulbarga Division
1 BELLARY 172 17 0 189 81 181 5 0 4562 BIDAR 149 9 0 158 95 177 2 0 4323 GULBARGA 254 23 0 277 94 247 1 0 6194 KOPPAL 128 15 0 143 26 80 1 0 2505 RAICHUR 162 17 0 179 32 139 2 0 3526 YADAGIRI 116 12 0 128 10 44 0 0 182
Total 981 93 0 1,074 338 868 11 0 2,291% to Total Schools in State 22.93 23.43 0.00 22.73 10.04 16.51 14.29 0.00 17.04Mysore Division
1 CHAMARAJANAGARA 84 10 0 94 37 62 2 1 1962 CHIKKAMANGALORE 115 17 0 132 113 80 2 0 3273 DAKSHINA KANNADA 160 11 0 171 107 196 3 0 4774 HASSAN 241 22 0 263 127 124 2 0 5165 KODAGU 47 6 0 53 48 62 3 1 1676 MANDYA 214 19 0 233 68 136 1 0 4387 MYSORE 216 19 0 235 97 281 5 0 6188 UDUPI 106 2 1 109 69 92 1 0 271
Total 1,183 106 1 1,290 666 1,033 19 2 3,010% to Total Schools in State 27.65 26.70 1.96 27.30 19.78 19.64 24.68 11.11 22.38State Total 4,278 397 51 4,726 3,367 5,259 77 18 13,447
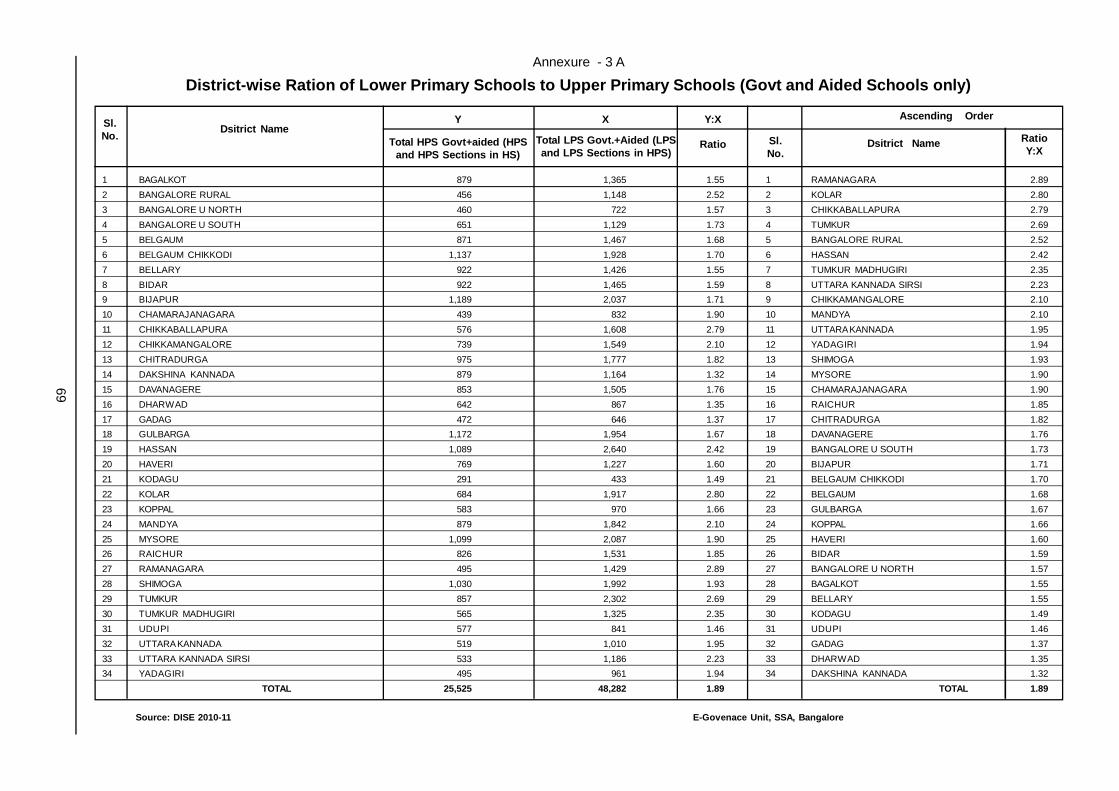
69
Sl.No. Dsitrict Name
Annexure - 3 A
District-wise Ration of Lower Primary Schools to Upper Primary Schools (Govt and Aided Schools only)
E-Govenace Unit, SSA, BangaloreSource: DISE 2010-11
Y X Y:X Ascending Order
RatioY:X
Dsitrict NameSl.No.
Total HPS Govt+aided (HPSand HPS Sections in HS)
RatioTotal LPS Govt.+Aided (LPSand LPS Sections in HPS)
1 BAGALKOT 879 1,365 1.55 1 RAMANAGARA 2.892 BANGALORE RURAL 456 1,148 2.52 2 KOLAR 2.803 BANGALORE U NORTH 460 722 1.57 3 CHIKKABALLAPURA 2.794 BANGALORE U SOUTH 651 1,129 1.73 4 TUMKUR 2.695 BELGAUM 871 1,467 1.68 5 BANGALORE RURAL 2.526 BELGAUM CHIKKODI 1,137 1,928 1.70 6 HASSAN 2.427 BELLARY 922 1,426 1.55 7 TUMKUR MADHUGIRI 2.358 BIDAR 922 1,465 1.59 8 UTTARA KANNADA SIRSI 2.239 BIJAPUR 1,189 2,037 1.71 9 CHIKKAMANGALORE 2.1010 CHAMARAJANAGARA 439 832 1.90 10 MANDYA 2.1011 CHIKKABALLAPURA 576 1,608 2.79 11 UTTARA KANNADA 1.9512 CHIKKAMANGALORE 739 1,549 2.10 12 YADAGIRI 1.9413 CHITRADURGA 975 1,777 1.82 13 SHIMOGA 1.9314 DAKSHINA KANNADA 879 1,164 1.32 14 MYSORE 1.9015 DAVANAGERE 853 1,505 1.76 15 CHAMARAJANAGARA 1.9016 DHARWAD 642 867 1.35 16 RAICHUR 1.8517 GADAG 472 646 1.37 17 CHITRADURGA 1.8218 GULBARGA 1,172 1,954 1.67 18 DAVANAGERE 1.7619 HASSAN 1,089 2,640 2.42 19 BANGALORE U SOUTH 1.7320 HAVERI 769 1,227 1.60 20 BIJAPUR 1.7121 KODAGU 291 433 1.49 21 BELGAUM CHIKKODI 1.7022 KOLAR 684 1,917 2.80 22 BELGAUM 1.6823 KOPPAL 583 970 1.66 23 GULBARGA 1.6724 MANDYA 879 1,842 2.10 24 KOPPAL 1.6625 MYSORE 1,099 2,087 1.90 25 HAVERI 1.6026 RAICHUR 826 1,531 1.85 26 BIDAR 1.5927 RAMANAGARA 495 1,429 2.89 27 BANGALORE U NORTH 1.5728 SHIMOGA 1,030 1,992 1.93 28 BAGALKOT 1.5529 TUMKUR 857 2,302 2.69 29 BELLARY 1.5530 TUMKUR MADHUGIRI 565 1,325 2.35 30 KODAGU 1.4931 UDUPI 577 841 1.46 31 UDUPI 1.4632 UTTARA KANNADA 519 1,010 1.95 32 GADAG 1.3733 UTTARA KANNADA SIRSI 533 1,186 2.23 33 DHARWAD 1.3534 YADAGIRI 495 961 1.94 34 DAKSHINA KANNADA 1.32
TOTAL 25,525 48,282 1.89 TOTAL 1.89
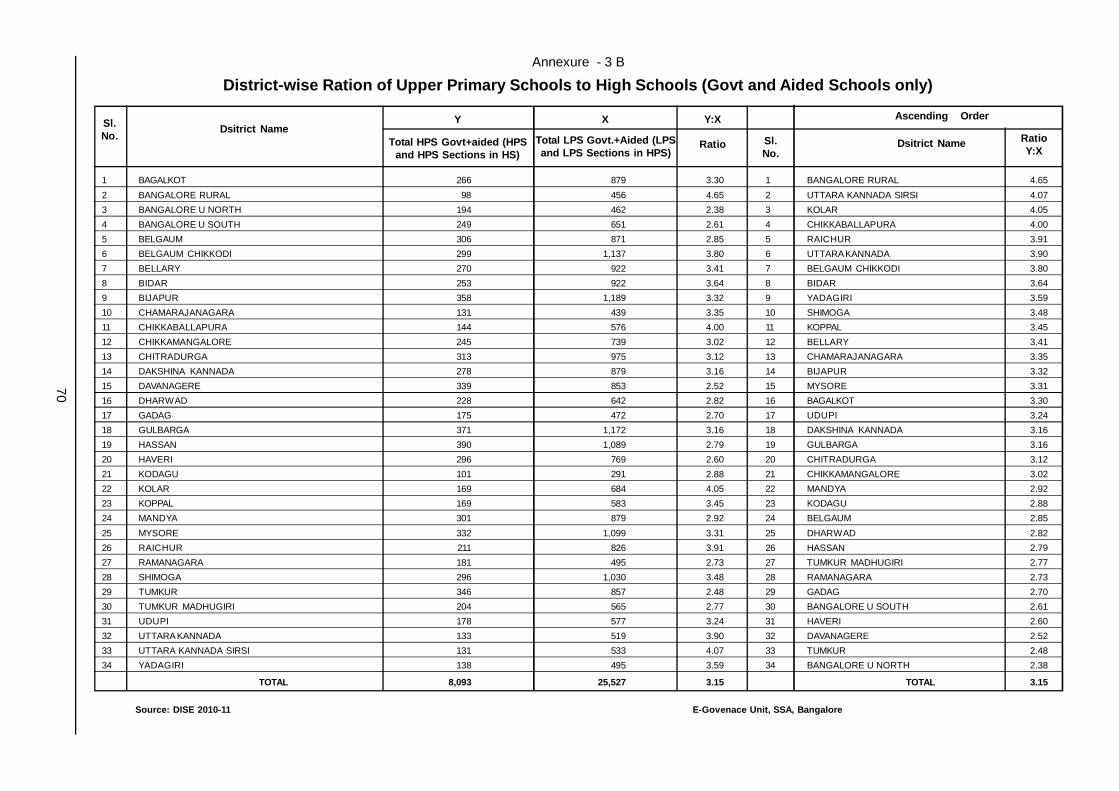
70
Sl.No. Dsitrict Name
Annexure - 3 B
District-wise Ration of Upper Primary Schools to High Schools (Govt and Aided Schools only)
E-Govenace Unit, SSA, BangaloreSource: DISE 2010-11
Y X Y:X Ascending Order
RatioY:X
Dsitrict NameSl.No.
Total HPS Govt+aided (HPSand HPS Sections in HS)
RatioTotal LPS Govt.+Aided (LPSand LPS Sections in HPS)
1 BAGALKOT 266 879 3.30 1 BANGALORE RURAL 4.652 BANGALORE RURAL 98 456 4.65 2 UTTARA KANNADA SIRSI 4.073 BANGALORE U NORTH 194 462 2.38 3 KOLAR 4.054 BANGALORE U SOUTH 249 651 2.61 4 CHIKKABALLAPURA 4.005 BELGAUM 306 871 2.85 5 RAICHUR 3.916 BELGAUM CHIKKODI 299 1,137 3.80 6 UTTARA KANNADA 3.907 BELLARY 270 922 3.41 7 BELGAUM CHIKKODI 3.808 BIDAR 253 922 3.64 8 BIDAR 3.649 BIJAPUR 358 1,189 3.32 9 YADAGIRI 3.5910 CHAMARAJANAGARA 131 439 3.35 10 SHIMOGA 3.4811 CHIKKABALLAPURA 144 576 4.00 11 KOPPAL 3.4512 CHIKKAMANGALORE 245 739 3.02 12 BELLARY 3.4113 CHITRADURGA 313 975 3.12 13 CHAMARAJANAGARA 3.3514 DAKSHINA KANNADA 278 879 3.16 14 BIJAPUR 3.3215 DAVANAGERE 339 853 2.52 15 MYSORE 3.3116 DHARWAD 228 642 2.82 16 BAGALKOT 3.3017 GADAG 175 472 2.70 17 UDUPI 3.2418 GULBARGA 371 1,172 3.16 18 DAKSHINA KANNADA 3.1619 HASSAN 390 1,089 2.79 19 GULBARGA 3.1620 HAVERI 296 769 2.60 20 CHITRADURGA 3.1221 KODAGU 101 291 2.88 21 CHIKKAMANGALORE 3.0222 KOLAR 169 684 4.05 22 MANDYA 2.9223 KOPPAL 169 583 3.45 23 KODAGU 2.8824 MANDYA 301 879 2.92 24 BELGAUM 2.8525 MYSORE 332 1,099 3.31 25 DHARWAD 2.8226 RAICHUR 211 826 3.91 26 HASSAN 2.7927 RAMANAGARA 181 495 2.73 27 TUMKUR MADHUGIRI 2.7728 SHIMOGA 296 1,030 3.48 28 RAMANAGARA 2.7329 TUMKUR 346 857 2.48 29 GADAG 2.7030 TUMKUR MADHUGIRI 204 565 2.77 30 BANGALORE U SOUTH 2.6131 UDUPI 178 577 3.24 31 HAVERI 2.6032 UTTARA KANNADA 133 519 3.90 32 DAVANAGERE 2.5233 UTTARA KANNADA SIRSI 131 533 4.07 33 TUMKUR 2.4834 YADAGIRI 138 495 3.59 34 BANGALORE U NORTH 2.38
TOTAL 8,093 25,527 3.15 TOTAL 3.15

71
Annexure - 4 A
Management wise/ Class wise/ Category wise/Sex wise Enrolment - All Management
E-Govenace Unit, SSA, BangaloreSource: DISE 2010-11
Class 1 106574 93787 200361 114,800 106,660 221,460 47,510 44,715 92,225 312,767 292,381 605,148 581,651 537,543 1,119,194 90,976 85,713 176,689
Class 2 98601 87701 186302 105,760 98,269 204,029 43,721 41,152 84,873 298,428 282,098 580,526 546,510 509,220 1,055,730 82,999 80,339 163,338
Class 3 98841 87779 186620 105,483 99,104 204,587 44,692 42,084 86,776 301,318 286,865 588,183 550,334 515,832 1,066,166 82,287 81,388 163,675
Class 4 99171 87573 186744 107,885 101,657 209,542 45,574 42,697 88,271 310,176 294,573 604,749 562,806 526,500 1,089,306 83,392 82,045 165,437
Class 5 99400 88246 187646 106,646 99,240 205,886 44,517 41,543 86,060 309,665 294,921 604,586 560,228 523,950 1,084,178 79,910 79,308 159,218
Class 6 96115 85859 181974 101,388 92,882 194,270 42,696 39,667 82,363 296,658 286,970 583,628 536,857 505,378 1,042,235 73,458 74,977 148,435
Class 7 90723 81303 172026 92,555 83,483 176,038 38,322 35,284 73,606 279,280 267,364 546,644 500,880 467,434 968,314 67,602 68,875 136,477
Class 8 119523 105170 224693 90,397 80,549 170,946 38,281 33,211 71,492 250,926 238,838 489,764 499,127 457,768 956,895 63,858 65,198 129,056
Class 9 115248 102250 217498 77,907 69,511 147,418 32,640 28,079 60,719 225,088 213,829 438,917 450,883 413,669 864,552 54,638 57,376 112,014
Class 10 104983 95994 200977 68,323 62,421 130,744 27,979 25,671 53,650 199,253 198,175 397,428 400,538 382,261 782,799 43,541 49,073 92,614
1 to 5 502587 445086 947673 540574 504930 1045504 226014 212191 438205 1532354 1450838 2983192 2801529 2613045 5414574 419564 408793 828357
6 to 7 186838 167162 354000 193943 176365 370308 81018 74951 155969 575938 554334 1130272 1037737 972812 2010549 141060 143852 284912
6 to 8 306361 272332 578693 284340 256914 541254 119299 108162 227461 826864 793172 1620036 1536864 1430580 2967444 204918 209050 413968
1 to 7 689425 612248 1301673 734517 681295 1415812 307032 287142 594174 2108292 2005172 4113464 3839266 3585857 7425123 560624 552645 1113269
1 to 8 808948 717418 1526366 824914 761844 1586758 345313 320353 665666 2359218 2244010 4603228 4338393 4043625 8382018 624482 617843 1242325
8 to 10 339754 303414 643168 236627 212481 449108 98900 86961 185861 675267 650842 1326109 1350548 1253698 2604246 162037 171647 333684
1 to 10 1029179 915662 1944841 971144 893776 1864920 405932 374103 780035 2783559 2656014 5439573 5189814 4839555 10029369 722661 724292 1446953
OBC(Muslims and otherMinority included)GeneralClass SC ST Total Muslims out of Total
Boys Girls Total Boys Girls Total Boys Girls Total Boys Girls Total Boys Girls Total Boys Girls Total

72
E-Govenace Unit, SSA, BangaloreSource: DISE 2010-11
Annexure - 4 B
Management wise/ Class wise/ Category wise/Sex wise Enrolment - Education Department
Class 1 24,025 24,155 48,180 81,383 79,390 160,773 34,113 34,027 68,140 170,401 172,991 343,392 309,922 310,563 620,485 44,051 45,820 89,871
Class 2 23,372 23,778 47,150 75,322 73,236 148,558 31,729 31,483 63,212 165,954 171,079 337,033 296,377 299,576 595,953 40,714 44,044 84,758
Class 3 25,315 25,850 51,165 76,507 75,461 151,968 33,399 32,859 66,258 175,199 180,889 356,088 310,420 315,059 625,479 42,234 46,267 88,501
Class 4 27,621 27,539 55,160 79,795 78,791 158,586 34,690 34,232 68,922 188,180 192,619 380,799 330,286 333,181 663,467 44,909 48,569 93,478
Class 5 28,011 28,588 56,599 79,305 77,198 156,503 33,924 33,344 67,268 190,606 194,879 385,485 331,846 334,009 665,855 44,070 47,869 91,939
Class 6 28,237 28,476 56,713 72,615 68,507 141,122 31,915 30,527 62,442 182,946 189,107 372,053 315,713 316,617 632,330 40,883 45,181 86,064
Class 7 26,803 27,515 54,318 65,996 61,062 127,058 28,695 27,163 55,858 172,678 177,676 350,354 294,172 293,416 587,588 37,591 42,101 79,692
Class 8 29,384 28,738 58,122 45,304 42,283 87,587 21,263 19,381 40,644 116,233 120,005 236,238 212,184 210,407 422,591 26,377 29,659 56,036
Class 9 27,554 26,781 54,335 34,617 32,761 67,378 16,116 14,326 30,442 91,123 93,964 185,087 169,410 167,832 337,242 20,265 23,084 43,349
Class 10 24,451 26,224 50,675 29,466 29,189 58,655 13,228 12,785 26,013 79,618 87,774 167,392 146,763 155,972 302,735 15,014 19,449 34,463
1 to 5 128344 129910 258254 392312 384076 776388 167855 165945 333800 890340 912457 1802797 1578851 1592388 3171239 215978 232569 448547
6 to 7 55040 55991 111031 138611 129569 268180 60610 57690 118300 355624 366783 722407 609885 610033 1219918 78474 87282 165756
6 to 8 84424 84729 169153 183915 171852 355767 81873 77071 158944 471857 486788 958645 822069 820440 1642509 104851 116941 221792
1 to 7 183384 185901 369285 530923 513645 1044568 228465 223635 452100 1245964 1279240 2525204 2188736 2202421 4391157 294452 319851 614303
1 to 8 212768 214639 427407 576227 555928 1132155 249728 243016 492744 1362197 1399245 2761442 2400920 2412828 4813748 320829 349510 670339
8 to 10 81389 81743 163132 109387 104233 213620 50607 46492 97099 286974 301743 588717 528357 534211 1062568 61656 72192 133848
1 to 10 264773 267644 532417 640310 617878 1258188 279072 270127 549199 1532938 1580983 3113921 2717093 2736632 5453725 356108 392043 748151
OBC(Muslims and otherMinority included)GeneralClass SC ST Total Muslims out of Total
Boys Girls Total Boys Girls Total Boys Girls Total Boys Girls Total Boys Girls Total Boys Girls Total

73
E-Govenace Unit, SSA, BangaloreSource: DISE 2010-11
Annexure - 4 C
Management wise/ Class wise/ Category wise/Sex wise Enrolment - Social Welfare
Class 1 108 82 190 664 426 1,090 628 660 1,288 314 231 545 1,714 1,399 3,113 73 51 124
Class 2 105 56 161 665 464 1,129 668 577 1,245 369 258 627 1,807 1,355 3,162 75 58 133
Class 3 115 69 184 754 520 1,274 652 617 1,269 406 277 683 1,927 1,483 3,410 70 52 122
Class 4 127 64 191 908 507 1,415 652 584 1,236 437 322 759 2,124 1,477 3,601 89 44 133
Class 5 114 50 164 865 517 1,382 720 663 1,383 415 319 734 2,114 1,549 3,663 66 32 98
Class 6 447 549 996 3,570 4,085 7,655 1,291 1,824 3,115 4,622 4,826 9,448 9,930 11,284 21,214 801 656 1457
Class 7 438 482 920 2,938 3,473 6,411 1,131 1,617 2,748 4,352 4,514 8,866 8,859 10,086 18,945 744 665 1409
Class 8 453 347 800 2,892 2,445 5,337 925 722 1,647 4,392 3,401 7,793 8,662 6,915 15,577 709 551 1260
Class 9 440 289 729 2,285 1,911 4,196 748 610 1,358 3,459 2,822 6,281 6,932 5,632 12,564 586 476 1062
Class 10 470 273 743 1,735 1,460 3,195 603 477 1,080 2,568 2,004 4,572 5,376 4,214 9,590 463 293 756
1 to 5 569 321 890 3856 2434 6290 3320 3101 6421 1941 1407 3348 9686 7263 16949 373 237 610
6 to 7 885 1031 1916 6508 7558 14066 2422 3441 5863 8974 9340 18314 18789 21370 40159 1545 1321 2866
6 to 8 1338 1378 2716 9400 10003 19403 3347 4163 7510 13366 12741 26107 27451 28285 55736 2254 1872 4126
1 to 7 1454 1352 2806 10364 9992 20356 5742 6542 12284 10915 10747 21662 28475 28633 57108 1918 1558 3476
1 to 8 1907 1699 3606 13256 12437 25693 6667 7264 13931 15307 14148 29455 37137 35548 72685 2627 2109 4736
8 to 10 1363 909 2272 6912 5816 12728 2276 1809 4085 10419 8227 18646 20970 16761 37731 1758 1320 3078
1 to 10 2817 2261 5078 17276 15808 33084 8018 8351 16369 21334 18974 40308 49445 45394 94839 3676 2878 6554
OBC(Muslims and otherMinority included)GeneralClass SC ST Total Muslims out of Total
Boys Girls Total Boys Girls Total Boys Girls Total Boys Girls Total Boys Girls Total Boys Girls Total

74
E-Govenace Unit, SSA, BangaloreSource: DISE 2010-11
Annexure - 4 D
Management wise/ Class wise/ Category wise/Sex wise Enrolment - Local Bady
Class 1 221 171 392 85 94 179 13 13 26 182 141 323 501 419 920 106 83 189
Class 2 164 131 295 88 72 160 7 3 10 156 142 298 415 348 763 64 60 124
Class 3 166 123 289 96 101 197 8 7 15 110 105 215 380 336 716 72 59 131
Class 4 138 138 276 106 89 195 6 4 10 134 118 252 384 349 733 76 55 131
Class 5 124 115 239 128 78 206 9 10 19 93 87 180 354 290 644 58 59 117
Class 6 142 122 264 155 85 240 29 12 41 175 104 279 501 323 824 107 70 177
Class 7 165 118 283 174 96 270 32 24 56 201 97 298 572 335 907 95 71 166
Class 8 660 1002 1662 543 633 1,176 75 45 120 597 329 926 1,875 2,009 3,884 381 522 903
Class 9 811 1263 2074 616 684 1,300 91 50 141 582 363 945 2,100 2,360 4,460 336 677 1013
Class 10 706 1130 1836 529 617 1,146 74 47 121 519 345 864 1,828 2,139 3,967 229 566 795
1 to 5 813 678 1491 503 434 937 43 37 80 675 593 1268 2034 1742 3776 376 316 692
6 to 7 307 240 547 329 181 510 61 36 97 376 201 577 1073 658 1731 202 141 343
6 to 8 967 1242 2209 872 814 1686 136 81 217 973 530 1503 2948 2667 5615 583 663 1246
1 to 7 1120 918 2038 832 615 1447 104 73 177 1051 794 1845 3107 2400 5507 578 457 1035
1 to 8 1780 1920 3700 1375 1248 2623 179 118 297 1648 1123 2771 4982 4409 9391 959 979 1938
8 to 10 2177 3395 5572 1688 1934 3622 240 142 382 1698 1037 2735 5803 6508 12311 946 1765 2711
1 to 10 3297 4313 7610 2520 2549 5069 344 215 559 2749 1831 4580 8910 8908 17818 1524 2222 3746
OBC(Muslims and otherMinority included)GeneralClass SC ST Total Muslims out of Total
Boys Girls Total Boys Girls Total Boys Girls Total Boys Girls Total Boys Girls Total Boys Girls Total

75
E-Govenace Unit, SSA, BangaloreSource: DISE 2010-11
Annexure - 4 E
Management wise/ Class wise/ Category wise/Sex wise Enrolment - Aided
Class 1 6,915 6,922 13,837 9,482 9,099 18,581 2,716 2,447 5,163 26,964 25,683 52,647 46,077 44,151 90,228 10,317 9,969 20,286
Class 2 7,013 6,829 13,842 9,585 9,175 18,760 2,604 2,407 5,011 27,264 25,725 52,989 46,466 44,136 90,602 10,204 9,464 19,668
Class 3 7,151 7,306 14,457 9,720 9,151 18,871 2,765 2,371 5,136 28,154 27,086 55,240 47,790 45,914 93,704 10,123 10,157 20,280
Class 4 7,697 7,520 15,217 9,766 9,180 18,946 2,796 2,425 5,221 29,308 27,972 57,280 49,567 47,097 96,664 10,174 10,231 20,405
Class 5 8,787 8,195 16,982 10,252 9,399 19,651 2,923 2,452 5,375 31,441 29,320 60,761 53,403 49,366 102,769 10,042 10,124 20,166
Class 6 10,193 9,462 19,655 10,941 9,702 20,643 3,360 2,726 6,086 33,590 31,718 65,308 58,084 53,608 111,692 10,189 10,365 20,554
Class 7 10,393 9,612 20,005 10,713 9,384 20,097 3,207 2,642 5,849 33,072 30,620 63,692 57,385 52,258 109,643 9,588 9,618 19,206
Class 8 35,557 31,915 67,472 27,786 24,746 52,532 10,342 8,789 19,131 69,648 66,978 136,626 143,333 132,428 275,761 19,199 19,175 38,374
Class 9 37,567 34,170 71,737 27,548 24,183 51,731 10,311 9,045 19,356 74,070 71,280 145,350 149,496 138,678 288,174 18,508 19,311 37,819
Class 10 35,331 33,292 68,623 24,857 22,282 47,139 9,396 8,783 18,179 68,278 68,202 136,480 137,862 132,559 270,421 15,494 16,908 32,402
1 to 5 37563 36772 74335 48805 46004 94809 13804 12102 25906 143131 135786 278917 243303 230664 473967 50860 49945 100805
6 to 7 20586 19074 39660 21654 19086 40740 6567 5368 11935 66662 62338 129000 115469 105866 221335 19777 19983 39760
6 to 8 56143 50989 107132 49440 43832 93272 16909 14157 31066 136310 129316 265626 258802 238294 497096 38976 39158 78134
1 to 7 58149 55846 113995 70459 65090 135549 20371 17470 37841 209793 198124 407917 358772 336530 695302 70637 69928 140565
1 to 8 93706 87761 181467 98245 89836 188081 30713 26259 56972 279441 265102 544543 502105 468958 971063 89836 89103 178939
8 to 10 108455 99377 207832 80191 71211 151402 30049 26617 56666 211996 206460 418456 430691 403665 834356 53201 55394 108595
1 to 10 166604 155223 321827 150650 136301 286951 50420 44087 94507 421789 404584 826373 789463 740195 1529658 123838 125322 249160
OBC(Muslims and otherMinority included)GeneralClass SC ST Total Muslims out of Total
Boys Girls Total Boys Girls Total Boys Girls Total Boys Girls Total Boys Girls Total Boys Girls Total
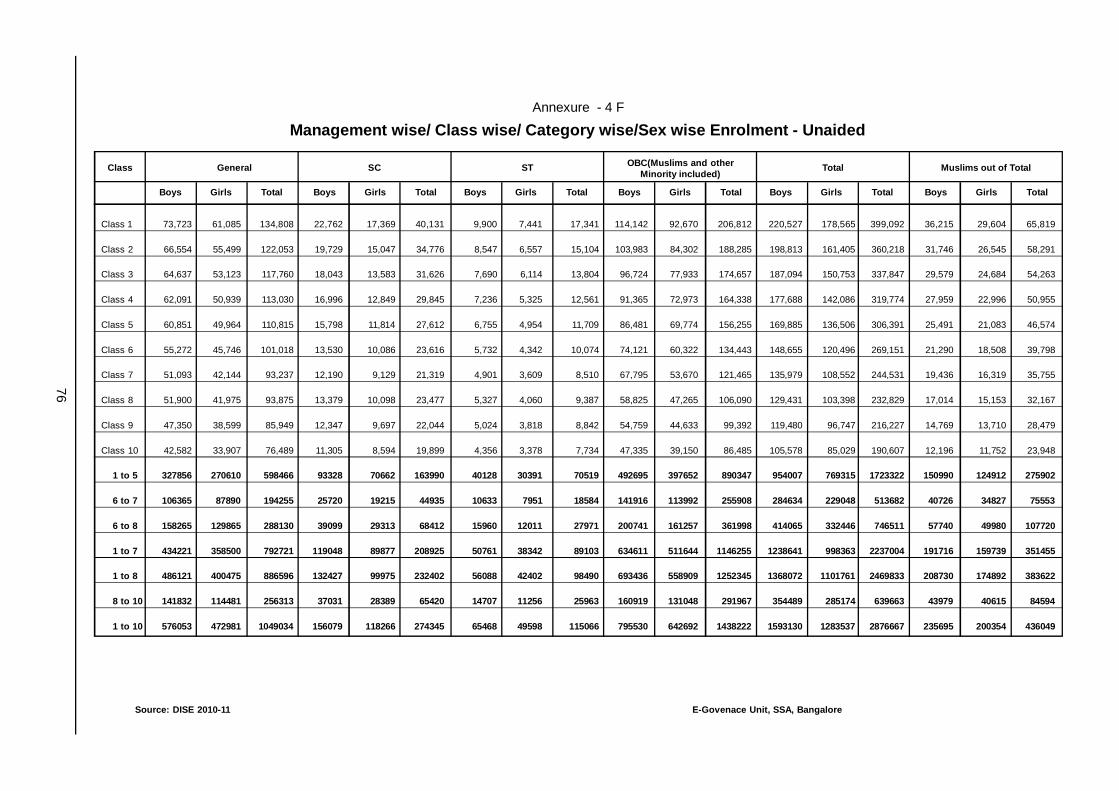
76
E-Govenace Unit, SSA, BangaloreSource: DISE 2010-11
Annexure - 4 F
Management wise/ Class wise/ Category wise/Sex wise Enrolment - Unaided
Class 1 73,723 61,085 134,808 22,762 17,369 40,131 9,900 7,441 17,341 114,142 92,670 206,812 220,527 178,565 399,092 36,215 29,604 65,819
Class 2 66,554 55,499 122,053 19,729 15,047 34,776 8,547 6,557 15,104 103,983 84,302 188,285 198,813 161,405 360,218 31,746 26,545 58,291
Class 3 64,637 53,123 117,760 18,043 13,583 31,626 7,690 6,114 13,804 96,724 77,933 174,657 187,094 150,753 337,847 29,579 24,684 54,263
Class 4 62,091 50,939 113,030 16,996 12,849 29,845 7,236 5,325 12,561 91,365 72,973 164,338 177,688 142,086 319,774 27,959 22,996 50,955
Class 5 60,851 49,964 110,815 15,798 11,814 27,612 6,755 4,954 11,709 86,481 69,774 156,255 169,885 136,506 306,391 25,491 21,083 46,574
Class 6 55,272 45,746 101,018 13,530 10,086 23,616 5,732 4,342 10,074 74,121 60,322 134,443 148,655 120,496 269,151 21,290 18,508 39,798
Class 7 51,093 42,144 93,237 12,190 9,129 21,319 4,901 3,609 8,510 67,795 53,670 121,465 135,979 108,552 244,531 19,436 16,319 35,755
Class 8 51,900 41,975 93,875 13,379 10,098 23,477 5,327 4,060 9,387 58,825 47,265 106,090 129,431 103,398 232,829 17,014 15,153 32,167
Class 9 47,350 38,599 85,949 12,347 9,697 22,044 5,024 3,818 8,842 54,759 44,633 99,392 119,480 96,747 216,227 14,769 13,710 28,479
Class 10 42,582 33,907 76,489 11,305 8,594 19,899 4,356 3,378 7,734 47,335 39,150 86,485 105,578 85,029 190,607 12,196 11,752 23,948
1 to 5 327856 270610 598466 93328 70662 163990 40128 30391 70519 492695 397652 890347 954007 769315 1723322 150990 124912 275902
6 to 7 106365 87890 194255 25720 19215 44935 10633 7951 18584 141916 113992 255908 284634 229048 513682 40726 34827 75553
6 to 8 158265 129865 288130 39099 29313 68412 15960 12011 27971 200741 161257 361998 414065 332446 746511 57740 49980 107720
1 to 7 434221 358500 792721 119048 89877 208925 50761 38342 89103 634611 511644 1146255 1238641 998363 2237004 191716 159739 351455
1 to 8 486121 400475 886596 132427 99975 232402 56088 42402 98490 693436 558909 1252345 1368072 1101761 2469833 208730 174892 383622
8 to 10 141832 114481 256313 37031 28389 65420 14707 11256 25963 160919 131048 291967 354489 285174 639663 43979 40615 84594
1 to 10 576053 472981 1049034 156079 118266 274345 65468 49598 115066 795530 642692 1438222 1593130 1283537 2876667 235695 200354 436049
OBC(Muslims and otherMinority included)GeneralClass SC ST Total Muslims out of Total
Boys Girls Total Boys Girls Total Boys Girls Total Boys Girls Total Boys Girls Total Boys Girls Total

77
E-Govenace Unit, SSA, BangaloreSource: DISE 2010-11
Annexure - 4 G
Management wise/ Class wise/ Category wise/Sex wise Enrolment - Central Schools
Class 1 1,211 1,065 2,276 379 245 624 136 116 252 455 371 826 2,181 1,797 3,978 99 51 150
Class 2 1,073 1,072 2,145 330 239 569 150 116 266 414 336 750 1,967 1,763 3,730 92 50 142
Class 3 1,125 977 2,102 328 244 572 171 108 279 458 326 784 2,082 1,655 3,737 97 56 153
Class 4 1,170 1,074 2,244 282 212 494 183 118 301 449 334 783 2,084 1,738 3,822 88 59 147
Class 5 1,191 1,057 2,248 276 201 477 177 113 290 407 348 755 2,051 1,719 3,770 95 64 159
Class 6 1,549 1,240 2,789 553 361 914 363 227 590 960 671 1,631 3,425 2,499 5,924 106 109 215
Class 7 1,582 1,199 2,781 518 296 814 339 224 563 999 659 1,658 3,438 2,378 5,816 105 65 170
Class 8 1,369 1,025 2,394 455 306 761 316 193 509 933 679 1,612 3,073 2,203 5,276 93 101 194
Class 9 1,356 1,009 2,365 450 260 710 313 206 519 857 596 1,453 2,976 2,071 5,047 96 87 183
Class 10 1,311 1,036 2,347 414 256 670 296 182 478 760 552 1,312 2,781 2,026 4,807 82 76 158
1 to 5 5770 5245 11015 1595 1141 2736 817 571 1388 2183 1715 3898 10365 8672 19037 471 280 751
6 to 7 3131 2439 5570 1071 657 1728 702 451 1153 1959 1330 3289 6863 4877 11740 211 174 385
6 to 8 4500 3464 7964 1526 963 2489 1018 644 1662 2892 2009 4901 9936 7080 17016 304 275 579
1 to 7 8901 7684 16585 2666 1798 4464 1519 1022 2541 4142 3045 7187 17228 13549 30777 682 454 1136
1 to 8 10270 8709 18979 3121 2104 5225 1835 1215 3050 5075 3724 8799 20301 15752 36053 775 555 1330
8 to 10 4036 3070 7106 1319 822 2141 925 581 1506 2550 1827 4377 8830 6300 15130 271 264 535
1 to 10 12937 10754 23691 3985 2620 6605 2444 1603 4047 6692 4872 11564 26058 19849 45907 953 718 1671
OBC(Muslims and otherMinority included)GeneralClass SC ST Total Muslims out of Total
Boys Girls Total Boys Girls Total Boys Girls Total Boys Girls Total Boys Girls Total Boys Girls Total
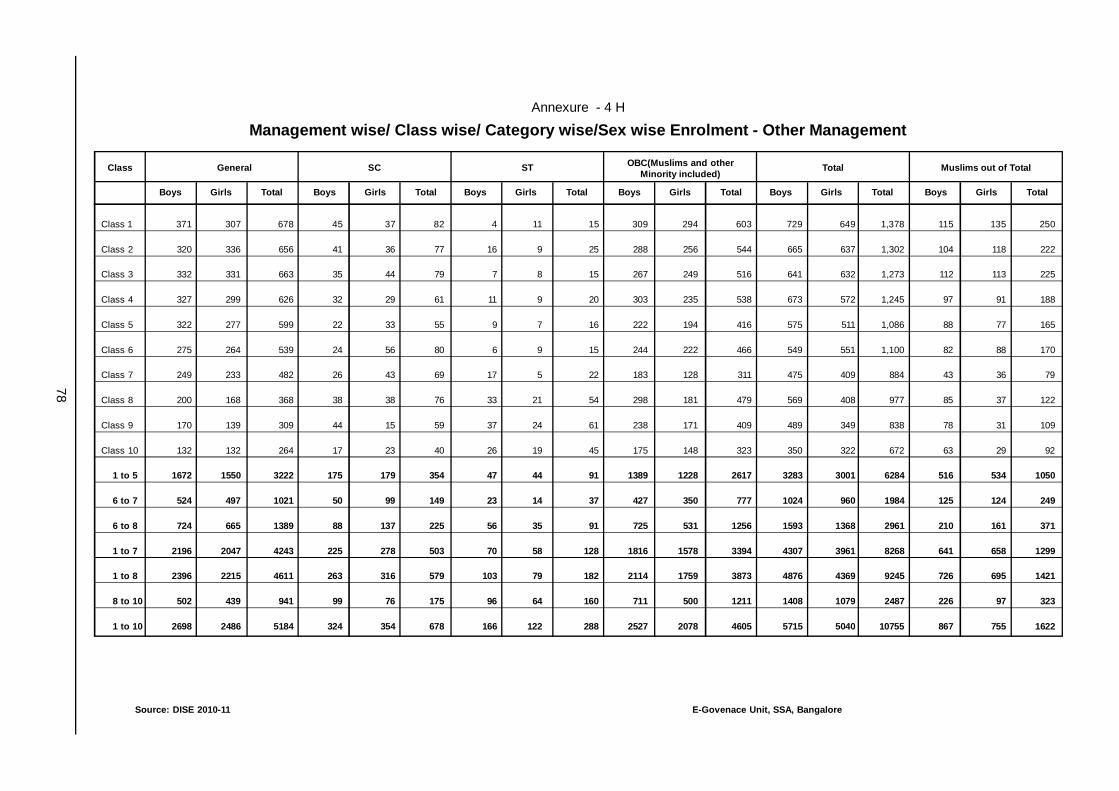
78
E-Govenace Unit, SSA, BangaloreSource: DISE 2010-11
Annexure - 4 H
Management wise/ Class wise/ Category wise/Sex wise Enrolment - Other Management
Class 1 371 307 678 45 37 82 4 11 15 309 294 603 729 649 1,378 115 135 250
Class 2 320 336 656 41 36 77 16 9 25 288 256 544 665 637 1,302 104 118 222
Class 3 332 331 663 35 44 79 7 8 15 267 249 516 641 632 1,273 112 113 225
Class 4 327 299 626 32 29 61 11 9 20 303 235 538 673 572 1,245 97 91 188
Class 5 322 277 599 22 33 55 9 7 16 222 194 416 575 511 1,086 88 77 165
Class 6 275 264 539 24 56 80 6 9 15 244 222 466 549 551 1,100 82 88 170
Class 7 249 233 482 26 43 69 17 5 22 183 128 311 475 409 884 43 36 79
Class 8 200 168 368 38 38 76 33 21 54 298 181 479 569 408 977 85 37 122
Class 9 170 139 309 44 15 59 37 24 61 238 171 409 489 349 838 78 31 109
Class 10 132 132 264 17 23 40 26 19 45 175 148 323 350 322 672 63 29 92
1 to 5 1672 1550 3222 175 179 354 47 44 91 1389 1228 2617 3283 3001 6284 516 534 1050
6 to 7 524 497 1021 50 99 149 23 14 37 427 350 777 1024 960 1984 125 124 249
6 to 8 724 665 1389 88 137 225 56 35 91 725 531 1256 1593 1368 2961 210 161 371
1 to 7 2196 2047 4243 225 278 503 70 58 128 1816 1578 3394 4307 3961 8268 641 658 1299
1 to 8 2396 2215 4611 263 316 579 103 79 182 2114 1759 3873 4876 4369 9245 726 695 1421
8 to 10 502 439 941 99 76 175 96 64 160 711 500 1211 1408 1079 2487 226 97 323
1 to 10 2698 2486 5184 324 354 678 166 122 288 2527 2078 4605 5715 5040 10755 867 755 1622
OBC(Muslims and otherMinority included)GeneralClass SC ST Total Muslims out of Total
Boys Girls Total Boys Girls Total Boys Girls Total Boys Girls Total Boys Girls Total Boys Girls Total

79
E-Govenace Unit, SSA, BangaloreSource: DISE 2010-11
Annexure - 5 A
District wise / Class wise/ Sex wise Enrolment in all Management Schools
Boys Girls Boys Girls Boys Girls Boys Girls Boys Girls Boys Girls Boys Girls Boys Girls Boys Girls Boys GirlsClass 1Sl
No.District Class 2 Class 3 Class 4 Class 5 Class 6 Class 7 Class 8 Class 9 Class 10
1 BAGALKOT 22,784 20,624 20,360 18,979 20,717 19,055 20,802 19,582 20,399 18,865 18,462 17,302 16,603 15,158 16,205 13,999 14,802 12,197 13,742 11,072
2 BANGALORE RURAL 7,592 7,183 6,986 6,838 7,064 6,831 7,320 6,960 7,855 7,228 7,588 7,375 7,522 7,264 7,501 6,948 6,975 6,417 6,581 6,443
3 BANGALORE U NORTH 31,119 28,781 29,338 27,704 28,857 27,371 28,647 27,473 29,423 28,107 28,165 27,188 26,834 26,058 26,600 25,950 24,685 24,497 22,159 22,202
4 BANGALORE U SOUTH 44,844 42,276 41,702 39,116 40,560 38,516 40,567 37,768 40,630 37,970 37,863 36,072 36,272 34,707 36,183 34,864 32,896 32,487 28,225 28,541
5 BELGAUM 20,232 18,650 19,131 17,546 19,719 18,260 20,721 18,986 20,577 19,308 19,244 18,505 18,936 17,838 19,406 17,403 17,797 15,618 16,045 14,777
6 BELGAUM CHIKKODI 26,632 24,200 25,573 22,983 26,169 23,867 26,725 24,055 25,813 23,313 24,052 22,186 23,759 21,618 23,736 21,034 21,459 18,204 19,723 15,958
7 BELLARY 27,672 25,484 24,325 22,996 24,785 23,245 24,858 23,354 23,823 22,046 22,193 20,727 19,560 17,590 19,231 16,224 16,615 13,572 13,900 11,351
8 BIDAR 25,406 23,496 23,684 22,050 23,637 21,881 23,790 22,505 22,799 21,186 20,847 19,642 18,779 17,929 15,329 15,693 13,182 13,294 11,340 11,557
9 BIJAPUR 31,964 28,021 29,355 25,975 29,781 26,842 30,157 27,507 28,208 25,828 24,534 22,724 22,002 19,568 19,946 16,597 18,344 14,259 16,781 12,881
10 CHAMARAJANAGARA 7,552 7,068 7,181 6,882 7,206 6,818 7,560 7,053 8,027 7,562 7,782 7,508 7,093 6,802 7,689 7,081 6,872 6,384 6,110 6,172
11 CHIKKABALLAPURA 11,075 10,148 9,710 9,164 9,756 9,071 10,269 9,652 10,371 10,079 10,355 10,140 9,717 9,569 10,395 9,803 9,147 8,595 8,738 8,610
12 CHIKKAMANGALORE 8,279 7,994 8,268 7,718 8,371 7,933 8,916 8,228 9,217 8,746 9,550 9,026 8,988 8,936 9,987 9,352 8,898 8,770 7,660 8,050
13 CHITRADURGA 14,509 13,515 14,130 13,245 14,204 13,265 14,775 13,818 14,593 14,048 15,692 14,659 14,254 13,639 14,394 13,181 13,048 11,874 12,289 11,582
14 DAKSHINA KANNADA 16,504 15,479 16,172 15,100 16,503 15,688 17,271 16,617 18,391 17,056 18,902 17,717 17,713 16,457 20,185 17,800 18,416 17,309 14,648 15,936
15 DAVANAGERE 18,752 17,300 18,032 16,831 18,299 17,369 18,928 17,810 19,137 17,572 18,325 17,046 17,121 16,050 17,032 15,744 15,365 14,403 12,833 13,339
16 DHARWAD 18,158 17,425 17,713 16,775 18,308 17,363 18,341 17,798 18,767 18,068 18,006 17,353 17,213 16,617 17,141 16,038 15,252 13,863 13,777 13,143
17 GADAG 10,071 9,482 9,917 9,302 10,375 10,045 10,715 10,007 10,650 9,963 10,138 9,653 9,345 8,495 9,250 8,496 8,356 7,555 7,505 6,886
18 GULBARGA 33,938 30,485 31,328 28,887 31,240 28,433 30,827 28,332 28,737 26,736 26,583 25,006 23,545 21,669 20,633 18,673 18,109 16,549 16,426 14,775
19 HASSAN 12,725 12,022 12,371 11,812 12,375 11,987 13,263 12,477 13,665 13,211 13,997 13,668 13,557 12,980 14,507 13,878 13,365 12,945 11,753 12,373
20 HAVERI 15,180 14,606 14,653 13,674 14,859 14,401 15,310 14,535 15,160 14,645 14,805 13,920 13,873 13,511 13,699 13,153 11,625 11,164 10,330 10,392
21 KODAGU 4,481 4,308 4,413 4,268 4,521 4,426 4,809 4,451 4,891 4,690 5,060 4,858 4,667 4,578 5,130 4,756 4,938 4,662 3,804 3,997
22 KOLAR 13,783 13,015 12,635 11,783 12,443 11,950 13,243 12,582 13,253 12,901 13,193 12,895 12,394 12,140 12,889 12,433 11,856 11,122 10,796 10,790
23 KOPPAL 16,499 15,089 15,134 14,301 16,112 15,108 16,072 15,004 15,488 14,512 14,304 13,070 12,805 11,435 11,796 9,971 9,916 8,245 8,165 7,248
24 MANDYA 13,603 12,454 13,175 12,148 12,713 11,700 13,319 12,356 13,703 12,712 14,009 13,196 13,066 12,126 14,197 13,274 13,041 12,673 12,534 12,592
25 MYSORE 24,064 22,607 23,220 22,077 22,654 21,699 23,931 23,087 25,174 24,391 25,186 24,613 23,871 22,847 24,486 23,421 22,408 21,784 20,319 20,448
26 RAICHUR 23,866 21,701 22,159 20,278 22,585 21,172 22,246 20,676 20,714 18,786 17,949 16,389 16,143 13,802 13,352 11,526 12,017 9,466 10,485 8,438
27 RAMANAGARA 8,023 7,630 7,798 7,123 7,947 7,603 7,867 7,467 8,269 7,699 8,285 7,805 8,046 7,830 8,317 7,820 7,736 7,341 7,501 7,448
28 SHIMOGA 15,175 14,353 14,524 14,033 14,676 14,192 15,531 14,708 15,948 15,092 16,043 15,015 15,383 14,234 16,036 15,395 14,212 14,117 11,787 12,933
29 TUMKUR 12,735 11,674 12,144 11,464 11,918 11,187 12,982 11,979 13,806 12,539 14,346 12,994 13,894 12,236 15,009 12,913 14,135 12,343 13,966 12,567
30 TUMKUR MADHUGIRI 8,110 7,398 7,444 6,883 7,380 7,069 8,185 7,599 8,244 7,738 8,442 7,990 7,968 7,326 8,577 8,140 7,909 7,700 7,794 7,866
31 UDUPI 8,165 7,544 7,829 7,439 7,969 7,595 8,466 8,127 9,052 8,535 9,452 8,846 8,812 8,158 9,736 9,070 9,569 9,048 8,319 8,350
32 UTTARA KANNADA 5,130 4,928 5,433 4,917 5,368 5,141 5,820 5,473 6,076 5,693 6,015 5,636 5,778 5,541 6,507 5,958 5,807 5,519 4,929 5,297
33 UTTARA KANNADA SIRSI 6,328 5,914 5,838 5,494 6,197 5,820 6,397 6,045 6,657 6,169 6,881 6,221 6,377 5,902 6,457 5,640 5,507 5,177 4,226 4,325
34 YADAGIRI 16,701 14,689 14,835 13,435 15,066 12,929 14,176 12,429 12,711 10,956 10,609 8,433 8,990 6,824 7,589 5,540 6,624 4,516 5,348 3,922
Total 581,651 537,543 546,510 509,220 550,334 515,832 562,806 526,500 560,228 523,950 536,857 505,378 500,880 467,434 499,127 457,768 450,883 413,669 400,538 382,261

80
E-Govenace Unit, SSA, BangaloreSource: DISE 2010-11
Annexure - 5 B
District wise / Level wise/ Sex wise Enrolment in all Management Schools
Girls Total
Class 1 to 5SlNo.
DistrictClass 6 to 7
1 BAGALKOT 105,052 97,105 202,167 35,065 32,460 67,525 51,270 46,459 97,729 140,127 129,565 269,692 156,332 143,564 299,896 44,749 37,268 82,017 184,876 166,833 351,709
2 BANGALORE RURAL 36,817 35,040 71,857 15,110 14,639 29,749 22,611 21,587 44,198 51,927 49,679 101,606 59,428 56,627 116,055 21,057 19,808 40,865 72,984 69,487 142,471
3 BANGALORE U NORTH 147,384 139,436 286,820 54,999 53,246 108,245 81,599 79,196 160,795 202,383 192,682 395,065 228,983 218,632 447,615 73,444 72,649 146,093 275,827 265,331 541,158
4 BANGALORE U SOUTH 208,303 195,646 403,949 74,135 70,779 144,914 110,318 105,643 215,961 282,438 266,425 548,863 318,621 301,289 619,910 97,304 95,892 193,196 379,742 362,317 742,059
5 BELGAUM 100,380 92,750 193,130 38,180 36,343 74,523 57,586 53,746 111,332 138,560 129,093 267,653 157,966 146,496 304,462 53,248 47,798 101,046 191,808 176,891 368,699
6 BELGAUM CHIKKODI 130,912 118,418 249,330 47,811 43,804 91,615 71,547 64,838 136,385 178,723 162,222 340,945 202,459 183,256 385,715 64,918 55,196 120,114 243,641 217,418 461,059
7 BELLARY 125,463 117,125 242,588 41,753 38,317 80,070 60,984 54,541 115,525 167,216 155,442 322,658 186,447 171,666 358,113 49,746 41,147 90,893 216,962 196,589 413,551
8 BIDAR 119,316 111,118 230,434 39,626 37,571 77,197 54,955 53,264 108,219 158,942 148,689 307,631 174,271 164,382 338,653 39,851 40,544 80,395 198,793 189,233 388,026
9 BIJAPUR 149,465 134,173 283,638 46,536 42,292 88,828 66,482 58,889 125,371 196,001 176,465 372,466 215,947 193,062 409,009 55,071 43,737 98,808 251,072 220,202 471,274
10 CHAMARAJANAGARA 37,526 35,383 72,909 14,875 14,310 29,185 22,564 21,391 43,955 52,401 49,693 102,094 60,090 56,774 116,864 20,671 19,637 40,308 73,072 69,330 142,402
11 CHIKKABALLAPURA 51,181 48,114 99,295 20,072 19,709 39,781 30,467 29,512 59,979 71,253 67,823 139,076 81,648 77,626 159,274 28,280 27,008 55,288 99,533 94,831 194,364
12 CHIKKAMANGALORE 43,051 40,619 83,670 18,538 17,962 36,500 28,525 27,314 55,839 61,589 58,581 120,170 71,576 67,933 139,509 26,545 26,172 52,717 88,134 84,753 172,887
13 CHITRADURGA 72,211 67,891 140,102 29,946 28,298 58,244 44,340 41,479 85,819 102,157 96,189 198,346 116,551 109,370 225,921 39,731 36,637 76,368 141,888 132,826 274,714
14 DAKSHINA KANNADA 84,841 79,940 164,781 36,615 34,174 70,789 56,800 51,974 108,774 121,456 114,114 235,570 141,641 131,914 273,555 53,249 51,045 104,294 174,705 165,159 339,864
15 DAVANAGERE 93,148 86,882 180,030 35,446 33,096 68,542 52,478 48,840 101,318 128,594 119,978 248,572 145,626 135,722 281,348 45,230 43,486 88,716 173,824 163,464 337,288
16 DHARWAD 91,287 87,429 178,716 35,219 33,970 69,189 52,360 50,008 102,368 126,506 121,399 247,905 143,647 137,437 281,084 46,170 43,044 89,214 172,676 164,443 337,119
17 GADAG 51,728 48,799 100,527 19,483 18,148 37,631 28,733 26,644 55,377 71,211 66,947 138,158 80,461 75,443 155,904 25,111 22,937 48,048 96,322 89,884 186,206
18 GULBARGA 156,070 142,873 298,943 50,128 46,675 96,803 70,761 65,348 136,109 206,198 189,548 395,746 226,831 208,221 435,052 55,168 49,997 105,165 261,366 239,545 500,911
19 HASS AN 64,399 61,509 125,908 27,554 26,648 54,202 42,061 40,526 82,587 91,953 88,157 180,110 106,460 102,035 208,495 39,625 39,196 78,821 131,578 127,353 258,931
20 HAVERI 75,162 71,861 147,023 28,678 27,431 56,109 42,377 40,584 82,961 103,840 99,292 203,132 117,539 112,445 229,984 35,654 34,709 70,363 139,494 134,001 273,495
21 KODAGU 23,115 22,143 45,258 9,727 9,436 19,163 14,857 14,192 29,049 32,842 31,579 64,421 37,972 36,335 74,307 13,872 13,415 27,287 46,714 44,994 91,708
22 KOLAR 65,357 62,231 127,588 25,587 25,035 50,622 38,476 37,468 75,944 90,944 87,266 178,210 103,833 99,699 203,532 35,541 34,345 69,886 126,485 121,611 248,096
23 KOPPAL 79,305 74,014 153,319 27,109 24,505 51,614 38,905 34,476 73,381 106,414 98,519 204,933 118,210 108,490 226,700 29,877 25,464 55,341 136,291 123,983 260,274
24 MANDYA 66,513 61,370 127,883 27,075 25,322 52,397 41,272 38,596 79,868 93,588 86,692 180,280 107,785 99,966 207,751 39,772 38,539 78,311 133,360 125,231 258,591
25 MYSORE 119,043 113,861 232,904 49,057 47,460 96,517 73,543 70,881 144,424 168,100 161,321 329,421 192,586 184,742 377,328 67,213 65,653 132,866 235,313 226,974 462,287
26 RAICHUR 111,570 102,613 214,183 34,092 30,191 64,283 47,444 41,717 89,161 145,662 132,804 278,466 159,014 144,330 303,344 35,854 29,430 65,284 181,516 162,234 343,750
27 RAMANAGARA 39,904 37,522 77,426 16,331 15,635 31,966 24,648 23,455 48,103 56,235 53,157 109,392 64,552 60,977 125,529 23,554 22,609 46,163 79,789 75,766 155,555
28 SHIMOGA 75,854 72,378 148,232 31,426 29,249 60,675 47,462 44,644 92,106 107,280 101,627 208,907 123,316 117,022 240,338 42,035 42,445 84,480 149,315 144,072 293,387
29 TUMKUR 63,585 58,843 122,428 28,240 25,230 53,470 43,249 38,143 81,392 91,825 84,073 175,898 106,834 96,986 203,820 43,110 37,823 80,933 134,935 121,896 256,831
30 TUMKUR MADHUGIRI 39,363 36,687 76,050 16,410 15,316 31,726 24,987 23,456 48,443 55,773 52,003 107,776 64,350 60,143 124,493 24,280 23,706 47,986 80,053 75,709 155,762
31 UDUPI 41,481 39,240 80,721 18,264 17,004 35,268 28,000 26,074 54,074 59,745 56,244 115,989 69,481 65,314 134,795 27,624 26,468 54,092 87,369 82,712 170,081
32 UTTARA KANNADA 27,827 26,152 53,979 11,793 11,177 22,970 18,300 17,135 35,435 39,620 37,329 76,949 46,127 43,287 89,414 17,243 16,774 34,017 56,863 54,103 110,966
33 UTTARA KANNADA SIRSI 31,417 29,442 60,859 13,258 12,123 25,381 19,715 17,763 37,478 44,675 41,565 86,240 51,132 47,205 98,337 16,190 15,142 31,332 60,865 56,707 117,572
34 YADAGIRI 73,489 64,438 137,927 19,599 15,257 34,856 27,188 20,797 47,985 93,088 79,695 172,783 100,677 85,235 185,912 19,561 13,978 33,539 112,649 93,673 206,322
Total 2,801,529 2,613,045 5,414,574 1,037,737 972,812 2,010,549 1,536,864 1,430,580 2,967,444 3,839,266 3,585,857 7,425,123 4,338,393 4,043,625 8,382,018 1,350,548 1,253,698 2,604,246 5,189,814 4,839,555 10,029,369
Boys
Class 6 to 8 Class 1 to 7 Class 1 to 8 Class 8 to 10 Class 1 to 10
Girls TotalBoys Girls TotalBoys Girls TotalBoys Girls TotalBoys Girls TotalBoys Girls TotalBoys

81
Annexure - 6 A
District wise / Class Wise Enrolment in All Management Schools
E-Govenace Unit, SSA, BangaloreSource: DISE 2010-11
SlNo
District Class 1 Class 2 Class 3 Class 4 Class 5 Class 6 Class 7 Class 8 Class 9 Class 10 Total
1 BAGALKOT 43,408 39,339 39,772 40,384 39,264 35,764 31,761 30,204 26,999 24,814 351,709
2 BANGALORE RURAL 14,775 13,824 13,895 14,280 15,083 14,963 14,786 14,449 13,392 13,024 142,471
3 BANGALORE U NORTH 59,900 57,042 56,228 56,120 57,530 55,353 52,892 52,550 49,182 44,361 541,158
4 BANGALORE U SOUTH 87,120 80,818 79,076 78,335 78,600 73,935 70,979 71,047 65,383 56,766 742,059
5 BELGAUM 38,882 36,677 37,979 39,707 39,885 37,749 36,774 36,809 33,415 30,822 368,699
6 BELGAUM CHIKKODI 50,832 48,556 50,036 50,780 49,126 46,238 45,377 44,770 39,663 35,681 461,059
7 BELLARY 53,156 47,321 48,030 48,212 45,869 42,920 37,150 35,455 30,187 25,251 413,551
8 BIDAR 48,902 45,734 45,518 46,295 43,985 40,489 36,708 31,022 26,476 22,897 388,026
9 BIJAPUR 59,985 55,330 56,623 57,664 54,036 47,258 41,570 36,543 32,603 29,662 471,274
10 CHAMARAJANAGARA 14,620 14,063 14,024 14,613 15,589 15,290 13,895 14,770 13,256 12,282 142,402
11 CHIKKABALLAPURA 21,223 18,874 18,827 19,921 20,450 20,495 19,286 20,198 17,742 17,348 194,364
12 CHIKKAMANGALORE 16,273 15,986 16,304 17,144 17,963 18,576 17,924 19,339 17,668 15,710 172,887
13 CHITRADURGA 28,024 27,375 27,469 28,593 28,641 30,351 27,893 27,575 24,922 23,871 274,714
14 DAKSHINA KANNADA 31,983 31,272 32,191 33,888 35,447 36,619 34,170 37,985 35,725 30,584 339,864
15 DAVANAGERE 36,052 34,863 35,668 36,738 36,709 35,371 33,171 32,776 29,768 26,172 337,288
16 DHARWAD 35,583 34,488 35,671 36,139 36,835 35,359 33,830 33,179 29,115 26,920 337,119
17 GADAG 19,553 19,219 20,420 20,722 20,613 19,791 17,840 17,746 15,911 14,391 186,206
18 GULBARGA 64,423 60,215 59,673 59,159 55,473 51,589 45,214 39,306 34,658 31,201 500,911
19 HASSAN 24,747 24,183 24,362 25,740 26,876 27,665 26,537 28,385 26,310 24,126 258,931
20 HAVERI 29,786 28,327 29,260 29,845 29,805 28,725 27,384 26,852 22,789 20,722 273,495
21 KODAGU 8,789 8,681 8,947 9,260 9,581 9,918 9,245 9,886 9,600 7,801 91,708
22 KOLAR 26,798 24,418 24,393 25,825 26,154 26,088 24,534 25,322 22,978 21,586 248,096
23 KOPPAL 31,588 29,435 31,220 31,076 30,000 27,374 24,240 21,767 18,161 15,413 260,274
24 MANDYA 26,057 25,323 24,413 25,675 26,415 27,205 25,192 27,471 25,714 25,126 258,591
25 MYSORE 46,671 45,297 44,353 47,018 49,565 49,799 46,718 47,907 44,192 40,767 462,287
26 RAICHUR 45,567 42,437 43,757 42,922 39,500 34,338 29,945 24,878 21,483 18,923 343,750
27 RAMANAGARA 15,653 14,921 15,550 15,334 15,968 16,090 15,876 16,137 15,077 14,949 155,555
28 SHIMOGA 29,528 28,557 28,868 30,239 31,040 31,058 29,617 31,431 28,329 24,720 293,387
29 TUMKUR 24,409 23,608 23,105 24,961 26,345 27,340 26,130 27,922 26,478 26,533 256,831
30 TUMKUR MADHUGIRI 15,508 14,327 14,449 15,784 15,982 16,432 15,294 16,717 15,609 15,660 155,762
31 UDUPI 15,709 15,268 15,564 16,593 17,587 18,298 16,970 18,806 18,617 16,669 170,081
32 UTTARA KANNADA 10,058 10,350 10,509 11,293 11,769 11,651 11,319 12,465 11,326 10,226 110,966
33 UTTARA KANNADA SIRSI 12,242 11,332 12,017 12,442 12,826 13,102 12,279 12,097 10,684 8,551 117,572
34 YADAGIRI 31,390 28,270 27,995 26,605 23,667 19,042 15,814 13,129 11,140 9,270 206,322
Total 1,119,194 1,055,730 1,066,166 1,089,306 1,084,178 1,042,235 968,314 956,895 864,552 782,799 10,029,369
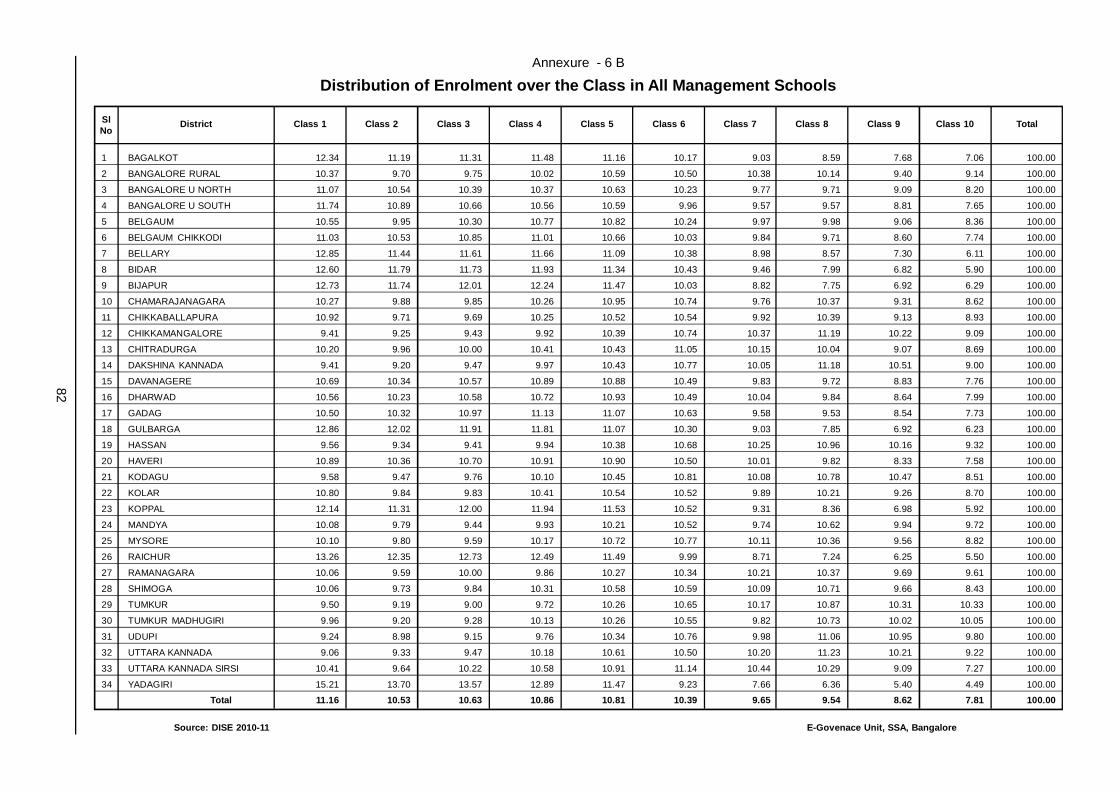
82
Annexure - 6 B
Distribution of Enrolment over the Class in All Management Schools
E-Govenace Unit, SSA, BangaloreSource: DISE 2010-11
SlNo
District Class 1 Class 2 Class 3 Class 4 Class 5 Class 6 Class 7 Class 8 Class 9 Class 10 Total
1 BAGALKOT 12.34 11.19 11.31 11.48 11.16 10.17 9.03 8.59 7.68 7.06 100.00
2 BANGALORE RURAL 10.37 9.70 9.75 10.02 10.59 10.50 10.38 10.14 9.40 9.14 100.00
3 BANGALORE U NORTH 11.07 10.54 10.39 10.37 10.63 10.23 9.77 9.71 9.09 8.20 100.00
4 BANGALORE U SOUTH 11.74 10.89 10.66 10.56 10.59 9.96 9.57 9.57 8.81 7.65 100.00
5 BELGAUM 10.55 9.95 10.30 10.77 10.82 10.24 9.97 9.98 9.06 8.36 100.00
6 BELGAUM CHIKKODI 11.03 10.53 10.85 11.01 10.66 10.03 9.84 9.71 8.60 7.74 100.00
7 BELLARY 12.85 11.44 11.61 11.66 11.09 10.38 8.98 8.57 7.30 6.11 100.00
8 BIDAR 12.60 11.79 11.73 11.93 11.34 10.43 9.46 7.99 6.82 5.90 100.00
9 BIJAPUR 12.73 11.74 12.01 12.24 11.47 10.03 8.82 7.75 6.92 6.29 100.00
10 CHAMARAJANAGARA 10.27 9.88 9.85 10.26 10.95 10.74 9.76 10.37 9.31 8.62 100.00
11 CHIKKABALLAPURA 10.92 9.71 9.69 10.25 10.52 10.54 9.92 10.39 9.13 8.93 100.00
12 CHIKKAMANGALORE 9.41 9.25 9.43 9.92 10.39 10.74 10.37 11.19 10.22 9.09 100.00
13 CHITRADURGA 10.20 9.96 10.00 10.41 10.43 11.05 10.15 10.04 9.07 8.69 100.00
14 DAKSHINA KANNADA 9.41 9.20 9.47 9.97 10.43 10.77 10.05 11.18 10.51 9.00 100.00
15 DAVANAGERE 10.69 10.34 10.57 10.89 10.88 10.49 9.83 9.72 8.83 7.76 100.00
16 DHARWAD 10.56 10.23 10.58 10.72 10.93 10.49 10.04 9.84 8.64 7.99 100.00
17 GADAG 10.50 10.32 10.97 11.13 11.07 10.63 9.58 9.53 8.54 7.73 100.00
18 GULBARGA 12.86 12.02 11.91 11.81 11.07 10.30 9.03 7.85 6.92 6.23 100.00
19 HASSAN 9.56 9.34 9.41 9.94 10.38 10.68 10.25 10.96 10.16 9.32 100.00
20 HAVERI 10.89 10.36 10.70 10.91 10.90 10.50 10.01 9.82 8.33 7.58 100.00
21 KODAGU 9.58 9.47 9.76 10.10 10.45 10.81 10.08 10.78 10.47 8.51 100.00
22 KOLAR 10.80 9.84 9.83 10.41 10.54 10.52 9.89 10.21 9.26 8.70 100.00
23 KOPPAL 12.14 11.31 12.00 11.94 11.53 10.52 9.31 8.36 6.98 5.92 100.00
24 MANDYA 10.08 9.79 9.44 9.93 10.21 10.52 9.74 10.62 9.94 9.72 100.00
25 MYSORE 10.10 9.80 9.59 10.17 10.72 10.77 10.11 10.36 9.56 8.82 100.00
26 RAICHUR 13.26 12.35 12.73 12.49 11.49 9.99 8.71 7.24 6.25 5.50 100.00
27 RAMANAGARA 10.06 9.59 10.00 9.86 10.27 10.34 10.21 10.37 9.69 9.61 100.00
28 SHIMOGA 10.06 9.73 9.84 10.31 10.58 10.59 10.09 10.71 9.66 8.43 100.00
29 TUMKUR 9.50 9.19 9.00 9.72 10.26 10.65 10.17 10.87 10.31 10.33 100.00
30 TUMKUR MADHUGIRI 9.96 9.20 9.28 10.13 10.26 10.55 9.82 10.73 10.02 10.05 100.00
31 UDUPI 9.24 8.98 9.15 9.76 10.34 10.76 9.98 11.06 10.95 9.80 100.00
32 UTTARA KANNADA 9.06 9.33 9.47 10.18 10.61 10.50 10.20 11.23 10.21 9.22 100.00
33 UTTARA KANNADA SIRSI 10.41 9.64 10.22 10.58 10.91 11.14 10.44 10.29 9.09 7.27 100.00
34 YADAGIRI 15.21 13.70 13.57 12.89 11.47 9.23 7.66 6.36 5.40 4.49 100.00
Total 11.16 10.53 10.63 10.86 10.81 10.39 9.65 9.54 8.62 7.81 100.00

83
Annexure- 7 A
Management wise Sanctioned post and Working Teachers - Lower Primary Schools
Sl.No.
District Name
Sanc
t
Wor
king
DOE Social Welfare Local Body Govt Aided Unaided Others Central Total
Sanc
t
Wor
king
Sanc
t
Wor
king
Sanc
t
Wor
king
Sanc
t
Wor
king
Sanc
t
Wor
king
Sanc
t
Wor
king
Sanc
t
Wor
king
Sanc
t
Wor
king
1 BAGALKOT 1,249 1,118 14 12 0 0 1,263 1,130 15 11 408 386 0 0 0 0 1,686 1,5272 BANGALORE RURAL 1,399 1,357 4 4 0 0 1,403 1,361 0 0 106 95 0 0 0 0 1,509 1,4563 BANGALORE U NORTH 604 578 5 3 0 0 609 581 66 41 533 533 0 0 0 0 1,208 1,1554 BANGALORE U SOUTH 993 967 11 10 9 9 1,013 986 86 52 963 949 0 0 2 2 2,064 1,9895 BELGAUM 1,530 1,458 14 12 4 4 1,548 1,474 2 2 390 392 0 0 0 0 1,940 1,8686 BELGAUM CHIKKODI 1,840 1,565 16 14 0 0 1,856 1,579 52 45 585 553 0 0 0 0 2,493 2,1777 BELLARY 1,423 1,298 25 17 0 0 1,448 1,315 31 29 898 777 0 0 0 0 2,377 2,1218 BIDAR 1,381 1,180 7 6 0 0 1,388 1,186 30 15 699 666 0 0 0 0 2,117 1,8679 BIJAPUR 1,867 1,766 43 37 0 0 1,910 1,803 86 84 778 751 0 0 0 0 2,774 2,63810 CHAMARAJANAGARA 890 821 68 55 0 0 958 876 12 11 185 179 0 0 0 0 1,155 1,06611 CHIKKABALLAPURA 2,091 1,955 13 11 0 0 2,104 1,966 1 1 150 168 0 0 0 0 2,255 2,13512 CHIKKAMANGALORE 1,616 1,471 48 47 0 0 1,664 1,518 9 9 235 199 0 0 0 0 1,908 1,72613 CHITRADURGA 1,709 1,648 15 8 0 0 1,724 1,656 13 11 196 237 0 0 0 0 1,933 1,90414 DAKSHINA KANNADA 618 550 26 15 0 0 644 565 109 53 276 253 0 0 0 0 1,029 87115 DAVANAGERE 1,650 1,590 12 10 0 0 1,662 1,600 31 31 646 645 6 6 0 0 2,345 2,28216 DHARWAD 618 586 7 6 3 3 628 595 26 22 362 333 0 0 0 0 1,016 95017 GADAG 582 552 8 7 0 0 590 559 21 21 200 210 0 0 0 0 811 79018 GULBARGA 2,062 1,872 19 14 0 0 2,281 1,886 87 60 568 475 6 6 0 0 2,869 2,74219 HASSAN 3,100 2,992 17 18 0 0 3,117 3,010 1 0 143 333 0 0 0 0 3,261 3,34320 HAVERI 1,170 1,097 34 30 17 16 1,221 1,143 9 7 387 378 0 0 0 0 1,617 1,52821 KODAGU 327 298 3 2 0 0 330 300 8 5 70 63 0 0 0 0 408 36822 KOLAR 2,582 2,517 6 6 0 0 2,588 2,523 4 4 207 213 0 0 0 0 2,799 2,74023 KOPPAL 1,059 965 5 3 0 0 1,064 968 15 15 224 269 8 8 0 8 1,311 1,26824 MANDYA 1,834 1,757 6 5 0 0 1,840 1,762 18 17 358 332 0 0 0 0 2,216 2,11125 MYSORE 2,387 2,242 10 10 6 5 2,403 2,257 54 33 554 539 0 0 0 0 3,011 2,82926 RAICHUR 1,846 1,751 38 33 0 0 1,884 1,784 30 22 617 657 0 0 0 0 2,531 2,46327 RAMANAGARA 1,859 1,779 11 10 0 0 1,870 1,789 16 13 104 135 0 0 0 0 1,990 1,93728 SHIMOGA 1,984 1,856 15 12 0 0 1,999 1,868 9 9 233 234 5 5 0 0 2,246 2,11629 TUMKUR 2,819 2,760 14 10 0 0 2,833 2,770 4 4 247 240 0 0 0 0 3,084 3,01430 TUMKUR MADHUGIRI 1,517 1,450 12 10 0 0 1,529 1,460 0 0 131 126 0 0 0 0 1,660 1,58631 UDUPI 566 531 13 7 0 0 579 538 60 35 54 49 0 0 0 0 693 62232 UTTARA KANNADA 1,072 1,019 1 1 0 0 1,073 1,020 14 8 102 98 0 0 14 14 1,203 1,14033 UTTARA KANNADA SIRSI 1,343 1,080 15 12 0 0 1,358 1,092 4 3 32 32 0 0 0 0 1,394 1,12734 YADAGIRI 1,178 1,095 5 5 0 0 1,183 1,100 15 15 339 320 0 0 0 0 1,537 1,435
TOTAL 50,765 47,521 560 462 39 37 51,364 48,020 938 688 11,980 11,819 25 25 16 24 64,323 60,576
E-Govenace Unit, SSA, BangaloreSource: DISE 2010-11

84
Annexure- 7 B
Management wise Sanctioned post and Working Teachers - Upper Primary Schools
Sl.No.
District Name
Sanc
t
Wor
king
DOE Social Welfare Local Body Govt Aided Unaided Others Central Total
Sanc
t
Wor
king
Sanc
t
Wor
king
Sanc
t
Wor
king
Sanc
t
Wor
king
Sanc
t
Wor
king
Sanc
t
Wor
king
Sanc
t
Wor
king
Sanc
t
Wor
king
1 BAGALKOT 6,174 5,757 122 88 0 0 6,296 5,845 550 478 1,426 1,405 36 11 0 0 8,308 7,7392 BANGALORE RURAL 2,646 2,437 17 15 0 0 2,663 2,452 115 108 1,736 1,538 22 22 11 11 4,547 4,1313 BANGALORE U NORTH 2,098 2,046 29 29 52 50 2,179 2,125 1,551 1,274 10,642 10,302 150 150 165 159 14,687 14,0104 BANGALORE U SOUTH 3,336 3,219 12 10 29 27 3,377 3,256 1,561 1,317 14,683 14,194 149 149 125 123 19,895 19,0395 BELGAUM 6,367 6,186 44 25 0 0 6,411 6,211 394 365 1,251 1,253 68 68 0 0 8,124 7,8976 BELGAUM CHIKKODI 7,514 6,844 165 144 4 4 7,683 6,992 692 642 2,239 2,119 50 46 0 0 10,664 9,7997 BELLARY 7,343 6,306 194 191 0 0 7,537 6,497 594 515 2,657 2,363 91 81 0 0 10,879 9,4568 BIDAR 5,608 5,144 130 117 7 7 5,745 5,268 1,524 1,362 2,150 2,075 52 48 0 0 9,471 8,7539 BIJAPUR 7,442 7,100 138 124 0 0 7,580 7,224 739 649 1,780 1,732 65 56 5 5 10,169 9,66610 CHAMARAJANAGARA 2,526 2,353 91 79 0 0 2,617 2,432 186 177 578 551 31 26 0 0 3,412 3,18611 CHIKKABALLAPURA 2,910 2,806 103 108 0 0 3,013 2,914 266 246 1,541 1,791 26 26 0 0 4,846 4,97712 CHIKKAMANGALORE 4,048 3,779 161 145 0 0 4,209 3,924 204 160 1,153 971 43 35 5 5 5,614 5,09513 CHITRADURGA 5,355 5,165 149 124 0 0 5,504 5,289 453 404 847 841 22 21 0 0 6,826 6,55514 DAKSHINA KANNADA 4,224 3,952 59 26 0 0 4,283 3,978 2,165 1,254 1,873 1,854 33 30 0 0 8,354 7,11615 DAVANAGERE 5,027 4,898 135 134 0 0 5,162 5,032 927 860 1,870 1,834 13 13 0 0 7,972 7,73916 DHARWAD 4,528 4,388 101 78 75 74 4,704 4,540 993 815 2,290 2,031 94 94 0 0 8,081 7,48017 GADAG 3,383 3,230 78 63 56 40 3,517 3,333 346 313 696 704 30 19 15 15 4,604 4,38418 GULBARGA 8,027 7,524 193 171 0 0 8,220 7,695 1,344 1,174 2,614 2,445 16 16 0 0 12,194 11,33019 HASSAN 4,705 4,497 92 170 0 0 4,797 4,667 276 235 878 1,713 49 52 0 0 6,000 6,66720 HAVERI 5,171 4,912 145 113 28 25 5,344 5,050 334 316 972 964 48 44 0 0 6,698 6,37421 KODAGU 1,680 1,545 88 73 24 9 1,792 1,627 108 90 798 786 37 33 2 2 2,737 2,53822 KOLAR 3,512 3,439 81 81 0 0 3,593 3,520 287 238 2,201 2,168 12 13 11 11 6,104 5,95023 KOPPAL 4,824 4,340 27 26 0 0 4,851 4,366 127 120 739 755 24 21 0 0 5,741 5,26224 MANDYA 4,134 3,930 159 148 0 0 4,293 4,078 266 230 1,931 1,823 18 18 0 0 6,508 6,14925 MYSORE 6,369 5,975 243 149 14 14 6,626 6,138 753 543 3,528 3,303 184 164 0 0 11,091 10,14826 RAICHUR 7,015 6,321 115 112 0 0 7,130 6,433 460 323 1,965 2,111 49 34 0 0 9,604 8,90127 RAMANAGARA 2,496 2,349 91 109 0 0 2,587 2,458 180 159 1,072 1,130 0 0 0 0 3,839 3,74728 SHIMOGA 5,121 4,840 123 103 0 0 5,244 4,943 491 435 1,523 1,450 10 10 0 0 7,268 6,83829 TUMKUR 3,884 3,770 7 7 0 0 3,891 3,777 356 312 1,852 1,759 36 34 0 0 6,135 5,88230 TUMKUR MADHUGIRI 2,917 2,783 92 85 0 0 3,009 2,868 63 51 778 770 8 8 0 0 3,858 3,69731 UDUPI 2,192 2,096 42 37 3 3 2,237 2,136 1,498 937 984 935 22 22 0 0 4,741 4,03032 UTTARA KANNADA 2,551 2,453 17 12 0 0 2,568 2,465 247 192 465 437 97 58 0 0 3,377 3,15233 UTTARA KANNADA SIRSI 2,570 2,313 49 31 0 0 2,619 2,344 121 87 409 283 36 28 0 0 3,185 2,74234 YADAGIRI 3,591 3,233 122 86 0 0 3,713 3,319 182 160 578 578 0 0 0 0 4,473 4,057
TOTAL 151,288 141,930 3,414 3,013 292 253 154,994 145,196 20,353 16,541 72,699 70,968 1,621 1,450 339 331 250,006 234,486
E-Govenace Unit, SSA, BangaloreSource: DISE 2010-11

85
Annexure- 7 C
Management wise Sanctioned post and Working Teachers - Elementary Schools
Sl.No.
District Name
Sanc
t
Wor
king
DOE Social Welfare Local Body Govt Aided Unaided Others Central Total
Sanc
t
Wor
king
Sanc
t
Wor
king
Sanc
t
Wor
king
Sanc
t
Wor
king
Sanc
t
Wor
king
Sanc
t
Wor
king
Sanc
t
Wor
king
Sanc
t
Wor
king
1 BAGALKOT 7,423 6,875 136 100 0 0 7,559 6,975 565 489 1,834 1,791 36 11 0 0 9,994 9,2662 BANGALORE RURAL 4,045 3,794 21 19 0 0 4,066 3,813 115 108 1,842 1,633 22 22 11 11 6,056 5,5873 BANGALORE U NORTH 2,702 2,624 34 32 52 50 2,788 2,706 1,617 1,315 11,175 10,835 150 150 165 159 15,895 15,1654 BANGALORE U SOUTH 4,329 4,186 23 20 38 36 4,390 4,242 1,647 1,369 15,646 15,143 149 149 127 125 21,959 21,0285 BELGAUM 7,897 7,644 58 37 4 4 7,959 7,685 396 367 1,641 1,645 68 68 0 0 10,064 9,7656 BELGAUM CHIKKODI 9,354 8,409 181 158 4 4 9,539 8,571 744 687 2,824 2,672 50 46 0 0 13,157 11,9767 BELLARY 8,766 7,604 219 208 0 0 8,985 7,812 625 544 3,555 3,140 91 81 0 0 13,256 11,5778 BIDAR 6,989 6,324 137 123 7 7 7,133 6,454 1,554 1,377 2,849 2,741 52 48 0 0 11,588 10,6209 BIJAPUR 9,309 8,866 181 161 0 0 9,490 9,027 825 733 2,558 2,483 65 56 5 5 12,943 12,30410 CHAMARAJANAGARA 3,416 3,174 159 134 0 0 3,575 3,308 198 188 763 730 31 26 0 0 4,567 4,25211 CHIKKABALLAPURA 5,001 4,761 116 119 0 0 5,117 4,880 267 247 1,691 1,959 26 26 0 0 7,101 7,11212 CHIKKAMANGALORE 5,664 5,250 209 192 0 0 5,873 5,442 213 169 1,388 1,170 43 35 5 5 7,522 6,82113 CHITRADURGA 7,064 6,813 164 132 0 0 7,228 6,945 466 415 1,043 1,078 22 21 0 0 8,759 8,45914 DAKSHINA KANNADA 4,842 4,502 85 41 0 0 4,927 4,543 2,274 1,307 2,149 2,107 33 30 0 0 9,383 7,98715 DAVANAGERE 6,677 6,488 147 144 0 0 6,824 6,632 958 891 2,516 2,479 19 19 0 0 10,317 10,02116 DHARWAD 5,146 4,974 108 84 78 77 5,332 5,135 1,019 837 2,652 2,364 94 94 0 0 9,097 8,43017 GADAG 3,965 3,782 86 70 56 40 4,107 3,892 367 334 896 914 30 19 15 15 5,415 5,17418 GULBARGA 10,089 9,396 212 185 0 0 10,301 9,581 1,431 1,234 3,182 2,920 22 22 0 0 14,936 13,75719 HASSAN 7,805 7,489 109 188 0 0 7,914 7,677 277 235 1,021 2,046 49 52 0 0 9,261 10,01020 HAVERI 6,341 6,009 179 143 45 41 6,565 6,193 343 323 1,359 1,342 48 44 0 0 8,315 7,90221 KODAGU 2,007 1,843 91 75 24 9 2,122 1,927 116 95 868 849 37 33 2 2 3,145 2,90622 KOLAR 6,094 5,956 87 87 0 0 6,181 6,043 291 242 2,408 2,381 12 13 11 11 8,903 8,69023 KOPPAL 5,883 5,305 32 29 0 0 5,915 5,334 142 135 963 1,024 32 29 0 8 7,052 6,53024 MANDYA 5,968 5,687 165 153 0 0 6,133 5,840 284 247 2,289 2,155 18 18 0 0 8,724 8,26025 MYSORE 8,756 8,217 253 159 20 19 9,029 8,395 807 576 4,082 3,842 184 164 0 0 14,102 12,97726 RAICHUR 8,861 8,072 153 145 0 0 9,014 8,217 490 345 2,582 2,768 49 34 0 0 12,135 11,36427 RAMANAGARA 4,355 4,128 102 119 0 0 4,457 4,247 196 172 1,176 1,265 0 0 0 0 5,829 5,68428 SHIMOGA 7,105 6,696 138 115 0 0 7,243 6,811 500 444 1,756 1,684 15 15 0 0 9,514 8,95429 TUMKUR 6,703 6,530 21 17 0 0 6,724 6,547 360 316 2,099 1,999 36 34 0 0 9,219 8,89630 TUMKUR MADHUGIRI 4,434 4,233 104 95 0 0 4,538 4,328 63 51 909 896 8 8 0 0 5,518 5,28331 UDUPI 2,758 2,627 55 44 3 3 2,816 2,674 1,558 972 1,038 984 22 22 0 0 5,434 4,65232 UTTARA KANNADA 3,623 3,472 18 13 0 0 3,641 3,485 261 200 567 535 97 58 14 14 4,580 4,29233 UTTARA KANNADA SIRSI 3,913 3,393 64 43 0 0 3,977 3,436 125 90 441 315 36 28 0 0 4,579 3,86934 YADAGIRI 4,769 4,328 127 91 0 0 4,896 4,419 197 175 917 898 0 0 0 0 6,010 5,492
TOTAL 202,053 189,451 3,974 3,475 331 290 206,358 193,216 21,291 17,229 84,679 82,787 1,646 1,475 355 355 314,329 295,062
E-Govenace Unit, SSA, BangaloreSource: DISE 2010-11

86
Annexure- 7 D
Management wise Sanctioned post and Working Teachers - High School
Sl.No.
District Name
Sanc
t
Wor
king
DOE Social Welfare Local Body Govt Aided Unaided Others Central Total
Sanc
t
Wor
king
Sanc
t
Wor
king
Sanc
t
Wor
king
Sanc
t
Wor
king
Sanc
t
Wor
king
Sanc
t
Wor
king
Sanc
t
Wor
king
Sanc
t
Wor
king
1 BAGALKOT 1,326 1,227 132 98 18 12 1,476 1,337 1,035 923 780 768 36 11 0 0 3,327 3,0392 BANGALORE RURAL 778 610 11 9 0 0 789 619 380 305 1,295 1,162 22 22 0 0 2,486 2,1083 BANGALORE U NORTH 667 603 22 22 179 123 868 748 1,279 1,153 9,606 9,318 166 165 127 121 12,046 11,5054 BANGALORE U SOUTH 902 845 12 10 128 94 1,042 949 1,576 1,390 12,484 12,058 149 149 70 70 15,321 14,6165 BELGAUM 1,084 1,038 28 20 0 0 1,112 1,058 1,692 1,569 903 889 29 29 0 0 3,736 3,5456 BELGAUM CHIKKODI 1,341 1,205 146 125 15 12 1,502 1,342 1,629 1,412 1,259 1,161 40 36 0 0 4,430 3,9517 BELLARY 1,728 1,513 179 138 0 0 1,907 1,651 827 699 1,635 1,504 88 88 0 0 4,457 3,9428 BIDAR 1,540 1,376 90 78 0 0 1,630 1,454 983 929 1,435 1,396 52 48 0 0 4,100 3,8279 BIJAPUR 1,090 1,012 122 108 0 0 1,212 1,120 1,886 1,638 887 856 65 56 0 0 4,050 3,67010 CHAMARAJANAGARA 858 758 84 72 0 0 942 830 298 270 463 448 22 20 9 8 1,734 1,57611 CHIKKABALLAPURA 1,052 903 54 52 0 0 1,106 955 358 327 999 1,068 18 18 0 0 2,481 2,36812 CHIKKAMANGALORE 1,197 1,035 151 140 0 0 1,348 1,175 996 873 687 620 43 35 0 0 3,074 2,70313 CHITRADURGA 1,114 1,011 110 85 0 0 1,224 1,096 1,626 1,441 515 521 22 21 0 0 3,387 3,07914 DAKSHINA KANNADA 1,573 1,283 69 39 0 0 1,642 1,322 1,304 1,036 1,379 1,341 31 28 0 0 4,356 3,72715 DAVANAGERE 1,548 1,422 118 115 0 0 1,666 1,537 1,457 1,324 1,148 1,114 13 13 0 0 4,284 3,98816 DHARWAD 857 761 62 39 120 112 1,039 912 1,495 1,190 1,805 1,566 94 94 4 4 4,437 3,76617 GADAG 769 696 68 53 56 40 893 789 844 738 598 623 24 15 15 15 2,374 2,18018 GULBARGA 2,401 2,157 168 149 0 0 2,569 2,306 853 762 1,992 1,758 16 16 0 0 5,430 4,84219 HASSAN 2,345 2,000 79 153 0 0 2,424 2,153 1,078 973 480 974 49 52 0 0 4,031 4,15220 HAVERI 1,235 1,123 140 109 41 28 1,416 1,260 1,278 1,163 755 749 48 44 0 0 3,497 3,21621 KODAGU 514 409 47 46 0 0 561 455 441 383 547 545 37 33 6 4 1,592 1,42022 KOLAR 1,230 1,078 65 65 0 0 1,295 1,143 504 439 1,371 1,337 7 7 11 11 3,188 2,93723 KOPPAL 1,306 1,144 27 26 0 0 1,333 1,170 247 210 232 359 24 21 0 0 1,836 1,76024 MANDYA 2,052 1,792 143 136 0 0 2,195 1,928 654 534 1,085 1,045 18 18 0 0 3,952 3,52525 MYSORE 2,210 1,985 157 99 0 0 2,367 2,084 962 809 2,659 2,485 184 164 0 0 6,172 5,54226 RAICHUR 1,630 1,437 115 112 0 0 1,745 1,549 353 284 1,322 1,385 49 34 0 0 3,469 3,25227 RAMANAGARA 976 842 91 109 0 0 1,067 951 551 462 761 772 0 0 0 0 2,379 2,18528 SHIMOGA 1,632 1,511 104 87 0 0 1,736 1,598 1,098 957 863 814 10 10 0 0 3,707 3,37929 TUMKUR 1,337 1,154 4 4 0 0 1,341 1,158 1,813 1,624 1,073 1,033 36 34 0 0 4,263 3,84930 TUMKUR MADHUGIRI 931 851 82 75 0 0 1,013 926 842 800 482 464 0 0 0 0 2,337 2,19031 UDUPI 1,087 996 23 18 3 3 1,113 1,017 730 595 762 713 22 22 0 0 2,627 2,34732 UTTARA KANNADA 449 405 17 12 0 0 466 417 784 652 374 353 97 58 0 0 1,721 1,48033 UTTARA KANNADA SIRSI 673 591 37 28 0 0 710 619 486 404 218 213 36 28 0 0 1,450 1,26434 YADAGIRI 1,422 979 122 86 0 0 1,544 1,065 111 80 356 326 0 0 0 0 2,011 1,471
TOTAL 42,854 37,752 2,879 2,517 560 424 46,293 40,693 32,450 28,348 53,210 51,738 1,547 1,389 242 233 133,742 122,401
E-Govenace Unit, SSA, BangaloreSource: DISE 2010-11

87
Annexure- 8 A
District Wise Pupil Teacher Ratio in Education Department (Teachers Sanctioned) - Descending Order
Sl.No. District Name
1 YADAGIRI 1,178 30,183 25.62 YADAGIRI 3,591 113,855 31.71 YADAGIRI 4,769 144,038 30.20
2 KOPPAL 1,059 26,483 25.01 BIJAPUR 7,442 234,881 31.56 DHARWAD 5,146 153,752 29.88
3 BELLARY 1,423 30,342 21.32 DHARWAD 4,528 140,893 31.12 BIJAPUR 9,309 271,341 29.15
4 GADAG 582 12,378 21.27 KOPPAL 4,824 138,971 28.81 KOPPAL 5,883 165,454 28.12
5 DHARWAD 618 12,859 20.81 BANGALORE U NORTH 2,098 59,431 28.13 BAGALKOT 7,423 198,246 26.71
6 RAICHUR 1,846 38,139 20.66 BAGALKOT 6,174 173,637 28.12 BELLARY 8,766 228,386 26.05
7 BAGALKOT 1,249 24,609 19.70 BANGALORE U SOUTH 3,336 93,301 27.97 BANGALORE U SOUTH 4,329 111,920 25.85
8 BIJAPUR 1,867 36,460 19.53 BELGAUM CHIKKODI 7,514 204,177 27.17 BANGALORE U NORTH 2,702 69,813 25.84
9 GULBARGA 2,062 40,235 19.51 GULBARGA 8,027 217,545 27.10 GULBARGA 10,089 257,780 25.55
10 BANGALORE U SOUTH 993 18,619 18.75 BELGAUM 6,367 172,131 27.03 GADAG 3,965 101,616 25.63
11 BIDAR 1,381 24,342 17.63 BELLARY 7,343 198,044 26.97 BELGAUM CHIKKODI 9,354 236,185 25.25
12 BELGAUM CHIKKODI 1,840 32,008 17.40 HAVERI 5,171 136,989 26.49 BELGAUM 7,897 195,389 24.74
13 BANGALORE U NORTH 604 10,382 17.19 GADAG 3,383 89,238 26.38 HAVERI 6,341 156,374 24.66
14 HAVERI 1,170 19,385 16.57 BIDAR 5,608 143,528 25.59 RAICHUR 8,861 213,650 24.11
15 DAVANAGERE 1,650 26,185 15.87 RAICHUR 7,015 175,511 25.02 BIDAR 6,989 167,870 24.02
16 BELGAUM 1,530 23,258 15.20 DAKSHINA KANNADA 4,224 101,015 23.91 DAKSHINA KANNADA 4,842 110,115 22.74
17 DAKSHINA KANNADA 618 9,100 14.72 CHAMARAJANAGARA 2,526 59,316 23.48 DAVANAGERE 6,677 142,834 21.39
18 MYSORE 2,387 34,853 14.60 MYSORE 6,369 149,367 23.45 MYSORE 8,756 184,220 21.04
19 CHAMARAJANAGARA 890 12,492 14.04 DAVANAGERE 5,027 116,649 23.20 CHAMARAJANAGARA 3,416 71,808 21.02
20 MANDYA 1,834 25,423 13.86 CHITRADURGA 5,355 120,709 22.54 CHITRADURGA 7,064 143,936 20.38
21 KOLAR 2,582 35,765 13.85 TUMKUR MADHUGIRI 2,917 63,943 21.92 UDUPI 2,758 54,835 19.88
22 TUMKUR MADHUGIRI 1,517 20,728 13.66 MANDYA 4,134 89,616 21.68 MANDYA 5,968 115,039 19.28
23 CHITRADURGA 1,709 23,227 13.59 UDUPI 2,192 47,382 21.62 TUMKUR MADHUGIRI 4,434 84,671 19.10
24 UDUPI 566 7,453 13.17 UTTARA KANNADA SIRSI 2,570 54,886 21.36 SHIMOGA 7,105 128,309 18.06
25 SHIMOGA 1,984 25,803 13.01 CHIKKABALLAPURA 2,910 59,935 20.60 KODAGU 2,007 36,122 18.00
26 CHIKKABALLAPURA 2,091 26,615 12.73 TUMKUR 3,884 79,060 20.36 UTTARA KANNADA SIRSI 3,913 70,257 17.95
27 RAMANAGARA 1,859 23,310 12.54 KOLAR 3,512 71,514 20.36 KOLAR 6,094 107,279 17.60
28 KODAGU 327 3,873 11.84 SHIMOGA 5,121 102,506 20.02 CHIKKABALLAPURA 5,001 86,550 17.31
29 BANGALORE RURAL 1,399 16,253 11.62 RAMANAGARA 2,496 48,293 19.35 TUMKUR 6,703 110,964 16.55
30 UTTARA KANNADA SIRSI 1,343 15,371 11.45 KODAGU 1,680 32,249 19.20 RAMANAGARA 4,355 71,603 16.44
31 TUMKUR 2,819 31,904 11.32 HASSAN 4,705 84,348 17.93 BANGALORE RURAL 4,045 62,958 15.56
32 HASSAN 3,100 32,541 10.50 BANGALORE RURAL 2,646 46,705 17.65 UTTARA KANNADA 3,623 55,078 15.20
33 UTTARA KANNADA 1,072 11,199 10.45 UTTARA KANNADA 2,551 43,879 17.20 HASSAN 7,805 116,889 14.98
34 CHIKKAMANGALORE 1,616 16,140 9.99 CHIKKAMANGALORE 4,048 63,496 15.69 CHIKKAMANGALORE 5,664 79,636 14.06
Total 50,892 777,917 15.29 Total 151,591 3,727,000 24.59 Total 202,483 4,504,917 22.25
Source: DISE 2010-11
LPSDistrict name
Teachers Enrolment PTR
HPS
Teachers Enrolment PTRDistrict name
Teachers Enrolment PTR
E-Govenace Unit, SSA, Bangalore

88
Annexure- 8 B
District Wise Pupil Teacher Ratio in Education Department (Teachers Sanctioned) - Descending Order
Sl.No. District Name
1 YADAGIRI 1,095 30,183 27.56 YADAGIRI 3,233 113,855 35.22 YADAGIRI 4,328 144,038 33.28
2 KOPPAL 965 26,483 27.44 BIJAPUR 7,100 234,881 33.08 KOPPAL 5,305 165,454 31.19
3 BELLARY 1,298 30,342 23.38 DHARWAD 4,388 140,893 32.11 DHARWAD 4,974 153,752 30.91
4 GADAG 552 12,378 22.42 KOPPAL 4,340 138,971 32.02 BIJAPUR 8,866 271,341 30.60
5 BAGALKOT 1,118 24,609 22.01 BELLARY 6,306 198,044 31.41 BELLARY 7,604 228,386 30.03
6 DHARWAD 586 12,859 21.94 BAGALKOT 5,757 173,637 30.16 BAGALKOT 6,875 198,246 28.84
7 RAICHUR 1,751 38,139 21.78 BELGAUM CHIKKODI 6,844 204,177 29.83 BELGAUM CHIKKODI 8,409 236,185 28.09
8 GULBARGA 1,872 40,235 21.49 BANGALORE U NORTH 2,046 59,431 29.05 GULBARGA 9,396 257,780 27.44
9 BIJAPUR 1,766 36,460 20.65 BANGALORE U SOUTH 3,219 93,301 28.98 GADAG 3,782 101,616 26.87
10 BIDAR 1,180 24,342 20.63 GULBARGA 7,524 217,545 28.91 BANGALORE U SOUTH 4,186 111,920 26.74
11 BELGAUM CHIKKODI 1,565 32,008 20.45 BIDAR 5,144 143,528 27.90 BANGALORE U NORTH 2,624 69,813 26.61
12 BANGALORE U SOUTH 967 18,619 19.25 HAVERI 4,912 136,989 27.89 BIDAR 6,324 167,870 26.54
13 BANGALORE U NORTH 578 10,382 17.96 BELGAUM 6,186 172,131 27.83 RAICHUR 8,072 213,650 26.47
14 HAVERI 1,097 19,385 17.67 RAICHUR 6,321 175,511 27.77 HAVERI 6,009 156,374 26.02
15 DAKSHINA KANNADA 550 9,100 16.55 GADAG 3,230 89,238 27.63 BELGAUM 7,644 195,389 25.56
16 DAVANAGERE 1,590 26,185 16.47 DAKSHINA KANNADA 3,952 101,015 25.56 DAKSHINA KANNADA 4,502 110,115 24.46
17 BELGAUM 1,458 23,258 15.95 CHAMARAJANAGARA 2,353 59,316 25.21 CHAMARAJANAGARA 3,174 71,808 22.62
18 MYSORE 2,242 34,853 15.55 MYSORE 5,975 149,367 25.00 MYSORE 8,217 184,220 22.42
19 CHAMARAJANAGARA 821 12,492 15.22 DAVANAGERE 4,898 116,649 23.82 DAVANAGERE 6,488 142,834 22.02
20 MANDYA 1,757 25,423 14.47 UTTARA KANNADA SIRSI 2,313 54,886 23.73 CHITRADURGA 6,813 143,936 21.13
21 TUMKUR MADHUGIRI 1,450 20,728 14.30 CHITRADURGA 5,165 120,709 23.37 UDUPI 2,627 54,835 20.87
22 UTTARA KANNADA SIRSI 1,080 15,371 14.23 TUMKUR MADHUGIRI 2,783 63,943 22.98 UTTARA KANNADA SIRSI 3,393 70,257 20.71
23 KOLAR 2,517 35,765 14.21 MANDYA 3,930 89,616 22.80 MANDYA 5,687 115,039 20.23
24 CHITRADURGA 1,648 23,227 14.09 UDUPI 2,096 47,382 22.61 TUMKUR MADHUGIRI 4,233 84,671 20.00
25 UDUPI 531 7,453 14.04 CHIKKABALLAPURA 2,806 59,935 21.36 KODAGU 1,843 36,122 19.60
26 SHIMOGA 1,856 25,803 13.90 SHIMOGA 4,840 102,506 21.18 SHIMOGA 6,696 128,309 19.16
27 CHIKKABALLAPURA 1,955 26,615 13.61 TUMKUR 3,770 79,060 20.97 CHIKKABALLAPURA 4,761 86,550 18.18
28 RAMANAGARA 1,779 23,310 13.10 KODAGU 1,545 32,249 20.87 KOLAR 5,956 107,279 18.01
29 KODAGU 298 3,873 13.00 KOLAR 3,439 71,514 20.79 RAMANAGARA 4,128 71,603 17.35
30 BANGALORE RURAL 1,357 16,253 11.98 RAMANAGARA 2,349 48,293 20.56 TUMKUR 6,530 110,964 16.99
31 TUMKUR 2,760 31,904 11.56 BANGALORE RURAL 2,437 46,705 19.16 BANGALORE RURAL 3,794 62,958 16.59
32 UTTARA KANNADA 1,019 11,199 10.99 HASSAN 4,497 84,348 18.76 UTTARA KANNADA 3,472 55,078 15.86
33 CHIKKAMANGALORE 1,471 16,140 10.97 UTTARA KANNADA 2,453 43,879 17.89 HASSAN 7,489 116,889 15.61
34 HASSAN 2,992 32,541 10.88 CHIKKAMANGALORE 3,779 63,496 16.80 CHIKKAMANGALORE 5,250 79,636 15.17
Total 47,521 777,917 16.37 Total 141,930 3,727,000 26.26 Total 189,451 4,504,917 23.78
Source: DISE 2010-11
LPSDistrict name
Teachers Enrolment PTR
HPS
Teachers Enrolment PTRDistrict name
Teachers Enrolment PTR
E-Govenace Unit, SSA, Bangalore

89
E-Govenace Unit, SSA, BangaloreSource: DISE 2010-11
Annexure - 9 A
Management wise / Geder wise Teachers Details - Lower Primary Schools
Contract Total
Total Teacher WorkingSlNo.
District NameDOE
1 BAGALKOT 1527 7 1534 752 366 4 8 0 0 756 374 7 5 109 283 0 0 0 0 872 662
2 BANGALORE RURAL 1456 1 1457 720 638 3 1 0 0 723 639 0 0 26 69 0 0 0 0 749 708
3 BANGALORE U NORTH 1155 10 1165 142 436 1 2 0 0 143 438 11 30 51 492 0 0 0 0 205 960
4 BANGALORE U SOUTH 1989 5 1994 211 756 4 6 2 7 217 769 11 41 95 859 0 0 0 2 323 1671
5 BELGAUM 1868 39 1907 878 580 4 8 1 3 883 591 1 1 116 315 0 0 0 0 1000 907
6 BELGAUM CHIKKODI 2177 13 2190 1042 523 9 5 0 0 1051 528 31 14 191 375 0 0 0 0 1273 917
7 BELLARY 2121 5 2126 806 492 10 7 0 0 816 499 8 21 201 581 0 0 0 0 1025 1101
8 BIDAR 1867 2 1869 746 434 2 4 0 0 748 438 15 0 174 494 0 0 0 0 937 932
9 BIJAPUR 2638 0 2638 1152 614 23 14 0 0 1175 628 76 8 307 444 0 0 0 0 1558 1080
10 CHAMARAJANAGARA 1066 9 1075 504 318 51 12 0 0 555 330 2 9 47 132 0 0 0 0 604 471
11 CHIKKABALLAPURA 2135 0 2135 1217 738 6 5 0 0 1223 743 0 1 41 127 0 0 0 0 1264 871
12 CHIKKAMANGALORE 1726 37 1763 953 518 21 26 0 0 974 544 0 9 34 202 0 0 0 0 1008 755
13 CHITRADURGA 1904 68 1972 1068 580 5 5 0 0 1073 585 11 0 72 231 0 0 0 0 1156 816
14 DAKSHINA KANNADA 871 16 887 188 362 7 18 0 0 195 380 16 37 11 248 0 0 0 0 222 665
15 DAVANAGERE 2282 0 2282 971 619 6 4 0 0 977 623 24 7 131 514 6 0 0 0 1138 1144
16 DHARWAD 950 0 950 251 335 3 3 1 2 255 340 12 10 42 291 0 0 0 0 309 641
17 GADAG 790 20 810 307 245 2 5 0 0 309 250 12 9 52 178 0 0 0 0 373 437
18 GULBARGA 2427 76 2503 1077 795 9 8 0 0 1086 803 33 35 155 385 3 3 0 0 1277 1226
19 HASSAN 3343 12 3355 1751 1242 9 9 0 0 1760 1251 0 0 58 286 0 0 0 0 1818 1537
20 HAVERI 1528 3 1531 716 381 18 12 3 13 737 406 7 0 91 290 0 0 0 0 835 696
21 KODAGU 368 1 369 91 207 3 0 0 0 94 207 0 5 1 62 0 0 0 0 95 274
22 KOLAR 2740 0 2740 1354 1163 1 5 0 0 1355 1168 0 4 32 181 0 0 0 0 1387 1353
23 KOPPAL 1268 116 1384 591 374 6 3 0 0 597 377 13 2 127 252 5 3 6 2 748 636
24 MANDYA 2111 4 2115 1129 628 3 4 0 0 1132 632 0 19 31 301 0 0 0 0 1163 952
25 MYSORE 2829 5 2834 1184 1058 3 8 0 5 1187 1071 1 32 64 479 0 0 0 0 1252 1582
26 RAICHUR 2463 5 2468 1085 667 19 14 0 0 1104 681 9 13 212 449 0 0 0 0 1325 1143
27 RAMANAGARA 1937 0 1937 936 843 4 6 0 0 940 849 13 0 15 120 0 0 0 0 968 969
28 SHIMOGA 2116 0 2116 1003 853 5 7 0 0 1008 860 3 6 38 196 5 0 0 0 1054 1062
29 TUMKUR 3014 4 3018 1410 1351 4 6 0 0 1414 1357 2 2 37 206 0 0 0 0 1453 1565
30 TUMKUR MADHUGIRI 1586 0 1586 921 529 6 4 0 0 927 533 0 0 21 105 0 0 0 0 948 638
31 UDUPI 622 5 627 289 242 2 5 0 0 291 247 20 15 3 51 0 0 0 0 314 313
32 UTTARA KANNADA 1140 0 1140 427 592 1 0 0 0 428 592 3 5 13 85 0 0 2 12 446 694
33 UTTARA KANNADA SIRSI 1127 2 1129 526 556 3 9 0 0 529 565 3 0 5 27 0 0 0 0 537 592
34 YADAGIRI 1435 8 1443 762 336 0 5 0 0 762 341 14 1 135 190 0 0 0 0 911 532
Total 60576 473 61049 27160 20371 257 238 7 30 27424 20639 358 341 2738 9500 19 6 8 16 30547 30502
Regular
Social Welfare Local Body Unaided Others Total
Female MaleMale Male FemaleFemale Female MaleMale Male FemaleFemale Female MaleMale Male FemaleFemale
Govt Aided Central

90
E-Govenace Unit, SSA, BangaloreSource: DISE 2010-11
Annexure - 9 B
Management wise / Geder wise Teachers Details - Upper Primary Schools
Contract Total
Total Teacher WorkingSlNo.
District NameDOE
1 BAGALKOT 7739 58 7797 3313 2448 81 32 0 0 3394 2480 378 100 632 779 28 6 0 0 4432 3365
2 BANGALORE RURAL 4131 37 4168 1067 1392 17 5 0 0 1084 1397 46 62 447 1099 14 8 3 8 1594 2574
3 BANGALORE U NORTH 14010 2 14012 381 1666 10 19 8 42 399 1727 341 933 1567 8736 37 113 18 141 2362 11650
4 BANGALORE U SOUTH 19039 25 19064 594 2625 7 3 2 25 603 2653 329 990 2418 11799 52 97 23 100 3425 15639
5 BELGAUM 7897 119 8016 2977 3209 38 10 0 0 3015 3219 184 187 416 927 32 36 0 0 3647 4369
6 BELGAUM CHIKKODI 9799 71 9870 3909 2936 125 41 4 0 4038 2977 447 195 1036 1131 17 29 0 0 5538 4332
7 BELLARY 9456 0 9456 3389 2917 138 53 0 0 3527 2970 371 144 748 1615 60 21 0 0 4706 4750
8 BIDAR 8753 8 8761 2795 2350 81 36 2 5 2878 2391 895 468 799 1282 34 14 0 0 4606 4155
9 BIJAPUR 9666 0 9666 4195 2905 98 26 0 0 4293 2931 463 186 799 933 51 5 4 1 5610 4056
10 CHAMARAJANAGARA 3186 1 3187 1170 1184 49 30 0 0 1219 1214 83 94 166 385 16 10 0 0 1484 1703
11 CHIKKABALLAPURA 4977 2 4979 1470 1338 53 55 0 0 1523 1393 153 93 644 1147 16 10 0 0 2336 2643
12 CHIKKAMANGALORE 5095 177 5272 1927 1852 92 66 0 0 2019 1918 73 92 265 865 24 11 3 2 2384 2888
13 CHITRADURGA 6555 300 6855 2653 2523 102 57 0 0 2755 2580 277 134 354 732 16 7 0 0 3402 3453
14 DAKSHINA KANNADA 7116 26 7142 968 2984 12 33 0 0 980 3017 341 913 199 1662 19 11 0 0 1539 5603
15 DAVANAGERE 7739 0 7739 2625 2273 93 41 0 0 2718 2314 642 218 616 1218 10 3 0 0 3986 3753
16 DHARWAD 7480 0 7480 1692 2696 57 21 37 37 1786 2754 419 396 497 1534 54 40 0 0 2756 4724
17 GADAG 4384 37 4421 1851 1379 39 24 31 9 1921 1412 228 85 281 460 11 8 14 1 2455 1966
18 GULBARGA 11330 89 11419 3847 3682 123 57 0 0 3970 3739 542 645 840 1667 13 3 0 0 5365 6054
19 HASSAN 6667 38 6705 2360 2137 87 93 0 0 2447 2230 101 141 458 1276 35 17 0 0 3041 3664
20 HAVERI 6374 6 6380 2740 2172 81 35 11 14 2832 2221 222 94 350 617 26 18 0 0 3430 2950
21 KODAGU 2538 36 2574 351 1195 59 49 2 7 412 1251 22 68 91 695 24 9 0 2 549 2025
22 KOLAR 5950 15 5965 1445 1994 55 36 0 0 1500 2030 84 156 512 1659 4 9 3 8 2103 3862
23 KOPPAL 5262 513 5775 2539 1804 87 41 0 0 2626 1845 94 26 516 647 14 7 0 0 3250 2525
24 MANDYA 6149 24 6173 2165 1766 85 71 0 0 2250 1837 86 146 421 1412 7 14 0 0 2764 3409
25 MYSORE 10148 164 10312 2605 3370 145 77 2 12 2752 3459 148 406 755 2628 81 83 0 0 3736 6576
26 RAICHUR 8901 5 8906 3358 2963 85 27 0 0 3443 2990 217 106 759 1357 13 21 0 0 4432 4474
27 RAMANAGARA 3747 75 3822 1064 1301 79 43 0 0 1143 1344 88 74 262 911 0 0 0 0 1493 2329
28 SHIMOGA 6838 17 6855 2138 2702 74 36 0 0 2212 2738 242 193 384 1076 5 5 0 0 2843 4012
29 TUMKUR 5882 82 5964 1623 2147 39 47 0 0 1662 2194 186 128 370 1390 19 15 0 0 2237 3727
30 TUMKUR MADHUGIRI 3697 15 3712 1570 1213 62 38 0 0 1632 1251 45 6 284 486 2 6 0 0 1963 1749
31 UDUPI 4030 47 4077 770 1326 10 27 0 3 780 1356 479 458 143 839 12 10 0 0 1414 2663
32 UTTARA KANNADA 3152 16 3168 721 1732 11 6 0 0 732 1738 115 79 78 368 33 25 0 0 958 2210
33 UTTARA KANNADA SIRSI 2742 53 2795 814 1499 25 25 0 0 839 1524 40 47 84 233 22 6 0 0 985 1810
34 YADAGIRI 4057 39 4096 1,972 1,270 82 22 0 0 2,054 1,292 121 46 224 359 0 0 0 0 2399 1697
Total 234486 2097 236583 69058 72950 2281 1282 99 154 71438 74386 8502 8109 18415 53924 801 677 68 263 99224 137359
Regular
Social Welfare Local Body Unaided Others Total
Female MaleMale Male FemaleFemale Female MaleMale Male FemaleFemale Female MaleMale Male FemaleFemale
Govt Aided Central

91
E-Govenace Unit, SSA, BangaloreSource: DISE 2010-11
Annexure - 9 C
Management wise / Geder wise Teachers Details - Elementary Schools
Contract Total
Total Teacher WorkingSlNo.
District NameDOE
1 BAGALKOT 9266 65 9331 4065 2814 85 40 0 0 4150 2854 385 105 741 1062 28 6 0 0 5304 4027
2 BANGALORE RURAL 5587 38 5625 1787 2030 20 6 0 0 1807 2036 46 62 473 1168 14 8 3 8 2343 3282
3 BANGALORE U NORTH 15165 12 15177 523 2102 11 21 8 42 542 2165 352 963 1618 9228 37 113 18 141 2567 12610
4 BANGALORE U SOUTH 21028 30 21058 805 3381 11 9 4 32 820 3422 340 1031 2513 12658 52 97 23 102 3748 17310
5 BELGAUM 9765 158 9923 3855 3789 42 18 1 3 3898 3810 185 188 532 1242 32 36 0 0 4647 5276
6 BELGAUM CHIKKODI 11976 84 12060 4951 3459 134 46 4 0 5089 3505 478 209 1227 1506 17 29 0 0 6811 5249
7 BELLARY 11577 5 11582 4195 3409 148 60 0 0 4343 3469 379 165 949 2196 60 21 0 0 5731 5851
8 BIDAR 10620 10 10630 3541 2784 83 40 2 5 3626 2829 910 468 973 1776 34 14 0 0 5543 5087
9 BIJAPUR 12304 0 12304 5347 3519 121 40 0 0 5468 3559 539 194 1106 1377 51 5 4 1 7168 5136
10 CHAMARAJANAGARA 4252 10 4262 1674 1502 100 42 0 0 1774 1544 85 103 213 517 16 10 0 0 2088 2174
11 CHIKKABALLAPURA 7112 2 7114 2687 2076 59 60 0 0 2746 2136 153 94 685 1274 16 10 0 0 3600 3514
12 CHIKKAMANGALORE 6821 214 7035 2880 2370 113 92 0 0 2993 2462 73 101 299 1067 24 11 3 2 3392 3643
13 CHITRADURGA 8459 368 8827 3721 3103 107 62 0 0 3828 3165 288 134 426 963 16 7 0 0 4558 4269
14 DAKSHINA KANNADA 7987 42 8029 1156 3346 19 51 0 0 1175 3397 357 950 210 1910 19 11 0 0 1761 6268
15 DAVANAGERE 10021 0 10021 3596 2892 99 45 0 0 3695 2937 666 225 747 1732 16 3 0 0 5124 4897
16 DHARWAD 8430 0 8430 1943 3031 60 24 38 39 2041 3094 431 406 539 1825 54 40 0 0 3065 5365
17 GADAG 5174 57 5231 2158 1624 41 29 31 9 2230 1662 240 94 333 638 11 8 14 1 2828 2403
18 GULBARGA 13757 165 13922 4924 4477 132 65 0 0 5056 4542 575 680 995 2052 16 6 0 0 6642 7280
19 HASSAN 10010 50 10060 4111 3379 96 102 0 0 4207 3481 101 141 516 1562 35 17 0 0 4859 5201
20 HAVERI 7902 9 7911 3456 2553 99 47 14 27 3569 2627 229 94 441 907 26 18 0 0 4265 3646
21 KODAGU 2906 37 2943 442 1402 62 49 2 7 506 1458 22 73 92 757 24 9 0 2 644 2299
22 KOLAR 8690 15 8705 2799 3157 56 41 0 0 2855 3198 84 160 544 1840 4 9 3 8 3490 5215
23 KOPPAL 6530 629 7159 3130 2178 93 44 0 0 3223 2222 107 28 643 899 19 10 6 2 3998 3161
24 MANDYA 8260 28 8288 3294 2394 88 75 0 0 3382 2469 86 165 452 1713 7 14 0 0 3927 4361
25 MYSORE 12977 169 13146 3789 4428 148 85 2 17 3939 4530 149 438 819 3107 81 83 0 0 4988 8158
26 RAICHUR 11364 10 11374 4443 3630 104 41 0 0 4547 3671 226 119 971 1806 13 21 0 0 5757 5617
27 RAMANAGARA 5684 75 5759 2000 2144 83 49 0 0 2083 2193 101 74 277 1031 0 0 0 0 2461 3298
28 SHIMOGA 8954 17 8971 3141 3555 79 43 0 0 3220 3598 245 199 422 1272 10 5 0 0 3897 5074
29 TUMKUR 8896 86 8982 3033 3498 43 53 0 0 3076 3551 188 130 407 1596 19 15 0 0 3690 5292
30 TUMKUR MADHUGIRI 5283 15 5298 2491 1742 68 42 0 0 2559 1784 45 6 305 591 2 6 0 0 2911 2387
31 UDUPI 4652 52 4704 1059 1568 12 32 0 3 1071 1603 499 473 146 890 12 10 0 0 1728 2976
32 UTTARA KANNADA 4292 16 4308 1148 2324 12 6 0 0 1160 2330 118 84 91 453 33 25 2 12 1404 2904
33 UTTARA KANNADA SIRSI 3869 55 3924 1340 2055 28 34 0 0 1368 2089 43 47 89 260 22 6 0 0 1522 2402
34 YADAGIRI 5492 47 5539 2,734 1,606 82 27 0 0 2,816 1,633 135 47 359 549 0 0 0 0 3310 2229
Total 295062 2570 297632 96218 93321 2538 1520 106 184 98862 95025 8860 8450 21153 63424 820 683 76 279 129771 167861
Regular
Social Welfare Local Body Unaided Others Total
Female MaleMale Male FemaleFemale Female MaleMale Male FemaleFemale Female MaleMale Male FemaleFemale
Govt Aided Central

92
Contract Total
Total Teacher WorkingSlNo.
District NameDOE
1 BAGALKOT 3039 56 3095 831 396 88 35 7 5 926 436 809 114 512 264 28 6 0 0 2275 820
2 BANGALORE RURAL 2108 16 2124 319 291 12 4 0 0 331 295 269 36 519 652 14 8 0 0 1133 991
3 BANGALORE U NORTH 11505 24 11529 178 425 10 12 57 74 245 511 607 546 1683 7651 43 122 15 106 2593 8936
4 BANGALORE U SOUTH 14616 24 14640 276 569 7 3 61 34 344 606 777 613 2281 9800 52 97 11 59 3465 11175
5 BELGAUM 3545 99 3644 654 384 20 8 0 0 674 392 1259 343 540 407 15 14 0 0 2488 1156
6 BELGAUM CHIKKODI 3951 80 4031 827 378 110 37 6 6 943 421 1171 241 832 387 14 22 0 0 2960 1071
7 BELLARY 3942 0 3942 932 581 109 29 0 0 1041 610 551 148 694 810 57 31 0 0 2343 1599
8 BIDAR 3827 2 3829 936 440 59 19 0 0 995 459 734 195 835 563 34 14 0 0 2598 1231
9 BIJAPUR 3670 4 3674 702 310 86 22 0 0 788 332 1359 281 552 306 51 5 0 0 2750 924
10 CHAMARAJANAGARA 1576 6 1582 479 280 50 22 0 0 529 302 230 43 287 163 17 3 7 1 1070 512
11 CHIKKABALLAPURA 2368 0 2368 579 324 28 24 0 0 607 348 266 61 526 542 10 8 0 0 1409 959
12 CHIKKAMANGALORE 2703 63 2766 669 366 88 60 0 0 757 426 736 137 289 386 24 11 0 0 1806 960
13 CHITRADURGA 3079 191 3270 671 340 71 43 0 0 742 383 1284 157 404 277 16 7 0 0 2446 824
14 DAKSHINA KANNADA 3727 29 3756 582 701 20 34 0 0 602 735 530 506 377 978 19 9 0 0 1528 2228
15 DAVANAGERE 3988 0 3988 950 472 79 36 0 0 1029 508 1140 184 585 529 10 3 0 0 2764 1224
16 DHARWAD 3766 0 3766 383 378 28 11 54 58 465 447 795 395 482 1084 54 40 2 2 1798 1968
17 GADAG 2180 1 2181 448 248 31 22 31 9 510 279 597 142 356 267 8 7 14 1 1485 696
18 GULBARGA 4842 227 5069 1385 779 110 48 0 0 1495 827 506 302 845 1078 13 3 0 0 2859 2210
19 HASSAN 4152 28 4180 1198 802 79 84 0 0 1277 886 790 188 469 518 35 17 0 0 2571 1609
20 HAVERI 3216 11 3227 715 410 81 31 14 14 810 455 973 196 439 310 26 18 0 0 2248 979
21 KODAGU 1420 19 1439 195 214 39 20 0 0 234 234 239 150 134 411 24 9 3 1 634 805
22 KOLAR 2937 13 2950 637 442 48 27 0 0 685 469 295 144 534 805 2 5 3 8 1519 1431
23 KOPPAL 1760 443 2203 813 331 85 33 0 0 898 364 198 17 412 293 14 7 0 0 1522 681
24 MANDYA 3525 41 3566 1137 658 82 62 0 0 1219 720 394 145 522 545 7 14 0 0 2142 1424
25 MYSORE 5542 96 5638 1152 833 95 61 0 0 1247 894 501 310 1022 1500 81 83 0 0 2851 2787
26 RAICHUR 3252 0 3252 890 547 85 27 0 0 975 574 195 89 649 736 13 21 0 0 1832 1420
27 RAMANAGARA 2185 35 2220 518 326 79 43 0 0 597 369 406 56 389 403 0 0 0 0 1392 828
28 SHIMOGA 3379 8 3387 964 547 63 31 0 0 1027 578 766 191 341 474 5 5 0 0 2139 1248
29 TUMKUR 3849 79 3928 663 491 41 42 0 0 704 533 1387 237 461 572 19 15 0 0 2571 1357
30 TUMKUR MADHUGIRI 2190 21 2211 600 252 60 30 0 0 660 282 731 74 305 159 0 0 0 0 1696 515
31 UDUPI 2347 22 2369 499 497 5 13 0 3 504 513 372 223 227 508 12 10 0 0 1115 1254
32 UTTARA KANNADA 1480 16 1496 172 233 11 6 0 0 183 239 438 217 137 224 33 25 0 0 791 705
33 UTTARA KANNADA SIRSI 1264 47 1311 341 251 22 25 0 0 363 276 303 102 127 112 22 6 0 0 815 496
34 YADAGIRI 1471 33 1504 661 322 82 22 0 0 743 344 66 20 205 126 0 0 0 0 1014 490
Total 122401 1734 124135 22956 14818 1963 1026 230 203 25149 16047 21674 6803 18972 33840 772 645 55 178 66622 57513
Regular
Social Welfare Local Body Unaided Others Total
Female MaleMale Male FemaleFemale Female MaleMale Male FemaleFemale Female MaleMale Male FemaleFemale
Govt Aided Central
E-Govenace Unit, SSA, BangaloreSource: DISE 2010-11
Annexure - 9 D
Management wise / Geder wise Teachers Details - High Schools

93
E-Govenace Unit, SSA, BangaloreSource: DISE 2010-11
Annexure - 10 A
District wise Education Department Lower Primary Schools Infrastrature Facilities
Sl.No.
CoumpoundWall
CompositeIndex of
provision in %
District Schools Common Toilet Girls Toilet Electricity Play Ground Ramps Library Drinking Water
Yes NoYes NoYes NoYes NoYes NoYes NoYes NoYes No
1 BAGALKOT 509 475 34 204 305 433 76 252 257 347 162 393 116 232 277 481 28 69.182 BANGALORE RURAL 697 677 20 420 277 672 25 205 492 354 343 687 10 468 229 660 37 74.303 BANGALORE U NORTH 249 248 1 231 18 243 6 106 143 122 127 233 16 168 81 249 0 80.324 BANGALORE U SOUTH 452 423 29 436 16 431 21 133 319 318 134 450 2 289 163 451 1 81.065 BELGAUM 615 504 111 198 417 456 159 294 321 303 312 506 109 302 313 562 53 63.526 BELGAUM CHIKKODI 819 633 186 385 434 383 436 479 340 447 372 511 308 332 487 581 238 57.257 BELLARY 530 427 103 237 293 390 140 150 380 408 122 406 124 202 328 464 66 63.308 BIDAR 553 490 63 138 415 308 245 255 298 447 106 260 293 113 440 338 215 53.109 BIJAPUR 834 769 65 69 765 821 13 563 271 834 0 834 0 201 633 598 236 70.2810 CHAMARAJANAGARA 386 340 46 134 252 317 69 138 248 172 214 354 32 250 136 354 32 66.6811 CHIKKABALLAPURA 1,049 765 284 666 383 1,005 44 332 717 358 691 979 70 583 466 962 87 67.3312 CHIKKAMANGALORE 818 810 8 451 367 775 43 424 394 180 638 770 48 575 243 796 22 73.0613 CHITRADURGA 826 824 2 824 2 767 59 318 508 753 73 736 90 418 408 825 1 82.7014 DAKSHINA KANNADA 280 186 94 276 4 280 0 232 48 280 0 276 4 125 155 280 0 86.3815 DAVANAGERE 669 625 44 254 415 599 70 270 399 435 234 609 60 459 210 652 17 72.9316 DHARWAD 230 227 3 188 42 222 8 122 108 215 15 197 33 129 101 230 0 83.1517 GADAG 190 176 14 87 103 159 31 120 70 156 34 174 16 138 52 186 4 78.6818 GULBARGA 796 564 232 376 420 768 28 310 486 796 0 409 387 285 511 727 69 66.5019 HASSAN 1,576 1,401 175 526 1,050 1,352 224 607 969 587 989 1,454 122 942 634 1,469 107 66.1320 HAVERI 462 459 3 462 0 462 0 215 247 221 241 356 106 250 212 462 0 78.1121 KODAGU 145 139 6 129 16 138 7 95 50 126 19 139 6 116 29 145 0 88.5322 KOLAR 1,254 1,254 0 1,254 0 1,253 1 1,180 74 1,201 53 1,113 141 929 325 1,250 4 94.0423 KOPPAL 411 330 81 325 86 366 45 171 240 305 106 292 119 233 178 354 57 72.2624 MANDYA 988 884 104 987 1 948 40 396 592 753 235 939 49 713 275 903 85 82.5325 MYSORE 1,005 927 78 591 414 888 117 363 642 631 374 916 89 855 150 922 83 75.7826 RAICHUR 722 477 245 382 340 435 287 290 432 318 404 503 219 368 354 480 242 56.3227 RAMANAGARA 946 876 70 625 321 891 55 205 741 396 550 923 23 533 413 883 63 70.4528 SHIMOGA 976 976 0 976 0 883 93 515 461 310 666 831 145 710 266 890 86 78.0129 TUMKUR 1,461 1,413 48 892 569 1,393 68 447 1,014 523 938 1,383 78 1,010 451 1,386 75 72.2730 TUMKUR MADHUGIRI 771 741 30 742 29 720 51 299 472 260 511 741 30 552 219 753 18 77.9531 UDUPI 256 251 5 182 74 238 18 156 100 227 29 204 52 69 187 246 10 76.8132 UTTARA KANNADA 502 487 15 341 161 487 15 306 196 408 94 487 15 323 179 502 0 83.1933 UTTARA KANNADA SIRSI 656 629 27 464 192 636 20 341 315 311 345 649 7 377 279 634 22 77.0034 YADAGIRI 476 242 234 132 344 453 23 173 303 476 0 316 160 116 360 296 180 57.88
Total 23,109 20,649 2,460 14,584 8,525 20,572 2,537 10,462 12,647 13,978 9,131 20,030 3,079 13,365 9,744 20,971 2,138 72.81

94
E-Govenace Unit, SSA, BangaloreSource: DISE 2010-11
Annexure - 10 B
District wise Education Department Upper Primary Schools Infrastrature Facilities
Sl.No.
CoumpoundWall
CompositeIndex of
provision in %
District Schools Common Toilet Girls Toilet Electricity Play Ground Ramps Library Drinking Water
Yes NoYes NoYes NoYes NoYes NoYes NoYes NoYes No
1 BAGALKOT 806 750 56 507 299 755 51 558 248 740 66 778 28 610 196 789 17 85.102 BANGALORE RURAL 441 431 10 394 47 433 8 222 219 349 92 435 6 350 91 427 14 86.203 BANGALORE U NORTH 267 266 1 263 4 265 2 164 103 181 86 261 6 236 31 267 0 89.094 BANGALORE U SOUTH 452 444 8 444 8 444 8 258 194 349 103 452 0 365 87 452 0 88.725 BELGAUM 812 753 59 580 232 731 81 562 250 709 103 791 21 600 212 761 51 84.476 BELGAUM CHIKKODI 1,039 900 139 770 269 884 155 746 293 925 114 988 51 724 315 955 84 82.927 BELLARY 836 729 107 597 239 730 106 421 415 756 80 799 37 513 323 792 44 79.808 BIDAR 737 683 54 519 218 559 178 392 345 710 27 645 92 340 397 604 133 75.519 BIJAPUR 1,052 1,015 37 1,032 20 1,041 11 763 289 1,052 0 1,051 1 670 382 941 111 89.8910 CHAMARAJANAGARA 394 377 17 258 136 371 23 194 200 300 94 387 7 321 73 382 12 82.1711 CHIKKABALLAPURA 530 491 39 439 91 509 21 264 266 336 194 524 6 404 126 519 11 82.2212 CHIKKAMANGALORE 695 691 4 649 46 688 7 519 176 410 285 690 5 593 102 691 4 88.6913 CHITRADURGA 882 879 3 878 4 857 25 485 397 849 33 874 8 644 238 882 0 89.9714 DAKSHINA KANNADA 653 614 39 652 1 652 1 591 62 653 0 653 0 386 267 653 0 92.9215 DAVANAGERE 708 700 8 583 125 683 25 429 279 627 81 705 3 599 109 703 5 88.7916 DHARWAD 543 532 11 488 55 541 2 397 146 532 11 539 4 410 133 542 1 91.6417 GADAG 428 399 29 290 138 412 16 317 111 401 27 422 6 390 38 427 1 89.3118 GULBARGA 1,010 872 138 714 296 980 30 545 465 1,010 0 863 147 564 446 971 39 80.6819 HASSAN 1,021 991 30 878 143 974 47 554 467 716 305 1,016 5 754 267 1,014 7 84.4420 HAVERI 704 679 25 704 0 704 0 514 190 573 131 687 17 548 156 704 0 90.7821 KODAGU 261 255 6 247 14 258 3 225 36 244 17 259 2 231 30 261 0 94.8322 KOLAR 632 632 0 632 0 632 0 613 19 618 14 621 11 567 65 632 0 97.8423 KOPPAL 553 513 40 465 88 531 22 366 187 524 29 537 16 455 98 528 25 88.5824 MANDYA 825 793 32 818 7 802 23 455 370 769 56 819 6 679 146 809 16 90.0625 MYSORE 954 913 41 954 0 917 37 508 446 832 122 934 20 905 49 939 15 90.4426 RAICHUR 775 679 96 615 160 639 136 513 262 597 178 748 27 607 168 691 84 82.0827 RAMANAGARA 455 447 8 414 41 445 10 217 238 339 116 454 1 342 113 447 8 85.3028 SHIMOGA 945 945 0 945 0 910 35 617 328 673 272 914 31 803 142 923 22 89.0229 TUMKUR 791 778 13 714 77 764 27 416 375 517 274 790 1 652 139 785 6 85.5930 TUMKUR MADHUGIRI 543 537 6 533 10 507 36 308 235 371 172 533 10 458 85 539 4 87.1531 UDUPI 362 348 14 337 25 359 3 293 69 352 10 337 25 234 128 359 3 90.4432 UTTARA KANNADA 493 483 10 364 129 491 2 380 113 458 35 491 2 423 70 493 0 90.8533 UTTARA KANNADA SIRSI 510 507 3 400 110 498 12 348 162 412 98 510 0 434 76 508 2 88.6534 YADAGIRI 459 332 127 257 202 435 24 239 220 459 0 422 37 249 210 390 69 75.79
Total 22,568 21,358 1,210 19,334 3,234 21,401 1,167 14,393 8,175 19,343 3,225 21,929 639 17,060 5,508 21,780 788 86.74

95
E-Govenace Unit, SSA, BangaloreSource: DISE 2010-11
Annexure - 10 C
Districtwise Education Department Elementary Schools Infrastrature Facilities
Sl.No.
CoumpoundWall
CompositeIndex of
provision in %
District Schools Common Toilet Girls Toilet Electricity Play Ground Ramps Library Drinking Water
Yes NoYes NoYes NoYes NoYes NoYes NoYes NoYes No
1 BAGALKOT 1,315 1,225 90 711 604 1,188 127 810 505 1,087 228 1,171 144 842 473 1,270 45 78.942 BANGALORE RURAL 1,138 1,108 30 814 324 1,105 33 427 711 703 435 1,122 16 818 320 1,087 51 78.913 BANGALORE U NORTH 516 514 2 494 22 508 8 270 246 303 213 494 22 404 112 516 0 84.864 BANGALORE U SOUTH 904 867 37 880 24 875 29 391 513 667 237 902 2 654 250 903 1 84.895 BELGAUM 1,427 1,257 170 778 649 1,187 240 856 571 1,012 415 1,297 130 902 525 1,323 104 75.446 BELGAUM CHIKKODI 1,858 1,533 325 1,155 703 1,267 591 1,225 633 1,372 486 1,499 359 1,056 802 1,536 322 71.607 BELLARY 1,366 1,156 210 834 532 1,120 246 571 795 1,164 202 1,205 161 715 651 1,256 110 73.408 BIDAR 1,290 1,173 117 657 633 867 423 647 643 1,157 133 905 385 453 837 942 348 65.909 BIJAPUR 1,886 1,784 102 1,101 785 1,862 24 1,326 560 1,886 0 1,885 1 871 1,015 1,539 347 81.2210 CHAMARAJANAGARA 780 717 63 392 388 688 92 332 448 472 308 741 39 571 209 736 44 74.5011 CHIKKABALLAPURA 1,579 1,256 323 1,105 474 1,514 65 596 983 694 885 1,503 76 987 592 1,481 98 72.3212 CHIKKAMANGALORE 1,513 1,501 12 1,100 413 1,463 50 943 570 590 923 1,460 53 1,168 345 1,487 26 80.2413 CHITRADURGA 1,708 1,703 5 1,702 6 1,624 84 803 905 1,602 106 1,610 98 1,062 646 1,707 1 86.4514 DAKSHINA KANNADA 933 800 133 928 5 932 1 823 110 933 0 929 4 511 422 933 0 90.9615 DAVANAGERE 1,377 1,325 52 837 540 1,282 95 699 678 1,062 315 1,314 63 1,058 319 1,355 22 81.0816 DHARWAD 773 759 14 676 97 763 10 519 254 747 26 736 37 539 234 772 1 89.1217 GADAG 618 575 43 377 241 571 47 437 181 557 61 596 22 528 90 613 5 86.0418 GULBARGA 1,806 1,436 370 1,090 716 1,748 58 855 951 1,806 0 1,272 534 849 957 1,698 108 74.4319 HASSAN 2,597 2,392 205 1,404 1,193 2,326 271 1,161 1,436 1,303 1,294 2,470 127 1,696 901 2,483 114 73.3320 HAVERI 1,166 1,138 28 1,166 0 1,166 0 729 437 794 372 1,043 123 798 368 1,166 0 85.7621 KODAGU 406 394 12 376 30 396 10 320 86 370 36 398 8 347 59 406 0 92.5822 KOLAR 1,886 1,886 0 1,886 0 1,885 1 1,793 93 1,819 67 1,734 152 1,496 390 1,882 4 95.3123 KOPPAL 964 843 121 790 174 897 67 537 427 829 135 829 135 688 276 882 82 81.6324 MANDYA 1,813 1,677 136 1,805 8 1,750 63 851 962 1,522 291 1,758 55 1,392 421 1,712 101 85.9625 MYSORE 1,959 1,840 119 1,545 414 1,805 154 871 1,088 1,463 496 1,850 109 1,760 199 1,861 98 82.9226 RAICHUR 1,497 1,156 341 997 500 1,074 423 803 694 915 582 1,251 246 975 522 1,171 326 69.6627 RAMANAGARA 1,401 1,323 78 1,039 362 1,336 65 422 979 735 666 1,377 24 875 526 1,330 71 75.2828 SHIMOGA 1,921 1,921 0 1,921 0 1,793 128 1,132 789 983 938 1,745 176 1,513 408 1,813 108 83.4329 TUMKUR 2,252 2,191 61 1,606 646 2,157 95 863 1,389 1,040 1,212 2,173 79 1,662 590 2,171 81 76.9530 TUMKUR MADHUGIRI 1,314 1,278 36 1,275 39 1,227 87 607 707 631 683 1,274 40 1,010 304 1,292 22 81.7531 UDUPI 618 599 19 519 99 597 21 449 169 579 39 541 77 303 315 605 13 84.7932 UTTARA KANNADA 995 970 25 705 290 978 17 686 309 866 129 978 17 746 249 995 0 86.9833 UTTARA KANNADA SIRSI 1,166 1,136 30 864 302 1,134 32 689 477 723 443 1,159 7 811 355 1,142 24 82.1034 YADAGIRI 935 574 361 389 546 888 47 412 523 935 0 738 197 365 570 686 249 66.67
Total 45,677 42,007 3,670 33,918 11,759 41,973 3,704 24,855 20,822 33,321 12,356 41,959 3,718 30,425 15,252 42,751 2,926 79.69

96
E-Govenace Unit, SSA, BangaloreSource: DISE 2010-11
Annexure - 10 D
District wise Education Department High Schools Infrastrature Facilities
Sl.No.
CoumpoundWall
CompositeIndex of
provision in %
District Schools Common Toilet Girls Toilet Electricity Play Ground Ramps Library Drinking Water
Yes NoYes NoYes NoYes NoYes NoYes NoYes NoYes No
1 BAGALKOT 146 117 29 102 44 92 54 107 39 45 101 136 10 74 72 125 21 68.322 BANGALORE RURAL 59 43 16 51 8 47 12 49 10 9 50 56 3 42 17 56 3 74.793 BANGALORE U NORTH 52 50 2 51 1 46 6 43 9 18 34 49 3 46 6 52 0 85.344 BANGALORE U SOUTH 79 71 8 73 6 74 5 62 17 17 62 74 5 63 16 79 0 81.175 BELGAUM 123 83 40 64 59 50 73 86 37 20 103 112 11 77 46 94 29 59.556 BELGAUM CHIKKODI 146 77 69 77 69 66 80 97 49 22 124 139 7 83 63 105 41 57.027 BELLARY 172 99 73 85 87 99 73 127 45 52 120 159 13 90 82 138 34 61.708 BIDAR 149 98 51 81 68 81 68 86 63 65 84 116 33 57 92 103 46 57.639 BIJAPUR 121 49 72 47 74 66 55 99 22 25 96 107 14 46 75 87 34 54.3410 CHAMARAJANAGARA 84 47 37 45 39 64 20 57 27 18 66 79 5 61 23 67 17 65.1811 CHIKKABALLAPURA 106 66 40 73 33 77 29 82 24 18 88 103 3 59 47 98 8 67.9212 CHIKKAMANGALORE 115 92 23 91 24 95 20 100 15 21 94 107 8 82 33 104 11 75.2213 CHITRADURGA 109 81 28 77 32 89 20 86 23 9 100 105 4 58 51 109 0 70.4114 DAKSHINA KANNADA 160 104 56 127 33 138 22 117 43 51 109 155 5 61 99 149 11 70.4715 DAVANAGERE 152 137 15 124 28 129 23 135 17 30 122 147 5 124 28 147 5 80.0216 DHARWAD 89 56 33 50 39 58 31 62 27 28 61 85 4 51 38 78 11 65.7317 GADAG 83 67 16 60 23 66 17 66 17 18 65 78 5 36 47 77 6 70.4818 GULBARGA 254 152 102 151 103 173 81 178 76 107 147 201 53 113 141 218 36 63.6319 HASSAN 241 159 82 157 84 172 69 182 59 49 192 239 2 139 102 209 32 67.7420 HAVERI 131 130 1 88 43 131 0 104 27 33 98 114 17 78 53 131 0 77.1921 KODAGU 47 34 13 35 12 41 6 36 11 12 35 46 1 27 20 47 0 73.9422 KOLAR 115 78 37 67 48 111 4 86 29 33 82 112 3 84 31 113 2 74.3523 KOPPAL 128 80 48 77 51 72 56 101 27 24 104 116 12 82 46 108 20 64.4524 MANDYA 214 155 59 213 1 203 11 162 52 25 189 204 10 147 67 194 20 76.1125 MYSORE 216 138 78 155 61 153 63 162 54 24 192 204 12 154 62 193 23 68.4626 RAICHUR 162 88 74 95 67 84 78 107 55 23 139 157 5 85 77 109 53 57.7227 RAMANAGARA 106 80 26 74 32 66 40 71 35 17 89 103 3 67 39 89 17 66.8628 SHIMOGA 155 120 35 123 32 126 29 123 32 24 131 147 8 99 56 144 11 73.0629 TUMKUR 133 107 26 109 24 107 26 110 23 16 117 129 4 93 40 124 9 74.7230 TUMKUR MADHUGIRI 94 83 11 83 11 73 21 79 15 16 78 92 2 55 39 85 9 75.2731 UDUPI 106 87 19 83 23 96 10 87 19 30 76 104 2 54 52 100 6 75.5932 UTTARA KANNADA 45 45 0 30 15 43 2 35 10 38 7 43 2 30 15 45 0 85.8333 UTTARA KANNADA SIRSI 70 50 20 43 27 49 21 47 23 16 54 68 2 25 45 58 12 63.57
YADAGIRI 116 49 67 52 64 107 9 67 49 116 0 90 26 46 70 77 39 65.09
Total 4,278 2,972 1,306 2,913 1,365 3,144 1,134 3,198 1,080 1,069 3,209 3,976 302 2,488 1,790 3,712 566 68.58

97
E-Govenace Unit, SSA, BangaloreSource: DISE 2010-11
Annexure - 11 A
Building Status and Condition of Classrooms and other Rooms Details in Lower Primary Schools - Education Department
Sl.No. District
1 BAGALKOT 509 2 4 479 15 0 0 9 1,097 96 142 1,335 479 41 57 5772 BANGALORE RURAL 697 2 2 688 1 3 1 0 897 134 305 1,336 329 68 62 4593 BANGALORE U NORTH 249 0 8 222 19 0 0 0 456 54 90 600 147 13 26 1864 BANGALORE U SOUTH 452 0 4 416 31 1 0 0 783 92 137 1,012 260 19 43 3225 BELGAUM 615 10 16 563 20 5 0 1 1,102 100 260 1,462 320 38 83 4416 BELGAUM CHIKKODI 819 5 4 781 8 14 1 6 1,347 107 337 1,791 521 32 102 6557 BELLARY 530 4 9 503 4 5 0 5 1,326 103 252 1,679 318 63 84 4658 BIDAR 553 0 1 541 5 2 0 4 1,391 52 151 1,594 549 48 69 6669 BIJAPUR 834 0 4 819 6 0 0 5 1,857 106 264 2,227 593 60 76 72910 CHAMARAJANAGARA 386 4 7 367 4 3 0 1 565 117 191 873 159 43 44 24611 CHIKKABALLAPURA 1,049 2 1 1,041 0 3 2 0 1,315 213 531 2,059 529 75 134 73812 CHIKKAMANGALORE 818 2 0 814 0 1 1 0 1,115 189 370 1,674 409 46 71 52613 CHITRADURGA 826 0 4 819 2 1 0 0 1,100 135 480 1,715 197 20 54 27114 DAKSHINA KANNADA 280 2 1 273 1 0 0 3 562 51 207 820 245 13 45 30315 DAVANAGERE 669 3 7 655 1 0 0 3 1,059 223 457 1,739 329 87 135 55116 DHARWAD 230 1 3 216 8 0 0 2 608 35 143 786 229 23 56 30817 GADAG 190 0 2 187 0 0 0 1 490 38 118 646 120 17 34 17118 GULBARGA 796 0 2 772 2 0 0 20 1,863 110 234 2,207 479 48 102 62919 HASSAN 1,576 4 2 1,552 6 10 0 2 1,470 498 1,023 2,991 580 126 233 93920 HAVERI 462 0 0 462 0 0 0 0 844 116 241 1,201 263 28 48 33921 KODAGU 145 3 0 140 2 0 0 0 284 29 77 390 126 20 45 19122 KOLAR 1,254 0 6 1,243 5 0 0 0 1,602 295 598 2,495 606 54 99 75923 KOPPAL 411 1 1 384 5 5 0 15 917 76 101 1,094 374 36 54 46424 MANDYA 988 5 2 977 4 0 0 0 1,175 349 563 2,087 269 99 81 44925 MYSORE 1,005 3 5 964 9 13 2 9 1,478 212 545 2,235 456 77 95 62826 RAICHUR 722 8 6 594 15 0 0 99 1,431 120 198 1,751 349 62 65 47627 RAMANAGARA 946 9 4 926 4 2 0 1 1,109 253 436 1,798 555 93 106 75428 SHIMOGA 976 0 1 972 2 1 0 0 1,239 281 503 2,023 476 23 88 58729 TUMKUR 1,461 6 3 1,452 0 0 0 0 1,543 357 888 2,788 403 91 186 68030 TUMKUR MADHUGIRI 771 1 2 761 3 3 0 1 951 272 307 1,530 369 45 77 49131 UDUPI 256 0 3 251 2 0 0 0 387 100 182 669 100 17 35 15232 UTTARA KANNADA 502 5 6 486 5 0 0 0 698 106 220 1,024 379 26 62 46733 UTTARA KANNADA SIRSI 656 0 1 652 3 0 0 0 897 132 297 1,326 464 38 120 622
YADAGIRI 476 6 2 442 18 0 0 8 941 119 154 1,214 257 47 53 357
Total 23,109 88 123 22,414 210 72 7 195 35,899 5,270 11,002 52,171 12,238 1,636 2,724 16,598
Schools
Building Status
Private Rented Govt RentFree
Dilapilated
UnderConstru
ction
NoBuilding
GoodRooms
NeedMajorRepair
NeedMinorRepair
TotalRooms
GoodRooms
NeedMajorRepair
NeedMinorRepair
TotalRooms
Class Rooms Others Rooms

98
E-Govenace Unit, SSA, BangaloreSource: DISE 2010-11
Annexure - 11 B
Building Status and Condition of Classrooms and other Rooms Details in Upper Primary Schools - Education Department
Sl.No. District
1 BAGALKOT 806 2 10 783 9 1 0 1 4,112 664 1,054 5,830 947 203 311 1,4612 BANGALORE RURAL 441 4 1 429 3 2 1 1 1,490 331 511 2,332 415 128 130 6733 BANGALORE U NORTH 267 1 8 246 12 0 0 0 1,717 106 246 2,069 443 52 108 6034 BANGALORE U SOUTH 452 0 15 411 26 0 0 0 2,560 156 400 3,116 714 74 143 9315 BELGAUM 812 3 13 790 4 0 0 2 4,546 447 1,115 6,108 1,006 179 375 1,5606 BELGAUM CHIKKODI 1,039 1 10 1,022 5 1 0 0 4,919 553 1,363 6,835 1,296 246 397 1,9397 BELLARY 836 2 7 817 6 3 1 0 4,941 455 979 6,375 1,096 286 377 1,7598 BIDAR 737 0 3 725 9 0 0 0 3,963 440 765 5,168 982 284 303 1,5699 BIJAPUR 1,052 0 25 1,023 4 0 0 0 6,085 681 1,181 7,947 1,053 274 279 1,60610 CHAMARAJANAGARA 394 1 4 385 4 0 0 0 1,605 331 538 2,474 399 143 159 70111 CHIKKABALLAPURA 530 0 6 521 2 1 0 0 1,923 346 661 2,930 579 156 252 98712 CHIKKAMANGALORE 695 0 1 694 0 0 0 0 2,621 506 867 3,994 752 253 290 1,29513 CHITRADURGA 882 0 5 874 1 2 0 0 2,766 659 1,558 4,983 426 154 244 82414 DAKSHINA KANNADA 653 3 3 646 0 0 0 1 2,804 577 1,124 4,505 1,014 220 386 1,62015 DAVANAGERE 708 0 11 696 0 0 0 1 2,966 773 1,212 4,951 780 320 441 1,54116 DHARWAD 543 0 14 525 4 0 0 0 4,050 555 931 5,536 836 171 228 1,23517 GADAG 428 0 1 424 3 0 0 0 2,368 255 640 3,263 652 220 228 1,10018 GULBARGA 1,010 0 7 994 9 0 0 0 5,418 674 1,064 7,156 956 225 347 1,52819 HASSAN 1,021 1 0 1,015 3 1 1 0 2,448 952 1,735 5,135 679 351 453 1,48320 HAVERI 704 0 0 704 0 0 0 0 3,139 701 1,197 5,037 695 237 316 1,24821 KODAGU 261 2 0 259 0 0 0 0 1,088 109 429 1,626 532 90 229 85122 KOLAR 632 0 7 625 0 0 0 0 2,215 451 792 3,458 583 143 187 91323 KOPPAL 553 1 0 544 4 3 0 1 2,897 461 529 3,887 786 286 250 1,32224 MANDYA 825 2 0 818 5 0 0 0 2,854 661 1,235 4,750 712 259 409 1,38025 MYSORE 954 3 11 923 9 7 1 0 3,918 626 1,460 6,004 973 212 369 1,55426 RAICHUR 775 10 2 760 3 0 0 0 4,206 589 648 5,445 802 229 217 1,24827 RAMANAGARA 455 5 1 445 3 1 0 0 1,488 455 623 2,566 484 199 205 88828 SHIMOGA 945 0 1 938 6 0 0 0 2,898 845 1,370 5,113 928 136 321 1,38529 TUMKUR 791 5 7 779 0 0 0 0 2,217 619 1,207 4,043 519 253 354 1,12630 TUMKUR MADHUGIRI 543 2 0 538 3 0 0 0 1,742 624 571 2,937 454 176 206 83631 UDUPI 362 0 11 349 2 0 0 0 1,458 264 604 2,326 476 97 207 78032 UTTARA KANNADA 493 5 6 480 2 0 0 0 1,722 298 586 2,606 523 105 211 83933 UTTARA KANNADA SIRSI 510 0 2 506 2 0 0 0 1,678 356 562 2,596 494 121 198 813
YADAGIRI 459 1 4 443 11 0 0 0 2,279 394 470 3,143 377 178 145 700
Total 22,568 54 196 22,131 154 22 4 7 99,101 16,914 30,227 146,244 24,363 6,660 9,275 40,298
Schools
Building Status
Private Rented Govt RentFree
Dilapilated
UnderConstru
ction
NoBuilding
GoodRooms
NeedMajorRepair
NeedMinorRepair
TotalRooms
GoodRooms
NeedMajorRepair
NeedMinorRepair
TotalRooms
Class Rooms Others Rooms

99
E-Govenace Unit, SSA, BangaloreSource: DISE 2010-11
Annexure - 11 C
Building Status and Condition of Classrooms and other Rooms Details in Elementary Schools - Education Department
Sl.No. District
1 BAGALKOT 1,315 4 14 1,262 24 1 0 10 5,209 760 1,196 7,165 1,426 244 368 2,0382 BANGALORE RURAL 1,138 6 3 1,117 4 5 2 1 2,387 465 816 3,668 744 196 192 1,1323 BANGALORE U NORTH 516 1 16 468 31 0 0 0 2,173 160 336 2,669 590 65 134 7894 BANGALORE U SOUTH 904 0 19 827 57 1 0 0 3,343 248 537 4,128 974 93 186 1,2535 BELGAUM 1,427 13 29 1,353 24 5 0 3 5,648 547 1,375 7,570 1,326 217 458 2,0016 BELGAUM CHIKKODI 1,858 6 14 1,803 13 15 1 6 6,266 660 1,700 8,626 1,817 278 499 2,5947 BELLARY 1,366 6 16 1,320 10 8 1 5 6,267 558 1,231 8,054 1,414 349 461 2,2248 BIDAR 1,290 0 4 1,266 14 2 0 4 5,354 492 916 6,762 1,531 332 372 2,2359 BIJAPUR 1,886 0 29 1,842 10 0 0 5 7,942 787 1,445 10,174 1,646 334 355 2,33510 CHAMARAJANAGARA 780 5 11 752 8 3 0 1 2,170 448 729 3,347 558 186 203 94711 CHIKKABALLAPURA 1,579 2 7 1,562 2 4 2 0 3,238 559 1,192 4,989 1,108 231 386 1,72512 CHIKKAMANGALORE 1,513 2 1 1,508 0 1 1 0 3,736 695 1,237 5,668 1,161 299 361 1,82113 CHITRADURGA 1,708 0 9 1,693 3 3 0 0 3,866 794 2,038 6,698 623 174 298 1,09514 DAKSHINA KANNADA 933 5 4 919 1 0 0 4 3,366 628 1,331 5,325 1,259 233 431 1,92315 DAVANAGERE 1,377 3 18 1,351 1 0 0 4 4,025 996 1,669 6,690 1,109 407 576 2,09216 DHARWAD 773 1 17 741 12 0 0 2 4,658 590 1,074 6,322 1,065 194 284 1,54317 GADAG 618 0 3 611 3 0 0 1 2,858 293 758 3,909 772 237 262 1,27118 GULBARGA 1,806 0 9 1,766 11 0 0 20 7,281 784 1,298 9,363 1,435 273 449 2,15719 HASSAN 2,597 5 2 2,567 9 11 1 2 3,918 1,450 2,758 8,126 1,259 477 686 2,42220 HAVERI 1,166 0 0 1,166 0 0 0 0 3,983 817 1,438 6,238 958 265 364 1,58721 KODAGU 406 5 0 399 2 0 0 0 1,372 138 506 2,016 658 110 274 1,04222 KOLAR 1,886 0 13 1,868 5 0 0 0 3,817 746 1,390 5,953 1,189 197 286 1,67223 KOPPAL 964 2 1 928 9 8 0 16 3,814 537 630 4,981 1,160 322 304 1,78624 MANDYA 1,813 7 2 1,795 9 0 0 0 4,029 1,010 1,798 6,837 981 358 490 1,82925 MYSORE 1,959 6 16 1,887 18 20 3 9 5,396 838 2,005 8,239 1,429 289 464 2,18226 RAICHUR 1,497 18 8 1,354 18 0 0 99 5,637 709 846 7,196 1,151 291 282 1,72427 RAMANAGARA 1,401 14 5 1,371 7 3 0 1 2,597 708 1,059 4,364 1,039 292 311 1,64228 SHIMOGA 1,921 0 2 1,910 8 1 0 0 4,137 1,126 1,873 7,136 1,404 159 409 1,97229 TUMKUR 2,252 11 10 2,231 0 0 0 0 3,760 976 2,095 6,831 922 344 540 1,80630 TUMKUR MADHUGIRI 1,314 3 2 1,299 6 3 0 1 2,693 896 878 4,467 823 221 283 1,32731 UDUPI 618 0 14 600 4 0 0 0 1,845 364 786 2,995 576 114 242 93232 UTTARA KANNADA 995 10 12 966 7 0 0 0 2,420 404 806 3,630 902 131 273 1,30633 UTTARA KANNADA SIRSI 1,166 0 3 1,158 5 0 0 0 2,575 488 859 3,922 958 159 318 1,435
YADAGIRI 935 7 6 885 29 0 0 8 3,220 513 624 4,357 634 225 198 1,057
Total 45,677 142 319 44,545 364 94 11 202 135,000 22,184 41,229 198,415 36,601 8,296 11,999 56,896
Schools
Building Status
Private Rented Govt RentFree
Dilapilated
UnderConstru
ction
NoBuilding
GoodRooms
NeedMajorRepair
NeedMinorRepair
TotalRooms
GoodRooms
NeedMajorRepair
NeedMinorRepair
TotalRooms
Class Rooms Others Rooms

100
E-Govenace Unit, SSA, BangaloreSource: DISE 2010-11
Annexure - 11 D
Building Status and Condition of Classrooms and other Rooms Details in High Schools - Education Department
Sl.No. District
1 BAGALKOT 146 1 1 112 27 4 0 1 438 45 146 629 258 67 130 4552 BANGALORE RURAL 59 1 1 49 1 7 0 0 185 60 102 347 129 30 69 2283 BANGALORE U NORTH 52 0 1 46 5 0 0 0 302 19 48 369 161 22 24 2074 BANGALORE U SOUTH 79 0 2 72 2 3 0 0 493 10 62 565 251 20 17 2885 BELGAUM 123 1 0 90 20 7 1 4 428 38 76 542 195 25 53 2736 BELGAUM CHIKKODI 146 3 4 101 20 14 1 3 439 26 133 598 227 10 98 3357 BELLARY 172 0 0 134 15 19 0 4 603 66 206 875 324 86 190 6008 BIDAR 149 0 0 131 10 5 1 2 454 64 95 613 326 83 94 5039 BIJAPUR 121 0 1 94 24 0 0 2 330 56 119 505 181 50 121 35210 CHAMARAJANAGARA 84 1 0 59 9 11 1 3 246 48 93 387 117 31 52 20011 CHIKKABALLAPURA 106 1 1 95 3 5 1 0 386 45 141 572 210 47 100 35712 CHIKKAMANGALORE 115 0 0 105 0 5 0 5 337 73 163 573 201 48 122 37113 CHITRADURGA 109 0 1 100 2 3 0 3 286 61 131 478 169 46 126 34114 DAKSHINA KANNADA 160 2 2 125 8 7 0 16 408 56 230 694 286 49 156 49115 DAVANAGERE 152 0 1 148 0 1 0 2 534 132 169 835 344 79 196 61916 DHARWAD 89 0 0 58 30 0 0 1 376 30 89 495 132 24 68 22417 GADAG 83 0 0 61 20 0 0 2 322 8 68 398 143 20 41 20418 GULBARGA 254 0 0 227 23 0 1 3 924 49 236 1,209 422 71 247 74019 HASSAN 241 1 1 208 9 8 0 14 454 151 448 1,053 339 162 383 88420 HAVERI 131 0 0 109 22 0 0 0 350 43 143 536 177 21 72 27021 KODAGU 47 0 0 43 1 3 0 0 96 29 76 201 71 8 45 12422 KOLAR 115 0 0 103 6 5 0 1 414 86 157 657 214 44 95 35323 KOPPAL 128 0 0 107 5 5 1 10 360 63 152 575 232 81 109 42224 MANDYA 214 3 0 179 32 0 0 0 617 66 386 1,069 423 89 260 77225 MYSORE 216 2 0 177 11 21 1 4 652 99 296 1,047 377 86 176 63926 RAICHUR 162 2 0 117 36 0 0 7 679 61 113 858 289 46 89 42427 RAMANAGARA 106 0 0 81 8 13 0 4 322 33 136 491 230 33 85 34828 SHIMOGA 155 1 1 144 2 2 0 5 439 85 220 744 291 63 167 52129 TUMKUR 133 0 1 113 6 8 0 5 376 95 173 644 195 63 148 40630 TUMKUR MADHUGIRI 94 0 0 77 8 7 0 2 236 54 139 429 154 38 77 26931 UDUPI 106 1 1 94 3 1 0 6 307 47 195 549 240 36 145 42132 UTTARA KANNADA 45 0 0 38 4 0 0 3 127 14 63 204 94 5 43 14233 UTTARA KANNADA SIRSI 70 0 0 58 9 0 0 3 213 29 71 313 96 24 72 192
YADAGIRI 116 1 0 92 17 0 0 6 402 63 105 570 169 82 81 332
Total 4,278 21 19 3,547 398 164 8 121 13,535 1,904 5,180 20,624 7,667 1,689 3,951 13,307
Schools
Building Status
Private Rented Govt RentFree
Dilapilated
UnderConstru
ction
NoBuilding
GoodRooms
NeedMajorRepair
NeedMinorRepair
TotalRooms
GoodRooms
NeedMajorRepair
NeedMinorRepair
TotalRooms
Class Rooms Others Rooms