Embed Size (px)
Citation preview

1
WEBINAR: FULLY FRANKED DIVIDENDS
ASX: PIA
REGISTER
FOR THE WEBINAR >>
For
per
sona
l use
onl
y

PENGANA INTERNATIONAL EQUITIES LIMITED
Webinar
ASX: PIA
Steven GlassDeputy Portfolio Manager & Analyst
PRESENTED BY
Russel PillemerManaging Director
For
per
sona
l use
onl
y

So far in 2020, investors have seen circa $26b worth of dividend income disappear. For some investors, the loss of
income is no great concern, but for investors that rely on that income, dividend cuts can have a material impact on
lifestyles.
3
FULLY FRANKED DIVIDENDS
So far in 2020, Australian investors have seen
circa $26b worth of dividend income
disappear.
For investors that rely on that income,
dividend cuts can have a material impact on
lifestyles.
ASX: PIA
For
per
sona
l use
onl
y
4
So far in 2020, investors have seen circa $26b worth of dividend income disappear. For some investors, the loss of
income is no great concern, but for investors that rely on that income, dividend cuts can have a material impact on
lifestyles.
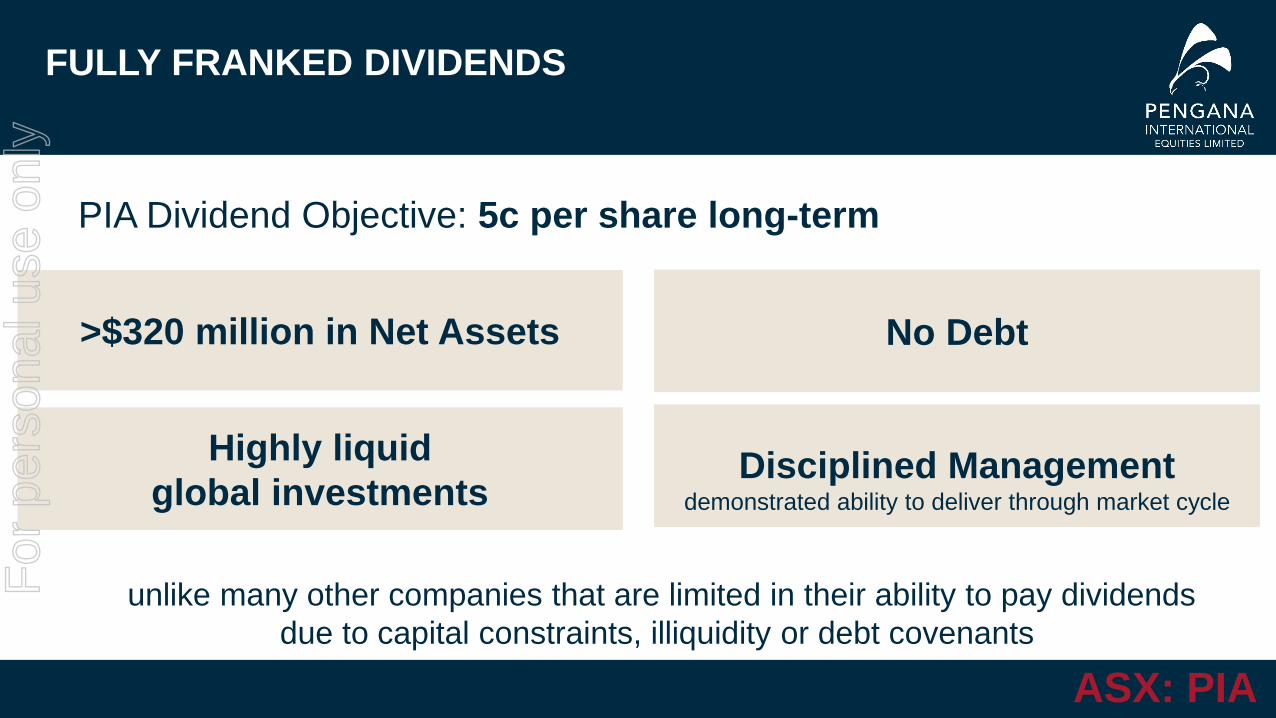
FULLY FRANKED DIVIDENDS
PIA Dividend Objective: 5c per share long-term
ASX: PIA
Highly liquid
global investmentsDisciplined Management
demonstrated ability to deliver through market cycle
unlike many other companies that are limited in their ability to pay dividends
due to capital constraints, illiquidity or debt covenants
>$320 million in Net Assets No Debt
For
per
sona
l use
onl
y
5
PIA is uniquely placed to satisfy the first test as it has $114 million of profits reserves, i.e. sufficient to pay the
current amount of fully franked dividends for the next several years.
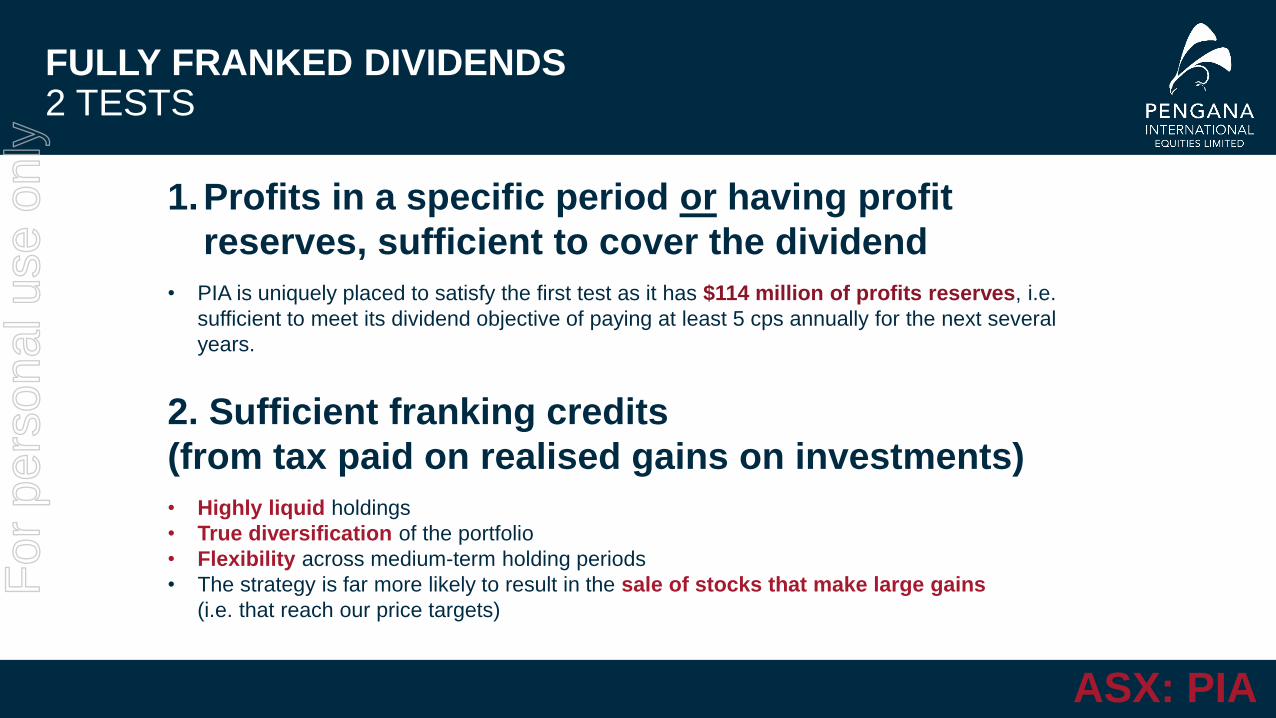
FULLY FRANKED DIVIDENDS2 TESTS
1.Profits in a specific period or having profit
reserves, sufficient to cover the dividend
• PIA is uniquely placed to satisfy the first test as it has $114 million of profits reserves, i.e.
sufficient to meet its dividend objective of paying at least 5 cps annually for the next several
years.
2. Sufficient franking credits
(from tax paid on realised gains on investments)
• Highly liquid holdings
• True diversification of the portfolio
• Flexibility across medium-term holding periods
• The strategy is far more likely to result in the sale of stocks that make large gains
(i.e. that reach our price targets)
ASX: PIA
For
per
sona
l use
onl
y

6
currently trading at a discount to its underlying net asset value
FULLY FRANKED DIVIDENDS
We think that PIA has the
potential to make a
significant contribution to
investment portfolios
ASX: PIA
Currently trading at a discount to its underlying net asset valueFor
per
sona
l use
onl
y

7
ABOUT THE PORTFOLIO
ASX: PIA
For
per
sona
l use
onl
y

8
INVESTMENT MANAGERS
ABOUT PENGANA INVESTMENT APPROACH FOCUS
Founded in 2003
14 Strategies across listed and unlisted equities
Took over Hunter Hall in 2017, including the management of PIA portfolio
Implemented for over 15 years
International team approaching 5 year track record
Managed out of our Sydney office
Ethical Screens
Portfolio construction unchanged
3 key aims
• Making money
• Protecting capital
• Minimize volatility
Newly mandated fully-franked dividends for shareholders
ASX: PIA
For
per
sona
l use
onl
y

9
PENGANA INTERNATIONAL EQUITIES LIMITED ASX: PIA
Long-onlytypically invested 80-100%
Typically hold
30-50 stocks
ESGconsideration of ESG issues
Invest across market cap range
min market cap is A$1.5b and there is no max
Focus on • capital appreciation
• avoid losses and
• minimise volatility
Evergreenfocus on value and growth
Globalinvest in developed and
emerging markets
Funds under management
capped at A$7b
Ethicalnegative screening process
Unique Portfolio Construction
ASX: PIA
For
per
sona
l use
onl
y

10
A DIVERSIFIED INTERNATIONAL ETHICAL COMGLOMERATE
PORTFOLIO CONSTRUCTION ACTIVE MANAGEMENT ESG FRAMEWORK
LOWER VOLATILITY LOWER BETA LOWER MAXIMUM DRAWDOWN
ASX: PIA
For
per
sona
l use
onl
y

11
LOGICAL AND COMMON SENSE
HOW WE PICK OUR STOCKS7 CORE INGREDIENTS
ASX: PIA
ESG
For
per
sona
l use
onl
y

12
PORTFOLIO CONSTRUCTION
ASX: PIA
For
per
sona
l use
onl
y

13
UNDERSTAND VOLATILITY NOT FEAR IT
• Take advantage of the opportunities that volatile markets present
• Search for low volatility stocks that tend to outperform the high volatility stocks
• Structural and behavioural factors make a difference to returns
• Managing volatility can often exhibit better downside protection
• Key to long-term investing
ASX: PIA
For
per
sona
l use
onl
y

14
• World’s largest wind turbine company
• Large service business – c40% VWS’ EBIT
• Competitive advantages - installed based,
biggest R&D budget, reputation
• Market share (ex-China) grown from 17%
(CY14) to 35% (CY19)
• Immaculate balance sheet
• Green energy has positive outlook but
regulation is a concern, particularly PTC
(USA)
• Potential to benefit from fiscal stimulus
• 7% FY21 FCF yield
STOCK IN FOCUS
ASX: PIA
For
per
sona
l use
onl
y
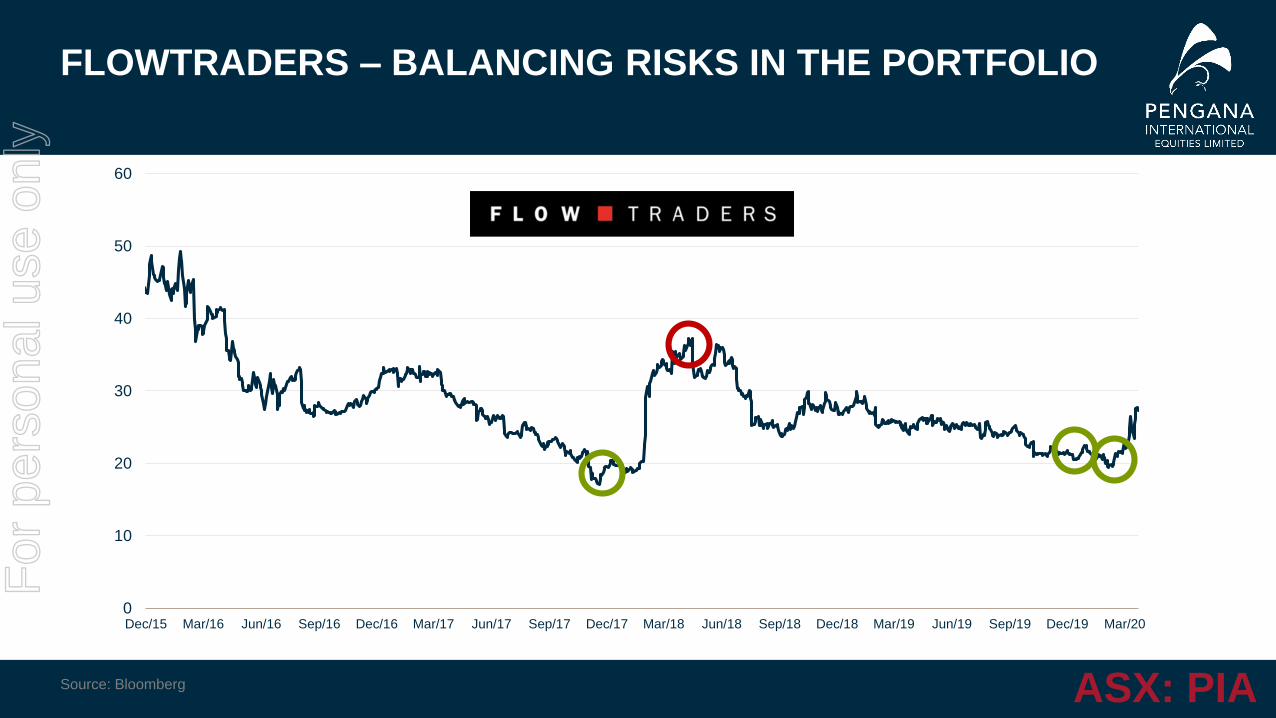
FLOWTRADERS – BALANCING RISKS IN THE PORTFOLIO
15Source: Bloomberg
0
10
20
30
40
50
60
Dec/15 Mar/16 Jun/16 Sep/16 Dec/16 Mar/17 Jun/17 Sep/17 Dec/17 Mar/18 Jun/18 Sep/18 Dec/18 Mar/19 Jun/19 Sep/19 Dec/19 Mar/20
ASX: PIA
For
per
sona
l use
onl
y

POSITIONED WELL FOR POTENTIAL OUTPERFORMANCE
16Source: Bloomberg and Pengana Capital
Portfolio segment Weight FCF yield Rev CAGR Gearing Stocks
69.3% 5.9% 7.1% 1.1 24
8.2% 7.0% 1.3% 0.3 4
11.3% 2.3% 16.3% 0.0 7
Total 88.9% 6.0% 6.5% 1.0 35
Cash 11.1%
Total portfolio 100.0%
ASX: PIA
For
per
sona
l use
onl
y

PROTECTING ON THE DOWNSIDE HAS NOT BEEN UNIQUE TO COVID 19
MANAGING VOLATILITY AND PROTECTING CAPITAL
17
PIA 11.2%
Benchmark 11.3%
Annualised Return 1 July 2017 to
31 May 2020
Source: Bloomberg and Pengana CapitalPerformance figures refer to the movement in net assets per share, reversing out the impact of option exercises and payments of dividends, before tax paid or accrued on realised and unrealised gains. Past performance is not a reliable indicator of future performance, the value of investments can go up and down.nception date of PIA: 19 March 2004, new investment team with new mandate adopted: 1 July 2017. Pengana International Equities Limited has been managed under the new investment mandate by the Pengana investment team since 1 July 2017.
-4.7%-4.2%
-11.0%
-9.3%
-12%
-10%
-8%
-6%
-4%
-2%
0%
Global stock market downturn, S&P500falls by more than 10% (Q4/2018) COVID-19 (Q1/2020)
Pengana International Company
MSCI World Total Return Index, Net Dividends Reinvested, in A$
PIA 10.9%
Benchmark 13.8%
Volatility 1 Year to 31 May 2020
ASX: PIA
For
per
sona
l use
onl
y
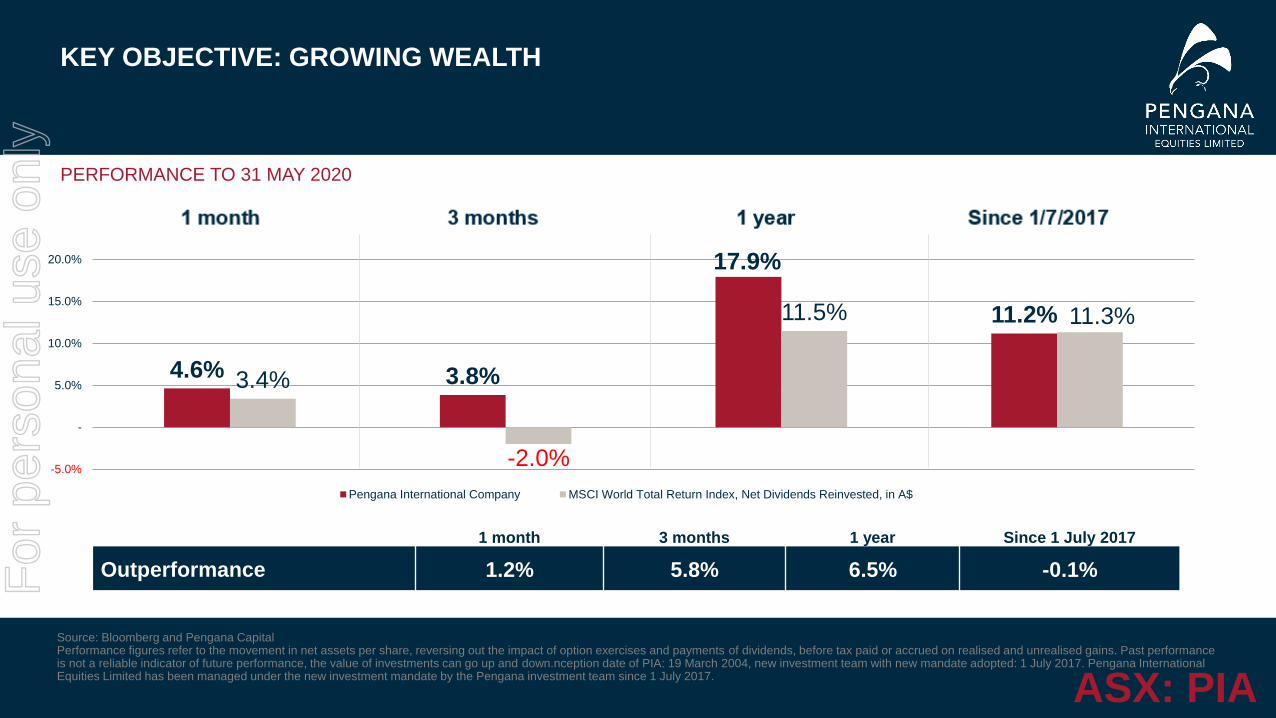
KEY OBJECTIVE: GROWING WEALTH
Source: Bloomberg and Pengana CapitalPerformance figures refer to the movement in net assets per share, reversing out the impact of option exercises and payments of dividends, before tax paid or accrued on realised and unrealised gains. Past performance is not a reliable indicator of future performance, the value of investments can go up and down.nception date of PIA: 19 March 2004, new investment team with new mandate adopted: 1 July 2017. Pengana International Equities Limited has been managed under the new investment mandate by the Pengana investment team since 1 July 2017.
1 month 3 months 1 year Since 1 July 2017
Outperformance 1.2% 5.8% 6.5% -0.1%
PERFORMANCE TO 31 MAY 2020
ASX: PIA
4.6% 3.8%
17.9%
11.2%
3.4%
-2.0%
11.5% 11.3%
-5.0%
-
5.0%
10.0%
15.0%
20.0%
Pengana International Company MSCI World Total Return Index, Net Dividends Reinvested, in A$
For
per
sona
l use
onl
y

Protect capital
Outperform on days market declines meaningfully
Minimize volatility Positioned to perform
• Cheaper than market• Growing faster• Lower gearing• Better ESG
Make money
Return since 1 July 2017 = 11.2% p.a.
IN SUMMARY
COMMITTED TO THE PROCESS
Fully franked dividends are now part of our mandateFor
per
sona
l use
onl
y

Q & A
For
per
sona
l use
onl
y

FOR MORE INFORMATION
Pengana Investment Management Limited
AFSL 219462
PENGANA INTERNATIONAL EQUITIES LIMITED
ACN 107 462 966
Level 12, 167 Macquarie Street
Sydney NSW 2000
T: +61 2 8524 9900
F: +61 2 8524 9901
PIA.PENGANA.COM
MANAGED BY
For
per
sona
l use
onl
y

IMPORTANT INFORMATION AND DISCLAIMER
22
Pengana Capital Limited (ABN 30 103 800 568, AFSL 226566) (“PCL”) is the issuer of units in the Pengana International Fund - Managed Risk (ARSN 612 382 260) (“Fund”). A product disclosure statement for the Fund is available and can be obtained from our distribution team or at www.pengana.com. A person should consider the product disclosure statement carefully and consult with their financial adviser before deciding whether to acquire, or to continue to hold, or making any other decision in respect of, the units in the Fund.
The performance calculations for the Fund in this report have been calculated net of fees and expenses, on a pre-tax basis and assume that all distributions are reinvested.
The value of investments can go up and down. Past performance is not a reliable indicator of future performance.
While care has been taken in the preparation of this report, none of PCL nor any of its related bodies corporate make any representation or warranty as to the accuracy, currency or
completeness of any statement, data or value. To the maximum extent permitted by law, PCL and its related bodies corporate expressly disclaim any liability which may arise out of the
provision to, or use by, any person of this report.
Relating to data in this report sourced from MSCI: Neither MSCI nor any other party involved in or relating to compiling, computing or creating the MSCI data makes any express or implied
warranties or representations with respect to such data (or the results to be obtained by the use thereof), and all such parties hereby expressly disclaim all warranties of originality, accuracy,
completeness, merchantability or fitness for a particular purpose with respect to any of such data. Without limiting any of the foregoing, in no event shall MSCI, any of its affiliates or any third
party involved in or related to compiling, computing or creating the data have any liability for any direct, indirect, special, punitive, consequential or any other damages (including lost profits)
even if notified of the possibility of such damages. No further distribution or dissemination of the MSCI data is permitted without MSCI’s express written consent.
For
per
sona
l use
onl
y