Embed Size (px)
Citation preview
Transportation & Climate Initiative
December 17, 2019
https://www.transportationandclimate.org/
Webinar:Draft Memorandum of Understanding
& 2019 Cap-and-Invest Modeling Results
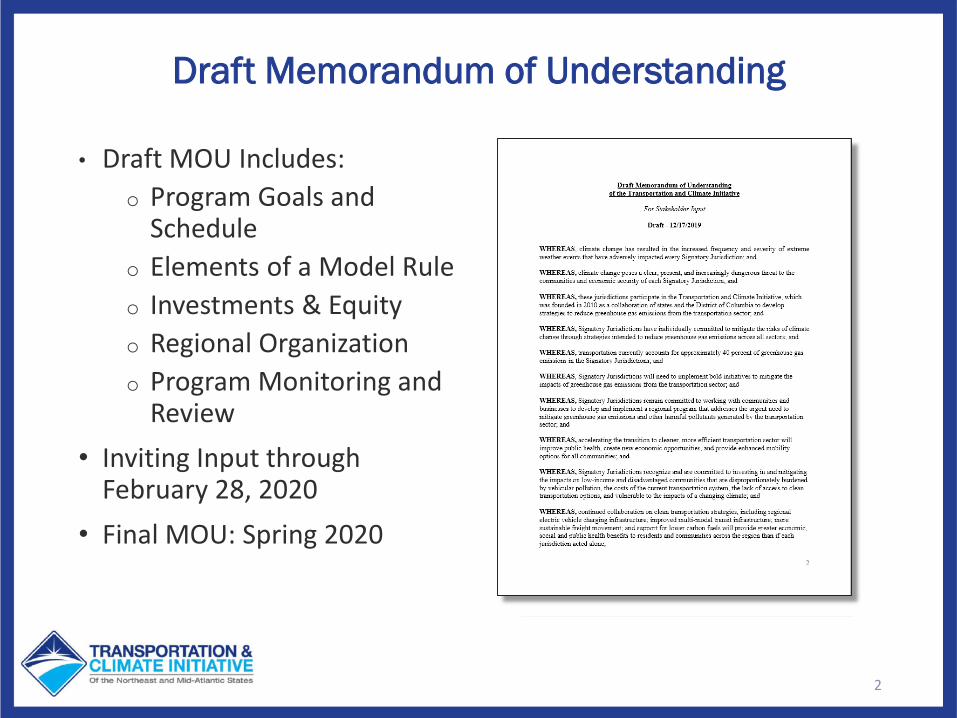
Draft Memorandum of Understanding
• Draft MOU Includes:o Program Goals and
Scheduleo Elements of a Model Ruleo Investments & Equityo Regional Organizationo Program Monitoring and
Review• Inviting Input through
February 28, 2020• Final MOU: Spring 2020
2
Presentation Outline• Context & TCI program objectives
• Introduction to modeling tools and underlying assumptions
• Updated business as usual / Reference case
• Approach to cap reduction policy case modeling
• Results from cap reduction modeling
• Results from macro-economic modeling
• Results from preliminary public health benefits modeling
• Next steps
• Q&A
3
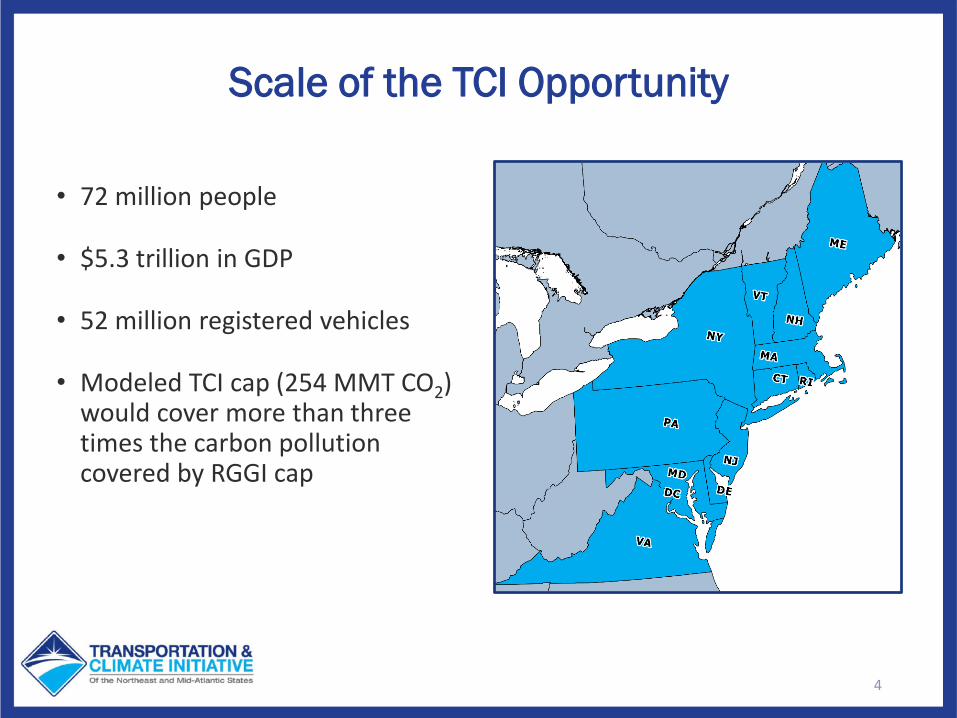
Scale of the TCI Opportunity
• 72 million people
• $5.3 trillion in GDP
• 52 million registered vehicles
• Modeled TCI cap (254 MMT CO2) would cover more than three times the carbon pollution covered by RGGI cap
4
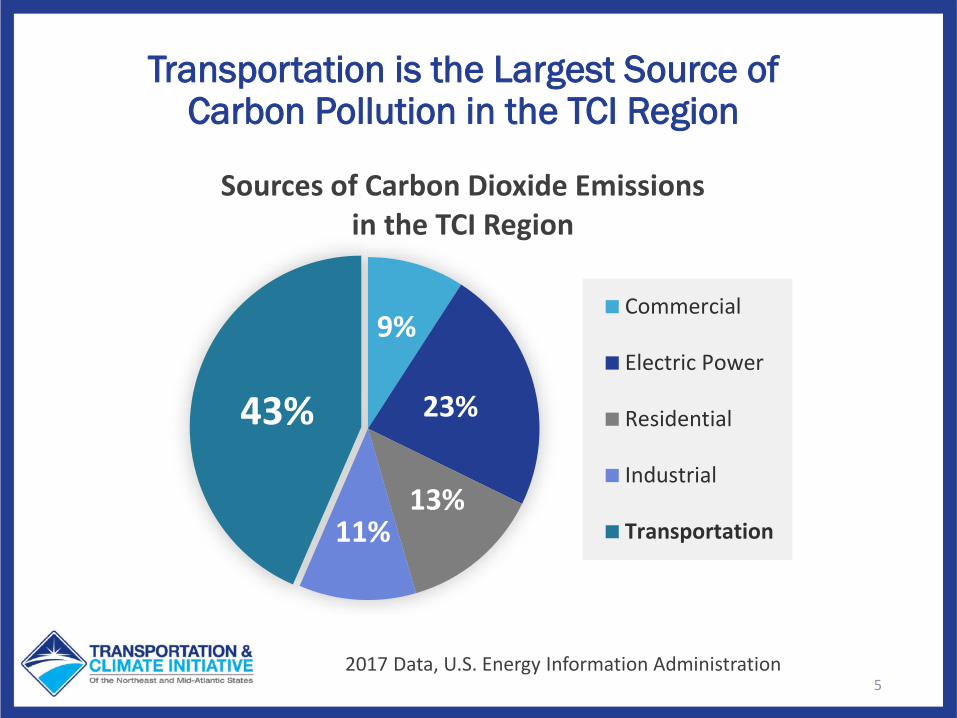
52017 Data, U.S. Energy Information Administration
9%
23%
13%11%
43%
Sources of Carbon Dioxide Emissions in the TCI Region
Commercial
Electric Power
Residential
Industrial
Transportation
Transportation is the Largest Source of Carbon Pollution in the TCI Region
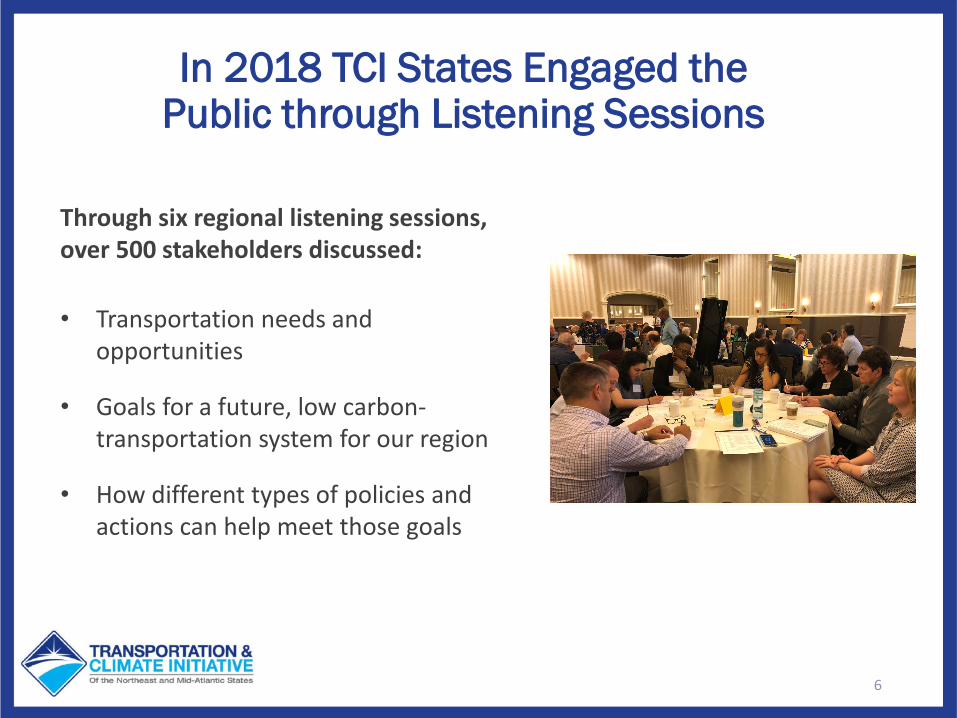
In 2018 TCI States Engaged the Public through Listening Sessions
6
• Transportation needs and opportunities
• Goals for a future, low carbon-transportation system for our region
• How different types of policies and actions can help meet those goals
Through six regional listening sessions, over 500 stakeholders discussed:
7
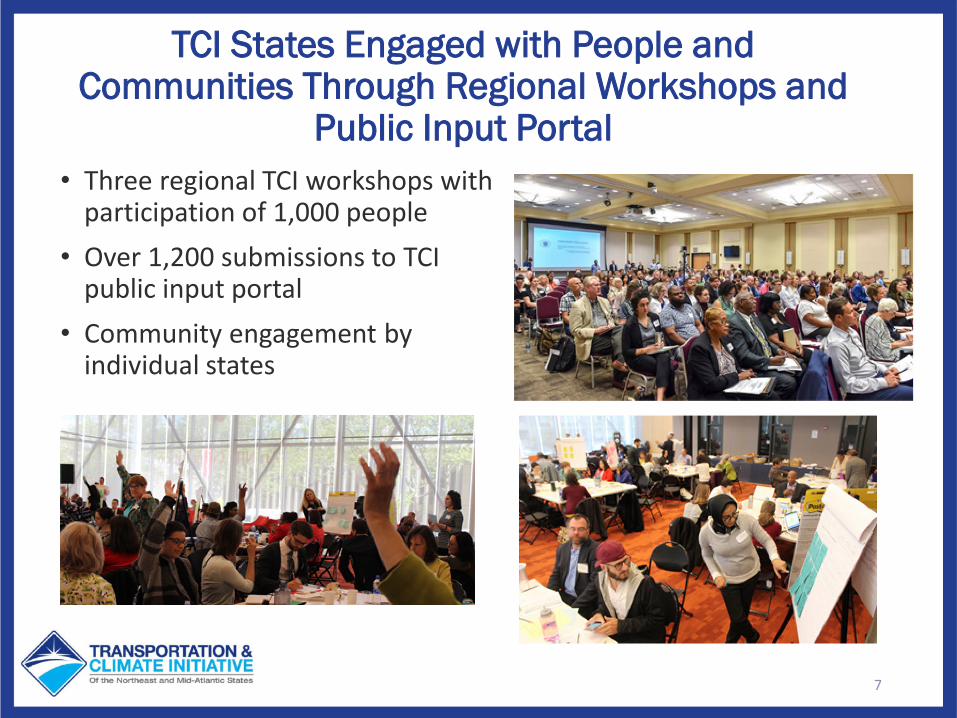
• Three regional TCI workshops with participation of 1,000 people
• Over 1,200 submissions to TCI public input portal
• Community engagement by individual states
TCI States Engaged with People and Communities Through Regional Workshops and
Public Input Portal
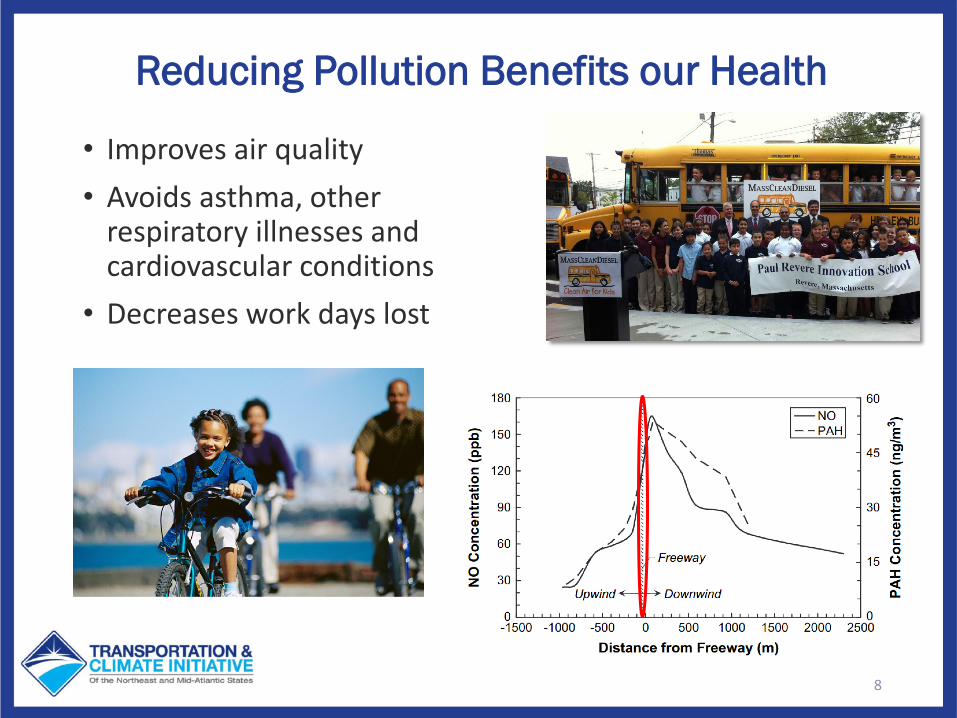
Reducing Pollution Benefits our Health
• Improves air quality• Avoids asthma, other
respiratory illnesses and cardiovascular conditions
• Decreases work days lost
8
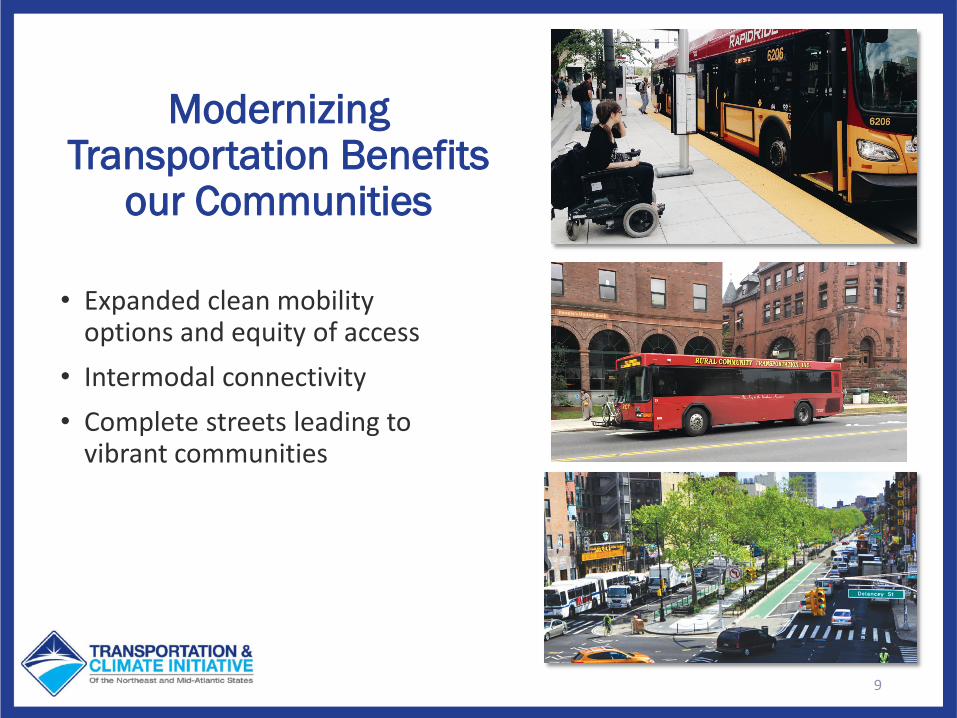
Modernizing Transportation Benefits
our Communities
• Expanded clean mobility options and equity of access
• Intermodal connectivity • Complete streets leading to
vibrant communities
9
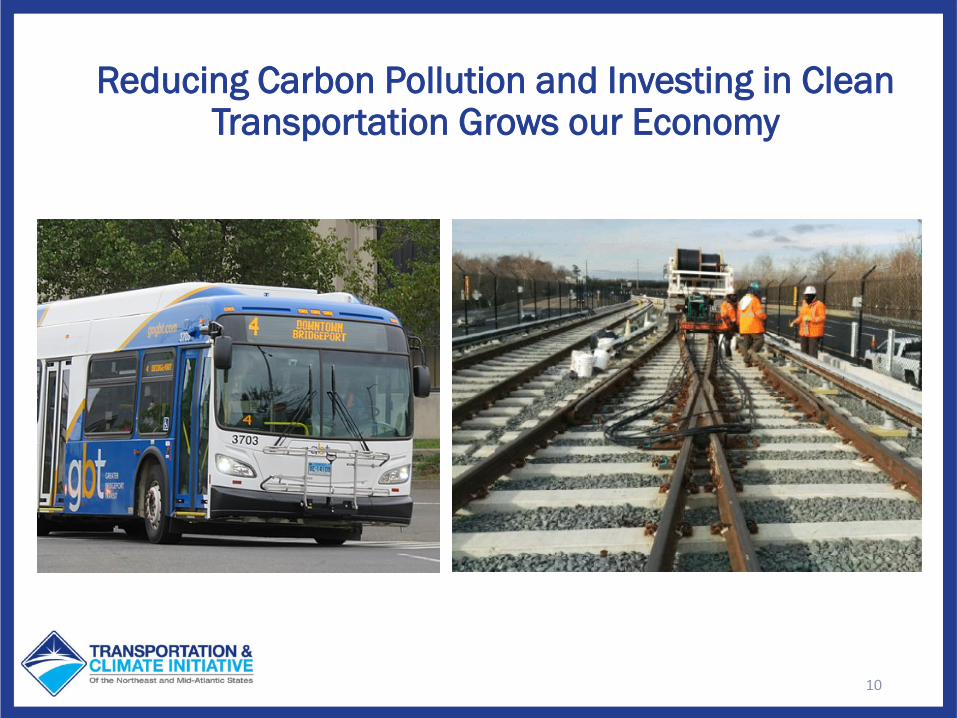
Reducing Carbon Pollution and Investing in Clean Transportation Grows our Economy
10
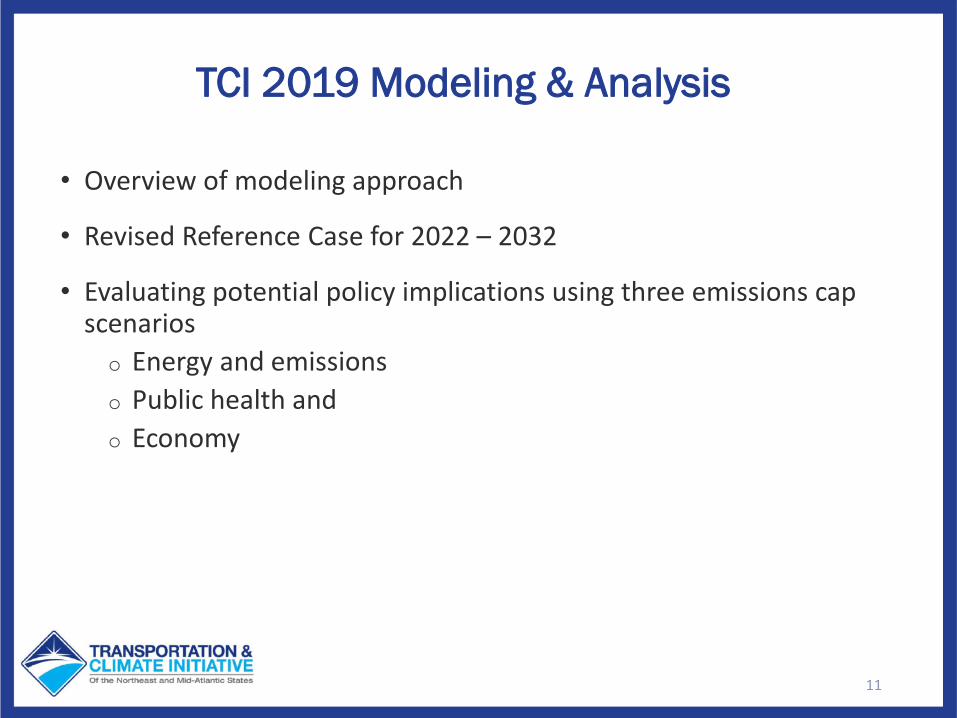
TCI 2019 Modeling & Analysis
• Overview of modeling approach
• Revised Reference Case for 2022 – 2032
• Evaluating potential policy implications using three emissions cap scenarioso Energy and emissionso Public health and o Economy
11
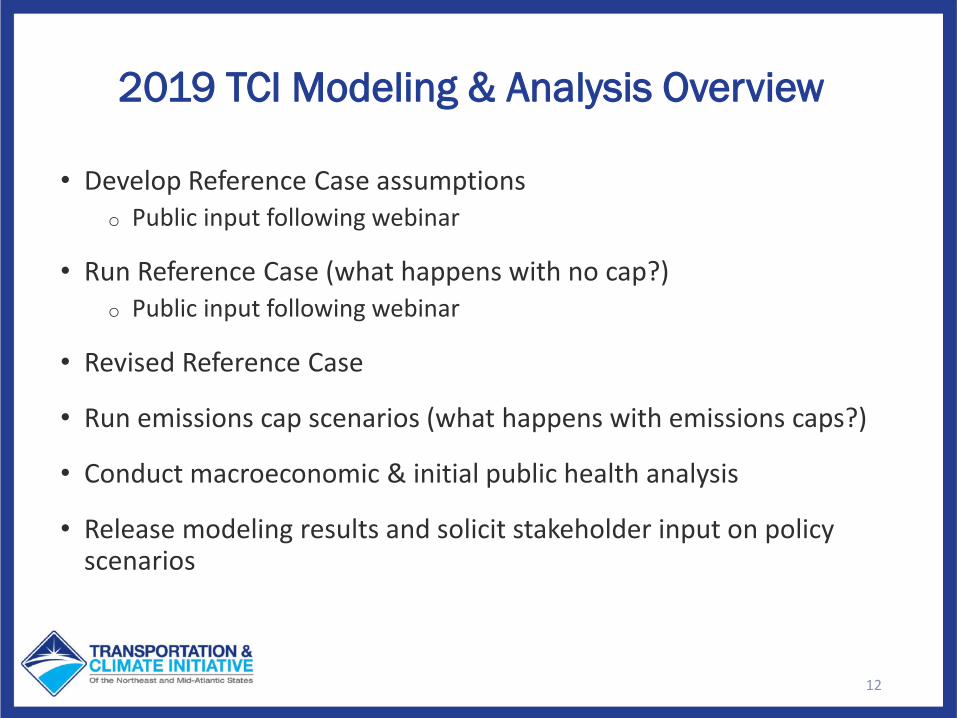
2019 TCI Modeling & Analysis Overview
• Develop Reference Case assumptionso Public input following webinar
• Run Reference Case (what happens with no cap?)o Public input following webinar
• Revised Reference Case
• Run emissions cap scenarios (what happens with emissions caps?)
• Conduct macroeconomic & initial public health analysis
• Release modeling results and solicit stakeholder input on policy scenarios
12
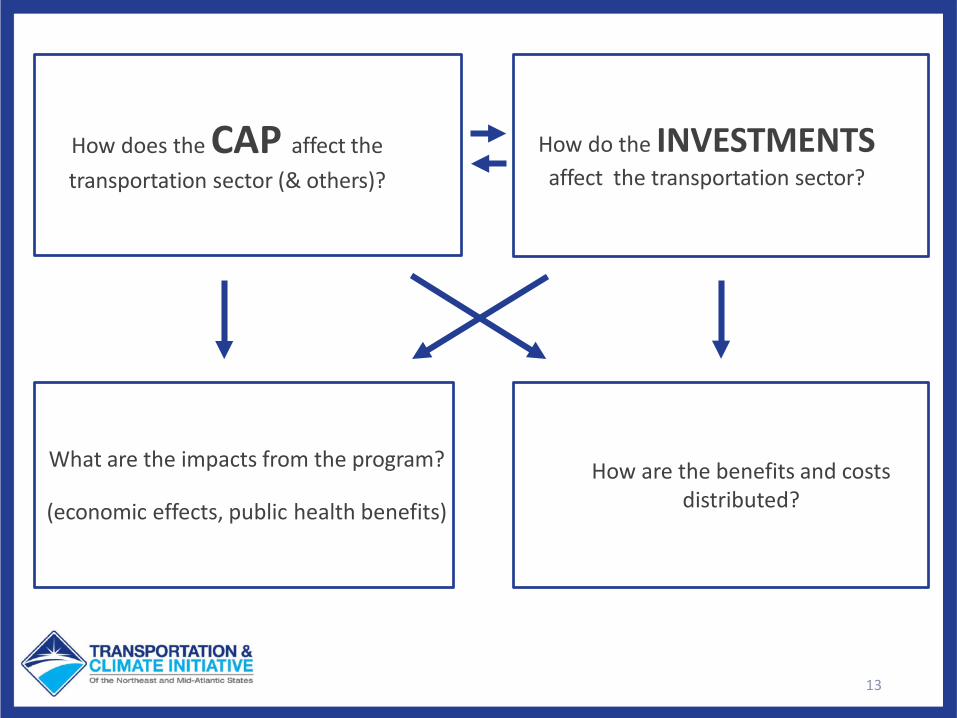
13
How does the CAP affect the transportation sector (& others)?
How do the INVESTMENTSaffect the transportation sector?
What are the impacts from the program?
(economic effects, public health benefits)
How are the benefits and costs distributed?
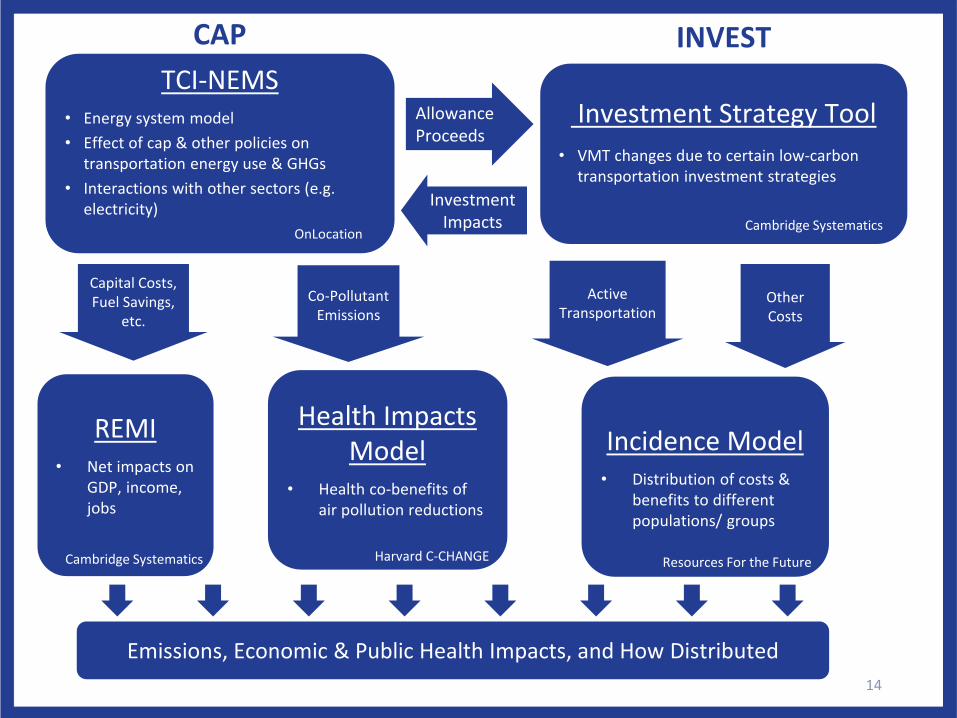
TCI-NEMS• Energy system model• Effect of cap & other policies on
transportation energy use & GHGs• Interactions with other sectors (e.g.
electricity)
Allowance Proceeds
INVESTCAP
Investment Strategy Tool• VMT changes due to certain low-carbon
transportation investment strategiesInvestment
ImpactsOnLocation Cambridge Systematics
REMI• Net impacts on
GDP, income, jobs
Cambridge Systematics
Health Impacts Model
• Health co-benefits of air pollution reductions
Harvard C-CHANGE
Capital Costs, Fuel Savings,
etc.Other Costs
Incidence Model• Distribution of costs &
benefits to different populations/ groups
Co-Pollutant Emissions
Active Transportation
Resources For the Future
Emissions, Economic & Public Health Impacts, and How Distributed14

“TCI-NEMS” Energy System Model
• In the TCI-NEMS model run to inform
the TCI policy development process,
the region is represented by three
subregions:
o Northeast,
o Mid-Atlantic and
o Upper South-Atlantic*
15
* For this analysis, we have split the South Atlantic Census Division into 2 subregions and renamed the model TCI-NEMS
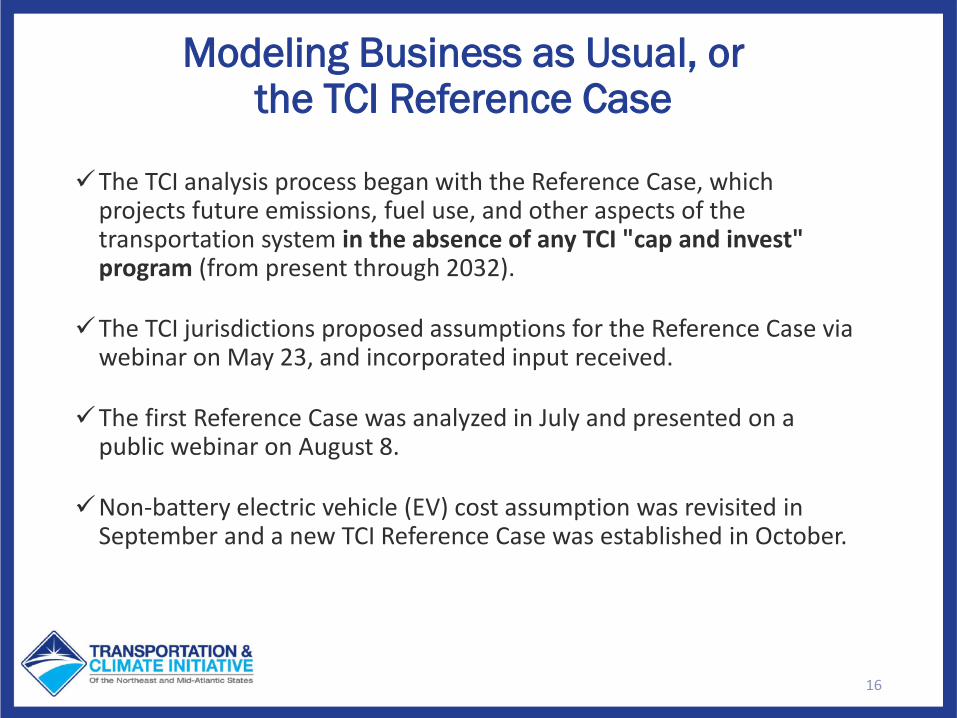
Modeling Business as Usual, or the TCI Reference Case
The TCI analysis process began with the Reference Case, which projects future emissions, fuel use, and other aspects of the transportation system in the absence of any TCI "cap and invest" program (from present through 2032).
The TCI jurisdictions proposed assumptions for the Reference Case via webinar on May 23, and incorporated input received.
The first Reference Case was analyzed in July and presented on a public webinar on August 8.
Non-battery electric vehicle (EV) cost assumption was revisited in September and a new TCI Reference Case was established in October.
16
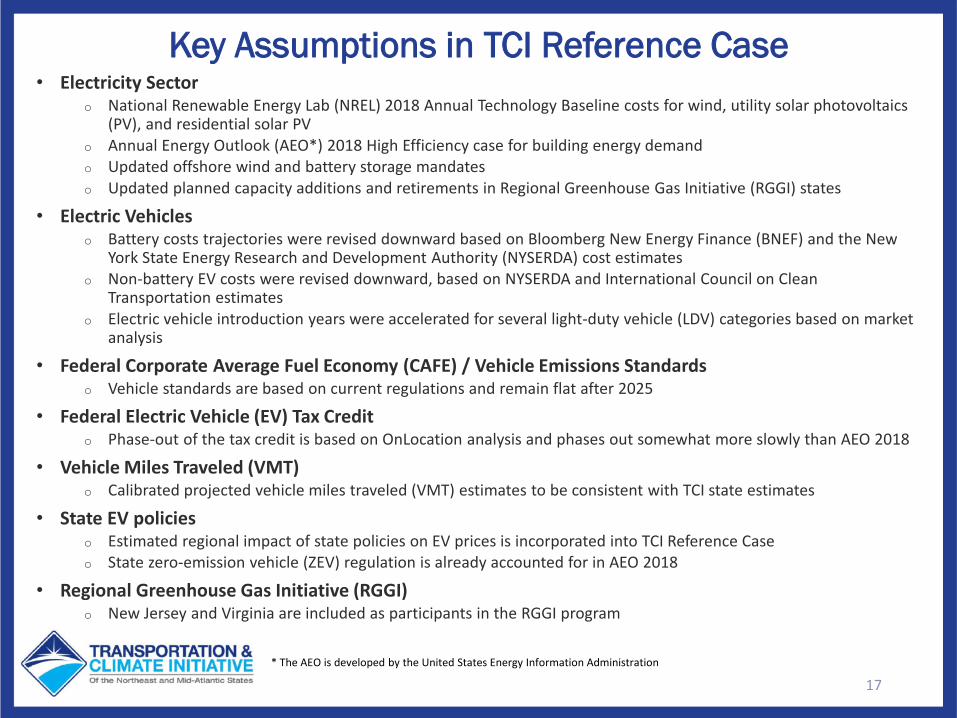
Key Assumptions in TCI Reference Case• Electricity Sector
o National Renewable Energy Lab (NREL) 2018 Annual Technology Baseline costs for wind, utility solar photovoltaics (PV), and residential solar PV
o Annual Energy Outlook (AEO*) 2018 High Efficiency case for building energy demando Updated offshore wind and battery storage mandateso Updated planned capacity additions and retirements in Regional Greenhouse Gas Initiative (RGGI) states
• Electric Vehicleso Battery costs trajectories were revised downward based on Bloomberg New Energy Finance (BNEF) and the New
York State Energy Research and Development Authority (NYSERDA) cost estimateso Non-battery EV costs were revised downward, based on NYSERDA and International Council on Clean
Transportation estimates o Electric vehicle introduction years were accelerated for several light-duty vehicle (LDV) categories based on market
analysis
• Federal Corporate Average Fuel Economy (CAFE) / Vehicle Emissions Standardso Vehicle standards are based on current regulations and remain flat after 2025
• Federal Electric Vehicle (EV) Tax Credito Phase-out of the tax credit is based on OnLocation analysis and phases out somewhat more slowly than AEO 2018
• Vehicle Miles Traveled (VMT)o Calibrated projected vehicle miles traveled (VMT) estimates to be consistent with TCI state estimates
• State EV policieso Estimated regional impact of state policies on EV prices is incorporated into TCI Reference Caseo State zero-emission vehicle (ZEV) regulation is already accounted for in AEO 2018
• Regional Greenhouse Gas Initiative (RGGI)o New Jersey and Virginia are included as participants in the RGGI program
17* The AEO is developed by the United States Energy Information Administration
18
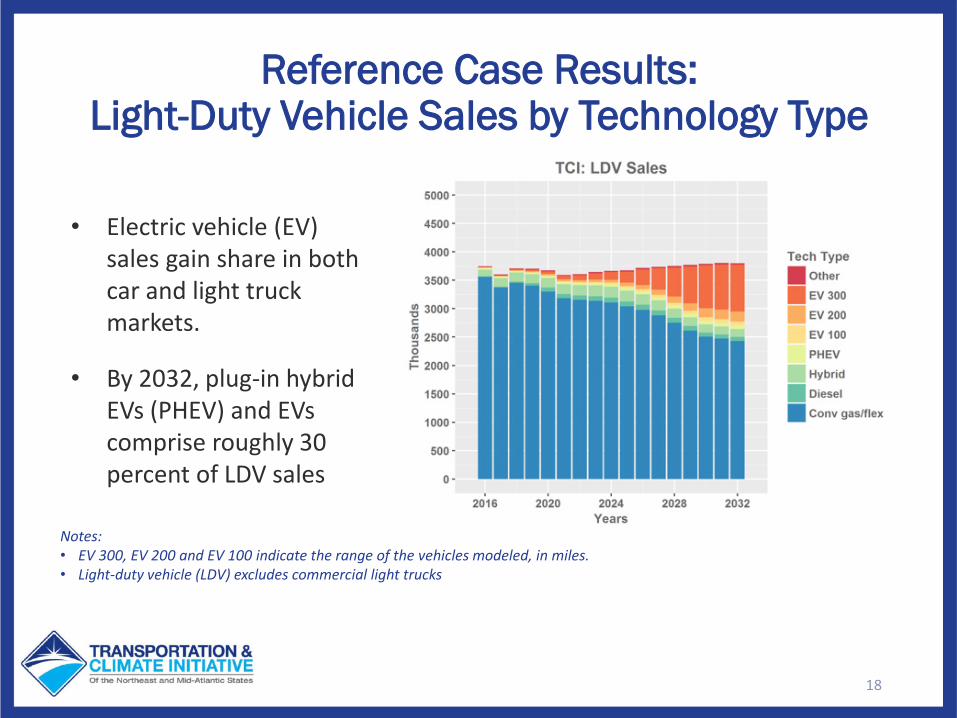
Reference Case Results: Light-Duty Vehicle Sales by Technology Type
• Electric vehicle (EV) sales gain share in both car and light truck markets.
• By 2032, plug-in hybrid EVs (PHEV) and EVs comprise roughly 30 percent of LDV sales
Notes:• EV 300, EV 200 and EV 100 indicate the range of the vehicles modeled, in miles.• Light-duty vehicle (LDV) excludes commercial light trucks
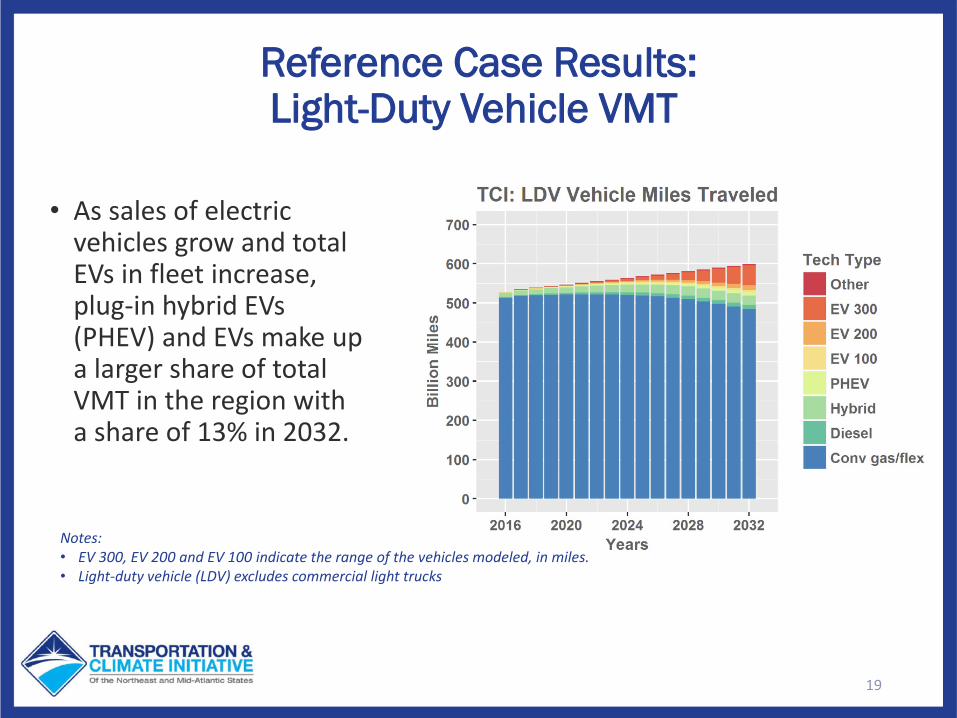
Reference Case Results: Light-Duty Vehicle VMT
• As sales of electric vehicles grow and total EVs in fleet increase, plug-in hybrid EVs (PHEV) and EVs make up a larger share of total VMT in the region with a share of 13% in 2032.
19
Notes:• EV 300, EV 200 and EV 100 indicate the range of the vehicles modeled, in miles.• Light-duty vehicle (LDV) excludes commercial light trucks
20
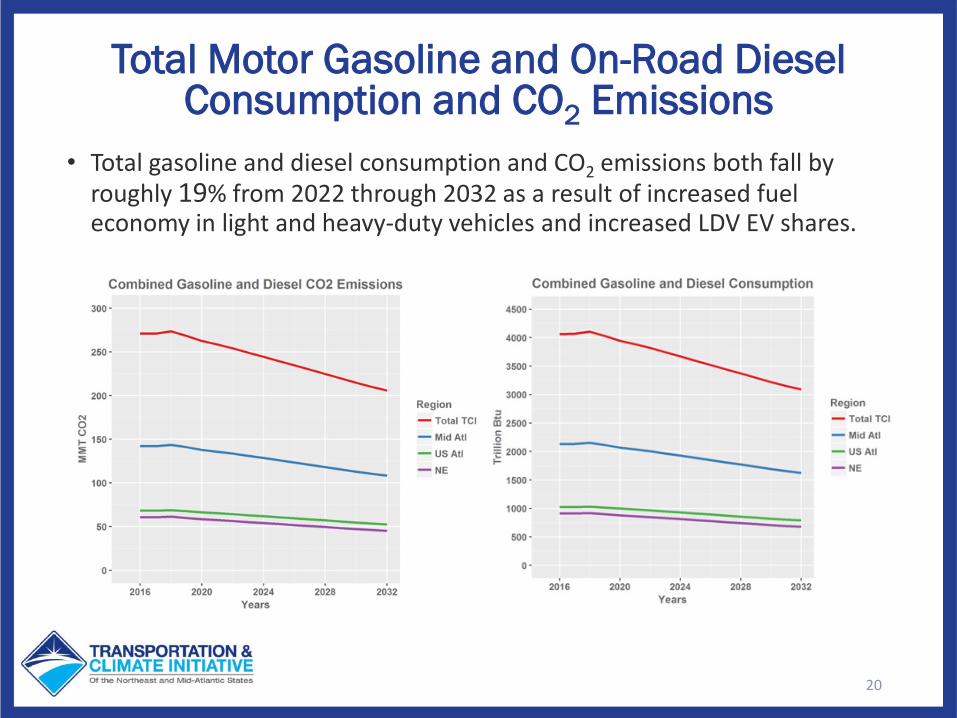
Total Motor Gasoline and On-Road Diesel Consumption and CO2 Emissions
• Total gasoline and diesel consumption and CO2 emissions both fall by roughly 19% from 2022 through 2032 as a result of increased fuel economy in light and heavy-duty vehicles and increased LDV EV shares.
21
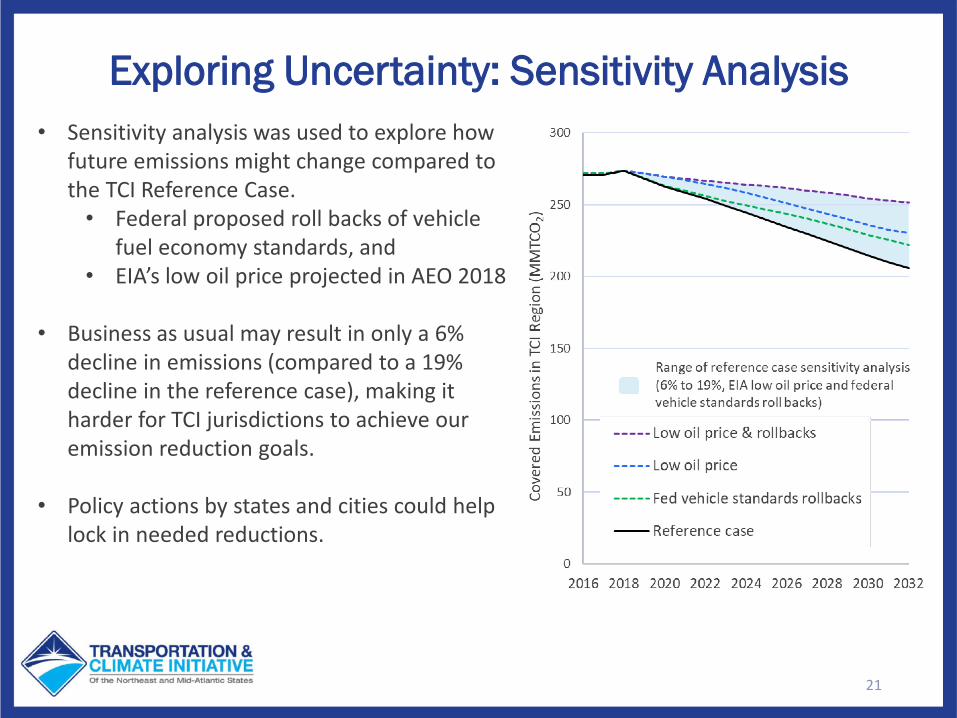
Exploring Uncertainty: Sensitivity Analysis• Sensitivity analysis was used to explore how
future emissions might change compared to the TCI Reference Case.
• Federal proposed roll backs of vehicle fuel economy standards, and
• EIA’s low oil price projected in AEO 2018
• Business as usual may result in only a 6% decline in emissions (compared to a 19% decline in the reference case), making it harder for TCI jurisdictions to achieve our emission reduction goals.
• Policy actions by states and cities could help lock in needed reductions.
22
Modeling Investments in Clean Transportation Strategies
• TCI is using an Investment Modeling Tool, in conjunction with TCI-NEMS, to estimate the reductions in CO2 emissions (and other benefits) for different amounts of potential allowance proceeds and clean transportation investments.
• The Investment Tool generates rough estimates for specific investment types, recognizing that there is substantial variability in the real world when comparing the impacts of investments across places and project types.
• This investment modeling is directional and illustrative, and does not take the place of each jurisdiction’s discretion to invest using strategies that support the goals of the overall program within their jurisdiction.
23
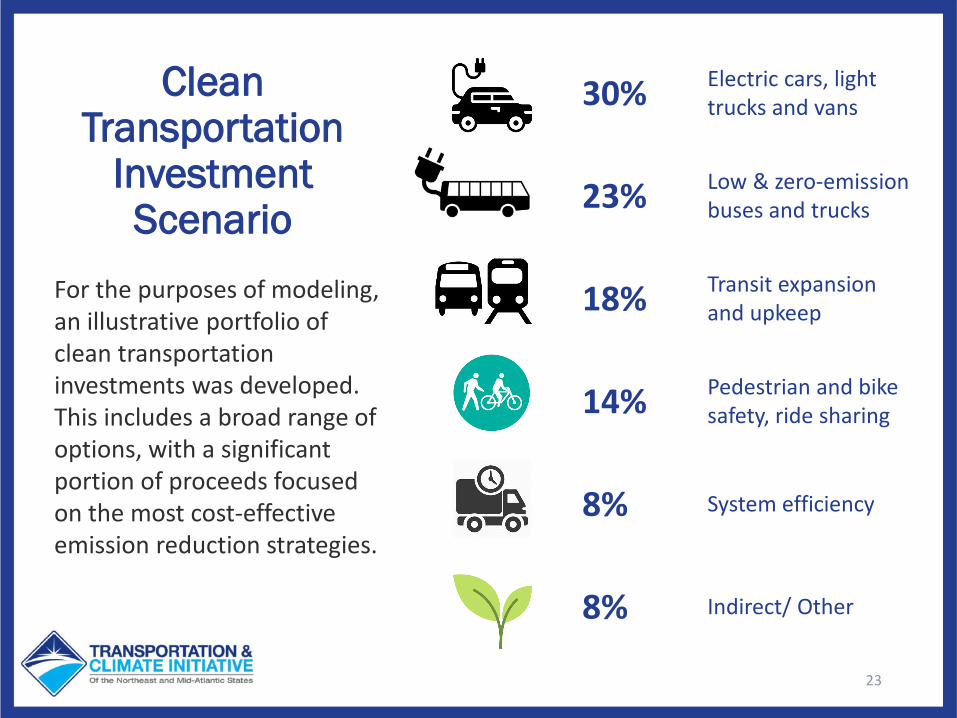
Clean Transportation
Investment Scenario
For the purposes of modeling, an illustrative portfolio of clean transportation investments was developed. This includes a broad range of options, with a significant portion of proceeds focused on the most cost-effective emission reduction strategies.
30% Electric cars, light trucks and vans
23% Low & zero-emission buses and trucks
18% Transit expansion and upkeep
14% Pedestrian and bike safety, ride sharing
8% System efficiency
8% Indirect/ Other
24
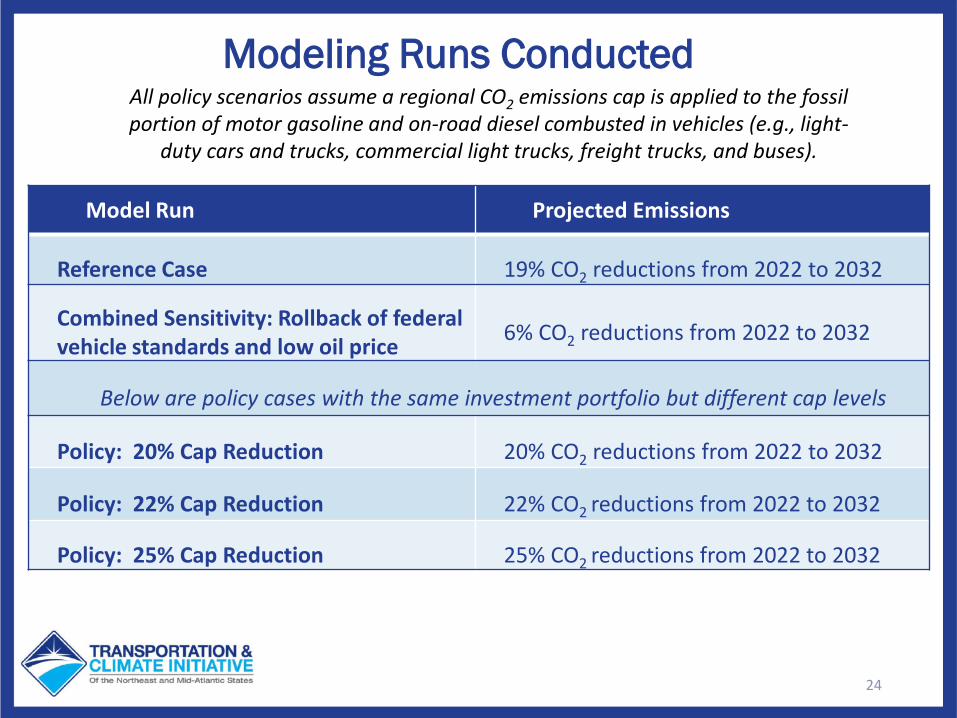
Modeling Runs Conducted All policy scenarios assume a regional CO2 emissions cap is applied to the fossil portion of motor gasoline and on-road diesel combusted in vehicles (e.g., light-
duty cars and trucks, commercial light trucks, freight trucks, and buses).
Model Run Projected Emissions
Reference Case 19% CO2 reductions from 2022 to 2032
Combined Sensitivity: Rollback of federal vehicle standards and low oil price 6% CO2 reductions from 2022 to 2032
Below are policy cases with the same investment portfolio but different cap levels
Policy: 20% Cap Reduction 20% CO2 reductions from 2022 to 2032
Policy: 22% Cap Reduction 22% CO2 reductions from 2022 to 2032
Policy: 25% Cap Reduction 25% CO2 reductions from 2022 to 2032
25
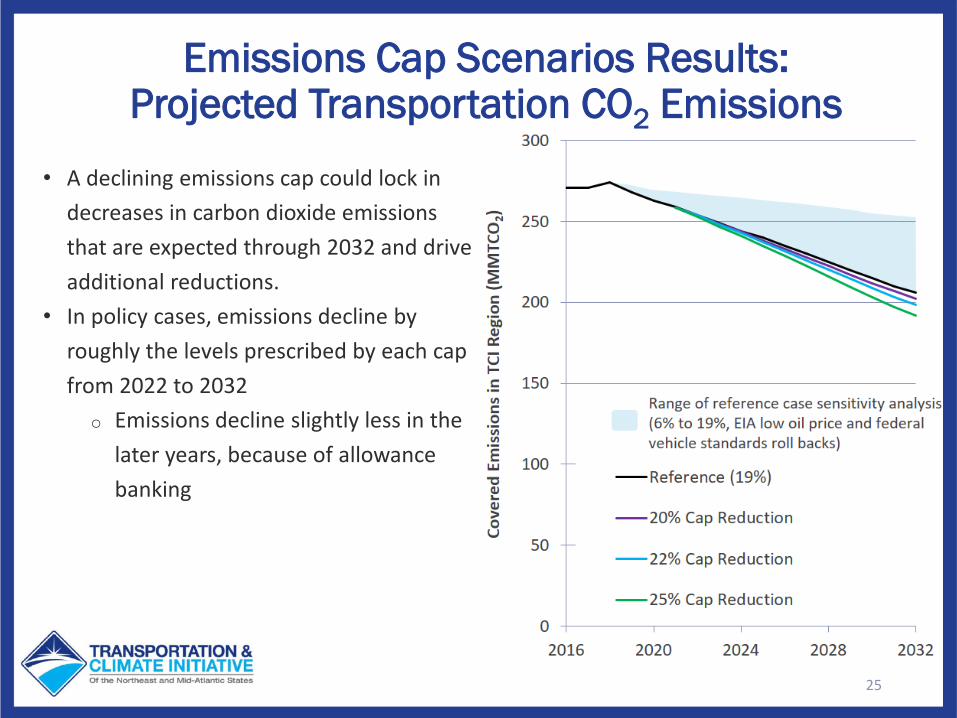
• A declining emissions cap could lock in decreases in carbon dioxide emissions that are expected through 2032 and drive additional reductions.
• In policy cases, emissions decline by roughly the levels prescribed by each cap from 2022 to 2032
o Emissions decline slightly less in the later years, because of allowance banking
Emissions Cap Scenarios Results:Projected Transportation CO2 Emissions
26
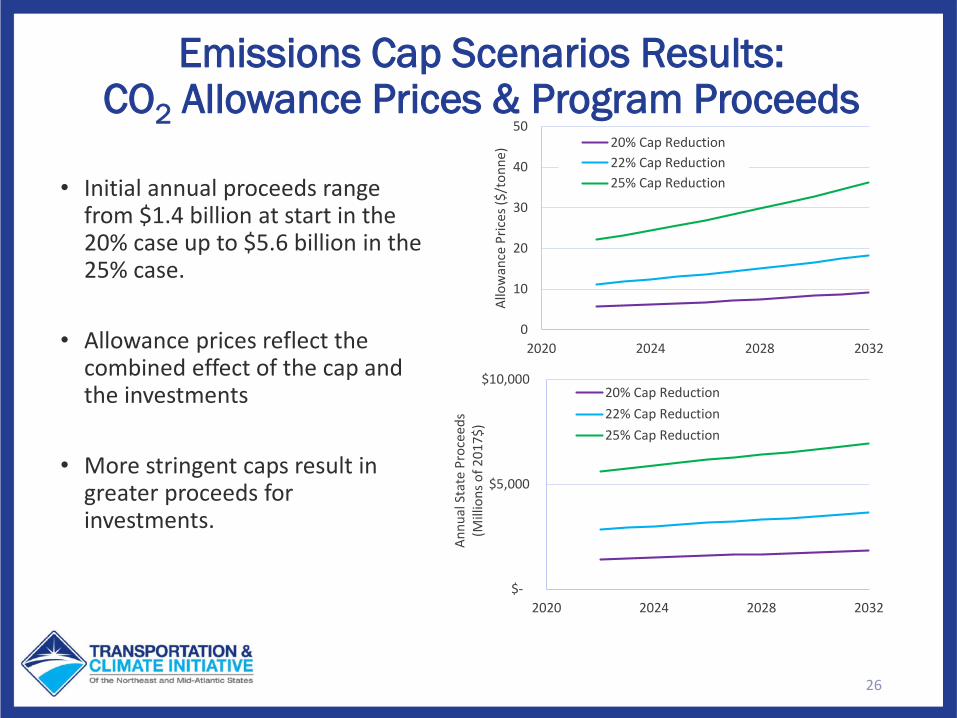
• Initial annual proceeds range from $1.4 billion at start in the 20% case up to $5.6 billion in the 25% case.
• Allowance prices reflect the combined effect of the cap and the investments
• More stringent caps result in greater proceeds for investments.
Emissions Cap Scenarios Results: CO2 Allowance Prices & Program Proceeds
$-
$5,000
$10,000
2020 2024 2028 2032
Annu
al S
tate
Pro
ceed
s (M
illio
ns o
f 201
7$)
20% Cap Reduction22% Cap Reduction25% Cap Reduction
0
10
20
30
40
50
2020 2024 2028 2032
Allo
wan
ce P
rices
($/t
onne
) 20% Cap Reduction22% Cap Reduction25% Cap Reduction
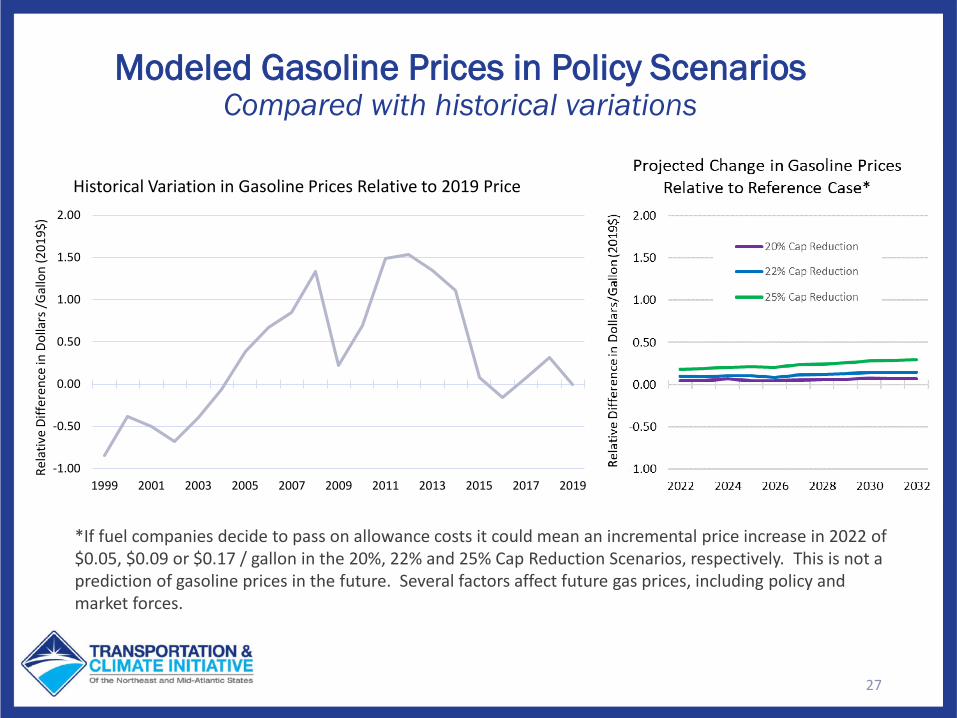
Modeled Gasoline Prices in Policy ScenariosCompared with historical variations
27
*If fuel companies decide to pass on allowance costs it could mean an incremental price increase in 2022 of $0.05, $0.09 or $0.17 / gallon in the 20%, 22% and 25% Cap Reduction Scenarios, respectively. This is not a prediction of gasoline prices in the future. Several factors affect future gas prices, including policy and market forces.
-1.00
-0.50
0.00
0.50
1.00
1.50
2.00
1999 2001 2003 2005 2007 2009 2011 2013 2015 2017 2019
Rela
tive
Diffe
renc
e in
Dol
lars
/Gal
lon
(201
9$)
Historical Variation in Gasoline Prices Relative to 2019 Price
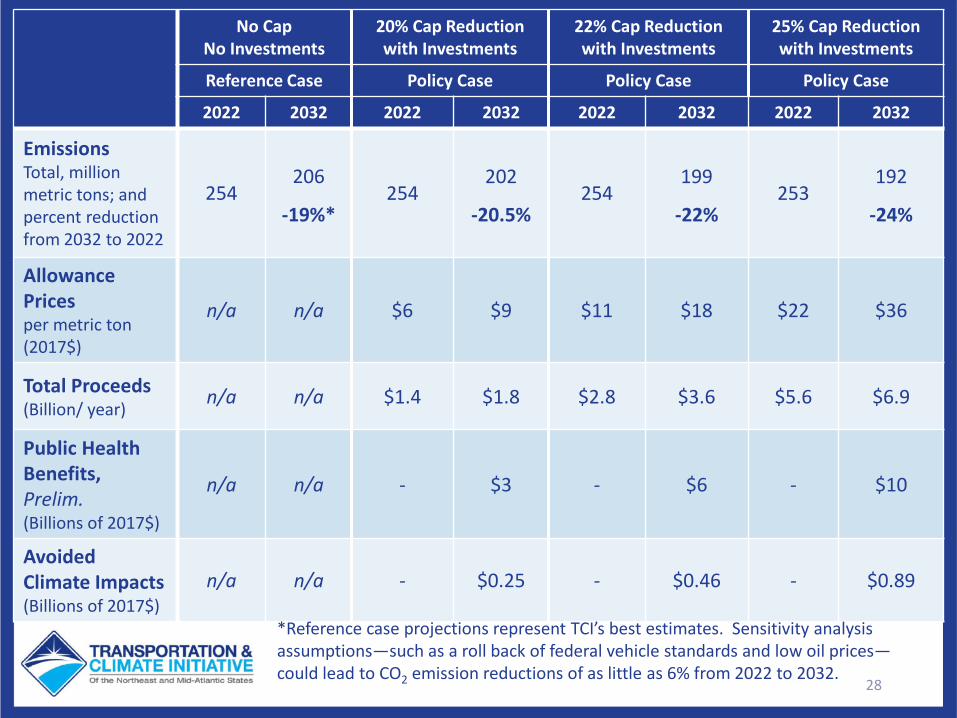
No CapNo Investments
20% Cap Reductionwith Investments
22% Cap Reductionwith Investments
25% Cap Reductionwith Investments
Reference Case Policy Case Policy Case Policy Case
2022 2032 2022 2032 2022 2032 2022 2032
EmissionsTotal, million metric tons; andpercent reduction from 2032 to 2022
254206
-19%*254
202
-20.5%254
199
-22%253
192
-24%
AllowancePricesper metric ton (2017$)
n/a n/a $6 $9 $11 $18 $22 $36
Total Proceeds(Billion/ year)
n/a n/a $1.4 $1.8 $2.8 $3.6 $5.6 $6.9
Public Health Benefits, Prelim.(Billions of 2017$)
n/a n/a - $3 - $6 - $10
Avoided Climate Impacts(Billions of 2017$)
n/a n/a - $0.25 - $0.46 - $0.89
28
*Reference case projections represent TCI’s best estimates. Sensitivity analysis assumptions—such as a roll back of federal vehicle standards and low oil prices—could lead to CO2 emission reductions of as little as 6% from 2022 to 2032.
29
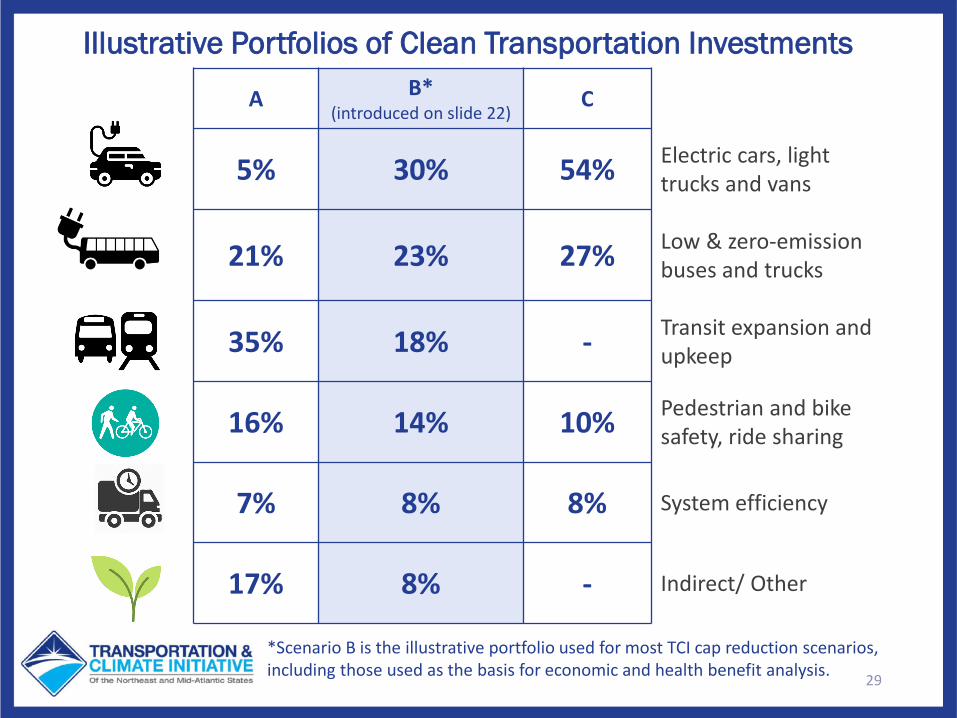
Illustrative Portfolios of Clean Transportation Investments
A B*(introduced on slide 22)
C
5% 30% 54% Electric cars, light trucks and vans
21% 23% 27% Low & zero-emission buses and trucks
35% 18% - Transit expansion and upkeep
16% 14% 10% Pedestrian and bike safety, ride sharing
7% 8% 8% System efficiency
17% 8% - Indirect/ Other
*Scenario B is the illustrative portfolio used for most TCI cap reduction scenarios, including those used as the basis for economic and health benefit analysis.
30
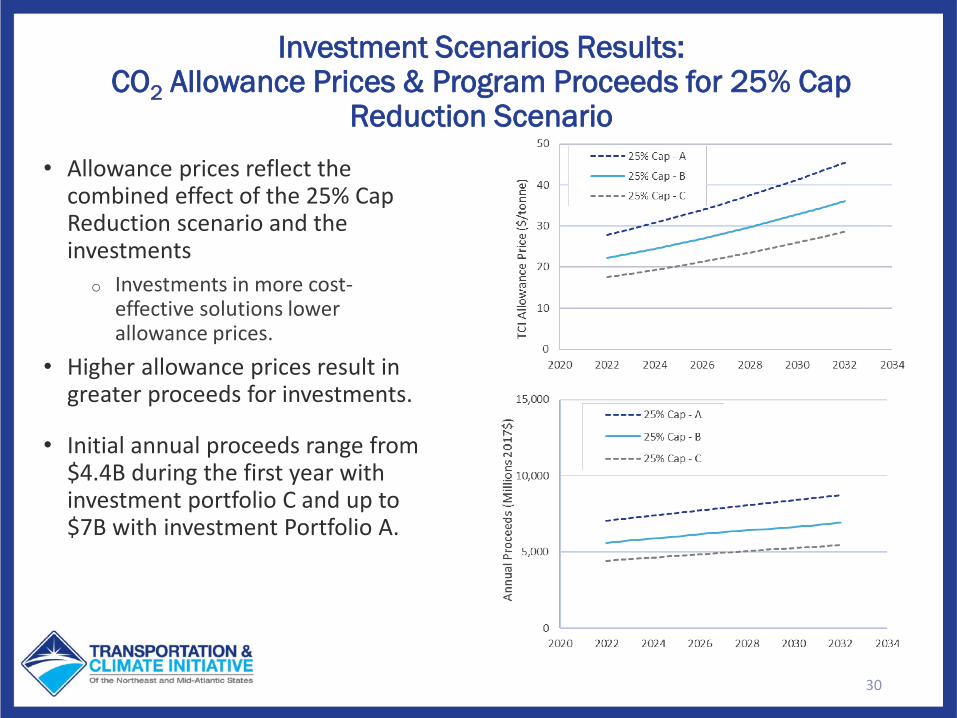
• Allowance prices reflect the combined effect of the 25% Cap Reduction scenario and the investments
o Investments in more cost-effective solutions lower allowance prices.
• Higher allowance prices result in greater proceeds for investments.
• Initial annual proceeds range from $4.4B during the first year with investment portfolio C and up to $7B with investment Portfolio A.
Investment Scenarios Results: CO2 Allowance Prices & Program Proceeds for 25% Cap
Reduction Scenario
Background on REMI Macroeconomic Model
• Dynamic model of the regional economy
• Considers monetary flows throughout the economy
• Model includes:o 12 states & D.C. o 23 industry sectors
31
Overview of REMI Modeling Results
• Shown are REMI model economic inputs and outputs for the 20%, 22%, & 25% reduction cases, illustrative annual average investments of $1.6 to $6.25B compared to the Reference Case
• Changes represent combined output of NEMS and TCI Investment Modeling Tool
• Changes for 2033 – 2040 time period assume discontinuation of cap-and-invest, but continuation of accrued benefits from 2022-2032 investments
32
Key Findings from Macroeconomic Modeling
• Businesses and individuals save money from:o reduced overall fuel expenditures, o lower congestion, and o lower vehicle operating and maintenance costs.
• Cost of policy (fuel prices increase due to allowance prices) is small relative to overall expected economic growth in the ‘business as usual’ Reference Case.
• The modeled program would have a modest positive impact on GDP, income, and jobs, all of which would be greater than business as usual in 2032 and substantially net positive over the 2022-2040 timeframe.
33
34
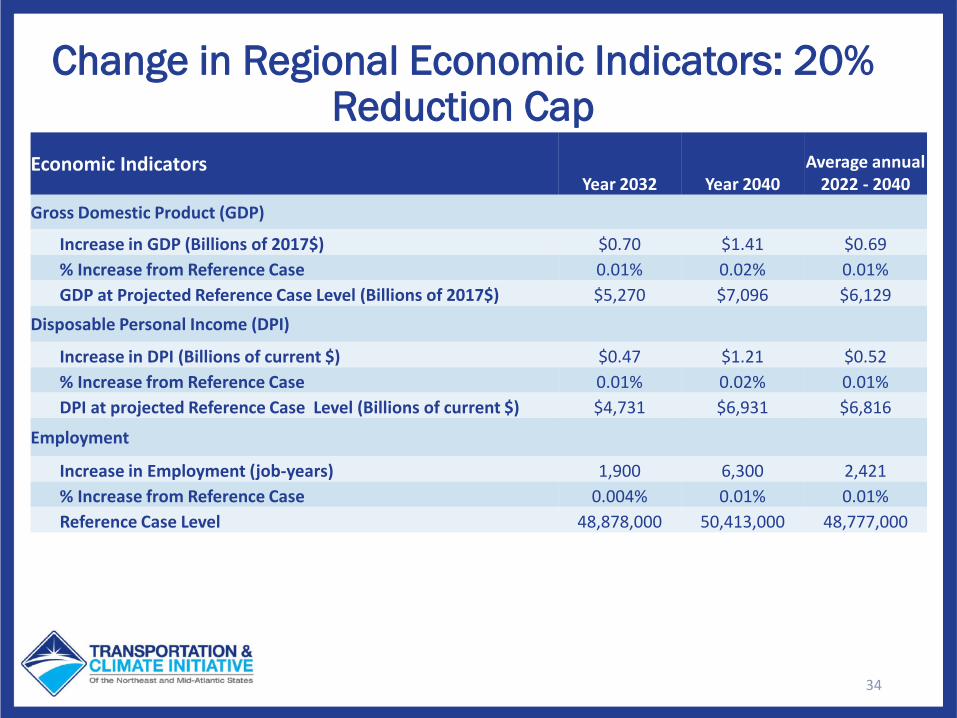
Change in Regional Economic Indicators: 20% Reduction Cap
Economic IndicatorsYear 2032 Year 2040
Average annual 2022 - 2040
Gross Domestic Product (GDP)
Increase in GDP (Billions of 2017$) $0.70 $1.41 $0.69 % Increase from Reference Case 0.01% 0.02% 0.01%GDP at Projected Reference Case Level (Billions of 2017$) $5,270 $7,096 $6,129
Disposable Personal Income (DPI)
Increase in DPI (Billions of current $) $0.47 $1.21 $0.52 % Increase from Reference Case 0.01% 0.02% 0.01%DPI at projected Reference Case Level (Billions of current $) $4,731 $6,931 $6,816
Employment
Increase in Employment (job-years) 1,900 6,300 2,421% Increase from Reference Case 0.004% 0.01% 0.01%Reference Case Level 48,878,000 50,413,000 48,777,000

35
Change in Regional Economic Indicators: 22% Reduction Cap
Economic IndicatorsYear 2032 Year 2040
Average annual 2022 - 2040
Gross Domestic Product (GDP)
Increase in GDP (Billions of 2017$) $1.40 $2.81 $1.38 % Increase from Reference Case 0.03% 0.04% 0.02%GDP at Projected Reference Case Level (Billions of 2017$) $5,270 $7,096 $6,129
Disposable Personal Income (DPI)
Increase in DPI (Billions of current $) $0.94 $2.42 $1.04 % Increase from Reference Case 0.02% 0.03% 0.02%DPI at projected Reference Case Level (Billions of current $) $4,731 $6,931 $6,816
Employment
Increase in Employment (job-years) 3,982 12,709 4,917 % Increase from Reference Case 0.01% 0.03% 0.01%Reference Case Level 48,878,000 50,413,000 48,777,000
36
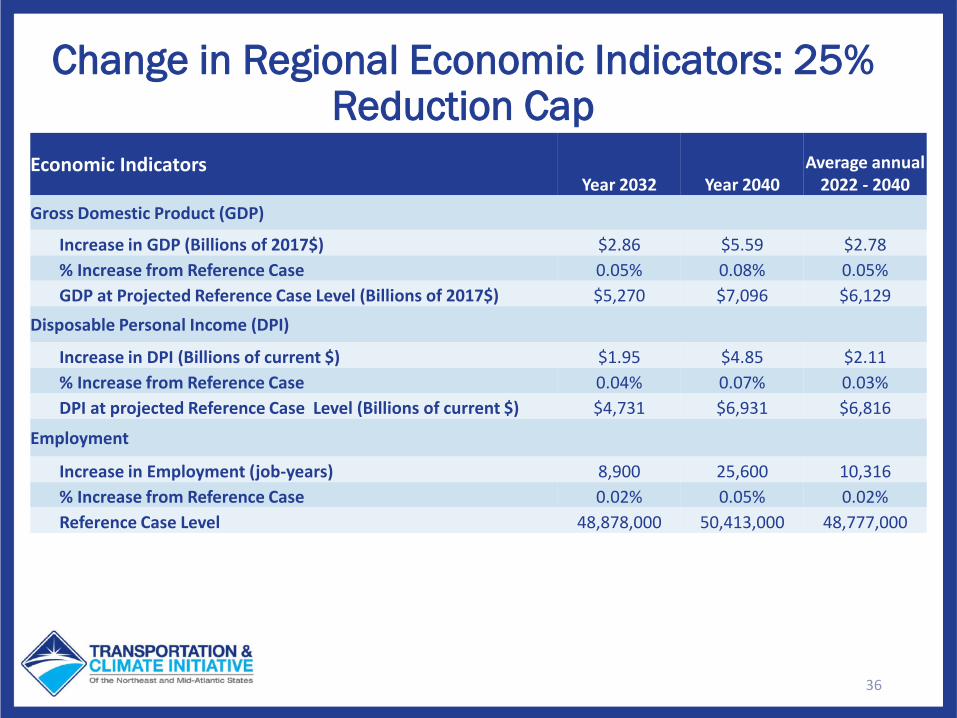
Change in Regional Economic Indicators: 25% Reduction Cap
Economic IndicatorsYear 2032 Year 2040
Average annual 2022 - 2040
Gross Domestic Product (GDP)
Increase in GDP (Billions of 2017$) $2.86 $5.59 $2.78 % Increase from Reference Case 0.05% 0.08% 0.05%GDP at Projected Reference Case Level (Billions of 2017$) $5,270 $7,096 $6,129
Disposable Personal Income (DPI)
Increase in DPI (Billions of current $) $1.95 $4.85 $2.11 % Increase from Reference Case 0.04% 0.07% 0.03%DPI at projected Reference Case Level (Billions of current $) $4,731 $6,931 $6,816
Employment
Increase in Employment (job-years) 8,900 25,600 10,316% Increase from Reference Case 0.02% 0.05% 0.02%Reference Case Level 48,878,000 50,413,000 48,777,000
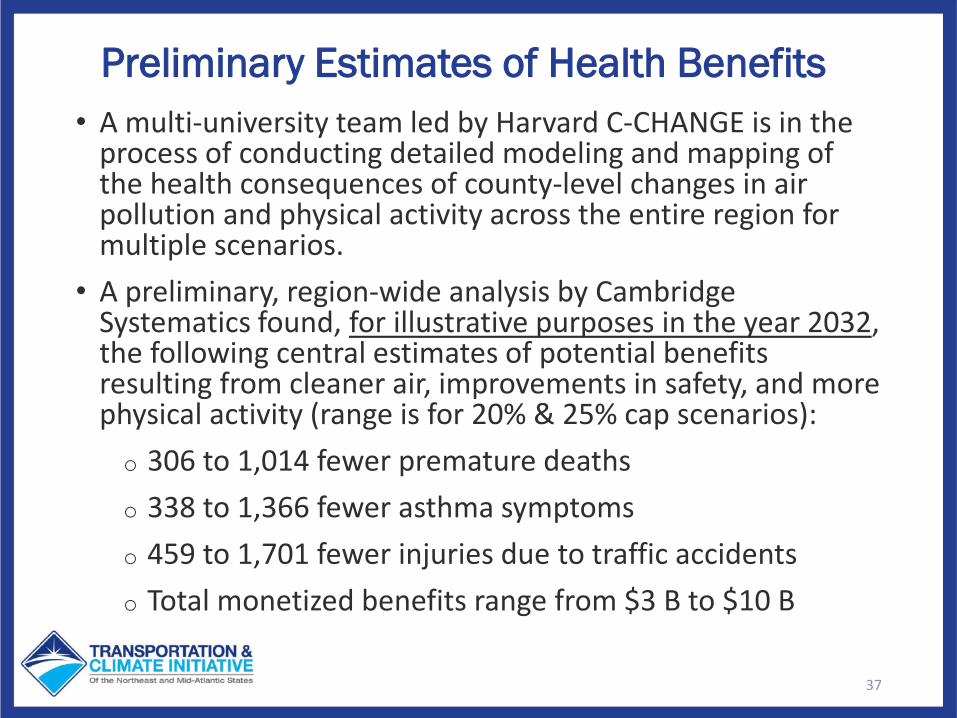
Preliminary Estimates of Health Benefits • A multi-university team led by Harvard C-CHANGE is in the
process of conducting detailed modeling and mapping of the health consequences of county-level changes in air pollution and physical activity across the entire region for multiple scenarios.
• A preliminary, region-wide analysis by Cambridge Systematics found, for illustrative purposes in the year 2032, the following central estimates of potential benefits resulting from cleaner air, improvements in safety, and more physical activity (range is for 20% & 25% cap scenarios):o 306 to 1,014 fewer premature deathso 338 to 1,366 fewer asthma symptomso 459 to 1,701 fewer injuries due to traffic accidentso Total monetized benefits range from $3 B to $10 B
37
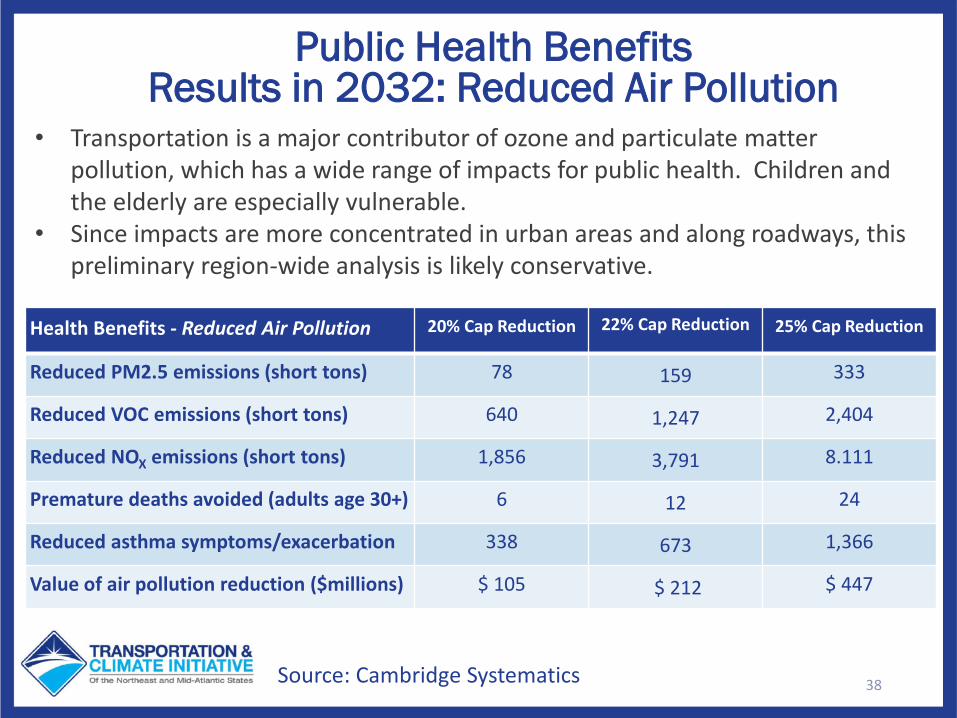
Public Health Benefits Results in 2032: Reduced Air Pollution
• Transportation is a major contributor of ozone and particulate matter pollution, which has a wide range of impacts for public health. Children and the elderly are especially vulnerable.
• Since impacts are more concentrated in urban areas and along roadways, this preliminary region-wide analysis is likely conservative.
Source: Cambridge Systematics 38
Health Benefits - Reduced Air Pollution 20% Cap Reduction 22% Cap Reduction 25% Cap Reduction
Reduced PM2.5 emissions (short tons) 78 159 333
Reduced VOC emissions (short tons) 640 1,247 2,404
Reduced NOX emissions (short tons) 1,856 3,791 8.111
Premature deaths avoided (adults age 30+) 6 12 24
Reduced asthma symptoms/exacerbation 338 673 1,366
Value of air pollution reduction ($millions) $ 105 $ 212 $ 447
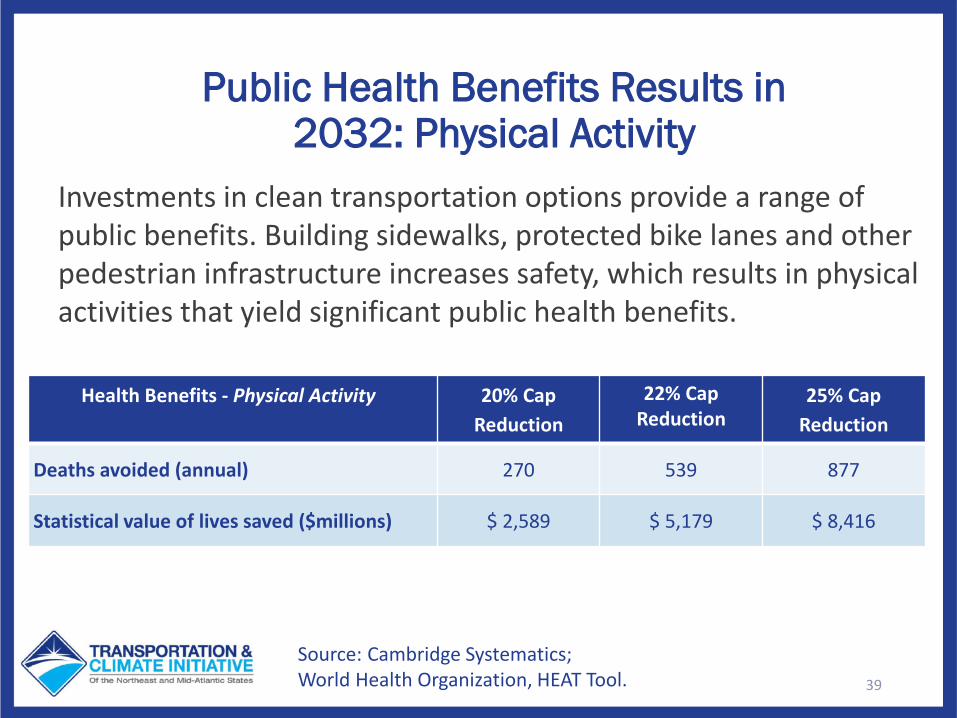
Public Health Benefits Results in 2032: Physical Activity
Health Benefits - Physical Activity 20% Cap Reduction
22% Cap Reduction
25% Cap Reduction
Deaths avoided (annual) 270 539 877
Statistical value of lives saved ($millions) $ 2,589 $ 5,179 $ 8,416
39
Source: Cambridge Systematics; World Health Organization, HEAT Tool.
Investments in clean transportation options provide a range of public benefits. Building sidewalks, protected bike lanes and other pedestrian infrastructure increases safety, which results in physical activities that yield significant public health benefits.
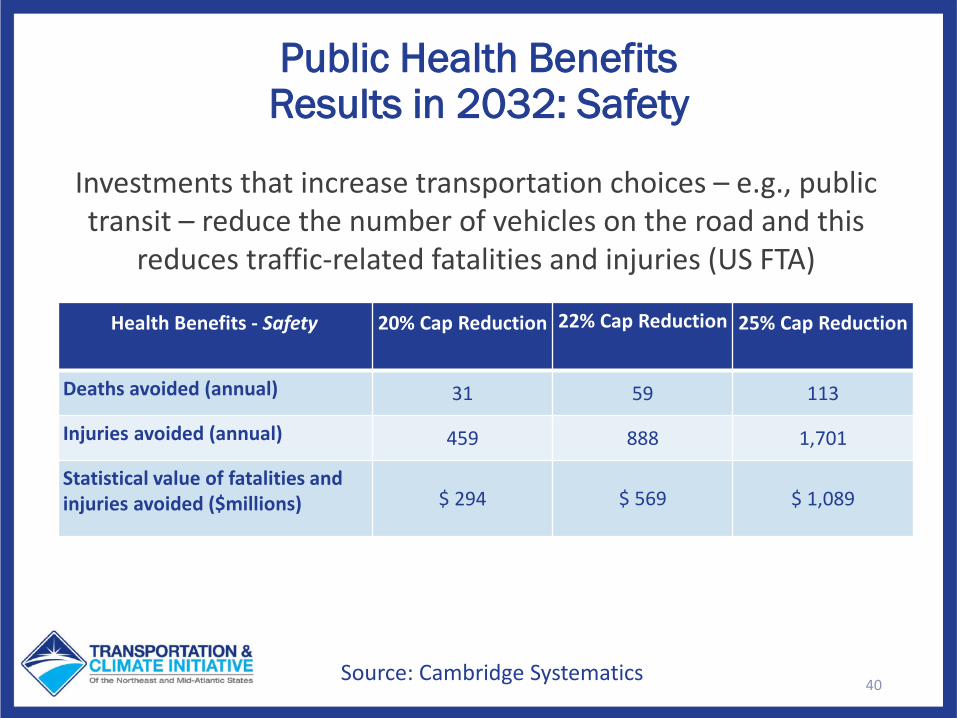
Public Health Benefits Results in 2032: Safety
Investments that increase transportation choices – e.g., public transit – reduce the number of vehicles on the road and this
reduces traffic-related fatalities and injuries (US FTA)
40Source: Cambridge Systematics
Health Benefits - Safety 20% Cap Reduction 22% Cap Reduction 25% Cap Reduction
Deaths avoided (annual) 31 59 113
Injuries avoided (annual) 459 888 1,701
Statistical value of fatalities and injuries avoided ($millions) $ 294 $ 569 $ 1,089
Conclusions from Macroeconomic and Public Health Modeling
• A declining emissions cap could lock in decreases in carbon dioxide emissions that are expected through 2032 and drive additional reductions throughout the region.
• The modeled program would have a modest positive impact on GDP, income, and jobs, all of which would be greater than business as usual in 2032 and substantially net positive over the 2022-2040 timeframe.
• Significant region-wide benefits to public health would result from improvements to air quality, public safety, and greater access to active transportation options, including walking and cycling.
We can make significant progress towards achieving climate goals by reducing GHG and other pollution from transportation at modest cost
and net benefits to the economy
41
Next Steps• Public input will continue to be welcome and encouraged through the
TCI online portal. Please provide input by Friday, February 28, 2020
https://www.transportationandclimate.org/main-menu/tci-regional-policy-design-stakeholder-input-form
• Modeling
o More sensitivity analysis, to reflect uncertainties and inform the design of stability mechanisms
o More policy cases, based on sensitivity analysis
o Detailed modeling on benefits for public health is underway by a multi-university team led by Harvard C-CHANGE
o Incidence modeling to evaluate benefits and costs for households, led by Resources of for the Future
• Public engagement through webinars and in-person events
42
Questions?Speakers on today’s webinar:
State OfficialsMarty Suuberg, Commissioner, Massachusetts Department of Environmental
ProtectionBrian Woods, Environmental Analyst in the Vermont Agency of Natural ResourcesChris Hoagland, Program Manager for the Climate Change Program at Maryland
Department of the Environment Keri Enright-Kato, Director of the Office of Climate Change, Technology, and Research
at the Connecticut Department of Energy and Environmental Protection
ConsultantsFrances Wood, Director, OnLocation
Chris Porter, Principal, Cambridge Systematics
Georgetown Climate CenterVicki Arroyo, Executive Director
James Bradbury, Mitigation Program DirectorJoe Kruger, Director of Research and Strategy
43
Appendix
44
45
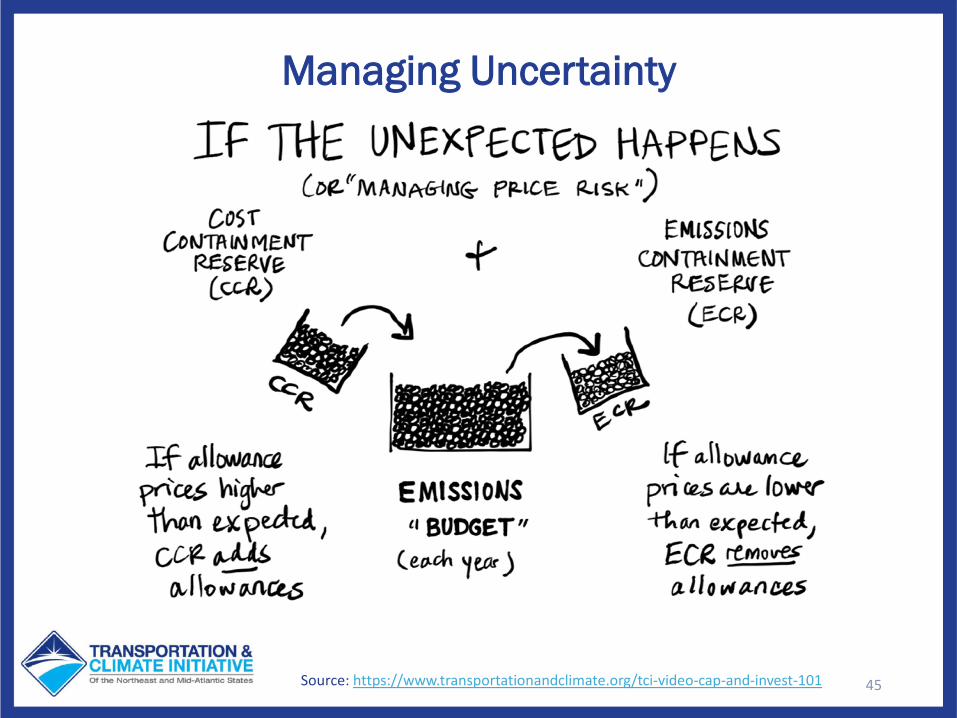
Managing Uncertainty
Source: https://www.transportationandclimate.org/tci-video-cap-and-invest-101
46
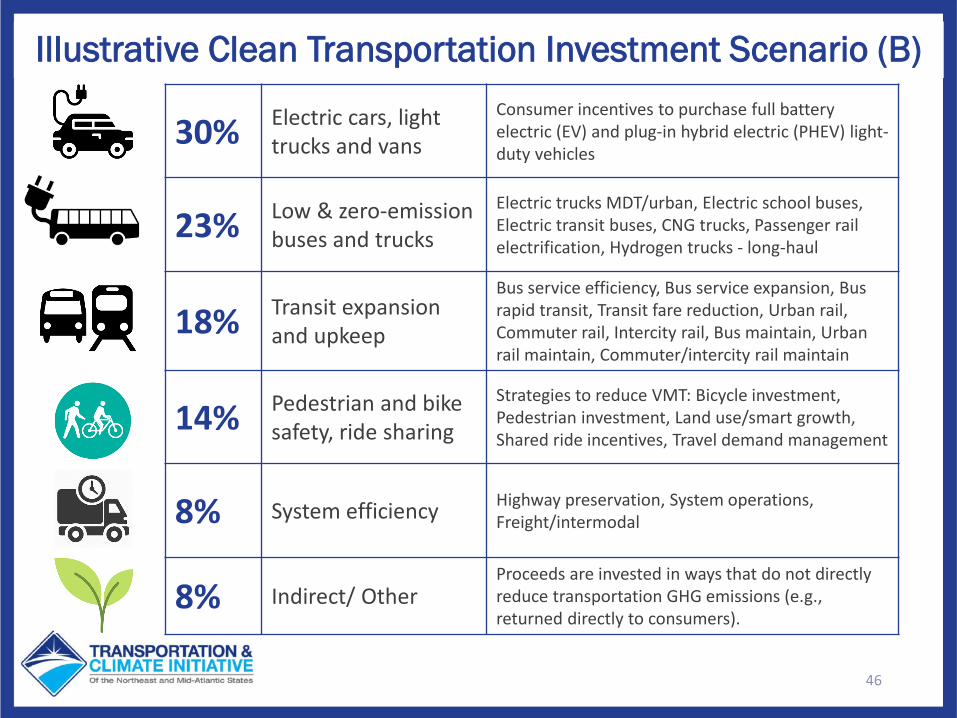
Illustrative Clean Transportation Investment Scenario (B)
30% Electric cars, light trucks and vans
Consumer incentives to purchase full battery electric (EV) and plug-in hybrid electric (PHEV) light-duty vehicles
23% Low & zero-emission buses and trucks
Electric trucks MDT/urban, Electric school buses, Electric transit buses, CNG trucks, Passenger rail electrification, Hydrogen trucks - long-haul
18% Transit expansion and upkeep
Bus service efficiency, Bus service expansion, Bus rapid transit, Transit fare reduction, Urban rail, Commuter rail, Intercity rail, Bus maintain, Urban rail maintain, Commuter/intercity rail maintain
14% Pedestrian and bike safety, ride sharing
Strategies to reduce VMT: Bicycle investment, Pedestrian investment, Land use/smart growth, Shared ride incentives, Travel demand management
8% System efficiency Highway preservation, System operations, Freight/intermodal
8% Indirect/ OtherProceeds are invested in ways that do not directly reduce transportation GHG emissions (e.g., returned directly to consumers).
47
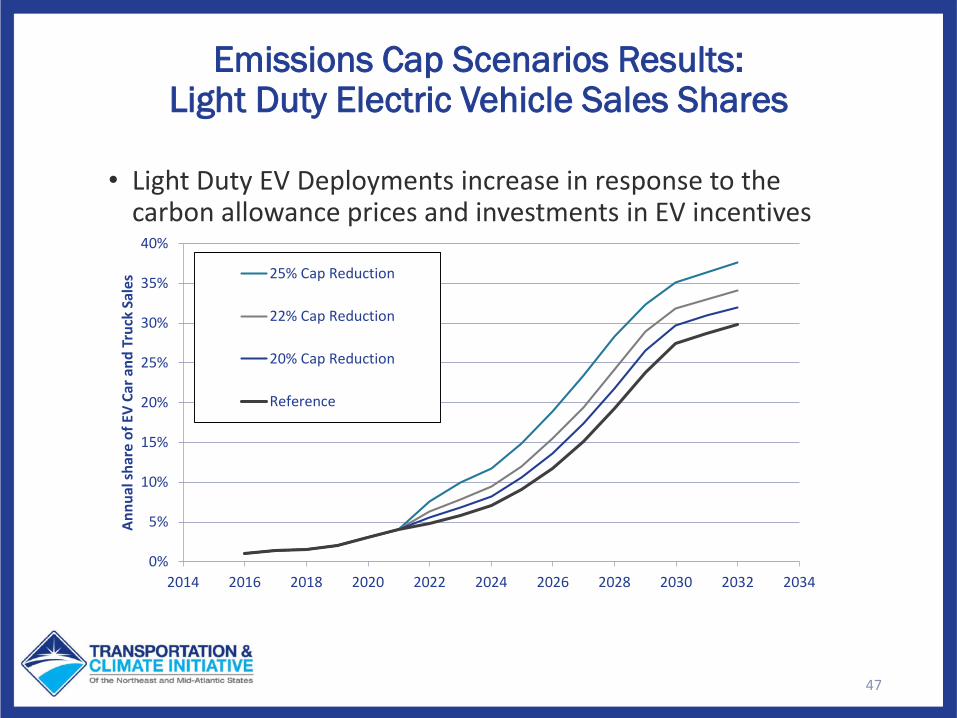
• Light Duty EV Deployments increase in response to the carbon allowance prices and investments in EV incentives
Emissions Cap Scenarios Results:Light Duty Electric Vehicle Sales Shares
0%
5%
10%
15%
20%
25%
30%
35%
40%
2014 2016 2018 2020 2022 2024 2026 2028 2030 2032 2034
Annu
al sh
are
of E
V Ca
r and
Tru
ck S
ales
25% Cap Reduction
22% Cap Reduction
20% Cap Reduction
Reference
48
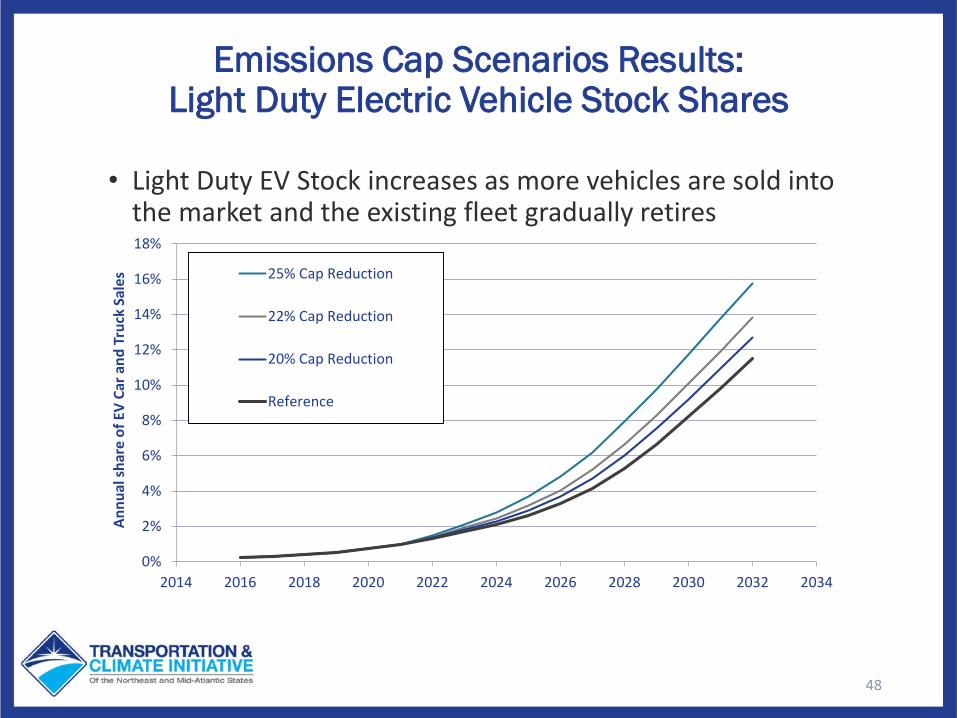
• Light Duty EV Stock increases as more vehicles are sold into the market and the existing fleet gradually retires
Emissions Cap Scenarios Results:Light Duty Electric Vehicle Stock Shares
0%
2%
4%
6%
8%
10%
12%
14%
16%
18%
2014 2016 2018 2020 2022 2024 2026 2028 2030 2032 2034
Annu
al sh
are
of E
V Ca
r and
Tru
ck S
ales
25% Cap Reduction
22% Cap Reduction
20% Cap Reduction
Reference
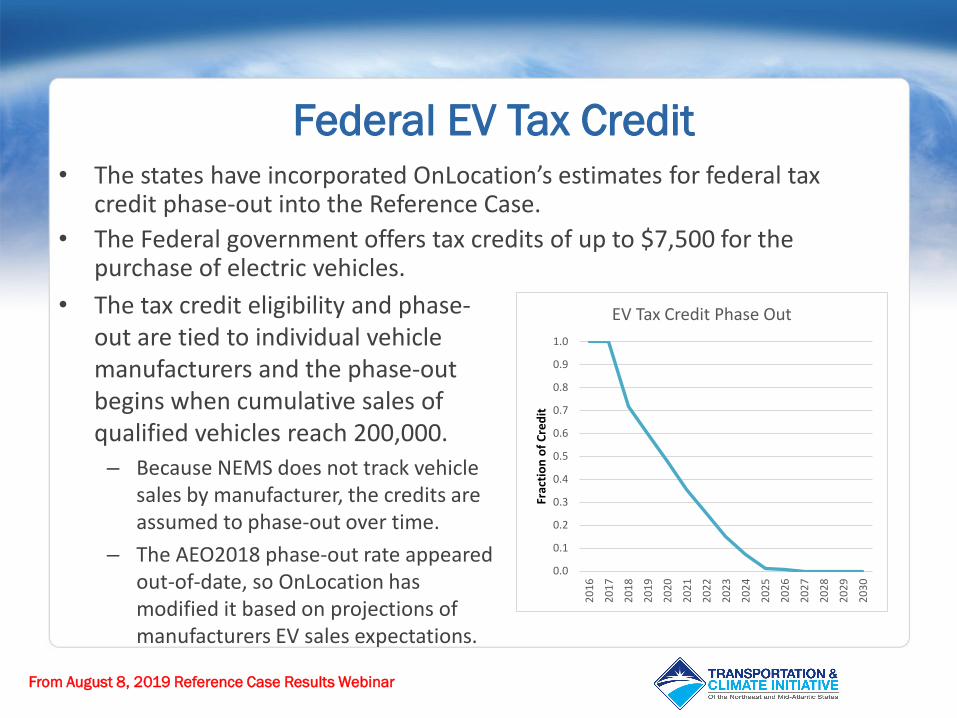
• The states have incorporated OnLocation’s estimates for federal tax credit phase-out into the Reference Case.
• The Federal government offers tax credits of up to $7,500 for the purchase of electric vehicles.
0.0
0.1
0.2
0.3
0.4
0.5
0.6
0.7
0.8
0.9
1.0
2016
2017
2018
2019
2020
2021
2022
2023
2024
2025
2026
2027
2028
2029
2030
Frac
tion
of C
redi
t
EV Tax Credit Phase Out• The tax credit eligibility and phase-out are tied to individual vehicle manufacturers and the phase-out begins when cumulative sales of qualified vehicles reach 200,000.
– Because NEMS does not track vehicle sales by manufacturer, the credits are assumed to phase-out over time.
– The AEO2018 phase-out rate appeared out-of-date, so OnLocation has modified it based on projections of manufacturers EV sales expectations.
Federal EV Tax Credit
From August 8, 2019 Reference Case Results Webinar