Embed Size (px)
Citation preview

Geographic Information Systems Conference and Exhibition “GIS ODYSSEY 2016”, 5th to 9th of September 2016, Perugia, ItalyConference proceedings
266
WEBGIS APPLICATION AS A TOOL FOR QUERYING WMSPARAMETRIZED LAYERS
Ivan Vučić, M.Sc.Institute of Oceanography and FisheriesSplit, Croatiae-mail:[email protected]
Damir Ivanković, M.Sc.Institute of Oceanography and FisheriesSplit, Croatiae-mail:[email protected]
Prof. dr. Vlado DadićInstitute of Oceanography and FisheriesSplit, Croatiae-mail:[email protected]
Abstract
Data retrieved from map server using OGC WMS service comes in a form of predefined georeferencedraster image(s). If dealing with large amount of spatial data this form of visualization can beproblematic. It gets hard to distinguish every little feature, even if they are styledusing differentattribute values. This was the problem with representing the data for project of monitoring ecosystemhealth and water quality on the Institute of Oceanography and Fisheries. We needed a way to makethose data available and styled in certain way, but still to be able to query it according to attributevalues. WebGIS application containing form in which user can choose value for some or allof the attributes and create parametrized WMS layer would be a solution to this problem.
This paper describes development of such webGIS applications using OpenLayers, GeoExt and ExtJSJavaScript framework. Combining spatial database, GeoServer map server and open source JavaScriptframeworks we have developed simple but powerful WMS parametrization tool.
Keywords: WMS parametrization, WebGIS, GeoServer, OpenLayers, GeoExt.
IntroductionIn 2011. group of scientist from the Laboratory for Benthos on Institute of Oceanography andFisheries decided to try a new method for monitoring ecosystem health and water quality. This non-destructive method called CARLIT (Cartography of littoral rocky-shore communities) is basedon a visual observation of the type and length of coast occupied by rocky-shore communitiesin the upper-sublittoral zone (NIKOLIC et al., 2013).It is ongoing project, and each year they collect big amount of spatial data that are stored insideIOR’s spatial database. To be able to use those data for planning next years monitoring sites and alsoto be able to reach it during the fields work those data were made available as OGC WMS service.WMS was chosen because data had to be styled in a certain way, according to their attribute values,which was done by the map server.Even thou this approach proves to be very useful, it was impossible to distinguish segments withcertain attribute value, because each WMS layer is a georeferenced raster that includes all of the dataavailable for that year.For that WMS request needs to be parameterized by those attribute values. This could be donethrough a form inside webGIS application were user can choose different values for differentattributes and in that way request WMS layer from map server that will include only those featuresthat are eligible.

Geographic Information Systems Conference and Exhibition “GIS ODYSSEY 2016”, 5th to 9th of September 2016, Perugia, ItalyConference proceedings
267
Materials and methods
DataDifferent parts of the coast that were monitored each year during the field workare divided intosegments. Each of those segment is described and defined by set of attributes and their valuesand usually is of different length. Length depends on how much of certain area can be described bysingle value of an attribute.Those sets of data are stored inside Oracle 10.2 database which , through it's Locator feature,provides significant capabilities typically required to support Internet and wireless service-basedapplications and partner-based GIS solutions.In this way we were able to define spatial component of our collected data along with it’sattributes as seen in Fig. 1.
Fig. 1. Spatial database table organization. Source: Oracle developer.
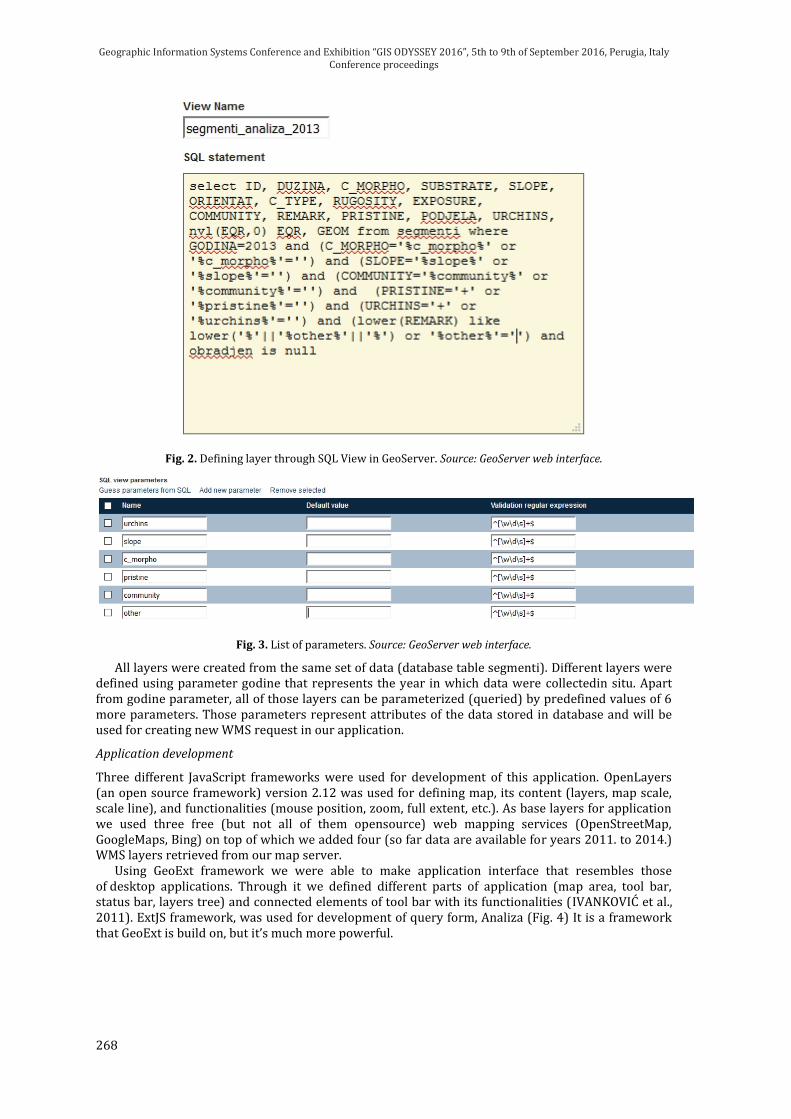
Layer definitionTo be able to use stored data within our web application, we needed a way to transform it into layersthat can be served by map server as WMS service. It is simple HTTP interface for requesting geo-registered map images. WMS request defines the geographic layer(s) and area of interest to beprocessed. The response to the request is one or more geo-registered map images (returned as JPEG,PNG, etc.) that can be displayed in a web application.We decided to use an open source map server called GeoServer. It is platform independent, stable,easily adjustable software solution developed using Java programing language which enables datafrom different sources (like shapefiles, different databases, other OGC compliant map servers, etc.)to be presented as different types of GIS layers.Through the GeoServer, by defining our Oracle database as data source, we created connectionwith it. Instead of using traditional way to access database data by configure layers against eithertables or database views, we used SQL View that allowed us executing a custom SQL query on eachrequest to the layer (Fig. 2). These queries were parameterized via string substitution (Fig. 3).Parameter values will be supplied in WMS requests created through a form inside our application.
Geographic Information Systems Conference and Exhibition “GIS ODYSSEY 2016”, 5th to 9th of September 2016, Perugia, ItalyConference proceedings
267
Materials and methods
DataDifferent parts of the coast that were monitored each year during the field workare divided intosegments. Each of those segment is described and defined by set of attributes and their valuesand usually is of different length. Length depends on how much of certain area can be described bysingle value of an attribute.Those sets of data are stored inside Oracle 10.2 database which , through it's Locator feature,provides significant capabilities typically required to support Internet and wireless service-basedapplications and partner-based GIS solutions.In this way we were able to define spatial component of our collected data along with it’sattributes as seen in Fig. 1.
Fig. 1. Spatial database table organization. Source: Oracle developer.
Layer definitionTo be able to use stored data within our web application, we needed a way to transform it into layersthat can be served by map server as WMS service. It is simple HTTP interface for requesting geo-registered map images. WMS request defines the geographic layer(s) and area of interest to beprocessed. The response to the request is one or more geo-registered map images (returned as JPEG,PNG, etc.) that can be displayed in a web application.We decided to use an open source map server called GeoServer. It is platform independent, stable,easily adjustable software solution developed using Java programing language which enables datafrom different sources (like shapefiles, different databases, other OGC compliant map servers, etc.)to be presented as different types of GIS layers.Through the GeoServer, by defining our Oracle database as data source, we created connectionwith it. Instead of using traditional way to access database data by configure layers against eithertables or database views, we used SQL View that allowed us executing a custom SQL query on eachrequest to the layer (Fig. 2). These queries were parameterized via string substitution (Fig. 3).Parameter values will be supplied in WMS requests created through a form inside our application.
Geographic Information Systems Conference and Exhibition “GIS ODYSSEY 2016”, 5th to 9th of September 2016, Perugia, ItalyConference proceedings
268
Fig. 2. Defining layer through SQL View in GeoServer. Source: GeoServer web interface.
Fig. 3. List of parameters. Source: GeoServer web interface.All layers were created from the same set of data (database table segmenti). Different layers weredefined using parameter godine that represents the year in which data were collectedin situ. Apartfrom godine parameter, all of those layers can be parameterized (queried) by predefined values of 6more parameters. Those parameters represent attributes of the data stored in database and will beused for creating new WMS request in our application.Application developmentThree different JavaScript frameworks were used for development of this application. OpenLayers(an open source framework) version 2.12 was used for defining map, its content (layers, map scale,scale line), and functionalities (mouse position, zoom, full extent, etc.). As base layers for applicationwe used three free (but not all of them opensource) web mapping services (OpenStreetMap,GoogleMaps, Bing) on top of which we added four (so far data are available for years 2011. to 2014.)WMS layers retrieved from our map server.Using GeoExt framework we were able to make application interface that resembles thoseof desktop applications. Through it we defined different parts of application (map area, tool bar,status bar, layers tree) and connected elements of tool bar with its functionalities (IVANKOVIĆ et al.,2011). ExtJS framework, was used for development of query form, Analiza (Fig. 4) It is a frameworkthat GeoExt is build on, but it’s much more powerful.
Geographic Information Systems Conference and Exhibition “GIS ODYSSEY 2016”, 5th to 9th of September 2016, Perugia, ItalyConference proceedings
269
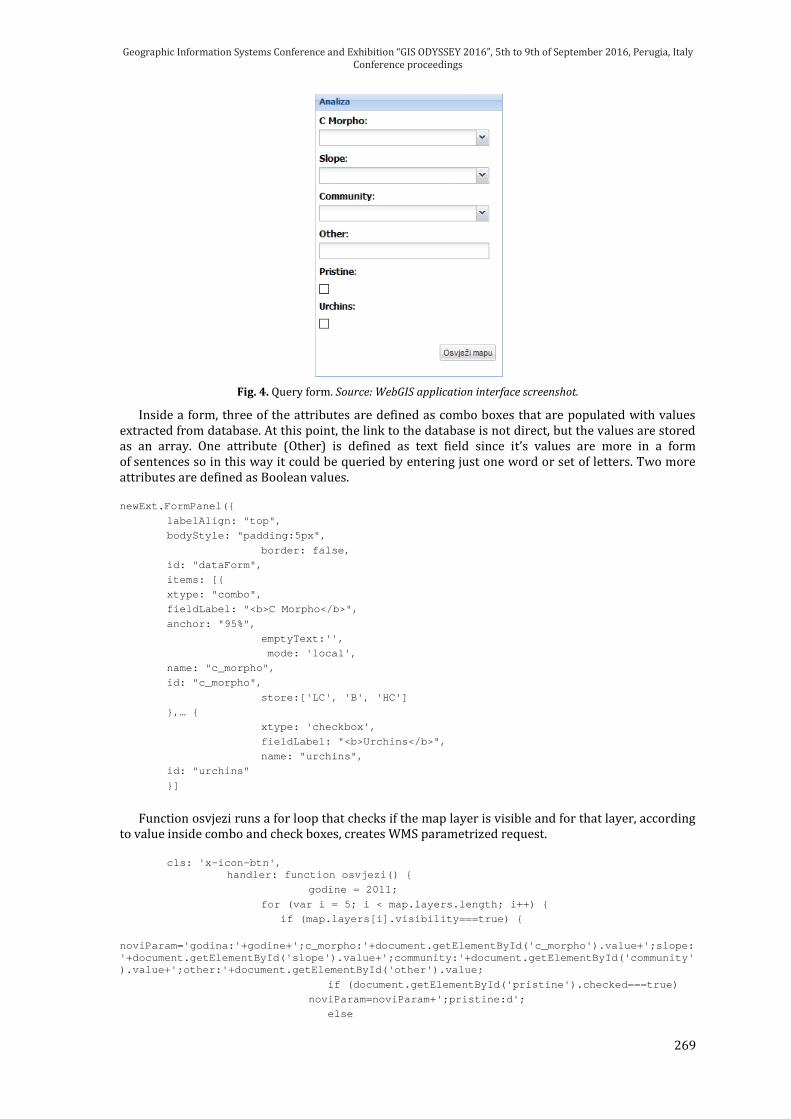
Fig. 4. Query form. Source: WebGIS application interface screenshot.Inside a form, three of the attributes are defined as combo boxes that are populated with valuesextracted from database. At this point, the link to the database is not direct, but the values are storedas an array. One attribute (Other) is defined as text field since it’s values are more in a formof sentences so in this way it could be queried by entering just one word or set of letters. Two moreattributes are defined as Boolean values.newExt.FormPanel({
labelAlign: "top",
bodyStyle: "padding:5px",
border: false,
id: "dataForm",
items: [{
xtype: "combo",
fieldLabel: "<b>C Morpho</b>",
anchor: "95%",
emptyText:'',
mode: 'local',
name: "c_morpho",
id: "c_morpho",
store:['LC', 'B', 'HC']
},… {xtype: 'checkbox',
fieldLabel: "<b>Urchins</b>",
name: "urchins",
id: "urchins"
}]Function osvjezi runs a for loop that checks if the map layer is visible and for that layer, accordingto value inside combo and check boxes, creates WMS parametrized request.cls: 'x-icon-btn',
handler: function osvjezi() {
godine = 2011;
for (var i = 5; i < map.layers.length; i++) {
if (map.layers[i].visibility===true) {
noviParam='godina:'+godine+';c_morpho:'+document.getElementById('c_morpho').value+';slope:'+document.getElementById('slope').value+';community:'+document.getElementById('community').value+';other:'+document.getElementById('other').value;
if (document.getElementById('pristine').checked===true)
noviParam=noviParam+';pristine:d';
else
Geographic Information Systems Conference and Exhibition “GIS ODYSSEY 2016”, 5th to 9th of September 2016, Perugia, ItalyConference proceedings
269
Fig. 4. Query form. Source: WebGIS application interface screenshot.Inside a form, three of the attributes are defined as combo boxes that are populated with valuesextracted from database. At this point, the link to the database is not direct, but the values are storedas an array. One attribute (Other) is defined as text field since it’s values are more in a formof sentences so in this way it could be queried by entering just one word or set of letters. Two moreattributes are defined as Boolean values.newExt.FormPanel({
labelAlign: "top",
bodyStyle: "padding:5px",
border: false,
id: "dataForm",
items: [{
xtype: "combo",
fieldLabel: "<b>C Morpho</b>",
anchor: "95%",
emptyText:'',
mode: 'local',
name: "c_morpho",
id: "c_morpho",
store:['LC', 'B', 'HC']
},… {xtype: 'checkbox',
fieldLabel: "<b>Urchins</b>",
name: "urchins",
id: "urchins"
}]Function osvjezi runs a for loop that checks if the map layer is visible and for that layer, accordingto value inside combo and check boxes, creates WMS parametrized request.cls: 'x-icon-btn',
handler: function osvjezi() {
godine = 2011;
for (var i = 5; i < map.layers.length; i++) {
if (map.layers[i].visibility===true) {
noviParam='godina:'+godine+';c_morpho:'+document.getElementById('c_morpho').value+';slope:'+document.getElementById('slope').value+';community:'+document.getElementById('community').value+';other:'+document.getElementById('other').value;
if (document.getElementById('pristine').checked===true)
noviParam=noviParam+';pristine:d';
else
Geographic Information Systems Conference and Exhibition “GIS ODYSSEY 2016”, 5th to 9th of September 2016, Perugia, ItalyConference proceedings
270
noviParam=noviParam+';pristine:x';
if (document.getElementById('urchins').checked===true)
noviParam=noviParam+';urchins:d';
else
noviParam=noviParam+';urchins:x';
//alert(noviParam);
map.layers[i].mergeNewParams({viewparams: noviParam});
map.layers[i].redraw(true);
}
godine++;
}
}For each visible layer there would be a new WMS request with same parameters values (Fig. 5)
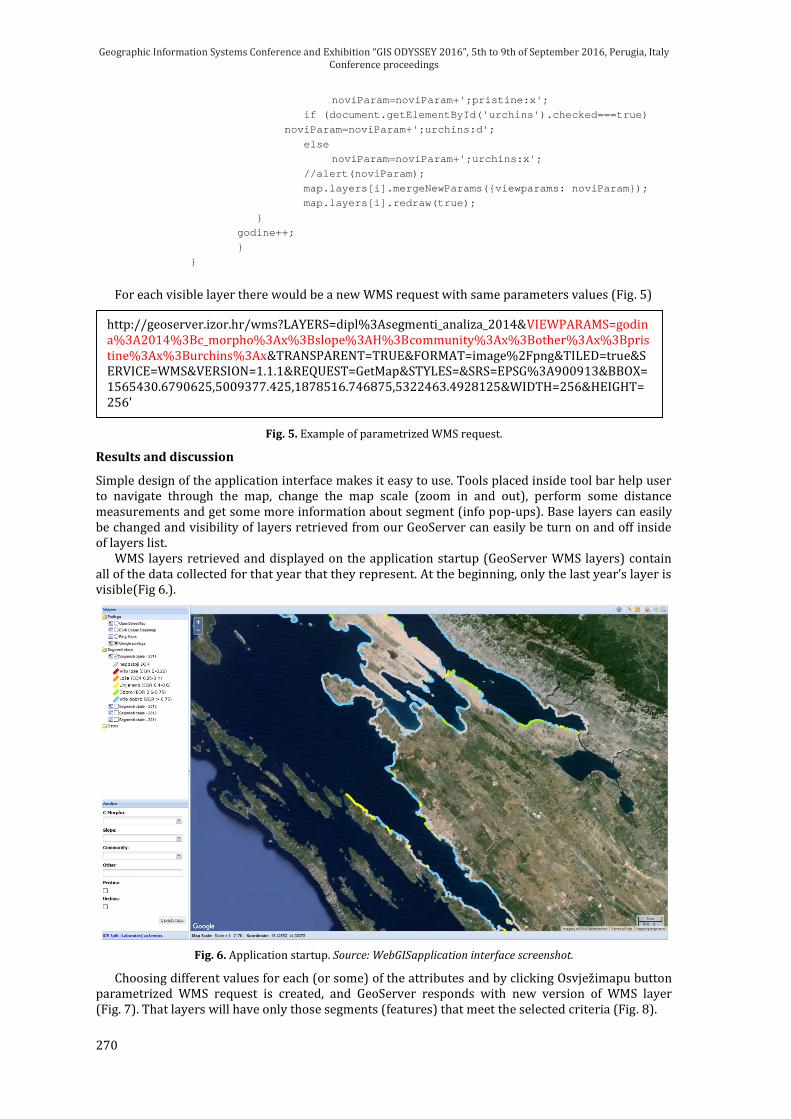
Fig. 5. Example of parametrized WMS request.Results and discussionSimple design of the application interface makes it easy to use. Tools placed inside tool bar help userto navigate through the map, change the map scale (zoom in and out), perform some distancemeasurements and get some more information about segment (info pop-ups). Base layers can easilybe changed and visibility of layers retrieved from our GeoServer can easily be turn on and off insideof layers list.WMS layers retrieved and displayed on the application startup (GeoServer WMS layers) containall of the data collected for that year that they represent. At the beginning, only the last year’s layer isvisible(Fig 6.).
Fig. 6. Application startup. Source: WebGISapplication interface screenshot.Choosing different values for each (or some) of the attributes and by clicking Osvježimapu buttonparametrized WMS request is created, and GeoServer responds with new version of WMS layer(Fig. 7). That layers will have only those segments (features) that meet the selected criteria (Fig. 8).
http://geoserver.izor.hr/wms?LAYERS=dipl%3Asegmenti_analiza_2014&VIEWPARAMS=godina%3A2014%3Bc_morpho%3Ax%3Bslope%3AH%3Bcommunity%3Ax%3Bother%3Ax%3Bpristine%3Ax%3Burchins%3Ax&TRANSPARENT=TRUE&FORMAT=image%2Fpng&TILED=true&SERVICE=WMS&VERSION=1.1.1&REQUEST=GetMap&STYLES=&SRS=EPSG%3A900913&BBOX=1565430.6790625,5009377.425,1878516.746875,5322463.4928125&WIDTH=256&HEIGHT=256'
Geographic Information Systems Conference and Exhibition “GIS ODYSSEY 2016”, 5th to 9th of September 2016, Perugia, ItalyConference proceedings
270
noviParam=noviParam+';pristine:x';
if (document.getElementById('urchins').checked===true)
noviParam=noviParam+';urchins:d';
else
noviParam=noviParam+';urchins:x';
//alert(noviParam);
map.layers[i].mergeNewParams({viewparams: noviParam});
map.layers[i].redraw(true);
}
godine++;
}
}For each visible layer there would be a new WMS request with same parameters values (Fig. 5)
Fig. 5. Example of parametrized WMS request.Results and discussionSimple design of the application interface makes it easy to use. Tools placed inside tool bar help userto navigate through the map, change the map scale (zoom in and out), perform some distancemeasurements and get some more information about segment (info pop-ups). Base layers can easilybe changed and visibility of layers retrieved from our GeoServer can easily be turn on and off insideof layers list.WMS layers retrieved and displayed on the application startup (GeoServer WMS layers) containall of the data collected for that year that they represent. At the beginning, only the last year’s layer isvisible(Fig 6.).
Fig. 6. Application startup. Source: WebGISapplication interface screenshot.Choosing different values for each (or some) of the attributes and by clicking Osvježimapu buttonparametrized WMS request is created, and GeoServer responds with new version of WMS layer(Fig. 7). That layers will have only those segments (features) that meet the selected criteria (Fig. 8).
http://geoserver.izor.hr/wms?LAYERS=dipl%3Asegmenti_analiza_2014&VIEWPARAMS=godina%3A2014%3Bc_morpho%3Ax%3Bslope%3AH%3Bcommunity%3Ax%3Bother%3Ax%3Bpristine%3Ax%3Burchins%3Ax&TRANSPARENT=TRUE&FORMAT=image%2Fpng&TILED=true&SERVICE=WMS&VERSION=1.1.1&REQUEST=GetMap&STYLES=&SRS=EPSG%3A900913&BBOX=1565430.6790625,5009377.425,1878516.746875,5322463.4928125&WIDTH=256&HEIGHT=256'

Geographic Information Systems Conference and Exhibition “GIS ODYSSEY 2016”, 5th to 9th of September 2016, Perugia, ItalyConference proceedings
271
Fig. 7. WMS Layer query. Source: Inkscape.
Fig. 8. Parametrized WMS layer. Source: WebGIS application interface screenshot.By leaving attribute values empty, and sending new request, the map server will reply with WMSlayer containing all of the features (segments).ConclusionConcerning the huge amount of data collected each year during the project of monitoring ecosystemhealth and water quality using CARLIT method, styling those data by certain attribute values,and making them available using the WMS service proved to be both good and poorsolutions. Eventhough WMS layers (georeferenced raster) guaranty that layers style would not change, and would beavailable even insitu, it always included all of the data collected inside the year that they refer to. Thismade it hard to distinguish specific segments one from another.By developing a webGIS application with a query formwe solved this problem. Inside a queryform, user can easily pick one of the values for each or some of the attributes and get new versionof the same layer that was retrieved from the map server. The new version of the layer will have onlythose segments (features) that meet the new criteria.It turned out that in this way scientists can easily validate attribute values for each segment. Thiswasn’t one of the objectives of the development of this application but it gave us ideas for futureimprovements. So next step would be to enable user to change data directly inside of the application.This would mean that a direct connection to the database is needed.

Geographic Information Systems Conference and Exhibition “GIS ODYSSEY 2016”, 5th to 9th of September 2016, Perugia, ItalyConference proceedings
272
One more way to improve this application is to add an option of creating different statistical viewaccording to the set criteria.ReferencesNIKOLIĆ V., ŽULJEVIĆ A., MANGIALAJO L., ANTOLIĆ B., KUŠPILIĆ G., BALLESTEROS E. 2013.
Cartography of littoral rocky-shore communities (CARLIT) as a tool for ecological quality assessmentof coastal waters in the Eastern Adriatic Sea. Ecologica lIndicators, vol. 34, pp. 87–93.IVANKOVIĆ D., VUČIĆ I. 2011. Web presentation of GIS objects on Institute of Oceanographyand Fisheries using opensource/free tools (OpenLayers&GeoServer). The Future with GIS, pp. 197-204.