Embed Size (px)
DESCRIPTION
WEBFRAM 5: A risk assessment module for soil invertebrates. Geoff Frampton University of Southampton (UK) Joerg Roembke ECT Oekotoxikologie (DE) Paul van den Brink Alterra Green World Research (NL) Janeck Scott-Fordsmand NERI (DK). Funded by. WEBFRAM-5 : Principal aim. - PowerPoint PPT Presentation
Citation preview

1
WEBFRAM 5: A risk assessment module for soil invertebrates
Geoff Frampton
University of Southampton (UK)
Joerg Roembke
ECT Oekotoxikologie (DE)
Paul van den Brink
Alterra Green World Research (NL)
Janeck Scott-Fordsmand
NERI (DK) Funded by

2
WEBFRAM-5 : Principal aim
To investigate whether the pesticide risk assessment for
below-ground invertebrates could be improved by explicitly
incorporating variability and uncertainty into estimates of risk

3
Testing
Standard higher-tier
test ?
Earthworms
Collembola
Enchytraeidae
routine
optional
optional
yes
no
no
Soil invertebrates pesticide risk assessment
( 91 / 414 / EEC )

4
WEBFRAM 5 : Background

5
Deterministic risk assessment scheme
Risk: based ontoxicity
exposure× safety factor
Lower tier : acute
Lower tier : chronic
Higher tier : field
Risk measure Safety factor
TER
TER
effects none
10
5
Earthworms example

6
Appropriate as a worst-case screening tool
Simple to apply
Harmonised calculations and interpretation
Applicable to small data sets
Safety factor represents uncertainty
Risk: based ontoxicity
exposure× safety factor
Deterministic risk assessment scheme
7
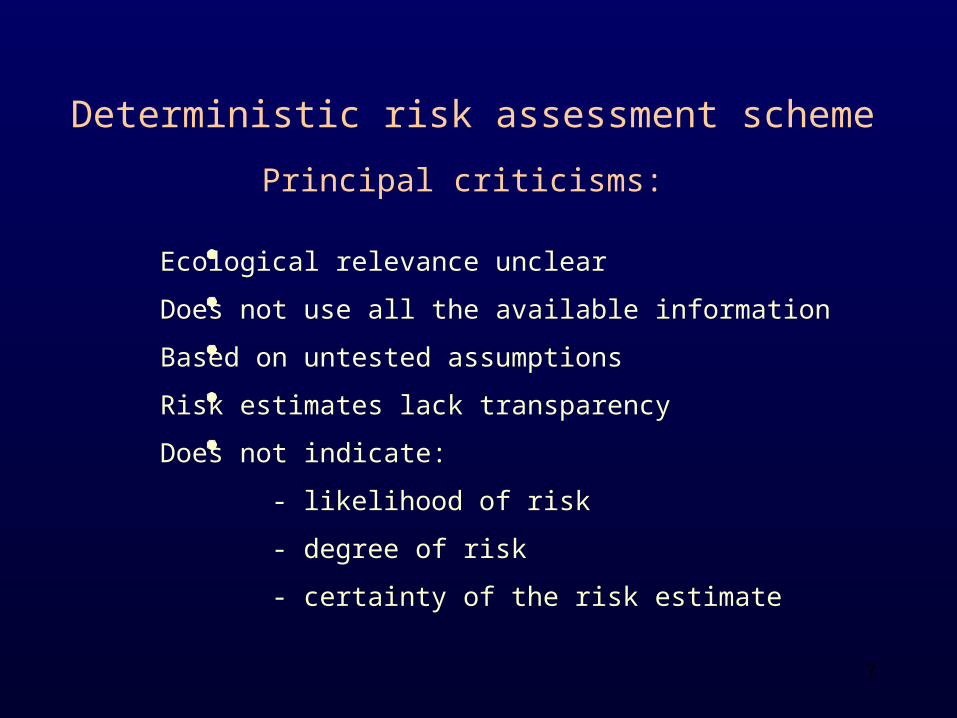
Deterministic risk assessment scheme
Ecological relevance unclear
Does not use all the available information
Based on untested assumptions
Risk estimates lack transparency
Does not indicate:
- likelihood of risk
- degree of risk
- certainty of the risk estimate
Principal criticisms:

8
Potential benefits of incorporating uncertainty in the risk assessment
Clarify how conservative the risk estimate is
Make better use of available information
Improve realism (i.e. ecological relevance)
Indicate certainty, likelihood, degree of risk
Improve transparency of risk estimation
Validate or refine assumptions
Improve efficiency (reduce unnecessary testing)

9
Requires more data than deterministic approach
Statistical approaches more complex
Could introduce more assumptions
May not clarify risk if not communicated well
Potential criticisms of incorporating uncertainty in the risk assessment

10
1. Acquire data (key step!)
2. Identify variables with adequately-supported distributions
3. Use data distributions to describe variability
4. Incorporate descriptions of variability in alternative version(s) of the risk assessment
Risk assessment version(s)that include uncertainty
where appropriate
Deterministic riskassessment with
supporting data andworked examples
output
WEBFRAM 5 : Objectives

11
WEBFRAM 5 : Database summary
12
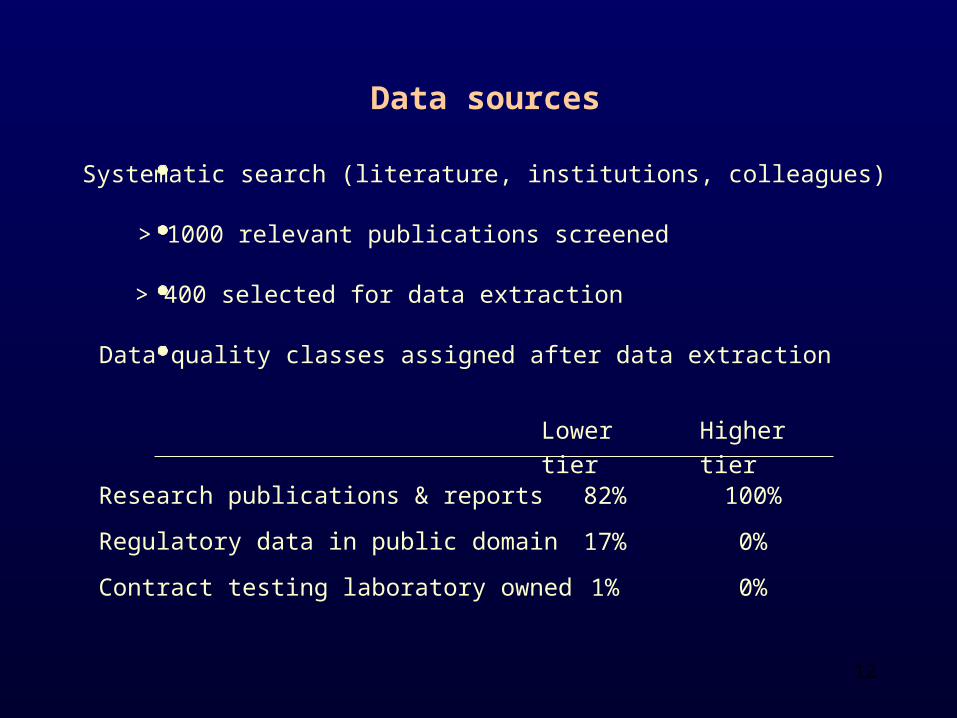
Data sources
Research publications & reports
Regulatory data in public domain
Contract testing laboratory owned
82%
17%
1%
100%
0%
0%
Systematic search (literature, institutions, colleagues)
> 1000 relevant publications screened
> 400 selected for data extraction
Data quality classes assigned after data extraction
Lower tier Higher tier

13
Below-ground invertebrates database
Active substances (a. s.)
Species / groups
Effects data sets
Lower tier(laboratory)
Higher tier(TME / field)
257
70
1282
75
72
1029
a. s. with data for both tiers
a. s. with only one data set
45 (16%)
108 (38%)

14
CarbendazimCopper
BenomylDimethoate
PentachlorophenolParathion
CarbofuranDiazinonLindaneAtrazine
ChloroacetamideLambda-cyhalothrin
ImidaclopridChlorpyrifos
CarbarylHalofenozide
DNOCBendiocarb
MalathionThiophanate-methyl
PhorateNumber of data sets
0 50 100 150 200 250 300 350
Lower tier
Higher tier
Soil invertebrate effects data : pesticides with > 20 data sets

15
Number of data sets
Diflubenzuron
Cypermethrin
Methylacetophos
e
Dicresyl
Propxur
4-nitrophenol
Parathion-methyl
Chlordane
Isofenphos
Disulfoton
DDT
Phenmedipham
Imazalil
Flusilazole
Cyfluthrin
Chlorthal
Boric acid
Amidosulfuron0 2 4 6 8 10 12 14 16 18
Lower tier
Higher tier
Soil invertebrate effects data : pesticides with 9 - 20 data sets

16
Lumbricidae
Collembola
Enchytraeidae
Acari
Coleoptera
Nematoda
Isopoda
Formicidae
Diptera
Araneae
0 200 400 600 800 1000 1200 1400
Distribution of pesticide effects data among soil invertebrate groups
Number of data sets
Lower tier
Higher tier

17
Collembola species data : lower tier
Number of data sets
0 10 20 30 40 50
Folsomia candidaFolsomia fimetariaOnychiurus folsomiIsotoma viridisOnychiurus armatusProisotoma minutaOrchesella cinctaSinella communisCollembolans groupedIsotomidaeLepidocyrtus sp.Onychiurus apuanicusSinella caeca

18
0 5 10 15 20 25 30 35
Enchytraeidae species data : lower tier
Number of data sets
Enchytraeus sp. indet.
Enchytraeus coronatus
Enchytraeus albidus
Cognettia sphagnetorum
Friderica ratzeli
Enchytraeus crypticus
Enchytraeus buchholzi

19
Lumbricidae species data : lower tier
Number of data sets
Eisenia fetida
Earthworms grouped
Eisenia andrei
Lumbricus terrestris
Aporrectodea caliginosa
Lumbricus rubellus
Aporrectodea tuberculata
Allobophora chlorotica
Dendrobaena rubida
Apporectodea longa
Aporrectodea rosea
Octolasium lacteum
Eisenia veneta
0 100 200 300 400 500

20
Data reliability checks
Following Klimisch et al. (1997) in Regulatory Toxicology & Pharmacology
(1) Reliable without restriction
(2) Reliable with restrictions
(4) Not assignable
(3) Not reliable
Number %
114 9
586 45
241 19
351 27
54 %
46 %
1292 100Total

21
EC50
LC50
0.2
0.4
0.6
0.8
1.0
10 100 1000 10000
EC50 and LC50 (mg/kg Cu)
Po
ten
tia
lly A
ffe
cte
d F
ract
ion
Reliable without restriction
Reliable with restrictions
Not reliableNot assignable
0.0
Cumulative sensitivity distributions for Cu based on data of varying quality

22
WEBFRAM 5 : Risk assessment approach

23
Tiered risk assessment approach
Earlier steps are more strict / conservative than later steps
Later steps are more realistic than earlier steps
Earlier steps usually require less effort than later steps
The same type of concentration applies to all steps
Jumping to later steps is usually acceptable

24
Tiered risk assessment approach
Exposure model

25
Tiered risk assessment approach (Boesten, J.J.T.I.)

26
Fate model Ploughing No ploughing
Step 1 No loss 8.3 8.3
Step 2 Loss due to transformation and ploughing only, 5 oC
0.6 0.9
Step 3 PEARL calculations for a realistic worst-case scenario
0.4 0.5
Maximum carbendazim content in top 5cm soil (mg a.i. / kg)
20 year period
Annual carbendazim application 250 g.a.i. / ha on 15 May
Annual ploughing to 15cm on 1 November

27
Tiered risk assessment approach
Tier 1 Laboratory
deterministic
- a reasonable worst case estimate (present situation)
Tier 2 Laboratory
probabilistic
- a point estimate based on a distribution that indicates probability of the sensitivity
Tier 3 (Semi-)Field - a safe concentration based on (semi-)field experiments
Effects model

28
Tiered risk assessment approach
Effects model (top 5 cm soil) – earthworms example
Tier 1 LC50 acuteNOEC chronic
OECD 207 guidance &ISO 11268-2(present situation)
Tier 2 HC5 From lower-tier species sensitivity distributions to incorporate inter-species variation
Tier 3 NOEC field From higher-tier semi-field or field experiments

29
earthworms
OECD 207
Assumptions:
(a) even distribution
(b) top 5cm soil
(c) bulk density 1200 kg m
(d) no loss
-3
Lower limit TER acute trigger
(safety factor) = 10
Example: carbendazim
Tier 1 (deterministic, acute)
Tiered risk assessment approach

30
earthworms
OECD 207
Assumptions:
(a) even distribution
(b) top 5cm soil
(c) bulk density 1200 kg m
(d) no loss
-3
Lower limit TER acute trigger
(safety factor) = 10
Lowest LC50 acute = 3.9 mg a.i. / kg (EU
SEEM project 2002)
Typical application rate = 250 g a.i. / ha,
equivalent to 0.418 mg a.i. / kg
Example: carbendazim
Tier 1 (deterministic, acute)
Tiered risk assessment approach

31
Example: carbendazim
Tier 1 (deterministic, acute)
Tiered risk assessment approach earthworms
OECD 207
Lowest LC50 acute = 3.9 mg a.i. / kg (EU
SEEM project 2002)
Typical application rate = 250 g a.i. / ha,
equivalent to 0.418 mg a.i. / kg
TER < 10RISK
indicated
Assumptions:
(a) even distribution
(b) top 5cm soil
(c) bulk density 1200 kg m
(d) no loss
-3
Lower limit TER acute trigger
(safety factor) = 10

32
earthworms
OECD 207
Requirement for chronic (reproduction) test if:
EU Terrestrial Guidance Document
SANCO / 10329 / 2002
• More than 6 applications (not fulfilled here)
• DT90 field > 90 days (probably not fulfilled)
• TER acute < 10 (fulfilled)
Tiered risk assessment approach

33
Example: carbendazim
Tier 1 (deterministic, chronic)
earthworms
OECD 207
Tiered risk assessment approach
PEC chronic:
Cumulative concentration
In top 5cm over 20 years,
assuming no loss
Lower limit TER chronic trigger
(safety factor) = 5

34
Example: carbendazim
Tier 1 (deterministic, chronic)
earthworms
OECD 207
Tiered risk assessment approach
PEC chronic:
Cumulative concentration
In top 5cm over 20 years,
assuming no loss
Lower limit TER chronic trigger
(safety factor) = 5
Lowest NOEC chronic = 0.6 mg a.i. / kg
(van Gestel 1992)
PEC chronic = 8.36 mg a.i. / kg

35
Example: carbendazim
Tier 1 (deterministic, chronic)
earthworms
OECD 207
Tiered risk assessment approach
PEC chronic:
Cumulative concentration
In top 5cm over 20 years,
assuming no loss
Lower limit TER chronic trigger
(safety factor) = 5
Lowest NOEC chronic = 0.6 mg a.i. / kg
(van Gestel 1992)
PEC chronic = 8.36 mg a.i. / kg
TER < 5RISK
indicated

36
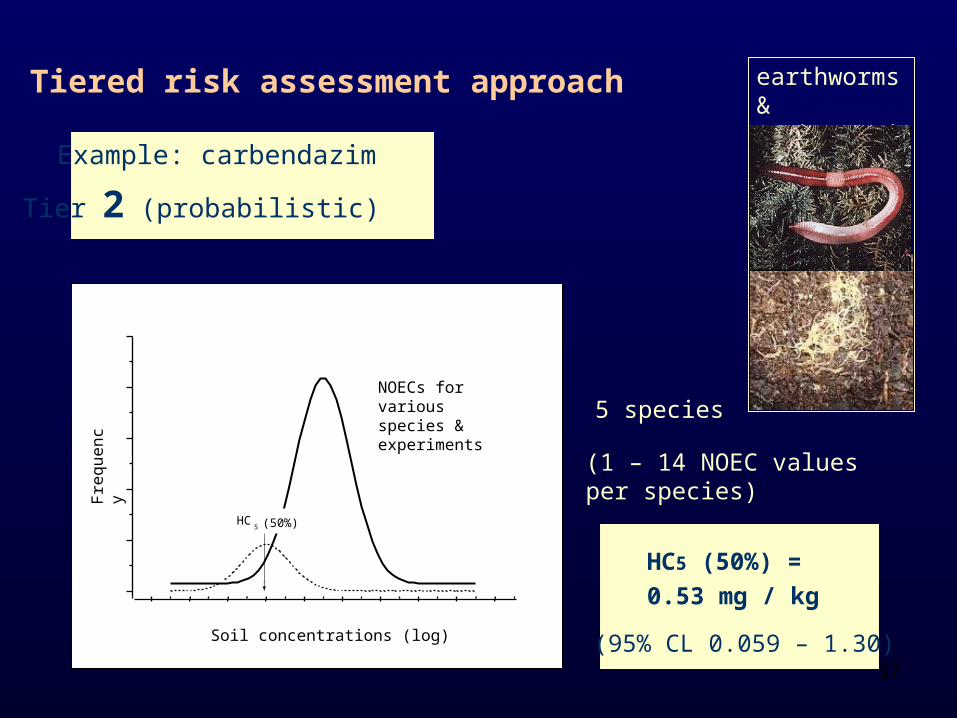
earthworms &enchytraeids
Example: carbendazim
Tier 2 (probabilistic)
An effect estimate based on the
median HC5, in this example
derived from an array of
individual toxicity (NOEC) data
for earthworms and enchytraeids
Tiered risk assessment approach
37
HC5 (50%)
Fre
qu
en
cy
Soil concentrations (log)
NOECs forvariousspecies &experiments
5 species
(1 – 14 NOEC valuesper species)
HC5 (50%) =
0.53 mg / kg
(95% CL 0.059 – 1.30)
earthworms &enchytraeids
Example: carbendazim
Tier 2 (probabilistic)
Tiered risk assessment approach

38
earthworms &enchytraeids
Example: carbendazim
Tier 2 (probabilistic)
Tiered risk assessment approach
5 species
(1 – 14 NOEC valuesper species)
HC5 (50%) =
0.53 mg / kg
(95% CL 0.059 – 1.30)
Lowest PEC from step 2 of exposure model = 0.6 mg / kg
TER refined = 0.53 / 0.6 = 0.88

39
Lowest PEC from step 2 of exposure model = 0.6 mg / kg
earthworms &enchytraeids
Example: carbendazim
Tier 2 (probabilistic)
Tiered risk assessment approach
5 species
(1 – 14 NOEC valuesper species)
HC5 (50%) =
0.53 mg / kg
(95% CL 0.059 – 1.30)
TER refined = 0.53 / 0.6 = 0.88
TER < 5RISK
indicated
Safety factor ? Assume = 5 (conservative, from Tier 1)

40
multiplespecies
Example: carbendazim
Tier 3 (semi-field / field)
Instead, the effect estimate (NOEC field) may be determined from
TME and field experiments that simulate or represent realistic
agroecological conditions
Tiered risk assessment approach
Higher-tier studies did not yield data suitable for
constructing distributions of sensitivities
An HC5 type approach therefore could not be applied to
the higher-tier data to estimate risk

41
Higher-tier effects classes
(based on Brock et al. (2000) Alterra Report 88)
Class 1
Class 2
Class 3
No effect demonstrable
Slight effect, transient
Slight effect, long term;
Pronounced effect, transient or long term

42
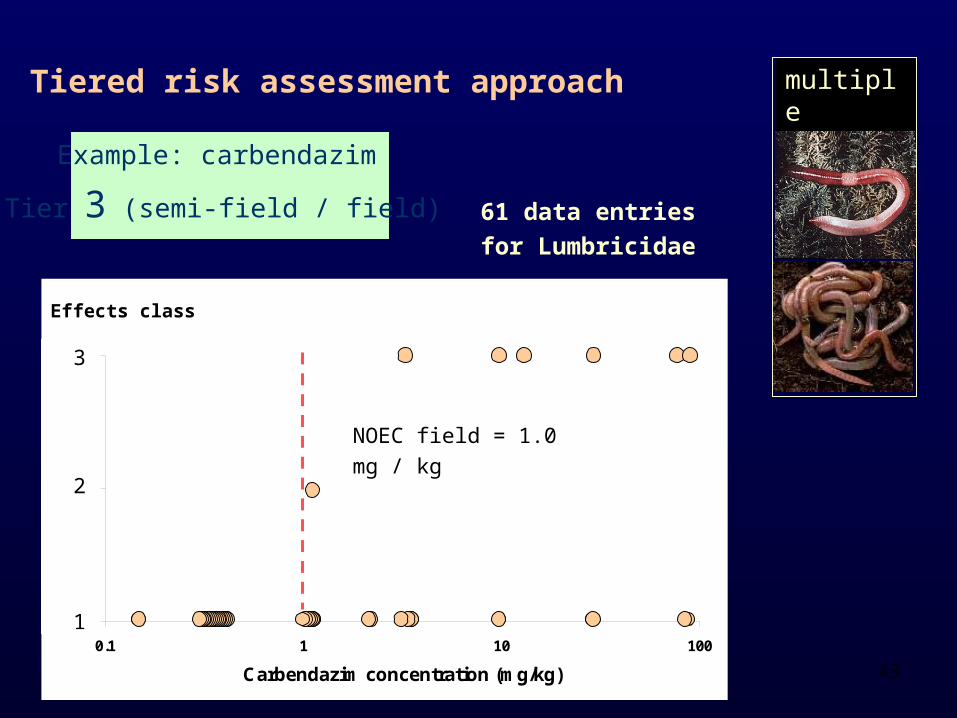
The effect estimate (NOEC field) is determined from
TME and field experiments that simulate or represent
realistic agroecological conditions
Lumbricidae
1
2
3
0.1 1 10 100
Carbendazim concentration (mg/kg)
Eff
ect
Cla
ss
1
2
3
Effects class
multiplespecies
Example: carbendazim
Tier 3 (semi-field / field)
Tiered risk assessment approach
61 data entries for
Lumbricidae
43
The effect estimate (NOEC field) is determined from
TME and field experiments that simulate or represent
realistic agroecological conditions
Lumbricidae
1
2
3
0.1 1 10 100
Carbendazim concentration (mg/kg)
Eff
ect
Cla
ss
1
2
3
Effects class
multiplespecies
Example: carbendazim
Tier 3 (semi-field / field)
Tiered risk assessment approach
NOEC field = 1.0 mg / kg
61 data entries for
Lumbricidae

44
The effect estimate (NOEC field) is determined from
TME and field experiments that simulate or represent
realistic agroecological conditions
Lumbricidae
1
2
3
0.1 1 10 100
Carbendazim concentration (mg/kg)
Eff
ect
Cla
ss
1
2
3
Effects class
multiplespecies
Example: carbendazim
Tier 3 (semi-field / field)
Tiered risk assessment approach
NOEC field = 1.0 mg / kgStep 2 PECs
61 data entries for
Lumbricidae

45
The effect estimate (NOEC field) is determined from
TME and field experiments that simulate or represent
realistic agroecological conditions
Lumbricidae
1
2
3
0.1 1 10 100
Carbendazim concentration (mg/kg)
Eff
ect
Cla
ss
1
2
3
Effects class
multiplespecies
Example: carbendazim
Tier 3 (semi-field / field)
Tiered risk assessment approach
NOEC field = 1.0 mg / kg
Step 3 PECs
Step 2 PECs
NOEC > PEC
NO RISK
61 data entries for
Lumbricidae

46
Project outputs
An internet-based risk assessment tool that would enable stakeholders to input their own data or use default examples to explore the impact on risk estimates of incorporating uncertainty, using:
a species sensitivity distribution model to calculate HC5 (or HCx) values for lower-tier data
a tiered exposure model
an interface to enable exposure and effects estimates to be combined and plotted (where appropriate) to indicate probability and certainty of risk estimates
online guidance and links to other relevant risk assessment resources

47
Purpose of the internet resource
Optimise opportunities for interested parties to explore alternative ways of estimating risk
Assist decision making at each risk assessment tier
Raise awareness of data availability issues and limitations
Provide feedback
Could be used as an educational and training resource

48
Conclusions
Opportunities to explicitly incorporate uncertainty in the risk assessment are limited, even for standard testspecies, due to a lack of appropriate empirical data
However, the feasibility of incorporating uncertainty can beillustrated for components of the risk assessment schemewhere data shortage is least problematic
Further development of the database is imperative, to enableadvances in these research areas
Data from the independent literature is biased stronglytowards standard test species, meaning that few data areavailable to support extrapolation to non-standard species