Embed Size (px)
Citation preview

Webcenter Application Performance
Tuning guide
Vinay Kumar 18-03-2014
Abstract This paper describe generic tuning guideline for webcenter portal , Webcenter content, JRockit, Database
and Weblogic server

Table of Contents
Introduction ............................................................................................ 1
Part 1: Tuning the Database ................................................................... 2
Part 2: Tuning the JVM ( JRockit ) ............................................................ 4
Part 3: Tuning WebLogic Server (WLS) .................................................... 5
Part 4: Tuning Webcenter Servers ........................................................... 7
Tuning Webcenter Content (UCM) ....................................................... 7
Tuning Webcenter Portal (Spaces) ....................................................... 9
Appendix ............................................................................................... 10
Introduction

This document describes basic performance concepts, how to measure performance, and designing applications for performance and scalability .This will be useful for application built on Fusion Middleware i.e. Webcenter Portal, Webcenter Spaces .
This tips and guide will be helpful in tuning the Webcenter applications. Use case is like, we are using webcenter portal 11.1.1.8 and Wecenter content. Following guideline will used to optimize the portal application. Application using Webcenter Portal and Webcenter content in backend. We are using Oracle Database 11g R2.
Part 1: Tuning the Database

The first of tuning the Platform is to tune the database appropriately to enhance the performance. The
following 5 steps can be used for tuning the database.
MDS Cache: MDS cache grows in size as metadata objects are accessed until it hits max-size- kb. After that, objects are removed from the cache to make room as needed on a least recently used (LRU) basis to make room for new objects. Unless time-to-live (TTL) is set, the MDS cache continues to occupy the max-size-kb of memory. This can be tuned by increasing the size of
Buffer cache.
o SQL> DB_CACHE_SIZE=16 MB
Shared Pool Size: Need to increase for improving the performance if the application uses stored procedures and functions by setting memory_target. Also set the minimum value of shared pool
to 500MB which can grow and reduce based on demand.
o SQL> alter system set shared_pool_size=500MB
Maximum Opened cursor: For using JDBC statement caching. Set the value to 1500.
Shared Global Area (SGA): Set the SGA to 700 MB.
o SQL> alter system set SGA_TARGET=700MB scope=spfile

Part 2: Tuning the JVM ( JRockit )
As all the java processes are spun and maintained by the JVM, it needs to be tuned properly in order to get the desired performance. The tuning can be done in terms of heap size allocated to different JVM processes, Garbage collection and other run-time parameters.
Tuning the Garbage Collection: Set the dynamic Garbage Collection mode to Throughput Mode. Also we can reduce the memory fragmentation by selecting this GC mode.Use -XgcPrio:throughput as the command line reference for JVM.
Setting the Heap Size on 64-bit Systems: The heap allocation is a vital area which needs to be carrefully tuned to increase the performance. As in demo environments, at most 1 or 2 users will be using the systems, the memory allocation should be efficient, e.g. allocate the minimum memory required for the application during startup and allow it to grow dynamically. Also the heap size should be set such that the used heap is 50% of the maximum allocated heap. Ex: Set -Xms=512 MB (for UCM and WC_Spaces) and -Xmx=1024 (for WC_Spaces) and -Xmx=1536 (for UCM) in setDSSCustomDomainEnv.sh for USER_MEM_ARGS
Setting the Nursery Size: Set -Xns=128m to increase the nursery size. This reduces the chances of very frequent Garbage collections and long pause times. It is set to optimal value by default when the GC mode is selected as throughput.
Tuning Start Up Time: Add the argument -Djava.security.egd=file:/dev/../dev/urandom to increase the startup time by restricting the OS from random number generation and instead using a pseudo random number. Never use this option on an actual production environment
Disabling Explicit Garbage Collection: Add the argument –XxnoSystemGC to avoid the applications calling the system.gc() method which results in a performance degradation.

Part 3: Tuning WebLogic Server (WLS)
As the Applications are built and hosted on the WebLogic application server, the tuning of the WLS is an essential part of the tuning process of the demos.
Stuck thread corrective action: o Set Max Stuck Thread Time to 600 sec. o Set Stuck Thread Count to 3 o Set Failure Action to “Suspend this server for corrective action” o Set the Auto killed and Auto restart to true at <server> → configuration → health
monitoring → set restart interval at 7200 and max restart times to 2.
Set On-Demand deployment of WebLogic internal components instead of start-up. There are many internal applications that are deployed during start-up. These internal applications consume memory and require CPU time during deployment. This contributes to the WebLogic. Server start-up time and base memory footprint. Since many of these internal applications are not needed by every user, WebLogic Server has been modified to wait and deploy these applications on the first access (on-demand) instead of always deploying them during server start-up. This reduces start-up time and memory footprint. On the Configuration: General page for each domain, you can specify whether to deploy internal applications such as the administration Console, UDDI, and the UDDI Explorer on demand (upon first access) instead of during server start-up.
Use minimum logging and disable the HTTP and stdout logging. Reduce the logging volume by changing the log level to warning/debug/error. Switched off domain broadcaster logs. JMS and JDBC logging has been disabled. Access logs are also disabled.
Tuning Network I/O for WebLogic: o Reduce the Connection Backlog Buffering by reducing Accept Backlog Values to 50 from
300 so as to drop the backlogs on TCP requests because in Demo, not many TCP requests will be incoming. Environment → Servers → Configuration → Tuning → Accept Backlog=50
o Enable Java I/O. If the Enable Native IO parameter is not selected, the server instance exclusively uses the Java muxer. This may be acceptable if there are a small number of clients and the rate at which requests arrive at the server is fairly high. Under these conditions, the Java muxer performs as well as a native muxer and eliminate Java Native Interface (JNI) overhead. Since in demo environment, the numbers of clients are limited, enabling Java I/O can increase performance.
Uncheck “Server → Configuration → Tuning → enable native I/O”
Tuning JDBC: o Turn off the property “test connections on reserve”. o Set the initial connection pool size to 5.

o Increased statement cached size to 20 from 10. o For the datasources (used by independent managed servers), enable “pinned to thread”
services.
Use Pipelining and parallel processing in DBMS applications. DBMS are designed to work best when very busy with lots of different things to do. The worst way to use a DBMS is as dumb file storage for one big single-threaded application. If you can design your application and data to support lots of parallel processes working on easily distinguished subsets of the work, your application will be much faster.
Tuning File Stores: o Use Direct-Write synchronous write policy. It performs better than cache-flush write
policy. o The Disabled write-policy option can dramatically improve performance, especially at
low client loads. However, it is unsafe because writes become asynchronous and data can be lost in the event of Operating System or power failure.
Tuning JMS: o Paging Out Messages to free up memory. JMS servers automatically attempt to
free up virtual memory during peak message load periods. JMS message paging saves memory for persistent messages, as even persistent messages cache their data in memory.
o Specifying a Message Paging Directory: If a paging directory is not specified, then paged-out message bodies are written to the default \tmp directory inside the servername subdirectory of a domain’s root directory. For example, if no directory name is specified for the default paging directory, it defaults to:
bea_home\user_projects\domains\domainname\servers\servername\tmp
where domainname is the root directory of your domain, typically c:\bea\user_projects\domains\domainname, which is parallel to the directory in which WebLogic Server program files are stored, typically c:\bea\wlserver_10.3.
o Tuning the Message Buffer Size Option: The Message Buffer Size option specifies the amount of memory that will be used to store message bodies in memory before they are paged out to disk. The default value of Message Buffer Size is approximately one-third of the maximum heap size for the JVM, or a maximum of 512 megabytes. The larger this parameter is set, the more memory JMS will consume when many messages are waiting on queues or topics.
Reduced it to 100MB (approx.)
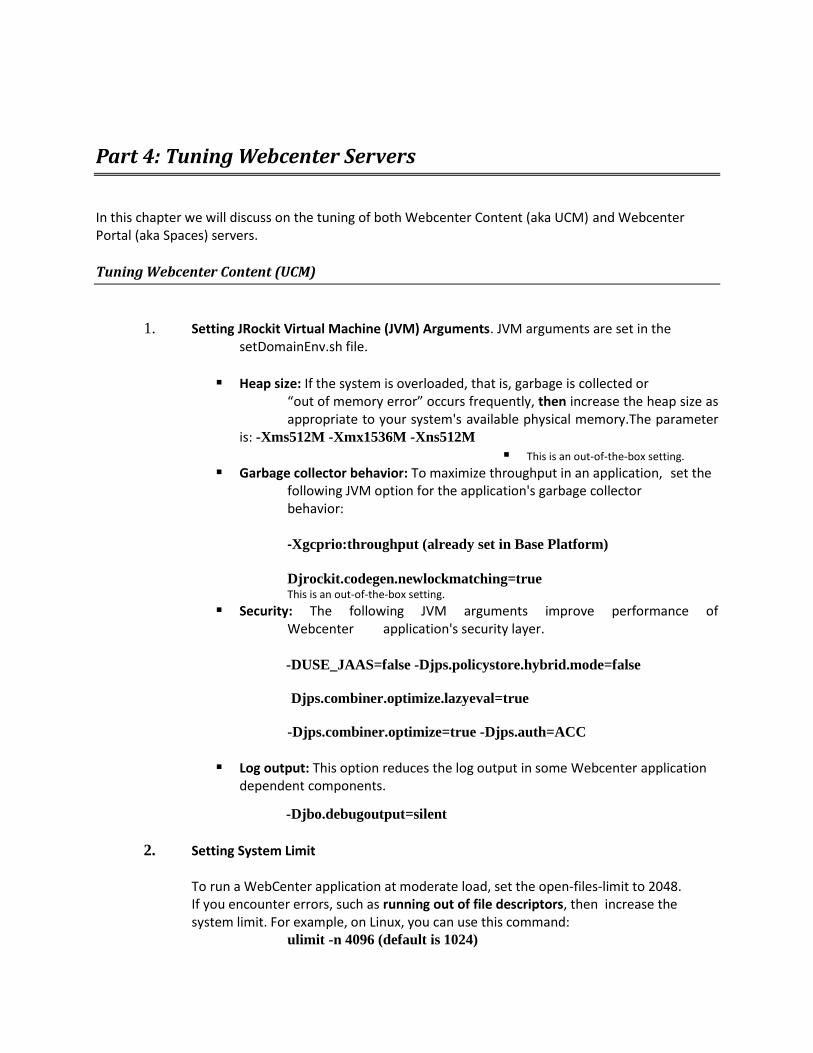
Part 4: Tuning Webcenter Servers
In this chapter we will discuss on the tuning of both Webcenter Content (aka UCM) and Webcenter Portal (aka Spaces) servers.
Tuning Webcenter Content (UCM)
1. Setting JRockit Virtual Machine (JVM) Arguments. JVM arguments are set in the setDomainEnv.sh file.
Heap size: If the system is overloaded, that is, garbage is collected or “out of memory error” occurs frequently, then increase the heap size as appropriate to your system's available physical memory.The parameter is: -Xms512M -Xmx1536M -Xns512M
This is an out-of-the-box setting. Garbage collector behavior: To maximize throughput in an application, set the
following JVM option for the application's garbage collector behavior:
-Xgcprio:throughput (already set in Base Platform)
Djrockit.codegen.newlockmatching=true This is an out-of-the-box setting.
Security: The following JVM arguments improve performance of Webcenter application's security layer.
-DUSE_JAAS=false -Djps.policystore.hybrid.mode=false
Djps.combiner.optimize.lazyeval=true
-Djps.combiner.optimize=true -Djps.auth=ACC
Log output: This option reduces the log output in some Webcenter application dependent components.
-Djbo.debugoutput=silent
2. Setting System Limit To run a WebCenter application at moderate load, set the open-files-limit to 2048. If you encounter errors, such as running out of file descriptors, then increase the system limit. For example, on Linux, you can use this command: ulimit -n 4096 (default is 1024)

3. Setting HTTP Session Timeout To manage over resource usage, adjust the session timeout value, in minutes, in the web.xml file manually. The following is a sample snippet of web.xml:
<session-config>
<session-timeout>
45
</session-timeout>
</session-config>

Tuning Webcenter Portal (Spaces)
In addition to above tunings, follow the below steps for tuning Webcenter Spaces.
1. Tuning Portlet Service - For the Portlets service, 28 supported locales are defined out-of-the-box. Remove the locales that are unnecessary for the application. If these properties are modified, then post deployment, the adfconfig.xml must be edited manually.
2. Configure Portlet cache size
Change the following parameter in adf-config.xml manually
<adf-portlet-config> <supportedLocales> <cacheSettings enabled="true"> <maxSize>10000000</maxSize> {default value} </cacheSettings> <adf-portlet-config>
3. Configure portlet timeout Modify the portlet timeout value in the adf-portlet-config element of the adf-config.xml file. Default: 10 seconds, minimum: 0.1 seconds, maximum: 60 seconds. If you must modify these properties, post deployment, you must edit adf- config.xml manually.The following is a sample snippet of adf-config.xml:
<adf-portlet-config> ....
<defaultTimeout>5</defaultTimeout>
<minimumTimeout>2</minimumTimeout>
<maximumTimeout>100</maximumTimeout>
</adf-portlet-config>

Appendix
Related Reading and References
Oracle Documentation
http://www.oracle.com/technology/documentation/index.html
Oracle Fusion Middleware Administrator's Guide
http://www.oracle.com/technology/documentation/middleware.html
Oracle Fusion Middleware Administrator's Guide for Oracle Webcenter
http://www.oracle.com/technology/documentation/database.html
Oracle Database Performance Tuning Guide Oracle Database Administrator's Guide
http://www.oracle.com/technetwork/middleware/weblogic/documentation/index.html
Oracle Fusion Middleware Performance and Tuning for Oracle WebLogic Server http://download.oracle.com/docs/cd/E21764_01/core.1111/e10108/toc.htm
Oracle JRockit Java Virtual Machine (JVM)
"Welcome to Oracle JRockit" at
http://download.oracle.com/docs/cd/E13150_01/jrockit_jvm/jrockit/webdocs/index.html
"First Steps for Tuning the Oracle JRockit JVM " at
http://download.oracle.com/docs/cd/E13150_01/jrockit_jvm/jrockit/geninfo/diagnos/bestpractices.html
"Tuning the Memory Management System" at http://download.oracle.com/docs/cd/E13150_01/jrockit_jvm/jrockit/geninfo/diagnos/memman.html#wp1087125
"About Profiling and Performance Tuning" at http://download.oracle.com/docs/cd/E13150_01/jrockit_jvm/jrockit/geninfo/diagnos/about_prof_perftune.html