Embed Size (px)
Citation preview

Australian vocational education and training statistics
Employers’ use and views ofthe VET system 2017
National Centre for Vocational Education Research
HighlightsEmployers’ use of the VET system In 2017, similar to 2015: 54.4% of employers used the VET system 37.2% of employers had jobs requiring vocational qualifications 23.5% of employers had apprentices and trainees 22.4% of employers used nationally recognised training (that was not part
of an apprenticeship or traineeship).
Employers’ satisfaction with the VET system 75.4% of employers were satisfied that vocational qualifications provide
employees with the skills they require for the job, similar to 2015.
(Base: all employers with jobs requiring vocational qualifications) 77.5% of employers were satisfied that apprentices and trainees are
obtaining skills they require from training, down 4.2 percentage points from 2015. (Base: all employers with apprentices/trainees)
82.2% of employers were satisfied that nationally recognised training (which is not part of an apprenticeship or traineeship) provides employees with the skills they require for the job, similar to 2015.

© Commonwealth of Australia, 2017
With the exception of the Commonwealth Coat of Arms, the Department’s logo, any material protected by a trade mark and where otherwise noted all material presented in this document is provided under a Creative Commons Attribution 3.0 Australia <http://creativecommons.org/licenses/by/3.0/au> licence.
The details of the relevant licence conditions are available on the Creative Commons website (accessible using the links provided) as is the full legal code for the CC BY 3.0 AU licence <http://creativecommons.org/licenses/by/3.0/legalcode>.
The Creative Commons licence conditions do not apply to all logos, graphic design, artwork and photographs. Requests and enquiries concerning other reproduction and rights should be directed to the National Centre for Vocational Education Research (NCVER).
This document should be attributed as NCVER 2017, Australian vocational education and training statistics: employers’ use and views of the VET system 2017, NCVER, Adelaide.
This work has been produced by NCVER on behalf of the Australian Government, and state and territory governments, with funding provided through the Australian Government Department of Education and Training.
The views and opinions expressed in this document are those of NCVER and do not necessarily reflect the views of the Australian Government or state and territory governments.
ISSN 1835–467XTD/TNC 129.21
Published by NCVER, ABN 87 007 967 311
Level 5, 60 Light Square, Adelaide SA 5000PO Box 8288 Station Arcade, Adelaide SA 5000, Australia
Phone +61 8 8230 8400 Email [email protected] Web <https://www.ncver.edu.au> <http://www.lsay.edu.au>Follow us: <https://twitter.com/ncver> <https://www.linkedin.com/company/ncver>

11
ContentsIntroduction 4Scope 5Technical notes 5More information 6Employer training choices 7Recruitment difficulties 7Proficiency of employees 8Vocational qualifications as a job requirement 9Apprenticeships and traineeships 9Nationally recognised training (not part of an apprenticeship or traineeship) 11Unaccredited training 11Tables
13Terms
22Notes on tables 24
Tables
1 Key findings 2005, 2007, 2009, 2011, 2013, 2015 and 2017 (%) 132 Recruitment difficulties, 2015 and 2017 (% of all employers) 133 Reasons for recruitment difficulties, 2015 and 2017 (% of employers experiencing recruitment difficulties)
134 Proficiency of employees at their job and impact on the organisation’s performance, 2015 and 2017 (%)
145 Reasons employees are not fully proficient at their job, 2015 and 2017 (% of employers with employees
not fully proficient at their job) 14
6 Effect on the organisation if employees are not fully proficient at their job, 2015 and 2017 (% of employers
with employees not fully proficient at their job and where this is impacting on how the organisation performs) 14
7 Strategies used by the organisation to cope with lack of proficiency of employees, 2015 and 2017 (% of employers with employees not fully proficient at their job and where this is impacting on how the organisation performs) 14
8 Use of training in the last 12 months by employer characteristics, 2015 and 2017 (%) 159 Use of the VET system and unaccredited training in the last 12 months by employer characteristics,
2015 and 2017 (%) 1610 Reasons for using the VET system by type of training, 2015 and 2017 (%) 1711 Employers satisfied with training as a way of meeting their skill needs by type of training and employer
characteristics, 2015 and 2017 (%) 1812 Employers’ satisfaction with training as a way of meeting their skill needs by type of training, 2015 and
2017 (%)19
13 Reasons for dissatisfaction with the VET system as a way of meeting skill needs by type of training, 2015 and 2017 (%) 19
14 Type of provider and main provider used for training in the last 12 months by type of training and provider, 2015 and 2017 (%) 20
15 Employers satisfied with aspects of training by main type of training provider, 2015 and 2017 (%) 2116 Number of interviews achieved by employer characteristic, 2015 and 2017 22
Employers’ use and views of the VET system, 2017

Australian vocational education and training statistics

Figures1 Employers’ use of training, 2015 and 2017 (%)
72 Employers’ recruitment difficulties, 2015 and 2017 (%)
83 Employers’ views of the proficiency of their employees at their job, 2015 and 2017 (%)
84 Employers with jobs that require vocational qualifications, 2014 and 2017 (%) 95 Employers satisfied that vocational qualifications provide employees with the skills they
require for the job, 2015 and 2017 (%) 96 Employers with apprentices and trainees, 2015 and 2017 (%) 107 Employers satisfied with the training apprentices and trainees receive as a way of meeting
their skill needs, 2015 and 2017 (%) 108 Main provider used for training apprentices and trainees, 2015 and 2017 (%)
109 Employers using nationally recognised training, 2015 and 2017 (%) 1110 Employers satisfied with nationally recognised training as a way of meeting their skills needs,
2015 and 2017 (%) 1111 Main provider used for nationally recognised training, 2015 and 2017 (%) 1112 Employers using unaccredited training, 2015 and 2017 (%) 1213 Employers satisfied with unaccredited training as a way of meeting their skill needs, 2015 and
2017 (%) 1214 Main provider used for unaccredited training, 2015 and 2017 (%) 12
Employers’ use and views of the VET system 2017 5

IntroductionThis publication presents information on employers’ use and views of the vocational education and training (VET) system. The findings relate to the various ways in which Australian employers use the VET system and unaccredited training to meet their skill needs, and their satisfaction with these methods of training. Australian employers can engage with the VET system in three main ways, by: having jobs that require vocational qualifications having apprentices and trainees using nationally recognised training.Information is also presented on employers’ views of the proficiency of their employees and whether they have experienced any recruitment difficulty.The figures in this publication are derived from the Survey of Employer Use and Views of the VET System. A total of 8022 telephone interviews were conducted with Australian employers between February and May 2017 and the results relate to employers’ training experiences in the 12 months preceding their interview. Note for the purposes of this publication, nationally recognised training excludes training that was part of an apprenticeship or traineeship as employers use and views of apprentices and trainees is reported separately.
ScopeAll organisations in Australia with at least one employee are in scope of the survey. For this survey, an employee is defined as ‘a person working in, or operating from, this organisation, including full-time, part-time and casual employees’. An owner-operator is not classed as an employee, regardless of whether or not they pay themselves a wage. The following organisations are out of the scope of the survey: Self-employed persons who do not employ staff Private households employing staff Foreign diplomatic missions Consulates in Australia Defence force establishments Superannuation funds.
Technical notesThe Survey of Employer Use and Views of the VET System is undertaken as a randomly selected sample, stratified by state/territory, employer size and industry. Survey responses are weighted to population benchmarks from the Australian Bureau of Statistics (ABS) Business Register. The estimates in this publication are subject to sampling variability, as they are based on a sample rather than a population; that is, they may differ from the estimates that would have been produced if all employers had been included and responded to the survey. The 2017 survey sample was designed to have greater overlap with respondents to the 2015 survey than was previously the case. About 64% of employers who responded to the 2015 survey were selected to participate in the 2017 survey. This was done in order to increase the precision in estimates of change over time. The sample overlap reduces the likelihood of any changes over time being due to different employers being surveyed, and where changes have occurred, allows us to more confidently report these as real changes.
6
Australian vocational education and training statistics

Because estimates are based on a sample instead of a survey of the entire population, any estimate is unlikely to be exactly equal to the true population value. How close the estimate is likely to be to the true value is reflected in the confidence interval. The confidence interval can be calculated for any confidence level, but usually a level of 90%, 95%, or 99% is used. For this publication we use a confidence level of 95%, which means the probability that the confidence interval contains the true population value is 95%. The confidence interval can be shown graphically using a black bar around the estimate. Smaller bars correspond to more accurate estimates. The confidence interval is sometimes expressed as Estimate +/- margin of error.That is, the margin of error is half the width of the confidence interval. For example, in figure B, Estimate A is equal to 70% and the margin of error (using a confidence level of 95%) is 5%. The confidence interval for this estimate is 65% to 75%, which means we can be 95% confident the true value is between 65% and 75%.
Figure A Confidence interval and margins of error Figure B Confidence intervals
It is important to consider the margin of error when comparing between groups and years, particularly when the results are close. Data users are encouraged to use the margin of error to determine if a difference between groups is statistically significant.In figure B, the black bars for Estimate A and Estimate B do not overlap. This means that it can be concluded with a 95% level of confidence that there is a difference between Estimate A and Estimate B. However, the error bars for Estimate B and Estimate C overlap. This means that it cannot be concluded with a 95% level of confidence that there is a difference between Estimate B and Estimate C.
For further technical details, please refer to Technical notes at <https://www.ncver.edu.au/data/collection/employers-use-and-views-of-the-vet-system>.
More informationFor additional data tables on employers’ use and views of the VET system, including data from the 2005, 2007, 2009, 2011, 2013 and 2015 surveys, please refer to <https://www.ncver.edu.au/data/collection/employers-use-and-views-of-the-vet-system>.These tables include information on each type of training by state, industry and employer size, as well as the margin of error. The margin of error allows data users to view the amount of certainty (or error) in a reported measure sourced from information provided by a sample rather than a population.
Employers’ use and views of the VET system 2017 7

Employer training choicesIn 2017: 54.4% of employers used the VET system to meet their training needs, similar to
2015Table 1 & figure 1
50.8% of employers provided unaccredited training to their staff, similar to 2015
81.4% of employers provided informal training to their staff, up 3.5 percentage points from 2015
Table 1 & figure 1
Table 1 & figure 1
8.7% of employers did not provide any training to their employees, down 2.2 percentage points from 2015.
Figure 1 Employers’ use of training, 2015 and 2017 (%)
Table 1
The VET system Unaccredited training Informal training0
20
40
60
80
100
2015 2017
Recruitment difficulties In 2017: 42.1% of employers had difficulty (a lot or some) recruiting employees, up 5.6
percentage points from 2015Table 2
16.8% of employers had a lot of difficulty recruiting employees, up 3.3 percentage points from 2015.
Table 2 & figure 2
8
Australian vocational education and training statistics

Figure 2 Employers’ recruitment difficulties, 2015 and 2017 (%)
A lot of difficulty Some difficulty No difficulty in recruiting, or have not looked for, employees
0
20
40
60
80
100
2015 2017
Of those employers that found it difficult to recruit employees: the main reasons for recruitment difficulties were a shortage of skilled people in the
industry (56.4%) and limited applicants (41.6%).Table 3
Proficiency of employeesIn 2017: 62.5% of employers believed all their employees were fully proficient at their job,
down 3.7 percentage points from 2015Table 4 & figure 3
36.1% of employers believed some or most of their employees were fully proficient at their job.
Table 4 & figure 3
Figure 3 Employers’ views of the proficiency of their employees at their job, 2015 and 2017 (%)
All e
mploye
es fu
lly pr
oficie
nt
Mos
t emplo
yees
fully
profi
cient
Som
e emplo
yees
fully
profi
cient
No e
mploye
es fu
lly pr
oficie
nt0
20406080
100
2015 2017
Of those employers who had some employees below full proficiency: the main reasons given were that employees were new to their role (44.1%) and had
only partially completed their training (33.5%)Table 5
Employers’ use and views of the VET system 2017 9

having staff below full proficiency had an impact on the performance of 82.4% of employers; a major impact on 17.8% and a minor impact on 64.6% of employers.
Table 4
Of those employers whose performance was impacted by having some employees below full proficiency: the main effects were an increased workload for other staff (81.8%) and increased
operating costs (61.7%)Table 6
the main strategies used to manage the lack of staff proficiency were training existing staff (86.9%), internal reorganisation (57.3%) and recruitment of new staff (56.7%).
Table 7
Employers use and satisfaction with the system Australian employers can engage with the VET system in three main ways: Having jobs that require vocational qualifications. Having apprentices and trainees. Using nationally recognised training.The following section outlines use and satisfaction for each type of training.
Vocational qualifications as a job requirementIn 2017: 37.2% of employers had jobs that require vocational qualifications, similar to 2015 Table 1 &
figure 4
Of these employers: the main reasons for having jobs that require vocational qualifications were to provide
skills required for the job (57.2%), to meet legislative, regulatory or licensing requirements (49.4%), and to meet and maintain professional or industry standards (30.9%)
Table 10
75.4% were satisfied that vocational qualifications provide employees with the skills they require for the job, similar to 2015
Table 1 & figure 5
12.8% were dissatisfied with vocational qualifications in providing employees with the skills they require for the job, similar to 2015. Of these, 41.8% believed that the training was of poor quality or low standard, 41.3% that relevant skills were not taught, and 28.6% that there was not enough focus on practical skills.
Table 12, 13
10
Australian vocational education and training statistics

Figure 4 Employers with jobs that require vocational qualifications, 2015 and 2017 (%)
Figure 5 Employers satisfied that vocational qualifications provide employees with the skills they require for the job, 2015 and 2017 (%)(Base: all employers with jobs requiring a vocational qualification)
Employers’ use and views of the VET system 2017
11
0
20
40
60
80
100
2015 20170
20
40
60
80
100
2015 2017

Apprentices and traineesIn 2017: 23.5% of employers had apprentices and trainees, similar to 2015. Table 1 &
figure 6
Of these employers: the main reasons for employing apprentices and trainees were to get skilled staff and
improve staff skills (45.4%), to fill a specific role in the organisation (31.9%), and to train them to their own requirements (28.9%)
Table 10
77.5% were satisfied with the training apprentices and trainees receive as a way of meeting their skill needs, down 4.2 percentage points from 2015
Table 1 & figure 7
12.0% were dissatisfied with the training provided to apprentices and trainees, similar to 2015. Of these, 60.2% believed that the training was of a poor quality and to a low standard, 33.5% that relevant skills were not taught, and 29.0% that there was not enough focus on practical skills.
Table 12, 13
Figure 6 Employers with apprentices and trainees, 2015 and 2017 (%)
Figure 7 Employers satisfied with the training apprentices and trainees receive as a way of meeting their skill needs, 2015 and 2017 (%)(Base: all employers with apprentices/trainees)
Of employers with apprentices and trainees, 62.4% used technical and further education institutes (TAFE) as their main provider to train apprentices and trainees, similar to 2015. Of these, 81.8% were satisfied overall with the training provided, similar to 2015.
Figure 8 Main provider used for training apprentices and trainees, 2015 and 2017 (%) (Base: all employers with apprentices/trainees)
Table 14, 15 & figure 8
12
Australian vocational education and training statistics
0
20
40
60
80
100
2015 20170
20
40
60
80
100
2015 2017

0
20
40
60
80
100
2015 2017
Nationally recognised training (not part of an apprenticeship or traineeship)In 2017: 22.4% of employers arranged or provided their employees with nationally recognised
training, similar to 2015.Table 1 & figure 9
Of these employers: the main reasons for using nationally recognised training were to provide skills
required for the job (47.0%), to meet legislative, regulatory and licensing requirements (34.6%), to meet and maintain professional or industry standards (26.3%), and for staff career development (25.5%)
Table 10
82.2% were satisfied with nationally recognised training as a way of meeting their skills needs, similar to 2015
Table 1 & figure 10
6.8% were dissatisfied with nationally recognised training as a way of providing employees with the skills they require for the job, similar to 2015. Of these, 47.7% believed that the training was of a poor quality or low standard, and 33.0% that relevant skills were not taught.
Table 12, 13
Figure 9 Employers using nationally recognised training, 2015 and 2017 (%)
Figure 10 Employers satisfied with nationally recognised training as a way of meeting their skills needs, 2015 and 2017 (%)(Base: all employers using nationally recognised training)
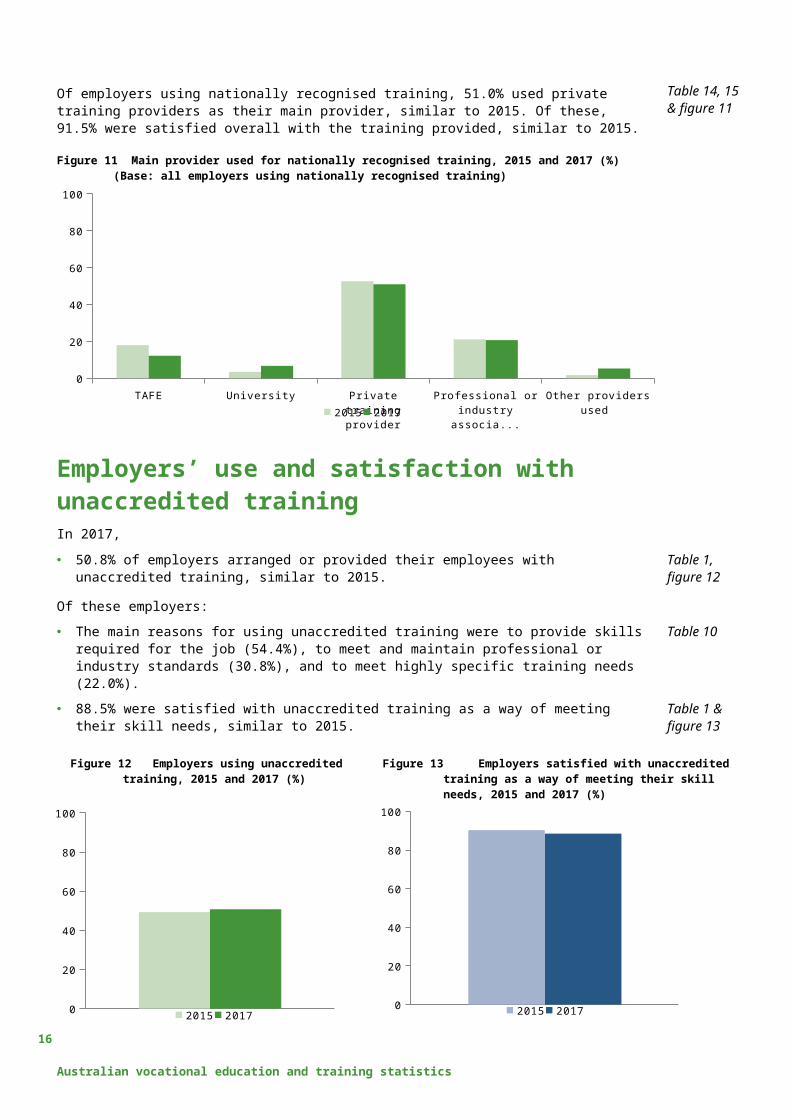
Of employers using nationally recognised training, 51.0% used private training providers as their main provider, similar to 2015. Of these, 91.5% were satisfied overall with the training provided, similar to 2015.
Table 14, 15 & figure 11
Employers’ use and views of the VET system 2017
13
0
20
40
60
80
100
0
20
40
60
80
100
2015 2017

Figure 11 Main provider used for nationally recognised training, 2015 and 2017 (%) (Base: all employers using nationally recognised training)
0
20
40
60
80
100
2015 2017
Employers’ use and satisfaction with unaccredited trainingIn 2017, 50.8% of employers arranged or provided their employees with unaccredited training,
similar to 2015.Table 1, figure 12
Of these employers: The main reasons for using unaccredited training were to provide skills required for
the job (54.4%), to meet and maintain professional or industry standards (30.8%), and to meet highly specific training needs (22.0%).
Table 10
88.5% were satisfied with unaccredited training as a way of meeting their skill needs, similar to 2015.
Table 1 & figure 13
Figure 12 Employers using unaccredited training, 2015 and 2017 (%)
Figure 13 Employers satisfied with unaccredited training as a way of meeting their skill needs, 2015 and 2017 (%)(Base: all employers using unaccredited training)
Of employers who used unaccredited training, 54.7% of employers did not use an external training provider (similar to 2015), 19.7% used a private training provider (up 4.0 percentage points from 2015), and 12.7% used a professional or industry association, (similar to 2015).
Figure 14 Main provider used for unaccredited training, 2015 and 2017 (%)(Base: all employers using unaccredited training)
Table 14, figure 14
14
Australian vocational education and training statistics
0
20
40
60
80
100
2015 2017
0
20
40
60
80
100

TAFE Private training provider
Professional or indus-try association
Supplier/manufacturer of equipment and/or
product
Other providers used0
5
10
15
20
25
30
2015 2017
Employers’ use and views of the VET system 2017
15
TablesTable 1 Key findings 2005, 2007, 2009, 2011, 2013, 2015 and 2017 (%)
2005 2007 2009 2011 2013 2015 2017
Training choicesEmployers using the VET system (Base: all employers):
57.9 55.6 58.0 56.1 51.9 52.8 54.4
With jobs that require vocational qualifications
37.0 34.8 35.7 36.4 33.3 36.6 37.2
With apprentices and trainees 29.2 30.3 32.0 30.4 26.9 24.3 23.5Using nationally recognised training 24.2 23.3 27.2 23.7 20.0 20.6 22.4
Employers using unaccredited training 54.5 50.4 54.1 49.0 47.5 49.3 50.8Employers using informal training 73.0 72.1 77.8 78.3 77.6 77.9 81.4Employers providing no training 12.2 13.0 8.7 9.3 12.4 10.9 8.7
Satisfaction with trainingEmployers satisfied with vocational qualifications (Base: all employers with jobs requiring a vocational qualification)
77.0 80.7 83.3 84.6 78.3 76.2 75.4
Employers satisfied with apprentices and trainees(Base: all employers with apprentices/trainees)
78.7 83.2 83.3 82.9 78.8 81.7 77.5
Employers satisfied with nationally recognised training(Base: all employers using nationally recognised training)
81.3 82.0 86.3 89.2 83.1 84.0 82.2
Employers satisfied with unaccredited training (Base: all employers using unaccredited training)
91.7 92.6 95.4 96.2 90.3 90.3 88.5
For notes on tables, see page 24.
Table 2 Recruitment difficulties, 2015 and 2017 (% of all employers)
2015 2017
Level of difficulty in recruiting staff:A lot of difficulty 13.5 16.8Some difficulty 22.9 25.2No difficulty in recruiting, or have not looked for, staff 63.5 57.9
For notes on tables, see page 24.
Table 3 Reasons for recruitment difficulties, 2015 and 2017 (% of employers experiencing recruitment difficulties)
2015 2017
Limited applicants 45.7 41.6Location is either remote or not desirable 12.8 15.0Loss of skilled workers to other companies or industries 1.8 1.1Not a career that is aspired to 5.5 6.5People unwilling to take certain shifts 6.1 7.0Poor work ethic 12.2 15.9Shortage of skilled people in the industry 50.9 56.4Wages and salaries are considered too low or uncertain 7.6 6.6Other reasons 10.8 9.2
For notes on tables, see page 24.
16
Australian vocational education and training statistics
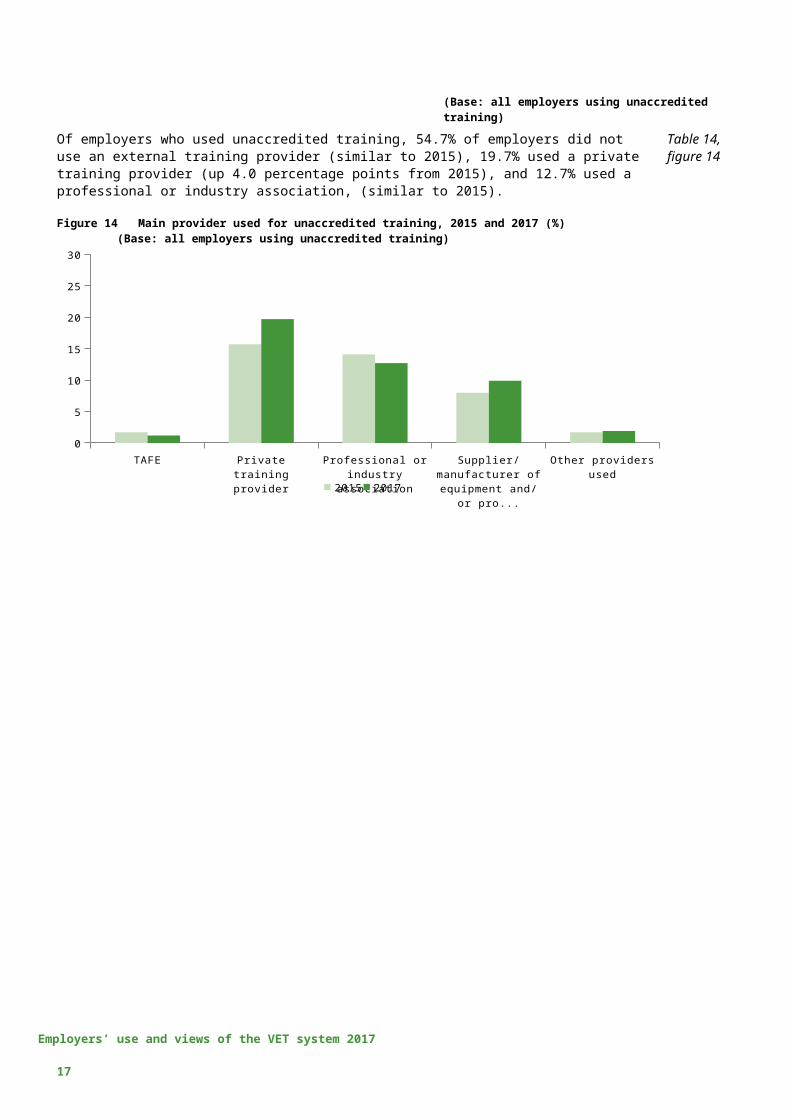
Table 4 Proficiency of employees at their job and impact on the organisation’s performance, 2015 and 2017 (%)
2015 2017
Proficiency of employees (Base: all employers):All employees fully proficient at their job 66.2 62.5Most employees fully proficient at their job 28.7 30.7Some employees fully proficient at their job 4.2 5.4
No employees fully proficient at their job 0.9* 1.4Impact on the organisation’s performance if employees not fully proficient at their job (Base: all employers with some staff not fully proficient at their job):
Major impact on how the organisation performs 20.9 17.8Minor impact on how the organisation performs 60.5 64.6No impact on how the organisation performs 18.6 17.6
For notes on tables, see page 24.
Table 5 Reasons employees are not fully proficient at their job, 2015 and 2017 (% of employers with employees not fully proficient at their job)
2015 2017Performance has not improved sufficiently after training 1.8* 2.1Staff lack motivation 15.8 16.8Their training is currently only partially completed 34.5 33.5They are apprentices or trainees 6.4 7.8They are new to the role 44.5 44.1They have not received the appropriate training 17.8 20.8Training is ongoing and there is always more to learn np npUnable to recruit staff with the required skills 2.0* 2.7*Other reasons 21.1 12.1
For notes on tables, see page 24.
Table 6 Effect on the organisation if employees are not fully proficient at their job, 2015 and 2017 (% of employers with employees not fully proficient at their job and where this is impacting on how the organisation performs)
2015 2017Delays in developing new products or services 30.8 36.7Difficulties in introducing technological change 38.4 33.3Difficulties in meeting customer service objectives 48.9 48.6Difficulty in introducing new working practices 41.9 43.0Difficulty in meeting quality standards 49.8 45.7Increased operating costs 58.7 61.7Increased workload for other staff 83.0 81.8Loss of business or orders to competitors 30.9 32.4Need to outsource work 19.7 24.3Not able to take on as much business as you would like 37.7 39.9Withdrawal of certain products or services altogether 11.0 15.1
For notes on tables, see page 24.
Table 7 Strategies used by the organisation to cope with lack of proficiency of employees, 2015 and 2017(% of employers with employees not fully proficient at their job and where this is impacting on howthe organisation performs)
2015 2017Internal reorganisation 57.2 57.3Recruitment of new staff 59.2 56.7Trained existing staff 86.0 86.9Taken other action 32.2 30.6None of these 4.8 4.5
For notes on tables, see page 24.
Employers’ use and views of the VET system 2017
17

Table 8 Use of training in the last 12 months by employer characteristics, 2015 and 2017 (%)
Employer characteristics
Employers using the VET system
Employers using unaccredited training
Employers using informal training
Employers providing no training
2015 2017 2015 2017 2015 2017 2015 2017
State (Base: all employers within state)New South Wales 53.9 56.5 51.7 51.8 77.1 81.6 10.6 7.1Victoria 47.7 51.8 42.7 49.4 77.1 82.3 11.8 9.6Queensland 57.9 54.9 52.3 51.4 81.2 81.0 9.4 9.5South Australia 46.6 51.2 44.3 45.4 71.7 80.0 13.8 10.6Western Australia 55.0 52.9 53.7 52.3 79.9 79.2 10.7 9.4Tasmania 54.2 58.5 46.1 51.1 73.6 80.2 13.0 10.4Northern Territory 61.5 58.5 53.5 57.5 85.4 84.3 7.2 7.8Australian Capital Territory 52.2 56.1 57.7 53.7 80.9 85.6 8.2 8.4
Employer size (Base: all employers within employer size)Small 46.3 47.5 41.1 42.6 72.7 76.9 14.1 11.7Medium 68.2 69.4 68.8 69.3 91.4 91.9 2.4 1.7Large 90.5 85.2 92.5 84.1 94.2 96.3 0.0 np
Industry (Base: all employers within industry)Agriculture, forestry and fishing 28.0 38.2 31.9 43.0 66.8 75.8 24.3 15.2Mining 62.2 58.6 64.7 60.5 66.8 66.1 14.5* 11.2*Manufacturing 57.3 63.7 39.4 47.0 81.8 81.1 9.6* 8.2Electricity, gas, water and waste services
43.8 44.1 47.4 40.3 74.8 82.2 12.1* np
Construction 74.7 78.7 37.6 39.6 77.8 80.2 6.5 6.1Wholesale trade 41.1 39.3 49.4 49.3 76.2 82.4 13.5 7.8Retail trade 35.3 36.3 41.4 46.5 74.4 79.9 16.4 12.1Accommodation and food services 40.6 41.8 43.4 39.7 88.1 85.4 5.7* 7.7Transport, postal and warehousing 26.7 30.0 35.5 47.6 75.5 83.0 20.5 11.0*Information media and telecommunications
49.9 35.0 53.5 54.8 86.4 83.2 10.9* 9.0*
Financial and insurance services 63.1 58.3 70.1 68.2 82.5 84.9 6.8* 8.3*Rental, hiring and real estate services 62.2 63.6 56.1 68.3 80.5 83.4 9.6* 5.9*Professional, scientific and technical services
42.6 47.3 57.0 56.9 77.1 80.5 12.2 9.0
Administrative and support services 41.8 38.5 46.4 51.4 85.6 90.3 10.3* 5.8*Public administration and safety 77.3 64.8 68.5 69.5 86.3 92.6 np npEducation and training 72.2 70.4 76.6 68.0 81.3 82.2 5.9* 6.7*Health care and social assistance 58.1 57.9 67.1 60.0 77.0 81.8 11.8 9.4Arts and recreation services 53.3 46.3 56.0 50.3 79.9 80.6 9.7* 13.3*Other services 73.4 73.4 54.7 54.9 70.7 78.7 5.8 7.0
Total 52.8 54.4 49.3 50.8 77.9 81.4 10.9 8.7For notes on tables, see page 24.
18
Australian vocational education and training statistics

Table 9 Use of the VET system and unaccredited training in the last 12 months by employer characteristics, 2015 and 2017 (%)
Employer characteristics
The VET system Employers using unaccredited training
Employers with vocational qualifications
as a job requirement
Employers with apprentices/trainees
Employers using nationally recognised
training2015 2017 2015 2017 2015 2017 2015 2017
State (Base: all employers within state)New South Wales 39.6 40.0 25.7 25.1 20.1 21.0 51.7 51.8Victoria 31.2 34.8 20.5 22.3 18.6 20.3 42.7 49.4Queensland 39.5 36.9 26.7 25.2 23.0 25.8 52.3 51.4South Australia 30.7 33.8 19.5 17.2 18.8 21.2 44.3 45.4Western Australia 38.3 35.4 26.1 19.0 21.1 25.5 53.7 52.3Tasmania 34.8 35.7 26.9 29.9 23.4 25.3 46.1 51.1Northern Territory 42.7 40.3 26.9 28.9 34.0 32.5 53.5 57.5Australian Capital Territory 33.2 37.6 24.8 26.2 25.8 23.5 57.7 53.7
Employer size(Base: all employers within employer size)Small 31.5 31.5 20.2 19.5 15.1 15.7 41.1 42.6Medium 48.6 49.0 33.2 31.3 32.6 36.0 68.8 69.3Large 69.0 67.0 55.1 47.9 62.4 63.7 92.5 84.1
Industry (Base: all employers within industry)Agriculture, forestry and fishing 13.1 18.5 10.0 9.6 14.6 21.3 31.9 43.0Mining 38.3 44.1 28.5 11.6* 48.4 30.3 64.7 60.5Manufacturing 39.8 43.6 36.9 32.0 18.0 25.7 39.4 47.0Electricity, gas, water and waste services
31.8 30.5 11.6* 21.5* 20.0 21.4* 47.4 40.3
Construction 48.9 48.2 49.3 53.7 24.6 26.7 37.6 39.6Wholesale trade 21.7 24.0 15.5 10.4 20.7 19.3 49.4 49.3Retail trade 21.4 20.8 19.8 17.7 16.3 18.6 41.4 46.5Accommodation and food services 18.7 24.8 29.8 21.6 16.0 17.1 43.4 39.7Transport, postal and warehousing 15.0 17.2 9.9 10.0* 10.9 14.0 35.5 47.6Information media and telecommunications
35.2 25.3 10.7* 13.8* 17.0* 10.2* 53.5 54.8
Financial and insurance services 44.1 41.0 12.6* 8.5* 37.5 29.6 70.1 68.2Rental, hiring and real estate services 49.6 47.6 20.7 19.6 24.3 22.1 56.1 68.3Professional, scientific and technical services
35.0 31.7 9.9 13.0 12.9 18.6 57.0 56.9
Administrative and support services 28.2 22.9 10.1* 7.5 17.5 20.4 46.4 51.4Public administration and safety 62.7 50.7 43.4 32.2 45.5 41.8 68.5 69.5Education and training 57.5 59.1 14.5 14.1 44.1 35.8 76.6 68.0Health care and social assistance 45.7 47.9 13.0 15.0 28.4 26.4 67.1 60.0Arts and recreation services 33.4 32.7 21.9 18.0 23.7 25.1 56.0 50.3Other services 58.0 58.7 38.1 40.9 16.6 20.4 54.7 54.9
Total 36.6 37.2 24.3 23.5 20.6 22.4 49.3 50.8For notes on tables, see page 24.
Employers’ use and views of the VET system 2017
19

Table 10 Reasons for using the VET system by type of training, 2015 and 2017 (%)
2015 2017
Reasons for having vocational qualifications as a job requirement (Base: all employers with jobs requiring vocational qualifications)In response to new technology 0.8* 1.5*Legislative, regulatory or licensing requirements 52.1 49.4To develop and maintain a flexible and responsive workforce 1.7* 2.3To improve the quality of goods and services provided 3.6 4.8To meet and maintain professional/industry standards 27.9 30.9To provide the skills required for the job 62.3 57.2To remain competitive 0.8* 1.1*Other reasons 0.8* 0.6*
Reasons for employing apprentices and trainees (Base: all employers with apprentices/trainees)Cheap source of labour/cost-effective 8.5 8.2Financial incentives 4.0* 1.8*Staff gain a nationally recognised qualification 3.0 4.9To fill a specific role or need more staff 32.2 31.9To get skilled staff and improve staff skills 39.1 45.4To give young people a head start 22.1 22.8To support the industry 11.1 9.4To train to own requirements 28.5 28.9Usual business practice to employ apprentices/trainees 15.0 18.2Other reasons 8.2 8.5
Reasons for using nationally recognised training(Base: all employers using nationally recognised training)Formalise qualifications and skills 14.5 8.9In response to new technology 0.5* npLegislative, regulatory or licensing requirements 41.5 34.6Staff career development 31.9 25.5To develop and maintain a flexible and responsive workforce 9.1 6.1To improve staff morale and retention 1.4* 1.9*To improve the quality of goods and services provided 11.7 12.3To meet and maintain professional/industry standards 23.0 26.3To provide the skills required for the job 41.5 47.0To remain competitive 1.4* 2.8*Other reasons 4.1* 3.2*
Reasons for using unaccredited training(Base: all employers using unaccredited training)In response to new technology 14.2 12.4Legislative, regulatory or licensing requirements 17.5 16.4Staff career development 1.8* 2.5To develop and maintain a flexible and responsive workforce 18.0 14.2To improve the quality of goods and services provided 18.9 15.7To meet and maintain professional/industry standards 27.6 30.8To meet highly specific training needs 15.1 22.0To provide the skills required for the job 55.2 54.4To remain competitive 2.8 2.8Other reasons 5.1 5.9For notes on tables, see page 24.
20
Australian vocational education and training statistics

Table 11 Employers satisfied with training as a way of meeting their skill needs by type of training and employer characteristics, 2015 and 2017 (%)
Employer characteristics
The VET system Employers using unaccredited training
Employers with vocational qualifications as ajob requirement
Employers with apprentices/trainees
Employers using nationally recognised
training2015 2017 2015 2017 2015 2017 2015 2017
State (Base: all employers within state)New South Wales 73.7 76.2 81.6 78.9 83.9 82.2 90.3 88.3Victoria 79.1 76.6 79.9 71.2 83.7 82.5 88.8 87.1Queensland 75.9 70.6 82.7 80.5 84.9 80.7 90.7 89.2South Australia 77.7 72.2 85.4 78.7 87.0 80.4 89.3 90.4Western Australia 78.9 79.8 82.4 81.9 82.6 83.9 93.2 90.0Tasmania 79.6 81.2 82.0 73.6 80.8 84.2 91.2 88.8Northern Territory 76.1 73.9 74.3 80.1 81.5 84.3 85.7 88.5Australian Capital Territory 77.9 77.9 80.5 78.3 82.2 86.7 88.8 88.8
Employer size (Base: all employers within employer size)Small 74.4 74.7 79.6 75.4 82.5 80.8 89.9 86.9Medium 78.8 76.4 84.4 78.5 85.8 83.6 90.7 90.9Large 82.8 77.4 86.9 92.1 84.6 83.3 92.4 90.2
Industry (Base: all employers within industry)Agriculture, forestry and fishing 75.5 89.3 81.1 78.7 83.5 85.1 92.4 89.8Mining 90.5 83.1 95.4 73.5 94.6 70.8 94.5 97.0Manufacturing 64.4 77.4 82.8 77.3 80.7 75.5 88.1 87.2Electricity, gas, water and waste services
75.7 93.0 91.6 59.4* 83.4 46.5* 82.3 95.8
Construction 74.6 74.2 81.3 78.3 90.0 80.5 91.8 89.9Wholesale trade 81.3 80.6 87.9 80.0 68.8 80.7 94.2 86.8Retail trade 78.5 80.3 90.3 76.0 84.5 86.2 92.2 89.2Accommodation and food services 76.9 55.8 89.0 72.0 88.8 76.4 92.3 77.0Transport, postal and warehousing 64.8 80.1 93.2 90.8 85.1 70.9 93.9 87.3Information media and telecommunications
85.6 62.1 50.6* 42.7* 79.4 62.0* 94.7 92.5
Financial and insurance services 87.3 74.4 93.5 93.8 84.8 79.8 92.3 82.8Rental, hiring and real estate services 77.7 79.7 80.0 90.3 86.4 81.8 93.1 87.6Professional, scientific and technical services
75.1 77.4 75.6 76.4 85.3 82.2 89.3 87.0
Administrative and support services 64.1 70.6 93.3 95.0 83.0 78.5 79.8 90.7Public administration and safety 84.4 77.7 81.3 78.3 82.7 86.6 82.7 89.6Education and training 80.1 83.8 85.7 95.7 80.2 90.4 91.5 94.7Health care and social assistance 83.7 80.5 82.1 84.2 87.5 91.3 90.0 92.4Arts and recreation services 80.2 75.7 90.0 94.3 90.5 83.9 87.9 86.7Other services 74.8 66.0 66.9 68.8 71.3 78.7 86.8 89.9
Total 76.2 75.4 81.7 77.5 84.0 82.2 90.3 88.5For notes on tables, see page 24.
Employers’ use and views of the VET system 2017
21

Table 12 Employers’ satisfaction with training as a way of meeting their skill needs by type of training, 2015 and 2017 (%)
2015 2017Satisfied Neither
satisfied nor dissatisfied
Dissatisfied Satisfied Neither satisfied nor dissatisfied
Dissatisfied
Training choicesEmployers with jobs that require vocational qualifications 76.2 12.8 10.9 75.4 11.7 12.8Employers with apprentices and trainees 81.7 7.9 10.4 77.5 10.5 12.0Employers using nationally recognised training 84.0 9.8 6.3 82.2 11.0 6.8Employers using unaccredited training 90.3 7.5 2.2 88.5 8.3 3.3For notes on tables, see page 24.
Table 13 Reasons for dissatisfaction with the VET system as a way of meeting skill needs by type of training, 2015 and 2017 (%)
2015 2017
Reasons for dissatisfaction with vocational qualifications as a job requirement (Base: dissatisfied employers with jobs requiring a vocational qualification)Instructors do not have enough industry experience 7.7* 11.7*Not enough focus on practical skills 41.0 28.6Poor access to training in regional/rural areas 11.8* 9.8*Relevant skills are not taught 44.3 41.3Standards are inconsistent across institutions 6.2* 8.8*Training content is outdated np npTraining is of a poor quality or low standard 43.7 41.8Training is too expensive 3.2* npTraining is too general and not specific enough 19.0* 21.4Other reasons 15.2* 15.5
Reasons for dissatisfaction with apprentices and trainees (Base: dissatisfied employers with apprentices/trainees)Access and the amount of funding available np npApprentice/trainee had a poor attitude 5.8* 8.1*Instructors do not have enough industry experience 12.3* 13.1*Insufficient communication between training provider and employment agency 9.0* 11.7*Not enough focus on practical skills 26.9* 29.0Poor access to training in regional/rural areas 8.6* 4.8*Relevant skills are not taught 41.7 33.5Training content is outdated np npTraining is of a poor quality or low standard 42.5 60.2Training is too general and not specific enough 12.9* 9.2*Other reasons 30.1* 13.2*
Reasons for dissatisfaction with nationally recognised training (Base: dissatisfied employers using nationally recognised training)Access and the amount of funding available np naInstructors do not have enough industry experience 3.6* 11.1*Not enough focus on practical skills 9.1* 20.8*Poor access to training in regional/rural areas 10.3* npRelevant skills are not taught 32.1 33.0Training content is outdated 4.4* npTraining is of a poor quality or low standard 36.5* 47.7Training is too expensive 10.7* 7.1*Training is too general and not specific enough 22.1* 13.2*Other reasons 26.8* 12.5*For notes on tables, see page 24.
22
Australian vocational education and training statistics

Table 14 Type of provider and main provider used for training in the last 12 months by type of training and provider, 2015 and 2017 (%)
Type of training provider All types of providers used Main provider used
2015 2017 2015 2017
Apprentices and trainees (Base: all employers with apprentices/trainees)TAFE 68.4 66.0 66.2 62.4Private training provider 22.4 25.4 18.8 21.2Professional or industry association 10.9 7.7 8.8 6.7Other providers used for training apprentices/trainees 5.4 9.9 4.4 7.4No external training provider used 1.8* 3.1 1.8* 2.3*
Nationally recognised training (Base: all employers using nationally recognised training)TAFE 27.2 19.3 18.0 12.2University 5.1* 8.7 3.5* 6.7*Private training provider 56.3 54.6 52.6 51.0Professional or industry association 23.3 23.4 21.1 20.7Other providers used for nationally recognised training 2.7* 7.3 1.7* 5.3No external training provider used 3.3* 4.2 3.1* 4.2
Unaccredited training (Base: all employers using unaccredited training)TAFE 2.4* 1.6 1.7* 1.2*Private training provider 18.0 20.9 15.7 19.7Professional or industry association 15.0 14.7 14.1 12.7Supplier/manufacturer of equipment and/or product 9.9 11.0 8.0 9.9Other providers used for unaccredited training 2.9 2.9 1.7 1.9*No external training provider used 58.4 54.5 58.7 54.7
For notes on tables, see page 24.
Employers’ use and views of the VET system 2017
23

Table 15 Employers satisfied with aspects of training by main type of training provider, 2015 and 2017 (%)
Main type of training provider Aspects of training Overall satisfaction
Relevance of skills taught
Condition of equipment and
facilities
Cost-effectiveness of the training
Flexibility of the provider in
meeting your needs
Trainers’ knowledge and experience of
your industry
Standard of assessment
2015 2017 2015 2017 2015 2017 2015 2017 2015 2017 2015 2017 2015 2017
Apprentices and trainees (Base: all employers with apprentices/trainees)TAFE 78.3 82.5 92.3 89.4 77.0 78.9 75.1 79.6 82.8 86.9 80.7 82.1 82.3 81.8
Private training provider 86.7 85.9 95.0 94.8 86.0 86.7 90.0 91.3 82.9 88.1 85.9 84.6 85.1 82.9
Professional or industry association 92.4 88.5 100.0 99.3 87.8 71.4 95.0 88.4 95.6 91.0 94.4 83.2 93.3 85.6
Other providers used for training apprentices/trainees
83.6 76.4 90.1 90.7 96.7 86.1 72.6 77.1 76.0 83.9 97.1 86.8 85.4 73.5
Nationally recognised training (Base: all employers using nationally recognised training)TAFE 92.5 86.8 97.1 93.8 87.4 85.5 93.7 81.8 96.4 94.9 91.9 87.1 93.8 85.6
University 98.1 90.1 92.0 91.5 95.4 67.9 96.3 91.5 91.6 99.9 50.4* 99.4 99.3 99.6
Private training provider 94.0 90.5 97.4 95.3 83.1 87.7 89.7 88.8 92.5 93.2 88.4 89.6 90.1 91.5
Professional or industry association 94.2 96.0 97.7 98.9 86.9 84.7 86.8 91.5 90.3 97.4 93.5 92.1 94.8 92.8
Other providers used for nationally recognised training
100.0 96.6 94.6 95.7 96.9 91.0 82.9 94.3 100.0 96.9 100.0 96.4 100.0 96.8
Unaccredited training (Base: all employers using unaccredited training)TAFE 99.6 99.5 100.0 99.3 99.6 98.9 95.6 100.0 99.4 99.4 100.0 98.9 99.6 99.5
Private training provider 99.1 96.9 96.0 92.2 91.6 88.2 90.4 95.0 96.0 91.6 93.7 90.7 95.0 97.2
Professional or industry association 97.9 97.9 94.8 97.3 88.3 87.5 88.1 82.2 98.2 94.5 88.5 89.7 94.3 94.9
Supplier/manufacturer of equipment and/or product
95.9 97.1 93.3 97.4 95.6 94.5 86.5 91.3 96.6 99.0 85.5 92.9 96.9 96.3
Other providers used for unaccredited training
98.1 99.0 87.1 99.2 93.5 80.5 98.9 98.9 96.9 99.0 86.4 90.0 98.3 94.7
For notes on tables, see page 24.
24 Australian vocational education and training statistics

Table 16 Number of interviews achieved by employer characteristic, 2015 and 2017 (%)
2015 2017
State
New South Wales 2 392 1 706Victoria 1 697 1 248Queensland 1 411 1 041South Australia 866 896Western Australia 1 041 899Tasmania 611 904Northern Territory 490 679Australian Capital Territory 702 649
Employer sizeSmall 3 905 4 991Medium 2 780 1 887Large 2 525 1 144
IndustryAgriculture, forestry and fishing 404 351Mining 240 148Manufacturing 463 498Electricity, gas, water and waste services 309 158Construction 1 019 1 316Wholesale trade 511 371Retail trade 536 550Accommodation and food services 504 476Transport, postal and warehousing 385 283Information media and telecommunications 636 222Financial and insurance services 514 313Rental, hiring and real estate services 328 307Professional, scientific and technical services 763 827Administrative and support services 488 305Public administration and safety 315 221Education and training 350 271Health care and social assistance 635 485Arts and recreation services 232 191Other services 578 729
Total 9 210 8 022For notes on tables, see page 24.
Employers’ use and views of the VET system 2017
25

TermsFor more information, please see Technical notes, Terms and definitions, and other supporting documents at <https://www.ncver.edu.au/data/collection/employers-use-and-views-of-the-vet-system>.Apprentice or trainee is a person who undertook a contract of training with an employer and a training provider.Employees are defined as wage and salary earners who received pay for any part of the last pay period. This includes employees on paid or prepaid leave, employees who commenced or terminated employment during the pay period, and employees on workers’ compensation who continue to be paid through the payroll. It excludes persons paid solely by commission, without a retainer, wage or salary. Employer refers to an organisation operating within Australia that employed at least one employee in the 12 months preceding the interview. Employer size is defined as: small: an employer with between 1 and 9 employees medium: an employer with between 10 and 99 employees large: an employer with 100 or more employees.Industry is defined by the Australian and New Zealand Standard Industry Classification (ANZSIC), 2006 Edition. This is an Australian Bureau of Statistics classification that identifies the industry or principal activity in which an employer is engaged. (ABS Catalogue No. 1292.0, February 2006). Industry is defined according to survey responses.Informal training refers to training that usually occurs on the job through interactions with co-workers as part of the day-to-day work.Nationally recognised training is a program of training leading to vocational qualifications and credentials that are recognised across Australia delivered by registered training organisations (RTOs).Registered training organisation is a training provider registered by the Australian Skills Quality Authority (ASQA) or in some cases, a state or territory registering and accrediting body, to deliver training and/or conduct assessment and issue nationally recognised qualifications in accordance with the Australian Quality Training Framework or the VET Quality Framework. State/territory refers to the state or territory where the employer’s head office is located.TAFE refers to technical and further education institutes.Unaccredited training is training that does not lead to a nationally recognised qualification. The training activity must have a specified content or predetermined plan designed to develop employment-related skills and competencies.Vocational education and training (VET) is post-compulsory education and training that provides people with occupational or work-related knowledge and skills. VET also includes programs that provide the basis for subsequent vocational programs.Vocational qualifications are nationally recognised completed qualifications. These qualifications are delivered by registered training organisations such as TAFE institutes, private providers and vocational divisions of universities.
26
Australian vocational education and training statistics

Notes on tablesData treatment* The estimate has a relative standard error equal to or greater than 25% and should be used with caution.na Not applicablenp Not published. NCVER does not report on estimates based on five or fewer respondents
because the estimates are unreliable.Definitions and derivations1 Nationally recognised training is defined as nationally recognised training that is not part of an
apprenticeship or traineeship. For the purposes of this survey, employers with apprenticeships and traineeships are reported separately.
2 Satisfied was rated as a 4 or 5 on a 5-point scale. It includes employers who were satisfied and very satisfied. Dissatisfied was rated as a 1 or 2 on a 5-point scale and includes employers who were dissatisfied or very dissatisfied.
3 Other providers used for training apprentices and trainees include universities, suppliers/manufacturers of equipment/product or providers not elsewhere defined.
4 Other providers used for nationally recognised training include suppliers/manufacturers of equipment/product or providers not elsewhere defined.
5 Other providers used for unaccredited training include universities or providers not elsewhere defined.
Employers’ use and views of the VET system 2017
27