Embed Size (px)
Citation preview

Domain B: SkillsDimension 3. Skill in Planning
The following lesson was prepared for 7th graders at a private middle school. The students had
reviewed the areas of two-dimensional shapes in a previous lesson. The aim of this lesson was to
illustrate how a third dimension creates a three-dimensional shape, which takes up space or
volume. The shape is dependent on the base shape, or “B” in the formula for Volume, Bh, where
“B” is the area of the base shape. The lesson is intended to engage the students in a hands on
kinesthetic activity which encourages learning through discovery.
7th Grade MathCCLS: 7.G.3, 7.G.4Materials: paper, pencils, worksheet, nets, scissors, tape, Smartboard, Document Camera, calculatorsAim: How can we use nets to determine the base shape of a three-dimensional shape?Student’s objective/Instructional Goals: Students will be able to identify the Base of a three-dimensional shapeVocabulary: NetsWarm-up Activity: Describe what you see on the board (the Smartboard has a net of a rectangular prism)Guided Practice:Teachers and students discuss responsesProcedure:1. Teacher models how to construct cubes, rectangular prisms and triangular prisms from their nets2. Teacher models how to identify the base shape and use the dimensions of the base shape to calculate the “B” in the volume formula.3. Teacher models how to find the height of the prism by identifying the dimension that is not part of the formula for the base shape.Independent Practice:1. Students construct 3-D shapes from their nets2. Students complete their worksheetClass Share: Students share their workExit Question: Point to the dimension that represents the height of your three-dimensional shapeHomework: Study worksheet for your test
As the lesson indicates, the students were required to analyze each “net” that related to a
three-dimensional shape.

The student responses indicate that their conceptual understanding improved after the
second activity, which involved the students actively engaged in the construction and
deconstruction of a three-dimensional shape. Each student’s construction was their own creation.
It was important for the student to understand that the base shape of a prism extended from the
middle of the net. Some students referred to the extension as “wings”. The dimensions of this
shape were the dimensions of the base. The “height” of the three dimensional shape was the
dimension that was not part of the base shape in the net.
The language function which showed a significant improvement was "explain". The
students were able to explain their work and develop different scenarios based on their projects.
The improvement in their conceptual understanding enabled them to perform calculations with
more fluency and use math language more effectively.
The most telling difference I observed was the students’ ability to have their individual
voices heard. This was evident when they were presented their work to their peers. Their
assessment grades were considerable higher for their projects compared to their test outcomes.
They were able to make connections and use appropriate math language. Teachers must be
cognizant of the different learning profiles of their students and must incorporate a variety of
instructional formats and individualized assignments.
Dimension 3 – Artifacts 1 – 6. The following artifacts represent the nets the students were given. One student was creative and illustrated “faces” on each face. The worksheets represent their reflections, after constructing the three-dimensional shapes from the nets.

Domain B: Skills

Dimension 4: Skill in Teaching
The learning objective for the lesson was:Students will be able to calculate the z-value and solve normal distribution word problems using a formula and/or calculator functions.
The Common Core Learning Standard for the lesson is:Interpreting Categorical and Quantitative Data S-IDSummarize, represent, and interpret data on a single count ormeasurement variable4. Use the mean and standard deviation of a data set to fit it to a normaldistribution and to estimate population percentages. Recognize thatthere are data sets for which such a procedure is not appropriate.Use calculators, spreadsheets, and tables to estimate areas under thenormal curve.
The Mathematical Practice was: 5. Use appropriate tools strategically. Mathematically proficient students consider the available tools when solving a mathematical problem. These tools might include pencil and paper, concrete models, a ruler, a protractor, a calculator, a spreadsheet, a computer algebra system, a statistical package, or dynamic geometry software… For example, mathematically proficient high school students analyze graphs of functions and solutions generated using a graphing calculator …When making mathematical models, they know that technology can enable them to visualize the results of varying assumptions, explore consequences, and compare predictions with data.
Summary:
The students were learning about the Standard Normal Distribution Curve. They were using the
formula to calculate the standard score. After obtaining the z-values, they used the standard
normal distribution table to find the probability under the curve for a given random variable.
The following is the problem they were asked to solve:
The average daily jail population in the United States is 706,242. If the distribution is normal and the standard deviation is 52,145, find the probability that on a randomly selected day, the jail population is
a. Between 705,000 and 720,000
Source: New York Times Almanac

The following Artifact represents one student’s individual work:
The following artifact represents group work. The students worked together in peer groups and then presented their work on the dry erase board:

The students were familiar with using the calculator to graph box plots and histograms. They
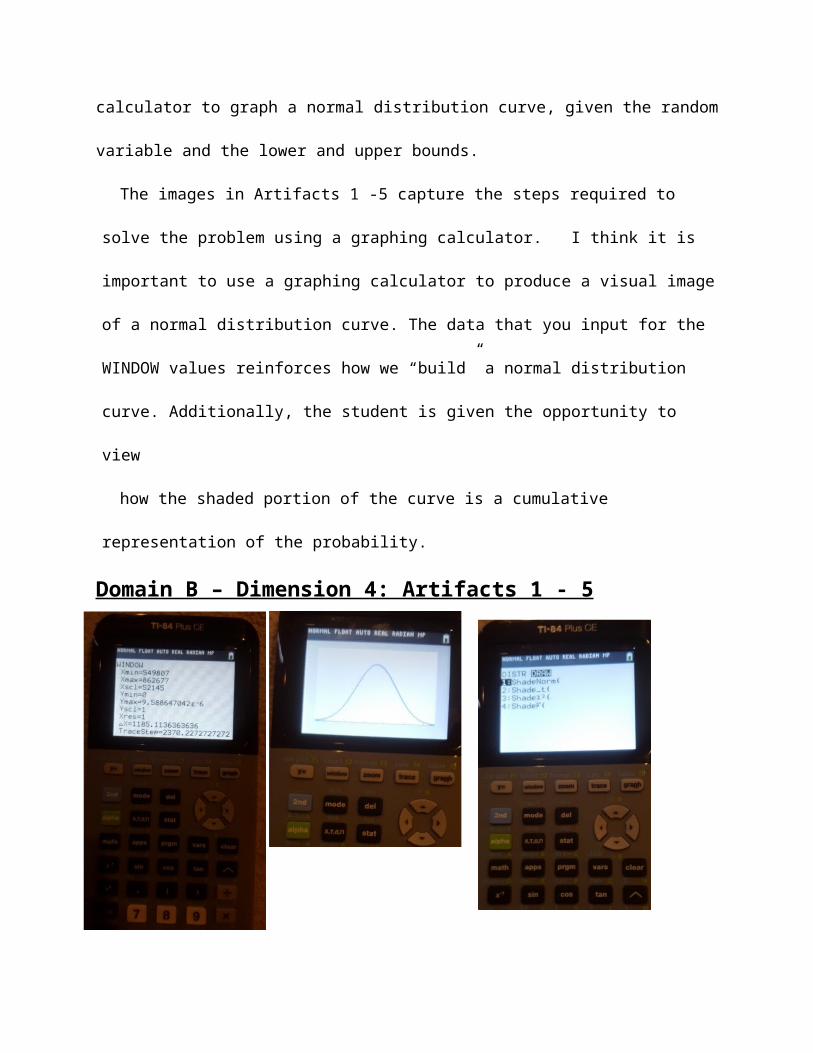
were taught how to use the calculator to graph a normal distribution curve, given the random
variable and the lower and upper bounds.
The images in Artifacts 1 -5 capture the steps required to solve the problem using a graphing
calculator. I think it is important to use a graphing calculator to produce a visual image of a
normal distribution curve. The data that you input for the WINDOW values reinforces how we
“build” a normal distribution curve. Additionally, the student is given the opportunity to view
how the shaded portion of the curve is a cumulative representation of the probability.
Domain B – Dimension 4: Artifacts 1 - 5

Domain B: Skills
Dimension 5.Skill in Assessing
As an educator, I consider myself fortunate to have the opportunity to influence the
learning experience of students. I would be remiss if I did not include that I have had the
exceptional privilege of working with students at many different ability levels. I have worked
with teachers with varied learning styles, some that I embraced and others that inspired me to
think about making changes. This is particularly true when the teaching skills is assessing.
I have worked in Integrated Collaborative Teaching classrooms, where struggling
students learn in the same classroom as their mainstream peers. Although there are a variety of
coteaching designs, I have discovered that struggling math students continue to struggle.
Students with learning disabilities are usually limited to the accommodations stated in their IEP
(Individualized Education Program). These accommodations usually include extra time, separate
location, use of calculator, repeating directions and seldom, if ever, include Alternate
Assessments. This type of assessment is used more frequently in special schools.
Working as a mathematics teacher in a special school gave me the unique experience of
using many different modalities of assessment. As shown in artifact 3, the student performed
extremely well on his assessment. This was not surprising; he is an exceptional math student
whose is particularly adept with formulas and calculations.
Artifact 4 and 5 is an alternate assessment of the same skill. This student has severe
learning disabilities and struggles with memory. He is creative and uses visual representations to
describe concepts.
Domain B. Dimension 5: Artifact 3
Artifact 5
Artifact 4
Domain B: Skills

Dimension 6. Skill in Developing Caring Learning Environments
The teacher projects an image of a balanced and unbalanced scale at the beginning of the
lesson. She invites the students to compare and contrast the two scales. The students are seated
in a U-shaped configuration. This environment creates an atmosphere that encourages students to
freely communicate their ideas. The teacher is able to see all her students and can approach them
easily within the “U”. The lesson begins from the social language/concrete level and is
connected to the symbolism/formal language, in order to help students master the skill of
understanding proportions.
Video – domdim6rhartofelis


