Embed Size (px)
Citation preview

UNIVERSITY OF OSLOFaculty of Mathematics and Natural Sciences
Exam in MENA3100 Day of exam: 4th May 2019Exam hours: 14:30– 18:30This examination paper consists of 6 pages including 1 appendix page.Permitted materials: Electronic calculator of accepted type and ruler. Make sure that your copy of this examination paper is complete before answering. You can choose if you want to give your answers in Norwegian or English.
Bragg’s law: 2dsinθ = nλ, d-values for cubic structures: d = a/(h2 + k2 + l2)1/2
Exercise 1
Figure 1 shows the silver–cadmium (Ag–Cd) phase diagram.
a) For the isothermal line at 440 °C, identify the three phases involved. What do we call the type of reaction a sample goes through when it crosses the line during cooling? Do the same for the isothermal lines at 590 and 343 °C. (Max 10 p.)
440 °C: (Ag), Ag0.5Cd0.5ht2 and Ag0.5Cd0.5ht1During cooling: Ag0.5Cd0.5ht2 → (Ag) + Ag0.5Cd0.5ht2, eutectoide (norsk: eutektoid)
590 °C: Ag5Cd8, Ag0.21Cd0.79 and LDuring cooling: Ag5Cd8 + L → Ag0.21Cd0.79, peritectic (norsk: peritektisk)
343 °C: Ag0.21Cd0.79 , (Cd) and LDuring cooling: Ag0.21Cd0.79 + L → Ag0.21Cd0.79, peritectic (norsk: peritektisk)
Reaction equations is not asked for.
For each temperature, half score for the phases and half score for the reaction names.
1
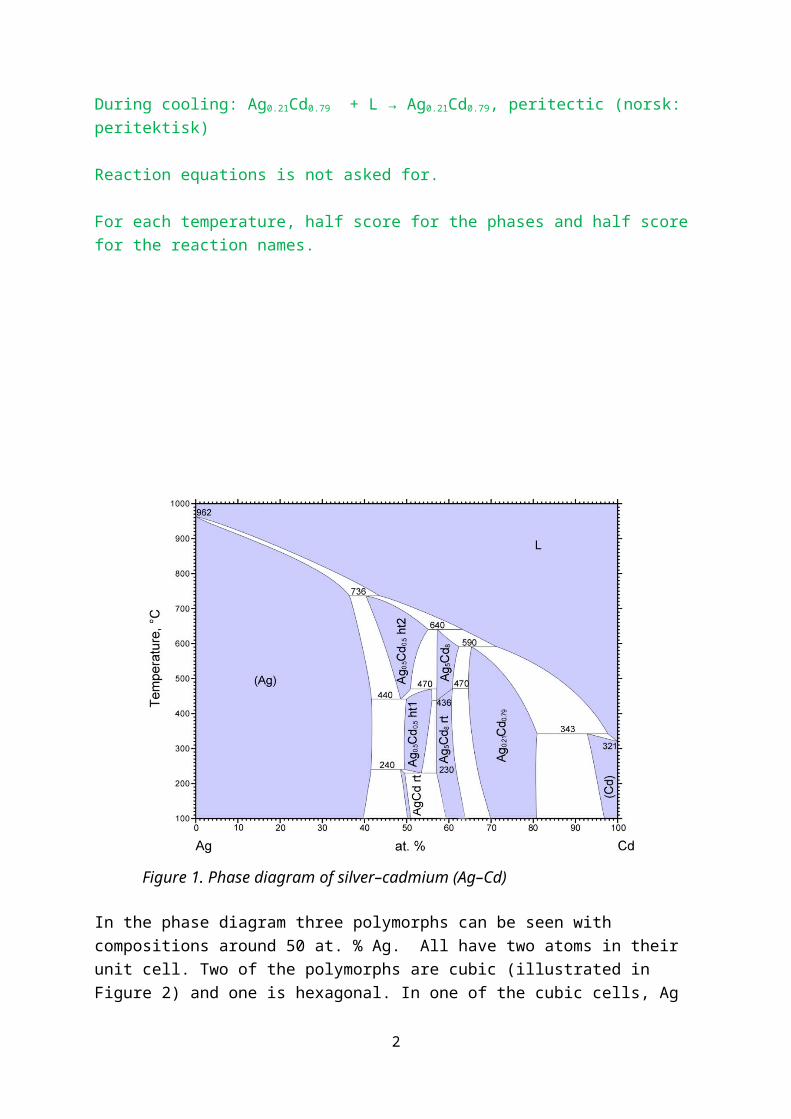
Figure 1. Phase diagram of silver–cadmium (Ag–Cd)
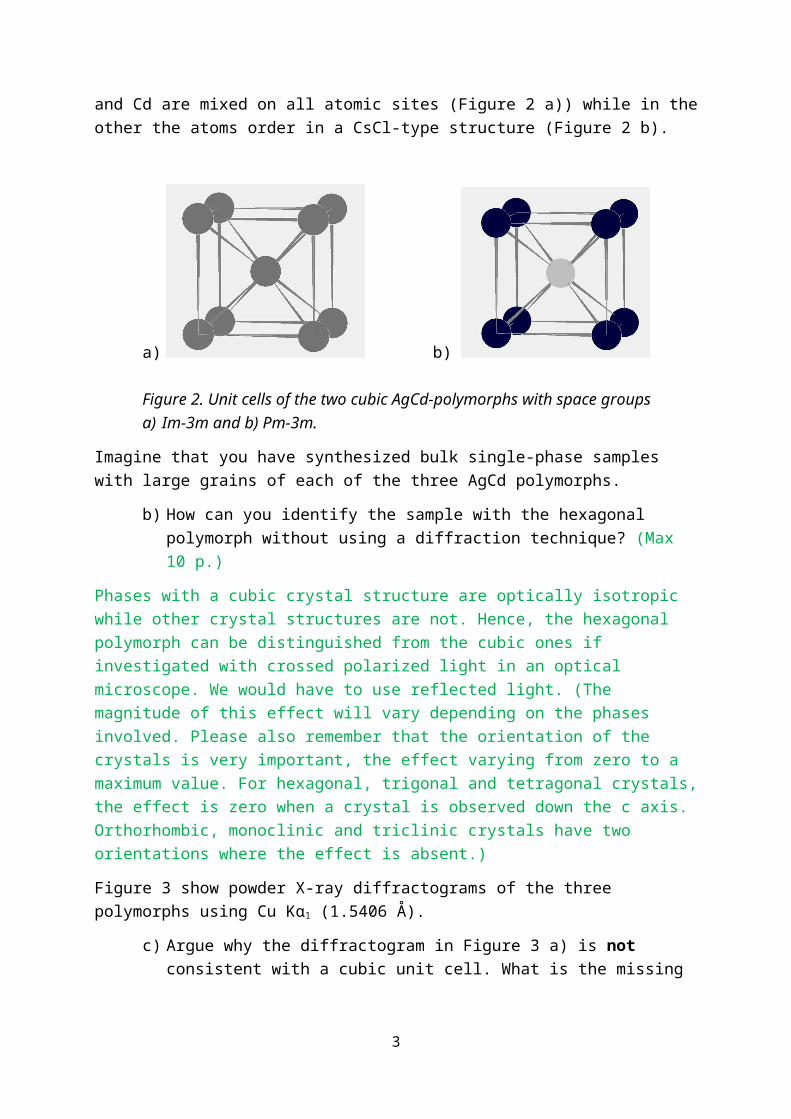
In the phase diagram three polymorphs can be seen with compositions around 50 at. % Ag. All have two atoms in their unit cell. Two of the polymorphs are cubic (illustrated in Figure 2) and one is hexagonal. In one of the cubic cells, Ag and Cd are mixed on all atomic sites (Figure 2 a)) while in the other the atoms order in a CsCl-type structure (Figure 2 b).
a) b)
Figure 2. Unit cells of the two cubic AgCd-polymorphs with space groups a) Im-3m and b) Pm-3m.
Imagine that you have synthesized bulk single-phase samples with large grains of each of the three AgCd polymorphs.
b) How can you identify the sample with the hexagonal polymorph without using a diffraction technique? (Max 10 p.)
2
Phases with a cubic crystal structure are optically isotropic while other crystal structures are not. Hence, the hexagonal polymorph can be distinguished from the cubic ones if investigated with crossed polarized light in an optical microscope. We would have to use reflected light. (The magnitude of this effect will vary depending on the phases involved. Please also remember that the orientation of the crystals is very important, the effect varying from zero to a maximum value. For hexagonal, trigonal and tetragonal crystals, the effect is zero when a crystal is observed down the c axis. Orthorhombic, monoclinic and triclinic crystals have two orientations where the effect is absent.)
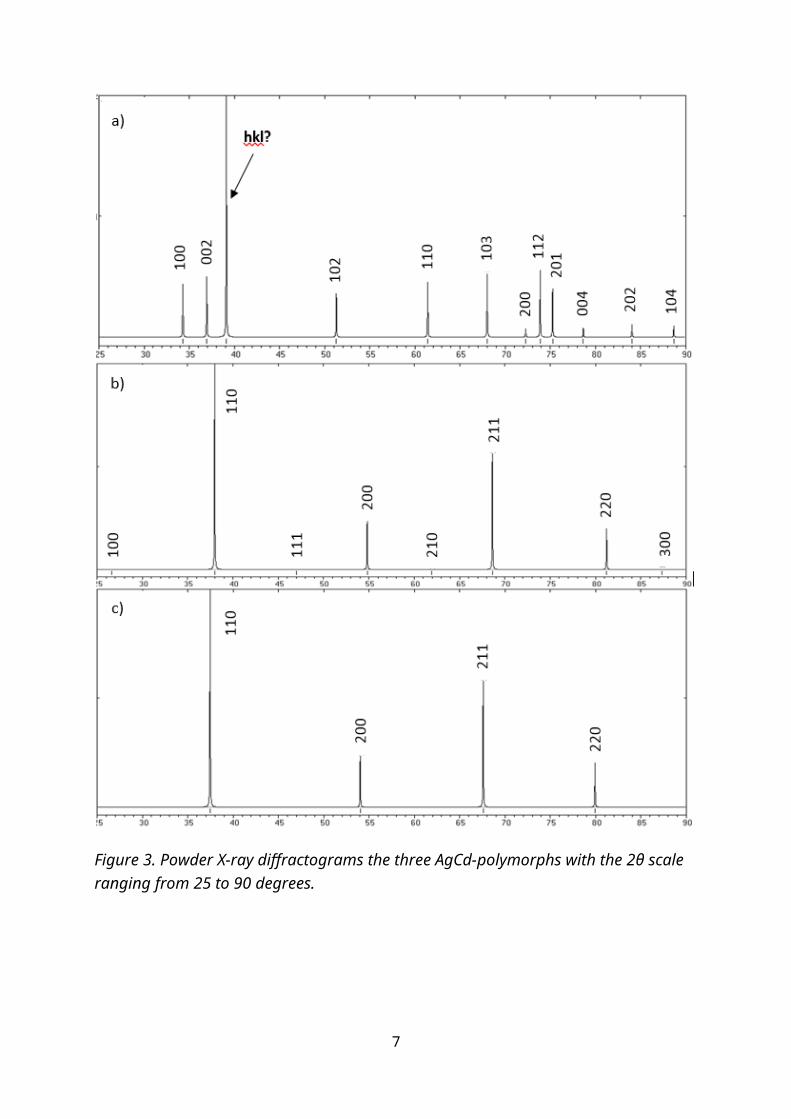
Figure 3 show powder X-ray diffractograms of the three polymorphs using Cu Kα1 (1.5406 Å).
c) Argue why the diffractogram in Figure 3 a) is not consistent with a cubic unit cell. What is the missing index of the marked diffraction peak in Figure 3 a)? (Max 10 p.)
In cubic unit cells the planar distances of (100), (010) and (001) are equal and it follows that the corresponding diffraction peaks overlap (multiplicity). This is not consistent with the indexing in Figure 3 a). (The relative distances between the peaks is also characteristic for cubic crystals (be that P, I or F). This is because they only relies on one parameter, a. An experienced user can therefore often tell that a diffractogram is from a cubic phase just by looking at it.)
By inspecting the indexing of the other reflections in the diffractogram one can logically deduce that hkl for the marked diffraction peak is 101. (Arguments based on the relative intensity cannot be used.)
It is also possible to come to the same conclusion if one a) calculate the d-value corresponding to the unindexed diffraction peak, b) calculate the θ value corresponding to d/2 (this is the d-value of the (2h,2k,2l) plane, the second order reflection), c) identify which reflection is located at this 2θ value (~84°, 202). It can be concluded that the missing indexes of the reflection with double the d-value must be 2/2 0/2 2/2. That is 101.
The structure factor can be expressed as: Fg=Fhkl=Σfj exp(2πi(huj+kvj+lwj))
d) What do the symbols represent and what is the general expression of Fg for the primitive cubic polymorph? (Max 10 p.)
The symbols g and hkl represent a given reflection from a corresponding (hkl) plane, fj represent the atomic scattering factor for element j and uj,vj,wj represents the coordinates of atom j in the unit cell.
In the primitive cubic polymorph we have two atoms in the unit cell (Cd and Ag). One of them is located in position 0,0,0 and the other one in ½,½,½ (both descriptions are equally good). The general expression becomes:
Fg = fA exp(2πi(0+0+0)) + fB exp(2πi½(h+k+l)) = fA + fBexp(πi(h+k+l))
3
The diffractogram in Figure 3b) show some weak reflections (100, 111, 210 and 300) that are absent in figure 3 c).
e) Why is the diffraction intensity of the 100 reflection very weak in Figure 3 b)? (max. 10 p.)
The structure factor for the 100 reflection (and 010, 001) is: F100 = fA – fB. (either fCd – fAg or fAg – fCd). Ag and Cg have similar, but not the same, X-ray atomic scattering factors as they are neighbors in the periodic table. Hence the structure factor will be small and the intensity of the reflection will be weak.
The same result can also be obtained graphically or by reasoning from the way we deduce Bragg’s law.
a) What is the unit cell size of the largest cubic polymorph? (max. 10 p.)
Comparing the two diffractograms of the cubic polymorphs (figure 3 b and c), the largest cubic polymorph will have corresponding reflections located at lower 2θ values (figure 3 b).
The size of the unit cell can be calculated by using the relationship:
a = d(h2 + k2 + l2)1/2 where the planar distance ‘d’ for a given reflection hkl can be calculated using Braggs law (d = λ/2sinθ). λ is 1.5406 Å and θ for a given reflections can be identified in the diffractogram.
The value if calculated from any peak will result in a lattice parameter of a ~ 3.4 Å. Calculation from more than one peak will usually improve the result, as will the use of high angle peaks. This is not necessary here.
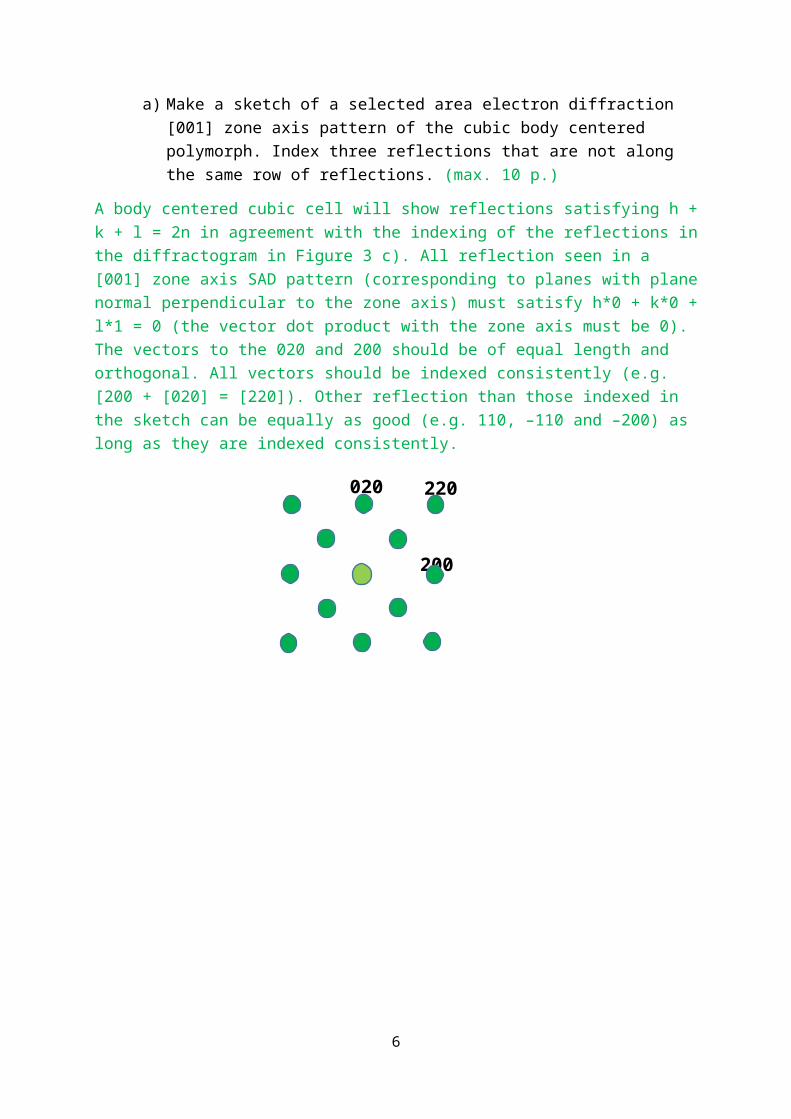
a) Make a sketch of a selected area electron diffraction [001] zone axis pattern of the cubic body centered polymorph. Index three reflections that are not along the same row of reflections. (max. 10 p.)
A body centered cubic cell will show reflections satisfying h + k + l = 2n in agreement with the indexing of the reflections in the diffractogram in Figure 3 c). All reflection seen in a [001] zone axis SAD pattern (corresponding to planes with plane normal perpendicular to the zone axis) must satisfy h*0 + k*0 + l*1 = 0 (the vector dot product with the zone axis must be 0). The vectors to the 020 and 200 should be of equal length and orthogonal. All vectors should be indexed consistently (e.g. [200 + [020] = [220]). Other reflection than those indexed in the sketch can be equally as good (e.g. 110, –110 and –200) as long as they are indexed consistently.
4
020
200
220
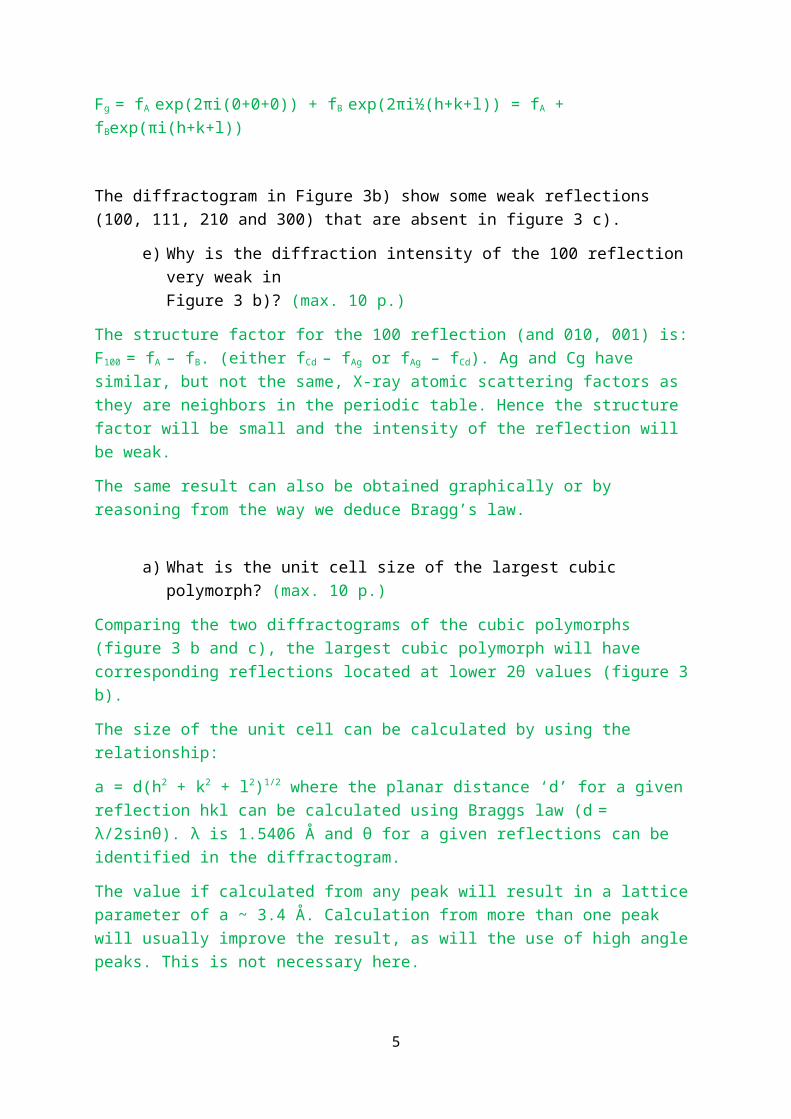
Figure 3. Powder X-ray diffractograms the three AgCd-polymorphs with the 2θ scale ranging from 25 to 90 degrees.
5
Exercise 2
a) When talking about thermal analysis, what do the abbreviations TG and DTG stand for? (Max 10 p.)
Thermal gravimetry (norsk: termisk gravimetri) Derivative thermal gravimetry (derivativ termisk gravimetri)
b) Make a schematic drawing of an instrument for thermal analysis. (max. 10 p.)
This ended up as a very open question. A drawing of any instrument for thermal analysis will do. The figure should show the working principles with regard to the measurement of the property being investigated.
Schematic drawing of a TG system. The balance arm is often kept horizontal by applying current through a coil changing the drag on a counter weight. Often there is a controlled atmosphere or vacuum in the chamber. Of cause the control system must be hooked up to the rest of the equipment, partly with sensors and partly to control the system.
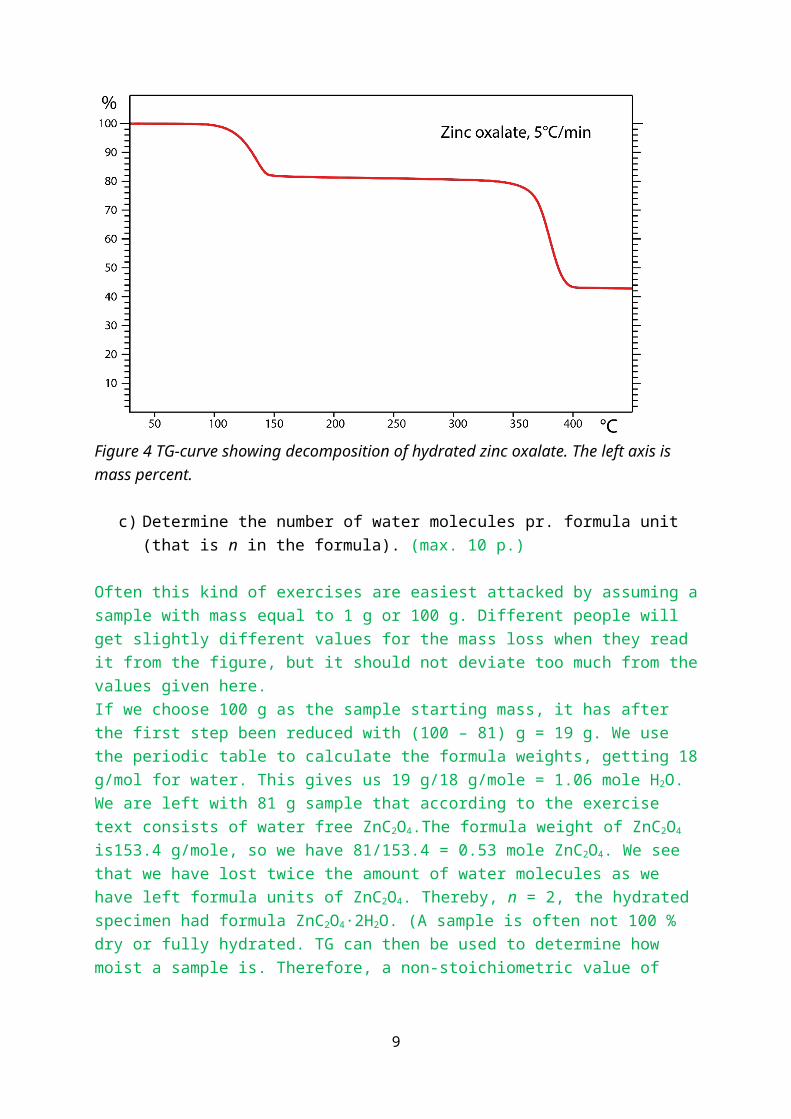
Figure 4 shows a TG-curve from heating zinc oxalate, ZnC2O4∙nH2O, in argon atmosphere. At around 130 °C H2O is lost and at around 380 °C the anion C2O4
2– decomposes.
Figure 4 TG-curve showing decomposition of hydrated zinc oxalate. The left axis is mass percent.
6
c) Determine the number of water molecules pr. formula unit (that is n in the formula). (max. 10 p.)
Often this kind of exercises are easiest attacked by assuming a sample with mass equal to 1 g or 100 g. Different people will get slightly different values for the mass loss when they read it from the figure, but it should not deviate too much from the values given here.If we choose 100 g as the sample starting mass, it has after the first step been reduced with (100 – 81) g = 19 g. We use the periodic table to calculate the formula weights, getting 18 g/mol for water. This gives us 19 g/18 g/mole = 1.06 mole H2O. We are left with 81 g sample that according to the exercise text consists of water free ZnC2O4.The formula weight of ZnC2O4 is153.4 g/mole, so we have 81/153.4 = 0.53 mole ZnC2O4. We see that we have lost twice the amount of water molecules as we have left formula units of ZnC2O4. Thereby, n = 2, the hydrated specimen had formula ZnC2O4∙2H2O. (A sample is often not 100 % dry or fully hydrated. TG can then be used to determine how moist a sample is. Therefore, a non-stoichiometric value of e.g. 1.76 should not come as a surprise when analyzing real samples.)
d) What is the final solid decomposition product? (max. 10 p.)
Before the final decomposing step we know from exercise c) that we have 0.53 mole ZnC2O4.The exercise text tells us that the anion C2O4
2– decomposes during the final decomposition step and it follows that the number of zinc atoms left after the final step is 0.53 mole. From the TG-curve we find that the weight of the final product is 43 g. It follows that the formula weight of the final product is: 43 g/0.53 mole = 81 g/mol. The formula weight of zinc is 65.4 g/mol so we are left with 15.6 g/mole ≈ 16 g/mol. This fits with oxygen, giving ZnO as the final product.
Exercise 3
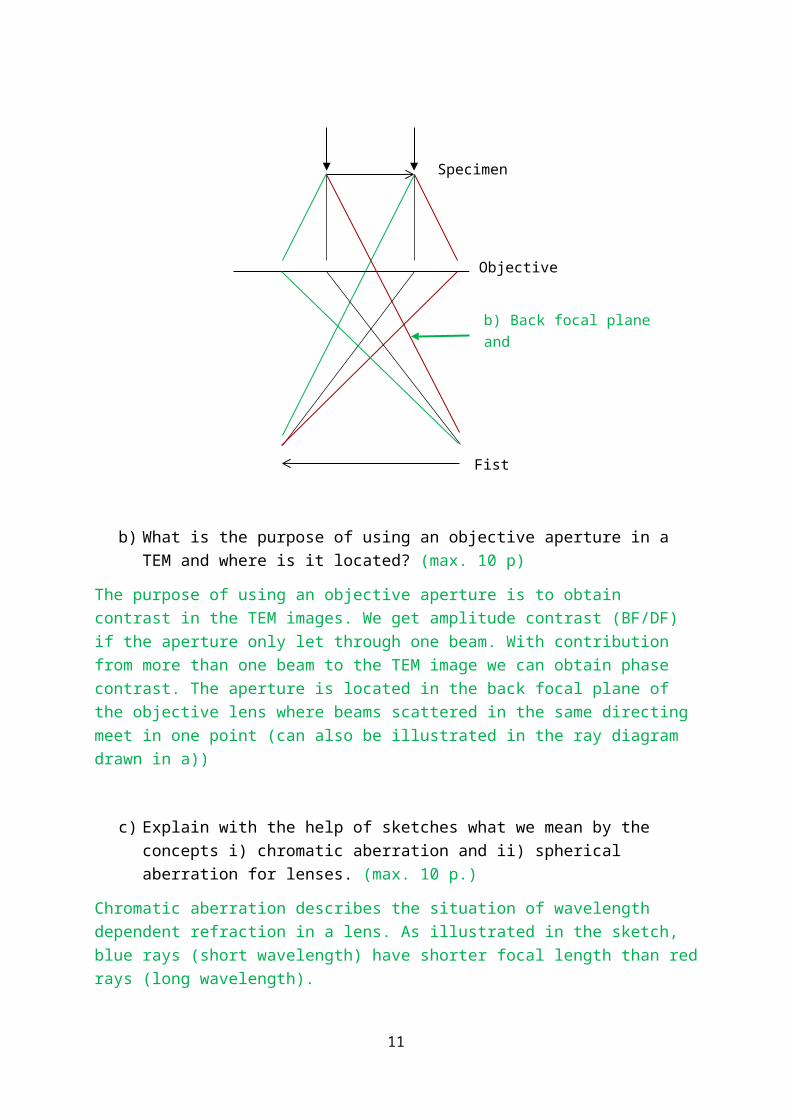
In the TEM column a set of lenses and apertures can be found.a) Make a ray diagram from the TEM specimen and down to the first image
plane. (max 10 p.)
Evaluated: A) The ray diagram show the position of the specimen, lens (objective) and first image plane. B) Rays going through the center of the objective lens do not bend. C) Parallel beams below sample meet in one point in the back focal plane. D) Beams from one position in the specimen meet in one point in the image plane. The figure may vary, but the criteria above must be fulfilled.
7

b) What is the purpose of using an objective aperture in a TEM and where is it located? (max. 10 p)
The purpose of using an objective aperture is to obtain contrast in the TEM images. We get amplitude contrast (BF/DF) if the aperture only let through one beam. With contribution from more than one beam to the TEM image we can obtain phase contrast. The aperture is located in the back focal plane of the objective lens where beams scattered in the same directing meet in one point (can also be illustrated in the ray diagram drawn in a))
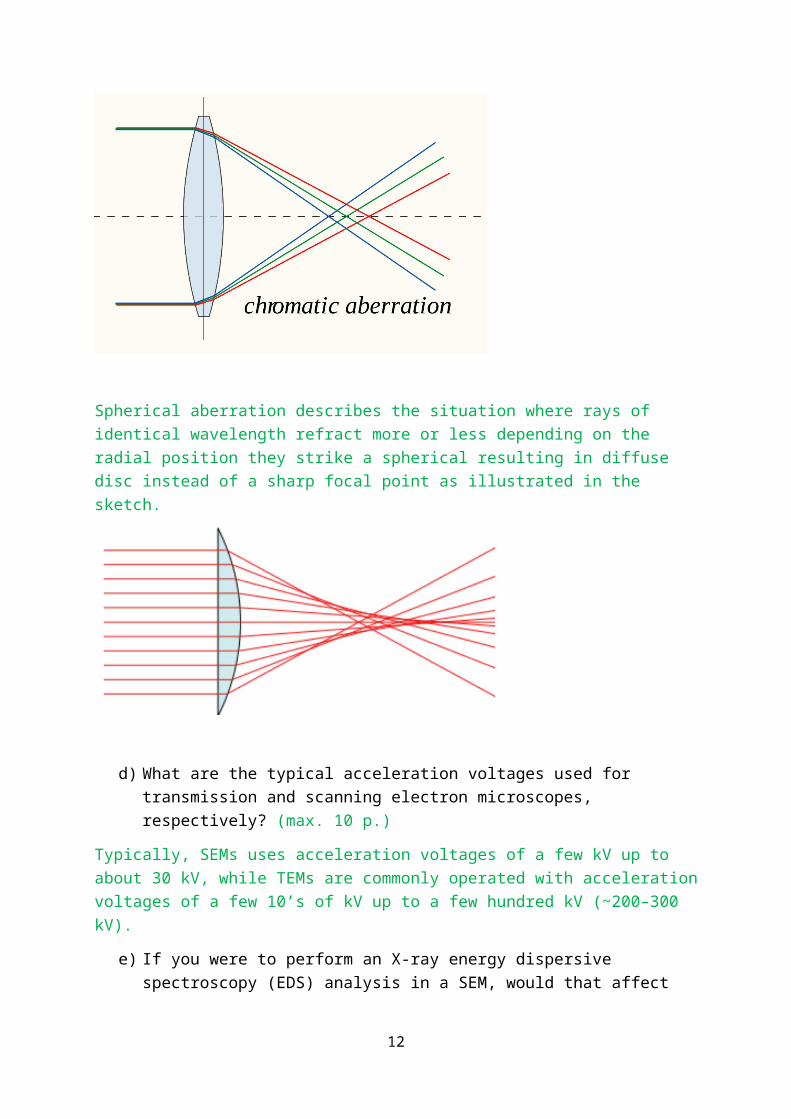
c) Explain with the help of sketches what we mean by the concepts i) chromatic aberration and ii) spherical aberration for lenses. (max. 10 p.)
Chromatic aberration describes the situation of wavelength dependent refraction in a lens. As illustrated in the sketch, blue rays (short wavelength) have shorter focal length than red rays (long wavelength).
8
Specimen
Objective lens
Fist image plane
b) Back focal plane and
position of objective apertures.
Spherical aberration describes the situation where rays of identical wavelength refract more or less depending on the radial position they strike a spherical resulting in diffuse disc instead of a sharp focal point as illustrated in the sketch.
d) What are the typical acceleration voltages used for transmission and scanning electron microscopes, respectively? (max. 10 p.)
Typically, SEMs uses acceleration voltages of a few kV up to about 30 kV, while TEMs are commonly operated with acceleration voltages of a few 10’s of kV up to a few hundred kV (~200–300 kV).
e) If you were to perform an X-ray energy dispersive spectroscopy (EDS) analysis in a SEM, would that affect which acceleration voltage you optimally would use? Why or why not? (max. 10 p.)
Yes, it would affect the acceleration voltage optimally used. One need high enough energy to excite all the elements present in the sample to generate representative X-ray signals from all the elements present for compositional analysis with EDS. Heavier elements will have peaks at low energy, but there are often severe problems with overlap at low energy (less than 1 keV). The use of L- or K-peaks is therefore
9

often to be preferred. Typically the acceleration voltage should be ~1.5–2 times higher than the highest X-ray energy used in the EDS analysis.
Another thing to consider when choosing accelerating voltage is the volume in which the signal is generated. If we seek information about the composition of minute particles or thin surface films, the smallest useful acceleration voltage should be used.
Exercise 4
a) What is the difference between the energy transfer of an X-ray to an atom relative to the energy transfer from an electron to an atom? (max. 10 p.)
An X-ray will transfer all its energy to an atom (the atom absorbs the X-ray when Compton scattering is disregarded) while electrons can lose/transfer parts of its energy (the amount depend on the excitation process).
b) Describe the de-excitation processes that can take place after an atom has been ionized by radiation. (max. 10 p.)
When an atom is ionized it can go back to its ground state in several steps. When an electron at a higher energy state falls into a core hole the energy difference can be released at by sending out an X-ray or out an outer electron (Auger electron).
c) What is the three letters XPS an abbreviation for? What is the principle of XPS? (max. 10 p.)
XPS: X-ray photo electron spectroscopy. (3 p.) When performing XPS, an X-ray probe (typically AlKα or MgKα) is illuminating a specimen surface and photoelectron and Auger electrons are produced (as illustrated in the sketch). Due to their low energy they escape from a depth of ~5 nm (book: 10 nm) or less. The kinetic energy of the electrons escaping the surface is analyzed and a typical XPS spectrum is a plot of intensity versus binding energy. The method gives chemical and electronic state information.
10
d) What does the equation Ek = hν – (Eb + Φ) describe? (max. 10 p.)
The equation is found in the theory of XPS and describes the relationship between the kinetic energy of a photoelectron (Ek), the energy of the photons irradiating the sample (hν), the binding energy (Eb) of the electron prior to the excitation process, and Φ which depend on the sample material and spectrometer
e) What is the three letters STM an abbreviation for? What is the principle behind STM? (max. 10 p.)
STM: Scanning tunneling microscopy. STM use a conducting tip (tungsten or Pt-Ir alloys) as probe when scanning over a surface. Ideally, the probe should have one atom at the tip to obtain images with atomic resolution. There are four operational modes in the STM: constant current, constant height, spectroscopic, and manipulation mode. The probe is positioned with sub-Ångstrom resolution using piezoelectric actuators.
f) Describe the three modes of operation for STM and what kind of information or work each mode does. (max. 10 p.)
The book mentions four modes of operation (constant current, constant height, spectroscopic, and manipulation mode.) while the lectures mentioned three (imaging, spectroscopic, and manipulation mode.) where the two first modes in the book are treated together due to their functionality.
In imaging mode the probe is scanned over the surface while monitoring the tunneling current. In constant current mode, the height of the probe over the surface is maintained at constant level using the piezoelectric actuators through a feedback loop. In constant height mode, the probe is kept at fixed height position and the distance to the substrate is calculated by noting the variations in the tunneling current and relating it to the exponential dependence of the current with distance to sample. The latter mode puts severe constraints on the flatness of the sample.
11
In spectroscopic mode the probe is kept still while the potential is scanned from negative to positive state, or in the reverse mode. In such manner the electronic states of the sample are probed by monitoring changes in the current with potential. The derivative of the current with potential provides the shape of the density of state of the sample.
In manipulation mode, the probe is used to poke on individual atoms on the surface to move them into a desired position. The sample must be cooled so that the atoms does not diffuse out due to thermal vibrations.
12
Appendix
13