Embed Size (px)
Citation preview

Name ________________________________________________________ Period __________ Earth Science
Solar Energy Unit Tracking SheetLearning Target Activity Date Target was Taught in Class
TEST PACKET DUE
Pages Completed Total Score
32 Pages Completed 10
29-31 Pages Completed 9
25-28 Pages Completed 8
20-24 Pages Completed 7
20-24 Pages Completed 6
16-19 Pages Completed 5
12-15 Pages Completed 4
9-11 Pages Completed 3
6-8 Pages Completed 2
1-5 Pages Completed 1
No Pages Completed/Not Turned In 0
1 Page Complete

Atmosphere Thinking SheetDate Question Answer
2 Page Complete

Atmosphere Thinking SheetDate Question Answer
Getting to Know You - Solar Energy Budget
3 Page Complete

Blast to the Past - Using the following words, fill in the blanks below:
Visible LightUltravioletConductionScattering
ElectromagneticRadioConvectionReflection
InfraredGammaRadiationAbsorption
1. ________________________________ is the transfer of heat (thermal energy) by collisions between particles of matter.
2. ________________________________ is the transfer of heat (thermal energy) by movement in a fluid in which warmer molecules rise and colder molecules sink.
3. _______________________________ is the transfer of heat (thermal energy) without requiring a medium to travel through and is carried by a wave.
4. _______________________________ is the process of radiant energy bouncing off an object.
5. _______________________________ is the process of radiant energy being taken up internally, or assimilated by a substance.
6. _______________________________ is the process that produces rays that travel in all directions.
Earth’s Energy Budget - Using the diagram on your table, predict the hypothesis percentage of where the solar energy goes. Fill out the table below in the hypothesis percentage column. Next in your
4 Page Complete
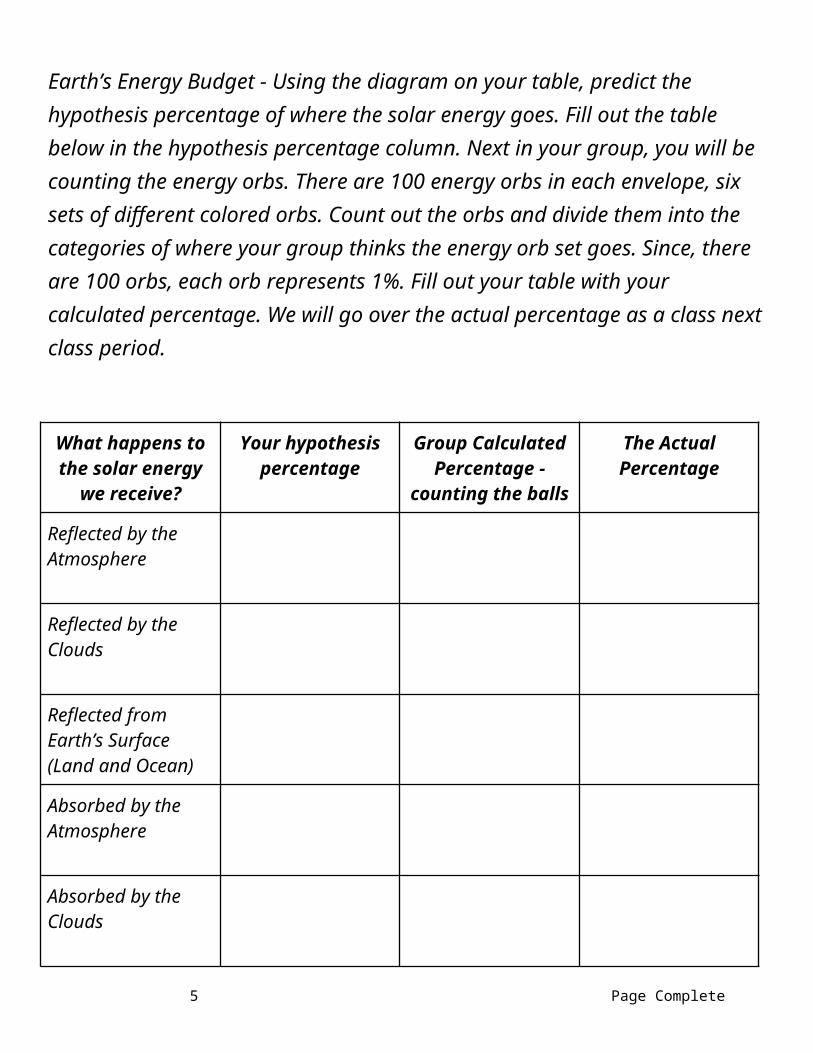
group, you will be counting the energy orbs. There are 100 energy orbs in each envelope, six sets of different colored orbs. Count out the orbs and divide them into the categories of where your group thinks the energy orb set goes. Since, there are 100 orbs, each orb represents 1%. Fill out your table with your calculated percentage. We will go over the actual percentage as a class next class period.
What happens to the solar energy we receive?
Your hypothesis percentage
Group Calculated
Percentage - counting the
balls
The Actual Percentage
Reflected by the Atmosphere
Reflected by the Clouds
Reflected from Earth’s Surface(Land and Ocean)
Absorbed by the Atmosphere
Absorbed by the Clouds
Absorbed by Earth’s Surface (Land and Ocean)
5 Page Complete
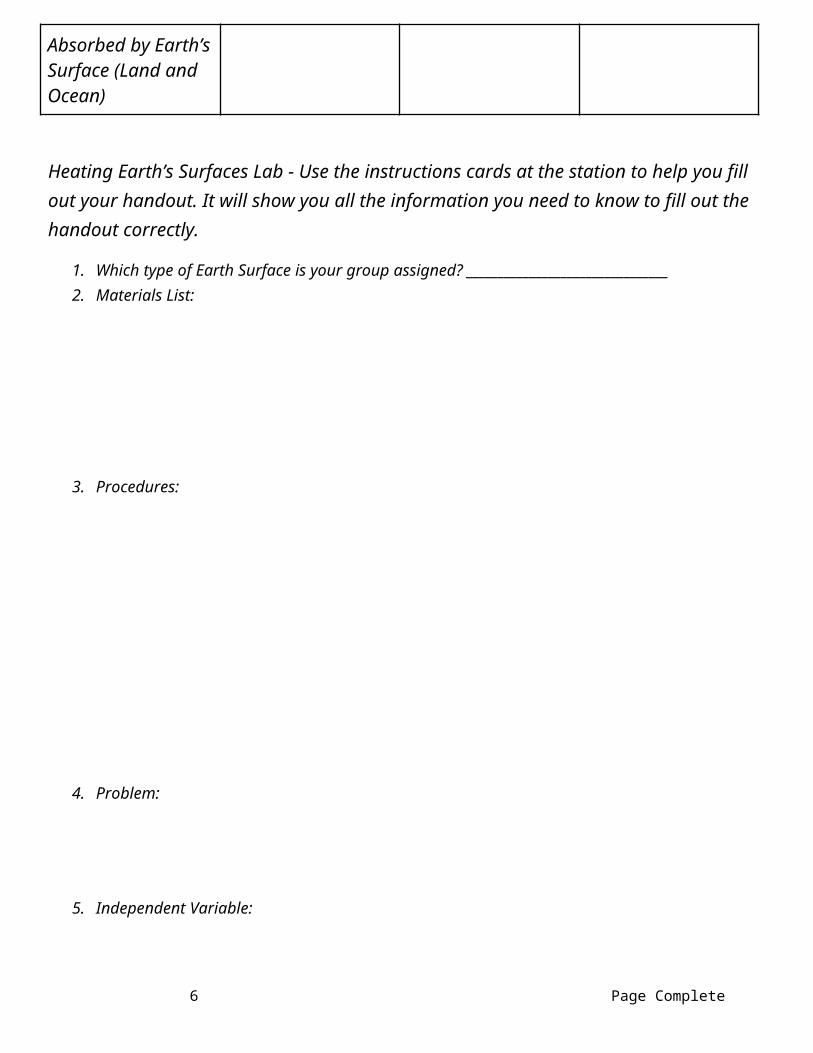
Heating Earth’s Surfaces Lab - Use the instructions cards at the station to help you fill out your handout. It will show you all the information you need to know to fill out the handout correctly.
1. Which type of Earth Surface is your group assigned? ________________________________
2. Materials List:
3. Procedures:
4. Problem:
5. Independent Variable:
6. Dependent Variable:
7. Hypothesis:
8. Data Table
6 Page Complete
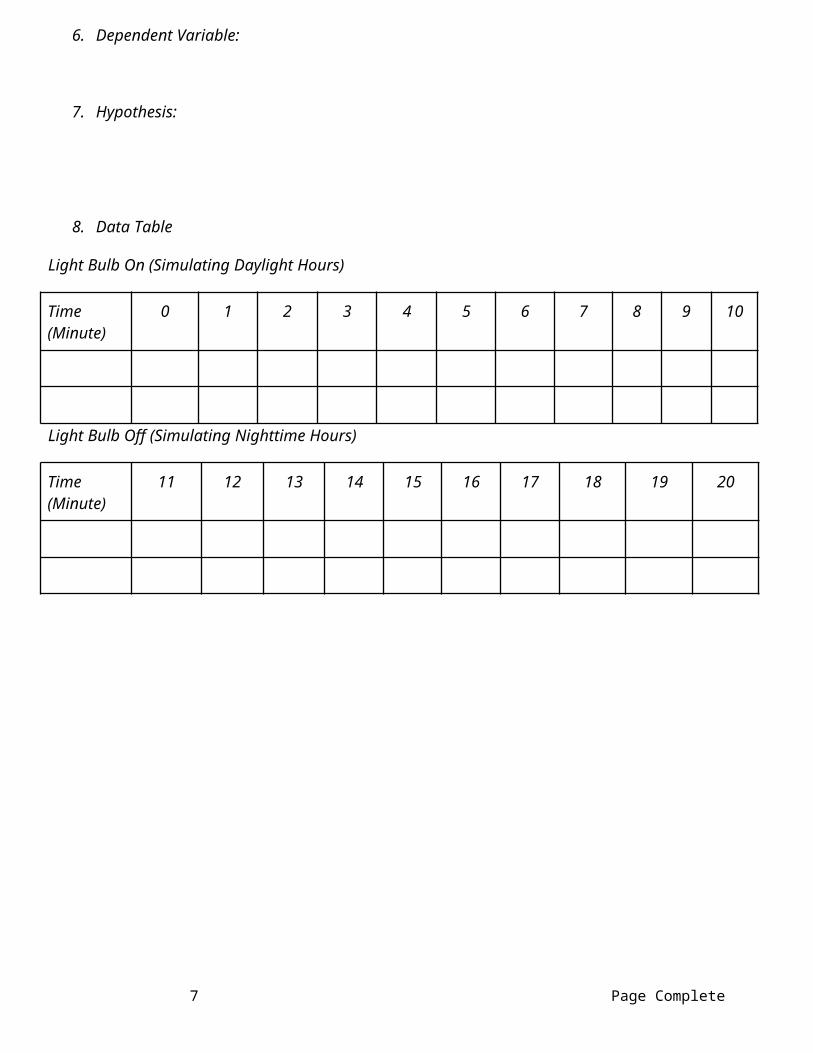
Light Bulb On (Simulating Daylight Hours)
Time (Minute)
0 1 2 3 4 5 6 7 8 9 10
Light Bulb Off (Simulating Nighttime Hours)
Time (Minute)
11 12 13 14 15 16 17 18 19 20
9. Graphing
7 Page Complete
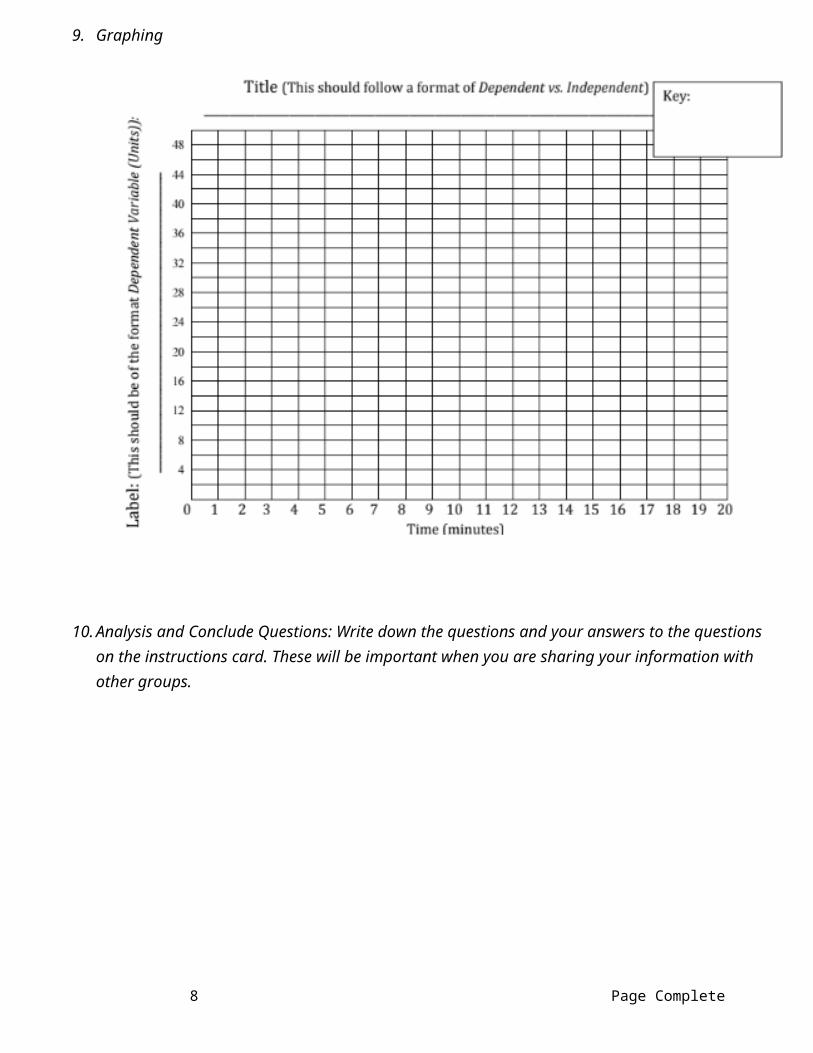
10. Analysis and Conclude Questions: Write down the questions and your answers to the questions on the instructions card. These will be important when you are sharing your information with other groups.
Exploring the Global Energy Budget Big Question: How does Earth “spend” its energy allowance from the sun? Listen to the presentations from the
8 Page Complete
other expert groups and note the key information about each lab in the boxes below.
Summary of the Land vs Water:
Summary of Albedo Lab:
Summary of Clouds Lab:
Solar Energy—Notes
9 Page Complete
Sunlight travels to earth as ______________________________________________.
The Earth deals with three types of heat:
1. Radiation :
2. Convection :
3. Conduction :
We can measure solar radiation in ______________________ (W/m2). Earth receives about _________ W/m2 of energy.
Reflection:
What it is: Drawing:
Absorption:
What it is: Drawing:
Scattering:
What it is: Drawing:
Reflection? Absorption? Scattering?
Role of Atmosphere
Role of Oceans
Role of Dry Land
Role of Ice and Glaciers
Solar Energy Math Analyze the image below and answer the following questions:
10 Page Complete

1. What is the total amount of incoming solar radiation?
2. What percentage of solar radiation is absorbed by Earth’s surface?
3. What percentage of solar radiation is reflected by clouds and atmosphere?
4. What percentage of solar radiation is absorbed by the atmosphere?
5. What is the total amount of outgoing longwave radiation leaving Earth’s atmosphere?
6. Use a blue crayon to circle the areas where the surface is ABSORBING energy (there are two).
7. Use a red crayon to circle the areas where energy is LEAVING the surface (there are three).
8. Looking only at the surface of the earth, what is the total amount of energy being absorbed by the surface?
9. Looking only at the surface of the earth, what is the total amount of energy leaving the surface?
10. Is the amount of energy being absorbed equal to, less than, or more than the amount of energy leaving?
11. Explain why your answer for number 10 is important:
Solar Energy and Greenhouse Gases
11 Page Complete

Go to www.phet.colorado.edu/en/simulation/greenhouse. Run the “Greenhouse Effect” (first tab at the top of the JAVA page) and change the “Atmosphere During…” option. Observe any changes to the thermometer as you change the atmosphere. Continue changing the simulation and making observations, then answer the analysis questions below.
1. How is the temperature TODAY different than during 1750?
2. How is the amount of CO2 in the atmosphere TODAY different than during the ICE AGE?
3. Under “Greenhouse Gas Concentration,” what happens when you slide the scale so there is “Lots”?
4. What happens when there is “None” (greenhouse gas concentration)?
5. How is the simulation on the screen similar to your solar oven? (What part of your solar oven represented the atmosphere and what part represented the land?)
6. How is the simulation on the screen different from your solar oven?
7. Why are scientists concerned that the level of CO2 in the atmosphere is continuing to rise?
Now click “Photon Absorption” at the top of the screen. Experiment with different atmospheric gases.
8. Which gases absorb infrared photons (heat)?
9. Which gases absorb visible photons (light)?
10. Now “Build an Atmosphere” to compare Earth’s atmosphere to Mars’ (these models are not to scale!):
Earth’s Atmosphere:
Fifteen N2, four O2, two H2O, two CO2
Mars’ Atmosphere:
one CO2 molecule, one N2 molecule
Observations: Observations:
Direct and Indirect Radiation Lab
12 Page Complete

Background Information:
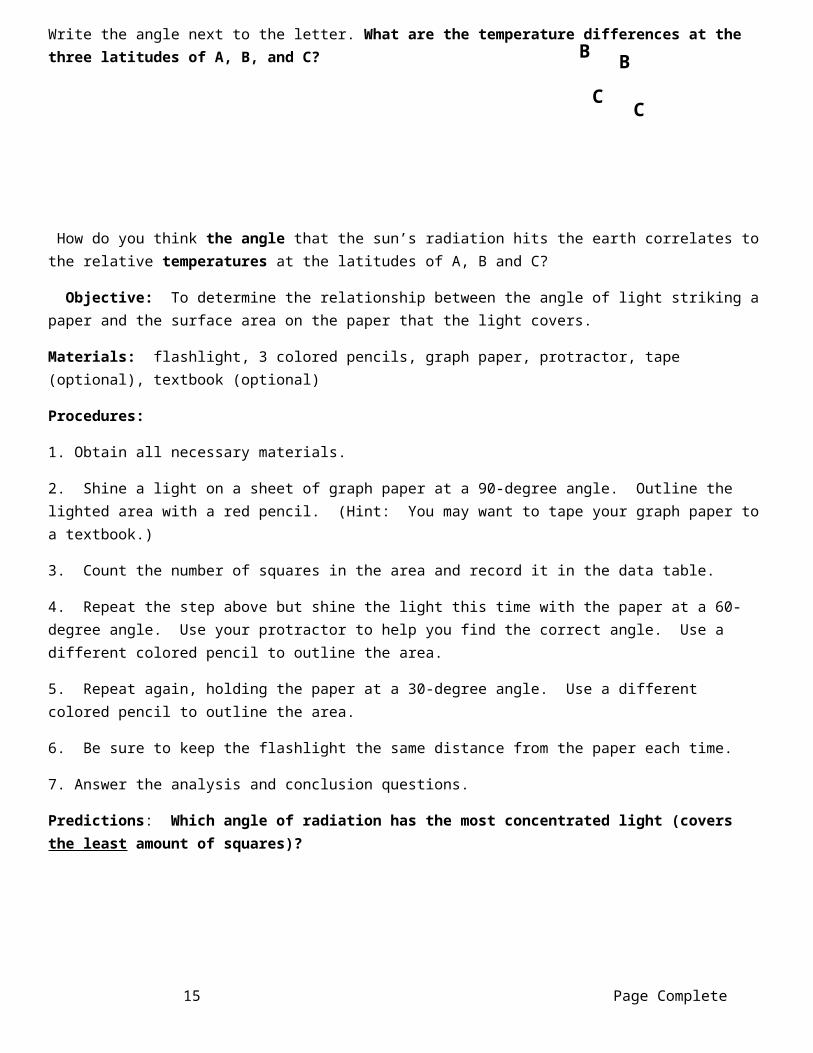
Using your protractor, determine the angle at which the sun’s radiation strikes the earth at the latitudes indicated by letters A, B and C. Write the angle next to the letter. What are the temperature differences at the three latitudes of A, B, and C?
How do you think the angle that the sun’s radiation hits the earth correlates to the relative temperatures at the latitudes of A, B and C?
Objective: To determine the relationship between the angle of light striking a paper and the surface area on the paper that the light covers.
Materials: flashlight, 3 colored pencils, graph paper, protractor, tape (optional), textbook (optional)
Procedures:
1. Obtain all necessary materials.
2. Shine a light on a sheet of graph paper at a 90-degree angle. Outline the lighted area with a red pencil. (Hint: You may want to tape your graph paper to a textbook.)
3. Count the number of squares in the area and record it in the data table.
4. Repeat the step above but shine the light this time with the paper at a 60-degree angle. Use your protractor to help you find the correct angle. Use a different colored pencil to outline the area.
5. Repeat again, holding the paper at a 30-degree angle. Use a different colored pencil to outline the area.
6. Be sure to keep the flashlight the same distance from the paper each time.
7. Answer the analysis and conclusion questions.
Predictions: Which angle of radiation has the most concentrated light (covers the least amount of squares)?
13 Page Complete
C
B
C
B
A

Quantitative Data: (numerical)
Angle Number of squares in lighted area
Qualitative Data: (written observations)
Describe the observed difference between the intensity of the light when the flashlight was held at each angle.
Analysis Questions:
1. What angle had the most concentrated radiation (covers the LEAST number of squares)?
2. When the angle is at 90 degrees is the radiation direct or indirect?
3. What latitude receives the most concentrated/direct radiation? What can you infer about the temperatures there?
4. What, in general, can you infer about the energy per square meter at the equator?
5. What latitude receives the most indirect radiation? What can you infer about the temperatures there?
6. What, in general, can you infer about the energy per square meter at the poles?
7. Why was it important to keep the flashlight the same distance each time?
8. How does the angle of the sun’s radiation affect the climate of at certain latitude?
9. What other factors can influence climate?
10. How does the angle of the sun’s radiation change from season to season in Utah? Draw a diagram to help you explain your answer.
Conclusions: Please summarize 2 main ideas you learned from completing this lab. Be sure to be complete and use full sentences.
14 Page Complete
Earth’s Tilt and Sunlight HoursPart 1
Go to http://goo.gl/CMBhys.
1. At the bottom of the blue interactive box choose “Earth” (this will set the tilt of the Earth to 23.5⁰). You can click and drag the Earth to change positions around the sun, or you can use the “slow” feature to start automatic movement.
2. Click on “Exercises” at the top of the blue interactive box. Answer questions 1-3 in the space below:
1.
2.
3.
3. The tilt of the Earth changes from a maximum to a minimum and back every 41,000 years. We are currently moving from our 23.5⁰ tilt to a 22.1⁰ tilt. Run the interactive model with an inclination angle of 22⁰. How will the climate of location “X” change when Earth’s axial tilt is 22.1⁰?
4. Run the model again for Uranus. Use the Venn Diagram to list similarities and differences between Earth’s Seasons and those on Uranus:
15 Page Complete

Part 2
Each group will be given a globe (to represent the Earth) and a flashlight (to represent sunlight). Use these materials to model each of the following scenarios. You will hold the flashlight so that it shines at a 90⁰ angle on the globe, as shown in the illustration to the right. For each scenario draw a picture of the Earth that shows the angle of Earth’s axis in relation to the sunlight.
Location Time of Sunrise Time of Sunset Drawing
Scenario 1
Anchorage, Alaska
3:26 am 10:43 pm
Rio de Janeiro, Brazil
6:33 am 5:16 pm
Sydney, Australia 7:00 am 4:54 pm
Denver, Colorado 4:32 am 7:31 pm
Cape Town, South Africa
7:51 am 5:45 pm
Location Time of Sunrise Time of Sunset Drawing
Scenario 2
Anchorage, Alaska 6:59 am 7:16 pm
Rio de Janeiro, Brazil
5:57 am 6:03 pm
Sydney, Australia 5:58 am 6:05 pm
Denver, Colorado 6:02 am 6:13 pm
Cape Town, South Africa
6:50 am 6:57 pm
16 Page Complete
Light
Globe
UranusEarth

Location Time of Sunrise Time of Sunset Drawing
Scenario 3
Anchorage, Alaska 10:14 am 3:41 pm
Rio de Janeiro, Brazil
5:04 am 6:37 pm
Sydney, Australia 4:40 am 7:05 pm
Denver, Colorado 7:17 am 4:39 pm
Cape Town, South Africa
5:32 am 7:57 pm
Assessment Questions:
5. Draw and label a picture to explain why Utah is cooler in the winter and warmer in the summer:
6. The data for all three scenarios is real. Match each scenario to the correct date:
Scenario 1 March 20, 2016
Scenario 2 June 20, 2016
Scenario 3 December 20, 2016
7. You and your friends are planning a trip to Australia. While there you would like to visit the beaches, swim in the ocean, scuba dive, hike, and enjoy the warm, tropical weather. During what time of year should you plan your trip? Explain your answer with 3 sentences or with a drawing.
17 Page Complete

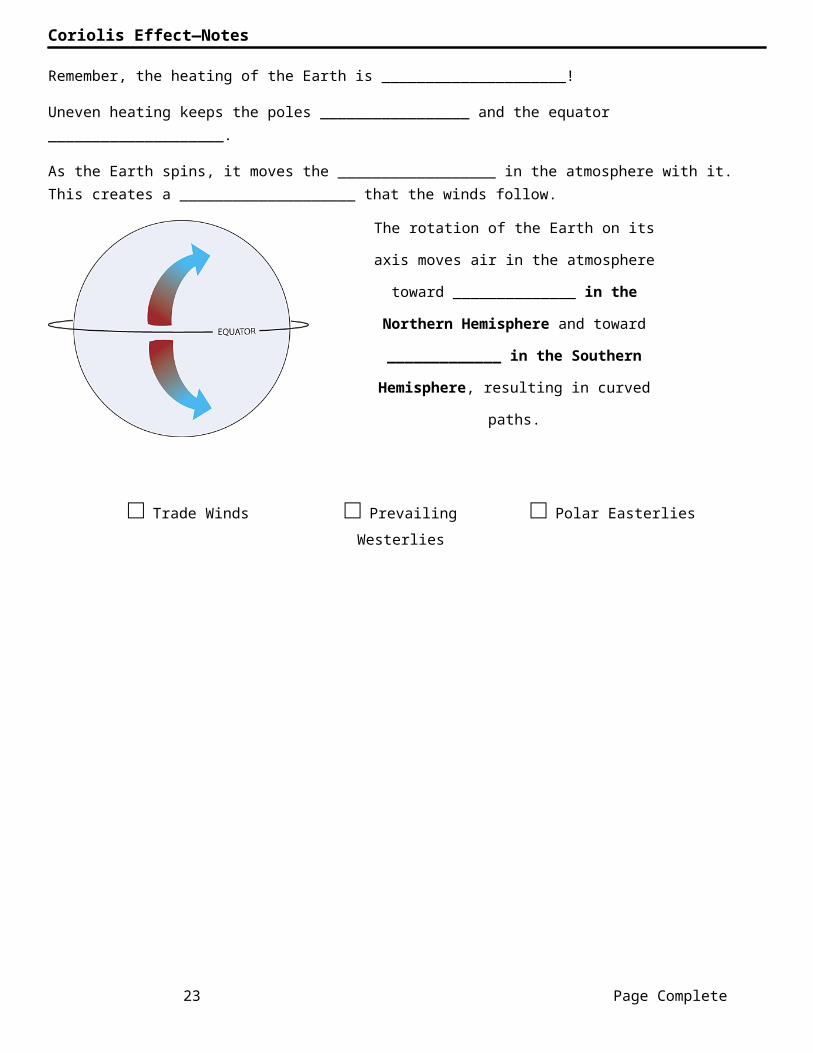
Coriolis Effect—Notes
Remember, the heating of the Earth is _____________________!
Uneven heating keeps the poles _________________ and the equator ____________________.
As the Earth spins, it moves the __________________ in the atmosphere with it. This creates a ____________________ that the winds follow.
□ Trade Winds □ Prevailing Westerlies □ Polar Easterlies
18 Page Complete
The rotation of the Earth on its axis moves air in the
atmosphere toward ______________ in the
Northern Hemisphere and toward _____________
in the Southern Hemisphere, resulting in curved
paths.
This is called the ______________________.
30 S
60 S
90 S
90 N
60 N
30 N
0

Label the “cells” below:
Modeling the Coriolis Effect Labs
The rotation of the Earth in an easterly direction causes the Coriolis Effect. The Coriolis Effect is the name given to the imaginary force that deflects objects, such as rockets or large storms, which move over the surface of some planets. The
19 Page Complete

Coriolis Effect is important in causing the swirling motions of storms and greatly influences the movement of global wind patterns and ocean currents.
Coriolis with Balloons:
Materials:
● Balloon
● Colored Markers
Procedure: Read through steps 2-5 below. Before you do the investigation, predict the path that the pen will trace.
1. The ovals below represent your balloon. In steps 2-5 you will rotate your balloon and try to draw a straight line. Predict what your lines will look like by drawing them in the rectangles below. The arrows represent the direction that the balloon will rotate.
2. Have one student hold the balloon with one hand at the top and one hand at the bottom. 3. That student will rotate the balloon COUNTER-CLOCKWISE slowly, and as nearly as possibly at a constant speed.
Try for a rotation rate of about one full turn in five seconds.4. A second will use a marker and slowly draw a STRAIGHT line on the balloon while it is rotating. IMPORTANT: the
trick is to try to ignore the motion of the balloon, and move the marker in a straight line.5. Record your results below:
20 Page Complete

6. Repeat steps 2-5 while rotating the balloon in the CLOCKWISE direction.
7. How did your predictions (in step 1) compare to your results?
8. Compare the sketches you made in steps 5 and 6. Describe any patterns that you observe.
9. The COUNTER-CLOCKWISE turning you used as part of step 5 is a model of the way wind moves in the Northern Hemisphere. Why was it necessary to also rotate your model in the CLOCKWISE direction?
10. How do you think the shape of the line would vary with the speed of rotation? (What would happen if you made the balloon rotate faster?)
11. Test your idea from question #10 and draw your results below:
21 Page Complete

Coriolis with Paper Plates
Materials:
● 1 paper plate labeled Reuse (this plate has a hole)
● 1 paper plate with no hole (referred to as plate A)
● Food coloring - 3 drops of different colors.
● Piece of packing tape that is long enough to cover the circumference of the plates
● Pencil
Procedure: Read through steps before starting the investigation. Make sure to answer the analysis questions when you have completed the investigation.
Step 1: Make your prediction of what will happen to the food coloring once you start to spin the plate. Prediction:
Step 2: Label the plate with no hole plate A.Step 3: Turn plate A upside down on the table and place the Re-use plate upside down on top plate A.Step 4: Using the pencil, trace the outline on to plate A. Step 5: Using the pencil, where you made the mark on plate A, push the pencil through the plate to create a hole in plate A. Step 6: Turn the plate A over right side up.Step 7: Take one of the food colorings and place three drops close to the hole but not on the hole. Take a different color and place three drops close to the hole but on a different side of the hole from the other color. Take a third color and place three drops close to the hole but on a different side from the other
colors (see example below).
22 Page Complete
YellRed
Penc Gr
Step 8: Place your reuse plate on top of the other plate - plate A upside down making a flying saucer shape. Be careful not to move plate A with the food coloring.
Step 9: Take the packing tape, once again being very careful not to disturb the food coloring, and place the tape on the outside edge of the two plates making a seal.Step 10: Get the teacher to check off the seal of the plates before proceeding because of the mess! Teacher’s initials: ________________Step 11: Very carefully, lift the two plates off the table and insert the pencil into the hole from the bottom of plate A. Make sure the pencil makes it through both plates and is sticking out of the top. The bottom of plate A should be no further than halfway down the pencil.Step 12: One partner will hold the pencil and the other partner will spin the plates in a clockwise direction. Do this for about 10-20 seconds.Step 13: Carefully open up the plates and answer the questions below:
1. Draw and describe what you see on your plate on the image below:
2. What is the difference between your prediction and what really happened?
3. What caused the food coloring to behave this way?
4. What would happen if you spun your plate in a different direction?
5. Describe how the Coriolis Effect would work on a baseball thrown from one side of a spinning merry-go-round to the other side.
23 Page Complete

Coriolis with Lazy Susan
Materials:
● Turntable (Lazy Susan)
● Paper
● Tape
● 3 Colored Markers
Procedure: Read through steps before starting the investigation. Make sure to answer the analysis questions when you have completed the investigation.
Step 1: Cover the turntable with the paper, taping it to the edges of the turntable.
Step 2: Use one of the markers to draw a straight line all the way across the turntable. This shows the path of clouds or objects moving on a non-rotating planet.
Step 3: Answer the following questions after completing steps 1-2.
1. Observe and describe the shape of the line you drew. Looking down on your line, is it straight or curved?
2. What is wrong with (missing from) this model of the Earth that might affect how objects truly move over the Earth’s surface?
Step 4: Now spin the turntable counterclockwise.This is the direction that the Earth turns (rotates) when viewed from the North Pole. The turntable is modeling the Northern Hemisphere of the Earth.
Step 5: Draw a straight line across the turntable using a different colored marker, while spinning it at a constant speed. Be sure to watch that your marker follows a straight path! Label the beginning of the line you drew with an arrow pointing in the direction the marker moved. Note that the line you drew is curved.
Step 6: Answer the following questions after completing steps 4-5.
1. With the starting point of the line directly in front of you, in which direction was the line deflected? (Which way does the arrow point - right or left?)
2. Which direction does the line curve? (Clockwise or Counterclockwise?)
24 Page Complete

3. If you were in an airplane that takes off from Miami, Florida and is flying directly north to Toronto, Canada, would your plane be deflected to the left or to the right as it flew?
Step 7: Now spin the turntable clockwise. This is the direction that the Earth turns (or rotates), when viewed from the South Pole. The turntable is modeling the Southern Hemisphere of the Earth.
Step 8: Draw a straight line across the turntable using a different colored marker, while spinning it at a constant speed. Be sure to watch that your marker follows a straight path! Label the beginning of the line you drew with an arrow pointing in the direction the marker moved. Note that the line you drew is again a curve.
Step 9: Answer the following questions after completing steps 4-5.
1. With the starting point of the line directly in front of you, in which direction was the line deflected? (Which way does the arrow point - right or left?)
2. Which direction does the line curve? (Clockwise or Counterclockwise?)
3. If you were on a cruise ship that set sail from Cape Town, South Africa and was sailing for Rio de Janeiro, Brazil - slightly north, mostly west, would you ship be deflected to the right or to the left as it traveled?
Application Questions: Examine Figure 7.1 on the next page, which shows part of Mars. The bright streaks associated with some craters can be used as wind direction indicators. They are deposits of dust that can form downwind from craters.
1. Does the group of streaks for a straight line or curved path (as a whole group)?
2. What does the shape of the wind streaks indicate the existence of the Coriolis Effect on Mars?
3. Does Mars rotate? How do you know?
4. From which way did the wind blow to make the streaks in Figure 7.1?
5. Imagine you are on the part of Mars shown in this figure, standing with the wind to your back. Which way is the wind being deflected, to your left or to the right?
25 Page Complete

6. If Mars rotates in the same direction as the Earth (from west to east), is this a picture Northern or Southern Hemisphere of Mars?
7. Why do you think the Coriolis Effect which causes objects to deflect from a straight path on a rotating planet, is sometimes called an imaginary force?
26 Page Complete

Our Atmosphere—NOTES
These lines represent our atmosphere from top to bottom. Along the left hand column you will predict where weather takes place, where airplanes fly, where the northern lights happen, and where the peak of Mt. Everest reaches.
Predictions Actual Answers
27 Page Complete

Edge of Atmosphere
Surface of Earth
28 Page Complete

Important Layers
Troposphere:
Ozone:
Greenhouse Effect:
● One important function of our atmosphere is that it keeps our ________________ _________________.
● Certain molecules in the air can __________________ solar radiation (light) and turn it into ______________.
● These molecules include _______________, ________________, _______________. We call these
________________________________________.
● If there are more molecules of greenhouse gases in the air, the atmosphere can ____________________ more
_________________.
Indoor ozone stopper Article - Oils from human skin fight off this harmful chemical, but at a cost.
by Stephen OrnesOzone is a chemical that can be both friend and foe to human beings — depending on where it is. In the atmosphere, high overhead, ozone protects Earth from harmful radiation that comes from the sun. But at Earth’s surface, ozone is better known as air pollution, and breathing it can be dangerous.Going inside is safer, but it doesn’t completely protect a person from pollution: Ozone can creep into buildings and homes and still pose a threat because it irritates the lungs. Inside a building, levels are much lower than outside because ozone changes when it runs into something like furniture. A new study identified yet another layer of protection that keeps ozone out of our bodies — human skin.Skin contains many different kinds of oils. It’s easy to see: Just press your finger against a sheet of glass and observe. Your fingerprint is outlined in oil. When ozone in the air meets the oils in human skin, there is a chemical reaction. That means that the molecules of ozone — and possibly the molecules of oil — change.Ozone is a lot like the oxygen we breathe. The kind that we breathe is made of diatomic molecules, which means each molecule has two atoms. But ozone has an extra: It is made of three oxygen atoms connected together. This extra atom makes ozone behave differently than typical oxygen. Ozone is both poisonous and protective.For the new study, the scientists gathered information about the dust in the bedrooms of 500 children who live on the Danish island of Fyn. This dust, the scientists found, contained many different chemicals. One was a phthalate, which is a controversial chemical found in many plastics and other materials and that might harm to the hormone balance in humans. The scientists weren’t surprised to find a phthalate because these chemicals are everywhere.
29 Page Complete

They were surprised to find large amounts of cholesterol and squalene. (Squalene is a fat that makes up about 10 percent of the oil in human skin.) Then the researchers realized that both of these things can be found in human skin. The human body regrows its outer layer of skin every two to four weeks, and bits and pieces of the old skin break off — to become dust.In this study, the researchers determined that skin flakes on surfaces were covering those surfaces with squalene, thus making those windows, doors or couches break up ozone as well as skin does.“We’ve known that the ozone indoors is being gobbled up,” Charles Weschler told Science News. “But we really didn’t know what’s doing the gobbling.” Now, he finds, “this squalene is just great at chewing up ozone.” Weschler, a scientist at the University of Medicine and Dentistry, New Jersey, in Piscataway, worked on the new study.It may seem like good news that human skin helps indoor spaces fight off dangerous ozone. After all, if the ozone goes away, then a person won’t breathe it and face the bad health effects.But that may not be the case: Emerging research suggests this battle with ozone might present its own dangers.In a different experiment, scientists in Austria mixed together ozone and skin oils in the laboratory. They found that, even though this mixing gets rid of ozone, it also creates new kinds of pollution. One in particular, called 4-oxopentanal (or 4-OPA), might be particularly dangerous. Until now, scientists have not analyzed 4-OPA to see how toxic it is, but that’s changing.Yet another team of scientists are working on this chemical at the National Institute for Occupational Safety and Health [2] in Morgantown, W.V. In early studies, the researchers found evidence that 4-OPA may be even worse than ozone. In other words, the ozone may be gone — but what’s left in its place may be even worse for human health.In the end, scientists want to know exactly what’s going on with the molecules that we breathe — and they hope this information will help us find new ways to protect our health. But the scientific journey from the first experiment (in the children’s bedrooms) is long, requiring study after study by scientists who can learn from each other.
Source URL: https://student.societyforscience.org/article/indoor-ozone-stopper“Indoor Ozone Stopper” Reading Article Questions
1. What claim is the article making?
2. List the reasons/evidence that the author uses to back up his claim:
3. List 4 new words that you read in this article, and a possible definition based on the way the word was used:
Word Possible Definition
4. Explain where AND why ozone is a “friend to humans” :30 Page Complete

5. Explain where AND why ozone is a “foe to humans” :
6. Draw a picture that shows the structure of an ozone molecule vs. the structure of an oxygen molecule.
Ozone Molecule Oxygen Molecule
7. What discovery led to scientists learning that ozone indoors is being destroyed?
8. When ozone and skin oils are mixed together in a laboratory, what is created? Explain if this new molecule is good or bad.
31 Page Complete

Layers of the Atmosphere
1. Examine the zigzag line on your layers of atmosphere graph. If the temperature of the atmosphere is DECREASING (getting colder) color that part of the line blue. If the temperature of the atmosphere is INCREASING (getting warmer) color that part of the zigzag line red.
2. Cut the images and the descriptions from the last page in your packet and glue them on this page where they belong. Make sure to look at the height and the layers in the description to ensure proper placement. Make sure to not cover the temperature lines or any other vital information on your graph.
32 Page Complete
33 Page Complete
34 Page Complete

Cut and Glue These Pieces onto your Layers of the Atmosphere page in your packet. Make sure to not cover the temperature lines or any other vital information on your graph.
. Put each object in the layer of atmosphere where they belong. Put each description on the layer where it belongs.
Blackbird SR-70
26 km
Weather
0-1 km
Troposphere
1. Most weather occurs here where we live2. Convection currents!
Boeing 787
12 km
Cirrus Clouds
16 km
Stratosphere
1. Contains most of atmosphere’s ozone2. Where jets and manned balloons have gone
Hot Air Balloon
5-7 km
Cumulonimbus
Up to 16 km
Mesosphere
1. Protects Earth from meteors2. Coldest region of atmosphere
Ozone Molecules
20-30 km
Radio Waves
96-112 km
Thermosphere
1. Temperatures get up to 2000 C2. Air molecules are 1 km apart!
Aurora Borealis
100-250 km
Meteors
48-80 km
Ozonosphere
1. Ozone is made of 3 oxygen atoms2. Protects the surface from Solar UV rays3. Humans can contribute to “holes” in the ozone
International Space Station
300 km
Unmanned Spacecraft
3000 km
Ionosphere
1. Lower part of the thermosphere2. Radio waves bounce back to Earth’s surface
Flock of Geese
6-7 km
Exosphere
1. Upper part of thermosphere2. Artificial satellites orbit here
Magnetosphere
1. Earth’s magnetic field2. Causes Aurora Borealis (Northern Lights)
35 Page Complete


![… · Web viewEarth’s interior with special reference to seismology [3] 2. ... Practical Geography: A Systematic Approach, 3rd ed, Orient Blackswan Private Ltd. Velvet, N. 2017](https://img.dokumen.tips/doc/110x75/5edb0c7e09ac2c67fa68b9b9/-web-view-earthas-interior-with-special-reference-to-seismology-3-2-practical.jpg)