Embed Size (px)
Citation preview

_________________________________________________________________Biol226L 2017Week 9: GIS Mapping of Tick Results
Introduction
In this lab, you will relate Ehrlichia chaffeensis presence/absence (from last week), to human land use and deer habitat. Remember, that the distribution of ticks, and therefore E. chaffeensis occurrence, relates to the distribution of white-tailed deer. The distribution of deer is influenced by human land use such as distribution of roads, urban and rural areas, and fragmentation of forest land cover. Deer populations have increased because human land use increases edge habitat, that is, habitat where forest land cover comes up against roads, agriculture fields, as well as urban and rural areas. These edge habitats are particularly attractive and suited for deer.
GIS or geographic information system is a widely-used tool that can be applied to a variety of ecological questions. This method combines geographical data with a measured variable in order to assess relationships. It is often used in ecology and wildlife management scenarios. In this week’s lab, we will be doing a super-simplified version of GIS using satellite data on Google Earth. Our variable we will be overlaying onto the satellite images will be presence or absence of E. chaffeensis in tick samples.
You will learn three things in this lab:1. How to manipulate data in Excel2. How to import data into Google Earth3. How to extract data from Google Earth
This lab is made up of two exercises. First, you will apply the molecular data you collected over the past two weeks spatially. In other words, you will label the collection sites as either having or not having E. chaffeensis positive ticks and overlay this onto satellite images. You can think of this as the local range data. Second, you will investigate how deer management and distance to the edge of forest habitat correlate with E. chaffeensis occurrence. You will work with a data set that has been collected by the ACER lab, Biology Department, College of William and Mary. This is the regional range data set.
You will need both Excel and Google Earth on your computer to complete these exercises.You will work in pairs for this lab exercise. Each student should answer the 15 questions in the protocol either on notebook paper or on your computer. Your TA will check these before you leave but will NOT be collecting them because you will need them to work on your module report.
Part 1: Local range exercise, College WoodsIn this section you will investigate the following question: Does E. chaffeensis occurrence relate to forest type?Here are the steps:
1. Download the following files from Blackboard: Local_data 2017.xls and Land_cover_data 2017.xls.2. Open the Local_data 2017.xls file. 3. Now we need to ask Excel to recode the names of our study sites to incorporate the PCR results so that
when we overlay these names on our map, we can easily tell sites where ticks tested positive for E. chaff. DNA. In cell C2 type the following formula: =D2 & “_” & E2. What you are asking Excel to do is take the contents of cell D2 and add an underscore (“_”) before attaching the contents of cell E2. The text for C2 should now read: CW 2-1_n.
4. Now drag the formula down to all cells in that column. Save the file to your desktop.

5. You are now ready to import your spatial data into Google Earth. Note, it is important that the columns be arranged as above as any text next to the Longitude column will be used by Google Earth as a site name. Latitude and Longitude define the location of each site where ticks were collected.
6. Now we need to convert the Excel file into a file structure recognized by Google Earth. Files with the extension “.kmz” are recognized by Google Earth.
7. Here is a website that allows you to convert and Excel file into a Google Earth .kmz file: http://www.earthpoint.us/exceltokml.aspx
8. Click the “Browse” or “Choose File” button and navigate to the Local_data 2017.xls file that you just have saved and click “open”.
9. Then click the “View on Google Earth” button.

10. Depending on your browser, this may open a window (see below). Make sure “Open with Google Earth” is selected. You must first have installed Google Earth on your computer. Alternatively, the file may download.
OR
11. Click OK or Open or click on the downloaded file.
12. This should open Google Earth and display the sites as pins.

13. In Google Earth, select the “time” button. This allows you to move between images taken at different times. We need to select an image where deciduous trees have lost their leaves. Select the most recent December image. The year does not matter, just the month. Here, trees that look green are evergreen trees (pines and holly) and trees that look grey-ish are deciduous trees without leaves like poplar, oak and maple.
14. Look on the left-hand side of your screen for the Places box. Find the “Local_data_2015” folder and click the small arrowhead just to the left. This will open a list of all of the sites from the spreadsheet in the same order as on the spreadsheet.

15. Double-clicking on the site name will take you directly to the first site CW 2-116. Now evaluate whether this site is in an area dominated by evergreen or deciduous trees. To do this,
imagine an approximate 10-m radius circle centered on each site and then evaluate whether evergreen or deciduous trees are dominant within the boundaries of the circle. Click on the Ruler tool at the top of the screen.
Then click on the site and move your mouse out until the counter reads approximately 10 meters
Imagine this diameter of a circle around the pin and visually gauge whether evergreen or deciduous trees are predominant within the circle.

17. Now open the Land_cover_data 2017.xls file in Excel 18. Type your classification into the “forest type” column as either E or D. “E” means you thought
evergreen trees dominated within the 10-meter circle. “D” means you thought deciduous trees were dominant.
19. Repeat this for each of the sites. Remember you can quickly find the next site on the list by double-clicking on it in the Places list in Google Earth.
20. Now you will summarize your data using Pivot tables in Excel. 21. Drag your mouse to select the cells A1 through G65. Select the Insert Tab from top row of tabs and then
select Pivot Table. Click the “Ok” button. Mac users should select Data/Pivot Table.
22. On the right-hand side, drag “Forest type: Evergreen or Deciduous” to the box marked “ROWS” and the “Ehrlichia chaffeensis” to the “COLUMNS” box.
23. Now drag the “Ehrlichia chaffeensis” to the “VALUES” box. This will provide the count of each type of site that was found to either have or not have bacteria-infected ticks. NOTE: The values in your pivot table will be different from these hypothetical values!!

24. Save this file! And make sure your lab partner has a copy of the file. You will need this for your lab report.
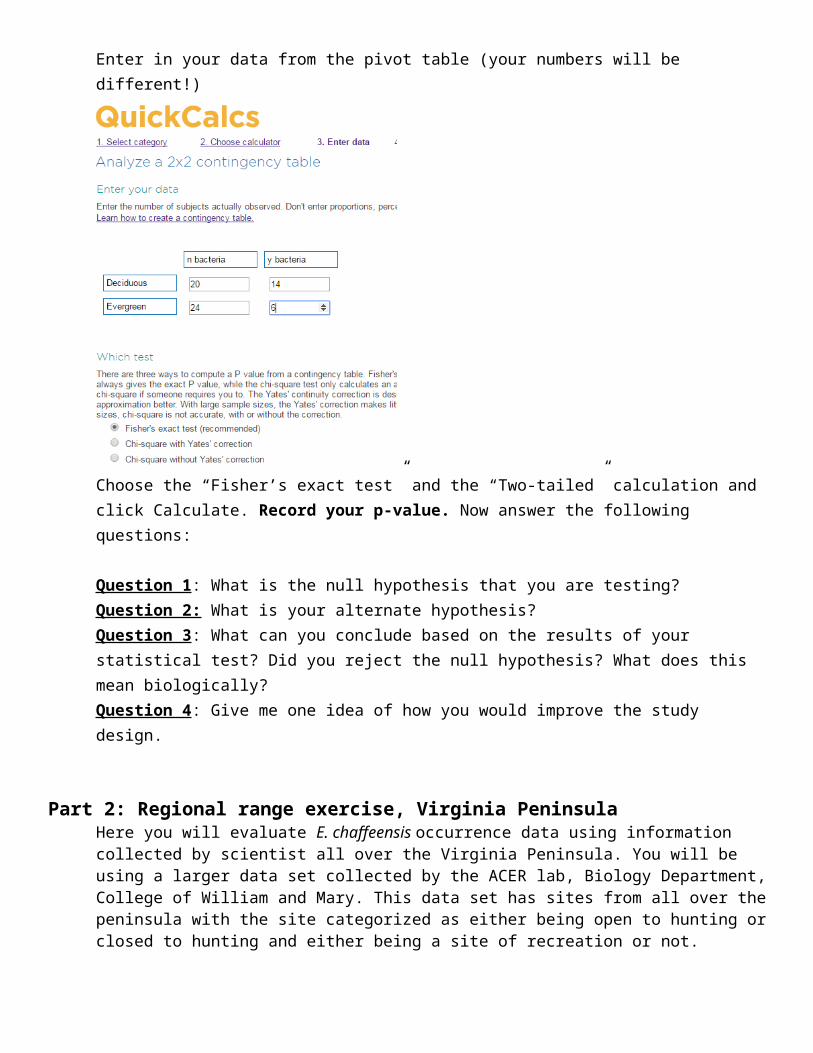
25. Now we need to find out if this relationship is statistically significant. To do that, navigate to this website: https://www.graphpad.com/quickcalcs/contingency1.cfmEnter in your data from the pivot table (your numbers will be different!)
Choose the “Fisher’s exact test” and the “Two-tailed” calculation and click Calculate. Record your p-value. Now answer the following questions:
Question 1: What is the null hypothesis that you are testing?Question 2: What is your alternate hypothesis?Question 3: What can you conclude based on the results of your statistical test? Did you reject the null hypothesis? What does this mean biologically?Question 4: Give me one idea of how you would improve the study design.
Part 2: Regional range exercise, Virginia PeninsulaHere you will evaluate E. chaffeensis occurrence data using information collected by scientist all over the Virginia Peninsula. You will be using a larger data set collected by the ACER lab, Biology Department, College of William and Mary. This data set has sites from all over the peninsula with the site categorized as either being open to hunting or closed to hunting and either being a site of recreation or not.
First, you will relate E. chaffeensis occurrence to where deer hunting occurs and to where people recreate1. Download from Bb and open the Regional_data.xls file in Excel and examine the data. 2. For each site, categorical data are provided regarding deer hunting (no hunting allowed or hunting
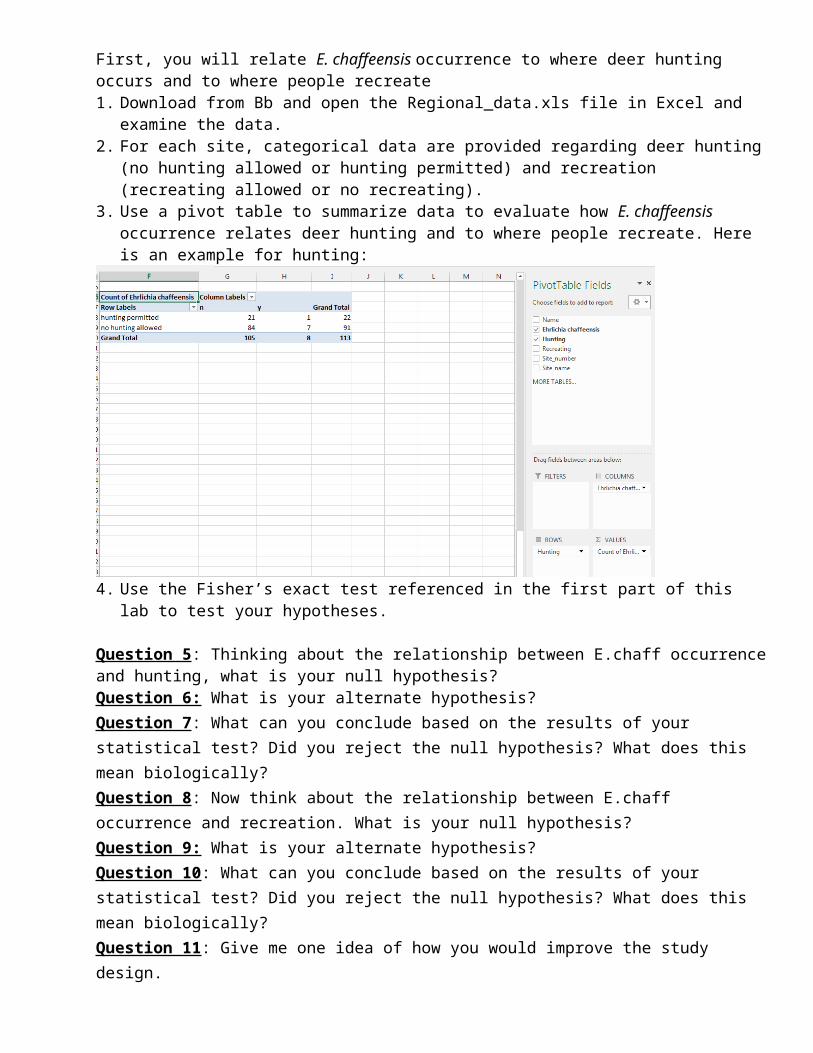
permitted) and recreation (recreating allowed or no recreating). 3. Use a pivot table to summarize data to evaluate how E. chaffeensis occurrence relates deer hunting
and to where people recreate. Here is an example for hunting:

4. Use the Fisher’s exact test referenced in the first part of this lab to test your hypotheses.
Question 5: Thinking about the relationship between E.chaff occurrence and hunting, what is your null hypothesis?Question 6: What is your alternate hypothesis?Question 7: What can you conclude based on the results of your statistical test? Did you reject the null hypothesis? What does this mean biologically?Question 8: Now think about the relationship between E.chaff occurrence and recreation. What is your null hypothesis?Question 9: What is your alternate hypothesis?Question 10: What can you conclude based on the results of your statistical test? Did you reject the null hypothesis? What does this mean biologically?Question 11: Give me one idea of how you would improve the study design.
Second, we want to examine the effect of proximity to edges on E. chaff occurrence. The data set you will be using consists of 8 E. chaffeensis presence sites and 8 randomly selected E. chaffeensis absence sites.
5. Download from Bb and open the Distance.xls file.6. Fill in the “Name” column by typing the following formula =G3 & “_” & D3 and drag the formula
down to cover the 8 sites in the top half of the spreadsheet.7. Repeat this for the negative sites by typing the following formula into the “Name” column =G14 &
“_” & D14 and dragging down.8. Now save this file9. Import the Distance.xls into Google Earth per instructions in the local range exercise. 10. Once the data are imported zoom to the infected and random sites one by one and measure distance
to edge. An edge is defined as the place where forest land cover abuts roads, agricultural land, or housing developments. You may need to zoom in pretty close to get small roads to show up on the map.
11. Measure the distance from the site to the edge using measuring tool in Google Earth. Pick the CLOSEST measurement. For example, if there are two roads near the site, measure the distance to the closest one.
12. Enter distances that you have measured in Google Earth into the Distance.xls file. 13. You will use a t-Test (Student’s t-Test) to test your hypothesis this time. Go to the following
website: http://www.physics.csbsju.edu/stats/Index.html. Select Student’s t-Test Unpaired for data set with 3-99 points.
14. Enter 8, the number of points in each category, in “Number of items”.
15. Now enter your distance measures. Note that your data will differ from the ones shown below. Then select “Calculate Now”
Question 12: What is your null hypothesis?Question 13: What is your alternate hypothesis?Question 14: What can you conclude based on the results of your statistical test? Did you reject the null hypothesis? What does this mean biologically?Question 15: Why did you do a t-test for this data set but a Fisher’s exact (Chi-square test) for the first part of this lab?