Embed Size (px)
Citation preview

Web Scraping Housing Prices in Real-time:
the Covid-19 Crisis in the UK Jean-Charles Bricongne1, Baptiste Meunier2 and Sylvain
Pouget3
August 2021, WP #827
ABSTRACT
While official statistics provide lagged and aggregate information on the housing market, extensive information is available publicly on real-estate websites. By web scraping them for the UK on a daily basis, this paper extracts a large database from which we build timelier and highly granular indicators. One originality of the dataset is to provide the sellers’ perspective, allowing to compute innovative indicators of the housing market such as the number of new posted offers or how prices fluctuate over time for existing offers. Matching selling prices in our dataset with transacted prices from the notarial database using machine learning techniques allows us to measure the negotiation margin of buyers – an innovation to the literature. During the Covid-19 crisis, these indicators demonstrate the freezing of the market and the “wait-and-see” behaviour of sellers. They also show that prices have been increasing in rural regions after the lockdown but experienced a continued decline in London.
Keywords: Housing, Real-time, Big Data, Web Scraping, High Frequency, United Kingdom
JEL classification: E01, R30
1 Banque de France, AMSE, LEO, LIEPP, [email protected] 2 Banque de France, AMSE, [email protected] 3 ENSIMAG. [email protected] We are very grateful to Kieran McQuinn (discussant), Jean Clark, Nigel Henretty, Karim Abdalla, Francoise Drumetz, Olivier de Bandt, and Nicolas Chatelais for useful comments. We thank Jerome Coffinet and Etienne Kintzler for excellent assistance regarding the automatizing of the data acquisition process. The views expressed here are those of the authors and do not necessarily represent those of the Banque de France, LEO, LIEPP, AMSE or ENSIMAG.
Working Papers reflect the opinions of the authors and do not necessarily express the views of the Banque de
France. This document is available on publications.banque-france.fr/en

Banque de France WP 827 ii
NON-TECHNICAL SUMMARY
Official statistics on the residential housing market are generally available with a certain delay and most are provided at aggregate level while discrepancies between urban and rural areas have been well documented in the literature (e.g. Poon and Garratt, 2012 for the UK). Getting timely information might be even more critical during crisis episodes such as the Covid-19 pandemics as the publication delays of official statistics do not allow to grasp dramatic and sudden turning points in the economic activity. In the meantime, a lot of information is available publicly and in real-time on real-estate websites, particularly on the residential segment where 92% of real-estate firms post ads on the Internet. Using these alternative data would then make it possible to construct indicators more rapidly (real-time), at higher frequency (daily), and with high granularity (at the postcode level).
Our approach focuses on the UK – but could be seamlessly extended to other countries – and consists in web-scraping the five main real-estate websites in the UK. On average, we scrap around 1.5 million offers (for sale and to rent) per day with extensive information on price, location, area, number of rooms, description, type of offers, and type of dwelling. The originality of the web-scraped data lies in getting the sellers’ perspective through the offers that they (or the real-estate agencies they mandate) post on the Internet – while much of the literature and all official statistics rely on the transactions.
This dataset first allows for a monitoring of the housing market in real-time. The selling price can be tracked daily and at a highly granular level, offering an early and finer picture of the on-going developments in the market – therefore complementing official statistics. In the same vein, usual indicators of the housing market (e.g. rent-to-price ratio) can be issued in real-time. These indicators complement official statistics by giving insights on the point of view of sellers. This is where the originality of our web-scraped dataset lies, and this peculiar standpoint allows for innovative indicators. A first example of it is the number of new offers posted each week – indicating sellers’ willingness to put their properties on the market. A second one relates to the price changes for an existing offer: daily web scraping makes it possible to track one particular offer over time and observe how the seller adjust its price. Interestingly, this gives a very early signal of the dynamics in the housing market – as this happens before any transaction can even be registered in official statistics.
Using these indicators on a daily basis, we track the UK housing market during the Covid-19 crisis and document a clear 80% decline in the number of new offers during the first lockdown (see Figure 1) while showing that sellers refrained from moving their prices during this period, suggesting a “wait-and-see” approach. In the aftermath of the lockdown, mean selling prices started to increase at country-level. However, this hides large discrepancies across regions: while prices increased steadily in rural areas, they declined in London (with potential composition effects though) – the region that was most affected by the virus, and where evidence suggests that the housing market is the most tense.
This dataset also allows to match web-scraped data on posted ads with notarial data on transactions, making it possible to compute the difference between posted and transacted prices. This is a direct indication of the buyers’ negotiation margin in the vein of Galesi et al. (2020), which can be computed at a very granular level and tracked over time. In the particular case of the UK, this indicator shows large discrepancies across regions with buyers’ negotiation margin being lowest in London.

Banque de France WP 827 iii
Figure 1. Weekly new offers during Covid-19 period
Sources: Zoopla and authors’ calculation
Données de prix immobiliers extraites d’Internet (web scraping) en temps réel :
le cas de la crise de la Covid-19 au Royaume-Uni
RÉSUMÉ
Alors que les données officielles sont disponibles avec un décalage et à un niveau souvent agrégé, de nombreuses informations peuvent être extraites en temps réel et publiquement des sites d’annonces immobilières. Cet article construit ainsi une large base de données en récupérant les annonces immobilières sur Internet (web scraping). Cela permet de construire des indicateurs avancés et très granulaires du marché immobilier. L’originalité des données vient aussi de ce qu’elles donnent le point de vue des vendeurs – quand la plupart des statistiques et de la littérature se basent sur les transactions. En exploitant cette originalité, nous construisons des indicateurs innovants comme le nombre de nouvelles offres ou les ajustements de prix des offres déjà sur le marché. Cela permet également de comparer les prix demandés par les vendeurs – issus de notre base de données – avec les prix finaux de transaction – en utilisant la base de données des notaires : cela donne une mesure du pouvoir de négociation des acheteurs. Pendant la crise de la Covid-19, ces indicateurs documentent une baisse drastique de 80% de l’activité sur le marché immobilier et le comportement attentiste des vendeurs. Par la suite, ils montrent la légère hausse des prix en zone rurale et leur baisse dans la région de Londres. Mots-clés : immobilier, temps réel, données haute fréquence, web scraping, big data
Les Documents de travail reflètent les idées personnelles de leurs auteurs et n'expriment pas nécessairement la position de la Banque de France. Ils sont disponibles sur publications.banque-france.fr

1 Introduction
Official statistics on the residential housing market are relatively scarce and availablewith a significant delay. In the UK – the reference market in this article – official trans-acted prices are published in the Land Registry only two months after the end of thecorresponding month, or even later for transactions that may be registered with somedelay, as shown in Figure 1. The earliest indicators (House Price index and new mort-gage approvals) are available in the following month but are proxy statistics based onmortgage data. Hence, timelier information might complement these official statistics.In addition, most of these early statistics are provided at aggregate level while discrep-ancies between urban – most notably London – and rural areas have been documentedin the literature (e.g. Poon and Garratt, 2012). In the meantime however, a lot ofinformation is available publicly and in real-time on real-estate websites, particularlyfor the residential segment where 92% of real-estate firms post ads on the Internet.1Getting timely information might be even more critical during crisis episodes such asthe Covid-19 pandemics as the publication delays of official statistics do not allow tograsp immediately the dramatic and sudden turning points in economic activity.
Figure 1: Timeline of official statisticsSource: Thomson Reuters, e.g. for March 2020
Against this background, the purpose of this paper is to exploit such publicly availableinformation online to build real-time and granular indicators for the housing market.Our approach builds on web-scraping the five main real-estate websites in the UK:Zoopla, Rightmove, and OnTheMarket – plus PropertyPal and S1Homes which focuson Northern Ireland and Scotland respectively. On average, we scrap around 1.5 millionoffers per day with extensive information on price, type of ads (for sale or to rent), lo-cation, area, number of rooms, type of good, and general description. Taking advantage
1Source: Realtor, available at https://www.nar.realtor/sites/default/files/documents/2018-real-estate-in-a-digital-world-12-12-2018.pdf
1

of this innovative dataset, we build real-time indicators of the housing market that cancomplement the official statistics.
The originality of the web-scraped data lies in getting the sellers’ perspective throughthe offers that they (or the real-estate agencies they mandate) post on the Internet,a peculiar point of view – in the literature on housing – which brings a twofold value-added. It first allows to monitoring the housing market in real-time notably through theselling price that can be tracked daily and at a highly granular level. But this originaldataset also allows for innovative indicators. A first example is the number of new offers– indicating sellers’ willingness to put their properties on the market. A second onerelates to the price changes for an existing offer: daily web-scraping makes it possibleto track one offer over time and observe how sellers adjust their prices. Interestingly,this gives a very early signal of on-going developments in the housing market – as thishappens before any transaction can even be registered in official statistics. On topon this real-time monitoring of the housing market, the second value brought by thisdataset is the possibility to match data on posted ads with notarial data on transactions,allowing to compute the difference between posted and transacted prices – indicatingthe negotiation margin of buyers.
Using these indicators in a conjectural fashion, we track the UK housing market duringthe Covid-19 crisis. Indicators shows a clear 80% decline in the number of new offersduring the first lockdown and also shows that during the lockdown, sellers refrainedfrom changing their prices, suggesting that most adopted a "wait-and-see" approach. Inthe aftermath of the lockdown, mean selling prices started to increase at country-level.However, this hides large discrepancies across regions: while prices increased steadily inrural areas, they declined in London – the region most affected by the virus and whereevidence suggests that the housing market is the most tense. In a second endeavour,we also compute the buyers’ negotiation margin, showing large heterogeneities acrossregions.
This paper contributes to the literature, first by providing new evidence for the on-going move to higher frequency statistics relying to some extent on alternative data (seeVeronese et al., 2020). Rather than competing with official statistics, our web-scrapeddata however complement the latter by detecting trends with enhanced timeliness (dailyindices in real-time vs. monthly / quarterly with lag) and high granularity (ZIP codelevel vs. at best region-level). In a broader perspective, this paper mirrors the recentendeavour across economists to design high-frequency indicators (e.g. Lewis et al., 2020)– which the Covid-19 and the subsequent abrupt swings in economic activity made morepressing. More specifically, we also contribute to the literature using alternative data tomonitor the real-estate market, such as Kulkarni et al., 2009 with Google Trends. Closerto us, we expand a recent strand of the literature making use of web-scraping to analyze
2

the housing market (e.g. Hanson and Santas, 2014). In this strand of the literature, thispaper is among the first with Galesi et al., 2020 to derive indicators focusing on sellers’perspective, and to use it to compute a metrics for buyers’ negotiation margin. Finally,this paper stands out by focusing on the UK market in this Covid-19 / Brexit period –though the approach can be seamlessly expanded in other geographies.
The remainder of the paper is organised as follows. Section 2 reviews the relatedliterature, section 3 describes how we retrieve and clean the data, section 4 presentsthe real-time monitoring of the housing market during the Covid-19 crisis. Section 5explores alternative indicators, namely a measure of buyers’ negotiation power as wellas the rent-to-price ratio. Finally, section 6 concludes.
2 Literature review
This paper first contributes to the literature on monitoring the housing market, a keytopic for economists not only because of its importance in the transmission betweencredit and business cycles (Kiyotaki, 1998) but also as it may act as a propagationmechanism for shocks (Kiyotaki and Moore, 1997) or even be the source of larger crises(Cheng et al., 2014). House prices can become disconnected from fundamentals up tothe point that agents sharply revise down their assessment (Case and Schiller, 1990;Case and Schiller, 2003), potentially leading to a deterioration of banks’ balance sheetswhile inducing negative wealth effect for households (e.g. Slacalek, 2009) with bothfactors ultimately weighing on aggregate demand. In that vein, papers such as Rünstlerand Vlekke, 2018 establish a strong correlation between the housing cycle and GDPcomponents. Therefore, designing indicators tracking price misalignments (e.g. rent-to-price ratio, vacancy rate, pending sales, price-to-income ratio) has been a long-lastingendeavour in the literature (e.g. Miller and Sklarz, 1986, Flood, 1997, Quigley, 2001,Case and Wachter, 2005, Lind, 2009, Dujardin et al., 2015, Engsted et al., 2016, andBlot et al., 2018).
We contribute to this literature by using cutting-edge techniques to retrieve informationat the fastest pace – in real-time – and in a very granular fashion – at ZIP code level,keeping however in mind the need to conciliate granularity with the representativenessconstraint. In addition, our dataset allows us to get information from the sellers’ per-spective in contrast with usual indicators that rely on transactions. Therefore, we arealso able to design innovative indicators reflecting sellers’ point of view (number of newoffers, price changes for existing offers), allowing to compare selling prices with finaltransacted prices and therefore to measure the negotiation margin of buyers. On a moreconjectural standpoint, we contribute by monitoring the impact of the Covid-19 on the
3

housing market, mirroring similar efforts such as Giudice et al., 2020 for Italy.
This paper also contributes to the growing field of the literature focusing on tracking theeconomy in real-time. In the wake of the Covid-19 crisis, a number of innovative high-frequency datasets have emerged such as weekly labour statistics (Coibion et al., 2020),daily credit card data (Carvalho et al., 2020), hourly electricity consumption (Chen etal., 2020), or marine traffic by the minute (Cerdeiro et al., 2020). Particularly illustrativeof this search for original data, Chetty et al., 2020 have developed multiple partnershipswith private entities to provide a vast amount of data -– untapped until now in theeconomic literature — on US employment, household spending and mobility. In thesame vein, Bricongne et al., 2020 have proposed a number of indicators for the Frencheconomy available from public sources. These high-frequency data allow for a swiftdetection of turning point in economic activity and their signalling power has been usedto develop activity trackers such as in Lewis et al., 2020 or to nowcast macroeconomicvariables such as world GDP in Jardet and Meunier, 2020. We contribute by coveringthe housing market while most of this literature has rather focused on GDP, industrialproduction or households’ consumption.
This paper more closely relates to the literature using alternative data, including throughweb-scraping, to analyse the housing market. Web-scraping is indeed increasingly usedin housing, whether for obtaining the levels of house prices (Bricongne et al., 2019) orrents (Chapelle and Eymeoud, 2018). This innovative technique has also been used toaddress more specific issues such as potential discrimination in rentals across the US(Hanson and Santas, 2014) or the impact of rent control in Germany (Mense et al.,2017). Web-scraping is also extensively used to take into account new digital playersof the housing market not covered by official statistics, for example Airbnb (Horn andMerante, 2017 or Garcia-López et al., 2020). More broadly, a number of papers haverelied on user-generated data available online to analyse the housing market such asAskitas, 2015 and McLaren and Shanbhogue, 2011. In particular, Wu and Brynjolfsson,2015, Veldhuizen et al., 2016, Oust and Martin, 2018, and Pavlicek and Kristoufek,2019 have demonstrated the capacity of Google searches data to monitor the dynamicsof the housing market. Closer to us would be both Boeing and Waddell, 2017, whouse web-scraping for tracking the housing market but focus only on rentals in the US,and Loberto et al., 2018, who use also web-scraped ads for monitoring the Italian real-estate market. We contribute to this literature through a more comprehensive effort tomonitor in real-time and for all types of goods the housing market for the UK. In theeffort to compute buyers’ negotiation margin, this paper is close to Galesi et al., 2020who however do not rely on web-scraping and do not compute real-time information onthe housing market.
Policy-wise and particularly relevant to our focus, we finally contribute to the on-going
4

movement calling economists – and particularly national statistical agencies – to relymore on alternative data. While the Covid-19 crisis has amplified this burgeoning move-ment (Veronese et al., 2020), a number of initiatives had been taken beforehand. Inter-estingly, some relied on web-scraping as a form of data collection such as Polidoro et al.,2015 who get consumer prices for the Italian National Institute of Statistics (ISTAT) orDumbacher and Capps, 2016 who retrieve government tax revenue for the US CensusBureau. Owing to heterogeneities in the source data (posted offers vs. transactions)as well as in the statistical adjustments applied to raw data, the indicators developedin this paper however aim at complementing official statistics rather than supplantingthem.
3 Data
3.1 Web-scraping
Data are retrieved through a daily web-scraping of the three most important real-estatewebsites in the UK: Zoopla, Rightmove, and OnTheMarket. To enhance our coverage onspecific areas, we also scrap PropertyPal – a real-estate website specialized on NorthernIreland – and S1Homes – its alter ego for Scotland. Through these websites, we scrapon average more than 1,500,000 real-estate offers every day. Out of these, around twothirds are offers for sale. More details can be found in Table 1. Data for Zoopla arescraped since the beginning of March 2020 while data for other websites are availablesince July 2020.2 In the residential segment, newly built dwellings represent on averagearound 11% of the total offers – a broadly stable share over time as shown in Figure11 in appendix B and in line with the share of new buildings in official UK’s HousePrice Index, around 10%.
Table 1: Average number of scraped offers per day (unique URL)Website name For sale To rent Commercial
for saleCommercialto rent
Zoopla 300,000 200,000 15,000 35,000Rightmove 500,000 200,000 20,000 25,000OnTheMarket 250,000 100,000 5,000 10,000
For each offer, we scrap information describing in detail the dwelling, the type of trans-2For this reason, the analysis undertaken in section 4 regarding the effect of the Covid-19 on the
UK housing market relies only on Zoopla data.
5

action, the price, and importantly its location at a very granular level. For our mainprovider Zoopla, we get the following information for residential real-estate offers: city,ZIP code, address, surface area, type of transaction (auction vs. sale), type of building(new housing projects vs. existing dwellings), number of bedrooms, number of bath-rooms, number of living rooms, general description (e.g. "lovely flat with a terrace ina safe neighbourhood"), and type of good (e.g. flat, duplex, property). For commercialreal-estate offers, we also retrieve the type of use such as hotel, offices, pub, restaurant,retail, warehouse, parking. Having extensive information on an offer might allow tobetter isolate the market effect from other elements that can affect the pricing of anoffer (location, type of good, area, etc.). In particular, retrieving the general descriptionmight allow to check whether it contains keywords referring to additional facilities (e.g.balcony, terrace, garage) that can add a premium on the price.
3.2 Data cleaning
Once data are scraped, we first perform quality checks and harmonize the observations.We first test if the price is displayed in British pounds and not in other currencies. Wealso give special attention to the area unit as they can be displayed in squared feet,squared meters or even acres. Where appropriate, we transform it to have all our dataexpressed in the same unit (squared meters). In addition, instead of displaying a singlevalue for the area, offers might display a range: in this case, we transform it to themean of such range.3 We also address the fact that rents can be expressed as weeklyamount: in this case, we transform the data to have rent expressed per calendar month.For string objects, we transform them to enhance the comparability of keywords acrossoffers: we lower characters and eliminate extraneous space character, line break andtabulation.
We also filter our data in order to gain a consistent picture of UK real-estate market.We first exclude properties that do not match residential offers like garages, parkings,mobile homes, lands,4 and bungalows. Focusing on offers for sale posted on Zoopla,5these offers accounts for around 30,000 offers per day – roughly 10% of the total offersfor sale in the residential segment. Second, we handle duplicates that may arise even on
3However, area data are missing for a large number of observations. While it might be natural tointerpolate such data, the issue is that this data are not missing at random: area is often quoted forpremium dwellings geared towards international buyers such as large apartments in London. Owing tothis issue and the fact that area is provided for a very limited sample (less than 5%), no interpolationis conducted.
4Further specific analysis on land prices can be found in appendix D5The main provider in the analysis below, since the scraping has started in March 2020 for this
website vs. July 2020 for other websites
6
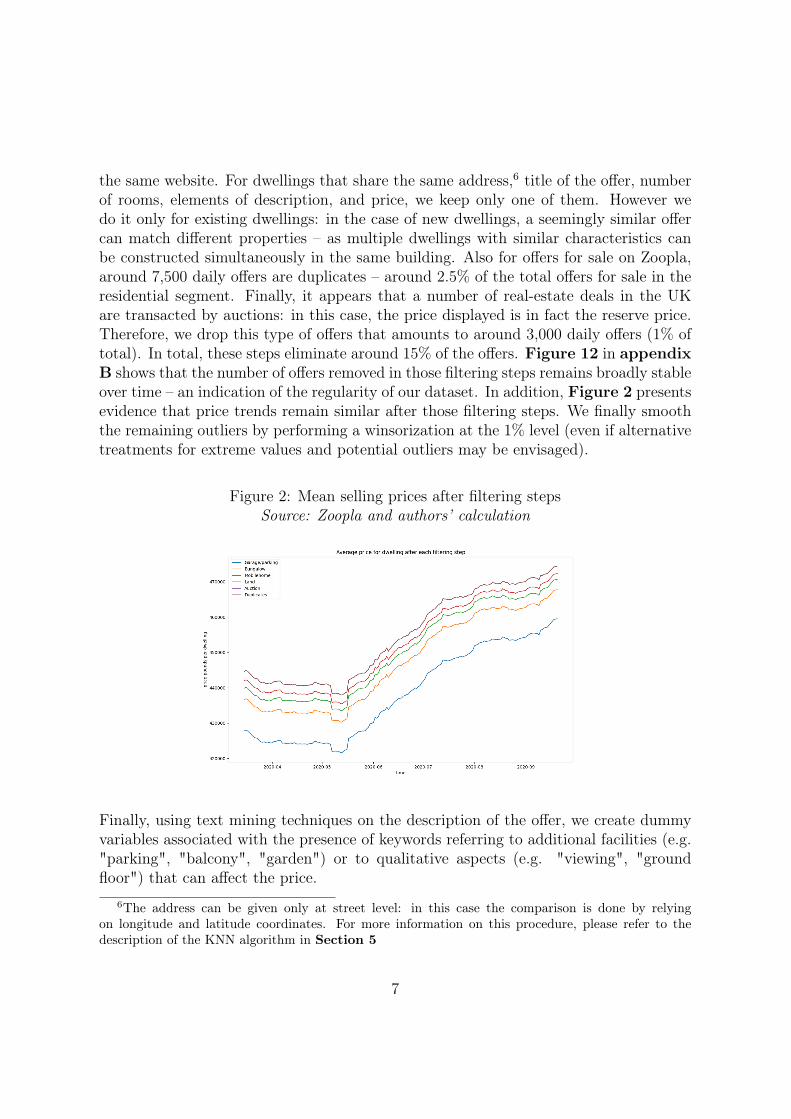
the same website. For dwellings that share the same address,6 title of the offer, numberof rooms, elements of description, and price, we keep only one of them. However wedo it only for existing dwellings: in the case of new dwellings, a seemingly similar offercan match different properties – as multiple dwellings with similar characteristics canbe constructed simultaneously in the same building. Also for offers for sale on Zoopla,around 7,500 daily offers are duplicates – around 2.5% of the total offers for sale in theresidential segment. Finally, it appears that a number of real-estate deals in the UKare transacted by auctions: in this case, the price displayed is in fact the reserve price.Therefore, we drop this type of offers that amounts to around 3,000 daily offers (1% oftotal). In total, these steps eliminate around 15% of the offers. Figure 12 in appendixB shows that the number of offers removed in those filtering steps remains broadly stableover time – an indication of the regularity of our dataset. In addition, Figure 2 presentsevidence that price trends remain similar after those filtering steps. We finally smooththe remaining outliers by performing a winsorization at the 1% level (even if alternativetreatments for extreme values and potential outliers may be envisaged).
Figure 2: Mean selling prices after filtering stepsSource: Zoopla and authors’ calculation
Finally, using text mining techniques on the description of the offer, we create dummyvariables associated with the presence of keywords referring to additional facilities (e.g."parking", "balcony", "garden") or to qualitative aspects (e.g. "viewing", "groundfloor") that can affect the price.
6The address can be given only at street level: in this case the comparison is done by relyingon longitude and latitude coordinates. For more information on this procedure, please refer to thedescription of the KNN algorithm in Section 5
7
3.3 Comparing with official statistics
A conceptual issue relates to whether alternative statistics should be substitutes orcomplements of official ones, i.e. whether or not the former should aim at providing theexact same information as the latter. In the particular case of this paper, it should benoted that web-scraped data represent a different aspect of the housing market fromofficial data. Official statistics are indeed based on mortgages and transacted prices –values that can be observed when a dwelling is actually sold – while web-scraped dataaccount for the price asked by the seller, which can markedly differ from the transactedprice or might not even translate into a transaction at all. On top of this, there isa temporal discrepancy since web-scraped data are taken at the start of the process,when the seller puts its dwelling on the market, while official statistics are taken at thevery end of it. Finally, statistical discrepancies might arise since the House Price Index– the main index for housing prices in the UK – is computed as a geometrical meanwith values corrected using hedonic regressions and mix-adjustment. This is in contrastwith our alternative indices which do not feature similar corrections7 due to the limitedtime span in our dataset and the very particular nature of the economic conjecture thatmight distort the results. We however leave it as an avenue for future research whenmore data become available. As a consequence, in the particular context of this paper,discrepancies are inevitable between alternative and official statistics, and the formershould rather be viewed as a complement of the latter.
While discrepancies with official statistics are inevitable, we however tried to limit biasesin our web-scraped data. A key question relates to its representativity: while a vastmajority of real-estate firms post ads on real-estate websites (92% according to Realtor– op. cit.8), this might entail composition effects due notably to uneven geographicalcoverage. As shown in appendix A, the geographical coverage of our main provider
7In addition, our alternative indices use the arithmetic mean vs. the geometric mean in officialstatistics. That being said, a figure with median prices, less influenced by high-value properties thanarithmetic mean, can be found in Figure 13 in appendix B: it conveys the same message as Figure 6based on the arithmetic mean. The median house price obtained from web-scraped data is also broadlysimilar to the statistically-adjusted geometric mean price in Land Registry as shown in Figure 14.
8This number however likely constitutes an upper bound to the share of "real-life" ads that arecaptured by web-scraping. Another upper bound is given by comparing the number of transactionsfrom Land Registry during a month, with the number of web-scraped ads that disappear during thesame month. Results are provided in Table 3 in appendix B: both figures are on average broadlysimilar. A lower bound can be computed through the share of transactions in Land Registry matchedin our dataset (see section 5): using only data from Zoopla and assuming conservative assumptionsthat limit the matching, such a lower bound is estimated at a relatively low level, e.g 23% in Londonthough there are regional disparities. This relatively limited matching also reflects the fact that sometransactions were not yet registered in official statistics with data retrieved at the time of the study(Nov. 2020).
8

Zoopla is indeed uneven with an over-representation of England. This is the main reasonwhy we complement it with other websites, and in particular PropertyPal and S1Homeswhich specialize respectively in Northern Ireland and Scotland. It should however benoted that results in section 4 are based only on Zoopla data since the web-scrapingof other websites started only as of July 2020, a caveat to keep in mind for section 4.Consequently, the cross-sectional analysis in this section is limited to England for whichthe geographical coverage of Zoopla is more balanced. In addition, most of the statisticspresented in this paper are at granular level, limiting such an issue of compositioneffects.9
4 Real-time monitoring of the housing market: an ap-plication to the Covid-19 crisis
Using our web-scraped data, we produce daily statistics for the housing market – inadvance of official statistics. Interestingly, we can also use location data to constructindicators at a very granular level. This allows to track several usual indicators (e.g.mean price, number of new construction projects) with enhanced timeliness comparedwith official statistics, together with a high granularity.
In addition, getting data from offers gives us the perspective from the sellers – in con-trast with usual statistics based on transaction data. It therefore brings an innovativestandpoint on the housing market: as such we track the number of new offers whichindicates whether sellers are eager to put their properties on the market. A deviationfrom its "normal" value would signal that sellers are anticipating (or facing) a shockin the housing market. Interestingly, our dataset also allows to track how the price ofan existing offer fluctuates over time. Again, a deviation from the "normal" trend ofcorrections (even under stable economic conditions, sellers might adjust their prices overtime to correct for initial under-/over-valuations) would indicate potential crisis/bubbleepisodes. The advantage of this approach relatively to official statistics is that the latterare based on transactions while our approach is based on offers, therefore at an earlierstage of the process. This might then allow for a swifter detection of turning points inthe housing market.
9For the mean price at national level, we compute an alternative index in a bottom-up fashionwhere regional indices are aggregated and weighted by their average share of dwellings sold from LandRegistry data. This weighted mean is shown in Figure 15 in appendix B, which compares to thesimple mean of Figure 5 in section 4. Both show the same trend.
9

4.1 An Application: UK real-estate amidst the Covid-19 crisis
A first indicator is the number of new offers – which indicates whether sellers find it isthe appropriate time to sell their property. In Figure 3, we display the weekly10 numberof new offers. This has clearly been 5 to 6 times less important during the lockdownthan after or before this period.
Figure 3: Weekly new offersSource: Zoopla and authors’ calculation
Another indicator is the number of offers that are still available after one month on thewebsite. This is displayed in Figure 4 on which a strong lockdown effect appears asaround 90% of the offers posted at the beginning of April were still available one monthlater. After the lockdown, the proportion drops progressively and stabilizes around itspre-lockdown level at about two thirds of the total.
10While data are available at daily frequency, looking at a weekly sum has the advantage of takingcare of intra-weekly seasonality in offer posting.
10

Figure 4: Number of offers available after one month on the websiteSource: Zoopla and authors’ calculation
We now turn to daily prices in Figure 5 showing the mean price at national level. Thisfigure and the monthly growth rate recapitulated in Table 2 show a slight decrease fromend-February to the beginning of May, followed by a steady increase after the lockdown.This figure also highlights the role of filtering which removes non-residential offers (e.g.garage, parking, lands) whose average price tends to be lower.
The granularity of our dataset also allows us to explore price trends by categories:available in appendix B, Figures 16, 17, and 18 analyse price level and evolutionsby quantiles while Figure 19 shows the prices by dwelling categories (studio; 2-rooms,etc.). Those decompositions are particularly key to alleviate concerns over compositioneffects that might distort our indices since the lack of surface data impairs computing aprice index per squared meter.11 In the particular case of the Covid-19 crisis, breakingdown the sample by price quantiles or dwelling categories suggests that price trendshave been shared across all types of dwellings.
11It should be however noted that the same issue arises in official statistics which do not provide suchprice index per surface.
11

Figure 5: Selling price evolutionSource: Zoopla and authors’ calculation
Table 2: Monthly selling price evolution (filtered data)Metrics March April May June July AugustMean price (pounds) 439,998 438,847 439,816 451,566 463,071 467,885Monthly change (%) - -0.26 0.22 2.67 2.55 1.04
Taking advantage of the granularity of our dataset, prices can also be observed at locallevel. In Figure 6 we represent price trends for four sub-regions: East England, South-East England, South-West England, and London. While trends are relatively similarfor the first three, the case of London stands out with a continued decline from May tothe end of August. This may be due to a fall in price per squared meter, a compositioneffect with more transactions taking place for smaller surfaces or a mix of the two.
12

Figure 6: Mean selling price per regionSource: Zoopla and authors’ calculation
Using our web-scraped data, we can also focus on how the price fluctuates for eachoffer. Using an offer posted at a given day, we check if it is still available in the nextday and whether its price has changed; we then repeat the same process day after day.Comparing offers for which the price changes over the total number of offers, it appearsthat only a minority of offers (between 8 and 10%) experience price changes with 90% ofthese changes being downward revisions (see Figure 20 in appendix B). In Figure 7,we take a look at the share of offers with price changes after 7, 14, 21, 31 and 45 days onthe market. It shows that at the beginning of the lockdown, sellers were not yet readyto change their prices and adopted a "wait-and-see" approach: a significantly lowershare of offers experienced price changes compared to pre-lockdown period – even foroffers that were in the market for an extended period of time (45 days). However, afterthe lockdown, the share of offers whose price changes has grown rapidly and stabilizedaround levels that appear higher than pre-lockdown levels for offers already staying fora longer period in the market.
13

Figure 7: Share of offers with prices revisions, by number of days already on the marketSource: Zoopla and authors’ calculation
Further analysis on the web traffic related to UK housing market, based on alternativedata from Google Trends and SimilarWeb can be found in appendix C. In particular, itcorroborates our finding that price trends have been quite dissimilar in London comparedto rural areas since the lockdown.
5 Alternative indicators
On top of monitoring in real-time selling prices and sellers’ behaviour in the housingmarket, our dataset allows us to derive alternative indicators to measure complementarydimensions in the housing market. In particular, having the sellers’ perspective allowsus to measure the difference between selling prices and final transacted prices, thereforeproviding an estimate for the buyers’ negotiation margin. Such a metrics is – to thebest of our knowledge – uncharted in the literature, and can prove useful for actors inthe real-estate market (sellers, buyers, intermediaries, and regulators). It can provide,from a policy perspective, an indication of tensions in the housing market which can alsobe proxied through other early indicators such as the rent-to-price or price-to-incomeratios which have been extensively analyzed in the literature (e.g. Lind, 2009 or Bundaand Ca’Zorzi, 2010) – and put into use by regulators to anticipate housing bubbles (e.g.Kelly et al., 2019).
14

5.1 Measuring buyers’ negotiation margin
One main innovation brought by this paper is to get the perspective of the sellers byretrieving the price that sellers are expecting for their dwellings – in contrast withofficial statistics based on the prices of transactions. We have shown how this particularperspective can be exploited to monitor the housing market in real-time in section 4.We now turn to comparing our dataset on selling prices with notarial data on transactedprices: while the latter reflects prices after negotiation, the former reflect the priceinitially expected by the seller. Comparing the two therefore provides information aboutthe negotiation margin of the buyers Mr,t for a region r at a time t as the median of allthe individual negotiation margins for dwellings j transacted and defined – in line withGalesi et al., 202012 – as:
SellingPricej,t − TransactionPricej,tSellingPricej,t
(1)
Land Registry data provide prices for all real-estate transaction in the UK. In thisdataset, dwellings are identified by their exact address, the type of property (e.g. de-tached, semi-detached, flat), the type of dwelling (new-build or not), the transactionprice, and the date of the transaction. Since there is no predefined key to match thesenotarial data with our web-scraped data, we design a matching algorithm based on theK-Nearest-Neighbours (KNN) algorithm first developed by Fix and Hodges, 1951 andwidely used in the machine learning literature (see for example Hastie et al., 2009). Afirst element of comparison would naturally be the address but ads in the web-scrapeddataset are generally not identified by their exact location but in most cases the mostgranular information is the name of the street. The first step is then to transform ad-dresses in both datasets into longitude and latitude coordinates using openstreetmap –a collaborative project creating a free editable world map – in order to compare the dis-tance between dwellings in Land Registry (exact location) and the web-scraped dataset(approximate location). The algorithm then takes the following sequential steps:
1. Starting from a transaction in the Land Registry, it searches whether observationsin the web-scraped share the same longitude and latitude (i.e. at the highestlocational precision possible provided by openstreetmap). If no ad is found, thealgorithm stops and no matching is done for this transaction,
2. On the selected ads, the algorithm retains only those which share the same typeof property (detached, semi-detached, etc.) and the same type of dwelling (new
12However, Galesi et al., 2020 compute the regional index as the average of the individuals margins.
15

or old). If no ad remains, the algorithm stops and no matching is done for thistransaction,
3. On the remaining ads, the algorithm retains only those which share the same timerange – more precisely those ads that are present at least one time in a range ofthree months before and two months after the date of the transaction. If no adremains, the algorithm stops and no matching is done for this transaction,
4. On the remaining ads, the algorithm retains only which those falls within a similarprice range. Specifically, we assume that the transacted price should have experi-enced a maximum decrease of 35% and a maximum increase of 35% compared tothe selling price. If no ad remains, the algorithm stops and no matching is donefor this transaction,
5. At this stage, generally at most a single corresponding ad remains. In the fewcases where several ads remain, the algorithm takes the average of their prices asthey might be considered as indistinguishable with respects to the transaction.
As a consequence of these constraints, not all transactions are matched (around 30%when using only Zoopla data) but this ensures that only very similar dwellings arematched – a pattern that we manually verify. Step 1 in particular eliminates a numberof potential matches given the imprecise location of the web-scraped data. This is inparticular the case in rural regions where a street might cover a wider.
Based on this methodology, Figure 8 shows an estimation of the buyers’ negotiationmargin at local level computed as the average percent change of the transacted priceover the lastly-posted selling price – meaning that if the price on a dwelling changesover time, only the last selling price is kept in the matching with Land Registry. A firstobservation relates to the fact that transacted prices are lower than selling prices acrossall regions, as indicated by a negative negotiation margin. Second, buyers’ negotiationmargin tends to be largely lower in London – as would be expected in a tense housingmarket. On the opposite, the negotiation margin is the double of London’s in North-West England and the East Midlands. These large discrepancies across regions validateex post our granular approach. Finally, while no noticeable change in the negotiationmargin can be detected over our time sample, the temporal dimension should come morerelevant as more data become available – the web-scraping started only as of February2020 – in complement of the cross-section analysis presented here.
16

Figure 8: Negotiation margin per regionSource: Real-estate websites, notarial data, and authors’ calculation
5.2 Rent-to-price ratio
A well-established early indicator is the rent-to-price ratio (see for example Campbellet al., 2009 and Engsted and Pedersen, 2015) which measures whether it is cheaperto rent or own a property. It is used as an indicator of whether housing prices areovervalued and might also be viewed as a proxy for yields in the housing market – nottaking into account taxation. The innovation brought by the web-scraped data is theability to compute such indicators in real-time and more importantly in a very granularfashion. On top of the rent-to-price ratio, other indicators – the price-to-income ratioand a novel purchasing-power-capacity – are also shown in appendix E.
We produce a rent-to-price estimation by matching an offer to rent in our dataset withoffers for sale sharing similar characteristics (ZIP code level, area, number of livingrooms, bedrooms, and bathrooms). To construct such an indicator, we rely on machinelearning techniques and use the KNN algorithm. We compute the rent-to-price for anindividual offer i as:
RTPi =AnnualRenti
1
K
∑Kj=1HomePricej
(2)
17

In our approach, we match every offer with its K = 10 closest ones: for the wholedataset, the rent-to-price ratio stands around 4.1%.13 Our web-scraped data allows usto produce this indicator on a daily basis. A main contribution of our approach lies inthe possibility of providing such an indicator at a very granular level. Regional rent-to-price ratios are represented in Figure 9. It validates our granular approach since itshows large discrepancies across regions. In particular, the London area stands out witha very low rent-to-price ratio which might signal to some extent an over-valuation of thehousing market – corroborating the findings of Marsden, 2015 or more recently Petriset al., in press for some London’s boroughs – or the fact that this location is consideredless risky and that corresponding yield integrates a smaller risk premium.
Figure 9: Rent-to-price ratio per regionSource: Real-estate websites and authors’ calculation
Due to heterogeneous coverage of UK regions in our web-scraped data,14 the rent-to-price ratio for the whole dataset cannot however be considered as a rent-to-price at thenational level due to composition effects. Using the regional rent-to-price ratios, we
13Note that this depends onK. Rent-to-price ratio varies between 3.7 and 4.1 when takingK between10 and 50. However if K is larger, a rental offer will be paired with offers for sale less and less related.In addition, if K is larger, the matching would require more data at local level – When this is not thecase, the matching is impossible. Therefore when K is larger, matching can only be performed in largecities, distorting the computation of the rent-to-price ratio. For those reasons, we choose K = 10 whichappears sufficiently low to match an offer only with comparable ones but sufficiently large to have astatistically meaningful number of offers to compare with.
14See appendix A for the coverage of Zoopla. As explained above, the analysis afferent to theCovid-19 period is only computed based on Zoopla data since the web-scraping of other websites hasonly started later in July 2020.
18

compute a national index using the share of each region in the total number of dwellingsat national level. We find a ratio around 5.1% – to be compared with the 4.1% obtainedfor the unweighted index. This reflects notably the fact that large urban areas withlower ratios are over-represented in our dataset.
6 Conclusion
By web-scraping main real-estate websites in the UK, this paper builds daily indicatorsthat monitor the housing market in real-time. This approach allows for more timelinessthan what can be achieved with official statistics. A second contribution is the highgranularity of our dataset (ZIP code level). In addition, our web-scraping approachon online offers shows the perspective of the sellers – in contrast with official statisticsbased on transactions. We are then able to define a number of innovative indicators forexample the number of new offers, indicating buyers’ willingness to put their propertieson the market, and how the price of existing offers fluctuates over time. The lattergives a very early signal of the housing market dynamics by showing whether sellersare eager to lower their prices to adapt to economic conditions. Finally, matching ourweb-scraped data on selling prices with notarial data on transacted prices allows us toassess the buyers’ negotiation margin.
We use these innovative data to monitor the UK housing market during the Covid-19crisis. The lockdown has been characterized by a freezing of activity in terms of newoffers posted and of price adjustments for existing offers. It appears therefore that sellersadopted a "wait-and-see" approach. However, evidence shows that they have been moreready to lower their prices afterwards – in particular for offers that were already on themarket for a long time. Mean price slightly decreases during the lockdown until thebeginning of May 2020, after which it started to increase at national level. This trendhowever hides regional disparities as the London area has been experiencing a continueddecline in mean selling price since the lockdown. We finally compute rent-to-price ratiosat very granular level, an early indicator for imbalances on the housing market. Whilethere is no evidence for changes in this indicator during the Covid-19 period, it displayslarge heterogeneities across regions – validating somehow our granular endeavour.
A potential limitation is however the lack of timespan since data have been collectedonly since March 2020. While it captures the Covid-19 crisis, the lack of timespan makesit challenging to properly correct for seasonality issues that might bias the indicators.It also makes it difficult to test for the predictive capacities of our innovative indicators.Another limitation is the fact that we cover only the UK, though the approach can beextended seamlessly to other countries – as long as their main real-estate websites allow
19

for web-scraping.
Finally, this analysis can be usefully extended to land prices which, combined withother costs (especially construction costs), and possibly compared with the prices of newdwellings, can give insights about under-/over-investment in the construction sector –see for example Bricongne and Pontuch, 2017.15 Another avenue for future work relatesto computing prices indices for commercial real-estate – a category mostly uncoveredby official statistics. Finally, web-scraped data can serve in econometric models – forexample in nowcasting housing prices or modelling the housing price convergence atlonger-term horizons.
15Preliminary analysis for land prices are performed in appendix D.
20

ReferencesAndré, C., Gil-Alana, L., & Gupta, R. (2014). Testing for persistence in housing price-
to-income and price-to-rent ratios in 16 OECD countries. Applied Economics,46 (18), 2127–2138.
Askitas, N. (2015). Trend-spotting in the housing market. Institute of Labor Economics(IZA) Discussion Papers, No 9427.
Blot, C., Hubert, P., & Odry, R. (2018). Are there asset price bubbles in the euro zone?Revue de l’OFCE, 158, 183–205.
Boeing, G., & Waddell, P. (2017). New insights into rental housing markets across theUnited States: Web scraping and analyzing Craigslist rental listings. Journal ofPlanning Education and Research, 37, 457–476.
Bricongne, J.-C., Coffinet, J., Delbos, J.-B., Kaiser, V., Kien, J.-N., Kintzler, E., Lestrade,A., Meunier, B., Mouliom, M., & Nicolas, T. (2020). Tracking the economy duringthe Covid-19 pandemic: The contribution of high-frequency indicators. Bulletinde la Banque de France, 231.
Bricongne, J.-C., & Pontuch, P. (2017). La crise s’est-elle accompagnée d’un sous-investissement dans l’immobilier résidentiel dans les pays de la zone euro ? RevueEconomique, 68, 129–157.
Bricongne, J.-C., Turrini, A., & Pontuch, P. (2019). Assessing house prices : Insightsfrom « Houselev », a dataset of price level estimates. European CommissionDiscussion Paper, No 101.
Bunda, I., & Ca’Zorzi, M. (2010). Signals from housing and lending booms. EmergingMarkets Review, 11 (1), 1–20.
Campbell, S., Davis, M., Gallin, J., & Martin, R. (2009). What moves housing markets:A variance decomposition of the rent–price ratio. Journal of Urban Economics,66 (2), 90–102.
Carvalho, V., Hansen, S., Ortiz, A., Ramón-García, J., Rodrigo, T., Mora, S. R., &Ruiz, J. (2020). Tracking the Covid-19 crisis with high-resolution transactiondata. Centre for Economic Policy Research Discussion Paper, No 14642.
Case, K., & Schiller, R. (1990). The efficiency of the market for single-family homes.American Economic Review, 79 (1), 125–137.
21

Case, K., & Schiller, R. (2003). Is there a bubble in the housing market? BrookingsPapers on Economic Activity, 2 (2003), 299–362.
Case, K., & Wachter, S. (2005). Residential real estate price indices as financial sound-ness indicators: Methodological issues (BIS, Ed.). In BIS (Ed.), Real estate indi-cators and financial stability.
Cerdeiro, D., Komaromi, A., Liu, Y., & Saeed, M. (2020). World seaborne trade in realtime: A proof of concept for building AIS-based nowcasts from scratch. Interna-tional Monetary Fund Working Papers, No 2020/57.
Chapelle, G., & Eymeoud, J.-B. (2018). Can big data increase our knowledge of localrental markets? Estimating the cost of density with rents. Sciences Po Paris,mimeo.
Chen, S., Igan, D., Pierri, N., & Presbitero, A. (2020). Tracking the economic impactof covid-19 and mitigation policies in Europe and the United States. Covid Eco-nomics: Vetted and Real-Time Papers, 36, 1–24.
Cheng, I.-H., Raina, S., & Xiong, W. (2014). Wall Street and the housing bubble.American Economic Review, 104 (9), 2797–2829.
Chetty, R., Friedman, J., Hendren, N., Stepner, M., & the Opportunity Insights Team.(2020). How did Covid-19 and stabilization policies affect spending and employ-ment? A new real-time economic tracker based on private sector data. NationalBureau of Economic Research Working Papers, No 27431.
Coibion, O., Gorodnichenko, Y., & Weber, M. (2020). Labor markets during the Covid-19 crisis: A preliminary view. National Bureau of Economic Research WorkingPapers, No 27017.
Dujardin, M., Kelber, A., & Lalliard, A. (2015). Overvaluation in the housing marketand returns on residential real estate in the euro area: Insights from data in europer square metre. Banque de France Bulletin Quarterly Selection, 37, 49–63.
Dumbacher, B., & Capps, C. (2016). Big data methods for scraping government taxrevenue from the web, In Proceedings of the joint statistical meetings, section onstatistical learning and data science.
Engsted, T., Hviid, S., & Pedersen, T. (2016). Explosive bubbles in house prices? Ev-idence from the OECD countries. Journal of International Financial Markets,Institutions and Money, 40, 14–25.
22

Engsted, T., & Pedersen, T. (2015). Predicting returns and rent growth in the housingmarket using the rent-price ratio: Evidence from the OECD countries. Journalof International Money and Finance, 53 (100), 257–275.
Fix, E., & Hodges, J. (1951). Discriminatory analysis. Nonparametric discrimination:Consistency properties. USAF School of Aviation Medicine report.
Flood, J. (1997). Urban and housing indicators. Urban Studies, 34, 1635–1665.
Galesi, A., Mata, N., Rey, D., Schmitz, S., & Schuffels, J. (2020). Regional housingmarket conditions in spain. Maastricht University Graduate School of Businessand Economics Research Memoranda, No 29.
Gan, Q., & Hill, J. (2009). Measuring housing affordability: Looking beyond the median.Journal of Housing Economics, 18 (2), 115–125.
Garcia-López, M.-A., Jofre-Monseny, J., Martínez-Mazza, R., & Segú, M. (2020). Doshort-term rental platforms affect housing markets? Evidence from Airbnb inBarcelona. Journal of Urban Economics, 119.
Giudice, V. D., Paola, P. D., & Giudice, F. D. (2020). Covid-19 infects real estatemarkets: Short and mid-run effects on housing prices in Campania region (Italy).Social Sciences, 9.
Goodman, A. (1988). An econometric model of housing price, permanent income, tenurechoice, and housing demand. Journal of Urban Economics, 23 (3), 327–353.
Hanson, A., & Santas, M. (2014). Field experiment tests for discrimination againsthispanics in the US rental housing market. Southern Economic Journal, 81, 135–167.
Hastie, T., Tibshirani, R., & Friedman, J. (2009). The elements of statistical learning,second edition. Springer.
Horn, K., & Merante, M. (2017). Is home sharing driving up rents? Evidence fromAirbnb in Boston. Journal of Housing Economics, 38, 14–24.
Jardet, C., & Meunier, B. (2020). Nowcasting world GDP growth with high-frequencydata. Banque de France Working Papers, No 788.
Kelly, J., Blanc, J. L., & Lydon, R. (2019). Pockets of risk in European housing markets:Then and now. European Systemic Risk Board, No 87.
23

Kiyotaki, N. (1998). Credit and business cycles. The Japanese Economic Review, 49 (1),18–35.
Kiyotaki, N., & Moore, J. (1997). Credit cycles. Journal of Political Economy, 105 (2),211–248.
Kulkarni, R., Haynes, K., Stough, R., & Paelinck, J. (2009). Forecasting housing priceswith Google Econometrics. GMU School of Public Policy Research Paper, No2009-10.
Lewis, D., Mertens, K., & Stock, J. (2020). Monitoring real activity in real time: Theweekly economic index. Federal Reserve Bank of New York Liberty Street Eco-nomics, No 20200330b.
Lind, H. (2009). Price bubbles in housing markets: Concept, theory and indicators.International Journal of Housing Markets and Analysis, 1 (1), 78–90.
Loberto, M., Luciani, A., & Pangallo, M. (2018). The potential of big housing data: Anapplication to the Italian real-estate market. Banca d’Italia Working Papers, No1171.
Marsden, J. (2015). House prices in London – an economic analysis of London’s housingmarket. Greater London Authority Economics Working Papers, No 72.
McLaren, N., & Shanbhogue, R. (2011). Using internet search data as economic indica-tors. Bank of England Quarterly Bulletin, 51, 134–140.
Mense, A., Michelsen, C., & Kholodilin, K. (2017). Empirics on the causal effects of rentcontrol in Germany. FAU Discussion Papers in Economics, No 24.
Miller, N., & Sklarz, M. (1986). A note on leaning indicators of housing market pricetrends. Journal of Real Estate Research, 1 (1), 99–109.
Oust, A., & Martin, E. O. (2018). Can Google search data be used as a housing bubbleindicator? European Real Estate Society, No 2018-151.
Pavlicek, J., & Kristoufek, L. (2019). Modeling UK mortgage demand using onlinesearches. Charles University Prague Working Papers IES, No 2019/18.
Petris, P., Dotsis, G., & Alexakis, P. (in press). Bubble tests in the London housing mar-ket: A borough level analysis. International Journal of Finance and Economics.
24

Polidoro, F., Giannini, R., Conte, R., Mosca, S., & Rossetti, F. (2015). Web scrapingtechniques to collect data on consumer electronics and airfares for Italian HICPcompilation. Statistical Journal of the IAOS, 31, 165–176.
Poon, J., & Garratt, D. (2012). Evaluating UK housing policies to tackle housing af-fordability. International Journal of Housing Markets and Analysis, 5 (3), 253–271.
Quigley, J. (2001). Real estate and the Asian crises. Journal of Housing Economics, 10,129–161.
Rünstler, G., & Vlekke, M. (2018). Business, housing, and credit cycles. Journal ofApplied Econometrics, 33, 212–226.
Slacalek, J. (2009). What drives personal consumption? The role of housing and financialwealth. The B.E. Journal of Macroeconomics, 9, 1–37.
Veldhuizen, S. V., Vogt, B., & Voogt, B. (2016). Internet searches and transactions onthe Dutch housing market. Applied Economics Letters, 23, 1321–1324.
Veronese, G., Biancotti, C., Rosolia, A., Kirchner, R., & Mouriaux, F. (2020). Covid-19and official statistics: A wakeup call?, In 8th IMF statistical forum: Measuringthe economics of a pandemic.
Wu, L., & Brynjolfsson, E. (2015). The future of prediction: How Google searches fore-shadow housing prices and sales (NBER, Ed.). In NBER (Ed.), Economic analysisof the digital economy.
25

A Zoopla geographical coverage
In this paper, our main provider is Zoopla whose offers are web-scraped since March2020 while it started only in July 2020 for other websites. In our analysis of the UKmarket, it should be kept in mind that the geographical coverage of this provider ishowever uneven across the UK territory: in the figure below, it appears in particularthat data for Scotland and Northern Ireland are limited. This is why we also scrapPropertypal and S1homes, specialized in those two regions.
Figure 10: Zoopla’s geographical coverageThe size of a circle represent the average number of daily ads per ZIP code, in red if >
500, blue if < 100, and green otherwise; source: Zoopla and authors’ calculation
26

B Additional graphs
Figure 11: Share of newly built dwellings in the residential real-estateSource: Zoopla and authors’ calculation
Figure 12: Share of offers filtered from the Zoopla datasetSource: Zoopla and authors’ calculation
27

Figure 13: Median selling prices by regionSource: Zoopla and authors’ calculation
Figure 14: Statistically-adjusted geometric average selling prices by regionIn pounds per dwelling, source: Land Registry
28

Figure 15: Mean selling prices as a weighted average of regional indicesSource: Zoopla and authors’ calculation
Table 3: Ads removed during a month compared to transactionsAverage monthly data
Zoopla Rightmove OnTheMarket
Transactions(Land Registry)
Total dwellings(ONS)
East Midlands 8832 16758 9075 7378 1961000East of England 14649 26590 17969 8945 2520000London 23693 32274 23923 8862 3318000North East England 4531 8472 7097 3959 1164000North West England 14691 22935 11949 11172 3111000South East England 25838 41095 28253 12974 3683000South West England 13053 23346 16428 8909 2403000West Midlands 10160 17378 11645 7995 2358000Yorkshire and the Humber 9664 15505 11116 8175 2294000
29

Figure 16: Weekly percentage change per quantileSource: Zoopla and authors’ calculation
Figure 17: Monthly percentage change per quantileSource: Zoopla and authors’ calculation
30

Figure 18: Price by quantileSource: Zoopla and authors’ calculation
Figure 19: Mean price by dwelling typeSource: Zoopla and authors’ calculation
31

Figure 20: Price changes as the share of total offersSource: Zoopla and authors’ calculation
32

C Web traffic statistics during the Covid-19 crisis
C.1 Google Trends
Google Trends data show a strong effect of Covid-19 on real-estate-related Googlesearches. Searches for "Zoopla" was plummeting during the first lockdown while thoserelated to "mortgage" peaked – potentially suggesting that some households had envis-aged renegotiation. This peculiar Covid-19 period stands out with a clear decorrelationbetween these two terms, a unique feature in the last 5 years – see Figure 21 .
Figure 21: Google Trends for "mortgage" and "Zoopla" over the last 5 yearsSource: Google Trends and authors’ calculation
C.2 Similar Web
SimilarWeb, which provides audience data for websites, gives a complementary andcongruent view. The loss of traffic during the Covid-19 period is visible in Figure 22as the real-estate industry in the UK lost a quarter of its traffic in March.
33

Figure 22: Real-estate Industry - Total monthly web traffic
SimilarWeb also shows geographical heterogeneities in this pattern, confirming to someextent the disparities observed in section 4 regarding the evolution of the mean sellingprice. As shown in Figure 23, web traffic related to property sales in London (the areamost affected by the virus) dropped by 12% in March 2020 compared to 2019, while thedecline was only 7% for home counties (region immediately outside London). Furtheraway from London, in the city of Canterbury, the traffic related to property sales insteadgrew by 20%. Also, the traffic for rentals proved more resilient than for non-rentals asthe former declined only by 10% year-on-year vs. a 17% drop for the latter.
Figure 23: SimilarWeb summary
34

D Land prices
Part of the scraped data is also labeled as lands and farms. The evolution of land pricesin levels is shown in Figure 24. It should however be noted that web-scraped offersfor lands include agricultural lands and leisure lands. In future research, identifyingbuilding plots could inform on the evolution of this factor in the construction sector.
Figure 24: Land pricesSource: Zoopla and authors’ calculation
35

E Price-to-income ratio and purchasing-power-capacity
Another well-established early indicator in the literature is the price-to-income ratio(André et al., 2014) which measures the number of years of median income necessaryto buy a dwelling. It measures the affordability of the housing (the lower, the moreaffordable) and can be used to analyse the long-term equilibrium of the housing market(Goodman, 1988). Our main contribution to the existing literature is the capacity tocompute those ratios at very granular level – building on findings such as those of Ganand Hill, 2009 that a finer picture is more relevant than the national median price-to-income ratio. This heterogeneity can be verified with Figure 25 built on historicalprices and incomes from the ONS.
Figure 25: Price-to-income ratio per localitySource: ONS and authors’ calculation
However the aforementioned price-to-income ratio does not take into account interestrates – as well as other factors that can impact housing prices (see Case and Schiller,1990). To take into account mortgage rates, we propose the purchasing-power-capacity(PPC) based on the following formula:
D: median duration
36

ER: maximum effort rate
MR: mortgage rate
ITP : income-to-price ratio
PPC =ER
MR∗ ITP ∗
[1− 1
(1 +MR)D
](3)
Using historical data from the ONS about income and housing price, and mortgage ratesfrom the Bank of England (or the Building Society Association if not available), thisis possible to derive a PPC index for each of the 400 localities in the UK. To computethe index we assume a maximum effort (ER) rate of 33% – which is widely taken asthe upper limit for the effort rate in France – and a median duration (D) of 15 years.Results are plotted in Figure 26.
Figure 26: PPC per localitySource: ONS and authors’ calculation
We then explore the signalling power of this new indicator. Considering data on PPCand on real-estate crisis per locality, we test whether there exists a threshold maximizingthe signalling power of the PPC (i.e. a threshold value above which the PPC signals a
37

potential risk of housing crisis entailing an adjustment of housing prices). More formally,the signalling power is defined as follows:
TP : true positive, i.e. PPC > threshold and a housing crisis actually occurs
FP : false positive, i.e. PPC > threshold but no housing crisis actually occurs (incorrectprediction of a crisis)
TN : true negative, i.e. PPC < threshold and no housing crisis actually occurs
TP : false negative, i.e. PPC < threshold but a housing crisis actually occurs (incorrectprediction of no crisis)
SignallingPower =TP
TP + FN+
TN
TN + FP− 1 (4)
The signalling power (also named "informedness" or "bookmaker informedness") canreach 0.48 for an optimal threshold near 0,003.16 It should be in particular noted thatthe signalling power of the PPC is higher than for the price-to-income ratio for whichit stands only around 0.34. Comparing this threshold with actual values in Figure 27,it appears that many localities in the UK are still above this threshold.
1615,000 potential thresholds have been tested.
38

Figure 27: PPC per locality compared with optimal thresholdSource: ONS and authors’ calculation
39