Embed Size (px)
Citation preview

GROUP 9 KRISHA PAULA OLANDAY VINAY PANJABI VINAY SHIVAKUMAR NEHA DESAI JONATHAN HAAS SIVARAMHARESH SIVA DROPBOX: HTTPS://WWW.DROPBOX.COM/SH/58UOMDLU8CB6IPI/9FRUKZ7NXK WEBSITE: HTTPS://BITBUCKET.ORG/VINKNEE/STOCKFORECASTER-GROUP-9 INSTRUCTOR: IVAN MARSIC
Web-Based Stock Forecaster REPORT 3

1 | P a g e
TABLE OF CONTENTS
1 Contribution Breakdown .............................................................................................................5
2 Costumer Statement of Requirements ........................................................................................5
2.1 Problem ......................................................................................................................................... 5
2.1.1 Investors are not able to predict a stock’s future performance due to various factors. ...... 5
2.1.2 Investors do not understand the company's business model or the company itself. .......... 6
2.1.3 Not having all the stock information in one area. ................................................................ 6
2.1.4 Investors not being able to visualize a stock's history and how it rises and falls. ................ 6
2.1.5 Investors not in touch with current company events, world events and the economy. ...... 6
2.1.6 Investors cannot easily compare potential stocks to view which stock(s) will provide the
best possible yield. ................................................................................................................................ 7
3 Glossary of Terms .......................................................................................................................7
4 System Requirements .................................................................................................................9
4.1 Enumerated Functional Requirements ......................................................................................... 9
4.1.1 Anaylsis: Enumerated Functional Requirements .................................................................. 9
4.2 Enumerated Nonfunctional Requirements ................................................................................. 10
4.2.1 Analysis: Enumerated NonFunctional Requirements ......................................................... 11
4.3 On-Screen Appearance Requirements ........................................................................................ 11
4.3.1 Screen Mockup .......................................................................................................................... 12
4.3.1 Analysis: On-Screen Appearance Requirements ................................................................. 12
5 Functional Requirements Specification ...................................................................................... 13
5.1 Specifying the discovered requirements: ................................................................................... 13
5.2 Stakeholders ............................................................................................................................... 13
5.3 Actors and Goals ......................................................................................................................... 13
5.4 Use Case Casual Description ....................................................................................................... 14
5.4.1 Use Case Analysis ................................................................................................................ 15
5.5 Traceability Matrix ...................................................................................................................... 17
5.6 Use Case Fully-Dressed Description ............................................................................................ 17
5.6.1 ObtainPrediction ................................................................................................................. 17
5.6.2 DataAcquisition ................................................................................................................... 18
5.7 System Sequence Diagram .......................................................................................................... 19
6 User Interface Specification ...................................................................................................... 20
6.1 Preliminary Design ...................................................................................................................... 20

2 | P a g e
6.2 User Effort Estimation ................................................................................................................. 23
7 Effort Estimation using Use Case Points ..................................................................................... 23
7.1 Search for a stock: ....................................................................................................................... 23
7.2 Add a stock: ................................................................................................................................. 23
7.3 Check News: ................................................................................................................................ 23
7.4 Portfolio: ..................................................................................................................................... 23
8 Domain Analysis ....................................................................................................................... 24
8.1 Domain Model ............................................................................................................................ 24
8.1.1 Concept Definitions ............................................................................................................. 24
8.1.2 Association Definitions ........................................................................................................ 26
8.1.3 Attribute Definitions ........................................................................................................... 27
8.1.4 Traceability Matrix .............................................................................................................. 29
8.2 System Operation Contracts .......................................................... Error! Bookmark not defined.
8.2.1 ObtainPrediction ................................................................................................................. 29
8.2.2 DataAcquisition ................................................................................................................... 30
8.2.3 SearchForStock.................................................................................................................... 30
8.3 Mathematical Model .................................................................................................................. 30
8.3.1 Moving Average Model ....................................................................................................... 30
8.3.2 Relative Strength Index (RSI) Model ................................................................................... 33
9 Interaction Diagrams ................................................................................................................ 35
10 Class Diagram and Interface Specification.................................................................................. 38
10.1 Class Diagram ............................................................................................................................. 38
10.2 Data Types and Operation Signatures ........................................................................................ 38
10.2.1 UserInterface Package ........................................................................................................ 38
10.2.2 Database Package ............................................................................................................... 40
10.2.3 Prediction Package .............................................................................................................. 41
10.2.4 WebPage Package ............................................................................................................... 42
10.3 Design Patterns ........................................................................................................................... 43
10.3.1 Design Patterns That can Add new Functionality ............................................................... 43
10.3.2 Design Patterns Used ............................................................. Error! Bookmark not defined.
10.4 Traceability Matrix ...................................................................................................................... 44
11 System Architecture and System Design .................................................................................... 45
11.1 Architectural Styles ..................................................................................................................... 45

3 | P a g e
11.2 Identifying Subsystems ............................................................................................................... 45
11.3 Mapping Subsystems to Hardware ............................................................................................. 46
11.4 Persistent Data Storage .............................................................................................................. 46
11.4.1 Table 1: User ....................................................................................................................... 46
11.4.2 Table 2: Stock ...................................................................................................................... 47
11.4.3 Table 3: Stock Data.............................................................................................................. 47
11.4.4 Table 4: Portfolio ................................................................................................................. 47
11.5 Global Control Flow .................................................................................................................... 47
11.5.1 Execution Order .................................................................................................................. 47
11.5.2 Time Dependency ............................................................................................................... 47
11.5.3 Concurrency ........................................................................................................................ 48
11.6 Hardware Requirements ............................................................................................................. 48
11.6.1 Disk Storage ........................................................................................................................ 48
11.6.2 Communication network .................................................................................................... 48
11.6.3 Device Flexibility ................................................................................................................. 48
12 Algorithms and Data Structures ................................................................................................ 48
12.1 Moving Average Model ............................................................................................................... 48
12.2 Relative Strength Index ............................................................................................................... 50
12.3 Data Structure Usage .................................................................................................................. 52
13 User Interface Design and Implementation................................................................................ 53
13.1 Login ............................................................................................................................................ 53
13.2 Sign Up/Registration ................................................................................................................... 54
13.3 Navigation ................................................................................................................................... 54
13.4 Stock Page ................................................................................................................................... 54
13.5 Home ........................................................................................................................................... 54
13.6 Portfolio ...................................................................................................................................... 55
13.7 News............................................................................................................................................ 55
13.8 FAQ .............................................................................................................................................. 55
14 Design of Tests ......................................................................................................................... 55
14.1 User Interface testing ................................................................................................................. 55
14.1.1 Use Case 1 – Search for Stock ............................................................................................. 55
14.1.2 Test 1 – Controller Received and Sent Input Request ........................................................ 55
14.1.3 Test 2 – Database Connection ............................................................................................ 56

4 | P a g e
14.2 Stock Page ................................................................................................................................... 56
14.2.1 Test 1 – Load Page .............................................................................................................. 56
14.2.2 Test 2 – Graph ..................................................................................................................... 56
14.3 Web Pages ................................................................................................................................... 56
14.3.1 Test 1 – Load Page .............................................................................................................. 56
14.4 Prediction Algorithm Testing ...................................................................................................... 56
14.5 Integration Testing ...................................................................................................................... 56
15 History of Work ........................................................................................................................ 57
15.1 Sub Teams Past Work ................................................................................................................. 57
15.2 Future Work ................................................................................................................................ 58
16 References ............................................................................................................................... 59

5 | P a g e
1 CONTRIBUTION BREAKDOWN
All members contributed equally.
2 COSTUMER STATEMENT OF REQUIREMENTS
Investing money in the stock market is relatively easy but investing successfully and earning a profit can
be a challenge and most non-professional investors lose money every year. There are many reasons why
this can occur but the primary reason behind this is the fact that most investors just do not have the
time and resources to implement the lengthy analysis that takes place by full-time investors or
employees of large investment organizations. Professional investors and firms have an advantage; they
have a team of investors to help with the research and spend their entire careers studying the markets.
On the other hand, normal investors do not have such a luxury, many of whom work far away from the
field of investments. If you've read articles about investment, many of them refer to investing as dating
and long term investing is akin to marriage. Just like dating and eventually marriage, investing requires
the investor to know the company they are investing in and it also requires a lot of commitment.
With this realization, our project will attempt to benefit a broad range of investors by providing
calculated predictions as a tool for them to make their own decision on whether to buy, sell, or hold the
stock. We will also provide them with as much information and current news about the company.
2.1 PROBLEM In order to reduce the amount of research for investors our team has identified these problems:
2.1.1 Investors are not able to predict a stock’s future performance due to various factors.
The topic of "can the stock market be predicted?" has always been a hot topic in the financial
world. The stock market is constantly rising and falling on a daily bases, stocks can go up a
certain amount one day and then the next day their prices may have gone down significantly. In
the long term, you cannot predict stocks with precision and it's impossible to predict stocks in
the short term. So the question is, what do you use to predict the constant rise and fall of the
stock prices and should you even waste time trying to obtain a prediction when the behavior is
deemed to be unpredictable?
There are three broad categories in stock prediction methods: fundamental analysis, technical
analysis, and technological methods. These three methods rely on the analysis of past data and
stock performance and are highly mathematical. However, once all the mathematical and logical
research has been obtain, when can you take the volatility and emotional aspects of buying and
selling stocks into consideration? Once again time is a big issue for individual investors and that
same question pops up again. Should time be even spent in finding the right kind of prediction
method?
Our solution to this problem is providing a stock prediction for the individual investor. They no
longer have to do their own research in order to generate a forecast; we will do that for them.
On the website, we will state what kind of prediction model we use to generate the prediction.

6 | P a g e
This is a method of accountability and investors do not need to question where such numbers
came from. From these predictions, it is then up to the investor on whether they should buy, sell,
or hold the stock.
2.1.2 Investors do not understand the company's business model or the company itself.
As mentioned before, would you date a person whom you know nothing about? It's the same
for stocks; investors should not invest in a stock without knowing these three things: what the
company actually does how they make a profit, and the company's fundamentals. The
company's fundamentals enable you to see the how the company is doing financially; it can
include its balance sheet, government filings, investor reports, etc. It's very common for
individual investors to not know much about the company they are trying to invest in or they
have a preconception of how well the company is doing and what they are best known for. The
problem with this is, how will investors be able to know when to buy or sell a stock if they don't
know exactly how the company is making money and if their assets will still be popular with
consumers in the future? Investors should also know the financial stability of the company. If an
investor does not know the financial stability of the company, then they may end up investing in
a company that has a lot of debt.
To remedy this problem, we will include a short description of what the company does and their
primary method of making money. This way, investors have a small inkling of what the company
does right on the page. We will also include a link to the U.S. Securities and Exchange
Commission's EDGAR database. This database contains financial statements for all U.S public
companies.
2.1.3 Not having all the stock information in one area.
When doing all this research, an investor will have to look for all of this information in various
places. Because of this, it's hard to keep track of all of the information. We as a team will try to
provide all relevant stock information on the page and in the website. The website will also
include quick links to other helpful sites such as Forbes.com and the EDGAR database.
2.1.4 Investors not being able to visualize a stock's history and how it rises and falls.
Not everyone is a visual person. Therefore, our stock data will be shown as a linear regression
graph of time versus price. This way investors can view the rise and fall of the stock price. The
prediction will be an extension from the current stock value on the graph and will help investors
see how the stock will perform relative to the current and past values.
2.1.5 Investors not in touch with current company events, world events and the economy.
To keep up with the latest news, the website will include a "What's Trending" page. The page is
where investors can view and read current news, world events, and companies are up to.

7 | P a g e
2.1.6 Investors cannot easily compare potential stocks to view which stock(s) will provide the best
possible yield.
Do you notice that on many websites that sell some sort of product, they have a "previously
viewed" section somewhere on the webpage? In order to help investors compare future stocks
with each other, we will create a comparative list of previously search stocks with their
prediction values. It will be something similar to a "previously viewed" section on a website such
as Macys.com. This way as investors search for potential stocks, they will see how well it
performs in the future compared to the previously searched companies.
3 GLOSSARY OF TERMS
52 Week
High/Low
Highest and lowest prices of a stock that has been recorded at during the previous
year.
Average Volume The amount of stocks that traded over duration of time.
Buy and Hold The practice of buying a good for a long term rather than trying to turn a profit
quickly.
Closing Price The price a particular stock closes at on a given trading day.
Dividend A distribution of a portion of a company's earnings, decided by the board of
directors, to a class of its shareholders. The dividend is most often quoted in terms
of the dollar amount each share receives (dividends per share). It can also be
quoted in terms of a percent of the current market price, referred to as dividend
yield.
http://www.investopedia.com/terms/d/dividend.asp
Earnings per
Share (EPS)
The portion of a company's profit allocated to each outstanding share of common
stock. Earnings per share serves as an indicator of a company's profitability. It
is calculated as (Net Income -Dividends on Preferred Stock) / divided by the
Average Outstanding Shares
http://www.investopedia.com/terms/e/eps.asp
Forecast A prediction of the future based on special knowledge
Fundamental
Trading
Fundamentalists trade companies based on fundamental analysis, which examines
things like corporate events such as actual or anticipated earnings reports, stock
splits, reorganizations or acquisitions.
http://www.investopedia.com/articles/trading/02/100102.asp

8 | P a g e
Individual
Investor
An investor who purchases relatively small lots of stocks for his or her own
portfolio.
Institutional
Investor
An entity with large amounts to invest, such as investment companies, brokerages,
and investment banks. Institutional investors are covered by fewer protective
regulations because it is assumed that they are more knowledgeable and better able
to protect themselves. Institutional investors are usually a group of people, rather
than individuals.
Market Trend The tendency of a financial market to move in a particular direction over time. Bull
market refers to an upward trend, and a bear market refers to a downward trend.
Momentum
The notion that an asset’s price is likely to move in one direction instead of
changing directions
Moving Average
Prediction
Model
A way to predict the future price of stocks based on the assumption of constant
underlying mean of given prices
Opening Price The price a stock starts off at a particular trading day.
Relative
Strength Index
(RSI)
A leading indicator that looks at the recent gains of the asset to the recent losses of
the asset to determine whether that particular asset is oversold or overbought
Shares See Stock
Stock A type of security that signifies ownership in a corporation and represents a claim
on part of the corporation's Assests and earnings.
Stock Market The marketplace for buyers and sellers of stocks.
Stock Symbol A unique set of symbols that represent a particular company. Ex: GOOG is the
stock symbol of Google.
Ticker See Stock Symbol
Trading Day The duration of time the stock market is open for buying and selling stock. Ex: For
the New York Stock Exchange trading day is 9:30 AM Eastern Time to 4:00 PM
Eastern Time, trading days never occur on weekends.

9 | P a g e
4 SYSTEM REQUIREMENTS
4.1 ENUMERATED FUNCTIONAL REQUIREMENTS
4.1.1 Anaylsis: Enumerated Functional Requirements
Our main requirement is to be able to obtain the historical data for all or most stocks (REQ-1) in the
Yahoo! Finanace API and then from this data be able to generate a prediction (REQ-5). The user will then
be able to search a stock on the website (REQ-3) and the system will return a webpage with all the
stock’s information, graph of historical data with the prediction as an overlay (REQ-11).
For REQ-1, our end goal is to have all the stocks listed in Yahoo! Finance to be stored in the database.
However, for demo and test purposes, we will only have 100 or so of the top fortune 500 companies in
the database. However, if a user does search for a stock that is not in the database, the system will
query the information from Yahoo! Finance and the user will still be able to obtain the information.
Identifier Priority Requirement
REQ 1 5 The system will acquire past stock prices and data from all stocks listed on Yahoo! Finance on a daily basis. The stock data will then be placed into a stock database.
REQ 2 3 The program will output the stock prices as a graph of price versus date.
REQ 3 4 The system will allow for users to search for the stock based on the stock ticker or the company name
REQ 4 5 Understand and implement the moving average prediction model or the decided prediction for the closing price of the stock prices.
REQ 5 3 The stock data stored in the database will be used by the prediction algorithm to calculate the stock’s prediction.
REQ 6 4 The graph generated by the program will also include the estimate of the future price.
REQ 7 3 The website should display the graph of the stock prices. The graph should depend on the input of the stock ticker.
REQ 8 3 The program should have a data structure (portfolio) that holds all the stock tickers that the user is interested in.
REQ 9 2 The website should display the current tweets or news articles from reputable sources.
REQ 10 3 The system should be password protected so only users with access can view the website.
REQ 11 5 Each stock shall have its own page in the website with all of the stock information on the page.
REQ 12 5 All stocks in the database can be searched and accessed through the search bar.

10 | P a g e
REQ-5 and REQ-11, are straight to the point, the prediction algorithms that the Prediction Team will
create uses the historical data stored in the database to generate a prediction model to be graphed
alongside the stock’s historical values.
The users will need to find information on a stock they are interested in. Therefore, we will have a static
search bar at the top of the site (REQ-25). Where users will be able to enter a stock ticker or the
company’s name and search for that stock in the database (REQ-3). If the stock is not found, the
database will quickly query the data from Yahoo! Finance. This will cause a slight delay for the
information to be sent to the user, because the system needs to obtain and generate the information.
On the other hand, if the user enters an invalid ticker, or the system does not recognize the company
name, the system will return a “Sorry, stock cannot be found’ page with a small list of suggested stocks
that were close to the one they entered.
4.2 ENUMERATED NONFUNCTIONAL REQUIREMENTS
Identifier Priority Requirement
Fun
ctio
nal
ity
REQ 13 5 Provide customers with predictive data on the stock market to aid their trading decisions.
REQ 14 5 The prediction will use market data and indicators from the database, such as RSI and stochastics, as input to the predictive algorithm.
REQ 15 4 Website will also display normal data on the stock such as the current price and volume.
Usa
bili
ty
REQ 16 2 Website will host the stock prediction as an overlay on the price graph.
REQ 17 3 The database will be updated daily to account for the daily changes to stock values.
REQ 18 4 Site will be simple and clean so that the customer can view everything easily.
Rel
iab
ility
REQ 19 4 Earnings reports can cause unpredictable changes in a stock. The earnings date can be shown to a user as a warning about predictions surrounding that date
REQ 20 3 Prediction models will be updated daily.
REQ 21 3 Data backed up in the case of a site failure.

11 | P a g e
Pe
rfo
rman
ce
REQ 22 3 Current data transfer rates should allow for quick and easy navigation of the site and its features.
Sup
po
rtab
ility
REQ 23 2 The service will be available in the form of a website, which will allow it to be accessed by most browsers.
REQ 24 2 Configuration options available to users.
4.2.1 Analysis: Enumerated NonFunctional Requirements
The key requirements are REQ-17 and REQ-20. In order for all the stock data to be up to date, the
database will be updated daily and the prediction algorithms as well. Updating both the database and
the prediction algorithm on a daily basis, is just a place holder value. Ideally, it should be updated more
than once a day, since stock values change every hour, but our team has not decided on how many
times a day the information will be updated (hourly, twice, three times). Since we did come to the
conclusion that it will be updated at least once a day that is what we stated here.
4.3 ON-SCREEN APPEARANCE REQUIREMENTS
Identifier Priority Requirement
REQ 25 5 A fixed navigation bar that includes all of the functional features, allowing the user to quickly navigate to any feature that they may choose without going through various subpages and menus.
REQ 26 5 The page must adapt to a various sizes in order to maintain functionality, consistent design, as well as ease of use on a mobile device
REQ 27 5 The website must support the latest versions of the most popular browsers, Google Chrome, Firefox, and Internet Explorer.
REQ 28 4 Function and purpose of each element on screen must be clear and direct by placing information in natural areas where natural will be defined based on other popular stock websites, as well as developer/designer intuition

12 | P a g e
4.3.1 Screen Mockup
Figure 4-1. Basic outline of a Stock's subpage
4.3.1 Analysis: On-Screen Appearance Requirements
REQ 26 - This is exemplified in the top portion of figure 4-1 in section 4.3.1, screen mockups, which has
the search bar, and navigation tabs to all of the site features at the top of the screen. There are no pages
outside of what can be accessed from the navigation bar.
REQ 29 - This requirement is rather vague yet important at the same time. This is related to REQ 26
however that relates more toward navigation, this is referring to the actual pages that will be loaded
and where the placement of information will be. An idea to meet this requirement is seen in figure 4-1.

13 | P a g e
5 FUNCTIONAL REQUIREMENTS SPECIFICATION
5.1 SPECIFYING THE DISCOVERED REQUIREMENTS: Architectural style: Web-based – The programs will run on a Web Browser and each user’s portfolio will
be stored; their portfolio includes a list of all the stock tickers, information for those stocks, and
corresponding graphs for those stocks. All information could be stored in a common database or on an
Excel Spreadsheet. There is no form of client communication, but if we feel as if it could be an added
benefit to the website, it can be implemented in the future.
5.2 STAKEHOLDERS The stakeholders of our system are:
Individual Investors Unlike institutional investors who have a team at their disposal, individual
investors don't have such a luxury and will benefit from our web application.
These investors have a broad range of assets (usually smaller than
institutional investors) and can either invest in the short or long term. They
usually purchases small lots of stock (1-5) depending on the value of their
assets. The individual investor is your standard person who does not use
investing as their primary source of income.
5.3 ACTORS AND GOALS Our system has both human and non-human actors.
User The user will take the form of an investor that registers and uses the website
Administrator The manager that is in charge or keeping the system updated and in working
order
Prediction Algorithm The algorithm(s) that will calculate the prediction.
Database The database will hold all the user data and information as well as all the stock
information. All the user information and their portfolios will be stored in the
database.
Yahoo! Finanace API The API is where we will pool all stock data from to store into the database to
generate the prediction.
Highchart Will be used to graphically plot the stock data.

14 | P a g e
5.4 USE CASE CASUAL DESCRIPTION
UC - 1 SearchForStock (REQ3, REQ7, REQ12)
Allows a registered user to search for a stock they want information on.
UC - 2 ObtainPrediction (REQ2, REQ3, REQ6 REQ13)
Obtains the input parameters for the prediction algorithm to calculate the prediction. Once the prediction is calculated, a graph will then be generated with both the stock’s historical data and prediction.
UC - 3 DataAcquisition (REQ1)
In order to obtain a prediction and generate a graph, we will need to retrieve stock and market data from the Yahoo! Finance API and store it into the database. This is done in the background. If the stock is not already in the database, an algorithm will query Yahoo! Finance for the requested data.
UC - 4 CalculatePrediction (REQ4, REQ5)
From the input parameters, the prediction algorithm will calculate the stock’s prediction.
UC - 5 Login (REQ10)
In order to access the website, users need to login. This why users will have their own portfolio. Also the home page of the website is customized according to the user's portfolio.
UC - 6 Register (REQ10)
Allows a visitor to fill out the registration form, allowing them access to the entire website
UC - 7 ManageUser (REQ10)
New users will be added to the database and current users will have their information updated in the data base.
UC - 8 AddUser (REQ10)
Enters new registered users' information to the database
UC - 9 EditUserInformation (REQ10)
Allows users to edit and change/update their information such as passwords, emails, and other account settings
UC - 10 ManagePortfolio (REQ8)
Allows users to add or remove stocks in their portfolio
UC - 11 News (REQ9)
Users will have access to current events and news regarding different companies directly on our site.
UC - 12 DisplayWebpage (REQ11, REQ13)
Once all the information has been obtained, the system will display the requested information on the stock webpage.

15 | P a g e
5.4.1 Use Case Analysis
UC-12 where “Users will have access to current events and news regarding different companies directly
on our site” isn’t strictly limited to our website. We could potentially also provide links to the specific
different companies on our websites, which could provide another source of information for the
investor. Also UC-12 is meant to attract users since investors always want to stay up to date with stock
news daily and updating this can attract more users.
UC-10, which states, “Allows users to edit and change/update their information such as passwords, emails,
and other account settings” doesn’t necessarily derive from requirement 11. However, it is a feature
that is available on all login protected accounts in case a user wants to change user information such as
privacy or password. It should be provided to give the user more flexibility and personalize the
experience for him or her.
From the twelve use cases above, we were able to create a use case diagram of our system. We have
decided to not include UC-12 which would display the news directly on our website. This use case does
not involve any actors and it is just an integral part of the website. Users can easily access the news
section by clicking on the "News" tab on the navigation bar. Figure 5.1 shoes the system use case
diagram.

16 | P a g e
Figure 5-1: Use Case Diagram of System

17 | P a g e
5.5 TRACEABILITY MATRIX PW UC1 UC2 UC3 UC4 UC5 UC6 UC7 UC8 UC9 UC10 UC11 UC12
REQ1 5 X REQ2 3 X
REQ3 4 X X
REQ4 5 X REQ5 3 X REQ6 4 X
REQ7 5 X
REQ8 3 X
REQ9 2 X REQ10 3 X X X X X REQ11 5 X
REQ12 5 X
REQ13 5 X X
Max PW 5 5 5 5 3 3 3 3 3 3 2 5 Total PW 19 16 5 8 3 3 3 3 3 3 2 10
Table 5-1: Traceability Matrix
5.6 USE CASE FULLY-DRESSED DESCRIPTION Out of all the use cases that we have come up with, there are four important use cases: register, login,
searchStock, and ManagePortfolio
5.6.1 ObtainPrediction
This table shows a detailed summary of the ObtainPrediction use case. The interactions is defined as
follows:
UC- 2: ObtainPrediction
Related Requirements REQ2, REQ5, REQ6, REQ7 Initiating Actors User Actor's Goal Return graph of the stock’s historical data and prediction should be
displayed on the stock’s page. Participating Actors Database, Prediction Algorithm, Highcharts Preconditions All stock data is in the database Success End Condition The stock’s page is loaded with the graph of the historical data and
prediction. Failed End Condition - Flow of Events for Main Success Scenario:
1. -> User searches for a stock 2. <- System locates the stock in the database 3. -> System sends historical values to Prediction Algorithm 4. <- Prediction Algorithm calculates and returns the prediction 5. <- System generates a graph of the historical data with the prediction as an overlay. 6. <- System loads the graph and all stock information onto the stock’s page

18 | P a g e
5.6.2 DataAcquisition
This table shows a detailed summary of the DataAquisition use case. The interactions are defined as
follows:
UC-3: DataAcquisition
Related Requirements REQ1 Initiating Actors User, Database Actor's Goal Obtain the stock data from the Yahoo! Finance API Participating Actors Yahoo! Finance API Preconditions Stock is currently not in the database Success End Condition The stock was successfully found in Yahoo! Finance and stored in the
Database Failed End Condition Stock was not found in Yahoo! Finance Flow of Events for Main Success Scenario:
1. -> User searches for stock 2. -> System searches Database for stock
a. If stock is not found i. -> Database queries Yahoo! Finance for stock data
ii. <- Database stores acquired stock data Flow of Events for Extensions:
1. Yahoo! Finance does not have the stock requested a. <- Database sends System error signal b. <- System sends user a “Stock cannot be found’ page with suggested stocks that are
similar to the searched stock

19 | P a g e
5.7 SYSTEM SEQUENCE DIAGRAM

20 | P a g e
6 USER INTERFACE SPECIFICATION
6.1 PRELIMINARY DESIGN
When the user loads our webpage, they do not have access to its content. Therefore, the first thing the
user will see is the login screen. On here, if they are already registered, they can simply fill in their
username and password in the boxes and click on login to access the site. If they are not registered, they
can just click on the "Register" button.

21 | P a g e
They can then register by filling in the information and hitting the "Register" button. After registration or
logging in, the User will be taken to the home page. The home page itself is customized according to the
User's portfolio and the current stocks they have. The home page consists of all of the User's stock's
shown on one graph. It will also show the User which stock is gaining the most income and which one is
the biggest loss. On the right hand side of the page, the User will see news articles and snippets of the
stocks he/she has in their portfolio.
If they click on the "My Portfolio" tab, the user will be brought to their portfolio. This is where they can
remove or add stocks to their portfolio. They can also add and remove by different quantities.

22 | P a g e
When a user searches for a stock, they will be shown the screen below.
The stock and its ticker will be displayed at the top right hand side of the screen and that is what will
identify that this is the page for the given stock. Underneath the title is the latest news about the ticker.
Underneath that will be a list of previously searched stocks. This will enable investors to quickly
compare stocks. The right hand side will have a plot of the ticker’s historical data. This plot will also plot
the prediction as an extension of the historical plot data.

23 | P a g e
6.2 USER EFFORT ESTIMATION The goal of designing our system was to create a clean and simple to use interface, clearly labeling each feature of the site on the homepage to avoid navigation and provide clarity. The following user effort estimations take the assumption that the user is already logged in and sitting on the home page.
1. Search for a stock prediction/information - 1 mouse click, 3 keystrokes minimum (depending on stock ticker length)
a. 1 mouse-click on the search field on home page b. Enter the stock ticker (minimum 2 keystrokes, average would be 3-4) c. Hit enter (1 keystroke) 2. Add a stock to your portfolio - 4 mouse click, 4 keystrokes a. Click "My Portfolio" on the home page b. Click the textbox to add ticker c. Enter ticker info (minimum 2, up to 4 keystrokes) d. Clock quantity textbox e. Enter quantity (minimum 1 digit/keystroke) f. Click "add" 3. Check News/View Portfolio Information/Frequently Asked Questions (1 mouse click) a. Click respective link on navigation bar
4. View combined portfolio/biggest loss and gain/portfolio news feed (0 clicks)
For all the different use cases we used this formula to calculate the duration:
7 EFFORT ESTIMATION USING USE CASE POINTS
7.1 SEARCH FOR A STOCK:
7.2 ADD A STOCK:
7.3 CHECK NEWS:
7.4 PORTFOLIO:

24 | P a g e
8 DOMAIN ANALYSIS
8.1 DOMAIN MODEL In order to build the domain model, we will need to once again analyze the primary use cases. From
there we will be able to derive the important concepts of the system. We will first look at the boundary
concepts that directly interact with the actors and then afterwards analyze and find the internal
concepts of the system.
8.1.1 Concept Definitions
Table 7-1 will contain all the boundary and internal concept definitions that we obtained from analyzing
each actor’s responsibility.
8.1.1.1 Boundary Concepts
In order to analyze the boundary concepts, we must look at all the actors and how they interact with the
system. The system interacts with five actors. Three of these actors handle the back end of the system
and their primary function is to contain the data and information that the website application needs to
output to the human actors, the investors and the administrator. We will first describe and break down
responsibilities for each actor.
Let’s first look at how the database interacts with the system to create a list of responsibilities and
concepts. The database’s primary purpose is to store user information (login information and their
portfolio). Therefore looking at the UC – 7 (Login) and UC – 8 (Register), the database has the following
responsibilities
R1 – Contains all user profile information and portfolio (UserDatabase)
R2 – Stores newly registered user information (StoreUser)
R2 – Update user information in the database when it is changed (UpdateUser)
R3 – Find and retrieve user information (SearchUser)
R4 – Update changes to MyPortfolio for given user (UpdatePortfolio)
R5 – Find and retrieve user’s MyPortfolio (SearchPortfolio)
We can group these requirements into one main concept and that is MaintainUserDatabase. The
primary use of our database is to store all of the Investor’s information. Which means it will store the
Investor’s username, password, email, and their portfolio. It will also maintain and update all the
records when they are changed by the Investors.
The Yahoo! Finance API actor is where we primarily collect the stock’s historical data for calculating the
prediction.
R6 – Collect stock’s historical data (DataAquisition)
The Highstock actor is what will generate the linear regression graph of historical data. Although this is
a requirement for the given actor, it belongs to a concept that we will define later.
R7 – Generate graph of historical data and prediction (CreateGraph)

25 | P a g e
Investors also interact with the system.
R8 – Search the system for a stock. (SearchForStock)
R9 – Change password (PWChange)
R10 – Change Email (ChangeEmail)
R11 – Edit user information (EditUserInfo)
R12 – Add stocks to portfolio (AddStock)
R13 – Remove stocks from portfolio (RemoveStock)
R14 – Register an account (RegisterUser)
R15 – Login and Logout (SystemAccess)
We can group these requirements into four concepts. The first will simply be SearchForStock; this is its
own concept because it is an integral part of our system. The next three concepts are EditStockPortfolio
{R12 and R13}, EditUserProfile {R9, R10, R11}, and UserAccess {R14 and R15}.
8.1.1.2 Internal Concepts
We can extend and break down some of the boundary concepts to create some of the internal concepts.
Once again we will look at each individual actor.
Administrator:
R16 – Authenticate user at login (AuthenticateUser)
R17 – Check if any user information has been changed (UserUpdateCheck)
R18 – Check if MyPortfolio has been edited (PortfolioUpdateCheck)
R19 – Know if a user is logged in or logged out (CheckUserAccess)
The Administrator is used to manage the users in the system and to know if they are logged in or not. It
primarily checks if the user belongs in the system or if any of the user’s information has been updated.
The administrator then alerts the database that information has been changed and sends it the updated
information. Therefore these requirements are grouped together to form the ManageUser concept. It is
also one of our use cases.
After we have obtained the data from the Yahoo! Finanace API, we will need to process this data.
R20 – Maintain a record of collected data (StockDatabase)
R21 – Validates that searched stock is in StockDatabase (FindStock)
R22 – Process numerical data for a given stock (ProcessStockData)
R23 – Calculate a prediction (CalculatePrediction)
R25 – Maintain a record of general stock information (StockInfo)
R26 – Maintain a record of news articles and twitter feeds (News)
R27 – Load Stock page (StockPage)
R28 – Load News page (NewsPage)
R29 – Load Home page (HomePage)
R30 – Load MyPortfolio page (PortfolioPage)
R31 – Load FAQ/Help page (FAQPage)
These requirements fall under three concepts. One concept is StockDatabase; R16 and R6
(DataAquisition) belong in this concept. The data collected from Yahoo! Finance’s API is then stored in a

26 | P a g e
file inside the system. We will call it a database but it is not an external user like the User Database. The
next concept is simply PredictionCalculator, and it will contain R17 and R18. The next concept is
Webpage {R7, R23, R24, R25, R26, R27, R28, R29, and R30}. All of these requirements fall under the user
interface.
Below is the summary of the concepts
Responsibility Description Type Concept
Contains all the user information including their portfolio K UserDatabase
Maintaining user information. It stores new users and updates all the information and portfolios of existing users in the system.
D MaintainDatabase
Allows the user to change their password, email, and edit their information.
D EditUserInfo
Allows the user to add and remove stocks from their portfolio.
D UpdatePortfolio
Allows user to register, login, and logout of the system D UserAccess
Allows the Administrator to authenticate users that log into the system. It also lets the Administrator check if the user has edited their profile or portfolio.
D ManageUser
Contains all the stock data and basic stock information K StockDatabase
Obtains and collects data from Yahoo! Finances API and stores them in the StockDatabase
D requestStock
Searches and Finds the stock that the user requested D SearchForStock
It processes the numerical data from the StockDatabase and calculates a prediction for the stock. Afterwards it generates a graph of all the historical and predictive data.
D ObtainPrediction
Loads all the pages and graphs that the website needs for the users to view and navigate.
D Webpage
8.1.2 Association Definitions
Concept Pair Association Description Association Name
UserDatabase ↔ MaintainDatabase
Updates any user information and portfolio changes to the UserDatabase
Updates data
(EditUserProfile, EditStockPortFolio) ↔ ManageUser
Detects if changes have been made to the user information or portfolio.
Conveys updates
ManageUser ↔ MaintainDatabase
If a change has been detected, it lets the database know and provides the changed information
Provides updated data
UserAccess ↔ ManageUser
Authenticates users when they login. Keeps track of whether or not users have logged in or out of the system
Enable/Disable System Access
SearchForStock ↔ StockDatabase
Finds the requested stock in the StockDatabase Provides requested data

27 | P a g e
DataAquisition ↔ StockDatabase
The stock database collects data from the Yahoo! Finance API
Provides and stores data
StockDatabase ↔ ObtainPrediction
Uses the data collected and stored to calculate the prediction.
Calculates Prediction
8.1.3 Attribute Definitions
Attribute Description Attribute Concept
String of the given stock ticker symbol or company name
tickerSymbol SearchForStock
String that contains an error message for when the stock is not found
error
Data Structure/pointer that contains: a username of type string a password of type string an email of type string a name of type string gender of type char portfolio of type list
user MaintainDatabase
String of the new password newPassword EditUserProfile
String of the new email newEmail
String of the given stock ticker symbol tickerSymbol EditStockPortfolio
Int of the number of stocks amount
Bool that indicates the user is either logged in or not access UserAccess
An array of the stock’s historical data data PredictionCalculator
Data Structure/linked list that contains: array of historical data String of the stock ticker symbol String of the company name
stockData StockDatabase

28 | P a g e
Figure 8-1: Domain Model Diagram

29 | P a g e
8.1.4 Traceability Matrix
DOMAIN CONCEPTS
USE CASE
PW Use
rDat
abas
e
Mai
nta
inD
atab
ase
Edit
Use
rIn
fo
Up
dat
eP
ort
folio
Use
rAcc
es
Man
ageU
ser
Sto
ckD
atab
ase
Req
ues
tSto
ck
Sear
chFo
rSto
ck
Ob
tain
Pre
dic
tio
n
We
bP
age
UC1 10 X UC2 10 X X UC3 10 X UC4 15 X X X UC5 4 X UC6 4 X UC7 3 X X X X UC8 3 X X X X X X X UC9 4 X X UC10 1 X UC11 1 X X X UC12 4 X X UC13 15 X X X
MAX PW 3 4 4 4 3 4 15 15 15 10 15 TOTAL PW 7 4 4 12 7 8 33 34 28 26 28
8.2 OBJECT CONSTRAINT LANGUAGE (OCL) CONTRACTS
8.2.1 ObtainPrediction
Operation: ObtainPrediction
Preconditions Stock has been found in the Database. The prediction has obtained the stock's historical data.
Success Postcondition A prediction is calculated using a prediction algorithm. The prediction and the historical data is then sent to create a graph.
Failed Postcondition Error with accessing prediction algorithm. Error accessing Highchart to generate graph.
The system should obtain the requested stock's historical data from the database. Once it is obtained,
then it will send it to the PredictionAlgorithm so that a prediction can be calculated. Afterwards, both
the prediction and the historical data will be sent to Highcharts to generate a graph.

30 | P a g e
8.2.2 DataAcquisition
Operation: DataAcquisition
Preconditions User requests for a stock's information that is not currently in the Database
Success Postcondition Database queries Yahoo! Finance API for requested stock. Stock is found and all data is stored into the Database.
Failed Postcondition Stock could not be found in Yahoo! Finance API. System loads "Stock Cannot Be Found" error and provides a suggested list of similar stocks.
When a User requests a stock but it's not found in the Database, it should be quickly retrievable. So once
a stock is not located inside the Database, a query to the Yahoo! Finance API is made. Once the stock is
found in Yahoo! Finance, it should be stored in the database so that the data can be used to calculate the
prediction and generate the graphs. If the stock is not found in Yahoo! Finance, then an error webpage is
loaded with a suggested list of stocks that are similar to the searched stock.
8.2.3 SearchForStock
Operation: SearchForStock
Preconditions There is a search bar at the top of every webpage Success Postcondition System loads page with all stock information displayed
Graphs are displayed for the stock Failed Postcondition System returns “Could not find stock” error
A list of links to assumed stocks is displayed under the error
At the top of every page there should be a search bar so that users can search for a new stock, so this is a
precondition. The postcondition is that as the search is being done, if the stock exists in the Database,
which it should if it is a valid entry, the stock’s information is displayed on the screen. If the stock is
invalid, the “Could not find stock” error comes up and links to “assumed” stocks with similar spelling are
displayed.
8.3 MATHEMATICAL MODEL
8.3.1 Moving Average Model
In order to smooth out the market fluctuations, a popular technique is to use the average of values over
different subsets. This method is called the moving average model where the average of the varying
prices of the stock is taken in periods. The moving average is a lagging indicator since the predication is
made on past prices. The two main ways to implement is the simple moving average model and the
exponential moving average. The difference is that the exponential moving average gives more weight
to more recent prices. In this project we used the simple moving average and used the period as 200
days. So, the average price is taken over the past 200 trading days. For instance, the first average price is
taken from day 0 to day 200 the second average is taken from day 1 to day 201. This trend is continued
until the current price is taken into account. The period is always kept constant at 200 days. This
number was chosen from the research the group did which lead us to believe that 200 days will provide
a good balance between placing emphasis on past prices as well as more recent prices.

31 | P a g e
8.3.1.1 Pseudo Code def mean200(start_date, stop_date, table):
# this function calculates the 200 day average
period = 200
# closing prices from the start date to the stop date
# stop - start = 200
prices = table[start_date:stop_date].Close
sum = 0
mean = 0
# compute the mean of all the prices
for val in prices:
sum = sum + val
mean = sum / period
return mean
Figure 8-2: The yellow line represents the moving average of the market fluctuations.

32 | P a g e
8-3 Graphical Analysis
As we can in figure 7-3 We have a plot of a moving average of a long span of time (200 days) along with
a shorter span (50 days). Using these two averages combined, along with the comparison against the
real closing prices of stocks we can gather very useful data for predicting trends, not necessarily exact
values. We can see that the 200 day moving average generally sits well below the closing prices,
therefore you can view it as a "trend line", showing the general direction of the stock, as mentioned
before the longer the days the smoother the resulting graph will be. The 50 day moving average follows
the real closing prices more closely. When the plot of the short term moving average and the long term
moving average intersect we see that prices fall and eventually bottom out, so that's a good place to buy.
We also see that when the current price touches or reaches a certain threshold that is close to the long
term moving average it is very likely to go up again, and it is a good time to buy. (investopedia3)
Figure 8-4: Equation used for simple moving average. Where PM refers to the stock price of day M. N is the period of the average in this system, n is 200.
33 | P a g e
8.3.2 Relative Strength Index (RSI) Model
With moving average being the base of our prediction model, we hope to further expand predictions
further by adding another prediction model. This prediction model will be the Relative Strength Index
(RSI) which is an oscillator that measures momentum providing leading predictions instead of lagging
like the moving average model. We will incorporate this by having the system either sourcing these
indicators or use the mathematical models used to create them to have the program calculate the
predictions on its own. From there we would use the stock's current direction and momentum to
determine whether the stock will continue to move in that direction or if a change in direction is going
to come. The direction and momentum can be measured by an oscillator, in the case of RSI, a number is
generated between 0 and 100, and if the value is approaching 30 and the stock value is depreciating and
possibly undervalued based off of the average duration of a change in price and likewise, when the
oscillator approaches the value of 70, the stock value may be overvalued. The following is the formula
for generating the RSI where RS is average x days up closes divided by average x days down closes.
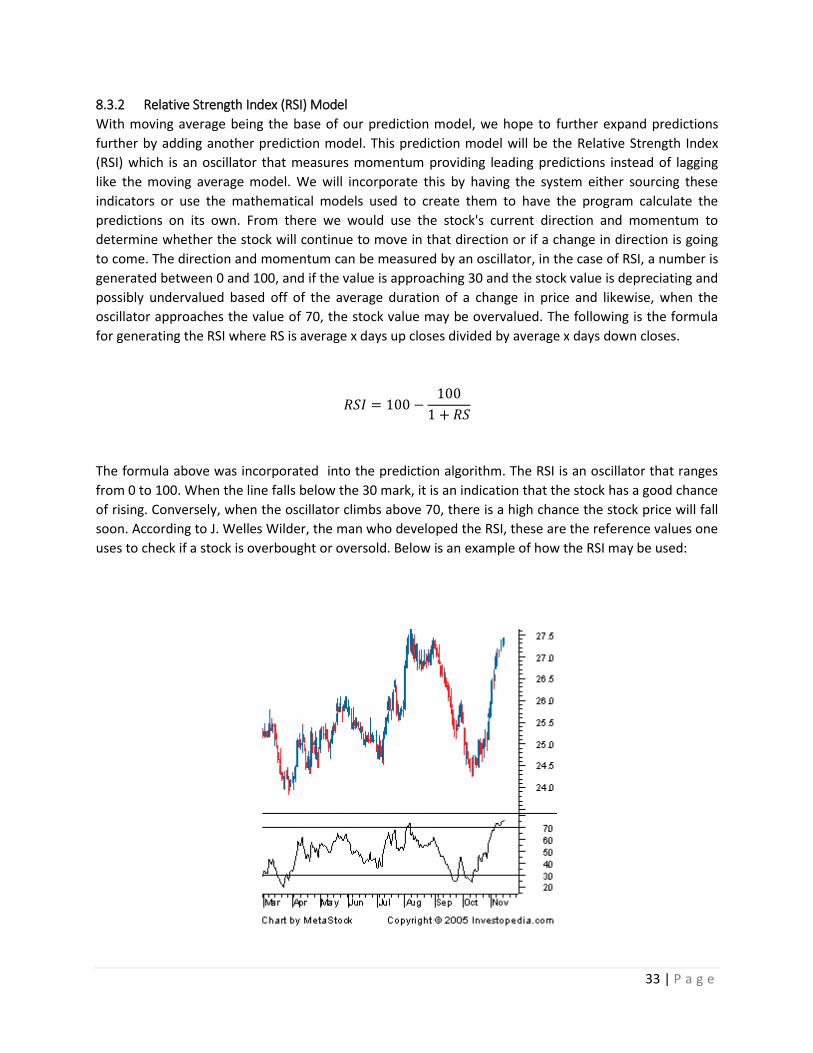
The formula above was incorporated into the prediction algorithm. The RSI is an oscillator that ranges
from 0 to 100. When the line falls below the 30 mark, it is an indication that the stock has a good chance
of rising. Conversely, when the oscillator climbs above 70, there is a high chance the stock price will fall
soon. According to J. Welles Wilder, the man who developed the RSI, these are the reference values one
uses to check if a stock is overbought or oversold. Below is an example of how the RSI may be used:

34 | P a g e
As we can see from the above figure we can see the actual market movement as seen in the top portion
of the graph correlated with the RSI prediction model in the bottom portion of the graph.
The formula for R Pivots, support, and resistance could also be used as input as they can be important
price points to the market, and it becomes less likely that a stock will move below support or above
resistance the more times that resistance/support was tested and held up as a significant price point.
The top graph represents the price movements of the Ebay stock, while the bottom-most graph
represents the RSI of this particular stock. Every time the RSI moves above the 70 threshold (indicated
by the green circles), the price drops shortly after (indicated by the blue circles). This doesn't always
predict that the stock price will go down, but rather that there is a point of instability that occurs and
conversely, when we reach the 30 threshold a stock isn't been decreasing in value for a long period of
time, there could be several reasons for this, but very often, prices tend to increase. In this particular
example, the RSI proves to be a very good indicator of the directional trend of a stock. However, there
are some cases where this may not be the case.

35 | P a g e
9 INTERACTION (SEQUENCE) DIAGRAMS
9.1 OBTAIN PREDICTION Prediction Engine Yahoo! Finance API DataBase:PredictionAlgorithm(s)
retrieveData(ticker symbol)
:Controller
getData(ticker)
retrieveData()
getData()
generatePrediction(data)
returnPrediction()
storePrediction(ticker,data)storePrediction(ticker,data)
return
exit()
The design principle employed in this diagram is the Expert Doer Principle because there is a decent
amount of communication in between the objects, but it is short and focused. Therefore, since the
communication chains are shortened between objects, this principle works best for this design.
9.2 DATA ACQUISITION Prediction Engine Yahoo! Finance API
retrieveData(ticker symbol)
:Controller
getData(ticker)
retrieveData()
getData()
exit()
Web Page HighStock/HighCharts Database
searchStock(ticker)getPrevInfo(ticker)
returnPrevInfo()postPrevData
getPrediction(ticker)
returnPrediction()
postPrediction
The High Cohesion Principle is exemplified in this diagram since there is a lot of communication between
the objects. All the data is being moved from location, to location to be stored. Therefore, there needs
to be lots of communication.
9.3 STATE DESIGN PATTERN We can definitely see an application for the state design pattern in our application, mainly with the RSI
model. From what we defined in our demo, we stated that RSI values below 30 and above 70 are what
we would determine as “stable” and “unstable”. So we could define two states for the stock and every
time we run the RSI script for a stock and it meets one of these thresholds we would transition from one
state to the next state. This state could also be used to alert users when their stocks reach a specific
state, like in the moving average model. According to the analysis done in section 7 on the moving
average model and RSI, we derived the following state diagrams.

36 | P a g e
BUY SELL
HOLD
SHORT TERM > LONG TERM&& DIVERGING
CLOSING PRICE = LONG TERM MOVING AVERAGE
CURRENT PRICE CLOSE TO LONG TERM MOVING AVERAGE (BOUNCE POINT)
NO CHANGE IN TREND LINES
SHORT TERM > LONG TERM&& DIVERGING
CLOSING PRICE = LONG TERM MOVING AVERAGE
9-1: State patterns for Buying/Selling/Holding based off of the Moving Average analysis
STABLE
INSTABLE &
LIKELY TO GO
UP
INSTABLE &
LIKELY TO GO
DOWN
RSI <= 30
30 < RSI < 70
RSI > 70
9-2: State pattern daigram for instable/stable based off of the RSI value

37 | P a g e
9.4 PUBLISHER - SUBSCRIPER DESIGN PATTERN We could definitely incorporate the publisher subscriber model where every stock is a publisher and
they publish the outputs of the various prediction models based off of their data, then every user can
subscribe to certain stocks. This could also be incorporated with the state in terms of alerting
subscribers about the predictions of their stock if they meet a certain threshold or changes state based
on the state patterns determined above. This would benefit the design greatly as it would simplify the
amount of work the user would have to do as you could simply have each stock generate certain
information and then pass the information along to the subscribers (the Users). There will be many
stocks, but there will also be many people that wish to view the information of each stock, and the
publisher subscriber model makes this easier to understand and implement on a larger scale. This would
be most likely to use event based communication between the objects due to the nature of the state
design that would be implemented as discussed. This would allow us to notify all subscribers if a stock
was to move from a state from buy to sell, making the software more useful for the user. This would
allow inactive users who may not check their portfolios often to be alerted when their stocks are going
down, when there is a good opportunity to expand their portfolio, or even track a stock and wait for the
right time to buy. Below is the class diagram for the publisher subscriber model.
<<interface>>
Publisher
<<interface>>
Subscriber
+ subscribe()
+ unsubscribe()
+ receive()
Publisher
GOOG
+ subscribe()
+ unsubscribe()
Publisher
AAPL
+ subscribe()
+ unsubscribe()
Subscriber
UserID1
+ receive()
Subscriber
UserID2
+ receive ()

38 | P a g e
10 CLASS DIAGRAM AND INTERFACE SPECIFICATION
10.1 CLASS DIAGRAM
10-1: Class Diagram
10.2 DATA TYPES AND OPERATION SIGNATURES The detailed specifications of each individual class is show in in UML notation in Figures 3.2, Figures 3.3,
Figures 3.4 and Figure 3.5. The classes are separated into four packages: UserInterface, Database,
Prediction, and Webpage. We will explain each class’s functions and operations in package order.
10.2.1 UserInterface Package
The classes Login and Register are very self-explanatory and do not need clarification. So we will not go
in depth with these two classes because they are not unique to project itself.
1. UserAccess
UserAccess controls when the user is able to access the system. The class will check if the user is
currently logged in or logged out and will adjust the access accordingly. In order to achieve this,
the class itself will have two parameters. One parameter will be a boolean flag and the other
one is simply the username. Every time the user logs into the website (and is properly
authenticated), the login function will call UserAccess and set the Boolean flag to 1, making it
true. When that subsequent user logs out of the website, the Boolean flag will be set to 0,
making it false. UserAccess will actually be linked to the UserDatabase and the Boolean flag will
be stored with the user information. This is where the second parameter comes in; it is used to
check if the user already has access to the web application (currently logged in) or they haven’t

39 | P a g e
logged in yet. UserAccess looks for the username in the Database and checks if the Boolean flag
has been asserted. The UserAccess class also handles the login and register requests of the user.
2. EditPortfolio
EditPortfolio is a simple class that the user uses to update their portfolio of stocks. The class
enables users to add a stock and remove a stock to their portfolio. In order to do this, the class
has two attributes the stock ticker and an amount. This way the user can add or remove the
desired number of a given stock.
3. EditUserInfo
This is another class that is fairly simple. EditUserInfo enables users to change their password,
update their email, and other information. If a user does change their information, the class will
send this information to the Database with a Boolean flag that will indicate that information has
been changed. The Database will then know that information has been changed and update it
accordingly.
4. SearchForStock
The class is the key feature of our system; it enables users to search the Database for a given
stock using either the stock ticker or the actual company name. The class will send this request
to the Database and have the stock’s information, prediction, and graphs be returned. Once all
the information is returned it will send the information to the Controller so that the stock’s
webpage may be created and loaded for the user.
5. GetNews
This class obtains news articles using RSS feeds from reputable websites and Twitter to obtain
news about a certain stock.
6. UserController
As the name suggests, this is the controller for the user interface. The controller receives
requests to the Database from the functions within the user interface and sends them to the
Database. It is essentially the communicator between the interface, the database, and the
webpage.

40 | P a g e
10.2.2 Database Package
The classes and objects in this package store, obtain, and maintain all of the user, portfolio, and stock
data. First we will talk about the classes that define objects before delving into the classes that maintain
functionality in the Database.
1. Stock
This class defines and contains all the information that defines a stock. This information is: stock
ticker, company name, a 2D array of the stock’s historical data. This two-dimensional array will
contain the stock values in a range of dates.
2. User
User is a class that is similar to stock in that it defines and contains all the information that
defines a user. It will hold the user’s username, password, email, and portfolio. The portfolio is a
separate class that will be defined below. Therefore the User class contains the Portfolio class.
3. Portfolio
The Portfolio class holds the stocks that each user adds into their portfolio. The class itself has
an array of stocks as its attribute. The class enables the User class and other classes in the
Database to access and edit the portfolio.
4. UserDatabase
This class contains a list of all the users that had registered in the system. It has operations such
as addUser, findUser, updateUser, updatePortfolio and validateUser. These operations are self-
explanatory in that it enables the class to add new users to the database, finds a user in the
database, updates user and stock information,,and validates existing users when they log into
the system.
5. StockDatabase
The StockDatabase is similar to the UserDatabase. It is a class that contains a list of all the stocks
acquired from the Yahoo! Finance API. It has functions such as findStock, addStock, updateStock.
The StockDatabase uses the class DataAquisition to add new stocks and update current stocks in
the database.
6. DataAquisition
DataAquisition is the class that queries stock information from Yahoo! Finance API. It has 2
operations, aquireStock and queryNewData. The aquireStock operation obtains new stock data
form Yahoo! Finance if the StockDatabase does not have that specific stock. The operation
queryNewData, is what is used to update and add new stock values into the already stored
stocks in the StockDatabase.
7. DatabaseController
This class is similar to the UserController and is the controller for the database. It communicates
with the UserController and ObtainPrediction to send and receive requests from the functions in
the database.

41 | P a g e
10.2.3 Prediction Package
The prediction package holds all of the classes that are needed to obtain a prediction.
1. PredictionController
This class is the controller for the Prediction package. It receives requests from the database to
calculate a prediction and then conveys the request to CalculatePrediction.
2. CalculatePrediction
This class obtains an algorithm from the Algorithm class to calculate the prediction.
3. PredictionAlgorithm
Each operation in this class is a specific prediction algorithm.
4. GraphData
This class calls Highchart to create a graph of the historical data. It also obtains the prediction
from CalculatePrediction to include the prediction in the graph.

42 | P a g e
10.2.4 WebPage Package
The webpage package contains the classes the will ultimately prepare the requested webpage and then
load that generated webpage.
1. PageCreator
This class prepares the webpages that the user requests. It obtains all the parameters that will
be on the webpage.
2. PageLoader
After the webpage has been prepared by the PageCreator class, it tells the PageLoader class to
load the prepared webpage.
3. WebPageController
This class handles all the requests to prepare and load a webpage. It obtains the information to
be placed on the webpage and then sends those attributes to the PageCreator.

43 | P a g e
10.3 DESIGN PATTERNS
10.3.1 Design Patterns That can Add new Functionality
10.3.1.1 Threading
Threading would not benefit our application if it was in a small scale, but if the system grew to a much
larger size where users track many stocks, then there would be value in threading. When we process the
predictions for a large amount of stocks, threading would benefit us because we would be able to
process a larger amount of data in a smaller portion of time, mainly with concurrent programming.
10.3.1.2 Proxy
The proxy pattern would benefit us in the context of the project because a lot of the queries could
become more complex if we were to subscribe to an API that required payment where we would have a
key and also with an external database that lives away from the website.
10.3.1.3 Decorator
We don’t really have any optional or additional processing or optional processing in our current design.
In the future we can see that the decorator pattern would greatly benefit our design to do an optional
buy/sell/hold prediction or calculate additional predictions if we added more prediction models. We
could have each prediction model be a decorator and then have the user select which ones they want.
10.3.1.4 Command
We don’t see the benefit of the undo/redo or having “concrete” commands because we are just
calculating prediction models, so our command would just be “calculate prediction”.

44 | P a g e
10.4 TRACEABILITY MATRIX CLASSES
CONCEPTS PW Use
rAcc
ess
Get
New
s
Up
dat
eP
ort
folio
Edit
Use
rIn
fo
Sear
chFo
rSto
ck
Dat
abas
eCo
ntr
olle
r
Use
rDat
abas
e
Sto
ckD
atab
ase
Dat
aAq
uis
itio
n
Use
r
Po
rtfo
lio
Sto
ck
Pre
dic
tio
nA
lgo
rith
m
Cal
cula
teP
red
icti
on
Gra
ph
Dat
a
Pre
dic
tio
nC
on
tro
ller
We
bP
ageC
on
tro
ller
Pag
eCre
ato
r
Pag
eLo
ader
USER DATABASE
7 X X X
EDITUSER INFO
4 X X X
MAINTAIN DATABASE
4 X X X
UPDATE PORTFOLIO
12 X X X X
USER ACCESS
7 X
MANAGE USER
8 X X X X X
STOCK DATABASE
33 X X X
DATA AQUISITION
34 X X X
SEARCHFOR
STOCK 28 X X
X
OBTAIN PREDICTION
26 X X X X
WEBPAGE 28 X X X X
MAX PW 8 28 12 12 28 33 12 34 34 7 12 34 26 26 26 26 28 28 28
TOTAL PW 15 28 24 24 28 41 35 99 34 7 27 95 26 26 26 26 28 28 28

45 | P a g e
11 SYSTEM ARCHITECTURE AND SYSTEM DESIGN
11.1 ARCHITECTURAL STYLES This project will be deployed using a Client/Server model because the system is segregated into two
applications. The client queries and submits data through the web site and on the server side the user
and stock information is stored in the database. The predictions are also done on the server side, or on a
seperate machine that will go through the tracked stocks and store the prediction information.
11.2 IDENTIFYING SUBSYSTEMS
Our design will be structured similarly to the MVC model (Model, View, and Control). Model deals with storage and managing data, View is how the user interacts with our product, and Control handles the main algorithm. The subsystems that are shown in the UML package diagram are named Investor, Stock, and Webpage.

46 | P a g e
The Investor package has the Portfolio which holds all the stocks of a specified user and the personal information of the user. The Portfolio has a dependency on the Investor because each investor has its own portfolio. The portfolio also has a dependency on the information from Yahoo Finance since it needs that information to update the portfolio.
The Stock subsystem has a dependency on the Yahoo Finance subsystem. This is because the info in the Yahoo Finance subsystem needs to be used for all of the things the Stock subsystem uses. Highchart also needs this information to generate its charts. It also relies on the PredictonAlgorithm subsystem to show the prediction.
The different tags next to each line are for different reasons. <<Import>> is placed where information is shared from system to system publicly, and <<access>> is for when this data transfer is to be private, like when sharing passwords, or other sensitive information.
11.3 MAPPING SUBSYSTEMS TO HARDWARE Our system does need to be run on multiple computers. The subsystems are mapped in the following
components:
The StockResource package and the packages contained inside it are allocated in the central server.
The WebPage package is allocated in the client’s PC.
The InvestorResource package is also contained insidethe central server.
11.4 PERSISTENT DATA STORAGE For the stock forecaster the system does need to save data that will outlive a single execution of the
system. A sample of the data that should be saved is stock tickers and their corresponding company
names, user information, and stock data. The data will be stored using a relational database, specifically
MySQL. MySQL was chosen for the job due to its open source nature and has all the functions required
for the job. Also, several team members have experience with this database and feel that it is the best
option. The data will be stored in three separate tables. The first table will hold the user data which
includes username, password, and portfolio. The second table will have stock ticker, the corresponding
company name, and information about the company such as industry and a small description. The third
and final table will have the stock ticker and the moving average data computed for the stock.
11.4.1 Table 1: User Create Table user_data (
UserID int not null auto_increment,
Name varchar(100) not null,
Username varchar(100) not null,
Password varchar(100) not null
Email varchar(100) not null
Primary Key(user_id)
);
UserID Name Username Password Email Portfolio

47 | P a g e
11.4.2 Table 2: Stock Create Table stock_company(
Ticker varchar(100),
Company_Name varchar(255)
);
Ticker Company_Name
11.4.3 Table 3: Stock Data Create Table stock_data(
ID int not null auto_increment,
Ticker varchar(100),
Prediction_Model varchar(255),
D1 int,
… D200 int
);
ID Ticker Prediction_Model D1 …. …. D200
11.4.4 Table 4: Portfolio Create Table portfolio(
Username varchar(100) Not Null,
Stock1_in_Portfolio var(100) Not Null,
… StockN_in_Portfolio var(100) Not Null,
);
Username Stock1_in_Portfolio …. StockN_in_Portfolio
11.5 GLOBAL CONTROL FLOW
11.5.1 Execution Order
The system is event driven, where a user must send commands to the system to get their desired
information. For example, if a user wished to view Google's stock chart, they must input the ticker into
the search bar and search for the stock. To view predictions the user must prompt the system to show
the prediction, as well.
11.5.2 Time Dependency
The system is event driven in regards to the prediction models, but the database containing the stock
prices will update daily. The prediction will happen in real-time once the user has requested the
information.

48 | P a g e
11.5.3 Concurrency
The system will use multiple threads in the prediction process. Once the time comes to make a
prediction, the predictor will create threads to carry out the calculations involved in the prediction
model. At the end of this process the threads will recombine and the prediction will be sent to the user.
11.6 HARDWARE REQUIREMENTS Screen display: Since our Web application utilizes Foundation by Zurd, a source of precompiled css
classes, this component allows any computer resolution starting from 1024 px X 768 px (portrait size) to
1920 px X 1080 px (large display).
11.6.1 Disk Storage
The Web Application isn’t fully implemented yet, but here are some preliminary estimates:
1. User needs modern computer (preferably a processor of i5 or higher)
2. Approximate server space should be near 20 gigabytes (for SQL Database).
3. RAM: 2 GBs
11.6.2 Communication network
At the moment we are unsure of the exact bandwidth needed or used, but once it is known the
document will be updated.
11.6.3 Device Flexibility
This web application should primarily be used for computers, however with the utilization of Foundation
by Zurb, we also have the capability of extending this application to Tablets and/or phones. If there is
enough time and resources, the web application would be extended to other devices as well.
12 ALGORITHMS AND DATA STRUCTURES
12.1 MOVING AVERAGE MODEL Moving average is a statistical process that creates a set of averages for many small subsets of the full
dataset. By taking the averages of mini-subsets of the dataset, it helps smoothen out the trend of the
data by showing the long-term lengths. It usually shows the price fluctuation of a stock for a certain
period, but can also be used for longer periods. The moving average is a lagging indicator since the
predication is made on past prices. The two main ways to implement is the simple moving average
model and the exponential moving average. The difference is that the exponential moving average gives
more weight to more recent prices. In this project we used the simple moving average and used the
period as 200 days. So, the average price is taken over the past 200 trading days. For instance, the first
average price is taken from day 0 to day 200 the second average is taken from day 1 to day 201. This
trend is continued until the current price is taken into account. The period is always kept constant at

49 | P a g e
200 days. This number was chosen from the research the group did which lead us to believe that 200
days will provide a good balance between placing emphasis on past prices as well as more recent prices.
Algorithm used for moving average:
12-1Moving Average Model Implementation Example

50 | P a g e
12-2Moving Average - Graphical Analysis
As we can in figure 7-3 We have a plot of a moving average of a long span of time (200 days) along with
a shorter span (50 days). Using these two averages combined, along with the comparison against the
real closing prices of stocks we can gather very useful data for predicting trends, not necessarily exact
values. We can see that the 200 day moving average generally sits well below the closing prices,
therefore you can view it as a "trend line", showing the general direction of the stock, as mentioned
before the longer the days the smoother the resulting graph will be. The 50 day moving average follows
the real closing prices more closely. When the plot of the short term moving average and the long term
moving average intersect we see that prices fall and eventually bottom out, so that's a good place to buy.
We also see that when the current price touches or reaches a certain threshold that is close to the long
term moving average it is very likely to go up again, and it is a good time to buy. (investopedia3)
12.2 RELATIVE STRENGTH INDEX RSI, in practice, is an oscillator from 0-100 showing the momentum of a given stock. The equation for
the RSI is calculated by the following formula:
This formula will either be incorporated into the prediction algorithms, or we may pull the data from a
website. When the oscillator goes below the 30 line, it is an indication that the stock has a good chance

51 | P a g e
of going up. Conversely, when the oscillator climbs above 70, there is a high chance the stock price will
fall soon. Using that information, the prediction algorithm will detect when a stock has passed either
threshold, and adjust its prediction model accordingly.
The creator of the Relative Strength Index was a guy named John Wilder; he created the arbitrary
thresholds of 70 and 30 since that indicates moderate momentum in either direction. These values are
used as thresholds by most people who rely on this algorithm so we decided to use these values as well.
This threshold can obviously be changed in our program to let’s say 80,20 or 90,10 to show a stronger
momentum. While our program is set by default to figure out when a stock goes above 70 or below 30
but in the future we could in the future allow the user to choose his or her own threshold since people
are looking for different qualitative trends with different types of stocks.
12-3: Relative Strength Index Model
As we can see from the above figure we can see the actual market movement as seen in the top portion
of the graph correlated with the RSI prediction model in the bottom portion of the graph.
The formula for R Pivots, support, and resistance could also be used as input as they can be important
price points to the market, and it becomes less likely that a stock will move below support or above
resistance the more times that resistance/support was tested and held up as a significant price point.

52 | P a g e
The top graph represents the price movements of the Ebay stock, while the bottom-most graph
represents the RSI of this particular stock. Every time the RSI moves above the 70 threshold (indicated
by the green circles), the price drops shortly after (indicated by the blue circles). This doesn't always
predict that the stock price will go down, but rather that there is a point of instability that occurs and
conversely, when we reach the 30 threshold a stock isn't been decreasing in value for a long period of
time, there could be several reasons for this, but very often, prices tend to increase. In this particular
example, the RSI proves to be a very good indicator of the directional trend of a stock. However, there
are some cases where this may not be the case.
12.3 DATA STRUCTURE USAGE The only data structure used in this system is the built-in data structure provided by the python package
Pandas called DataFrame. The DataFrame is a tabular, spreadsheet-like data structure. It contains an
ordered collection of columns, each of which can be a different type. This data structure was chosen
since it has many built-in methods such as join and sort so; we did not to implement these functions.
This saves us time and energy as well as allowing us to focus on creating the other parts of the system.
Furthermore, this data structure is very flexible to work with since it can take multiple types and
columns can be added as needed. For instance, the data structure internally handles missing data points
and automatically creates an index to work with. Individual rows and columns can be accessed similar to
accessing arrays in other programming languages. This allows us to easily work with the data we get
from Yahoo’s Finance API.

53 | P a g e
Fig 5.3.1: This is a sample DataFrame for the company Google.
GOOG
Date Open High Low Close Volume Adj Close
0 2014-03-14 1181.99 1190.87 1172.53 1172.80 2293900 1172.80
1 2014-03-13 1207.95 1210.50 1184.76 1189.06 2339700 1189.06
2 2014-03-12 1196.40 1207.85 1184.19 1207.30 1964300 1207.30
3 2014-03-11 1213.77 1214.32 1196.64 1199.99 1713000 1199.99
4 2014-03-10 1215.69 1217.64 1204.09 1211.57 1214600 1211.57
Moving_Average_200_Day
0 403.93005
1 405.08390
2 406.20225
3 407.28745
4 408.44785
13 USER INTERFACE DESIGN AND IMPLEMENTATION
The team is currently in the process of implementing the user interface. We will upload the
implementation once it is complete.
The user interfaces have not changed much from the initial mock ups created in Report 1. The only
major changes to the user interface is that we will no longer be implementing the “Previously Searched
Stock” list. This decision was made due to the time constraints and resources. We want to focus majority
of our time making sure that the necessary interfaces are functioning correctly. Everything else stated in
the User Interface Specification section of Report 1 will be implemented.
13.1 LOGIN The first page that users will encounter will be the login page. All users will be required to either login to
an existing account or sign up for a new one. This page will show a simple box with two input areas
where the user can enter their user name and password. Underneath this input are two buttons next to
each other. The left button will be the LOGIN button and the button next to it is the SIGN UP button.

54 | P a g e
Clicking the LOGIN button will either bring you to the home page if you entered the correct username
and password or it will just refresh the login page with an error stating that you have entered your
credentials wrong.
13.2 SIGN UP/REGISTRATION On the login page, if a user is not already registered, they can sign up to create a new account by clicking
on the SIGN UP button. When clicked, this button will bring them to the registration page where they
will be able to create a username and password. They will also be required to enter an email address
and optionally enter their name.
13.3 NAVIGATION We will have a static navigation bar at the top of the website. This ensures that no matter which page
the user is on, the navigation bar will consistently be at the top of the page for the user’s ease of
navigation. The navigation bar will consists of three tabs and a search bar. The three tabs will be on the
left hand side of the navigation bar and they are HOME, PORTFOLIO, and NEWS. Next to these tabs will
be the search bar. It will span the middle section of the navigation bar. Users will be able to search
different stocks no matter which page of the site they are on. After the search bar, there will be a drop
down ACCOUNT menu. This drop down menu is where users will be able to edit their account
information and sign out of the system.
13.4 STOCK PAGE Each stock in our database will have their own individual pages. The page itself will be divided into three
distinct section. The main and largest section will be on the top left hand side and it will take up two
thirds of the page. This section is where the graph of the stock’s historical and prediction data will be
displayed. The graph will have an indicator of the current data and which points on the graph represent
the stock prediction. Underneath this section, will be a smaller section that will show the open, high, low,
and current value of the stock for that given hour or however long we decide to refresh the data. The
third section will be a column next to the graph. This is where you will see the stock ticker that identifies
which stock you are currently viewing as well as the company name and a link to their website
underneath it. Next to that ticker title will be a button that enables you to add that specific stock to your
portfolio. Underneath this will be links to news articles about the stock. This way you can see relevant
news information about the stock.
13.5 HOME The home page will be the page that users see after they log into the site. It consists of two columns.
The left column is a list of current news and events of the stocks that are in the user’s portfolio. If they
are a new user, it will invite them to add stocks to their portfolio. The right column will show a graph of
all the stocks they have in their portfolio. This graph will comparatively show the performance of the
individual stocks that the user owns. Underneath the graph, it will state which of their stocks has the
worst and best performance. This way users can see how well their portfolio is doing and see which
stocks are creating a profit and which stocks aren’t.

55 | P a g e
13.6 PORTFOLIO The portfolio page is where users can actively add and remove stocks to their portfolio. The stocks will
be in a list form and next to each stock will be the current stock value as well as add and remove buttons.
Once these respective buttons are clicked, a pop up with the stock ticker and a box will pop up asking
how many shares they would like to add or remove from the stock they have in their portfolio. They will
also be required to verify that they want to make these changes.
At the top and bottom of the Portfolio page, there will also be a button with an input field next to it that
will enable users to add a stock to their portfolio. The user will enter the stock ticker to this input field
and click “ADD STOCK”. Once clicked, the stock’s page will be loaded and if the user truly wants to add
the stock they can click on the “ADD STOCK” button next to the Stock Ticker on the page. A pop up will
then appear verifying that they truly want to add the stock to their portfolio.
13.7 NEWS This news pages will be a stream of the current events that are happening about different companies.
These events will be obtained from reliable news sources via their RSS Feeds. The news on this page will
not be catered to the stocks in a user’s portfolio but is more of general news feed. Users will be able to
see and read current events even though they do not have those companies in their portfolio.
13.8 FAQ This page will have a list of frequently asked questions that will explain to users what each part of the
website is and teach them how to use the site including understanding various prediction models.
14 DESIGN OF TESTS
*A lot of the code has not yet been implemented, so specific testing cases that may be relevant to
certain frameworks or specific code implementation may not be mentioned yet
14.1 USER INTERFACE TESTING
14.1.1 Use Case 1 – Search for Stock
This is an important concept in our domain analysis and it enables the user to search for a stock in our
database. Once the stock is found the system will request the stock’s prediction and load the stock page.
The test for this use case is to primarily ensure that the search function is working and the input entered
by the user is read by the system properly.
14.1.2 Test 1 – Controller Received and Sent Input Request
This test will see if the input entered by the user is received and sent by the controllers in the system. It
will make sure that the user controller can read input entered by the user. If the user controller cannot
obtain this input then it will not be able to convey this information to the database controller and an
error will occur internally and the stock page will not load for the user. This test will also see if the

56 | P a g e
database controller is able to obtain the input request from the user controller. This test is to see if the
stock that is searched by the user is sent properly to the system.
14.1.3 Test 2 – Database Connection
This test will make sure that the database controller sends the request to the database properly. It will
also make sure that the information that the database sends back is the same information that the
controller requested.
14.2 STOCK PAGE
14.2.1 Test 1 – Load Page
This test will make sure that after the stock has been searched that the correct page is loaded. It will
also make sure that the various components of the page is also loaded successfully. This will include the
graphs
14.2.2 Test 2 – Graph
This ensures that the stock’s graph on the page is correct and loads properly. There will be two graphs,
one will have a dependency on yahoo finance data to populate and the other will have data that will be
populated from our database. We will be able to identify issues due to the fact that we have two graphs
pulling data from different sources. This could be useful because if one graph's data isn't loading
properly we can pinpoint it on that graphs data source which will aid in debugging.
14.3 WEB PAGES
14.3.1 Test 1 – Load Page
Like the stock page, we will run a test for all the other pages on the website and make sure they load
properly. These pages are Portfolio, Login, Registration, Logout, Home, News, and FAQ
14.4 PREDICTION ALGORITHM TESTING The prediction algorithms will be tested using previous data. This has not been implemented yet in
terms of actual testing, however manual testing has begun that compares the result of the moving
average based off of historical data. This testing can be automated using programs that will test for
validity of both the algorithm itself as well as the validity of the code. We will implement these tests for
all of the algorithms that we intend on implementing, at least the Moving average and RSI for now.
14.5 INTEGRATION TESTING Our integration testing will be done using big bang integration. Prior to compiling each individual sub
part, we will conduct unit testing on individual pieces of software in order to validate methods and
strategies so that we can eliminate logical errors and concentrate on technical errors that may occur as
a result of integration. There aren't too many external dependencies (the only is yahoo! finance api) and
everything is relatively modular since everything has its own purpose and is independent of other
aspects of the website so pinpointing issues shouldn't be too much of an issue. We will design larger test

57 | P a g e
cases once the program is complete that will allow the programmer to quickly identify any areas of
concern, whether it be connection issues, algorithm issues or even API issues just as a few examples.
15 HISTORY OF WORK
15.1 SUB TEAMS PAST WORK Over the course of the project a lot got done in terms of planning as well as coding. A basic web
framework was designed in ruby on rails as well as two important technical indicators were researched
as well as implemented in python and their trends were validated through our observations of real stock
prices and these indicators and comparing various implementations to validate that our algorithms were
correct. We were not able to meet the deadlines of our original gantt chart we had posted in previous
reports due to some overly ambitious goals that we had set for ourselves. No group members were very
proficient in any of the frameworks and languages we used for the project which led to many technical
issues that arose that took more time then we had anticipated to debug. This was both a learning
experience technically and in terms of project management, when exploring new languages and
frameworks without experience makes some things that seem trivial to implement actually become very
difficult. This makes translating our business goals into technical goals difficult sometimes due to the
variability in time based off of the experience and skill of the team. come up with the best solution for
developing our product. Sub-teams gave their reports at these meetings, also.
15.1.1.1 Database and Data Collection Progress (Sivaramharesh Siva and Neha Desai):
At the start of the project, it was imperative to import the stock data from Yahoo Finance and
put it in a database. Yahoo Finance was used because it held all the stock information that was
needed. Sivaramharesh Siva and Neha Desai worked together on importing the data and using
SQL, they were able to pull the information and keep it in different tables. The goal for this to
be accomplished by was February 25. They also had to integrate the database with the
prediction models to store the results, and then connect the database to the website.
15.1.1.2 Prediction Research and Algorithm Progress(Vinay Shivakumar and Jonathan Haas):
Another vital component of developing our product was having an accurate prediction model
to forecast the stocks. Jonathan Haas and Vinay Shivakumar studied various prediction models
and with the help of Siva implemented the moving average model. However it is not the
standalone model for prediction. They researched other models such as the MACD, RSI, and
Exponential Moving Average. They focused more on the RSI prediction model, because it
seemed to be the best fit. Two predictions were used to give the user the best forecast. The
algorithms were implemented by March 5 and testing began shortly thereafter. The results of
these algorithms then needed to be placed back in a table in the database. This was all worked
on from March 5 to March 15.
15.1.1.3 Front-End Web Development Progress (Vinay Panjabi and Krisha Paula Olanday):
The actual product that a user would see, the website, was developed by Vinay Panjabi and
Krisha Paula Olanday. Vinay created the Git repository. The two also came up with the overall
design of the website for the on-screen requirements and the wireframe by February 9. Then
they began to start coding the website. For the first demo, Vinay and Krisha created mockups

58 | P a g e
of what the website would look like, and created charts that would show what our website is
supposed to look like. The final step was integrating the website with the database, which Siva
and Vinay did for the final demo.
15.2 FUTURE WORK This product still needs a long way to go before it turns into a full scale application. If we had more time
we would do several things, the first and most important would be to integrate the prediction models
into the website. We ran into some technical issues which prevented us from actually doing this, mainly
the fact that they were written in different languages. We are also not proficient in all of the
technologies that could have allowed us to do this. Another thing important that we would like to
include for the future would be the design patterns mentioned in section 8. These would be very
beneficial and allow us to create a more refined product that could generate email alerts as well as allow
the system to grow nicely. Another idea we had toyed with but never got the chance to implement was
even more technical indicators but that would complicate the system. In order to reduce this
complication, we could use all of these indicators, along with a neural network, using the back
propagation method, to generate states, this way we have a prediction algorithm using indicators that
would all analyze different areas and generate one prediction, rather than just look at each indicator
individually.

59 | P a g e
16 REFERENCES
16.1 GLOSSARY TERMS REFERENCES 1. http://www.investopedia.com/terms
2. http://en.wikipedia.org/wiki/Stock_market_prediction
3. http://www.dummies.com/how-to/content/stock-investing-for-dummies-cheat-sheet.html
4. https://en.wikipedia.org/wiki/Stock
16.2 RSI MODEL REFERENCES 1. Sarkar, Asani. “Equity Market Valuation”.
2. Master Trader – Top Strategies for Market Success. Tigrent Learning. Print.
3. http://stockcharts.com/help/doku.php?id=chart_school:technical_indicators:relative_strength_in 4. http://en.wikipedia.org/wiki/Relative_strength_index
5. http://fxtrade.oanda.com/learn/technical-analysis-for-traders/rsi/
6. http://stockcharts.com/help/doku.php?id=chart_school:technical_indicators:relative_strength_i
n
16.3 MOVING AVERAGE REFERENCES 1. Sarkar, Asani. “Equity Market Valuation”.
2. Master Trader – Top Strategies for Market Success. Tigrent Learning. Print.
16.4 RUBY ON RAILS REFERENCES 1. http://www.railstutorial.org/book
2. http://www.sitepoint.com/rails-userpassword-authentication-from-scratch-part-i/
3. http://railscasts.com/
16.5 PYTHON AND SQL REFERENCES 1. http://shop.oreilly.com/product/mobile/0636920023784.do 2. http://www.tutorialspoint.com/python/python_database_access.htm