Embed Size (px)
Citation preview

Weather

Foggy Forecasting: What Weather Factors Create Radiation Fog?
(from http://sciencebuddies.com/science-fair-projects/project_ideas/Weather_p028.shtml?fave=no&isb=c2lkOjEsaWE6V2VhdGhlcixwOj
EscmlkOjMyOTM1OTE&from=TSW) Objective To determine the weather factors necessary to create radiation fog. Introduction Here's a riddle for you: What do you call a cloud that sits on the ground? A cloud with a bad altitude? Nope. Fog! What is fog? Well, imagine a water droplet suspended in the air, like a party balloon that has lost most of its helium and is floating just above the ground. The water droplet is opaque, which means that you can't see through it. So when there are enough water droplets suspended in the air, all close together, and you can't see beyond 1 kilometer (km), then you have the weather event called fog. In the video clip on the right, from CYBERCHASE on PBS KIDS GO!, watch as the CyberSquad investigates dew point in order to complete a rescue mission under the cover of fog! From where do the water droplets come? They originate from water vapor, which is water in its gaseous state. As water vapor cools, it undergoes a process called condensation, where it changes from a gaseous state to a liquid state. You have seen this if you've left a cold container out on your kitchen counter before. As the water vapor in the atmosphere hits the cold container, it cools, and little beads of water form on the outside of the container. The same thing happens, on a larger scale, to make fog. What weather conditions must exist for fog to form? Fog forms when very moist air (air with high humidity) is cooled to its dew point or saturation point, where it can no longer hold the moisture it contains. For formation, all fogs (and clouds) also need tiny nuclei (like dust or smog particles), on which condensation can form. Weather scientists, known as meteorologists, can determine when fog formation is likely by observing the dew-point depression, which is the temperature difference between the outdoor temperature and the dew point. You might think that "fog is fog," but meteorologists have grouped fog into many different types, with names like radiation fog, advection fog, sea fog, evaporation fog,

steaming fog, freezing fog, hail fog, garua fog, valley fog, upslope fog, precipitation (frontal) fog, and ice fog. These fogs differ in how and where the cooling of the water vapor (the condensation) occurs, which affects their appearance, and how long they last. In this science fair project, you will focus on radiation fog, also sometimes known as ground fog or tule fog (pronounced too-lee fog). Radiation fog doesn't have anything to do with X-rays or radioactivity. The name refers to the cooling of the land that goes on after sunset on a clear night when there is thermal radiation of ground heat into space. Radiation fog, shown in Figure 1, below, often occurs overnight above wet vegetation in autumn or early winter, and usually does not last long after sunrise. Meteorologists have identified a number of factors that can contribute to the formation of radiation fog on any given morning, including:
• Wet soil or vegetation (from a previous day's rain) • Light wind • Clear overnight skies • Low dew-point depression
In this science fair project, you will record weather conditions in your area over several weeks to see which of these factors, or combinations of factors, has the greatest impact on the formation of radiation fog.
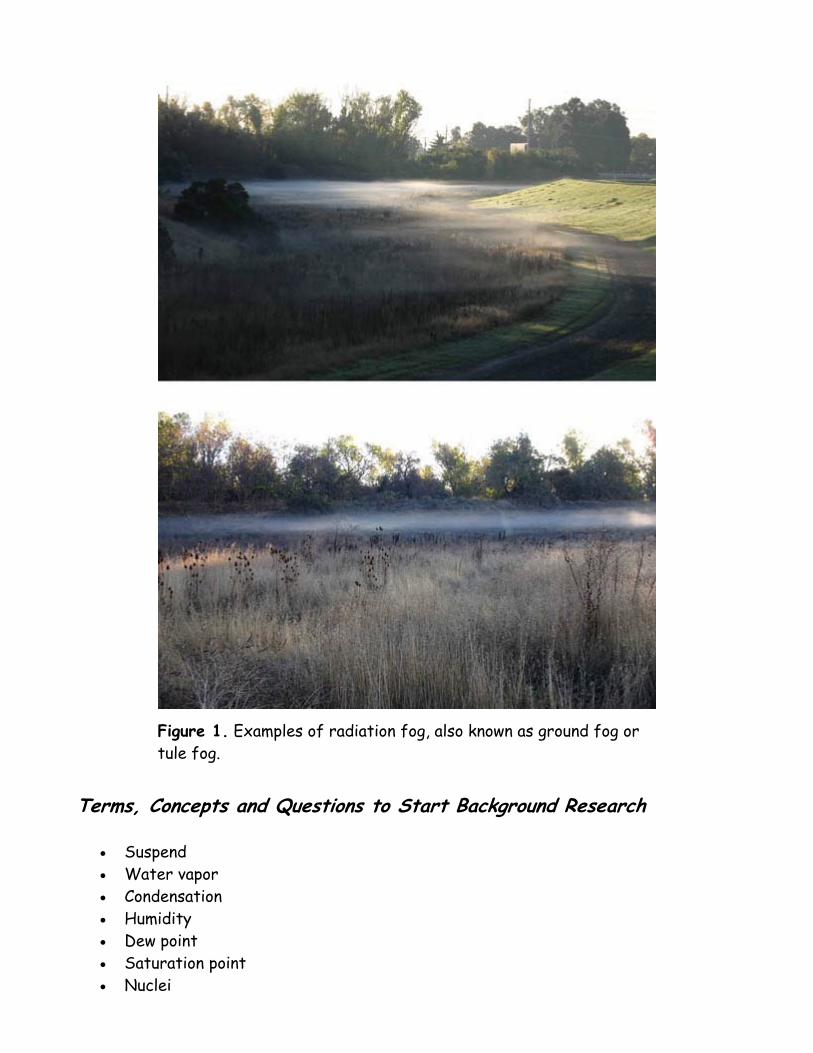
Figure 1. Examples of radiation fog, also known as ground fog or tule fog.
Terms, Concepts and Questions to Start Background Research
• Suspend • Water vapor • Condensation • Humidity • Dew point • Saturation point • Nuclei

• Meteorologist • Dew-point depression • Radiation fog • Ground fog • Tule fog • Thermal radiation
Questions
• What is fog? • Why can't you see through fog? • What factors are required to form all fogs?
Bibliography
• Weather.com. (2008). Retrieved December 19, 2008, from http://www.weather.com
• Thirteen/WNET New York. (2009). CYBERCHASE: Weather Watchers: Gone with the Fog. Educational Broadcasting Corporation, New York. Retrieved April 21, 2009 from http://pbskids.org/cyberchase/weather/fog.html
This source describes the factors that help form radiation fog: • Haby, J. (2000). Radiation Fog Ingredients. Retrieved November 20, 2008, from
http://www.theweatherprediction.com/habyhints/22/ This source shows the difference in heights between radiation fog over a warm parking lot and radiation fog over a cooler field:
o Ritter, M. (2007, March 11). Focus on Radiation Fog. Retrieved November 28, 2008, from http://www.uwsp.edu/geo/faculty/ritter/geog101/focus/focus_on_radiation_fog.html
This source describes and provides example photos of the different types of fog, including radiation fog:
o JKL (Webmaster), NOAA National Weather Service Weather Forecast Office. (2007, April 18). Radiation Fog. Retrieved November 28, 2008, from http://www.crh.noaa.gov/jkl/?n=fog_types
Materials and Equipment
o In this science fair project, you will need to make daily, or near-daily, observations of an area with considerable plant matter. If such an area is not easily observable from your home, then you will need transportation to

frequently visit a field, park, or other location that is within 10 minutes travel time (one way) from your home, to record your observations.
o A computer with Internet access o Optional: Camera o Optional: Helper o Lab notebook o Graph paper
Experimental Procedure Collecting Your Weather Data Notes Before You Begin: This experiment requires daily (or near-daily) visual observations and twice-daily online measurements of the weather for several weeks. Timing is important for these observations:
o The first set of online measurements should be collected prior to sunrise or in the half-hour following sunrise. This will also be the time of the visual observation.
o The second set of online measurements should be collected in the evening, either before or after sunset. The exact timing of the second set of measurements is less important than the first, but try to be fairly consistent about when you take your online measurements from day to day.
11. Go to The Weather Channel and enter the zip code or city name corresponding to the location of the field, park, or other area of vegetation that you are going to observe. 12. Enter weather information—time, temperature, wind, humidity, and dew point—from the website, into a data table twice a day, once prior to sunrise, or in the half-hour following sunrise, and once in the evening.
a. For your morning measurements, do not use the online indicator of weather conditions (clear, cloudy, foggy, etc.) for your data table. Instead, look at the field, park, or other area with heavy vegetation that you have chosen, and record the weather conditions that you see there in a data table, like the one below, in your lab notebook. If you see foggy conditions, note whether it is radiation fog or not, and take photos for your display board, if desired. If you cannot see the area you are observing from your home, have a helper write down your online measurements (time, temperature, wind, humidity, and dew point) while you are making your visual observation of the weather conditions. Or make and record your online measurements

immediately before, or immediately after, you return home from making your visual observation.
b. For the evening measurements, use the online indicator of weather conditions and record them in another data table, similar to the one below. You do not need to make visual observations in the evening.
Morning Weather Measurements Data Table
Date Time Temperature Wind Humidity Dew Point
Dew-Point Depression (Temperature - Dew Point)
Visual Observation of Weather Conditions (Clear, Cloudy, Type of Fog, etc.)
Evening Weather Measurements Data Table
Date Time Temperature Wind Humidity Dew Point
Any Precipitation During the Day?
Online Indication of Weather Conditions (Clear, Cloudy, Foggy, etc.)
Analyzing Your Data Table 13. For each row in your Morning Data Table, calculate the dew-point depression, and enter your calculations in your data table. Remember from the Introduction, dew-point depression is the temperature difference between the outdoor temperature and the dew point.

14. Make a graph. For each entry that has foggy conditions (of any type) in your Morning Data Table, plot the temperature on the x-axis and the dew point on the y-axis. What do you notice about the plot? Is it linear? 15. What do you notice about the dew-point depression for all the foggy mornings in your data table? What do you notice about the dew-point depression for all the non-foggy mornings? 16. For each entry that has radiation fog as a weather condition in your Morning Data Table, look at the preceding evening's data from your Evening Data Table. What percentage of mornings with radiation fog had precipitation the previous day? What percentage of mornings with radiation fog had clear skies the previous evening? 17. What percentage of mornings with radiation fog had light winds, meaning winds between 1 and 7 miles per hour (mph)? 18. Rank the radiation fog factors—dew-point depression, rain the previous day, clear overnight skies, and light morning winds—from the most commonly observed to the least commonly observed. Variations
o On mornings with radiation fog, start taking online measurements half an hour before sunrise, and then every 15 minutes until the fog disappears (If you cannot see the fog from your home, have a helper take and record online measurements while you are at the location, writing down the time and your visual observations of the radiation fog.) Plot the dew-point depression and humidity on the y-axis, and time on the x-axis. How long does it take for the fog to dissipate under the current temperature and wind conditions? Repeat on two more mornings with radiation fog to see how dissipation time changes with temperature and wind conditions.
o Take photographs of radiation fog for three mornings, from the same vantage point and at the same angle. Use a tripod, if possible. Record the weather conditions for those three mornings. Using your photographs, compare the relative heights of the radiation fog. Does a calmer wind create a lower-lying fog? Does temperature affect the relative heights?
From Gas to Rust: Measuring the Oxygen Content of Air
(from http://sciencebuddies.com/science-fair-projects/project_ideas/Weather_p004.shtml?fave=no&isb=c2lkOjEsaWE6V2VhdGhlcixwOj
IscmlkOjMyOTM1OTE&from=TSW) Objective The goal of this experiment is to measure the percentage of oxygen in air samples. Introduction We live near the bottom of an ocean of air that surrounds the earth. The atmosphere protects us from harmful radiation from the sun, yet captures enough of the sun's light and warmth to make the planet habitable. Speaking of habitable, the atmosphere also contains the oxygen we need to breathe to support cellular respiration, the metabolic process that provides the chemical energy necessary for life. How much oxygen is in the air? This project will show you an interesting way to measure the percentage of oxygen in a sample of air in a test tube. The method depends on atmospheric pressure and a chemical reaction that removes oxygen from the air. So, what kind of chemical reaction can remove oxygen from the air? Oxidation of iron, also known as rusting, will do the trick. Exposed iron will rust in the presence of oxygen and water. As you do your background research, study this chemical reaction, and you will see that oxygen becomes combined with the iron atoms and water to create iron oxides. You'll use plain, fine steel wool (available at the hardware store) as your source of iron, placing it in the bottom of a test tube. Then, you'll invert the test tube, and mount it so that the mouth is submerged under water. This will trap the air in the test tube, and also provide water vapor for the oxidation reaction. You will have all of the chemicals necessary for the reaction: iron in the steel wool, plus oxygen and water vapor in the air in the test tube. As the iron rusts, oxygen is removed from the air sample in the test tube. With less gas, there will be lower pressure inside the test tube (fewer gas molecules bouncing around, pushing on the walls of the test tube and the surface of the water inside the tube). Meanwhile, your experiment will continue to be under the (more or less) constant pressure of the ocean of air, atmospheric pressure. So what will happen to the water level in the test tube as the oxygen in the air sample becomes sequestered in iron oxide?

That's how you'll measure the percentage of oxygen in your air sample. By measuring the water level at the start of the experiment, and at the end (when the water level has stopped changing), you can take the difference to find out how much oxygen was used to oxidize the steel wool. How does oxygen content change with altitude? Can you use this method to find out? Terms, Concepts and Questions to Start Background Research To do this project, you should do research that enables you to understand the following terms and concepts:
• atmospheric pressure, • oxidation of iron, • layers of the atmosphere.
Questions
• What are the gases that comprise Earth's atmosphere? • What chemical reaction occurs when iron rusts? • Why does the water level in the test tube rise as the steel wool oxidizes? • Why does the water level eventually stop rising? • What would happen if a larger piece of steel wool was used? A much smaller
piece? Bibliography
• This NASA website has information on atmospheric pressure: Sample, S., 2003. "It's a Breeze: How Air Pressure Affects You," NASA [accessed January 30, 2006] http://kids.earth.nasa.gov/archive/air_pressure/.
• Information on the atmosphere from the website "CloudsRUs.com": http://www.rcn27.dial.pipex.com/cloudsrus/atmosphere.html.
• Windows to the Universe Team, 2004. "Layers of the Earth's Atmosphere," University Corporation for Atmospheric Research (UCAR), The Regents of the University of Michigan, [accessed January 30, 2006] http://www.windows.ucar.edu/tour/link=/earth/Atmosphere/layers.html&edu=mid.
• Wikipedia contributors, 2006. "Rust," Wikipedia, The Free Encyclopedia [accessed January 30, 2006] http://en.wikipedia.org/w/index.php?title=Rust&oldid=37112222.

Materials and Equipment To do this experiment you will need the following materials and equipment:
• minimum of 6 test tubes, same size, • masking tape, • permanent marker, • 6 clean, clear jars or bottles, with the same height, • ring stands and clamps (or other means of holding test tubes over the jars), • steel wool.
Experimental Procedure
Diagram of basic experimental setup. You'll want to use at least three test tubes for each condition you test, to assure that your results are consistent across multiple trials.
Alternate setup. If you don't have ringstands, you can make your own test tube holder with a piece of wood or pegboard. Mount the tubes between sets of holes, and hold them in place with rubber bands stretched tight and looped over nails or pegs on the back side. Add supports at the ends with height matched to your jars.

1. Attach a strip of masking tape to the side of each of your test tubes (for marking the water level).
2. Using permanent marker, make a mark on the tape about 1 cm down from the mouth of the test tube. This will be the starting water level.
3. Tear off enough steel wool to make a ball about 2.5 cm in diameter. Use a pencil to push the steel wool down to the bottom of a test tube. Repeat for a total of three test tubes with steel wool.
4. Invert the test tubes (3 with steel wool and 3 without) and mount them over the jars so that the water level is at the starting mark on each test tube.
5. You may want to cover your entire setup with a big plastic bag to minimize evaporation. Be careful not to knock the test tubes when covering and uncovering.
6. Check at least daily, and write your observations down in your lab notebook. Carefully mark the water level on the tape on each test tube.
7. When the water level is no longer changing in the test tubes, you're ready to analyze your results.
8. Measure is the difference in water level between the starting and ending position for each test tube.
9. For how many tubes did the water level change? For those that did: a. Calculate the volume that corresponds to this difference. (Remember that
the volume, V, of a cylinder can be calculated from the formula V = πr2h, where r is the radius and h is the height of the cylinder.)
b. Calculate the total starting volume of air in each test tube. c. Calculate the proportion of oxygen in each test tube.
Questions
• What is the average of your results? • How does this compare with the value(s) for percentage of oxygen in air that you
found in your background research? • What are the potential sources of error in your measurement?
Variations
• If you ever take a vacation in the mountains, you can use this method to compare oxygen levels in the air at high and low altitude. Try doing this experiment at high altitude and comparing the results with same experiment done at a lower altitude.
• Can you use this procedure to detect decreased oxygen content in exhaled air? Do background research and find out how much oxygen we consume when we breathe. Do you think this method is sensitive enough to detect the difference? Design an experiment to find out.

• What do you think would happen if you collected air samples at high altitude, and then tested them at low altitude (or vice versa)? How easily does oxygen dissolve in water? Could dissolved oxygen affect your results? Design an experiment to find out.

How Does Atmospheric Temperature Affect the Water Content of Snow?
(from http://sciencebuddies.com/science-fair-projects/project_ideas/Weather_p012.shtml?fave=no&isb=c2lkOjEsaWE6V2VhdGhlcixwOj
EscmlkOjMyOTM1OTE&from=TSW) Objective The goal of this project is to investigate the effect of atmospheric temperature on snowfall depth. Introduction If you're lucky enough to live in a place that gets snow in winter, you know that the feel of the snow can vary a lot. Sometimes it can be light and fluffy, and other times heavy and wet. The light, fluffy snow has less water content than the heavy snow. What accounts for these differences? One possibility might be the temperature of atmosphere in the clouds where the snow forms. Another possibility might be the temperature of the atmosphere through which the snow falls on its way to the ground. You may be wondering, "How in the world am I going to measure the temperature of the clouds?" Fortunately, you don't have to make the measurements yourself. The National Oceanic and Atmospheric Administration (NOAA) has already done it for you. Twice a day all over the U.S., weather balloons are used to take atmospheric soundings. The data from these soundings is available online (Unisys Corp., 2005). Figure 1 shows an example of an upper air sounding plot. This is a standard graph used by meteorologists to analyze data from a balloon sounding. There is a lot of additional information in the graph, but basically it is a plot of temperature (x-axis) vs. height (y-axis). The white data line on the left shows the dewpoint vs. pressure, and the white data line on the right shows the temperature vs. pressure. The pressure (in millibars, mb) is shown on the y-axis in blue lettering, and the height (in m) is shown in white lettering. A sounding plot is also called a "Skew T" plot, because the temperature axis is plotted at an angle (i.e., skew) of 45°. The temperature lines of the Skew T are in blue (at 45°).

Figure 1. Example of an upper air sounding plot from the Unisys Weather webpage. Data shown are from International Falls, MN, March 23, 2007. Atmospheric pressure decreases with height above the Earth's surface. The higher you go, the less atmosphere remains above you, so the pressure decreases. "Meteorology uses pressure as the vertical coordinate and not height. This works out better for thermodynamic computations that are done on a regular basis. Pressure decreases in the atmosphere exponentially as height increases reaching 0 pressure in space. The standard unit of pressure is millibars (mb or hectopascals-hPa) of which sea level is around 1015 mb. Here is a table of pressure levels and approximate heights (Unisys Corp., 2001):"

Pressure Approximate Height Approximate Temperature
(mb) (m) (ft) (°C) (°F)
1015 (sea level) 0 0 15 59
1000 100 300 15 59
850 1500 5000 5 41
700 3000 10000 −5 23
500 5000 18000 −20 −4
300 9000 30000 −45 −49
200 12000 40000 −55 −67
100 16000 53000 −56 −69
Figure 2 shows how to read the temperature at a chosen pressure level (height). On the y-axis, find the pressure level (in mb) where you want to know the temperature. Follow the horizontal pressure line over until it intersects with the temperature plot (right-hand data plot, in white). Then follow the 45° temperature line down and to the left to the temperature axis. In the example below, the temperature at 700 mb was about −11°C.

Figure 2. Reading the temperature of the atmosphere at 700 mb (3022 m) from the sounding plot. Follow the horizontal pressure line to where it intersects with the temperature plot (right hand data line, in white). Then follow the 45° temperature line down and to the left to the temperature axis. In this example, the temperature at 700 mb was about −11°C. There is a lot more information in the sounding plot, but it isn't important for this project. If you want to learn more about sounding plots, see the references in the Bibliography section. In this project you will use atmospheric sounding data combined with your own measurements of the snow depth to liquid ratio to find out if there is a relationship between atmospheric temperature and snow quality. Terms, Concepts and Questions to Start Background Research To do this project, you should do research that enables you to understand the following terms and concepts:

• troposphere, • pressure, • temperature, • snowflake structure.
Questions
• Where does snow typically form in the atmosphere? Bibliography
• For more information about the layers of the Earth's atmosphere, see: UCAR, 2000. "Windows to the Universe: Layers of the Earth's Atmosphere," University Corporation for Atmospheric Research [accessed March 27, 2007] http://www.windows.ucar.edu/tour/link=/earth/Atmosphere/layers.html.
• For current sounding data, see: Unisys Corp., 2005. "Unisys Weather: Upper Air: Upper Air Sounding Plots," Unisys Weather [accessed March 23, 2007] http://weather.unisys.com/upper_air/skew/.
• For more information on the data contained in upper air sounding plots, see the following references:
o Unisys Corp., 1998. "Unisys Weather: Upper Air: Upper Air Sounding Details," Unisys Weather [accessed March 23, 2007] http://weather.unisys.com/upper_air/skew/details.html.
o Unisys Corp., 2001. "Unisys Weather: Information: Vertical Coordinate—Pressure," Unisys Weather [accessed March 23, 2007] http://weather.unisys.com/info/press.html.
o Advanced. There is a lot more information in a sounding plot than just temperature. If you'd like to learn more, check out this page: Millersville University LEAD Undergraduates, date unknown. "Lead-to-Learn: Understanding a Sounding/Skew-T," http://www.atmos.millersville.edu/~lead/SkewT_Home.html.
• This project is based on: Haby, J., date unknown. "Basic Meteorology Experiments: Experiment #9: Snow-to-Liquid Ratio," TheWeatherPrediction.com [accessed March 20, 2007] http://www.theweatherprediction.com/experiments/.
Materials and Equipment To do this experiment you will need the following materials and equipment:
• tall cylindrical can for taking snow samples,
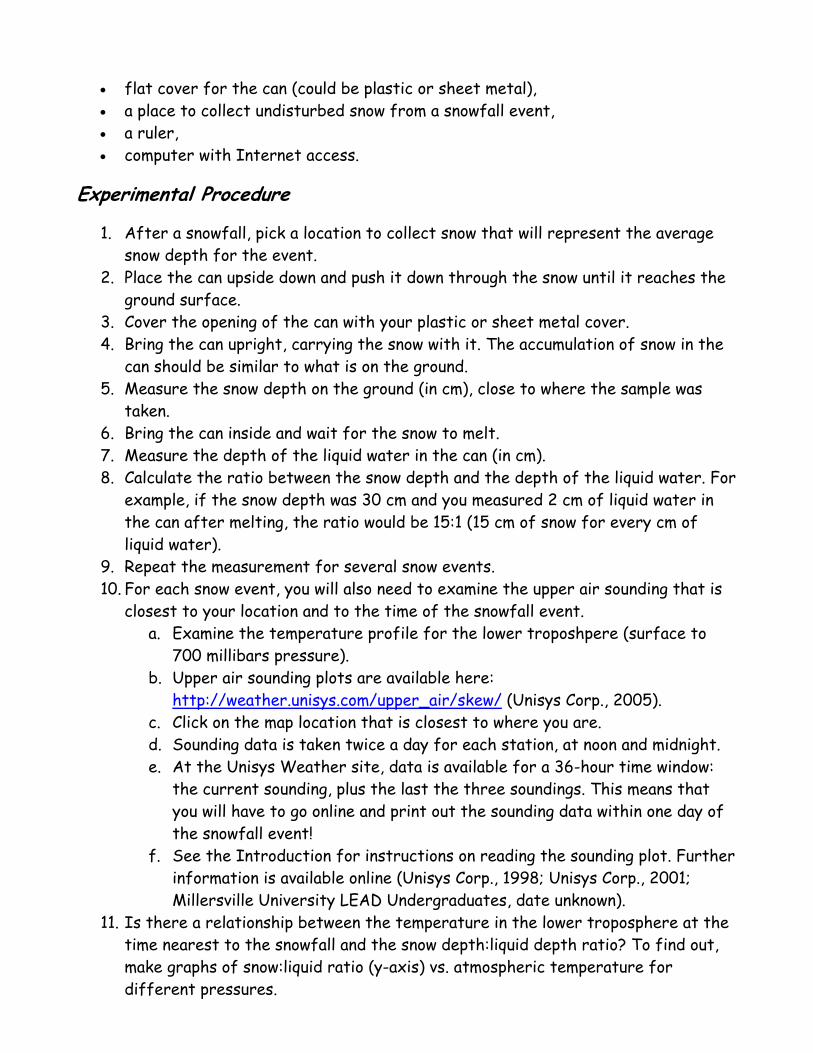
• flat cover for the can (could be plastic or sheet metal), • a place to collect undisturbed snow from a snowfall event, • a ruler, • computer with Internet access.
Experimental Procedure
1. After a snowfall, pick a location to collect snow that will represent the average snow depth for the event.
2. Place the can upside down and push it down through the snow until it reaches the ground surface.
3. Cover the opening of the can with your plastic or sheet metal cover. 4. Bring the can upright, carrying the snow with it. The accumulation of snow in the
can should be similar to what is on the ground. 5. Measure the snow depth on the ground (in cm), close to where the sample was
taken. 6. Bring the can inside and wait for the snow to melt. 7. Measure the depth of the liquid water in the can (in cm). 8. Calculate the ratio between the snow depth and the depth of the liquid water. For
example, if the snow depth was 30 cm and you measured 2 cm of liquid water in the can after melting, the ratio would be 15:1 (15 cm of snow for every cm of liquid water).
9. Repeat the measurement for several snow events. 10. For each snow event, you will also need to examine the upper air sounding that is
closest to your location and to the time of the snowfall event. a. Examine the temperature profile for the lower troposhpere (surface to
700 millibars pressure). b. Upper air sounding plots are available here:
http://weather.unisys.com/upper_air/skew/ (Unisys Corp., 2005). c. Click on the map location that is closest to where you are. d. Sounding data is taken twice a day for each station, at noon and midnight. e. At the Unisys Weather site, data is available for a 36-hour time window:
the current sounding, plus the last the three soundings. This means that you will have to go online and print out the sounding data within one day of the snowfall event!
f. See the Introduction for instructions on reading the sounding plot. Further information is available online (Unisys Corp., 1998; Unisys Corp., 2001; Millersville University LEAD Undergraduates, date unknown).
11. Is there a relationship between the temperature in the lower troposphere at the time nearest to the snowfall and the snow depth:liquid depth ratio? To find out, make graphs of snow:liquid ratio (y-axis) vs. atmospheric temperature for different pressures.

Predicting the Weather (from http://sciencebuddies.com/science-fair-
projects/project_ideas/Weather_p001.shtml?fave=no&isb=c2lkOjEsaWE6V2VhdGhlcixwOjIscmlkOjMyOTM1OTE&from=TSW)
Objective The objective of this experiment is to find the most accurate way to predict the weather without using advanced technology, like satellites and computers. The two methods compared are the scientific (using homemade instruments) and the traditional (using observations of nature) methods. Introduction Predicting the weather has become a science in itself. Through the use of satellite images and a variety of data-collection tools, we can now develop fairly accurate predictions of our weather patterns. Before the development of these more-advanced techniques, people used basic tools and/or stories and sayings to capture nature's signals of changes in weather, such as:
• Bad weather is coming when the cows lie down. • Good weather is coming when the bees are busier than usual. • Bad weather is coming when your bones or joints ache.
If you want to see how well this and other folklore predicts the weather, join Mari and Lindsay in the DragonflyTV video on the right as they watch the sky, make a homemade barometer, and put cows, bees, bones, and hair to the test for nine days, to see if natural signals can tell you what the weather is going to be like the next day. Which is more effective as a tool for prediction: our homemade instruments or nature's indicators? Terms, Concepts and Questions to Start Background Research In order to properly conduct this science fair project, you will need to learn the basics about weather. What is weather and what are the major factors that cause our weather to change?

Some key terms to understand:
• Atmospheric pressure (also known as barometric pressure) • Relative humidity • Dew point • Air temperature and how it varies relative to atmospheric pressure • Wind speed
Since you will also be constructing some homemade instruments to help you capture data, you will need to understand how each of the following instruments works:
• Hygrometer • Barometer • Weather vane
Bibliography
• TPT. (2006). Forecasting by Mari and Lindsey. DragonflyTV, Twin Cities Public Television. Retrieved November 13, 2008, from http://pbskids.org/dragonflytv/show/forecasting.html?video=forecasting
Basics of weather: • http://en.wikipedia.org/wiki/Weather • http://www.usatoday.com/weather/resources/basics/wworks0.htm • The National Oceanic and Atmospheric Administration (NOAA) is a government
organization that collects, analyzes, and disseminates data on weather. Their website has an abundance of information on weather: http://www.noaa.gov/
• The Unisys Weather site (http://weather.unisys.com/) provides a complete source of graphical weather information. The graphics and data are displayed as a meteorologist would expect to see them. For the novice user, there are detailed explanation pages to guide them through the various plots, charts and images.
Glossary of weather terms: • http://earthstorm.ocs.ou.edu/materials/glossary.php
Some sites that discuss weather lore: • http://www.almanac.com/weathercenter/predictforecasts.php • http://www.loc.gov/rr/scitech/mysteries/weather-sailor.html • http://snrs.unl.edu/amet351/janeczko/proverbs.html
How to build your own weather instruments: • Constructing a barometer: http://www.fi.edu/weather/todo/barometer.html • Constructing a hygrometer:
o Using hair: http://www.fi.edu/weather/todo/hygrometer.html

• Constructing a weather vane: http://www.bbc.co.uk/tyne/weather/wind_vane.shtml
Materials and Equipment
• Homemade weather instruments (see links above for specific instructions and materials required to build each of these instruments):
o Barometer o Hygrometer o Weather Vane
• Weather Lore: o To measure general weather observe: "Red sky at night, sailor's delight;
Red sky in morning, sailor take warning." o To measure humidity observe: "A ring around the moon or sun, and rain
approaches on the run." o To measure barometric pressure observe: "Sea gull, sea gull, sit on the
sand, It's never good weather while you're on the land." o To measure wind direction observe: blowing smoke or leaves.
• Weather data chart • Pen
Experimental Procedure For the scientific method:
• Build each of the instruments you will use to capture your weather data. • Collect data in your weather data chart twice daily (morning and evening). • Based on the collected data, make morning and evening predictions about the
oncoming weather and record these in our weather data chart. • Compare each of your predictions to the control.
For the traditional (weather lore) technique: • Observe "nature's signals" and collect data in your weather data chart twice daily
(morning and evening). • Based on the collected data, make morning and evening predictions about the
oncoming weather and record these in our weather data chart. • Compare each of your predictions to the control.
Control: • Use the weather prediction in your local paper (or an online source, such as Unisys
Weather, listed in the Bibliography) as the control and compare each of your predictions to the local paper. Make sure that you make your own predictions before reading the paper! ;-)