Embed Size (px)
Citation preview

We use a two-color
headline system to
highlight our rational and
emotional side alike. The
first line appears in blue
(the rational side), the
second line in orange (the
emotional side) and the
duality principle is reflected
in the wording of the
headline.
This system refers to the
first page title only, all
other headlines are blue.
Learn more about our
verbal identity in the
Sandvik Brand Identity
Directives, which you can
download at the Intranet >
home.sandvik.com/brand
INTERIM REPORT THIRD QUARTER 2019
1

SUMMARY Q3
2
SLOWDOWN IN EARLY-CYCLE COMPENSATED FOR BY
ROBUST ACTIVITY IN LATE-CYCLE SEGMENTS
• ORDER INTAKE -1%
• SMRT IN SOLID GROWTH +5%
• MAJOR ORDERS IN SMT ~700 MSEK (~500 MSEK LAST YEAR)
EARNINGS SUPPORTED BY FX TAILWIND
• ADJUSTED EBIT MARGIN AT 18.3%
EFFICIENCY MEASURES INITIATED –
HIGHER AMBITION
SANDVIK: Interim Report on the third quarter 2019
Comments and numbers refer to continuing operations unless otherwise stated.
STRONG CASH FLOW – SECOND BEST EVER

3
% of group
revenue FY18 Y/Y
order intake
Y/Y UNDERLYING DEMAND TREND
EUROPE 38% -10%
NORTH AMERICA 21% +7%
ASIA 20% -5%
AFRICA/MIDDLE EAST 9% +33%
SOUTH AMERICA 5% -0%
AUSTRALIA 7% -1%
segment bubble size – share of group revenue 2018
Sequential underlying
demand trend (Q2/Q3)
MARKET
DEVELOPMENT
Comments and numbers refer to continuing operations unless otherwise stated.
SANDVIK: Interim Report on the third quarter 2019

ORDER INTAKE
4
P/V
-1% REPORTED
24 992 MSEK MSEK
P/V
-1% REPORTED
25 163
REVENUES SLOWDOWN IN EARLY-CYCLE DEMAND SUPPORTED BY BACKLOG IN SMRT
Comments and numbers refer to continuing operations unless otherwise stated.
80 000
90 000
100 000
110 000
15 000
20 000
25 000
30 000
2015 2016 2017 2018 2019
Order intake, reported Organic order intake, 12M rolling
80 000
90 000
100 000
110 000
15 000
20 000
25 000
30 000
2015 2016 2017 2018 2019
Revenues, reported Organic revenues, 12M rolling
SANDVIK: Interim Report on the third quarter 2019

EBIT DEVELOPMENT
5
MSEK
ADJUSTED EBIT
4 617 MSEK
• DECLINE OF -11%
EXCLUDING FX, STRUCTURE
AND METALS
• IMPACTED BY
UNDERABSORPTION OF
FIXED COSTS IN SMS
ADJUSTED EBIT %
18.3
*Adjusted for items affecting comparability
+1%
Comments and numbers refer to continuing operations unless otherwise stated.
10%
13%
16%
19%
22%
2 000
3 000
4 000
5 000
6 000
Q1 Q2 Q3 Q4 Q1 Q2 Q3 Q4 Q1 Q2 Q3 Q4 Q1 Q2 Q3 Q4 Q1 Q2 Q3
2015 2016 2017 2018 2019
EBIT* EBIT%*
SANDVIK: Interim Report on the third quarter 2019

SANDVIK MACHINING
SOLUTIONS
6
WEAK DEMAND IN IMPORTANT SEGMENTS
− Decline in large segments; general engineering and
automotive
− Cutting tools underlying at about -8% with some
prolonged summer closures among customers
• Tungsten powder business impacted negatively by -2%
• Working day impact +1%
MARGIN IMPACTED BY LOWER VOLUMES AND
PRODUCTION RATES
− Negative impact by ~200 bps due to volume drop
including a negative impact from tungsten powder
business partially off-set by savings
− Destocking vs. restocking last year impacted negatively
by -190 bps but to some extent off-set by favorable FX
EBIT & ROCE DEVELOPMENT
-9%*
-7%*
-15%
CHANGE Q3 2018 Q3 2019
ORDER INTAKE
REVENUES
ADJ. OP PROFIT
% OF REVENUES
10 047
10 100
2 543
25.2%
9 609
9 927
2 173
21.9%
MSEK
*At fixed exchange rates for comparable units
¹Adjusted for items affecting comparability
²ROCE: EBIT adj. annualized, CE 1Q avg.
41%
SHARE OF
REVENUES 2018
15%
25%
35%
45%
1 500
2 000
2 500
3 000
Q1 Q2 Q3 Q4 Q1 Q2 Q3 Q4 Q1 Q2 Q3 Q4 Q1 Q2 Q3
2016 2017 2018 2019
EBIT¹ EBIT%¹ ROCE %²

SANDVIK MINING AND
ROCK TECHNOLOGY
7
DEMAND ON HIGH LEVEL
− Mid-single digit growth for equipment on easy
comparables
− Aftermarket in mid-single digit growth reaching
record level
RECORD EARNINGS AND MARGIN
− Earnings primarily supported by FX and
revenue growth
− Excluding FX earnings improved by 2%
GOOD RECEPTION OF NEWLY LAUNCHED
PRODUCT LINE FOR SURFACE DRILLING
44%
SHARE OF
REVENUES 2018
¹Adjusted for items affecting comparability
²ROCE: EBIT adj. annualized, CE 1Q avg.
EBIT & ROCE DEVELOPMENT
+5%*
+3%*
+18%
CHANGE Q3 2018 Q3 2019
ORDER INTAKE
REVENUES
ADJ. OP PROFIT
% OF REVENUES
10 468
10 838
1 966
18.1%
11 516
11 754
2 329
19.8%
MSEK
*At fixed exchange rates for comparable units
5%
10%
15%
20%
25%
30%
35%
0
500
1 000
1 500
2 000
2 500
Q1 Q2 Q3 Q4 Q1 Q2 Q3 Q4 Q1 Q2 Q3 Q4 Q1 Q2 Q3
2016 2017 2018 2019
EBIT¹ EBIT%¹ ROCE %²

SANDVIK MATERIALS
TECHNOLOGY
8
SLOWDOWN IN EARLY-CYCLE BUSINESS
− Slowing demand across regions and segments for
early-cycle product offering
− Large orders booked ~700 MSEK in capex-related
energy segment (~500 MSEK last year)
UNFAVORABLE MIX IMPACTED EARNINGS
− Lower volumes in standardized offering as well as
Kanthal more than off-set favorable development in
capex oil and gas
− Ongoing efficiency measures
¹Adjusted for items affecting comparability ²ROCE: EBIT adj. annualized, CE 1Q avg.
³EBIT adj. for items affecting comparability and metal prices
15%
SHARE OF
REVENUES 2018
+4%*
+3%*
+2%
CHANGE Q3 2018 Q3 2019
ORDER INTAKE
REVENUES
ADJ. OP. PROFIT
% OF REVENUES
UNDERLYING MARGIN³
3 677
3 344
230
6.9%
5.6%
3 867
3 482
236
6.8%
5.2%
MSEK
*At fixed exchange rates for comparable units
EBIT & ROCE DEVELOPMENT
-5%
0%
5%
10%
15%
20%
-200
0
200
400
600
800
Q1 Q2 Q3 Q4 Q1 Q2 Q3 Q4 Q1 Q2 Q3 Q4 Q1 Q2 Q3
2016 2017 2018 2019
EBIT¹ EBIT%¹ ROCE%² EBIT%³

9
TOMAS ELIASSON
CFO

FINANCIAL SUMMARY Q3 AND 9M
10
¹ At fixed exchange rates for comparable units
² Quarterly calculation i.e. annualized adj. EBIT or revenues and 1Q average CE or NWC
³ Cash flow before acquisitions and disposals, financial items and taxes
GROWTH Q319, %
ORDER REVENUES
INTAKE
ORGANIC: -1 -1
CURRENCY: +4 +4
STRUCTURE: +0 +0
TOTAL +3 +4
MSEK Q3 2018 Q3 2019 CHANGE
%
Q1-3 2018 Q1-3 2019
CHANGE
%
ORDER INTAKE 24 192 24 992 -1¹ 76 812 78 897 +0¹
REVENUES 24 283 25 163 -1¹ 74 104 76 655 +1¹
ADJUSTED OPERATING PROFIT 4 587 4 617 +1 13 925 14 152 +2
% OF REVENUES 18.9 18.3 18.8 18.5
FINANCE NET -140 -198 -42 -659 -963 -46
UNDERLYING TAX RATE 26.1 25.8 26.3 25.7
NWC %² ³ 27.2 28.3 24.1 25.8
CASH FLOW³ +4 679 +5 840 +25 +8 983 +11 348 +26
ROCE % ² ³ 21.7 20.6 22.6 21.3
ADJUSTED EPS CONT. OPS. 2.62 2.61 -1 7.81 7.92 +2
Comments and numbers refer to continuing operations unless otherwise stated.
SANDVIK: Interim Report on the third quarter 2019

SANDVIK GROUP
BRIDGE ANALYSIS
MSEK
REVENUES
ADJUSTED
EBIT
ADJUSTED
EBIT MARGIN
-206
-518
N/A
+994
+584
-
+92
-35
-
CURRENCY
STRUCTURE/
METAL IMPACT
PRICE/ VOLUME/
PRODUCTIVITY
24 283
4 587
18.9%
Q3 2018
25 163
4 617
18.3%
Q3 2019
11
-2.0% +1.7% -0.3% MARGIN ACCRETION / DILUTION
GROUP LEVERAGE:
N/A
Comments and numbers refer to continuing operations unless otherwise stated.
SANDVIK: Interim Report on the third quarter 2019
• Includes metal price effects within Sandvik Materials Technology of -4 MSEK in alloy surcharges on revenues and -11 MSEK in metal price effect on EBIT (+43 Q3 2018 vs. +54 Q3 2019). Structure SMT -66 MSEK
on topline and -9 MSEK on EBIT (Stainless wire). Structure SMS +83 MSEK on topline and -5 MSEK on EBIT (Dura-Mill, Wetmore & OSK). Structure +79 MSEK SMRT on topline and -33 MSEK on EBIT for Artisan
& Newtrax.

12
CAPEX TO SALES PREVIOUS
MINING PEAK CURRENT
MINING PEAK
12
PREVIOUS
MINING PEAK CURRENT
MINING PEAK
SANDVIK MACHINING
SOLUTIONS
SANDVIK MINING &
ROCK TECHNOLOGY SANDVIK MATERIALS
TECHNOLOGY
GROUP
COMMON
930
980
323
440
278
220
40
70
TOTAL COSTS
TOTAL ESTIMATED SAVINGS
1 571
MSEK, MAJORITY ACHIEVED BY MID-2020
~1 710
~2500*
0.9
COST SCRUTINY MORE TO DO
IMPLIED REDUCTION OF
PERSONNEL
PAYBACK TIME, YEARS
* 450 people already left the company as of end of Q2 2019 however savings
are to filter through in H2 2019 (Sandvik Machining Solutions)
MSEK, BOOKED IN Q3 2019
25% INCREASE COMPARED WITH ORIGINAL PLAN

NET FINANCIALS
13
Comments and numbers refer to continuing operations unless otherwise stated.
MSEK Q3 18 Q3 19
Underlying interest net -150 -99
Pension -32 -35
Bank charges -13 -7
Other fin income & costs -10 -5
IFRS16 -27
FX & other asset classes +65 -25
Total -140 -198
• INTEREST NET LOWERED
• NEGATIVE IMPACT FROM
DERIVATIVES
• GUIDANCE ~1.2 BSEK
FOR FULL 2019
SANDVIK: Interim Report on the third quarter 2019
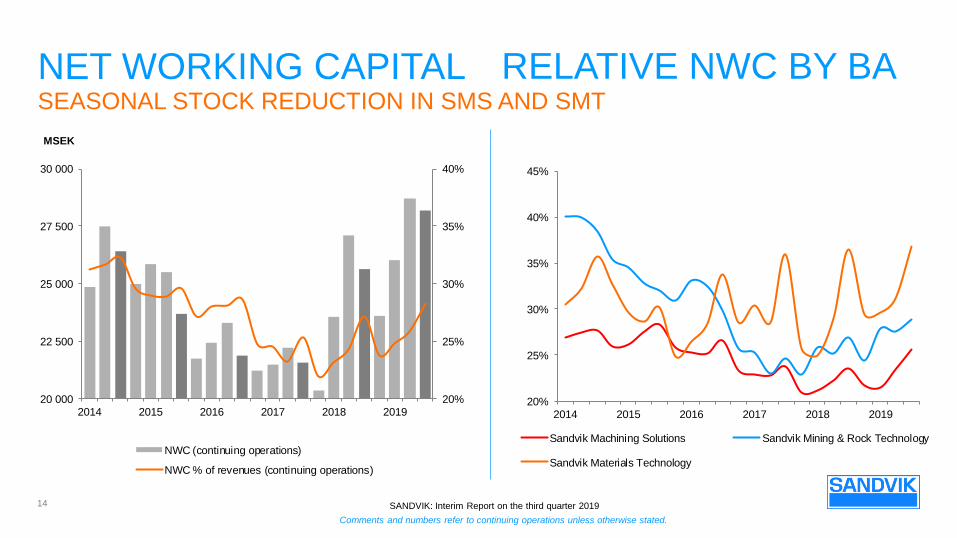
NET WORKING CAPITAL
14
RELATIVE NWC BY BA
MSEK
SEASONAL STOCK REDUCTION IN SMS AND SMT
Comments and numbers refer to continuing operations unless otherwise stated.
20%
25%
30%
35%
40%
20 000
22 500
25 000
27 500
30 000
2014 2015 2016 2017 2018 2019
NWC (continuing operations)
NWC % of revenues (continuing operations)
20%
25%
30%
35%
40%
45%
2014 2015 2016 2017 2018 2019
Sandvik Machining Solutions Sandvik Mining & Rock Technology
Sandvik Materials Technology
SANDVIK: Interim Report on the third quarter 2019

FREE OPERATING CASH FLOW
15
MSEK
*Including amortization of lease liabilities and IFRS adoption
**Including investments and disposals in rental, tangible and intangible assets
***Cash flow before acquisitions and disposals, financial items and taxes
*Adjusted for items affecting comparability
Comments and numbers refer to continuing operations unless otherwise stated.
MSEK Q3 2018 Q3 2019
EBITDA + non-cash* 5 534 5 533
NWC change +220 +1 392
Capex** -1 074 -1 085
FOCF*** 4 679 5 840
10 000
12 000
14 000
16 000
18 000
20 000
0
2 000
4 000
6 000
8 000
Q1 Q2 Q3 Q4 Q1 Q2 Q3 Q4 Q1 Q2 Q3 Q4 Q1 Q2 Q3 Q4 Q1 Q2 Q3
2015 2016 2017 2018 2019
Free operating cash flow
Free operating cash flow 12M rolling
Adjusted EBITA* 12M rolling
SANDVIK: Interim Report on the third quarter 2019

NET DEBT
16
• GEARING AT 0.27
• INCREASE IN
NET PENSION LIABILITIES
MSEK GEARING
Comments and numbers refer to continuing operations unless otherwise stated.
0.0
0.2
0.4
0.6
0.8
1.0
1.2
1.4
0
10 000
20 000
30 000
40 000
50 000
Q1 Q2 Q3 Q4 Q1 Q2 Q3 Q4 Q1 Q2 Q3 Q4 Q1 Q2 Q3 Q4 Q1 Q2 Q3
2015 2016 2017 2018 2019
Financial net debt Net pension liability Leases Gearing
SANDVIK: Interim Report on the third quarter 2019

OUTCOME Q3 AND GUIDANCE
17
Comments and numbers refer to continuing operations unless otherwise stated.
Q3 2019
Underlying currency effect (MSEK): +376 (~300)
Total currency effect (MSEK): +584
Metal price effect in quarter (MSEK): +54 (-20)
Q4 2019
Underlying currency effect (MSEK): +400*
Metal price effect in quarter (MSEK): +300**
FULL YEAR 2019
Cash capex (BSEK): <4 (Q3: 1; 9M: 2.8)
Net financial items (BSEK): ~1.2 (UPDATED) (Q3: 0.2; 9M: 1)
Underlying tax rate (%): 25-27 (Q3: 25.8; 9M: 25.7) *Based on currency rates end of September 2019
**Based on currency rates, stock levels and metal prices at the end of September 2019
SANDVIK: Interim Report on the third quarter 2019

SUMMARY Q3
SHARP SLOWDOWN IN EARLY-CYCLE DEMAND
EFFICIENCY MEASURES ONGOING
PROGRESS ON INTERNAL SEPARATION OF SMT
STRONG CASH FLOW – SECOND BEST QUARTER EVER

BACK-UP SLIDES
19

20
MINING (34%)
ENERGY (11%)
AUTOMOTIVE (12%)
CONSTRUCTION (9%)
AEROSPACE (6%)
END-CUSTOMER SEGMENTS % of group revenues 2018 excl. Mining systems; Other e.g. consumer goods, electronics, chemical and miscellaneous was 5% .
Comments and numbers refer to continuing operations unless otherwise stated.
GENERAL
ENGINEERING (23%)
SANDVIK: Interim Report on the third quarter 2019

PROFITABILITY DEVELOPMENT
21
+584
4,618
EBIT Q3 19
-518
EBIT Q3 18 ORGANIC
GROWTH
METAL PRICE
EFFECT SMT
CURRENCY
+11 -46
STRUCTURE
4,587
ADJUSTED
EBIT MARGIN 18.9% 18.3%
GROUP LEVERAGE:
N/A
Comments and numbers refer to continuing operations unless otherwise stated.
SANDVIK: Interim Report on the third quarter 2019

BRIDGE ANALYSIS
CURRENCY STRUCTURE ONE-OFFS*
PRICE/ VOLUME/ PRODUCTIVITY Q3 2018 MSEK Q3 2019
MACHINING SOLUTIONS
MINING AND ROCK
TECHNOLOGY
MATERIALS TECHNOLOGY
REVENUES
ADJUSTED EBIT
ADJUSTED EBIT MARGIN
REVENUES
ADJUSTED EBIT
ADJUSTED EBIT MARGIN
REVENUES
ADJUSTED EBIT
ADJUSTED EBIT MARGIN
10 100
2 543
25.2%
10 838
1 966
18.1%
3 344
230
6.9%
-664
-557
-84%
362
67
+19%
96
-50
n/a
+408
+192
-
+475
+329
-
+112
+54
-
+83
-5
-
+79
-33
-
-70
+2
-
9 927
2 173
21.9%
11 754
2 329
19.8%
3 482
236
6.8%
22
Comments and numbers refer to continuing operations unless otherwise stated.
• Includes metal price effects within Sandvik Materials Technology of -4 MSEK in alloy surcharges on revenues and -11 MSEK in metal price effect on EBIT (+43 Q3 2018 vs. +54 Q3 2019). Structure SMT -66 MSEK
on topline and -9 MSEK on EBIT (Stainless wire). Structure SMS +83 MSEK on topline and -5 MSEK on EBIT (Dura-Mill, Wetmore & OSK). Structure +79 MSEK SMRT on topline and -33 MSEK on EBIT for Artisan
& Newtrax.
SANDVIK: Interim Report on the third quarter 2019

LOAN AND DURATION PROFILE
Cash position 8 168 MSEK
Committed Credit facilities 12 541 MSEK
SHORT TERM
13%
LONG TERM
87%
AMOUNT MSEK AVERAGE DURATION
US Private Placement 0 -
Fin institutions, EIB, NIB 0 -
Swedish MTN 3 648 2 years
European MTN 11 776 7 years
Bank loans 82 1 year
Share swap - -
US Private Placement 0 -
Fin institutions, EIB, NIB 0 -
Swedish MTN 2 001 1 month
Bank loans 232 4 months
Share swap - -
TOTAL 17 738 5 years
23
Comments and numbers refer to continuing operations unless otherwise stated.
SANDVIK: Interim Report on the third quarter 2019

LOAN MATURITY PROFILE
MSEK
24
Comments and numbers refer to continuing operations unless otherwise stated.
0
500
1 000
1 500
2 000
2 500
3 000
3 500
4 000
2019 2020 2021 2022 2023 2024 2025 2026 2027 2028 2029 2030 2031 2032 2033
AVERAGE
INTEREST RATE:
~3%
SANDVIK: Interim Report on the third quarter 2019

Estimated to <4 BSEK for 2019
GUIDANCE
TAX RATE
NET FINANCIAL
ITEMS
CASH CAPEX
CURRENCY
EFFECTS
METAL PRICE
EFFECTS
The tax rate is estimated to 25-27% for 2019
Given currency rates at end of September 2019 the effect on operating profit from transaction and
translation would be +400 MSEK for Q4 2019
Given currency rates, stock levels and metal prices at the end of September 2019, it is
estimated that effect on operating profit in Q4 2019 will be +300 MSEK
Net financial items is estimated at about 1.2 BSEK for 2019
25
Comments and numbers refer to continuing operations unless otherwise stated.
SANDVIK: Interim Report on the third quarter 2019

DISCLAIMER STATEMENT
“Some statements herein are forward-looking and the actual outcome could be materially different. In addition to the factors
explicitly commented upon, the actual outcome could be materially affected by other factors for example, the effect of economic
conditions, exchange-rate and interest-rate movements, political risks, impact of competing products and their pricing, product
development, commercialisation and technological difficulties, supply disturbances, and the major customer credit losses.”