Embed Size (px)
Citation preview

econstorMake Your Publications Visible.
A Service of
zbwLeibniz-InformationszentrumWirtschaftLeibniz Information Centrefor Economics
Gründler, Klaus; Krieger, Tommy
Working Paper
Democracy and Growth: Evidence of a NewMeasurement
CESifo Working Paper, No. 5647
Provided in Cooperation with:Ifo Institute – Leibniz Institute for Economic Research at the University of Munich
Suggested Citation: Gründler, Klaus; Krieger, Tommy (2015) : Democracy and Growth:Evidence of a New Measurement, CESifo Working Paper, No. 5647, Center for EconomicStudies and ifo Institute (CESifo), Munich
This Version is available at:http://hdl.handle.net/10419/128347
Standard-Nutzungsbedingungen:
Die Dokumente auf EconStor dürfen zu eigenen wissenschaftlichenZwecken und zum Privatgebrauch gespeichert und kopiert werden.
Sie dürfen die Dokumente nicht für öffentliche oder kommerzielleZwecke vervielfältigen, öffentlich ausstellen, öffentlich zugänglichmachen, vertreiben oder anderweitig nutzen.
Sofern die Verfasser die Dokumente unter Open-Content-Lizenzen(insbesondere CC-Lizenzen) zur Verfügung gestellt haben sollten,gelten abweichend von diesen Nutzungsbedingungen die in der dortgenannten Lizenz gewährten Nutzungsrechte.
Terms of use:
Documents in EconStor may be saved and copied for yourpersonal and scholarly purposes.
You are not to copy documents for public or commercialpurposes, to exhibit the documents publicly, to make thempublicly available on the internet, or to distribute or otherwiseuse the documents in public.
If the documents have been made available under an OpenContent Licence (especially Creative Commons Licences), youmay exercise further usage rights as specified in the indicatedlicence.
www.econstor.eu

Democracy and Growth: Evidence of a New Measurement
Klaus Gründler Tommy Krieger
CESIFO WORKING PAPER NO. 5647 CATEGORY 2: PUBLIC CHOICE
DECEMBER 2015
An electronic version of the paper may be downloaded • from the SSRN website: www.SSRN.com • from the RePEc website: www.RePEc.org
• from the CESifo website: Twww.CESifo-group.org/wp T
ISSN 2364-1428

CESifo Working Paper No. 5647
Democracy and Growth: Evidence of a New Measurement
Abstract We present a novel approach for measuring democracy based on Support Vector Machines, a mathematical algorithm for pattern recognition. The Support Vector Machines Democracy Index (SVMDI) is continuously on the 0-1-interval and enables a very detailed measurement of democracy for 188 countries between 1981 and 2011. Application of the SVMDI highlights a robust positive relationship between democracy and economic growth. We argue that the ambiguity in recent studies mainly originates from the lack of sensitivity of traditional democracy indicators. Analyzing transmission channels we conclude that democratic countries have better educated populations, higher investment shares, and lower fertility rates, but not necessarily higher levels of redistribution.
JEL-codes: C430, F500, F550, H000, O110, P480.
Keywords: democracy, economic growth, democracy index, support vector machines.
Klaus Gründler University of Würzburg
Department of Economics Sanderring 2
Germany – 97070 Würzburg [email protected]
Tommy Krieger University of Konstanz
Department of Economics Universitätsstrasse 10
Germany – 78464 Konstanz [email protected]
December 1, 2015

1 Introduction
Today, the belief in democracy and its positive effects on freedom, liberty,
and wealth is widespread among citizens of different countries. Covering pref-
erences of the vast majority of the world’s citizens, the World Value Survey
(2014) finds that 79 percent of the global population wish to live in a coun-
try that is governed democratically.1 This preference is not only prevalent in
countries with long democratic traditions (United States: 78.7 percent, Swe-
den: 91.9), but can also be found in Islamic states (Pakistan: 78.3, Malaysia:
86.6), African nations (Rwanda: 74.1, Zimbabwe: 86.1), South America (Chile:
83.4, Ecuador: 84.2), and Asia (China: 80.6, South Korea: 86.0). Beginning
in 2011, the unfulfilled desire for democracy in the Arab World (Egypt: 93.6,
Yemen: 76.3) culminated in a wave of protests, riots, and demonstrations that
spread through the nations of the Arab League and its surroundings. Driven
by a fatigue with authoritarian rule, the desire for improvements of economic
opportunities was one major trigger of the uprisings (see Campante and Chor,
2012).
While most of the citizens around the world seem to be quite confident that
democracy brings with it an improvement in living standard, academics in
political science and economics could not disagree more about the effect of
democratization on economic growth. Gerring et al. (2005) summarize the
academic literature by concluding that “the net effect of democracy on growth
over the last five decades is negative or null”. More recently, some studies point
to a positive effect of democracy on the income level (e.g. Acemoglu et al.,
2014 and Madsen et al., 2015), whereas other surveys still find no positive
contribution (e.g. Murtin and Wacziarg, 2014).
In this paper, we provide evidence of a robust positive influence of democracy
on economic growth. We argue that the ambiguity in the recent literature can
first and foremost be traced back to the composition of existing democracy
indicators. Available indices are subject to substantial weaknesses in concep-
tualization, particularly with regard to the strategy employed to aggregate the
underlying secondary data. As a result, existing indicators do not react with
1See question V140 of the World Value Survey’s 6th Wave, conducted between 2010 and2014: “How important is it for you to live in a country that is governed democratically? Onthis scale where 1 means it is not at all important and 10 means absolutely important whatposition would you choose?” The above number refers to all respondents that respond tothe question with a value of 7 or larger.
2
sufficient sensitivity to political events and regime changes.
This problem is amplified by the specification of the applied estimation tech-
niques. A large number of recent studies eliminate unobserved heterogeneity
via Within-Group estimations or difference GMM. However, whereas the first
method yields a considerable dynamic panel bias (Nickell, 1981), the latter
is accompanied by dramatic efficiency losses if additional orthogonality re-
strictions can be exploited (see Blundell and Bond, 1998). Even more severely,
when estimating empirical models using transformations that remove the infor-
mation in the equation in levels, it is particularly necessary to have democracy
indicators that react very sensitively to political events and regime changes.
Otherwise, relying on the limited within-country information in the panel is
likely to yield ambiguous results concerning the growth effect of democratiza-
tion.
This paper addresses both challenges. In the first step, we introduce a novel ap-
proach to measure democracy which is based on machine learning algorithms
for pattern recognition. These algorithms operate on the basis of a model
drawn from example inputs to make data-driven predictions or decisions. The
particular advantage gained via application of such methods is that they give
computers the ability to learn without being explicitly programmed. Whereas
the machine learning toolbox provides numerous promising instruments, Sup-
port Vector Machines (SVM) in particular have recently yielded striking results
in various branches of science. Practical applications include categorization of
cancer cells (Guyon et al., 2002), classification of hyperspectral data in geo-
physics (Gualtieri, 2009) and identification of biomarkers of neurological and
psychiatric disease (Orru et al., 2012). We transfer the SVM approach to the
problem of democracy measurement, obtaining an index which we refer to as
the Support Vector Machines Democracy Indicator (SVMDI). The indicator
is continuous on the interval from 0 to 1, thereby considerably enhancing the
level of detail. The most important improvement, however, is that the aggre-
gation of the characterizing variables is not arbitrary, as our SVM algorithm
puts the problem of learning—i.e. the classification of country-years—into the
context of an optimization problem. The SVMDI is available for 188 countries
in the period from 1981 to 2011, covering countries representative of over 99
percent of the global population.
In the second step, we analyze the effect of the SVMDI on economic growth
in a system GMM framework which considers the econometric challenges de-
3

scribed above. Our findings indicate a robust positive relationship between the
SVMDI measure and economic growth. This result remains stable when chang-
ing the estimation technique to some of the recently applied strategies found
in the literature. In particular, accounting for waves of democratization via
instrumental variable regressions using regional and cultural democratization
trends as external instruments strongly supports the baseline outcomes.
We also provide an extensive comparative analysis of the results obtained by
SVMDI and alternative democracy indicators. Due to the disability of hitherto
existing democracy indicators to react with sufficient sensitivity to political
developments, the SVMDI is the only indicators that suggests a positive effect
on growth in models that rely on the within variation of countries. This
implies that even small steps in the transition process towards democracy are
important to increases in living standards. However, when using the system
GMM framework of our baseline estimations, the positive association between
democracy and growth emerges as a clear empirical pattern, even relying on
rough measures of democratization.
Finally, we investigate the transmission channels through which democracy
triggers income increases. We observe that democracy exerts its influence
via better education, higher investment shares, and lower fertility rates. In
contrast, we find no evidence for a redistribution-enhancing effect, which may
explain why we do not detect nonlinear effects of democracy in comprehensive
model specifications.
The paper proceeds as follows. Section 2 discusses the ambiguity in the effect of
democracy on growth in recent studies. Section 3 critically analyzes the most
commonly used traditional democracy indicators. In Section 4, we introduce
the ideas behind machine learning and the SVMDI algorithm. This Section
further provides an overview of the democracy level and its historical trends
in the world and compares the SVMDI to alternative indicators. Section 5 is
concerned with the estimation strategy and the presentation of the empirical
results. In Section 6, we investigate the transmission channels of democracy.
We conclude in Section 7.
4

2 The ambiguous effect of democracy in re-
cent studies
The effect of democracy on growth is strongly ambiguous in recent studies,
both theoretically and empirically. On the theoretical side, it has been argued
that democratization may benefit growth, most importantly via better provi-
sion of public goods and education (Saint-Paul and Verdier, 1993, Benabou,
1996, and Lizzeri and Persico, 2004) or by constraining kleptocratic dictators
and preventing political groups from monopolizing lucrative economic opportu-
nities (Acemoglu et al., 2008 and Acemoglu and Robinson, 2012). In addition,
Alesina et al. (1996) emphasize that increased political stability enhances na-
tional and foreign investment. Feng (1997) illustrates that democracy reduces
the probability of regime changes, which indirectly benefits growth. However,
a large body of literature emphasizes the possible negative effects of democra-
tization, mainly as a result of a higher level of redistribution, which is assumed
to reduce growth (see, for instance, Alesina and Rodrik, 1994 and Persson and
Tabellini, 1994). In addition, Olson (1982) argues that sufficient organization
of interest groups can lead to stagnation in democracies.
Empirically, cross-sectional analyses conducted by Barro (1996) and Tavares
and Wacziarg (2001) suggest a (slightly) negative effect of democracy on growth.
The investigation of Barro (1996) also provides evidence for a nonlinear rela-
tionship between the variables, where an increase in political rights at low levels
of democratization benefits growth, but triggers a negative effect if a critical
threshold of democratization is exceeded. Barro (2003) confirms the nonlinear
effect using panel data, where other panel data analyses yield quite ambiguous
results. Rodrik and Wacziarg (2005) find no significant effect of democratic
transition on growth in the long-run, but emphasize short-run benefits and
a decline in economic volatility. Likewise, Apolte (2011) reports ambiguous
effects of democracy on prosperity in transition countries, tentatively arguing
that basic constitutional rights and constraints on the government may be
conducive to growth. Burkhart and Lewis-Beck (1994), Giavazzi and Tabellini
(2005) and Murtin and Wacziarg (2014) also find no robust indication of a pos-
itive relationship running from democracy to growth. Using semi-parametric
methods, Persson and Tabellini (2008) report an average negative effect of de-
parture from democracy on growth. Persson and Tabellini (2009) analyze the
effect of democratic capital, measured by a nation’s historical experience with
5

democracy and by the incidence of democracy in its neighborhood. Whereas
the results imply that democratic capital stimulates growth, Acemoglu et al.
(2014) argue that the formidable challenge in this case is the difficulty of disen-
tangling the impact of unobserved heterogeneity from the effect of democratic
capital. Gerring et al. (2005) apply a similar approach, concluding that de-
mocratization facilitates income increases. Providing a dichotomous index of
democracy, Acemoglu et al. (2014) find that the degree of democracy is pos-
itively correlated with future GDP per capita. The authors also use regional
waves of democratization in an IV approach to account for possible problems
caused by endogeneity. A similar approach is conducted by Madsen et al.
(2015) who use the strength of democracy in linguistically comparable coun-
tries as an external instrument. Both approaches find a positive link between
democracy and the level of incomes.
A different branch of literature is concerned with the reverse effect, i.e. the
causal relationship of economic growth to democracy. This literature goes back
to Lipset (1959), who finds a strong and positive correlation between the level
of income per capita and the likelihood of transition to democracy. Recent sur-
veys, however, provide ambiguous results. While Acemoglu et al. (2008, 2009)
suggest that growth does not contribute to the process of democratization,
Murtin and Wacziarg (2014) endorse Lipset’s modernisation theory.
3 Recent democracy indicators
The traditional way to create a democracy indicator follows three steps: First,
it is required to choose a definition of democracy. Second, a number of in-
struments need to be designed that are able to describe the properties of the
theoretical concept. Finally, it is necessary to find a suitable manner for com-
bining the selected variables to compute the democracy index.
In practical applications, however, a large number of problems arise in each
of these steps. The first issue concerns the nature of democracy. With no
generally accepted definition at hand, the interpretations range from minimal
approaches primarily focusing on the election process (see, e.g., Dahl, 1971)
to concepts that additionally incorporates human rights and social inequal-
ity (see, e.g., Rawls, 1971). As a result of this variety, the indicators deviate
considerably in their underlying instruments. For instance, the popular index
of Vanhanen (2000) only utilizes two dimensions—participation and compet-
6
itiveness in elections—to characterize a democracy. The advantage of such a
minimal concept is that data can be collected for a large number of countries
and years, yielding a democracy indicator that covers a broad sample of obser-
vations. However, researchers employing democracy data need to acknowledge
the cost-benefit trade-off and must ensure that any substantial analytical con-
clusion drawn in their investigation is consistent with the underlying data con-
cept. In case of the Vanhanen-index, the allure of large data coverage comes
at a high cost. First, instrumentation of participation and competition via
(respectively) voter turnout and the percentage of votes going to the largest
party constitute, at best, poor measures of the corresponding attribute (for a
detailed discussion, see Munck and Verkuilen, 2002). Second, the aggregate
index is obtained by simply multiplying the two attributes, where Vanhanen
(2000) does not offer any theoretical justification for the arbitrary assumption
that equal weight ought to be assigned to the attributes.
A similar minimal concept is used in the index of Boix et al. (2013) that
defines a country-year as democratic if it meets three conditions in terms of
contestation and participation.2 The obvious drawback of this approach, one
inherent to each dichotomous indicator of democracy d{0,1}, is the lack of detail.
In particular, the implicit assumption in empirical cross-country analyses is
that each country with d{0,1} = 1 is equally weighted in the computation of
estimates. With regard to the Boix et al. (2013) measure for the year 2010, this
implies classifying Pakistan, Bangladesh, Mali, Liberia, Sierra Leone, Zambia,
and Lesotho as having the same extent of democratization as the United States,
Germany, Canada, and the United Kingdom. In addition, the data sources
underlying the classification of countries change over time (see Boix et al.,
2013), yielding inconsistency in the indicator across periods.
Two measures of democracy have achieved a particularly high degree of pop-
ularity. These are the Polity IV score provided by Marshall et al. (2014) and
the rating compiled by Freedom House (2014). What is common to both ap-
proaches is that they are neither dichotomous, nor continuous.3 For Polity
IV and Freedom House the range of possible values runs from −10 to 10 and
2These conditions are: (1) The executive is elected in popular elections and is responsibleto voters, (2) the legislature or the executive are elected in free and fair elections, and (3)the majority of adult men have the right to vote.
3As Cheibub et al. (2010) emphasizes, due to the discrepancies in their components, bothFreedom House and Polity IV cannot be interpreted as cardinal measures or ordinal rank-ings. In fact, the measures are categorial, whereby the categories are not precise.
7

from 1 to 7, respectively. Although they differ in their purpose, both indices
are quite similar in construction, building on the evaluation of country experts
who classify nations along a set of predefined criteria. In both cases, however,
the aggregation strategy is fraught with problems. The Freedom House (2014)
index aggregates scores for two attributes—political rights and civil liberty—
by simply adding up the values of its respective underlying components. With
regard to each of the two attributes, there is a bewilderingly long list of compo-
nents that are all added with equal weight without any theoretical justification
of this aggregation strategy. In contrast, with regard to the content of the un-
derlying components, equal weighting seems particularly inadequate in this
case.4 The disregard of a reasonable aggregation rule is compounded by a
number of conceptual and measurement problems that are discussed in detail
in Munck and Verkuilen (2002) and Cheibub et al. (2010). Arbitrariness of the
aggregation rule is also a fundamental deficiency of the Policy IV score (for a
detailed discussion, see Treier and Jackman, 2008).
More recently, some scholars have attempted to achieve more reliable measures
by synthesizing existing democracy indicators. For instance, Acemoglu et al.
(2014) propose an approach that includes four established indices to obtain a
dichotomous indicator. According to the applied heuristic, a country-year is
classified as democratic (d{0,1} = 1) if the rating of Freedom House (2014) is
free or partly free and the Polity IV score provided by Marshall et al. (2014)
is greater than zero. To address the issue that for certain observations only
one of the underlying indicators is available, Acemoglu et al. (2014) use two
additional indices (Boix et al., 2013 and Cheibub et al., 2010) to classify the
country-years in question.5 As in the case of the Boix et al. (2013) measure,
the main drawback of this method is that it enables only a binary classification
of democracy, which does not allow for a nuanced distinction between different
countries. For instance, when referring to the observation in 2012, the measure
of Acemoglu et al. (2014) implies that the young and fragile Tunisian democ-
racy has the same quality as the established democracies of Canada and the
United States. Employing this measure in cross-country analyses would imply
4For instance, it is likely erroneous to consider the decentralization of power to be as impor-tant for democracy as the actual power exercised by elected representatives (Munck andVerkuilen, 2002).
5As the Polity IV index only evaluates countries with at least 500,000 inhabitants, suchconflicts particularly arise when considering mini-states. In addition, the data of FreedomHouse (2014) only reaches back to 1973, while the measure of Acemoglu et al. (2014)includes the period between 1960 and 2010.
8

assigning Tunisia and Canada the same value, which impedes sound interpre-
tation of statistical estimations intended to evaluate the effect of democracy.
Furthermore, a dichotomous indicator contradicts the broad consensus that
cultivation of a democracy is a process which occurs over a longer period of
time. Treating each country-year as equally (non)democratic neglects infor-
mation on the process of democratization and results in a severe upwards bias
in empirical estimations (Doucouliagos and Ulubasoglu, 2008).
Pemstein et al. (2010) propose another, more technical method to combine
established indices. The basic idea underlying this concept is to synthesize
ten available democracy indicators via a Bayesian latent variable approach to
obtain the Unified Democracy Score (UDS). A formidable challenge presented
by the inclusion of such a large number of indicators is that of dealing with the
fact that the indicators differ substantially in the number of evaluated countries
and periods. For instance, the Polity IV score is available continuously for
the time-period from 1945 to present, while other indices are available only
for very few periods. Nevertheless, the approach of Pemstein et al. (2010)
includes all available information for each country-year, whereby the number
of included secondary indicators varies from observation to observation. This,
however, yields severe inconsistency in the UDS over time.6 In fact, a large
number of the included national series are quite constant over time, only to
be interrupted by a peak occurring almost every five years when analyzing the
time period between 1950 and 1980. This peak is due to the index of Bollen
(2001), which is only included in the UDS in the years 1950, 1955, 1960, 1965,
and 1980.7 A very similar bias that affects the UDS of a considerable number
of countries occurs in the early 1970s, the time period when the Freedom House
(2014) ratings were initially published. Finally, Gugiu and Centellas (2013)
emphasize that the UDS can hardly discern between countries that are not on
opposite ends of the democracy spectrum, as the reported confidence intervals
overlap.
The drawbacks discussed above may stand exemplarily for the majority of
the existing democracy indicators. There is an extensive literature discussing
the advantages and disadvantages of the democracy indicators at hand (e.g.
6Although for some country years the UDS was produced by drawing on information fromten democracy indicators, the majority of observations rely on an average of six underlyingindicators which deviate in their composition for different country-year. This restrictscomparison of UDS scores across countries and over time.
7See the online appendix of the paper for a graphical illustration of this effect.
9

Cheibub et al., 2010, Gugiu and Centellas, 2013, Munck and Verkuilen, 2002),
in which the consensus has been reached that existing indices suffer from a
plurality of conceptualization issues. Points of criticism include the low level
of detail, the utilization of unfounded scaling, the disproportionate influence
of expert knowledge, subjectivity and arbitrariness in the conceptualization,
the selection of the instruments, and the theoretical concept of democracy.
Above all, however, the main concern is the fairly low level of sophistication
with regard to the aggregation process and the way in which the underlying
components are weighted.
4 Measuring democracy using Support Vector
Machines
4.1 Machine learning and Support Vector Machines
The field of machine learning studies algorithms that operate on the basis of
a model drawn from example inputs that is then used to make data-driven
predictions or decisions (see, e.g., Bishop, 2006). The enormous advantage
gained through application of such methods is that of providing computers
with the ability to learn without being explicitly programmed (Samuels, 1959).
Largely developed at AT&T Bell Laboratories, the Support Vector Machines
(SVM) algorithm as a subfield of machine learning was designed to have a
firm orientation towards real-work applications. Hence, application of SVM
has achieved very promising results in various branches of sciences. Practical
applications include categorization of cancer cells (Guyon et al., 2002), classifi-
cation of hyperspectral data in geophysics (Gualtieri, 2009) and identification
of biomarkers of neurological and psychiatric disease (Orru et al., 2012). In
addition, the algorithm was used to categorize texts (Joachims, 2002) and to
analyze hand written characters (Cortes and Vapnik, 1995).8
Research on SVM was heavily influenced by introduction of the Generalized
Portrait algorithm in the mid-1960s (see Vapnik and Lerner, 1963 and Vapnik
and Chervonenkis, 1964); however, probably the most influential milestone was
8Only little effort has thus far been made to apply the SVM algorithm in the field ofeconomics, where up until now its applications has been restricted to financial topics andstock markets. For instance, Kim (2003) and Tay and Cao (2001) use SVMs for financialtime-series forecasting and Shin et al. (2005) apply the method in a bankruptcy predictionmodel.
10

putting the problem of “learning” into the context of an optimization problem,
thereby enabling access to the large body of already available knowledge on
mathematical optimization.
The problem to be solved by the SVMs classification tool can be described as
follows: Given a certain data set F = {(X1, y1); ...; (Xn, yn)}, where Xi ∈ Rm
and yi ∈ {−1,+1}, we want to find a function Ψ: Rm → R with the property
Ψ(Xi) = yi ∀ i = 1, ..., n. (1)
The general idea of the SVM algorithm is to find a hyperplane that separates
the observations according to their labels yi. However, while the optimal hy-
perplane algorithm introduced by Vapnik and Lerner (1963) was designed for
the linear case, it is often not sufficient for computation of Ψ(Xi) to rely on
the initial space of the vectors Xi. For this reason, Boser et al. (1992) sug-
gest using a higher dimensional space H instead—called feature space—where
shifting of the data is accomplished by a nonlinear map Φ(·) : X → H, which
is chosen a priori.
This procedure, however, gives rise to the question of how to treat the high-
dimensional space, since an appropriate map Φ(·) is typically unknown. In
addition, this approach can easily become computationally infeasible with re-
spect to polynomial features of higher order or higher dimensionalilty. To
overcome this problem, Boser et al. (1992) propose a method that has become
known as the kernel trick, largely building on the idea initially introduced
by Aizerman et al. (1964). This approach circumvents direct construction
of the hyperplane based on the data in H and relies on the dot products of
the support vectors (Vapnik, 1998). This method is feasible if there exists
an admissible SV kernel function k(X,Xi) that satisfies a certain number of
conditions.9 In our application, we use the Gaussian radial basis function as a
kernel, which results in the corresponding feature space H becoming a Hilbert
space of infinite dimension.
In doing so, the optimal classification function can be calculated by
Ψ(X,α) = sign
(∑i∈S
yi αi k(X,Xi) + b
), (2)
9See, in particular, the Theorem of Mercer (1909) and the Theorems of Schoenberg (1942)and Burges (1999).
11

where b is the intercept of the dividing hyperplane, S the set of support vectors,
and αi is computed by solving the optimization problem (Smola and Scholkopf,
2004)
maxα
n∑i=1
αi −1
2
n∑i,j=1
αi αj yi yj k(Xi, Xj)
s.t.n∑i=1
αi yi = 0 and αi ∈ [0, C].
Sample data for which it holds that the Lagrange multipliers α are nonzero—
i.e. αi 6= 0—are called Support Vectors. As these observations influence the
shape of the dividing hyperplane, the algorithm takes its name from this subset
of data.
4.2 The SVMDI algorithm
The low degree of sophistication with respect to the aggregation of the under-
lying attributes is undoubtedly the main methodological weak-point of existing
democracy indicators. By utilizing Support Vector Machines, we transfer the
problem of aggregation into an optimization context, thereby circumventing
arbitrary assumptions regarding the aggregation rule. Our numerical algo-
rithm consists of six stages and yields a continuous measurement of democ-
racy, which we refer to as the Support Vector Machines Democracy Indicator
(SVMDI). Intuitively, our approach picks up the idea of Acemoglu et al. (2014)
and conducts a rough binary classification based on an established democracy
indicator to obtain the desired set of observations on which the SV algorithm
is built. However, we only label a small selection of country-years that can be
unambiguously classified as (non)democratic. The large part consisting of the
remaining observations is classified by the Support Vector algorithm, which
recognizes patterns in the initially labeled observations based on a number of
recent democracy indicators consolidated in Xi.
To give a more detailed description of our algorithm, the first step consists
of the selection of eight established variables that characterize the different
aspects of a democratic state. We carefully select these determinants in order
to cover a broad definition of democracy without the threat of redundancy, the
latter being a point of criticism often brought forward with regard to the Polity
IV index (Munck and Verkuilen, 2002). Our definition of democracy is based
12

on a “liberal” concept of democracy in the sense of Rawls (1971) which not
only builds on the election process, but also takes into account other facets of
liberty and equality, such as human rights and independence of justice. Thus,
the secondary data includes the ratings of civil liberty, political rights, and
freedom of the press as published by Freedom House (2014), the rates of elec-
toral participation and competition similar to those used by Vanhanen (2000)
and the PTS scale of political terror (Gibney et al., 2013).10 In addition, we
incorporate two series built on data that we obtain from the CIRI dataset
provided by Cingranelli et al. (2014). The first is an index reflecting indepen-
dence of the judiciary (denoted by INJUD in the CIRI dataset), the second is
the mean value of the five human rights scores provided by the CIRI dataset.
These scores include freedom of assembly and association, freedom of religion,
and freedom of speech and press as well as freedom of domestic and foreign
movement.
In the second step, we select a set of country-years L ⊂ F that can unam-
biguously be categorized as democratic (d{0,1} = 1) and autocratic (d{0,1} = 0),
respectively. This selection lays the foundation for the SV algorithm. For the
categorization of the labeled observations we follow Acemoglu et al. (2014)
by using the Polity IV score as label criterion. A country-year is labeled as
democratic (d{0,1} = 1) only if the Polity IV index assumes its highest possible
value of 10. At the end of the spectrum, we classify countries as autocratic
(d{0,1} = 0) if the Polity IV indicator is −7 or below. However, it is not guar-
anteed a priori that our rough criteria for labeling are valid with regard to
our input variables. To test validity of the selection, we pick out ψran = 200
elements of L with the help of a random generator and use these observations
to obtain a nonlinear classification function Ψ(·) in accordance with the SV
classification tool introduced in Section 4.1. We use Ψ(·) to classify all ele-
ments of L and compare the initial label with the value predicted by Ψ(·).In order to eliminate the possibility of a sample selection bias, we repeat this
10To circumvent some of the drawbacks inherent in the Vanhanen (2000) measurement,we adjust the data with the help of further secondary data sets. These databases in-clude World Bank (2014a), Vanhanen (2014), Carr (2014), IPU (2014), IDEA (2014), andAfrican Election Database (2014). We also forgo utilization of the cut-off point regardingthe competition component, which is arbitrarily set to 70 percent by the index of Van-hanen (2000). In addition, we refrain from modeling the participation rate in a particularyear as the number of votes cast in the last election in relation to the population size inthat election year. Instead, the number of inhabitants during the respective monitoringyear is used for construction of the ratio, thereby sanctioning countries in which electionsonly occur very intermittently.
13

procedure 100 times.
As an additional robustness test, we evaluate the sensitivity of our results by
utilizing different values of ψran as well as different kernels.11 As the labels are
compatible with respect to each robustness check, we are convinced that our
selected criteria for labeling are valid.12
In the third step, a random generator selects td{0,1}=1 = 50 and td{0,1}=0 = 50
elements of L and consolidates them into the set T . The algorithm proceeds
(step 4) by conducting a Support Vector regression based on the observations
in T , yielding a nonlinear function GT (·).13 For computation of GT (·), we
use the Gaussian Radial Basis Function (RBF) kernel, which has provided the
most promising results in our robustness check.14 In the fifth step, we use
GT (·) to classify all country-years included in F . Finally, we compute ζ =
2, 000 iterations of the process from step 3 to 5. The Support Vector Machines
Democracy Index (SVMDI) is thus the average value over the 2,000 iterations
for each country-year, yielding a continuous measurement of democracy that
ranges from 0 to 1.
Due to availability of the underlying data, the SVMDI is computable for 188
countries in the period from 1981 to 2011. To account for a potential bias due to
inexact quantification and omitted variables, we compute confidence intervals
for our SVMDI point estimates. The lower (upper) bound of these intervals
corresponds with the 5th (95th) percentile of the simulated distribution of
the point estimate that is computed based on the 2,000 iterations for each
country-year. The SVMDI scores and the associated confidence intervals can
be accessed in the online appendix of this article.
11While we prefer the Gaussian RBF kernel that is often used in machine learning, we alsoapply different Polynomial kernels with degrees ≤ 4.
12To evaluate if our consistency check is able to detect inappropriate criteria, we also mis-labeled a number of observations. For instance, we assigned all observations of China—which were originally labeled as autocratic—a democratic label. As the series on whichthe classification is built implies labeling all Chinese country-years as autocratic, the SVMclassification tool strongly rejects our (wrong) choice. As a result, we can conclude that theapplied consistency test is able to detect misclassification if the share of misspecificationsis in the minority.
13We provide a brief overview of the application of Support Vectors as a regression tool inthe online appendix. For a more detailed description see Smola and Scholkopf (2004).
14In addition, Gaussian RBF is most commonly applied in the field of machine learning.
14

4.3 Democracy in the world
We now turn to a detailed illustration of the democratic tendencies in the world
implied by our indicator. Figure (1) maps the SVMDI data in the post-2010
period. This yields a very heterogeneous picture: while countries in Europe,
Oceania, North America, and—to a large extent—in South America possess
high SVMDI scores, a substantial part of the nations in Africa and Asia are
considerably less democratic.
[0,.051](.051,.258](.258,.628](.628,.965](.965,1]No data
Figure 1 Democracy in the world (SVMDI), post-2010 period. Classes refer to the quintilesof the distribution of the SVMDI indicator.
An interesting pattern revealed by Figure (1) is that the degree of democrati-
zation shows clear tendencies towards regional concentration. If a country is
(non-)democratic, we observe a high probability that the same applies to its
neighboring country. There are three remarkable exceptions to that general
rule: landlocked by countries with very low SVMDI scores, Mongolia (SVMDI:
0.8068), Ghana (0.9302), and—to a lesser extent—Benin (0.6413) succeeded
in establishing democratic structures. Overall, the figure suggests a strong
polarization of the extent of democratization.
This polarization becomes particularly apparent when we consider the distri-
bution of the SVMDI measure, which is illustrated in Figure (2). The data
suggests a bimodal distribution, where the first mode is located at a very low
level of democracy, and the second mode lies at a substantially higher degree
of democracy. This pattern is typical when examining the degree of democ-
racy across countries and occurs in a similar manner when analyzing alternate
measures. The reason is that there exist a substantial number of countries
with an SVMDI index close to zero. These countries include nations where
civil wars are prevalent—e.g. Syria (0.0337), Afghanistan (0.0934), and Sudan
15

0.5
11.5
Density
0 .2 .4 .6 .8 1SVMDI
1980 2010
Figure 2 Democracy in the World, SVMDI data, kernel density estimates 1980—2010.Kernel is Epanechnikov.
(0.0601)—and countries with absolute monarchies, such as Swaziland (0.0069),
Qatar (0.0305), and Brunei (0.0259). On the other hand, there are numerous
countries where strong democratic institutions have been established, particu-
larly in Europe, North America, Oceania and in some parts of Latin America.
Figure (2) also demonstrates that democratization emerges as a clear empirical
pattern in the SVMDI data. Whereas the relative fraction of non-democratic
nations was extraordinarily high in the 1980-1984 period, the data approxi-
mates a more uniform distribution in the post-2010 period, where we observe
a substantially higher number of democratic countries and a lower number of
nations with a poor SVMDI score.
Figure (3) exemplarily plots the SVMDI scores and the confidence intervals
for Serbia, South Korea, Venezuela, and Argentina over the entire period be-
tween 1981 and 2011.15 The figure highlights the considerable progress in
democratization during the 1980s and the early 1990s, which has later become
known as “Democracy’s Third Wave” (see, for instance, Huntington, 1991,
2012). Beginning in Latin America in the early 1980s, the Third Wave washed
over to Asia Pacific countries and reached its crest in Eastern Europe after
the collapse of the Soviet Union. This development is clearly visible in the
SVMDI data. Particularly noteworthy is the substantial progress achieved in
South Korea and Argentina, both of which were classified as highly autocratic
15Note that the Serbian SVMDI is composed of the scores of SFR Yugoslavia (1981-91), FRYugoslavia (92-02), Serbia and Montenegro (03-05), and Serbia (06-11).
16

0.2
.4.6
.81
1980 1990 2000 2010
Year
Confidence interval Serbia
0.2
.4.6
.81
1980 1990 2000 2010
Year
Confidence interval South Korea
0.2
.4.6
.81
1980 1990 2000 2010
Year
Confidence interval Venezuela
0.2
.4.6
.81
1980 1990 2000 2010
Year
Confidence interval Argentina
Figure 3 The path of democratization. SVMDI scores and confidence intervals of Serbia,South Korea, Venezuela and Argentina, whole period (1981-2011).
in the early 1980s. Similar movements towards democracy can be observed
in Eastern Europe after the fall of the Iron Curtain in 1989. The Serbian
path to democracy, however, was more tortuous than those of its Baltic and
East-Central European neighbors. Only following the resolution of the armed
conflicts in Bosnia and Herzegovina (1992-1995) and Kosovo (1998-99) was an
increase in political rights and democratization initiated (see McFaul, 2002).
Yet democracy has not yet been cultivated in full, which is exactly reflected
in the SVMDI of the country (Greenberg, 2014).
A further issue that has gained increasing attention is the fear of a potential
“reverse” wave occurring in Latin America due to the importance of autocracy
and military in the region’s political culture, as well as the strong institutional
position of its armed forces. Such a movement has already been ushered in
Venezuela and Paraguay (see Zagorski, 2003). As Venezuela was part of the
Third Wave in the early 1980s, the SVMDI implies that it succeeded in estab-
lishing democratic structures at that time. However, the relapse was not long
in coming. The data suggest a clear tendency towards autocracy, which was
initiated in the early 1990s and constantly promoted during the presidency of
17

Hugo Chavez (Levitsky and Murillo, 2008).
Similar tendencies emerged in Argentina during the presidency of Carlos Menem
(1989-1999). While Argentina’s democracy in the mid 1980s was more sta-
ble than previous regimes, it failed to establish enduring democratic institu-
tions (Levitsky and Murillo, 2008). In fact, President Menem increasingly
limited both the power of the congress and the independence of the Supreme
Court (Larkins, 1998), resulting in Argentina’s movement towards a delegetive
democracy shaped by weak control mechanisms between different state agen-
cies (O’Donell, 1994). With the presidential dominance and the centralization
of power still holding on (Elias, 2015, Levitsky and Murillo, 2008), Argentina’s
political and economic institutions remain strikingly weak under the presidency
of Nestor Kirchner (2003-2007) and his wife Christina Fernandez de Kirchner
(2007-present).
4.4 Relation to existing democracy indicators
One huge advantage of the SVMDI algorithm is that aggregation of the un-
derlying attributes is much less arbitrary, as it relies on much weaker assump-
tions. In particular, unification of attributes is conducted via a nonlinear
optimization problem rather than via crude aggregation rules or the implicit
assumption of equal weights. In addition, combining information from existing
democracy indicators compensates for weaknesses in conceptualization as well
as for measurement errors in the underlying secondary data. A direct result of
these methodical improvements is a substantial increase in the level of detail
in comparison to established approaches.
To demonstrate the superiority of the SVMDI algorithm, Figure (4) plots the
democracy levels of Jamaica, Nicaragua, Venezuela, and Mongolia as gauged
by SVMDI and several other indicators. Note that we have normalized all
indices to values between 0 and 1 in order to ensure sufficient comparability
of the measurements.16
First, consider the case of Jamaica. What is striking in terms of the classifi-
cation of the Jamaican democracy is the huge divergence between the trends
observed in the early 1980s by the SVMDI and those identified by alternative
measures. While the Polity scores and the Freedom House (2014) ratings do not
16It is crucial to emphasize that the superiority of the SVMDI score in describing recentpolitical developments is not limited to the illustrated countries, but can be observed withrespect to the overwhelming majority of country-years included in the data.
18

change notably, the SVMDI score experiences a sharp decline in the year 1983.
Given the political situation in that year, the result suggested by the SVMDI
algorithm is much more plausible. In 1983, the “People’s National Party”—
until that time the largest opposition group in the parliament—boycotted the
election, which resulted in the incumbent “Jamaica Labor Party” winning all
seats in the election (Figueros, 1985). In fact, whereas 54 of 60 seats were
completely unopposed, voting took place in six seats due to participation of
minor parties. However, nationwide voter turnout was only 2.7 percent, which
was the lowest value in the history of the country and the only time that it
was below 50 percent (Wust, 2005). From that time until 1989, Jamaica was
a de facto one-party state. Such a situation, however, should factor negatively
into a democracy measure, as political pluralism in parliament is an important
aspect of democracy, even in minimal concepts such as that proposed by Dahl
(1971). Without the control and criticism provided by a parliamentary opposi-
tion, the ruling party is able to exercise power without supervision. In fact, the
rule of Edward Seaga, Prime Minister of Jamaica from 1980 to 1989, became
increasingly authoritarian, which led to widespread public protest during the
election in 1989 (Wust, 2005).
The case of Nicaragua highlights a typical pattern of the Vanhanen (2000) in-
dex, which in the overwhelming majority of observations only changes (slightly)
after elections have taken place. In Nicaragua, elections are held every five
years. While the Vanhanen-index implies an increase in democracy in each
electoral year, it remains unaltered during the periods in between. In par-
ticular, with the exception of a minor decline in 2011, the index provides no
indication for a decrease in the degree of democracy during the entire pe-
riod. Likewise, the Polity score (Marshall et al., 2014) implies a similar period
of flourishing democracy without any indication of an interruption. The di-
chotomous indicator of Acemoglu et al. (2014) changes only once in 1990, the
year when the first competitive election in the country took place (Williams,
1990). Notwithstanding the consensus that Nicaragua’s democracy is far from
being in full bloom (Walker, 2009), the indicator suggests strong democratic
structures in the country. In contrast, the SVMDI displays a continuous loss
of democracy since 2006, the year when Daniel Ortega came into his second
presidency after years as a member of the opposition. Due to the increasingly
autocratic governance of President Ortega—including, for instance, growing
oppression of critical journalists and opposition members, as well controversial
19

.5.6
.7.8
.91
1980 1990 2000 2010Jamaica
SVMDI Freedom House
Polity IV UDS
0.2
.4.6
.81
1980 1990 2000 2010Nicaragua
SVMDI Polity IV
Vanhanen Acemoglu et al. (2014)
0.2
.4.6
.81
1980 1990 2000 2010Venezuela
SVMDI Vanhanen
Boix et al. (2013) Acemoglu et al. (2014)
0.2
.4.6
.81
1980 1990 2000 2010Mongolia
SVMDI Acemoglu et al. (2014)
Polity IV Vanhanen
Figure 4 Democracy in Jamaica, Nicaragua, Venezuela, and Mongolia. SVMDI and tradi-tional democracy indicators, 1980-2011.
constitutional amendments (Anderson and Dodd, 2009, McConnell, 2014)—a
decreasing trend is much more justifiable than a constant or even increasing
level.
The third nation illustrated in Figure (4) is Venezuela. As highlighted in
Figure (3) in the previous section, democratization in Venezuela experienced
a decline during the past decades. This phenomenon is intensely discussed in
the literature as a “reverse wave” of democracy (see, e.g., Huntington, 2012).
However, the breakdown in Venezuelan democracy is captured quite differently
by traditional democracy indicators. Whereas the indices from Boix et al.
(2013) and Acemoglu et al. (2014) attest to a thriving democracy until the
end of the 2000s, the index of Vanhanen (2000) remains at a constant level
of roughly 0.20 over the whole period between 1981 and 2011, indicating no
noteworthy decline in democracy at all. The SVMDI, however, illustrates that
the antidemocratic trend in Venezuela has already begun during the 1990s,
which is much more in line with the existing literature (see, e.g., Zagorski,
2003 and Levitsky and Murillo, 2008).
The last country depicted in Figure (4) is Mongolia. The figure highlights
20
that the SVMDI algorithm is able to detect differences between country-years
that have originally obtained a label in step two, i.e. observations that are
elements of L. Although Mongolia received a label of 1 for the period be-
tween 1999 and 2011, the figure clearly shows that the degree of democracy
has changed considerably over time.17 What is striking about the figure is the
sharp decline in the SVMDI of Mongolia in 2000. In this particular year, the
ex-communist Mongolian People’s Revolutionary Party (MPRP) won 72 of 76
seats, resulting in Mongolia’s shift towards a one-party system (Severinghaus,
2001). Such a development, however, stands in contrast to some established
definitions of democracy that typically require a multiple-party system. In
fact, political competition is a central issue in theoretical and empirical con-
cepts relating to democracy (see, for instance, Dahl, 1971, Huntington, 2012,
Vanhanen, 2000). As the vote in the 2004 Mongolian parliamentary election
was evenly split between the MPRP and the Motherland Democratic Coalition,
Mongolia’s SVMDI experienced a renewed increase. When relying on tradi-
tional indicators—such as Polity IV and the measures of Vanhanen (2000) and
Acemoglu et al. (2014)—no changes in democratization are observable.
In the online appendix, we illustrate the overall relationship between the
SVMDI measure and alternative democracy indicators that are most often
used in recent studies.
5 The empirical effect of democracy on growth
5.1 Estimation strategy
We now turn to the empirical investigation of democracy, measured via the
SVMDI algorithm, and growth. Our analysis uses a standard framework of
empirical growth regressions to estimate the effect of democracy on growth,
utilizing 5-year averages of all variables. Averaging the data is necessary due
to the long-term perspective of growth theory, the need to disentangle short-
term fluctuations and long-term effects, and the occurrence of gaps in the
data concerning some of the covariates. Considering additive linkage of the
17In order to make these slight differences computable, we only use a subset Tζ ⊂ L with|Tζ | � |L| to estimate GT ,ζ(·) in iteration ζ. This procedure enables detection of possibledifferences between country-years that have been classified with d{0,1} = 1 (democratic)in the second step.
21
variables, our basic dynamic panel specification is18
yit = θyit−1 + λhit + βXit + γdit + ηi + ξt + vit (3)
where yit is the log of initial per capita GDP in i at 5-year period t, hit is
human capital endowment, dit is the democracy index, and Xit includes the
covariates of the regression. The selection of the covariates is based on the
standard framework of Barro (2003, 2013), which has been proven to capture
the empirical determinants of economic growth quite accurately in a number of
studies. These variables include the logarithmic value of real per capita GDP
in (t − 1) to account for conditional convergence, denoted by log(GDPpc);
the investment share (INVS); government consumption (GOVC); the inflation
rate (INFL); the degree of openness (OPEN); and the log of the fertility rate,
log(FERT). Human capital enters into the equation using average years of
schooling (SCHOOLY) and log(LIFEEX), the log of life expectancy at birth,
to proxy education and health respectively.19 We do not include measures of
physical capital, as their calculation relies on arbitrary assumptions regarding
depreciation and the initial value. Rather, we follow Barro (2003, 2013) in
assuming that higher levels of log(GDPpc) and hit reflect higher levels of capital
endowment.
Equation (3) also captures country-specific effects ηi and time effects of period
t, denoted by ξt, in order to account for the various institutional aspects of the
countries. The term vit ≡ uit − ξt − ηi denotes the idiosyncratic error of the
model.
A common and widely-used approach to account for both unobserved het-
erogeneity and endogeneity is the estimator proposed by Arellano and Bond
(1991). Define for reasons of lucidity that ∇k ≡ (kit − kit−1) and ∇2k ≡(kit−1 − kit−2), the basic idea of this approach is to adjust (3) to
∇y = θ∇2y + λ∇h+ γ∇d+ β∇X +∇ξ +∇v (4)
18This specification is obtained by following the model structure developed in a number ofrecent empirical investigations where the growth rate is modeled to evolve as yit−yit−1 =(θ − 1)yit−1 + λhit + βXit + γdit + ηi + ξt + vit (see, e.g., Bond et al., 2001, Voitchovsky,2005, and Halter et al., 2014).
19The data used in the regression stems from commonly used data sources in empiricalgrowth research. log(GDPpc), INVS, GOVC, OPEN and INFL are from PWT 8.0 as doc-umented in Feenstra et al. (2013), SCHOOLY is from Barro and Lee (2013), log(LIFEEX)and log(FERT) are from World Bank (2014b).
22

and then use sufficiently lagged values of yit, hit, dit, and Xit as instruments
for the first-differences. However, first differencing Equation (3) removes the
information in the equation in levels. This drawback is particularly severe
with regard to the purpose of this paper, as large parts of the variation in
democracy data stem from the cross section rather than the time-dimension.
This particularly holds for hitherto existing democracy indicators. Blundell
and Bond (1998) and Bond et al. (2001) show that the standard first-difference
GMM estimator can be poorly behaved if time-series are persistent or if the
relative variance of the fixed effects ηi is high. The reason is that lagged levels
in these cases provide only weak instruments for subsequent first-differences,
resulting in a large finite sample bias. In addition, difference GMM magnifies
gaps in unbalanced panels, as it requires at least three consecutive lags for
each of the variables. This requirement results in an asynchronous loss of
observations, because data availability is typically more limited in developing
countries. However, we are particularly interested in observations concerning
developing economies, as these country-years contain information regarding
the growth effect of regime changes in transition economies.
System GMM proposed by Arellano and Bover (1995) and Blundell and Bond
(1998) provides a tool to circumvent the previously described biases, if one is
willing to assume a mild stationary restriction on the initial conditions of the
underlying data generating process.20 In this case, additional orthogonality
conditions for the level equation in (3) can be exploited, using lagged values of
∇k and ∇2k as instruments. By these means, system GMM maintains some
of the cross-sectional information in levels and exploits the information in the
data more efficiently. Satisfying the Arellano and Bover (1995) conditions,
system GMM has been shown to have better finite sample properties (see
Blundell et al., 2000). To detect possible violations of these assumptions, we
conduct Difference-in-Hansen tests for each of the system GMM regressions.21
Let Θ′it ≡ [yit hit dit X′it], the moment conditions in our analysis used for the
regression in first-differences are
E[(vit − vit−1)Θit−s] = 0 for t ≥ 3, 2 ≤ s ≤ 3,
20The assumption on the initial condition is E(ηi∇yi2) = 0, which holds when the processis mean stationary, i.e. yi1 = ηi/(1− θ) + vi with E(vi) = E(viηi) = 0.
21A more detailed description of the estimator in the context of the empirical applicationcan be found in Bond et al. (2001) and Roodman (2009b).
23

and the additional moment conditions for the regression in levels are given by
E[(vit + ηi)(Θit−1 −Θit−2)] = 0 for t ≥ 3.
We restrict the instrument matrix to lag 3. Roodman (2009a) illustrates the
need to introduce such a restriction, as otherwise the problem of “instrument
proliferation” may lead to severe biases. In principle, our specification can be
estimated using one-step or two-step GMM. Whereas one-step GMM estima-
tors use weight matrices independent of estimated parameters, the two-step
variant weights the moment conditions by a consistent estimate of their co-
variance matrix. Bond et al. (2001) show that the two-step estimation is
asymptotically more efficient. Yet it is well known that standard errors of
two-step GMM are severely downward biased in small samples. We therefore
rely on the Windmeijer (2005) finite sample corrected estimate of the variance,
which yields a more accurate inference.
5.2 Baseline results
Panel A of Table 1 reports the results of the baseline regressions. The first col-
umn illustrates the effect of democracy measured by the SVMDI in a restricted
model where the only covariate is the initial income level. The advantage of
examining the effect of democracy in a very reduced specification is that the
estimated parameter captures the full growth effect of democracy, leaving all
possible transmission channels open. In addition, this estimation enables the
investigation of SVMDI in a broad sample of 160 countries. The subsequent
columns examine the effect of the SVMDI when additional controls are in-
troduced; however, limited data availability for the covariates yields a decline
in the number of countries included in the estimation. Panels B and C use
exactly the same specifications as Panel A, but examine the influence of initial
democracy in (t− 1) as well as nonlinear effects of democracy.
The result in Column (1) of Panel A provides clear indication that democ-
racy and income increases are positively and significantly related. The column
rejects the hypothesis of convergence, reflecting the well-known argument in
empirical growth research that convergence can only be detected when holding
constant a number of variables that distinguish the countries (see, for instance,
Barro and Sala-i Martin, 1992). For this reason, the subsequent columns grad-
ually introduce a number of standard controls in empirical growth regressions.
24

Table 1 The effect of SVMDI on growth, dependent variable is real per capita GDP growth.
(1) (2) (3) (4)
Panel A: Baseline regression results
Log(GDPpc) 0.00479 -0.00839** -0.0180*** -0.0197***(0.00492) (0.00342) (0.00349) (0.00309)
SVMDI 0.0264*** 0.0242*** 0.0149** 0.00294(0.00941) (0.00840) (0.00750) (0.00684)
INVS 0.120*** 0.0467 0.0445(0.0346) (0.0310) (0.0323)
SCHOOLY 0.00225 0.00214* 0.000111(0.00199) (0.00123) (0.00129)
Log(LIFEEX) 0.102*** 0.0635***(0.0222) (0.0206)
GOVC -0.0112 -0.0168(0.0304) (0.0291)
INFL -0.00126* -0.00110(0.000651) (0.000680)
OPEN 0.00625* 0.00268(0.00331) (0.00356)
Log(FERT) -0.0333***(0.00643)
Panel B: The effect of initial democratization
SVMDI(t− 1) 0.0223* 0.0293** 0.0193* 0.00974(0.0134) (0.0123) (0.0108) (0.00684)
Panel C: Non-linear effect of democracy
SVMDI 0.121*** 0.0189 0.00944 0.00512(0.0431) (0.0391) (0.0227) (0.0199)
SVMDI SQUARED -0.107** 0.00297 0.00428 -0.000991(0.0446) (0.0421) (0.0235) (0.0197)
SLM p-val 0.0284 1.000 1.000 1.000
Observations 1048 857 775 775Countries 160 129 128 128Hansen p-val 0.0000928 0.0262 0.878 0.991Diff-in-Hansen 0.109 0.691 1.000 1.000AR(1) p-val 0.0416 0.0777 0.116 0.119AR(2) p-val 0.367 0.273 0.335 0.327Instruments 40 78 154 173
Notes: Table reports two-step system GMM estimations. All estimations use period fixed effects andWindmeijer-corrections, robust standard errors in parentheses. The instrument matrix is restricted to lag 3.Test statistics refer to Panel A. Hansen p-val. gives the p-value of Hansen’s J-test, AR(1) p-val. and AR(2)p-val. report the p-values of the AR(1) and AR(2) test. Diff-in-Hansen reports the p-value of the C statistic ofthe difference in the p-values of the restricted and the unrestricted model. The unrestricted model ignores theArellano and Bover (1995) conditions. ∗p < .10, ∗ ∗ p < .05, ∗ ∗ ∗p < .01.
25

The motivation for including additional controls is twofold. First, Hansen’s
p-value points to an omitted variable problem in the reduced regression in
Column (1), which may result in a bias in the estimated parameter. Second,
we aim to investigate the mechanism through which democracy affects incomes
by introducing potential transmission channels of democracy, as suggested by
Tavares and Wacziarg (2001).
When introducing the investment share and the average years of schooling in
Column (2), conditional convergence in the form of a negative relationship
between initial incomes and growth can be observed. What is remarkable
in this estimation is the robustness of the effect of SVMDI, which remains
significantly positive and maintains its magnitude. In Column (3) we incor-
porate life expectancy at birth, government consumption, the inflation rate,
and the openness of countries. The effect of democracy remains positive and
significant, but the marginal effect shrinks slightly. The latter is in line with
the findings of Doucouliagos and Ulubasoglu (2008), who show that inclusion
of these additional covariates reduces the marginal impact of democracy on
growth. Investigating bivariate correlations between SVMDI and the newly
introduced covariates, our data implies that democracies tend to have higher
life expectancies (correlation: 53 percent) and a lower probability of hyperin-
flation (-31 percent). Each of these effects stimulates growth, which is why
the column suggests a lower marginal impact of SVMDI. Finally, when intro-
ducing the fertility rate, the effect of democracy becomes insignificant. As
democracies tend to have substantially lower fertility rates (correlation: -60
percent), the fertility channel appears to be a crucial transmission mechanism
of democracy on growth. In countries where non-democratic structures are
prevalent, the trade-off between the quantity and the education of the children
is often resolved in favor of having more offspring. In light of binding budget
constraints, families may consider this a substitute for missing social security
systems.
The test statistics given in the lower part of Table (1) highlight the high degree
of validity of our results. The AR(2) p-value illustrates that there is no second-
order serial correlation in the residuals. In addition, once additional controls
are introduced in Columns (2)-(4), the p-value of Hansen’s J-test suggests that
an omitted variable bias becomes increasingly unlikely. Finally, the Difference-
in-Hansen statistics highlight validity of the instrument subsets used for the
level-equation, which implies superiority of system GMM over difference GMM.
26

Overall, there is a clear indication of a positive effect of democracy measured
by SVMDI on the growth rate. This effect remains positive and significant in
Panel B, which investigates the impact of the initial democratization level by
inclusion of SVMDI in (t−1). Whereas the marginal effect in the reduced spec-
ification in Column (1) slightly declines from 0.0264 to 0.0223, the influence of
initial democracy tends to be marginally stronger than current democracy in
the subsequent regressions. As in Panel A, the effect of democratization van-
ishes once additional controls are introduced that account for the transmission
channels of democracy, particularly the fertility rate.
Some authors have stressed a non-linear relationship between democracy and
growth, arguing that democracy enhances income increases at low levels of po-
litical freedom but depresses growth once a moderate level has been attained
(see, e.g., Barro, 1996). In dictatorships, an increase in political rights may
be growth enhancing due to the advantages arising from limitations on gov-
ernmental power, increases in contractual freedom, and reductions in foreign
trade barriers. At high levels of democracy, however, a further increase may
eventually be an impediment to growth due to increases in redistributive ef-
forts. Panel C deals with the examination of a possible nonlinear effect of
democracy by inclusion of the squared SVMDI score. Whereas Column (1)
provides indication of a parabolic influence of democracy on growth, the effect
vanishes when additional covariates are incorporated. The Sasabuchi-Lind-
Mehlum (SLM) test of Lind and Mehlum (2010) also indicates the presence of
an inverted-U relationship in the reduced model, but does not detect a similar
pattern in the more comprehensive specifications.
5.3 Sensitivity analysis I: Different estimation techniques
Subsequently, we explore whether our results are sensitive to the specified
estimation strategy. Table 2 provides the results of two adjustments of Table
(1). The first adjustment is first-difference GMM as proposed by Arellano and
Bond (1991), and the second method uses Within-Group estimations. Both
methods have been applied in recent studies concerning the effect of democracy
on income increases (e.g. in Acemoglu et al., 2014, Rodrik and Wacziarg, 2005
and Gerring et al., 2005). The table reports three variants of each technique.
The first specification is the reduced model of Column (1) of Table 1, while the
second and third columns refer to the more comprehensive models reported in
27

Columns (3) and (4) of Table 1. The columns are labeled in accordance with
the variant of the baseline table that is used for specification.
Overall, the effect of democratization is remarkably stable across the regres-
sions conducted in Table 2, strongly resembling the findings of the baseline es-
timations in significance and magnitude. One exception is the effect of SVMDI
in the reduced model reported in Column (1), where Hansen’s J-test again sug-
gests an omitted variable problem. In addition, the Difference-in-Hansen test
reported in Table 1 indicates that the additional moment conditions used in
the system GMM estimation are valid, suggesting substantial efficiency losses
when utilizing difference GMM. Note also that the number of observations de-
clines from 1048 to 888, as difference GMM requires observations for at least
three consecutive periods. This technique draws on variations over time and
eliminates the information in the equation in levels. Thus, when conducting
difference GMM estimations, we expect the main effect of democracy to ap-
pear via the transition of non-democracies to democracies. Differencing the
data, however, mainly yields losses of precisely the observations that we are
interested in, i.e. observations from developing economies during the transi-
tion process. When introducing additional controls in Columns (3) and (4),
the positive and significant effect of SVMDI found in the baseline model reap-
pears. This is a strong indication that democracy exerts its influence via a
number of transmission channels, which have opposing effects on growth. If
we do not control for the effects of these variables, the estimated parameter of
SVMDI captures the contrary effects of the transmission variables and becomes
insignificant.
The Within-Group (WG) estimations also strongly support the results of the
baseline table. This technique resembles the estimation strategy conducted
by Gerring et al. (2005), Rodrik and Wacziarg (2005) and Papaioannou and
Siourounis (2008). However, one concern is that introducing a lagged depen-
dent variable in a WG model most likely results in a Nickell (1981) bias. In
addition, WG does not account for possible problems caused by endogeneity,
which we typically expect in growth regressions.
28

Table 2 The effect of SVMDI on growth, different estimation techniques. Dependent vari-able is real per capita GDP growth.
First-difference GMM Within-Group(Arellano-Bond) (WG)
(1) (3) (4) (1) (3) (4)
Log(GDPpc) -0.139*** -0.0781*** -0.0756*** -0.0329*** -0.0589*** -0.0579***(0.0341) (0.0131) (0.0136) (0.00636) (0.00873) (0.00849)
SVMDI -0.00214 0.0325** 0.0258* 0.0279*** 0.0134** 0.00881(0.0407) (0.0134) (0.0133) (0.00584) (0.00616) (0.00600)
INVS 0.0816** 0.0784** 0.0808** 0.0709**(0.0360) (0.0358) (0.0325) (0.0322)
SCHOOLY 0.00292 -0.00343 0.00813*** 0.00300*(0.00468) (0.00595) (0.00170) (0.00176)
Log(LIFEEX) 0.0218 0.00948 0.133*** 0.121***(0.0475) (0.0432) (0.0245) (0.0231)
GOVC 0.0269 0.0290 -0.00852 -0.00502(0.0320) (0.0328) (0.0213) (0.0212)
INFL -0.000960 -0.000678 -0.000731 -0.000721(0.000636) (0.000489) (0.000549) (0.000543)
OPEN 0.00288 0.00346 -0.00107 -0.000940(0.00460) (0.00569) (0.00400) (0.00387)
Log(FERT) -0.0278 -0.0405***(0.0194) (0.00866)
Observations 888 647 647 1048 775 775Countries 160 128 128 160 128 128Hansen p-val 0.00841 0.211 0.263AR(1) p-val 0.0582 0.113 0.115AR(2) p-val 0.0590 0.221 0.230Instruments 27 99 111
Notes: Table reports first-difference GMM (Arellano-Bond) and Within-Group (WG) estimations. Robust standard errorsin parentheses. WG uses cluster robust standard errors. The instrument matrix in Columns (1)-(3) is restricted to lag 3.Hansen p-val. gives the p-value of Hansen’s J-test, AR(1) p-val. and AR(2) p-val. report the p-values of the AR(1) andAR(2) test. ∗p < .10, ∗ ∗ p < .05, ∗ ∗ ∗p < .01.
29

5.4 Sensitivity analysis II: Regional and cultural waves
of democratization
We now turn to another branch of sensitivity analyses, conducting IV regres-
sions with SVMDI instrumented by regional and cultural democratization.
This technique, used in some more recent studies of the topic (see, e.g., Ace-
moglu et al., 2014 and Madsen et al., 2015), is motivated by the empirical ob-
servation that democratization often occurs in waves. Section 4.3 demonstrates
that the SVMDI measure implies a multinational trend in democratization in
the world during the 1980s and the early 1990s, which Huntington (1991, 2012)
refers to as “Democracy’s Third Wave”. In addition, the renunciation of au-
thoritarian regimes during the Arab Spring provides more recent experience
with regional entanglements in the process of democratization. Spreading from
one country to another, waves of democratization may be a satisfactory de-
terminant of exogenous variation in democracy (Persson and Tabellini, 2009).
We follow Acemoglu et al. (2014) in assuming that, conditional on covariates,
democratization in neighboring countries should be uncorrelated with national
GDP.22 This allows for creation of external instruments of democracy which
capture the effect of democratization waves.
We use two different approaches to form our external instruments. The first
approach refers to Acemoglu et al. (2014), instrumenting country-year {i, t}with jack-knifed average SVMDI of region r (denoted by Zr
it) in which i is
located. In order to satisfy the exclusion restriction, we leave out the own
country in the calculation of Zrit. The crucial challenge in computing Zr
it is
the accurate definition of the decisive regions. Whereas a narrower concept is
more likely to include the countries that directly influence national demand for
democracy, it poses the risk of leaving out information necessary to accurately
instrument national SVMDI scores. In addition, arbitrary classification of
regions may cause a distortion of the results. For this reason, Table 3 uses two
different definitions of regions. The first (wide) definition refers to the country
classification of the World Bank, the second (narrower) definition splits each
continent into four disjoint regions, as illustrated in appendix A2.
The second approach weights the SVMDI of the countries by their cultural
distance from i. We refer to this instrument as Zrit. While this procedure
22Whereas we could imagine plausible reasons why this assumption may be violated—e.g.due to a decline in regional trade or capital flows—Acemoglu et al. (2014) provide evidencethat controlling for such effects has little effect on the estimation results.
30

builds on the method proposed by Madsen et al. (2015), we use the cultural
dimensions from Hofstede (2001) to capture cultural diversities rather than
linguistic differences. The advantage of Zrit is that the exclusion restriction may
be more likely to be fulfilled, as culturally close countries are not necessarily in
the immediate geographic vicinity. The creation of the instruments is described
in detail in appendix A1.
The estimation strategy used in Table 3 follows Acemoglu et al. (2014) and
Madsen et al. (2015), using 2SLS with cluster-robust standard errors including
country-fixed and period-fixed effects.23
Panel A of Table 3 reports the 2SLS results, with first-stage outcomes presented
in Panel B. The results from this exercise strongly support the positive effect
of democracy found in Table (1). However, when instrumenting SVMDI with
regional democratization waves, the reduced models imply an increase in the
marginal effect of SVMDI from 0.0264 in the baseline specification to 0.293 in
Table (3). The results also seem to be relatively unaffected by the classification
of regions r, as both the categorization of the World Bank and the narrower
concept yield outcomes strongly comparable in significance and magnitude.
This also holds if we instrument the SVMDI variable by culturally-weighted
waves of democracy. The marginal effect in the reduced model strongly re-
sembles the effect detected in Column (1). As in the baseline estimations,
the SVMDI ceases to be significant once the fertility rate is introduced in the
model.24
Panel B highlights a strong effect of regional democratization waves in t − 1
on national SVMDI scores, suggesting that Zrit−1 is a valid instrument for
SVMDI.25 The first-stage regressions also highlight that Zrit−1 is less valid than
Zrit−1. In the reduced model, cultural waves of democratization are signifi-
cantly related to national democracy; however, the marginal effect is smaller
compared to regional democratization waves. In the comprehensive model
23Whereas the authors in both studies use real per capita GDP as the dependent variable intheir IV regression, the dependent variable in Table 3 again is the growth rate of real GDPper capita to ensure comparability with the baseline results. Note that exact replicationwith inclusion of SVMDI as democracy variable yields quite similar results. Note alsothat the results of a more direct comparison to the baseline table achieved by inclusion ofour external instruments in the System GMM estimations strongly resemble the baselinefindings.
24Similar to the baseline results reported in Table (1), SVMDI significantly contributes toincome increases in each specification other than model (4).
25We instrument SVMDI by only one lag of Zrit. In accordance with Acemoglu et al. (2014),we find only slightly differing effects when using more lags of Zrit as instruments.
31

specification in the last column, we cannot find any contribution of cultural
democracy waves on the SVMDI in country i.
Comparing the outcomes of Table (3) to a similar analysis conducted by Ace-
moglu et al. (2014), we find that utilization of SVMDI is superior to application
of a rough dichotomous measure, as it yields much more significant results.26
The reason for this is the substantial increase in the level of detail achieved by
the Support Vector classification of the underlying data. Even when controlling
for regional democratization waves, the strong heterogeneity in the subset of
democratic (autocratic) countries—which necessarily occurs when conducting
a binary classification—results in a loss of information that causes a distortion
of the estimated results. Note also that the IV approach is likely to suffer from
a Nickell bias unless the (bold) assumption holds that E[Zrit−1εit] = 0 and εit
is serially uncorrelated.
5.5 The effect of alternative democracy indicators on
growth
Whereas the previous results provide strong evidence for a positive effect of
democracy on growth when applying the SVMDI measure, we are interested
in determining if these results are superior compared to estimations which
use alternative indices of democracy. Whenever the available indices lack ob-
servations for recent periods (e.g. Vanhanen and Lindell, 2012) or have not
yet been made available (e.g. Acemoglu et al., 2014), we calculate missing
values according to the algorithms reported in the original documentations.
We conduct two different estimation techniques, difference GMM and system
GMM.
Difference GMM has been used in a number of recent studies (e.g. in Ger-
ring et al., 2005 and Acemoglu et al., 2014). The general idea of this tech-
nique, shown in Equation (4), is to eliminate unobserved heterogeneity by
first-differencing the specified model, i.e. first-differencing Equation (3). How-
ever, this transformation removes the information in the equation in levels, so
that the estimation relies solely on the within-country information. In the con-
text of the relationship between democracy and growth, this means that the
estimated parameter essentially captures the effect of democratization within
26The same increase in significance occurs if we directly replicate the utilized specifications,using Log(GDPpc) as dependent variable.
32

Table 3 The effect of SVMDI on growth, IV estimations. Dependent variable is real percapita GDP growth.
Regional Democracy Regional Democracy Cultural Democracy(World Bank) (Narrower definition) (Culturally-weighted)
(1) (4) (1) (4) (1) (4)
Panel A: 2SLS regression results
SVMDI 0.293*** 0.224** 0.213*** 0.119*** 0.257*** 0.0518(0.0747) (0.109) (0.0493) (0.0429) (0.0787) (0.0496)
Log(GDPpc) -0.0573*** -0.0684*** -0.0514*** -0.0683*** -0.0416*** -0.0539***(0.0124) (0.0143) (0.00939) (0.0121) (0.0146) (0.00917)
INVS 0.0897* 0.0859** 0.0691*(0.0541) (0.0433) (0.0401)
SCHOOLY 0.00110 0.00219 0.00261(0.00341) (0.00231) (0.00203)
Log(LIFEEX) 0.142*** 0.135*** 0.113***(0.0454) (0.0266) (0.0430)
GOVC -0.0391 -0.0282 -0.0466*(0.0412) (0.0298) (0.0260)
INFL -0.000527 -0.000536 -0.000734(0.000617) (0.000584) (0.000803)
OPEN -0.0172 -0.0107* -0.00971(0.0109) (0.00609) (0.00651)
Log(FERT) 0.0000956 -0.0196 -0.0361***(0.0259) (0.0147) (0.0120)
Panel B: First-stage regression results
Democracy wave 0.41551*** 0.30557** 0.47916*** 0.37924*** 0.2568*** 0.05182(t− 1) (0.1070) (0.1221) (0.9224) (0.1051) (0.0787) (0.0495)
Observations 893 671 893 671 544 445Countries 157 128 157 128 94 83F p-val 0.00001 0.00000 0.00000 0.00000 0.00287 0.00000
Notes: Table reports 2SLS estimations, where SVMDI is instrumented by regional and cultural democracy. All estimationsinclude country fixed effects, cluster robust standard errors in parentheses. Test statistics and number of included countriesrefer to Panel A. F p-val gives the p-value of the F Statistic of the reported model. Labels of the columns refer to therespective specification reported in the baseline estimations in Table 1. ∗p < .10, ∗ ∗ p < .05, ∗ ∗ ∗p < .01.
33

Table 4 The effect of different democracy indicators on growth. Dependent variable is realper capita GDP growth.
SVMDI POLITY VANHANEN ACEMOGLU FREEDOM BOIX UDS
Panel A: Difference GMM estimations
DEMOCRACY 0.0320** 0.000680 0.000860 0.00829 0.00851 0.00755 0.00850(0.0151) (0.000918) (0.000529) (0.0116) .00698 (0.0104) (0.00723)
Observations 616 616 616 616 616 616 616Countries 122 122 122 122 122 122 122Hansen p-val 0.214 0.170 0.0968 0.221 0.210 0.199 0.226AR(1) p-val 0.118 0.120 0.116 0.122 0.115 0.120 0.115AR(2) p-val 0.229 0.240 0.237 0.229 0.220 0.231 0.236Instruments 99 99 99 99 99 99 99
Panel B: System GMM estimations
DEMOCRACY 0.0161** 0.000972** 0.000684*** 0.0119** 0.00585 0.00640 0.00698**(0.00751) (0.00049) (0.00026) (0.00543) 0.00356 (0.0055) (0.00336)
Observations 737 737 737 737 737 737 737Countries 122 122 122 122 122 122 122Hansen p-val 0.946 0.924 0.904 0.945 0.959 0.930 0.949Diff-Hansen 1.000 1.000 1.000 1.000 1.000 1.000 1.000AR(1) p-val 0.121 0.120 0.118 0.122 0.119 0.122 0.118AR(2) p-val 0.345 0.348 0.352 0.342 0.337 0.344 0.346Instruments 154 154 154 154 154 154 154
Notes: Table reports two-step system GMM estimations. All estimations use period fixed effects and Windmeijer-corrections, robust standard errors in parentheses. The instrument matrix is restricted to lag 3. Hansen p-val. givesthe p-value of Hansen’s J-test, AR(1) p-val. and AR(2) p-val. report the p-values of the AR(1) and AR(2) test. Diff-in-Hansen reports the C statistic of the difference in the p-values of the restricted and the unrestricted model. The unrestrictedmodel ignores the Arellano and Bover (1995) conditions. ∗p < .10, ∗ ∗ p < .05, ∗ ∗ ∗p < .01.
countries, i.e. the process of transformation towards more or less democracy.
Panel A of Table (4) illustrates the results of the difference GMM estimations,
replicating the specification of Column (3) in Table (2) using SVMDI and six
commonly used democracy indicators. To exclude the possibility of a sample
selection bias, the estimations rely on the intersection of observations that are
available for all indicators. As in Section 5.3, the SVMDI detects a positive
and significant effect of the democratization process within countries on their
growth rate. However, neither of the alternative indicators suggests a simi-
larly significant influence, a result which strongly resembles the effects found
in many recent studies.27 Since (non-)democratic countries differ in numer-
ous historical, cultural, political, and institutional aspects, first-differencing
27Note that this result also occurs if we use other model specifications, e.g. Column (4) ofTable (2) and Columns (2)–(4) of the baseline estimations of Table (1).
34

the model requires indicators that react quite sensitively to political events
in order to capture the effect of transition towards democracy within coun-
tries. As illustrated in Section 4.4, hitherto existing democracy indicators
are unable to react with sufficient sensitivity to political events and regime
changes. For this reason, raw measures of democracy—particularly dichoto-
mous indices—provide little indication of an income-enhancing effect of de-
mocratization, which is clearly visible in Table (4).
Since most of the variation of traditional democracy indicators stems from
the cross-section rather than the time-dimension, the utilization of additional
orthogonality conditions proposed by Arellano and Bover (1995) and Blun-
dell and Bond (1998) is beneficial, as these additional restrictions ensure that
some of the information of the equation in levels is maintained. With respect
to the estimation of the democracy-growth nexus, this implies that the es-
timated parameters also capture the between variation, i.e. the variation in
the level of democracy between the countries in the sample. In addition, as
difference GMM requires information from at least three consecutive periods
for a country to be included in the estimation, the exploitation of the Arellano
and Bover (1995) orthogonality conditions also yields an increase in the num-
ber of observations. This is crucial, as we might expect loss of observations
particularly for developing countries, which possess a higher within variation
of democratization than advanced economies. Panel B of Table 4 reports the
results of system GMM using the same model specifications as in Panel A.
What we observe is a change in the picture. The SVMDI index maintains its
positive and strongly significant effect on growth. Likewise, four of the six
alternative indices now point to a similar influence of democracy on growth.
Overall, the results of Table (4) broadly indicate that democracy is positively
related to growth. However, only the SVMDI indicates that the road to democ-
racy is beneficial to growth. From an economic perspective, this implies that
small steps towards democracy already lead to long-run increases in living
standards, even if political rights in the countries do not catch up with those
of established democracies. Conversely, reverse waves of democratization are
always harmful to growth in the long-run. Once the econometric specification
allows for the investigation of differences in the democracy level across coun-
tries, the positive effect of democracy can be observed as a clear empirical
pattern, even if the model relies on raw measures of democracy.
35
6 The transmission channels of democracy
In line with Tavares and Wacziarg (2001), we previously suspected that politi-
cal rights exert their influence on growth via a number of transmission channels.
This section is concerned with a more in-depth analysis of these mechanisms.
Table 5 illustrates the effect of democracy on schooling, investment, redistri-
bution, and fertility. Each of these variables plays an important role in the
growth progress; however, it is crucial to disentangle the effects of democ-
racy from those of credit availability. Whereas democracy may raise schooling
and investment via a more equal distribution of opportunities and less gov-
ernment interventions in the private sector, it simultaneously contributes to
better credit availability. It has been emphasized in the growth literature that
mitigation of credit market imperfections yields an increase in education and
physical capital investments (see, e.g., Galor and Moav, 2004, Galor and Zeira,
1993). For this reason, we specify two models for each of the transmission vari-
ables: the first variant basically uses the variables of the specifications in Table
(1), while the second variant additionally introduces private credit to GDP
(CREDIT) as a proxy for credit availability.28 As expected, the correlation
between SVMDI and CREDIT is high (50 percent).
The empirical framework follows Acemoglu et al. (2014), conducting Within-
Group (Panel A) and 2SLS (Panel B) estimations. The latter again uses re-
gional waves of democratization as external instruments for domestic democ-
racy. Due to the high probability of a potential Nickell (1981) bias in our
“small” T panel, we do not include lagged dependent variables. SVMDI enters
with a lag of one period in the regressions to ensure that causality runs from
democracy to the transmission variables, rather than the reverse.
The first transmission channel in Table 5 is concerned with education. The
results imply that richer economies exhibit a higher average level of school
attainment. In addition, better health as measured by life expectancy en-
hances education. The trade-off between the quantity and the education of
children is clearly visible, as we can observe a significantly negative impact of
fertility on education. Controlling for these effects, the influence of democra-
tization is positive in the Within-Group estimations and becomes significant
in Column (2) when we introduce CREDIT. Likewise, SVMDI is significant
in both specifications of the 2SLS estimations. The results imply that bet-
28The data source is World Bank (2014b).
36

Table 5 The transmission channels of democracy
Schooling Investment Redistribution Fertility
(1) (2) (1) (2) (1) (2) (1) (2)
Panel A: Within-Group regression results
Log(GDPpc) 1.036*** 0.650*** 0.00803 0.0000725 0.000969 -0.00556 0.00845 -0.0501(0.189) (0.183) (0.0223) (0.0234) (0.00606) (0.00553) (0.0347) (0.0333)
SVMDI(t− 1) 0.202 0.293* 0.0294** 0.0295* 0.00178 0.000810 -0.114** -0.0522(0.185) (0.161) (0.0132) (0.0151) (0.00379) (0.00429) (0.0453) (0.0364)
INVS -0.166 -0.327 -0.0781*** -0.0783*** -0.310** -0.370***(0.702) (0.701) (0.0216) (0.0220) (0.148) (0.138)
SCHOOLY 0.000906 -0.00284 0.00571*** 0.00492*** -0.115*** -0.120***(0.00552) (0.00594) (0.00152) (0.00140) (0.0165) (0.0166)
Log(LIFEEX) 2.585*** 2.123** 0.230*** 0.229*** 0.0300** 0.0263** -0.210 -0.192(0.961) (0.848) (0.0729) (0.0768) (0.0140) (0.0131) (0.160) (0.151)
GOVC -0.729 -0.632 -0.107 -0.126 0.00198 0.00242 0.0972 0.0950(0.720) (0.689) (0.0920) (0.0862) (0.00904) (0.00880) (0.109) (0.0985)
INFL -0.0139** -0.0108 -0.000165 -0.00119* 0.000405 0.000387 0.00034 0.00072(0.00668) (0.00727) (0.00134) (0.000601) (0.000275) (0.000307) (0.0007) (0.0006)
Log(FERT) -2.710*** -3.022*** -0.0633** -0.0810*** 0.0162** 0.0125*(0.306) (0.296) (0.0294) (0.0296) (0.00679) (0.00654)
OPEN 0.107 0.122 -0.00218 -0.00359 0.00524 0.00469 0.00246 0.0112(0.123) (0.112) (0.0105) (0.00979) (0.00348) (0.00334) (0.0221) (0.0189)
CREDIT 0.688*** 0.00757 0.0126** 0.122***(0.220) (0.0185) (0.00581) (0.0434)
REDIST -0.683***(0.189)
Panel B: 2SLS regression results
SVMDI(t− 1) 2.052*** 2.192*** 0.0755* 0.0867 0.0161 0.0162 -0.469*** -0.420**(0.706) (0.713) (0.0424) (0.0539) (0.0107) (0.0125) (0.146) (0.174)
Observations 670 648 560 648 560 544 670 648Countries 128 126 121 126 121 119 128 126R-squared 0.607 0.645 0.240 0.200 0.130 0.150 0.532 0.568F-statistic 43.10 46.57 7.454 8.023 3.545 3.307 28.59 29.24Model p-val 1.23e-30 6.06e-34 4.94e-08 1.08e-08 0.00102 0.00124 2.52e-23 2.99e-25
Notes: Table reports Within-Group and 2SLS estimations. Model specification of the 2SLS estimations is identical to the Within-Group variant. Cluster robust standard errors in parentheses. Test statistics refer to the Within-Group models. F statistic reportsthe test statistic of joint significance of the model, Model p-val gives the p-value of the F-test. ∗p < .10, ∗ ∗ p < .05, ∗ ∗ ∗p < .01.
37

ter credit availability softens the budget constraints of the household, thereby
contributing to a higher level of education of individuals. However, even when
controlling for this effect, the impact of democracy acts as an additional source
of educational improvements.
The second transmission channel illustrates the effect on investment, which
is positive in both the Within-Group and the 2SLS estimations. Apparently,
democratic structures and political rights facilitate both national and foreign
investments and capital inflows. These findings are in line with the well-known
results of Perotti (1996), who finds that political stability—which is consider-
ably larger in democracies (Feng, 1997)—has a huge impact on investment and
growth. CREDIT has no significant effect on investment, suggesting that the
positive contribution of the SVMDI stems largely from foreign investments,
which are not necessarily financed by loans acquired in the target country.
To examine a possible negative effect of increasing political rights in countries
with a medium or high level of SVMDI, Column (1) also incorporates the level
of effective redistribution measured by the difference of the Gini coefficient of
household incomes before and after taxes and transfers.29 The results show
a strongly significant impact of redistribution on investments, where a higher
amount of redistribution is negatively related to investment activity. This, in
principle, supports the hypothesis that a higher level of democratization may
be an impediment to growth. However, this mechanism only comes into play
if democracy enhances redistribution.
This effect is investigated in the third branch of transmission analysis. We
observe that redistribution is lower in countries with a higher average level of
education. Meanwhile, countries with higher life expectancies, higher govern-
ment consumption and higher fertility rates typically tend to redistribute more.
Controlling for these effects, we find no additional contribution of SVMDI on
redistribution, neither in the Within-Group regressions nor in the 2SLS esti-
mations. This implies that the strong bivariate correlation between SVMDI
and REDIST (63 percent) is not due to an inherent causality running from
democracy to redistribution, but is the result of numerous variables that are
affected by democracy. The ambiguous effect of democracy on redistribution
strongly resembles the recent findings of Acemoglu et al. (2013). However, Feld
and Schnellenbach (2014) emphasize that the manner in which income is redis-
tributed differs between countries, depending on the respective constitutional
29Data source is the SWIID v5, documented in Solt (2009) and Solt (2014).
38

framework.
The last transmission channel refers to the effect of democracy on fertility.
The first column highlights that democratization yields a significant decline in
fertility rates. The process of democratization is often accompanied by a sub-
stantial increase in social security systems and a reduction of uncertainty due
to higher political stability, both of which reduce families’ incentives to have
children as a substitute for social protection. However, it is crucial to disentan-
gle the different effects of democracy and credit availability, as illustrated in
Column (2). When holding constant CREDIT, the effect of democracy shrinks,
but remains negatively and—in case of the 2SLS estimations—significantly as-
sociated with fertility. Better credit availability increases the fertility rate, as
access to capital markets alleviates the otherwise binding trade-off between
the quantity and the education of children.
Summarizing the findings, we observe that democracy exerts its influence on
growth via better education, higher investment shares, and lower fertility rates.
In contrast, we find no evidence for a redistribution-enhancing effect of democ-
ratization.30
7 Conclusions
Having reliable measurements regarding democracy is essential for achieving
a sound understanding of democratization and its effects on political and eco-
nomic outcomes. The overwhelming majority of existing indicators, however,
are fraught with methodical problems. Scholars using such rough measure-
ments will find, not infrequently, that an inappropriate democracy indicator is
the Achilles’ heel of empirical analyses, particularly when working with panel
data.
By maximizing comparability for the broadest possible sample of countries,
the SVMDI algorithm facilitates empirical investigations of democracy. A
direct result of this methodical progress is a substantial increase in the level
30We also do not find any robust effect of democracy on health, even though both variablesreveal a high bivariate correlation (53 percent). What we do find, however, is a significantimpact of initial wealth on life expectancy. Whereas we would suspect that democraticcountries provide better public health services, the estimations imply that incomes aremuch more decisive for health than regime types. However, life expectancy may be a poorproxy in this context, as changes in this variable may only occur a considerable amountof time after democratization has taken place.
39

of detail in comparison to established approaches. In addition, the algorithm
places the crucial question of how to aggregate the underlying attributes—
undoubtedly the main weak point of alternative indicators—into the context
of a nonlinear optimization problem, thereby obtaining much more consistent
and plausible results. The unprecedented potential of machine learning enables
researchers to make highly accurate classifications, and may also yield very
promising results for problems in the field of economics beyond its utilization
for measuring democracy.
Using the SVMDI, we find a robust positive influence of democracy on long-
run economic growth. Our results imply that the ambiguity in recent studies
stems from two main sources. First, in light of the diversity of political institu-
tions across countries, the lack of a sufficient reaction of traditional democracy
indicators to political events and regime changes only allows for a rough clas-
sification of democracy. Second, when using empirical models that rely on the
within-country variation, the problem of inadequate and insensitive measure-
ment of democracy becomes particularly severe.
When digging deeper into the democracy-growth nexus, we find only little
indication of a nonlinear relationship between the variables. The analysis of the
transmission channels through which democracy exerts its influence on growth
illustrates why: whereas democratic countries typically have more educated
populations, higher investment shares and lower fertility rates, we cannot find
evidence of a redistribution-enhancing effect of democratization.
Taken together, our results emphasize that democratic structures facilitate
economic growth in the long-run, and their implementation may be a benefi-
cial strategy for less-developed countries. However, countries differ in numer-
ous cultural, historical, political, and institutional dimensions. Isolating the
growth effect of different aspects of democratic institutions may thus be an ad-
vantageous field of future research. Likewise, it would be beneficial to acquire
a deeper empirical understanding of the transmission channels of democracy,
particularly with regard to health, inequality, and redistribution.
40
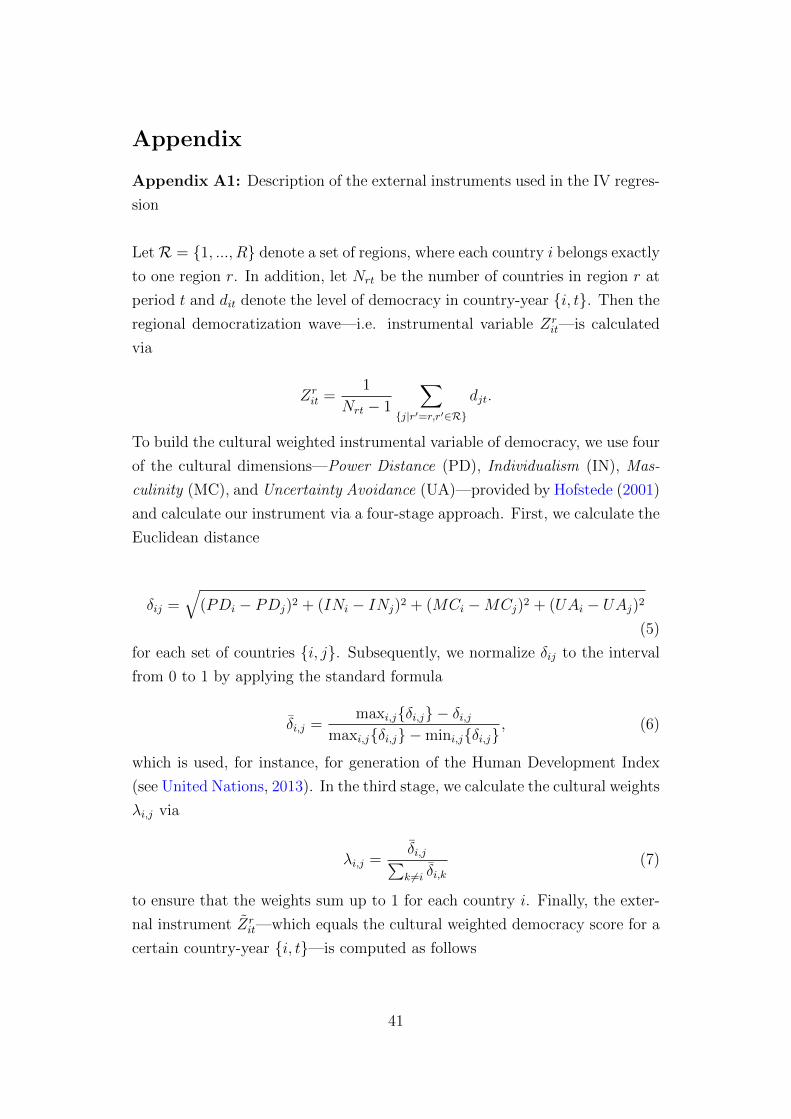
Appendix
Appendix A1: Description of the external instruments used in the IV regres-
sion
LetR = {1, ..., R} denote a set of regions, where each country i belongs exactly
to one region r. In addition, let Nrt be the number of countries in region r at
period t and dit denote the level of democracy in country-year {i, t}. Then the
regional democratization wave—i.e. instrumental variable Zrit—is calculated
via
Zrit =
1
Nrt − 1
∑{j|r′=r,r′∈R}
djt.
To build the cultural weighted instrumental variable of democracy, we use four
of the cultural dimensions—Power Distance (PD), Individualism (IN), Mas-
culinity (MC), and Uncertainty Avoidance (UA)—provided by Hofstede (2001)
and calculate our instrument via a four-stage approach. First, we calculate the
Euclidean distance
δij =√
(PDi − PDj)2 + (INi − INj)2 + (MCi −MCj)2 + (UAi − UAj)2
(5)
for each set of countries {i, j}. Subsequently, we normalize δij to the interval
from 0 to 1 by applying the standard formula
δi,j =maxi,j{δi,j} − δi,j
maxi,j{δi,j} −mini,j{δi,j}, (6)
which is used, for instance, for generation of the Human Development Index
(see United Nations, 2013). In the third stage, we calculate the cultural weights
λi,j via
λi,j =δi,j∑k 6=i δi,k
(7)
to ensure that the weights sum up to 1 for each country i. Finally, the exter-
nal instrument Zrit—which equals the cultural weighted democracy score for a
certain country-year {i, t}—is computed as follows
41

Zrit =
∑k 6=i
λk,tSVMDIk,t. (8)
42

Table A2 Classification of regions in the IV regression.
I. ASIA
Central Asia Afghanistan, Armenia, Azerbaijan, Bhutan, Georgia, India,Iran, Kazakhstan, Kyrgyzstan, Maldives, Mongolia, Nepal,Pakistan, Sri Lanka, Tajikistan, Turkmenistan, Uzbekistan
East-Southeast Asia Bangladesh, Cambodia, China, Japan, Laos, Myanmar,North Korea, South Korea, Taiwan, Thailand, Vietnam
Arabic Region Bahrain, Iraq, Israel, Jordan, Kuwait, Lebanon, Oman,Qatar, Saudi Arabia, Syria, Turkey, United Arab Emirates,Yemen
Oceania Australia, Brunei Darussalam, Fiji, Indonesia, Malaysia,New Zealand, Papua New Guinea, Philippines, Samoa, Sin-gapore Solomon Islands, Tonga, Vanuatu
II. EUROPE
Central-Northern Europe Austria, Belgium, Denmark, Finland, Germany, Ice-land, Ireland, Luxembourg, Netherlands, Norway, Sweden,Switzerland, United Kingdom
South-Southwest Europe Cyprus, France, Greece, Italy, Malta, Portugal, SpainEast Europe Belarus, Czech Republic, Estonia, Latvia, Lithuania,
Moldova, Poland, Russia, Slovakia, UkraineBalkan States Albania, Croatia, Bulgaria, Hungary, Kosovo, Macedonia,
Montenegro, Romania, Serbia, Slovenia
III. AFRICA
North Africa Algeria, Egypt, Libya, Morocco, TunisiaCentral-East Africa Cameroon, Central African Republic, Chad, Djibouti, Er-
itrea, Ethiopia, Kenya, Somalia, South Sudan, SudanWest Africa Benin, Burkina Faso, Cape Verde, Cote d’Ivoire, Gambia,
Ghana, Guinea, Guinea-Bissau, Liberia, Mali, Mauritania,Niger, Nigeria, Senegal, Sierra Leone, Togo
Southern Africa Angola, Burundi, Comoros, Democratic Republic of theCongo, Republic of the Congo, Equatorial Guinea, Gabon,Lesotho, Madagascar, Malawi, Mauritius, Mozambique,Namibia, Rwanda, Sao Tome and Prıncipe, Seychelles,South Africa, Swaziland, Tanzania, Uganda, Zambia, Zim-babwe
IV. AMERICA
North America Bahamas, Canada, United StatesCentral America Belize, Costa Rica, El Salvador, Grenada, Guatemala, Hon-
duras, Mexico, Nicaragua, PanamaSouth America Argentina, Brazil, Chile, Colombia, Ecuador, Guyana,
Paraguay, Peru, Suriname, Uruguay, VenezuelaCaribbean Antigua and Barbuda, Barbados, Cuba, Dominica, Domini-
can Republic, Haiti, Jamaica, St. Kitts and Nevis, St. Lu-cia, St. Vincent, Trinidad and Tobago
43

References
Acemoglu, D., Johnson, S., Robinson, J. A., and Yared, P. (2008). Income and
Democracy. American Economic Review, 98(3):808–42. 5, 6
Acemoglu, D., Johnson, S., Robinson, J. A., and Yared, P. (2009). Reeval-
uating the modernization hypothesis. Journal of Monetary Economics,
56(8):1043–1058. 6
Acemoglu, D., Naidu, S., Restrepo, P., and Robinson, J. (2013). Democracy,
redistribution and inequality. NBER Working Papers 19746, National Bu-
reau of Economic Research, Inc. 38
Acemoglu, D., Naidu, S., Restrepo, P., and Robinson, J. A. (2014). Democracy
Does Cause Growth. NBER Working Papers 20004, National Bureau of
Economic Research, Inc. 2, 6, 8, 12, 13, 19, 20, 21, 27, 30, 31, 32, 36
Acemoglu, D. and Robinson, j. A. (2012). Why nations fail. Crown, New York
(US). 5
African Election Database (2014). A database of election results in Sub-
Saharan Africa. 13
Aizerman, M., Braverman, E., and Rozonoer, L. I. (1964). Theoretical foun-
dations of the potential function method in pattern recognition learning.
Automation and Remote Control, 25:821–837. 11
Alesina, A., Ozler, S., Roubini, N., and Swagel, P. (1996). Political instability
and economic growth. Journal of Economic growth, 1(2):189–211. 5
Alesina, A. and Rodrik, D. (1994). Distributive Politics and Economic Growth.
The Quarterly Journal of Economics, 109(2):465–90. 5
Anderson, L. E. and Dodd, L. C. (2009). Nicaragua: progress amid regress?
Journal of Democracy, 20(3):153–167. 20
Apolte, T. (2011). Democracy and prosperity in two decades of transition.
The Economics of Transition, 19(4):693–722. 5
Arellano, M. and Bond, S. (1991). Some tests of specification for panel data:
Monte carlo evidence and an application to employment equations. The
Review of Economic Studies, 58(2):pp. 277–297. 22, 27
44

Arellano, M. and Bover, O. (1995). Another look at the instrumental variable
estimation of error-components models. Journal of econometrics, 68(1):29–
51. 23, 25, 34, 35
Barro, R. J. (1996). Democracy and Growth. Journal of Economic Growth,
1(1):1–27. 5, 27
Barro, R. J. (2003). Determinants of economic growth in a panel of countries.
Annals of economics and finance, 4:231–274. 5, 22
Barro, R. J. (2013). Education and economic growth. Annals of Economics
and Finance, 14(2):301–328. 22
Barro, R. J. and Lee, J. W. (2013). A new data set of educational attainment
in the world, 1950–2010. Journal of development economics, 104:184–198.
22
Barro, R. J. and Sala-i Martin, X. (1992). Convergence. Journal of Political
Economy, 100(2):223–51. 24
Benabou, R. (1996). Inequality and growth. In NBER Macroeconomics An-
nual 1996, Volume 11, NBER Chapters, pages 11–92. National Bureau of
Economic Research. 5
Bishop, C. (2006). Pattern Recognition and Machine Learning. Springer, New
York (US), 2 edition. 10
Blundell, R. and Bond, S. (1998). Initial conditions and moment restrictions
in dynamic panel data models. Journal of econometrics, 87(1):115–143. 3,
23, 35
Blundell, R., Bond, S., and Windmeijer, F. (2000). Estimation in dynamic
panel data models: improving on the performance of the standard gmm
estimator (in: Boarnet, m., 1997. highways and economic productivity, in-
terpreting recent evidence). Journal of Planning Literature, 11:476–486. 23
Boix, C., Miller, M., and Rosato, S. (2013). A complete data set of political
regimes, 1800–2007. Comparative Political Studies, 46(12):1523–1554. 7, 8,
20
45
Bollen, K. A. (2001). Cross-national indicators of liberal democracy, 1950-
1990. computer file]. 2nd ICPSR version. Chapel Hill, NC: University of
North Carolina [producer]. 9
Bond, S., Hoeffler, A., and Temple, J. (2001). Gmm estimation of empirical
growth models. (2001-W21). 22, 23, 24
Boser, B. E., Guyon, I. M., and Vapnik, V. N. (1992). A training algorithm for
optimal margin classifiers. In Proceedings of the 5th Annual ACM Workshop
on Computational Learning Theory, pages 144–152. ACM Press. 11
Burges, B. (1999). Geometry and invariance in kernel based methods. pages
89–116. 11
Burkhart, R. and Lewis-Beck, M. (1994). Comparative democracy: The
economic development thesis. The American Political Science Review,
88(4):903–910. 5
Campante, F. R. and Chor, D. (2012). Why was the arab world poised for
revolution? schooling, economic opportunities, and the arab spring. The
Journal of Economic Perspectives, 26(2):167–187. 2
Carr, A. (2014). Psephos: Adam Carr’s Electoral Archive. Melbourne (AU).
13
Cheibub, J. A., Gandhi, J., and Vreeland, J. R. (2010). Democracy and dic-
tatorship revisited. Public Choice, 143(1-2):67–101. 7, 8, 10
Cingranelli, D., Richards, D., and Clay, K. C. (2014). The CIRI Human Rights
Dataset. CIRI Human Rights Data Project. 13
Cortes, C. and Vapnik, V. (1995). Support-vector networks. Machine learning,
20(3):273–297. 10
Dahl, R. A. (1971). Polyarchy: Participation ans Opposition. Yale University
Press, New Haven (US). 6, 19, 21
Doucouliagos, H. and Ulubasoglu, M. A. (2008). Democracy and economic
growth: a meta-analysis. American Journal of Political Science, 52(1):61–
83. 9, 26
46

Elias, J. S. (2015). Judges and democracy in argentina: An elite in search
of legitimacy. In Turenne, S., editor, Fair Reflection of Society in Judicial
Systems-A Comparative Study, pages 23–40. Springer. 18
Feenstra, R. C., Inklaar, R., and Timmer, M. P. (2013). The next generation
of the penn world table. 22
Feld, L. and Schnellenbach, J. (2014). Political institutions and income
(re-)distribution: evidence from developed economies. Public Choice,
159(3):435–455. 38
Feng, Y. (1997). Democracy, political stability, and economic growth. British
Journal of Political Science, 27(3):391–418. 5, 38
Figueros, M. (1985). An assessment of overvoting in jamaica. Social and
Economic Studies, pages 71–106. 19
Freedom House (2014). Freedom in the World database. Washington D.C.(US).
7, 8, 9, 13, 18
Galor, O. and Moav, O. (2004). From Physical to Human Capital Accumu-
lation: Inequality and the Process of Development. Review of Economic
Studies, 71(4):1001–1026. 36
Galor, O. and Zeira, J. (1993). Income distribution and macroeconomics. The
Review of Economic Studies, 60(1):35–52. 36
Gerring, J., Bond, P., Barndt, W. T., and Moreno, C. (2005). Democracy and
economic growth. a historical perspective. World Politics, 57(3):323–364. 2,
6, 27, 28, 32
Giavazzi, F. and Tabellini, G. (2005). Economic and political liberalizations.
Journal of Monetary Economics, 52(7):1297–1330. 5
Gibney, M., Cornett, L., Wood, R., and Haschke, P. (2013). Political Terror
Scale, 1976-2012. 13
Greenberg, J. (2014). After the Revolution: Youth, Democracy, and the Poli-
tics of Disappointment in Serbia. Stanford University Press, Stanford (US).
17
47

Gualtieri, J. A. (2009). The support vector machine (svm) algorithm for super-
vised classification of hyperspectral remote sensing data. In Camps-Valls, G.
and Bruzzone, L., editors, Kernel Methods for Remote Sensing Data Anal-
ysis. John Wiley, Chichester (UK). 3, 10
Gugiu, M. R. and Centellas, M. (2013). The democracy cluster classification
index. Political Analysis, 21(3):334–349. 9, 10
Guyon, I., Weston, J., Barnhill, S., and Vapnik, V. (2002). Gene selection
for cancer classification using support vector machines. Machine learning,
46(1-3):389–422. 3, 10
Halter, D., Oechslin, M., and Zweimuller, J. (2014). Inequality and growth:
the neglected time dimension. Journal of Economic Growth, 19(1):81–104.
22
Hofstede, G. (2001). Culture’s Consequences. Comparing Values, Behaviors,
Institutions, and Organizations Across Nations. Sage, Thousand Oaks and
London. 31, 41
Huntington, S. P. (1991). Democracy’s third wave. Journal of Democracy,
2(2):12–34. 16, 30
Huntington, S. P. (2012). The Third Wave: Democratization in the Late 20th
Century. University of Oklahoma Press. 16, 20, 21, 30
IDEA (2014). Voter Turnout Database. International Institute for Democracy
and Electoral Assistance, Stockholm (SE). 13
IPU (2014). Parline databse on national parliaments. Inter-Parliamentary
Union, Le Grand-Saconnex (CH). 13
Joachims, T. (2002). Learning to classify text using support vector machines:
Methods, theory and algorithms. Kluwer Academic Publishers. 10
Kim, K.-j. (2003). Financial time series forecasting using support vector ma-
chines. Neurocomputing, 55(1):307–319. 10
Larkins, C. (1998). The judiciary and delegative democracy in argentina.
Comparative Politics, 30(4):423–442. 18
48

Levitsky, S. and Murillo, M. V. (2008). Argentina: From kirchner to kirchner.
Journal of Democracy, 19(2):16–30. 18, 20
Lind, J. T. and Mehlum, H. (2010). With or Without U? The Appropriate Test
for a U-Shaped Relationship. Oxford Bulletin of Economics and Statistics,
72(1):109–118. 27
Lipset, S. M. (1959). Some social requisites of democracy. American Political
Science Review, 53(1):69–105. 6
Lizzeri, A. and Persico, N. (2004). Why Did the Elites Extend the Suf-
frage? Democracy and the Scope of Government, With an Application to
Britain’s "Age of Reform". The Quarterly Journal of Economics,
119(2):705–763. 5
Madsen, J. B., Raschky, P. A., and Skali, A. (2015). Does democracy drive
income in the world, 1500-2000? European Economic Review, 78:175–195.
2, 6, 30, 31
Marshall, M., R., G. T., and Jaggers, K. (2014). Polity IV project. Political
Regime Characteristics and Transitions, 1800-2013. Center of Systematic
Peace. 7, 8, 19
McConnell, S. A. (2014). The 2011 presidential and legislative elections in
nicaragua. Electoral Studies, 34:300–303. 20
McFaul, M. (2002). The fourth wave of democracy and dictatorship: noncoop-
erative transitions in the postcommunist world. World politics, 54(2):212–
244. 17
Mercer, J. (1909). Functions of positive and negative type and their connection
with the theory of integral equations. Philosophical transactions of the Royal
Society, London A, 209:415–446. 11
Munck, G. L. and Verkuilen, J. (2002). Conceptualizing and meassuring
democracy: Evaluating alternative indices. Comparative Political Studies,
35(1):5–34. 7, 8, 10, 12
Murtin, F. and Wacziarg, R. (2014). The democratic transition. The Journal
of Economic Growth, 19(2):141–181. 2, 5, 6
49
Nickell, S. (1981). Biases in dynamic models with fixed effects. Econometrica,
49(6):pp. 1417–1426. 3, 28, 36
O’Donell, G. A. (1994). Delegative democracy. Journal of Democracy, 5(1):55–
69. 18
Olson, M. (1982). The Rise and Decline of Nations. Yale University Press,
New Haven (US). 5
Orru, G., Pettersson-Yeo, W., Marquand, A. F., Sartori, G., and Mechelli,
A. (2012). Using support vector machine to identify imaging biomarkers
of neurological and psychiatric disease: a critical review. Neuroscience &
Biobehavioral Reviews, 36(4):1140–1152. 3, 10
Papaioannou, E. and Siourounis, G. (2008). Democratisation and Growth.
Economic Journal, 118(532):1520–1551. 28
Pemstein, D., Meserve, S. A., and Melton, J. (2010). Democratic compromise:
A latent variable analysis of ten measures of regime type. Political Analysis,
18(4):426–449. 9
Perotti, R. (1996). Growth, income distribution, and democracy: What the
data say. Journal of Economic Growth, 1(2):149–187. 38
Persson, T. and Tabellini, G. (1994). Is Inequality Harmful for Growth? Amer-
ican Economic Review, 84(3):600–621. 5
Persson, T. and Tabellini, G. (2008). The growth effect of democracy: Is it
heterogenous and how can it be estimated? In Helpman, E., editor, Insti-
tutions ans Economic Performance. Harvard University Press, Cambridge
(US). 5
Persson, T. and Tabellini, G. (2009). Democratic Capital: The Nexus of Polit-
ical and Economic Change. American Economic Journal: Macroeconomics,
1(2):88–126. 5, 30
Rawls, J. (1971). A Theory of Justice. Cambridge (US). 6, 13
Rodrik, D. and Wacziarg, R. (2005). Do Democratic Transitions Produce Bad
Economic Outcomes? American Economic Review, 95(2):50–55. 5, 27, 28
50

Roodman, D. (2009a). A Note on the Theme of Too Many Instruments. Oxford
Bulletin of Economics and Statistics, 71(1):135–158. 24
Roodman, D. (2009b). How to do xtabond2: An introduction to difference
and system gmm in stata. Stata Journal, 9(1):86. 23
Saint-Paul, G. and Verdier, T. (1993). Education, democracy and growth.
Journal of Development Economics, 42(2):399–407. 5
Samuels, A. (1959). Some studies in machine learning using the game of check-
ers. IBM Journal of Research and Development, 3(3):210–229. 10
Schoenberg, I. (1942). Positive definite functions of spheres. Duke Mathemat-
ical Journal, 9:96–108. 11
Severinghaus, S. R. (2001). Mongolia in 2000 the pendulum swings again.
Asian Survey, 41(1):61–70. 21
Shin, K.-S., Lee, T. S., and Kim, H.-j. (2005). An application of support vector
machines in bankruptcy prediction model. Expert Systems with Applications,
28(1):127–135. 10
Smola, A. J. and Scholkopf, B. (2004). A tutorial on support vector regression.
Statistics and computing, 14(3):199–222. 12, 14
Solt, F. (2009). Standardizing the world income inequality database*. Social
Science Quarterly, 90(2):231–242. 38
Solt, F. (2014). The standardized world income inequality database. Working
paper. SWIID Version 5.0, October 2014. 38
Tavares, J. and Wacziarg, R. (2001). How democracy affects growth. European
Economic Review, 43(8):1341–1378. 5, 26, 36
Tay, F. E. and Cao, L. (2001). Application of support vector machines in
financial time series forecasting. Omega, 29(4):309–317. 10
Treier, S. and Jackman, S. (2008). Democracy as a latent variable. American
Journal of Poplitical Science, 52(1):201–217. 8
United Nations (2013). Human development index - technical notes. Technical
report, New York (US). 41
51

Vanhanen, T. (2000). A new dataset for measuring democracy, 1810-1998.
Journal of Peace Research, 37(2):251–265. 6, 7, 13, 19, 20, 21
Vanhanen, T. (2014). Measures of Democracy 1810-2012, version 6.0. Finish
Social Science Data Archive, Tampere (FI). 13
Vanhanen, T. and Lindell, K. (2012). Measures of Democracy 1810-2012.
FSD1289, version 6.0. Finnish Social Science Data Archiv, University of
Tampere (FI). 32
Vapnik, V. and Chervonenkis, A. (1964). A note on one class of the algorithms
of pattern recognition. Automation and Remote Control, 25(6):821–837. 10
Vapnik, V. and Lerner, A. (1963). Generalized portrait method for pattern
recognition. Automation and Remote Control, 24(6):774–780. 10, 11
Vapnik, V. N. (1998). Statistical learning theory, volume 1. Wiley New York.
11
Voitchovsky, S. (2005). Does the profile of income inequality matter for eco-
nomic growth? Journal of Economic Growth, 10(3):273–296. 22
Walker, L. D. (2009). Delegative democratic attitudes and institutional sup-
port in central america. Comparative Politics, 42(1):83–101. 19
Williams, P. J. (1990). Elections and democratization in nicaragua: the 1990
elections in perspective. Journal of Inter-American Studies and World Af-
fairs, pages 13–34. 19
Windmeijer, F. (2005). A finite sample correction for the variance of linear
efficient two-step GMM estimators. Journal of Econometrics, 126(1):25–51.
24
World Bank (2014a). The Database of Political Institutions. The World Bank,
Washington D.C. (US). 13
World Bank (2014b). World Development Indicators Database (WDI). The
World Bank. 22, 36
World Value Survey (2014). World Value Survey Wave 6, official aggregate
v.2015041. World Value Survey Association, Madrid (ES). 2
52

Wust, A. M. (2005). Jamaica. In Nohlen, D., editor, Elections in the Americas:
A data handbook., volume 1, pages 423–438. 19
Zagorski, P. W. (2003). Democratic breakdown in paraguay and venezuela:
The shape of things to come for latin america? Armed Forces and Society,
30:87–116. 17, 20
53


