Embed Size (px)
Citation preview

BASF Capital Market Story__June 2012
We add value as one company
Group Visit Morgan Stanley Ludwigshafen June 29, 2012

BASF Presentation June 2012
BASF Performance Products Growth. Value. Sustainability
Michael Heinz Member of the Board of Executive Directors Ludwigshafen June 29, 2012

BASF Presentation June 2012 2
Distinct customer interaction models allow to generate and fairly share additional value by serving differentiated customer needs
Industry leader in managing complexity and cost efficiency
Globally leading market positions serving a broad portfolio of industries
Leading the industry in innovations developed in close cooperation with customers for both developed and emerging markets
Growth
Value
Sustainability
Value generation throughout economic cycles
Outstanding contribution to consumers‘ need for sustainable well-being as well as resource and energy efficiency
Performance Products: Positioned to outperform

BASF Presentation June 2012 3
Performance Products segment in 2011: Net Sales of €15.7 billion
Dispersions & Pigments Sales: € 3.5bn
Care Chemicals Sales: € 5.2bn
Paper Chemicals Sales: € 1.6bn
Performance Chemicals Sales: € 3.5bn
Nutrition & Health
Sales: € 1.9bn
Pigments, Resins and Additives for - Paints &
Coatings - Printing &
Packaging Dispersions for
- Construction - Adhesives
Home Care
Personal Care - Cosmetics
Hygiene
Paper coating chemicals
Paper production chemicals
Kaolin
Plastics processing
Oilfield & Mining
Water
Automotive & Refineries
Textile & Leather
Human Nutrition
Animal Nutrition
Pharma
Aroma Ingredients
Five divisions serving a distinct portfolio of industries

BASF Presentation June 2012 4
Paints & Coatings | Plastics Processing | Fuel and Lubricants | Hygiene
10 – 15 %
5 – 10 %
< 5 % Printing & Packaging | Construction | Adhesives | Water | Oilfield & Mining | Textile & Leather
Personal Care | Home Care | Nutrition & Health | Paper
No dependency on single industry cycle
Performance Products sales by industry* - % of sales in 2011
* Distribution by direct customers of BASF
Broad array of end markets

BASF Presentation June 2012 5
Sales development (in billion €)* Sustainable growth
Steady sales increase since 2005
Acceleration in 2009 through Ciba acquisition
2010 sales increase reflects strong demand
In 2011 sales growth was especially supported by the inclusion of Cognis
Dispersions & Pigments Paper Chemicals
Care Chemicals Performance Chemicals
* All data restated for 2009 segment portfolio
Performance Products: Steady sales growth
Nutrition & Health
7.0 7.7 8.1 8.1 9.4
12.3
15.7

BASF Presentation June 2012 6
Sales development of Performance Products by region* (in million €) 2011 vs. 2010
25%
Europe - our home market with well established market position
North America – position significantly strengthened by additional Cognis businesses
Asia - strongly positioned for further growth with investments in assets and R&D
Excellent basis for growth in South America, Middle East due to in-depth knowledge of industries and consumer requirements
Global reach and excellent basis for growth in emerging markets
North America 3,560 (+23%)
Europe 7,247 (+34%)
Asia Pacific 3,416 (+23%)
South America, Africa, Middle East 1,474 (+23%)
46%
22% 9%
23%
* By location of customer
15,697 (+27%)

BASF Presentation June 2012 7
Development of EBITDA before special items (in million €)
Performance Products: Business portfolio shaped to optimize cash generation
EBITDA bSI continuously improving even in crisis years 2008 and 2009
EBITDA bSI 2010 substantially increasing due to higher sales volumes, successful measures to Ciba integration and repositioning of the combined businesses
EBITDA bSI 2011 benefitting from Cognis inclusion and lower integration expenses
Strategic portfolio development paying off
Improved value generation through repositioning of businesses
0
500
1.000
1.500
2.000
2005 2006 2007 2008 2009 2010 2011

BASF Presentation June 2012 8
Customers need certain breadth of product/service offering but not complete customization
Customers can configure own packages
Numerous anonymous or shallow buyer-supplier relationships
Spot market behavior
Customers willing to partner with supplier to jointly develop solutions
Customers ask for customization of product/service to fulfill their specific needs
Customer prepared to share value jointly created
Achieve benchmark leading cost position Supply reliability is important buying factor Customers see differentiation in sustainability
Distinct customer interaction models help managing complexity
Trader/transactional supplier
Standard package provider
Customized solution provider
Lean/reliable basics supplier
Customers open to shift parts of their own value chain
Substantial transaction cost and risk reduction seen by customer
Value chain integrator
Customer interested in superior performance of products/services
High spending in R&D required to capture market needs
Customer pays for value created in innovation
Product/process innovator
Differentiated BASF Customer Interaction Models matched to customer needs

BASF Presentation June 2012 9
Lean/reliable basics supplier
Standard package provider
Product/process innovator
Customized solution provider
2011 % of the business
~40 ~30 ~25 ~5
BASF
Reliable quality supplier
Sustainable product offering
Benchmark cost leader
Broader portfolio of products & services for differentiation in the market place
Continuous stream of new products, systems and business models
Customer-specific cooperations to fulfill unmet consumer needs
Customer
Leverages market opportunities
Values quality, sustainability and reliability of offering
Values industry specific synergies & support
Values innovation contribution
Fairly shares value jointly created
Pricing Cost leader defines lowest price limit Supply / demand balance defines market price Mitigating volatility essential
Value created along the value chain compared to market standard defines price level
Product life cycle management essential
Differentiated Customer Interaction Models at BASF Performance Products
BASF Presentation June 2012 10
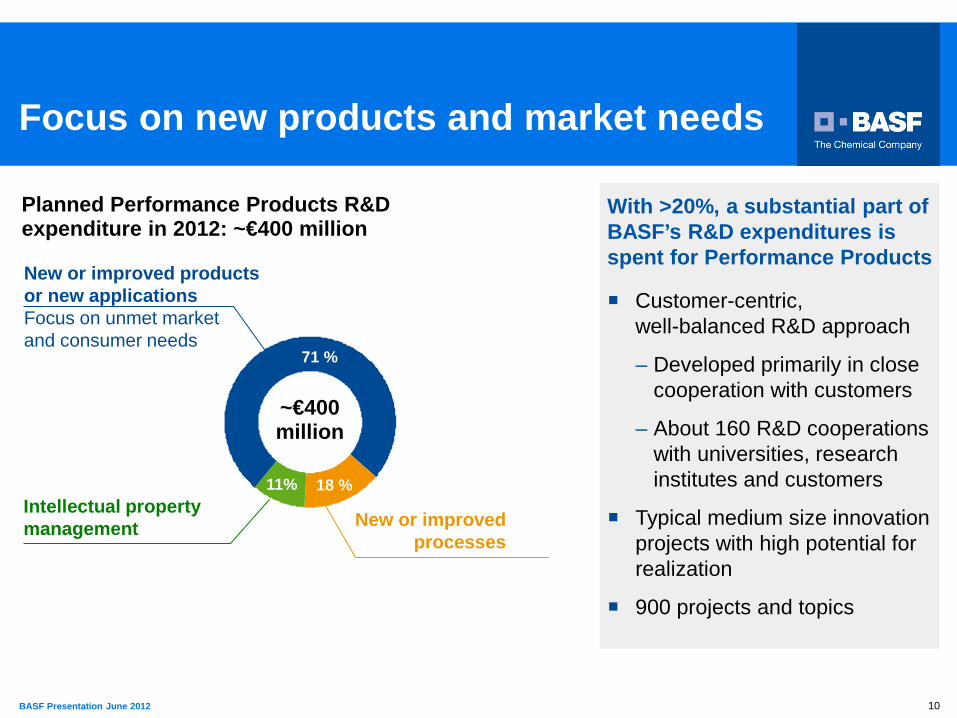
New or improved products or new applications Focus on unmet market and consumer needs
New or improved processes
71 %
18 %
Customer-centric, well-balanced R&D approach
– Developed primarily in close cooperation with customers
– About 160 R&D cooperations with universities, research institutes and customers
Typical medium size innovation projects with high potential for realization
900 projects and topics
With >20%, a substantial part of BASF’s R&D expenditures is spent for Performance Products
Focus on new products and market needs
Intellectual property management
11%
~€400 million
Planned Performance Products R&D expenditure in 2012: ~€400 million

BASF Presentation June 2012 11
Cetiol® RLF Light emollient for sensitive skin produced via an enzymatic process and solely derived from renewable feedstocks
L-Menthol New cost-effective and efficient production process for synthetic menthol used as an aroma ingredient Ecovio® FS Paper Biopolymer based on renewable resources to produce e.g. fully compostable drinking cups for hot and cold beverages
Irgaphor Red S 3620 CF High-performance organic pigment for an optimum contrast ratio in display applications
Rich R&D pipeline
Tinuvin® 1600 UV absorber for extremely demanding transparent outdoor plastic sheets, films and other thin-section applications
Multibore® Membrane Small-pore ultrafiltration membranes reliably remove suspended solids, bacteria, germs, viruses from polluted water

BASF Presentation June 2012
2
Formulation Additives
Further growth by capturing the full potential of our previous acquisitions
Market position
>10 5 Broad spectrum of
technologies with excellent market access to the coatings industry
Innovation power, deep formulation know-how, global production network & supply capability
Lubricant Solutions Mining Solutions Water Solutions
Market position
Leading provider of innovative chemical solutions to the Water industry worldwide
Bundling of membrane technology and chemical expertise
Market position Market position
n.a. >10 3 3 2 Unique position with
backwards integration, broad product portfolio and customer access
Synergies with fuel additives business to deliver superior fuel economy solutions
Globally strong position, esp. in Solid- Liquid Separation and Hydrometallurgy
Customer proximity with technical service
Promising R&D pipeline
2

BASF Presentation June 2012 13
BASF Performance Products: Today and into the future
Vision 2020 2011
13
Chemical industry leader to improve quality of life
Preferred partner for all performance & innovation driven customers
Comprehensive portfolio of value-adding and sustainable products and services
Earning a substantial premium on cost of capital every year in each division
Sales to 3rd parties € 15.7 billion
EBITDA bSI margin of 16.2%
Cognis integration cost of € 298 million
EBIT after cost of capital € - 119 million

BASF Presentation June 2012 14
This presentation includes forward-looking statements that are subject to risks and uncertainties, including those pertaining to the anticipated benefits to be realized from the proposals described herein. This presentation contains a number of forward-looking statements including, in particular, statements about future events, future financial performance, plans, strategies, expectations, prospects, competitive environment, regulation and supply and demand. BASF has based these forward-looking statements on its views with respect to future events and financial performance. Actual financial performance of the entities described herein could differ materially from that projected in the forward-looking statements due to the inherent uncertainty of estimates, forecasts and projections, and financial performance may be better or worse than anticipated. Given these uncertainties, readers should not put undue reliance on any forward-looking statements.
Forward-looking statements represent estimates and assumptions only as of the date that they were made. The information contained in this presentation is subject to change without notice and BASF does not undertake any duty to update the forward-looking statements, and the estimates and assumptions associated with them, except to the extent required by applicable laws and regulations.
Forward-looking statements

BASF Presentation June 2012 15
BASF Presentation June 2012 16
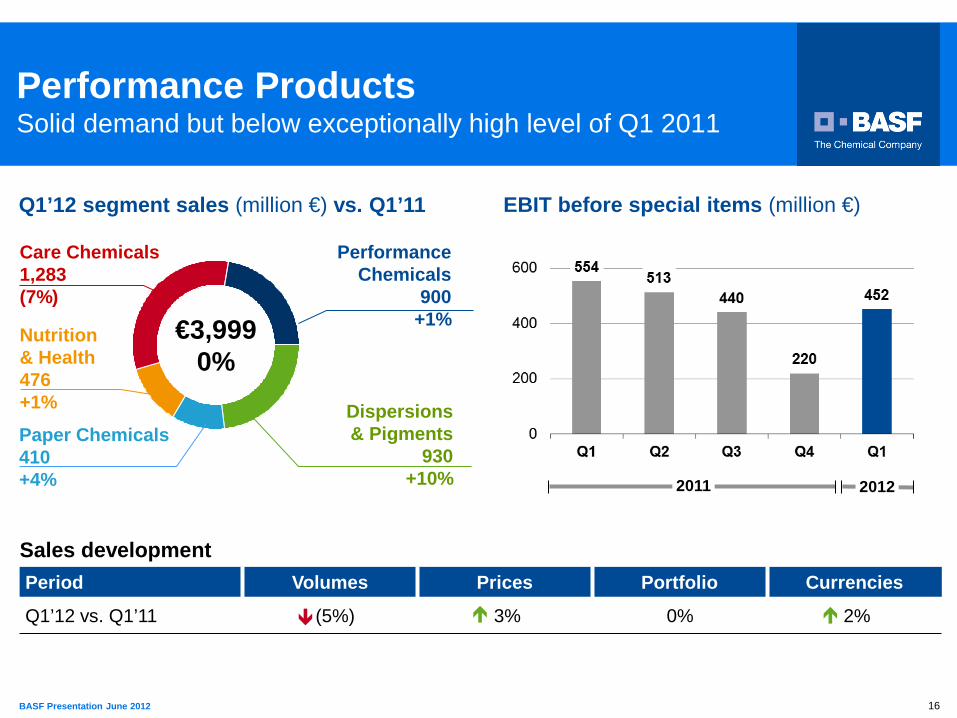
Performance Products Solid demand but below exceptionally high level of Q1 2011
Performance Chemicals
900 +1%
Care Chemicals 1,283 (7%)
€3,999 0%
Paper Chemicals 410 +4%
Q1’12 segment sales (million €) vs. Q1’11
Nutrition & Health 476 +1% Dispersions
& Pigments 930
+10%
EBIT before special items (million €)
2012 2011
Sales development Period Volumes Prices Portfolio Currencies
Q1’12 vs. Q1’11 (5%) 3% 0% 2%