Embed Size (px)
DESCRIPTION
WCU Students Who are our students and what they think about their campus experiences. New Faculty Orientation 12 August 2014 Dr. Idna M. Corbett Dean of Undergraduate Studies & Student Support Services. 1. WCU has how many undergrads…?. 10,000 – 12,000 12,000 – 14,000 - PowerPoint PPT Presentation
Citation preview

New Faculty Orientation12 August 2014
Dr. Idna M. Corbett Dean of Undergraduate Studies &
Student Support Services
WCU StudentsWho are our students and
what they think about their campus experiences

A. 10,000 – 12,000B. 12,000 – 14,000C. More than 15,000
1. WCU has how many undergrads…?

A. 12% MinorityB. 14% MinorityC. 16% Minority
2. How diverse is our UG student population?

A. 15% MinorityB. 17% MinorityC. 19% Minority
3. How diverse is our Grad student population?

Demographic DistributionTotal undergraduate enrollment for Fall semester
Some WCU Fast Facts
Overall 2010 2011 2012 2013
African-American
1,136 9.3% 1,246 9.7% 1,145 8.6%
1,248 9.1%
Latino 435 3.6% 549 4.3% 614 4.6%
636 4.6%
Asian 261 2.1% 277 2.2% 260 2.0%
292 2.1%
Caucasian
10,260
83.9% 10,648
83.0%
10,914
82.1%
11,138
81.2%
Other 142 1.2% 114 0.08%
368 2.7%
399 3%
TOTAL 12,234
12,834
13,301
13,713

Demographic DistributionTotal graduate enrollment for Fall semester
Graduate Students
Overall 2010 2011 2012 2013
African-American
197 8.7% 248 10.9%
236 11.2%
256 12%
Latino 51 2.3% 56 2.5% 57 2.7% 64 3%
Asian 60 2.7 94 4.1% 58 2.7% 57 2.7%
Caucasian 1,872
82.9%
1,846
81.5%
1,634
77.3%
1,642
77%
Other /Unknown
78 3.4% 22 1% 129 6.1% 115 5.3%
TOTAL 2,258
2,266
2,114
2,134

Out-of-State Students Active 478 20.3% of the class African American Students Active 295 13.4% of the class Hispanic Students Active 127 5.4% of the class
Special UG Populations - New

4. Transfer students represent about 45% of the undergrad student population.
5. More than 70% of WCU students are first generation college goers.
6. More than a third of WCU students are classified as low income.
7. 90% of incoming students expect to earn a B average or better.
True/False?

Spring 2013
Fall 2013
Enrolled/ Scheduled 561 1,263
The Incoming Transfer Students
Most popular majors:Biology PsychologyPre-Business Early and Middle GradesKinesiology NursingNutrition Pre-Major

First- to Second-Year Retention Rate (2013)
National ¤
Public Colleges*
Private Non-Profit
Pennsylvania
WCU
70 75 80 85 90
79.7
81.4
83.9
80.8
87.4
* CollegeMeasures.org¤ Education Trust

Regular Admission (FY1)
Academic Development Program – Act 101 (FY2)
Academic Development Program – Non-Act 101 (FY3)
Motivation (FY4)
FY Admit Types

WCU F1 F2 F3 F470
75
80
85
90
95
91.381.2
67.3 70.3
75.386.1
71.4
81.7
73.7
79.1
Second to Third Year Retention by Admit Type
ALLURM

Graduation
National PA Public PA Private WCU0
20
40
60
80
59.6 62.172.8 68.7
2013 Six-year Graduation Rate Overall

Graduation Rates by Race/EthnicityWCU
Black
Native Am
Asian
Latino
White
0 10 20 30 40 50 60 70 80
16.3
16.7
28.2
23.5
46.2
51.1
77.8
71.8
52.5
71.3
% Grad 6 Yrs % Grad 4 Yrs

First Generation College Goers
New Fall UG 2011 2012
Total FG % FG Total FG % FG
African American
193 93 48.2%
213 81 38.0%
Asian 29 8 27.6%
47 7 14.9%
Latino 164 62 37.8%
136 56 41.2%
White
1,844 407
22.1%
1,886
449 23.8%
Multi-racial 55 21 38.2%
47 14 29.8%
Total
2,292
593 25.9%
2,334
607 26.0%
Underrepresented minority students are more likely to be first-generation college students.
Year Undergraduate
Fall 2008 16.1%
Fall 2009 20.4%
Fall 2010 23.5%
Fall 2011 24.2%
Fall 2012 24.2%
Fall 2013 24.0%
Pell Recipients

Successis determined
by college experiencesas much as
pre-enrollment experiences
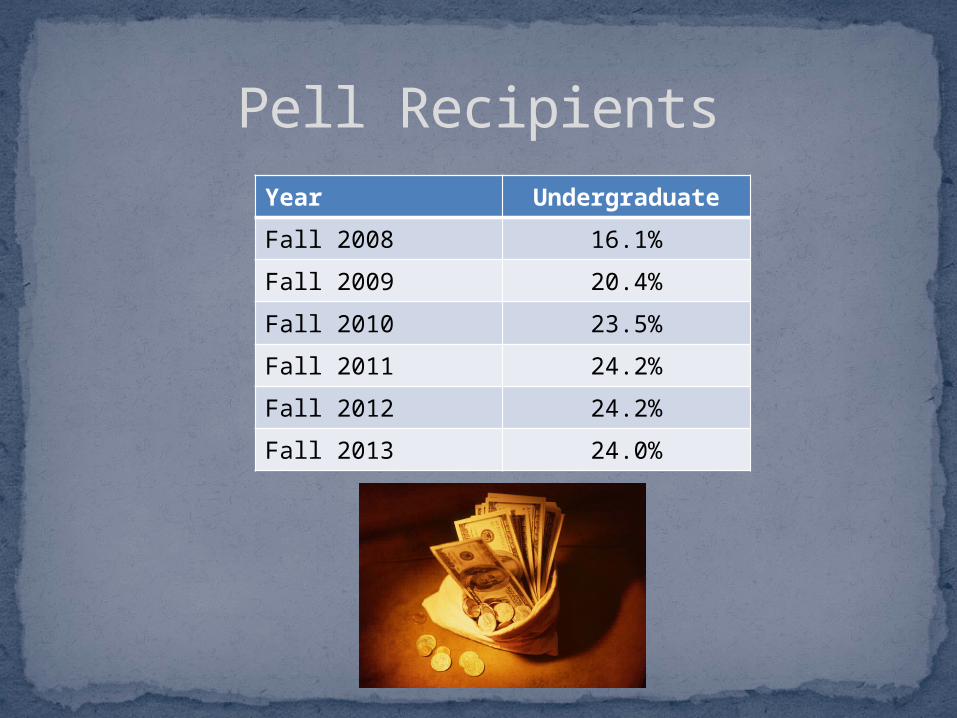
Intersection between low-income and first-generation status
4 times as likely to drop outPersistence, tenacity, high motivationIndependent and self-reliantLack the cultural and social capital

What can pass through the Green Glass Doors?

Once we know something… we find it hard to imagine not knowing it. Our knowledge has “cursed” us. We have difficulty sharing it with others, because we can’t readily re-create their state of mind. (Heath & Heath, 2006, Harvard Business Review)
What is common knowledge for faculty/staff, or current students, is a mystery for new students and particularly for LI/FG students.
Curse of Knowledge

May feel separated from family and friends in home community as a result of upward mobility and exposure to a new campus culture
May experience “impostor syndrome” or unwarranted feelings of inadequacy
They may see failure before it happensI’m ready for the fun of college!Have a glamorized perception of college“You Only Live Once”Not realize the effects on their future of decisions
they make now
Shock vs. Ecstasy

For FGCS, college is like giving someone a big bag with jigsaw puzzle pieces without giving
them the box with the picture.Dorothy Ward, UTEP
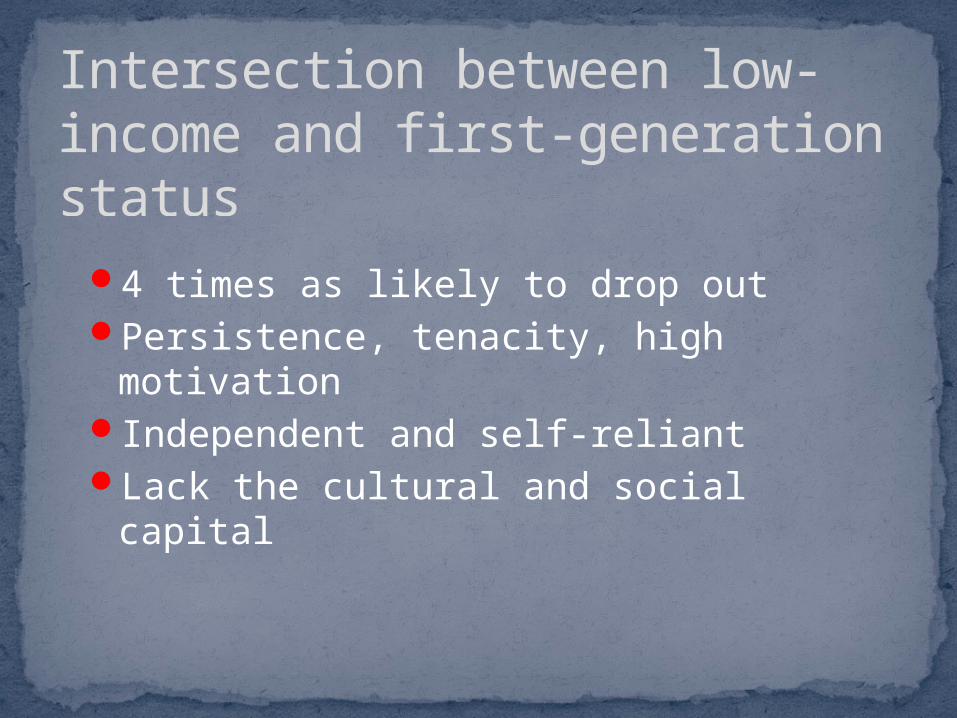
Reach out before help is neededRecognize the role of the classroom in
students’ campus lifeFind out if students are commutingInteract frequently in and out of class ― Say
more than “come to my office hours”Encourage students to collaborate and help each otherSupport students’ belief that they can learn
How can Faculty help?
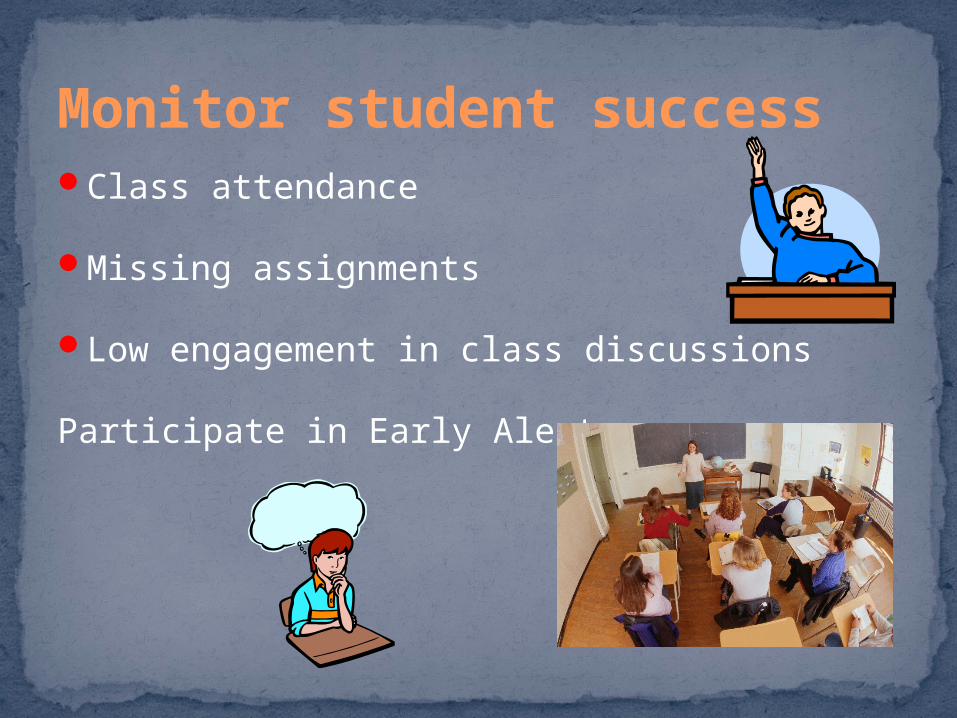
Class attendance
Missing assignments
Low engagement in class discussions
Participate in Early Alert
Monitor student success

Help students develop a sense of belongingRecognize that for some students being a
college student is not the most important role in their lives
Facilitate early connection to resourcesJoin the network of supportLearn to teach the students that you have, not
the students you wish you hadPractice…
AcceptanceEmpowermentAdvocacy

Two Related SurveysBeginning College Survey of
Student Engagement (BCSSE)First-year only, during orientation1,593 respondents
National Survey of Student Engagement (NSSE)First-year and seniors onlyResponse rate: FY 27%, Seniors
31%1,828 respondents

• Public 86%• Private, religiously-affiliated 12%• Private, independent 1%
BCSSE 2013
From what type of high school did you graduate?
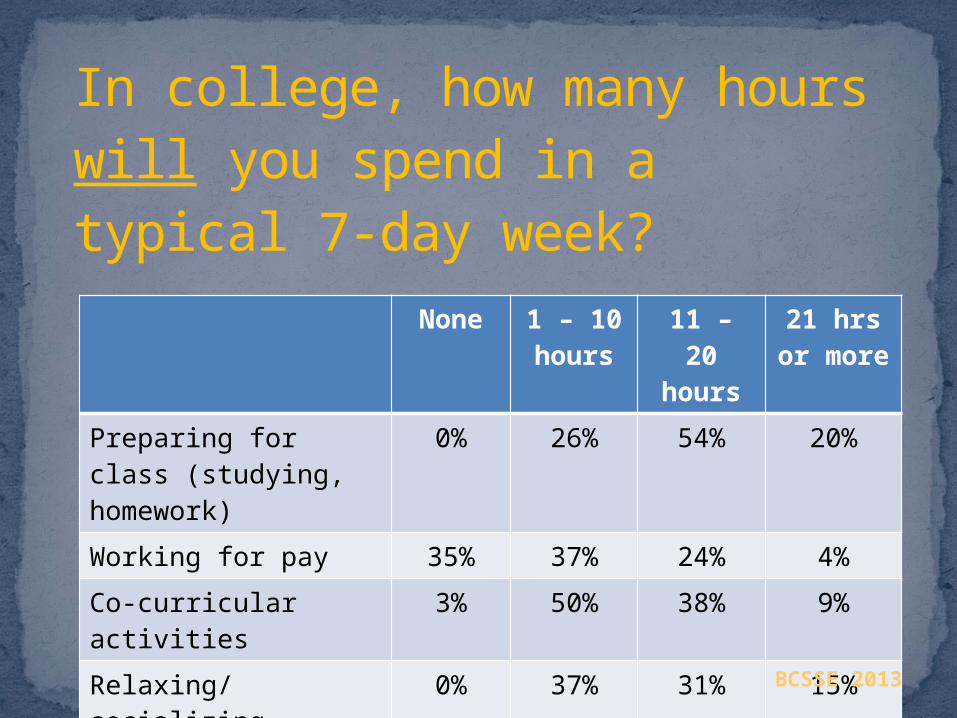
None 1 – 10 hours
11 – 20 hours
21 hrs or
more
Preparing for class (studying, homework)
0% 26% 54% 20%
Working for pay 35% 37% 24% 4%
Co-curricular activities
3% 50% 38% 9%
Relaxing/socializing 0% 37% 31% 15%
In college, how many hours will you spend in a typical 7-day week?
BCSSE 2013

Preparing for class11+ hr/wk FY 59% SY 58%
Working for pay off campus6+ hr/wk FY 25% SY 74%
Relaxing and socializing1-10 hr/wk FY 45% SY 52%16+ hr/wk FY 31% SY 25%
The majority of FY students (80%) and seniors (79%) say they spend “significant amounts of time studying and on academic work.”
Amount of time spent in
NSSE 2013
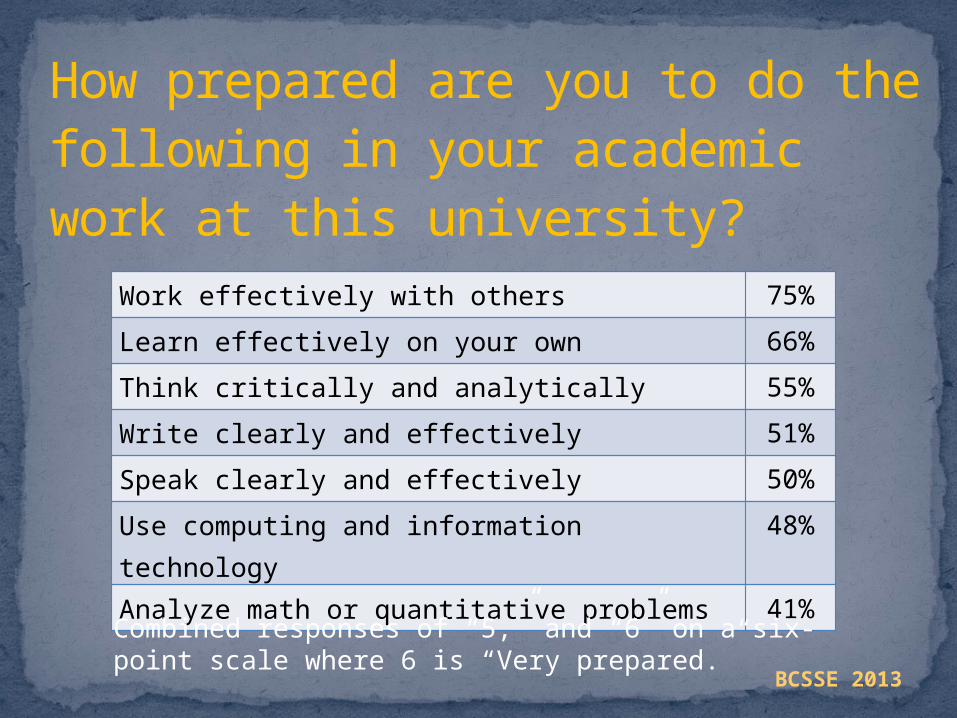
Work effectively with others 75%
Learn effectively on your own 66%
Think critically and analytically 55%
Write clearly and effectively 51%
Speak clearly and effectively 50%
Use computing and information technology 48%
Analyze math or quantitative problems 41%
How prepared are you to do the following in your academic work at this university?
Combined responses of “5,” and “6” on a six-point scale where 6 is “Very prepared.”
BCSSE 2013

Managing your time 44%
Paying college expenses 40%
Learning course material 28%
Interacting with faculty 10%
Making new friends 12%
Getting help with school work 10%
During the coming school year, how difficult do you expect the following to be?
Combined responses of “5,” and “6” on a six-point scale where 6 is “Very difficult.”
BCSSE 2013

C- or lower 0%
C 0%
C+ 1%
B- 4%
B 22%
B+ 31%
A- 28%
A 14%
What do you expect most of your grades will be at this university
during the coming year?(Select only one)
BCSSE 2013
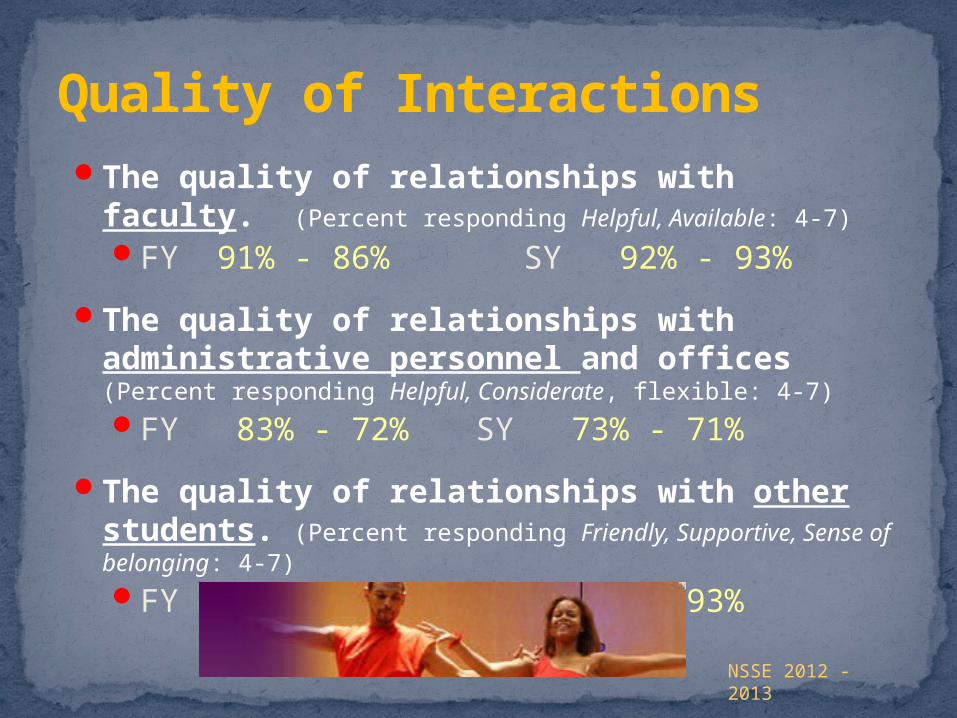
The quality of relationships with faculty. (Percent responding Helpful, Available: 4-7)FY 91% - 86% SY 92% - 93%
The quality of relationships with administrative personnel and offices (Percent responding Helpful, Considerate, flexible: 4-7)FY 83% - 72% SY 73% - 71%
The quality of relationships with other students. (Percent responding Friendly, Supportive, Sense of belonging: 4-7)FY 92% - 95% SY 93% - 93%
Quality of Interactions
NSSE 2012 - 2013

Progression toward a degreeChanged your major (at least once)
39% 36%
Delayed your graduation plans because courses were not available when needed (at least once)
31% 33%
2012 / 2013

Probably Yes Definitely YesFY – 45% 42%SY – 40% 45%
If you could start over again, would you go to the same institution you are now attending?
NSSE 2013