Embed Size (px)
Citation preview

2015-16 School Accountability Report Card for Waverly Elementary School Page 1 of 14
Waverly Elementary School
School Accountability Report Card
Reported Using Data from the 2015-16 School Year
Published During 2016-17
By February 1 of each year, every school in California is required by state law to publish a School Accountability Report Card (SARC). The SARC contains information about the condition and performance of each California public school. Under the Local Control Funding Formula (LCFF) all local educational agencies (LEAs) are required to prepare a Local Control and Accountability Plan (LCAP), which describes how they intend to meet annual school-specific goals for all pupils, with specific activities to address state and local priorities. Additionally, data reported in an LCAP is to be consistent with data reported in the SARC. • For more information about SARC requirements, see the California Department of Education (CDE) SARC Web page at
http://www.cde.ca.gov/ta/ac/sa/. • For more information about the LCFF or LCAP, see the CDE LCFF Web page at http://www.cde.ca.gov/fg/aa/lc/. • For additional information about the school, parents/guardians and community members should contact the school principal or
the district office. DataQuest DataQuest is an online data tool located on the CDE DataQuest Web page at http://dq.cde.ca.gov/dataquest/ that contains additional information about this school and comparisons of the school to the district and the county. Specifically, DataQuest is a dynamic system that provides reports for accountability (e.g., test data, enrollment, high school graduates, dropouts, course enrollments, staffing, and data regarding English learners). Internet Access Internet access is available at public libraries and other locations that are publicly accessible (e.g., the California State Library). Access to the Internet at libraries and public locations is generally provided on a first-come, first-served basis. Other use restrictions may include the hours of operation, the length of time that a workstation may be used (depending on availability), the types of software programs available on a workstation, and the ability to print documents.
About This School Contact Information (School Year 2016-17)
School Contact Information
School Name------- Waverly Elementary School
Street------- 3507 Wilmarth Rd.
City, State, Zip------- Stockton, CA 95215-1114
Phone Number------- 209-931-0735
Principal------- Jessica Riley
E-mail Address------- [email protected]
Web Site------- http://waverly.ca.lus.schoolinsites.com/
CDS Code 39 68577 6042006
2015-16 School Accountability Report Card for Waverly Elementary School Page 2 of 14
District Contact Information
District Name------- Linden Unified School District
Phone Number------- 209-887-3894
Superintendent-------
Rick Hall
E-mail Address------- [email protected]
Web Site------- www.lindenusd.com
School Description and Mission Statement (School Year 2016-17)
Waverly Elementary School is in the Linden Unified School District; a medium-sized rural district, which is a geographically isolated area in the Eastern agricultural belt of San Joaquin County, serving approximately 2,300 students in grades K - 12. There are six school sites in the district. Waverly Elementary is a Kindergarten through Eighth grade elementary school with an enrollment of roughly 335 students. Ethnically, Waverly is 1% African American, 1% American Indian/Alaskan Native, 5% Asian, 2% Filipino, 55% Hispanic, 0% Hawaiian/Pacific Islander, 2% Multiple and 33% White, as per CBED reporting. Special Categories of students include the following, Resource Specialist Program, Special Day Class, one Basic Skills class, Read 180 Program. Instructional Minutes for students are as follows: Kindergarten 315 instructional minutes, First through Third grades 305 instructional minutes, and Fourth through Eighth grades 330 instructional minutes. The teaching staff consists of 15 fully credentialed teachers, one librarian, one resource instructional aide, one special day class aide and one aide. MISSION STATEMENT: The Waverly community, which includes staff, parents, and students, shares a commitment to foster the development of the individual child, and to challenge students to maximize their potential to become lifelong learners, by providing a safe environment, in which students are learning basic skills and are developing self-esteem, and responsibility, thus preparing them to succeed in their school, community and the world. Student Enrollment by Grade Level (School Year 2015-16)
Grade Number of
Level Students
Kindergarten 25
Grade 1 23
Grade 2 38
Grade 3 42
Grade 4 31
Grade 5 45
Grade 6 44
Grade 7 42
Grade 8 43
Total Enrollment 333

2015-16 School Accountability Report Card for Waverly Elementary School Page 3 of 14
Student Enrollment by Group (School Year 2015-16)
Student Percent of
Group Total Enrollment
Black or African American 2.1
American Indian or Alaska Native 1.2
Asian 4.8
Filipino 1.8
Hispanic or Latino 54.7
Native Hawaiian or Pacific Islander 0
White 32.4
Two or More Races 3
Socioeconomically Disadvantaged 49.5
English Learners 18.3
Students with Disabilities 11.4
Foster Youth 0.9
A. Conditions of Learning
State Priority: Basic The SARC provides the following information relevant to the Basic State Priority (Priority 1): • Degree to which teachers are appropriately assigned and fully credentialed in the subject area and for the pupils they are
teaching; • Pupils have access to standards-aligned instructional materials; and • School facilities are maintained in good repair. Teacher Credentials
Teachers School District
2014-15 2015-16 2016-17 2016-17
With Full Credential 14 14 13
Without Full Credential 1 1 2
Teaching Outside Subject Area of Competence (with full credential) 0 0 0
Teacher Misassignments and Vacant Teacher Positions
Indicator 2014-15 2015-16 2016-17
Misassignments of Teachers of English Learners 0 0 0
Total Teacher Misassignments * 0 0 0
Vacant Teacher Positions 0 0 0 Note: “Misassignments” refers to the number of positions filled by teachers who lack legal authorization to teach that grade level, subject area, student group, etc. * Total Teacher Misassignments includes the number of Misassignments of Teachers of English Learners. Core Academic Classes Taught by Highly Qualified Teachers (School Year 2015-16)
Location of Classes Percent of Classes In Core Academic Subjects
Taught by Highly Qualified Teachers Not Taught by Highly Qualified Teachers
This School 100.0 0.0
All Schools in District 95.3 4.7
High-Poverty Schools in District 95.3 4.7
Low-Poverty Schools in District 0.0 0.0 Note: High-poverty schools are defined as those schools with student eligibility of approximately 40 percent or more in the free and reduced price meals program. Low-poverty schools are those with student eligibility of approximately 39 percent or less in the free and reduced price meals program.

2015-16 School Accountability Report Card for Waverly Elementary School Page 4 of 14
Quality, Currency, Availability of Textbooks and Instructional Materials (School Year 2016-17) Year and month in which data were collected: January 2017
Subject Textbooks and Instructional Materials/
Year of Adoption
From Most Recent
Adoption?
Percent of Students Lacking Own
Assigned Copy
Reading/Language Arts K - 2 Wonders - McGraw Hill - Adopted 2016 - 2017
3 - 5 Benchmark - BenchMark Education - Adopted 2016 - 2017
6 - 8 StudySync - McGraw Hill - Adopted 2016 - 2017
Yes 0
Mathematics K -5 Everyday Math- McGraw Hill - Published 2016 (Adopted 2014 - 2015) 6 - 8 California Math - McGraw Hill - Published 2016 (Adopted 2014 - 2015)
Yes 0
Science K-5: MacMillan/McGraw, (Adopted 4/18/2007)
6- 8 - Pearson-Prentice Hall, (Adopted 4/18/2007)
Yes 0
History-Social Science K-5- Houghton Mifflin; History/ Social Science, 2006 (Adopted 3/21/2006) 6 -8 - Holt, California Social Studies, 2006 (Adopted 3/21/2006)
0
Health Glencoe Health 6-12 (Adopted 2005) Yes 0
School Facility Conditions and Planned Improvements (Most Recent Year)
Waverly School site is in overall good condition for the age of the site. There are a couple of bathroom areas that are in need of updating. Some gutters need replacing and HVAC units need to be added once the boiler/chiller is removed from the site. School Facility Good Repair Status (Most Recent Year)
School Facility Good Repair Status (Most Recent Year) Year and month of the most recent FIT report: 12/21/2016
System Inspected Repair Status Repair Needed and
Action Taken or Planned Good Fair Poor
Systems: Gas Leaks, Mechanical/HVAC, Sewer
X MPR: Roof / Gutters need to be replaced Boiler / chiller needs to be replaced
Interior: Interior Surfaces X Upper Boys rest rooms: Tile floor needs to be replaced Upper girls Rest rooms: Tile floor needs to be replaced
Cleanliness: Overall Cleanliness, Pest/ Vermin Infestation
X
Electrical: Electrical X
Restrooms/Fountains: Restrooms, Sinks/ Fountains
X Bathrooms are dated but functional
Safety: Fire Safety, Hazardous Materials X

2015-16 School Accountability Report Card for Waverly Elementary School Page 5 of 14
School Facility Good Repair Status (Most Recent Year) Year and month of the most recent FIT report: 12/21/2016
System Inspected Repair Status Repair Needed and
Action Taken or Planned Good Fair Poor
Structural: Structural Damage, Roofs X MPR: Roof / Gutters need to be replaced Boiler / chiller needs to be replaced Rm 2: Roof needs new gutters Rm 3: Roof needs new gutters Rm 4: Roof needs new gutters Rm 5: Roof needs new gutters Teacher Lounge: Roof needs new gutter
External: Playground/School Grounds, Windows/ Doors/Gates/Fences
X Rm 23 Library: Play field has some low spots reported by site maintenance custodian.
Overall Facility Rating (Most Recent Year)
Year and month of the most recent FIT report: 12/21/2016
Overall Rating Exemplary Good Fair Poor
X
B. Pupil Outcomes State Priority: Pupil Achievement The SARC provides the following information relevant to the State priority: Pupil Achievement (Priority 4): • Statewide assessments (i.e., California Assessment of Student Performance and Progress [CAASPP] System, which includes the
Smarter Balanced Summative Assessments for students in the general education population and the California Alternate Assessments [CAAs] for English language arts/literacy [ELA] and mathematics given in grades three through eight and grade eleven. The CAAs have replaced the California Alternate Performance Assessment [CAPA] for ELA and mathematics, which were eliminated in 2015. Only eligible students may participate in the administration of the CAAs. CAA items are aligned with alternate achievement standards, which are linked with the Common Core State Standards [CCSS] for students with significant cognitive disabilities); and
• The percentage of students who have successfully completed courses that satisfy the requirements for entrance to the University of California and the California State University, or career technical education sequences or programs of study
CAASPP Test Results in English Language Arts/Literacy (ELA) and Mathematics for All Students
Subject
Percent of Students Meeting or Exceeding the State Standards (grades 3-8 and 11)
School District State
2014-15 2015-16 2014-15 2015-16 2014-15 2015-16
English Language Arts/Literacy 54 54 36 43 44 48
Mathematics 28 38 19 30 34 36 Note: Percentages are not calculated when the number of students tested is ten or less, either because the number of students in this category is too small for statistical accuracy or to protect student privacy.
2015-16 School Accountability Report Card for Waverly Elementary School Page 6 of 14
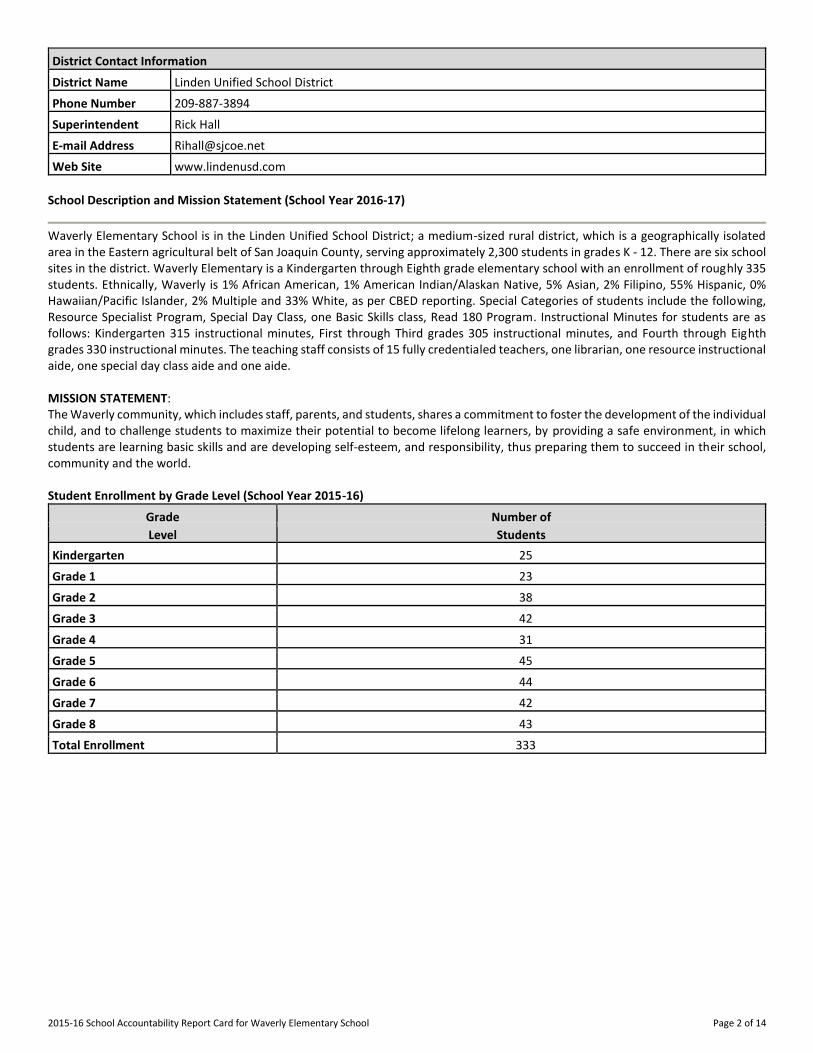
CAASPP Test Results in ELA by Student Group Grades Three through Eight and Grade Eleven (School Year 2015-16)
Student Group Grade
Number of Students Percent of Students
Enrolled Tested Tested Standard Met or
Exceeded
All Students 3 43 39 90.7 51.3
4 30 30 100.0 53.3
5 46 44 95.7 56.8
6 45 44 97.8 47.7
7 42 42 100.0 64.3
8 44 44 100.0 50.0
Male 3 25 22 88.0 59.1
4 18 18 100.0 55.6
5 26 25 96.2 40.0
6 27 26 96.3 42.3
7 17 17 100.0 52.9
8 23 23 100.0 30.4
Female 3 18 17 94.4 41.2
4 12 12 100.0 50.0
5 20 19 95.0 79.0
6 18 18 100.0 55.6
7 25 25 100.0 72.0
8 21 21 100.0 71.4
Black or African American 4 -- -- -- --
7 -- -- -- --
American Indian or Alaska Native 3 -- -- -- --
5 -- -- -- --
7 -- -- -- --
Asian 3 -- -- -- --
4 -- -- -- --
5 -- -- -- --
6 -- -- -- --
7 -- -- -- --
8 -- -- -- --
Filipino 5 -- -- -- --
6 -- -- -- --
7 -- -- -- --
8 -- -- -- --
Hispanic or Latino 3 23 22 95.7 27.3
4 18 18 100.0 50.0
5 28 28 100.0 53.6

2015-16 School Accountability Report Card for Waverly Elementary School Page 7 of 14
Student Group Grade
Number of Students Percent of Students
Enrolled Tested Tested Standard Met or
Exceeded
6 25 24 96.0 54.2
7 22 22 100.0 54.5
8 23 23 100.0 47.8
White 3 14 14 100.0 78.6
4 -- -- -- --
5 -- -- -- --
6 16 16 100.0 37.5
7 13 13 100.0 61.5
8 19 19 100.0 52.6
Two or More Races 4 -- -- -- --
5 -- -- -- --
6 -- -- -- --
7 -- -- -- --
Socioeconomically Disadvantaged 3 14 14 100.0 35.7
4 18 18 100.0 55.6
5 25 25 100.0 52.0
6 26 25 96.2 56.0
7 25 25 100.0 60.0
8 18 18 100.0 44.4
English Learners 3 -- -- -- --
4 -- -- -- --
5 -- -- -- --
6 -- -- -- --
7 -- -- -- --
8 -- -- -- --
Students with Disabilities 3 -- -- -- --
4 -- -- -- --
5 -- -- -- --
6 -- -- -- --
7 -- -- -- --
8 -- -- -- --
Students Receiving Migrant Education Services
4 -- -- -- --
6 -- -- -- --
Foster Youth 3 -- -- -- --
4 -- -- -- --
5 -- -- -- --
6 -- -- -- --
7 -- -- -- --

2015-16 School Accountability Report Card for Waverly Elementary School Page 8 of 14
Student Group Grade
Number of Students Percent of Students
Enrolled Tested Tested Standard Met or
Exceeded
8 -- -- -- --
Note: ELA test results include the Smarter Balanced Summative Assessment and the CAA. The “Percent Met or Exceeded” is calculated by taking the total number of students who met or exceeded the standard on the Smarter Balanced Summative Assessment plus the total number of students who met the standard on the CAAs divided by the total number of students who participated in both assessments. Double dashes (--) appear in the table when the number of students is ten or less, either because the number of students in this category is too small for statistical accuracy or to protect student privacy. Note: The number of students tested includes all students who participated in the test whether they received a score or not; however, the number of students tested is not the number that was used to calculate the achievement level percentages. The achievement level percentages are calculated using only students who received scores.
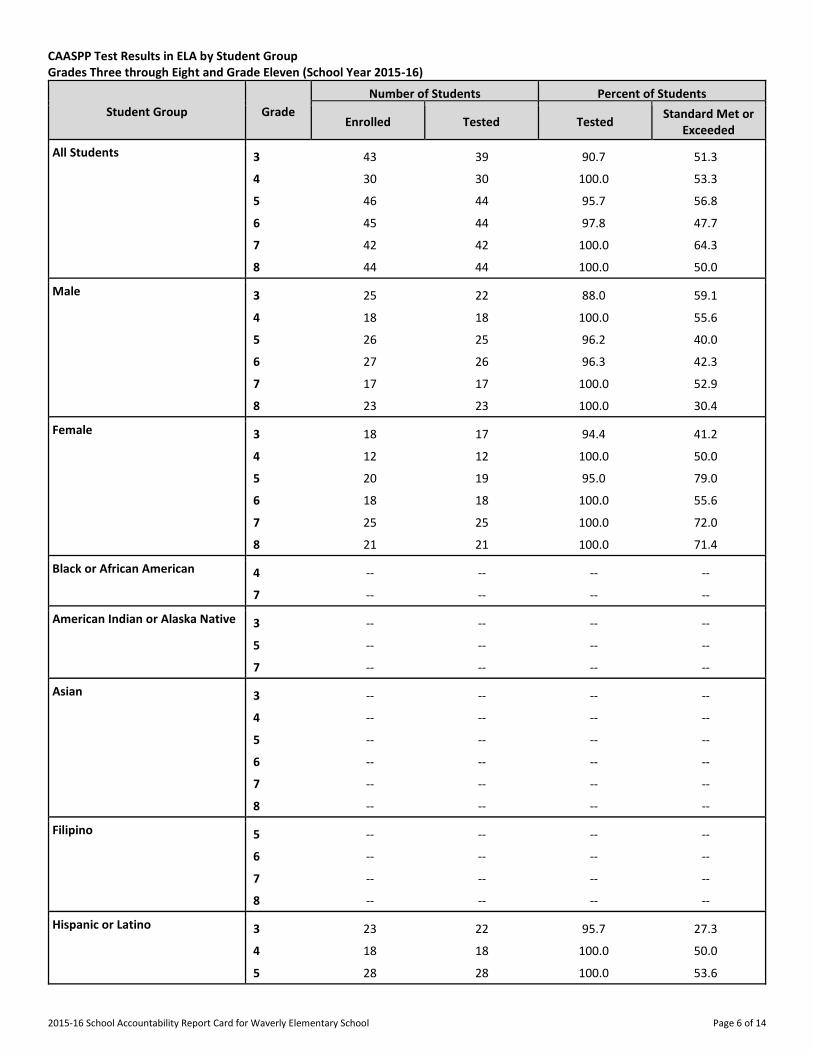
CAASPP Test Results in Mathematics by Student Group Grades Three through Eight and Grade Eleven (School Year 2015-16)
Student Group Grade
Number of Students Percent of Students
Enrolled Tested Tested Standard Met or
Exceeded
All Students 3 43 39 90.7 51.3
4 30 30 100.0 56.7
5 46 46 100.0 38.6
6 45 44 97.8 27.3
7 42 42 100.0 40.5
8 44 44 100.0 22.7
Male 3 25 22 88.0 59.1
4 18 18 100.0 72.2
5 26 26 100.0 32.0
6 27 26 96.3 26.9
7 17 17 100.0 47.1
8 23 23 100.0 13.0
Female 3 18 17 94.4 41.2
4 12 12 100.0 33.3
5 20 20 100.0 47.4
6 18 18 100.0 27.8
7 25 25 100.0 36.0
8 21 21 100.0 33.3
Black or African American 4 -- -- -- --
7 -- -- -- --
American Indian or Alaska Native 3 -- -- -- --
5 -- -- -- --
7 -- -- -- --
Asian 3 -- -- -- --
4 -- -- -- --
5 -- -- -- --
2015-16 School Accountability Report Card for Waverly Elementary School Page 9 of 14
Student Group Grade
Number of Students Percent of Students
Enrolled Tested Tested Standard Met or
Exceeded
6 -- -- -- --
7 -- -- -- --
8 -- -- -- --
Filipino 5 -- -- -- --
6 -- -- -- --
7 -- -- -- --
8 -- -- -- --
Hispanic or Latino 3 23 22 95.7 36.4
4 18 18 100.0 50.0
5 28 28 100.0 28.6
6 25 24 96.0 37.5
7 22 22 100.0 31.8
8 23 23 100.0 17.4
White 3 14 14 100.0 64.3
4 -- -- -- --
5 -- -- -- --
6 16 16 100.0 12.5
7 13 13 100.0 46.1
8 19 19 100.0 26.3
Two or More Races 4 -- -- -- --
5 -- -- -- --
6 -- -- -- --
7 -- -- -- --
Socioeconomically Disadvantaged 3 14 14 100.0 50.0
4 18 18 100.0 61.1
5 25 25 100.0 28.0
6 26 25 96.2 24.0
7 25 25 100.0 32.0
8 18 18 100.0 22.2
English Learners 3 -- -- -- --
4 -- -- -- --
5 -- -- -- --
6 -- -- -- --
7 -- -- -- --
8 -- -- -- --
Students with Disabilities 3 -- -- -- --
4 -- -- -- --
5 -- -- -- --

2015-16 School Accountability Report Card for Waverly Elementary School Page 10 of 14
Student Group Grade
Number of Students Percent of Students
Enrolled Tested Tested Standard Met or
Exceeded
6 -- -- -- --
7 -- -- -- --
8 -- -- -- --
Students Receiving Migrant Education Services
4 -- -- -- --
6 -- -- -- --
Foster Youth 3 -- -- -- --
4 -- -- -- --
5 -- -- -- --
6 -- -- -- --
7 -- -- -- --
8 -- -- -- --
Note: Mathematics test results include the Smarter Balanced Summative Assessment and the CAA. The “Percent Met or Exceeded” is calculated by taking the total number of students who met or exceeded the standard on the Smarter Balanced Summative Assessment plus the total number of students who met the standard on the CAAs divided by the total number of students who participated in both assessments. Double dashes (--) appear in the table when the number of students is ten or less, either because the number of students in this category is too small for statistical accuracy or to protect student privacy. Note: The number of students tested includes all students who participated in the test whether they received a score or not; however, the number of students tested is not the number that was used to calculate the achievement level percentages. The achievement level percentages are calculated using only students who received scores.
CAASPP Test Results in Science for All Students
Subject
Percent of Students Scoring at Proficient or Advanced (meeting or exceeding the state standards)
School District State
2013-14 2014-15 2015-16 2013-14 2014-15 2015-16 2013-14 2014-15 2015-16
Science (grades 5, 8, and 10) 73 57 48 57 49 50 60 56 54 Note: Science test results include California Standards Tests (CSTs), California Modified Assessment (CMA), and California Alternate Performance Assessment (CAPA) in grades five, eight, and ten. Note: Scores are not shown when the number of students tested is ten or less, either because the number of students in this category is too small for statistical accuracy or to protect student privacy.
2015-16 School Accountability Report Card for Waverly Elementary School Page 11 of 14
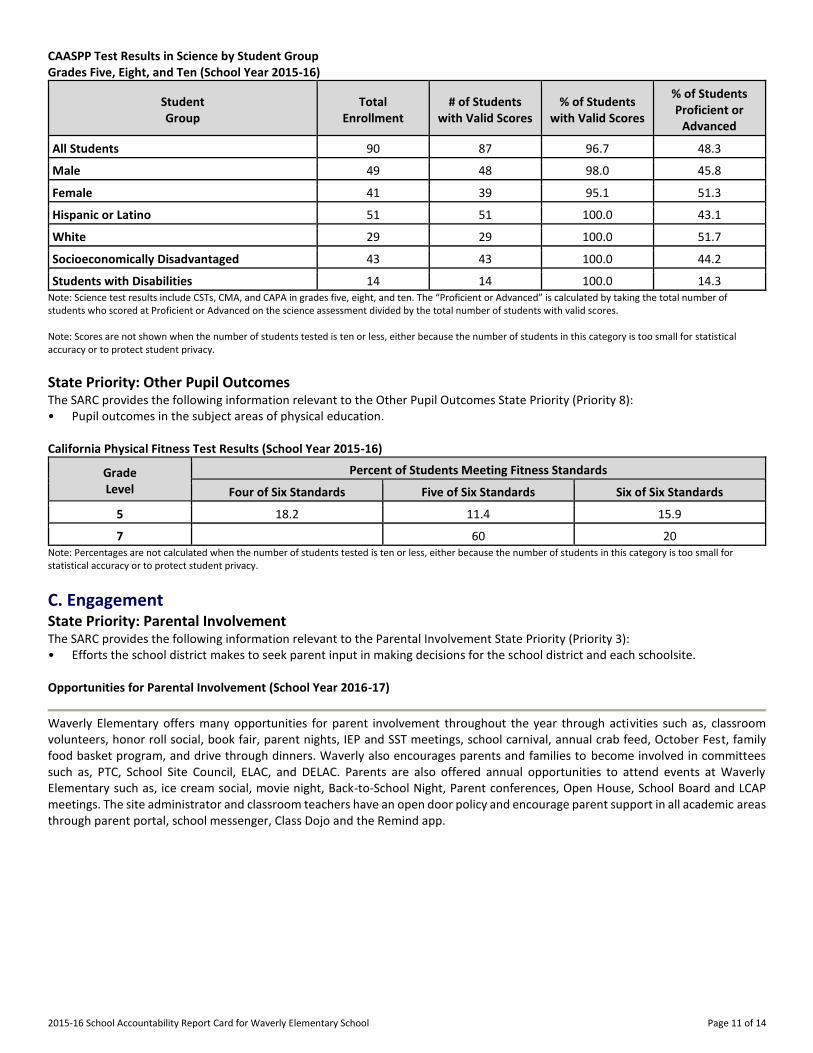
CAASPP Test Results in Science by Student Group Grades Five, Eight, and Ten (School Year 2015-16)
Student Group
Total Enrollment
# of Students with Valid Scores
% of Students with Valid Scores
% of Students Proficient or
Advanced
All Students 90 87 96.7 48.3
Male 49 48 98.0 45.8
Female 41 39 95.1 51.3
Hispanic or Latino 51 51 100.0 43.1
White 29 29 100.0 51.7
Socioeconomically Disadvantaged 43 43 100.0 44.2
Students with Disabilities 14 14 100.0 14.3 Note: Science test results include CSTs, CMA, and CAPA in grades five, eight, and ten. The “Proficient or Advanced” is calculated by taking the total number of students who scored at Proficient or Advanced on the science assessment divided by the total number of students with valid scores. Note: Scores are not shown when the number of students tested is ten or less, either because the number of students in this category is too small for statistical accuracy or to protect student privacy.
State Priority: Other Pupil Outcomes The SARC provides the following information relevant to the Other Pupil Outcomes State Priority (Priority 8): • Pupil outcomes in the subject areas of physical education. California Physical Fitness Test Results (School Year 2015-16)
Grade Level
Percent of Students Meeting Fitness Standards
Four of Six Standards Five of Six Standards Six of Six Standards
---5--- 18.2 11.4 15.9
---7--- 60 20 Note: Percentages are not calculated when the number of students tested is ten or less, either because the number of students in this category is too small for statistical accuracy or to protect student privacy.
C. Engagement State Priority: Parental Involvement The SARC provides the following information relevant to the Parental Involvement State Priority (Priority 3): • Efforts the school district makes to seek parent input in making decisions for the school district and each schoolsite. Opportunities for Parental Involvement (School Year 2016-17)
Waverly Elementary offers many opportunities for parent involvement throughout the year through activities such as, classroom volunteers, honor roll social, book fair, parent nights, IEP and SST meetings, school carnival, annual crab feed, October Fest, family food basket program, and drive through dinners. Waverly also encourages parents and families to become involved in committees such as, PTC, School Site Council, ELAC, and DELAC. Parents are also offered annual opportunities to attend events at Waverly Elementary such as, ice cream social, movie night, Back-to-School Night, Parent conferences, Open House, School Board and LCAP meetings. The site administrator and classroom teachers have an open door policy and encourage parent support in all academic areas through parent portal, school messenger, Class Dojo and the Remind app.

2015-16 School Accountability Report Card for Waverly Elementary School Page 12 of 14
State Priority: School Climate The SARC provides the following information relevant to the School Climate State Priority (Priority 6): • Pupil suspension rates; • Pupil expulsion rates; and • Other local measures on the sense of safety. Suspensions and Expulsions
Rate School District State
2013-14 2014-15 2015-16 2013-14 2014-15 2015-16 2013-14 2014-15 2015-16
Suspensions------- 6.1 2.8 6.5 5.0 6.7 6.1 4.4 3.8 3.7
Expulsions------- 0.0 0.0 0.0 0.0 0.4 0.3 0.1 0.1 0.1
School Safety Plan (School Year 2016-17)
Waverly Elementary strives to offer a safe and clean school campus, student and staff safety is a top priority. The Safety plan is a living document. The plan includes specific information about evacuation routes, drills and staff responsibilities. All staff members review the school safety procedures throughout the year. Safety signals and drills are practiced with the students on a regular basis. Each classroom has a safety backpack with emergency supplies and updated student emergency cards. Teachers carry these backpacks on field trips and during drills. Waverly provides supervision of students before, during and after school. The site is well maintained. Safety concerns are reported to the office and taken care of by site custodians, district maintenance crew, and/or the site administrator.
D. Other SARC Information The information in this section is required to be in the SARC but is not included in the state priorities for LCFF. Federal Intervention Program (School Year 2016-17)
Indicator School District
Program Improvement Status In PI
First Year of Program Improvement 2011-2012
Year in Program Improvement* Year 3
Number of Schools Currently in Program Improvement N/A 2
Percent of Schools Currently in Program Improvement N/A 66.7 Note: Cells with N/A values do not require data.
Average Class Size and Class Size Distribution (Elementary)
Grade Level
2013-14 2014-15 2015-16
Avg. Class Size
Number of Classes Avg. Class Size
Number of Classes Avg. Class Size
Number of Classes
1-20 21-32 33+ 1-20 21-32 33+ 1-20 21-32 33+
K
26 2 23 1 26 1
1
30 1 28 1 28 1
2
28 1 27 2 27 1
3
20 1 1 29 1 22 2
4
34 6 27 1 5 25 1 1
5
34 5 22 5 5 24 1 1
6
28 1 6 30 1 5 34 1 Number of classes indicates how many classes fall into each size category (a range of total students per class).

2015-16 School Accountability Report Card for Waverly Elementary School Page 13 of 14
Average Class Size and Class Size Distribution (Secondary)
Subject
2013-14 2014-15 2015-16
Avg. Class Size
Number of Classrooms Avg. Class Size
Number of Classrooms Avg. Class Size
Number of Classrooms
1-22 23-32 33+ 1-22 23-32 33+ 1-22 23-32 33+
English------- ----------
Mathematics ----------
17 1 1
Science------- ----------
19 2 2 20 2 2 20 2 2
Social Science ----------
25 1 2 27 1 2 27 1 2 Note: Number of classes indicates how many classrooms fall into each size category (a range of total students per classroom). At the secondary school level, this information is reported by subject area rather than grade level. Academic Counselors and Other Support Staff (School Year 2015-16)
Title Number of FTE
Assigned to School Average Number of Students per
Academic Counselor
Academic Counselor------- 1
Counselor (Social/Behavioral or Career Development) 0 N/A
Library Media Teacher (Librarian) 0 N/A
Library Media Services Staff (Paraprofessional) 0 N/A
Psychologist------- .5 N/A
Social Worker------- 0 N/A
Nurse------- 0 N/A
Speech/Language/Hearing Specialist .5 N/A
Resource Specialist------- 1 N/A
Other------- 0 N/A Note: Cells with N/A values do not require data. *One Full Time Equivalent (FTE) equals one staff member working full time; one FTE could also represent two staff members who each work 50 percent of full time.
Expenditures per Pupil and School Site Teacher Salaries (Fiscal Year 2014-15)
Level
Expenditures Per Pupil Average Teacher Salary Total
Supplemental/ Restricted
Basic/ Unrestricted
School Site------- 5,738 1,686 4,052 $63,726
District------- N/A N/A 3885 $65,134
Percent Difference: School Site and District N/A N/A 4.3 -2.2
State------- N/A N/A $5,677 $67,348
Percent Difference: School Site and State N/A N/A -28.6 -5.4 Note: Cells with N/A values do not require data.
Types of Services Funded (Fiscal Year 2015-16)
Waverly School provides a base program in accordance of the Williams Act. Additional support comes through professional development opportunities and intervention services through READ 180/System 44, Resource, SDC, Linden Success Shop and Extended Learning Program.
2015-16 School Accountability Report Card for Waverly Elementary School Page 14 of 14
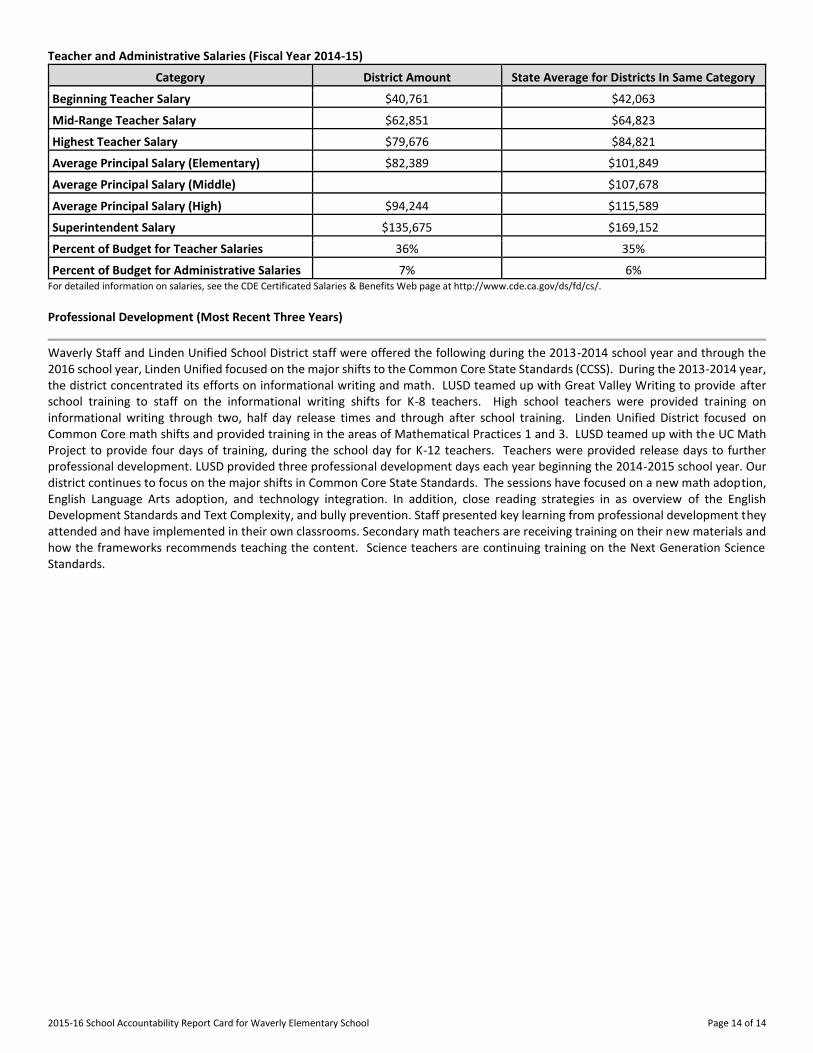
Teacher and Administrative Salaries (Fiscal Year 2014-15)
Category District Amount State Average for Districts In Same Category
Beginning Teacher Salary $40,761 $42,063
Mid-Range Teacher Salary $62,851 $64,823
Highest Teacher Salary $79,676 $84,821
Average Principal Salary (Elementary) $82,389 $101,849
Average Principal Salary (Middle) $107,678
Average Principal Salary (High) $94,244 $115,589
Superintendent Salary $135,675 $169,152
Percent of Budget for Teacher Salaries 36% 35%
Percent of Budget for Administrative Salaries 7% 6% For detailed information on salaries, see the CDE Certificated Salaries & Benefits Web page at http://www.cde.ca.gov/ds/fd/cs/. Professional Development (Most Recent Three Years)
Waverly Staff and Linden Unified School District staff were offered the following during the 2013-2014 school year and through the 2016 school year, Linden Unified focused on the major shifts to the Common Core State Standards (CCSS). During the 2013-2014 year, the district concentrated its efforts on informational writing and math. LUSD teamed up with Great Valley Writing to provide after school training to staff on the informational writing shifts for K-8 teachers. High school teachers were provided training on informational writing through two, half day release times and through after school training. Linden Unified District focused on Common Core math shifts and provided training in the areas of Mathematical Practices 1 and 3. LUSD teamed up with the UC Math Project to provide four days of training, during the school day for K-12 teachers. Teachers were provided release days to further professional development. LUSD provided three professional development days each year beginning the 2014-2015 school year. Our district continues to focus on the major shifts in Common Core State Standards. The sessions have focused on a new math adoption, English Language Arts adoption, and technology integration. In addition, close reading strategies in as overview of the English Development Standards and Text Complexity, and bully prevention. Staff presented key learning from professional development they attended and have implemented in their own classrooms. Secondary math teachers are receiving training on their new materials and how the frameworks recommends teaching the content. Science teachers are continuing training on the Next Generation Science Standards.