Embed Size (px)
Citation preview

International Journal of Geophysics and Geochemistry
2018; 5(1): 1-8
http://www.aascit.org/journal/ijgg
ISSN: 2381-1099 (Print); ISSN: 2381-1102 (Online)
Keywords Wavelet Transform,
Semblance Analysis,
Earth’s Magnetic Field,
Periodicity
Received: December 15, 2016
Accepted: January 16, 2018
Published: January 25, 2018
Wavelet Based Semblance Analysis
Ramachandran Nair Jayapal1,
Chakkalayil Parameswaran Anilkumar2, Chandu Venugopal
3, *
1Department of Physics, D B College, Thalayolapparambu, Kottayam, Kerala, India 2Equatorial Geophysical Research Laboratory, Indian Institute of Geomagnetism, Krishnapuram,
Tirunelveli, Tamil Nadu, India 3School of Pure & Applied Physics, Mahatma Gandhi University, Priyadarshini Hills, Kottayam,
Kerala, India
Email address [email protected] (C. Venugopal) *Corresponding author
Citation Ramachandran Nair Jayapal, Chakkalayil Parameswaran Anilkumar, Chandu Venugopal. Wavelet
Based Semblance Analysis. International Journal of Geophysics and Geochemistry.
Vol. 5, No. 1, 2018, pp. 1-8.
Abstract Wavelet analysis is a tool for analyzing localized variations of power within a time series.
By decomposing a time series into time-frequency space, the wavelet transform has been
used in a variety of fields and was found advantageous compared to the conventional tools
like Fourier analysis for a time series. Wavelet based semblance analysis compares two
time series on the basis of their phase as a function of frequency. Based on the wavelet
transform, an efficient methodology for measuring the periodicity of a time series of the
Earth’s magnetic field observed over the Indian subcontinent is presented in this paper.
1. Introduction
The magnetic field and its secular variations observed on the Earth’s surface are a
complex function of space and time. The identification of regular patterns in the
geomagnetic field relies not only on the acquisition of new experimental data but also on
the application of more effective methods of analysis [1]. Fourier analysis has been
widely used to interpret the observational results of atmospheric waves in the middle
atmosphere, assuming these are monochromatic waves. When a data series includes
different kinds of localized or intermittent frequencies, the Fourier spectrum is usually a
complex mixture which is difficult to interpret. The wavelet transform is an alternative to
the Fourier transform and can be used to analyze time series that contain non-stationary
power at different frequencies [2].
Wavelet transform began to be used in geophysics since the early 1980s for the
analysis of seismic signals. In geophysics, the power of wavelets for analysis of non
stationary processes that contain multi scale features, detection of singularities, analysis
of transient phenomena and signal compression is being exploited for the study of
several mechanisms. Wavelet analysis is becoming a common tool for analyzing
localized variations of power within a time series. By decomposing a time-series in to
time- frequency space, one is able to determine both the dominant modes of variability
and how those modes vary in time [3].
Wavelet analysis has also been applied to many areas of signal processing. It localizes
spectral information (unlike Fourier analysis), which makes it especially suitable for the
analysis of non stationary features [4]. Wavelet analysis is often very effective because it
provides a simple approach for dealing with local aspects of a signal [5]. With the help
of wavelet analysis we could bring out more details about the periodicity of daily

2 Ramachandran Nair Jayapal et al.: Wavelet Based Semblance Analysis
variations in the geomagnetic field. The fundamental purpose
of wavelet analysis outlined here is to identify the periodic
events in the geomagnetic time-series that were analyzed. We
use semblance analysis for this purpose.
Semblance is a measure of the cross correlation of two
datasets. It is frequently useful to be able to compare
different data sets to see what they have in common and
where they differ. One method of comparing two data sets is
semblance analysis. The semblance S is the cosine of the
difference between the Fourier phase angles of the two data
sets, at each frequency f. It can take values from -1 to +1,
where a value of +1 implies perfect phase correlation, 0
implies no correlation, and -1 implies perfect anti- correlation
[6]. In this paper, we compare the daily variation of Earth’s
horizontal intensity of magnetic field at different places in
India to get information about the periodicities. These are
verified using the MATLAB tool box.
2. Semblance Analysis Using the
Wavelet Transform
The wavelet transform method gives detailed information
on the time localization of each frequency component. In this
work, the wavelet technique is utilized to study the presence
of periodicities in the Earths horizontal intensity of magnetic
field. The wavelet transform is a powerful tool for the
analysis of non-stationary data sets. It can also use a variety
of basis functions whose mathematical properties can be
chosen depending on the data to be processed. The cross
wavelet transform between two datasets is defined as
CWT1,2=CWT1.CWT2
where CWT1 and CWT2 are the continuous wavelet transforms
of datasets 1 and 2 respectively. The cross wavelet transform is
a complex quantity having an amplitude given by [7]
A = CWT1,2
and local phase θ
θ = tan-1(J (CW1,2) / R (CW1,2))
where R and J indicate the real and imaginary parts.
Semblance is then defined as
S = Cosn(θ)
3. Data
In this work we use the data published by the Indian
Institute of Geomagnetism, Mumbai, for the horizontal
component of earth’s magnetic field at 1 hour intervals from
January to December, 2002 for the stations Alibag
(Geographic latitude = N'0 3718 , Geographic longitude =
0 '72 52 E Geomagnetic latitude = 010.02 N and denoted by
ABG), Ettaiyapuram ( 0 '09 10 N , 0 '78 01 E , 00.13 N , ETT),
Hyderabad ( 0 '17 25 N , 0 '78 33 E , 08.29 N , HYD), Sabhawala
( 0 '30 22 N , 0 '77 48 E , 021.25 N , SAB) and Visakhapatnam
( 0 '17 41 N , 0 '83 19 E , 08.17 N , VIS) spanning almost the
entire country. The data consists of hourly values of the H-
component with, obviously, 24 values for a day; these form the
raw data for the wavelet analysis. Wavelet based semblance
analysis was done for the pair of stations ABG-VIS, ETT-TVI
and SAB-TVI for the months January, April and June coming
respectively in D season (December solstice), E season
(Equinoctial months) and J season (June solstice) [8].
4. Results
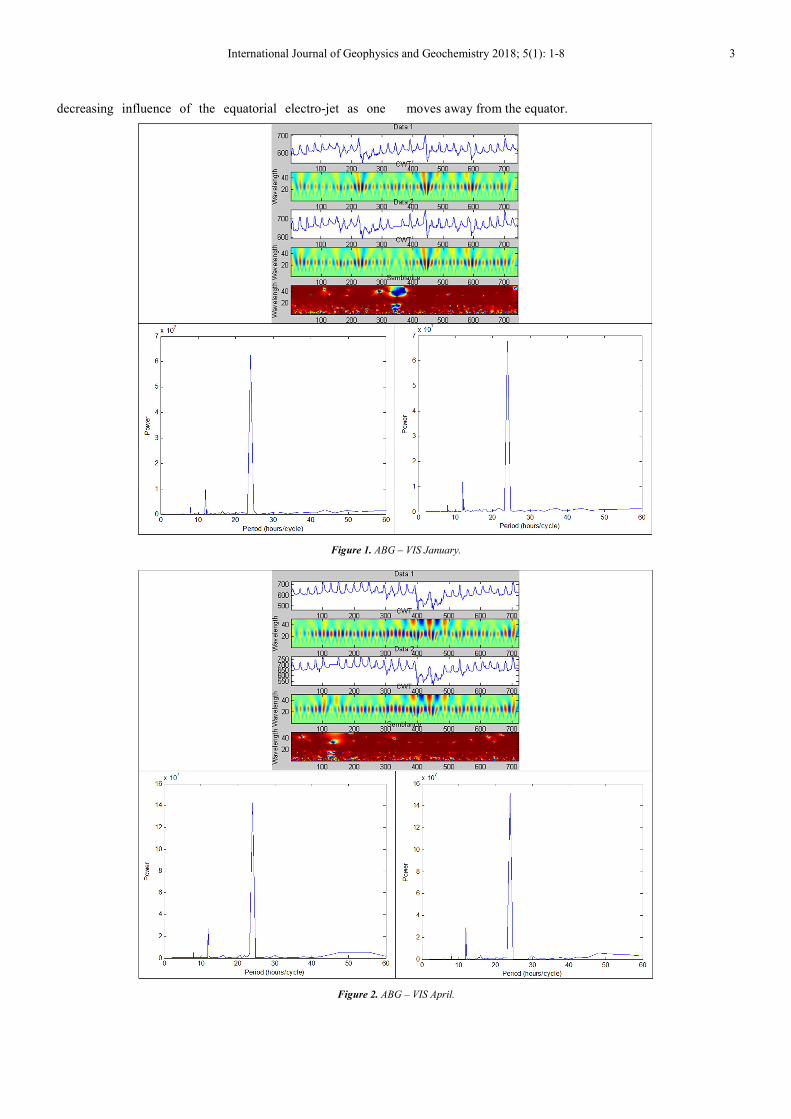
In Figure 1 Data 1 are the H- values of ABG for the month
of January and Data 2 are the same for Visakhapatnam.
Below Data 1 and Data 2, real part of the complex CWT of
the data set is shown. White (bright red in color version)
indicate a large positive amplitude and black (dark blue)
indicate a large negative amplitude. It is seen that alternate
white and black spots are seen at 24 units indicating a 24
hour periodicity in data 1 and data 2. Bottom Panel shows
power spectrum of ABG (left) and VIS (right). There is
strong evidence for 24 hour periodicity. The small peak
indicates a 12 hour periodicity also. Figures 2 and 3 are
similar plots respectively for the months April and June for
the same pair of stations ABG-VIS. In all the three cases 24
hour and 12 hour periodicities of the data can be seen.
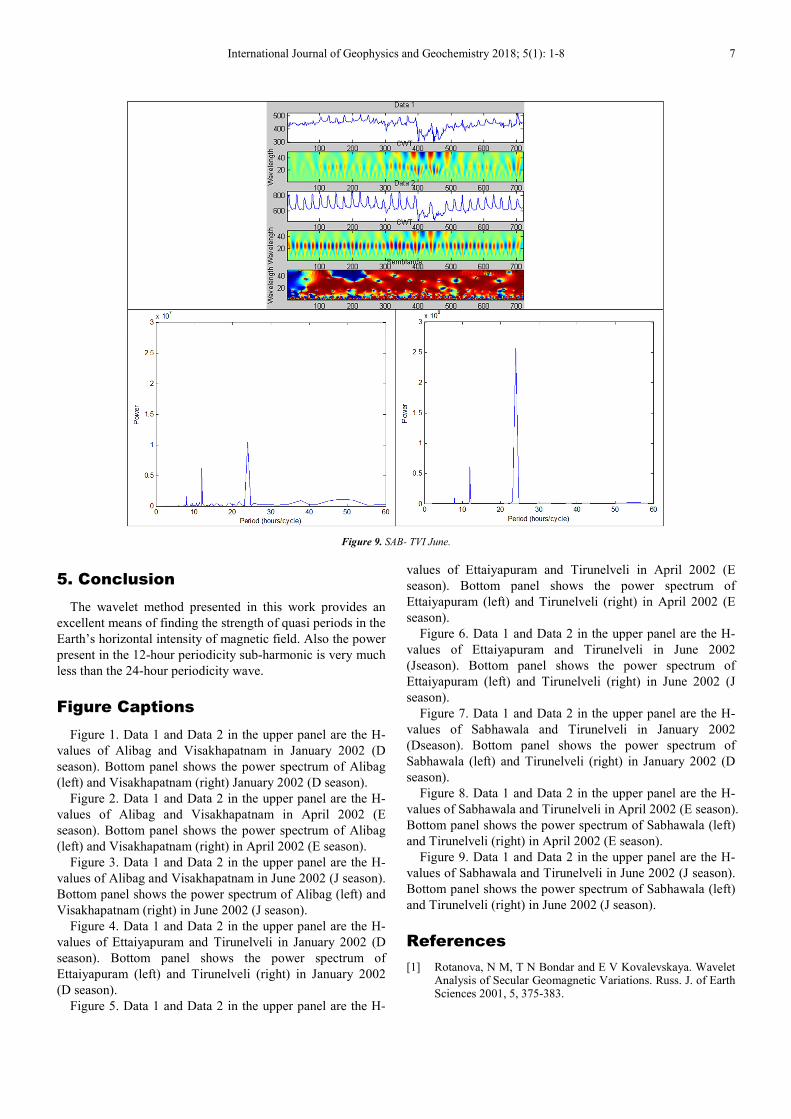
Similar figures are drawn for the pair of stations ETT-TVI
(Figures 4-6) and SAB-TVI (Figures 7-9). In all the cases the 24
hour and 12 hour periodicities can be seen. From this we can
conclude that the horizontal intensity of magnetic field varies
with a 24 hour periodicity. This 24 – hour periodicity was
observed earlier by Fourier analysis [9]. In addition we have, in
this study, confirmed the existence of a 12 hour periodicity also.
As is evident from the Figures, the power in the 12 - hour
peaks are almost an order of magnitude smaller than the
power in the 24 - hour peaks. Also the power in the 24 - hour
peaks at the equatorial stations Ettaiyapuram and Tirunelveli,
are much greater than the power in the peaks for the off
equatorial stations Alibag, Visakhapatnam and Sabhawala.
The movement of conductive air across the lines of the
earth’s magnetic field is responsible for the daily variations
of the geomagnetic field. However, lunar and solar tides have
also been proposed as the cause for the movement of air in
the upper atmosphere [10, 11]. This, in turn, has been
associated with the dynamo current in the E-region of the
earth’s ionosphere. Due to the presence of a non-conducting
layer, the strong vertical polarization field opposes the
downward flow of electric current. This field gives rise to an
intense Hall current, popularly known as the equatorial
electro-jet (EEJ) [12]. The EEJ flows along the dip equator in
the E-region of the ionosphere, within a latitudinal region of o
3± , and is responsible for variations of the earth’s
magnetic field. As indicted above the power present in the
12-hour periodicities at the equatorial stations were much
greater than the off-equatorial ones. This could be due to the
International Journal of Geophysics and Geochemistry 2018; 5(1): 1-8 3
decreasing influence of the equatorial electro-jet as one moves away from the equator.
Figure 1. ABG – VIS January.
Figure 2. ABG – VIS April.

4 Ramachandran Nair Jayapal et al.: Wavelet Based Semblance Analysis
Figure 3. ABG – VIS June.
Figure 4. ETT- TVI January.

International Journal of Geophysics and Geochemistry 2018; 5(1): 1-8 5
Figure 5. ETT- TVI April.
Figure 6. ETT- TVI June.

6 Ramachandran Nair Jayapal et al.: Wavelet Based Semblance Analysis
Figure 7. SAB- TVI January.
Figure 8. SAB- TVI April.
International Journal of Geophysics and Geochemistry 2018; 5(1): 1-8 7
Figure 9. SAB- TVI June.
5. Conclusion
The wavelet method presented in this work provides an
excellent means of finding the strength of quasi periods in the
Earth’s horizontal intensity of magnetic field. Also the power
present in the 12-hour periodicity sub-harmonic is very much
less than the 24-hour periodicity wave.
Figure Captions
Figure 1. Data 1 and Data 2 in the upper panel are the H-
values of Alibag and Visakhapatnam in January 2002 (D
season). Bottom panel shows the power spectrum of Alibag
(left) and Visakhapatnam (right) January 2002 (D season).
Figure 2. Data 1 and Data 2 in the upper panel are the H-
values of Alibag and Visakhapatnam in April 2002 (E
season). Bottom panel shows the power spectrum of Alibag
(left) and Visakhapatnam (right) in April 2002 (E season).
Figure 3. Data 1 and Data 2 in the upper panel are the H-
values of Alibag and Visakhapatnam in June 2002 (J season).
Bottom panel shows the power spectrum of Alibag (left) and
Visakhapatnam (right) in June 2002 (J season).
Figure 4. Data 1 and Data 2 in the upper panel are the H-
values of Ettaiyapuram and Tirunelveli in January 2002 (D
season). Bottom panel shows the power spectrum of
Ettaiyapuram (left) and Tirunelveli (right) in January 2002
(D season).
Figure 5. Data 1 and Data 2 in the upper panel are the H-
values of Ettaiyapuram and Tirunelveli in April 2002 (E
season). Bottom panel shows the power spectrum of
Ettaiyapuram (left) and Tirunelveli (right) in April 2002 (E
season).
Figure 6. Data 1 and Data 2 in the upper panel are the H-
values of Ettaiyapuram and Tirunelveli in June 2002
(Jseason). Bottom panel shows the power spectrum of
Ettaiyapuram (left) and Tirunelveli (right) in June 2002 (J
season).
Figure 7. Data 1 and Data 2 in the upper panel are the H-
values of Sabhawala and Tirunelveli in January 2002
(Dseason). Bottom panel shows the power spectrum of
Sabhawala (left) and Tirunelveli (right) in January 2002 (D
season).
Figure 8. Data 1 and Data 2 in the upper panel are the H-
values of Sabhawala and Tirunelveli in April 2002 (E season).
Bottom panel shows the power spectrum of Sabhawala (left)
and Tirunelveli (right) in April 2002 (E season).
Figure 9. Data 1 and Data 2 in the upper panel are the H-
values of Sabhawala and Tirunelveli in June 2002 (J season).
Bottom panel shows the power spectrum of Sabhawala (left)
and Tirunelveli (right) in June 2002 (J season).
References
[1] Rotanova, N M, T N Bondar and E V Kovalevskaya. Wavelet Analysis of Secular Geomagnetic Variations. Russ. J. of Earth Sciences 2001, 5, 375-383.

8 Ramachandran Nair Jayapal et al.: Wavelet Based Semblance Analysis
[2] Molly Issac, G Renuka and C Venugopal. Wavelet Analysis of Long Period Oscillations in Geomagnetic Field over the Magnetic Equator. J. Atmos. and Solar Terr. Phys., 2004, 66, 919-925.
[3] Torrence C and G P Compo. A Practical Guide to Wavelet Analysis. Bull. Am. Meteor. Soc. 1998, 79, 61-78.
[4] Gordon Cooper, Maria Kubik and Kurt Kubik, Wavelet based Raman Spectra Comparison. Chemmometrics and Intelligent Laboratory Systems, 2011, 107, 65-68.
[5] James S Walker, Fourier Analysis and Wavelet Analysis. Notices of the AMS, 1997, 44, 658-670.
[6] G R J Cooper, Wavelet based Semblance Filtering. Computers and Geosciences, 2009, 35, 1988-1991.
[7] Cooper G R J and D R Cowan, Comparing Time Series using Wavelet-based Semblance Analysis. Computers and Geosciences, 2008, 34, 95-102.
[8] Arora B R, D R K Rao D R K and N S Sastri. Geomagnetic Solar and Lunar Daily Variations at Alibag, India, 1984, Pure and Applied Geophysics (PAGEOPH), 122, 89-109.
[9] Jayapal R, Shenu Gopal, C P Anilkumar and Chandu Venugopal. A Regional Geomagnetic Model using Fourier Analysis. Intl. Res. J. Nat. Appl. Sci. 2016, 3, 1-13.
[10] Schruster A. The diurnal variation of terrestrial magnetism. Philos. Trans. Roy. Soc. London A. 1908, 208, 163-204.
[11] Chapman S. The solar and lunar diurnal variation of terrestrial magnetism. Philos. Trans. Roy. Soc. London A. 1919, 218, 1-118.
[12] Chapman S. The equatorial electrojet as detected from the abnormal current distribution above Huancayo and elsewhere. Arch. Meteor. Geophys. Bioclimatol. A. 1951, 4, 368-392.