Embed Size (px)
Citation preview
Watts Bar Unit 2 StartupSimulations with VERA
John RitchieTennessee Valley Authority
Andrew GodfreyOak Ridge National Laboratory
Joint IC/SC MeetingOak Ridge National LaboratoryOctober 11, 2016
2
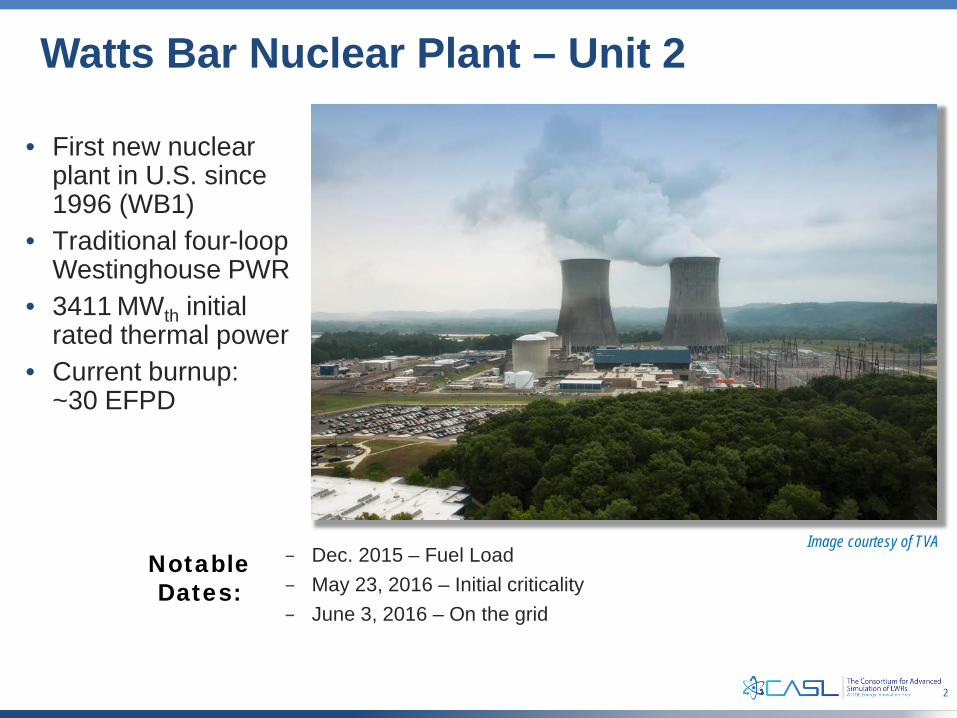
– Dec. 2015 – Fuel Load– May 23, 2016 – Initial criticality– June 3, 2016 – On the grid
Watts Bar Nuclear Plant – Unit 2
• First new nuclear plant in U.S. since 1996 (WB1)
• Traditional four-loop Westinghouse PWR
• 3411 MWth initial rated thermal power
• Current burnup: ~30 EFPD
Image courtesy of TVANotable Dates:
3
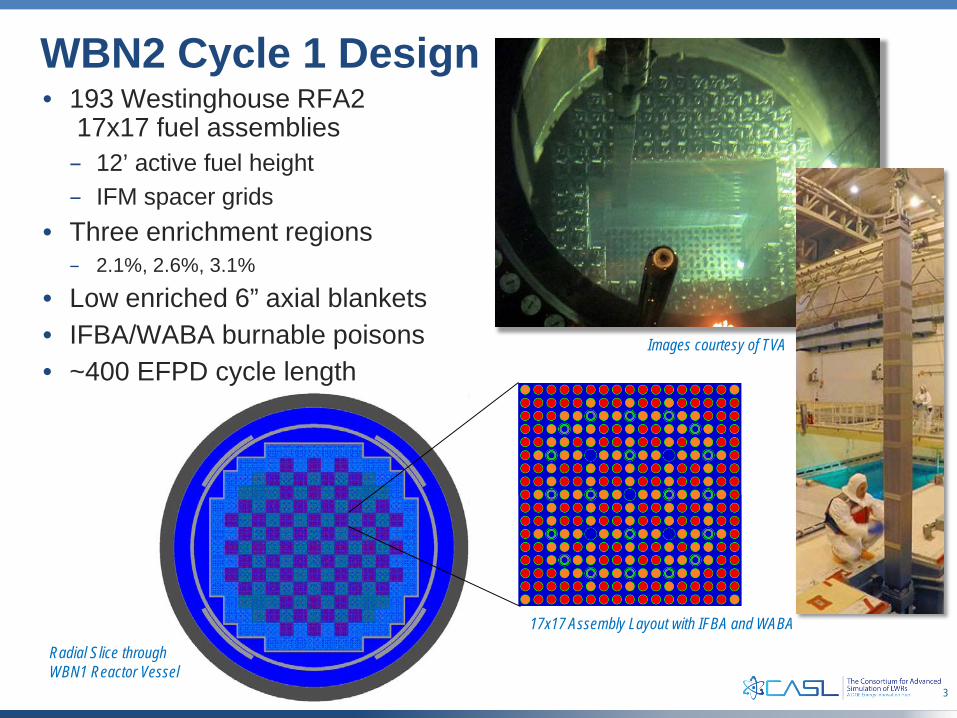
WBN2 Cycle 1 Design• 193 Westinghouse RFA2
17x17 fuel assemblies– 12’ active fuel height– IFM spacer grids
• Three enrichment regions– 2.1%, 2.6%, 3.1%
• Low enriched 6” axial blankets• IFBA/WABA burnable poisons• ~400 EFPD cycle length
Radial Slice through WBN1 Reactor Vessel
17x17 Assembly Layout with IFBA and WABA
Images courtesy of TVA
5
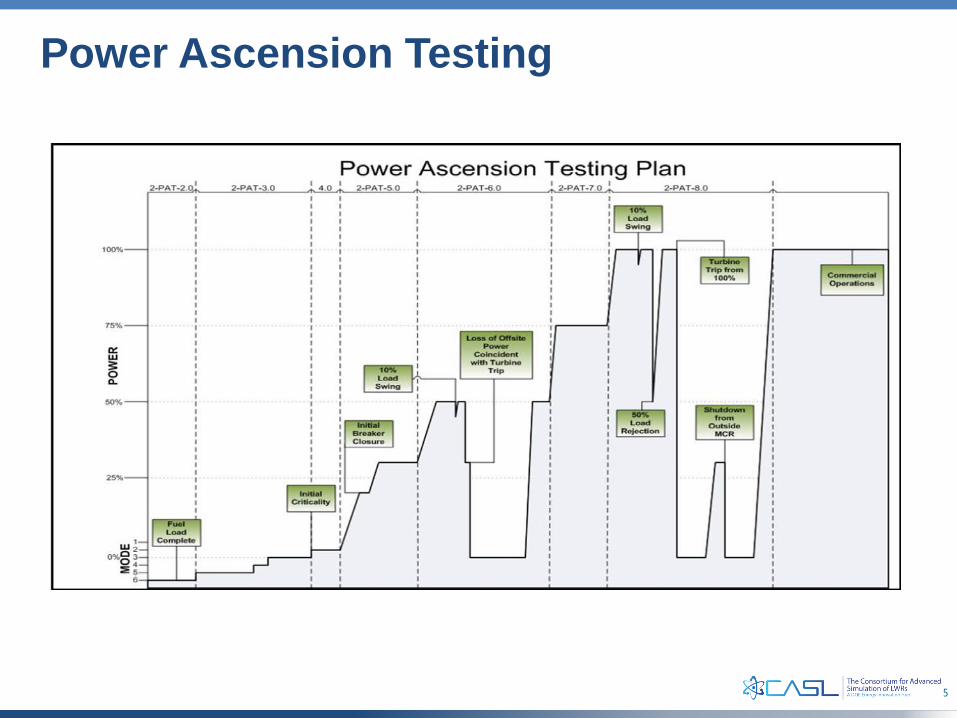
Power Ascension Testing
6
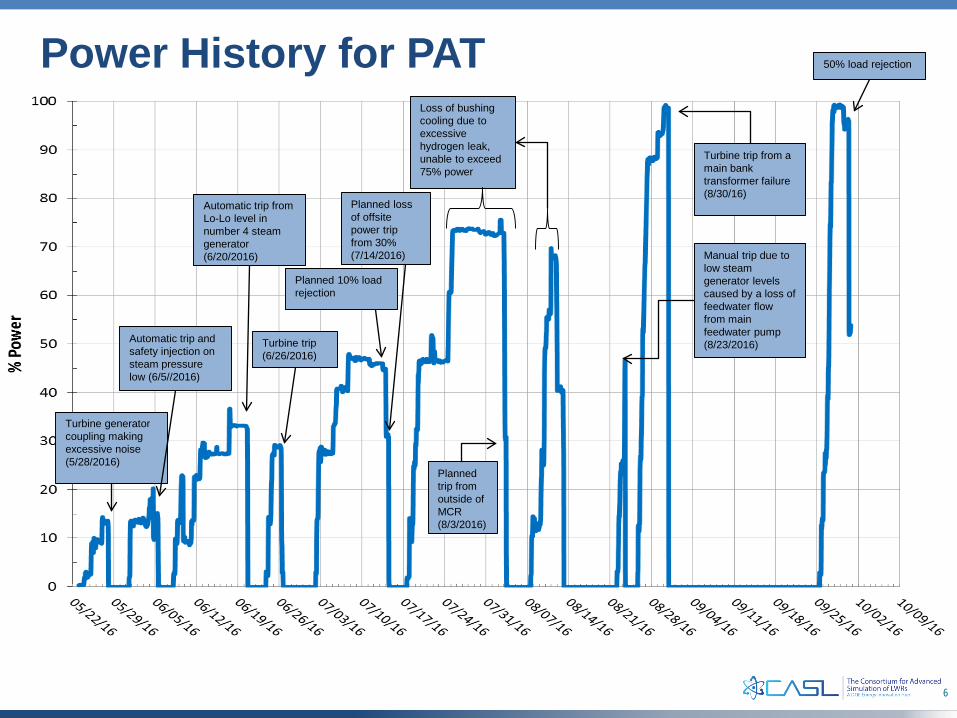
Power History for PAT
Turbine generatorcoupling making excessive noise (5/28/2016)
Automatic trip and safety injection on steam pressure low (6/5//2016)
Automatic trip from Lo-Lo level in number 4 steam generator(6/20/2016)
Planned 10% load rejection
Manual trip due to low steam generator levels caused by a loss of feedwater flow from mainfeedwater pump (8/23/2016)
Planned loss of offsitepower trip from 30% (7/14/2016)
Loss of bushingcooling due to excessive hydrogen leak, unable to exceed 75% power
Turbine trip from a main bank transformer failure (8/30/16)
50% load rejection
Turbine trip (6/26/2016)
Planned trip from outside of MCR (8/3/2016)
8
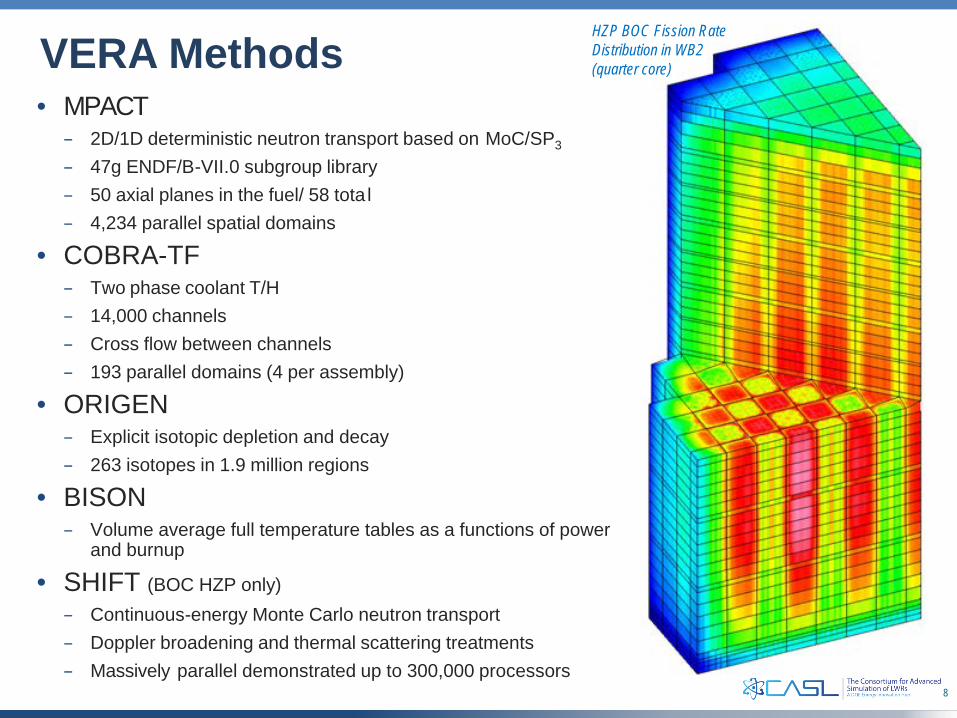
VERA Methods• MPACT
– 2D/1D deterministic neutron transport based on MoC/SP3
– 47g ENDF/B-VII.0 subgroup library– 50 axial planes in the fuel/ 58 tota l– 4,234 parallel spatial domains
• COBRA-TF– Two phase coolant T/H – 14,000 channels– Cross flow between channels– 193 parallel domains (4 per assembly)
• ORIGEN– Explicit isotopic depletion and decay– 263 isotopes in 1.9 million regions
• BISON– Volume average full temperature tables as a functions of power
and burnup
• SHIFT (BOC HZP only)– Continuous-energy Monte Carlo neutron transport– Doppler broadening and thermal scattering treatments– Massively parallel demonstrated up to 300,000 processors
HZP BOC Fission Rate Distribution in WB2 (quarter core)
10
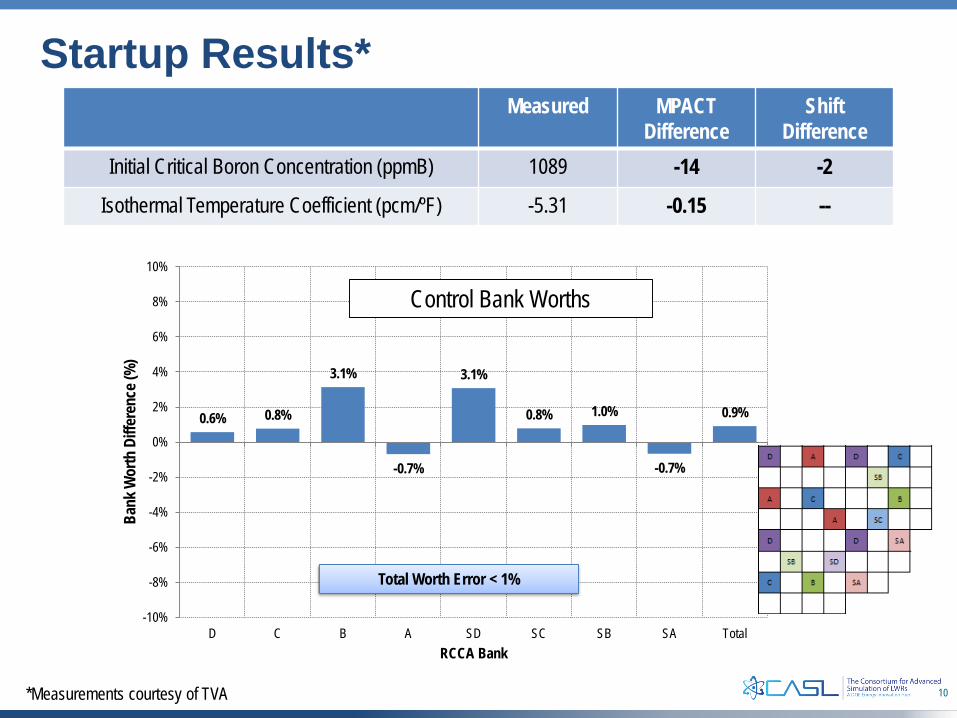
0.6% 0.8%
3.1%
-0.7%
3.1%
0.8% 1.0%
-0.7%
0.9%
-10%
-8%
-6%
-4%
-2%
0%
2%
4%
6%
8%
10%
D C B A SD SC SB SA Total
Bank
Wor
th D
iffer
ence
(%)
RCCA Bank
Startup Results*Measured MPACT
DifferenceShift
DifferenceInitial Critical Boron Concentration (ppmB) 1089 -14 -2
Isothermal Temperature Coefficient (pcm/ºF) -5.31 -0.15 --
Total Worth Error < 1%
*Measurements courtesy of TVA
Control Bank Worths
11
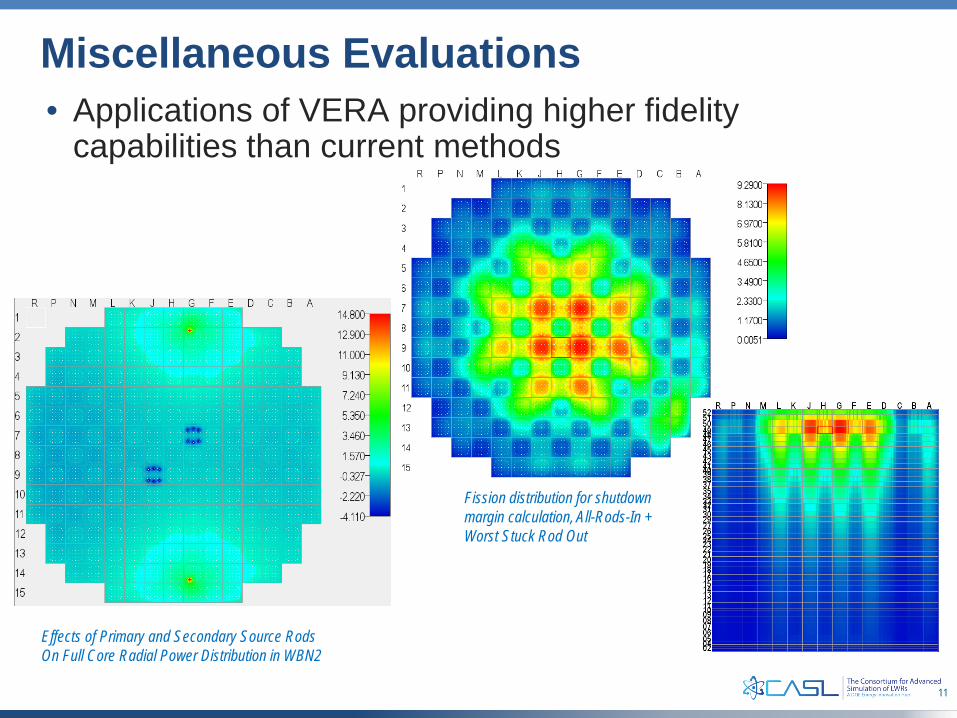
Miscellaneous Evaluations• Applications of VERA providing higher fidelity
capabilities than current methods
Effects of Primary and Secondary Source Rods On Full Core Radial Power Distribution in WBN2
Fission distribution for shutdown margin calculation, All-Rods-In + Worst Stuck Rod Out
12
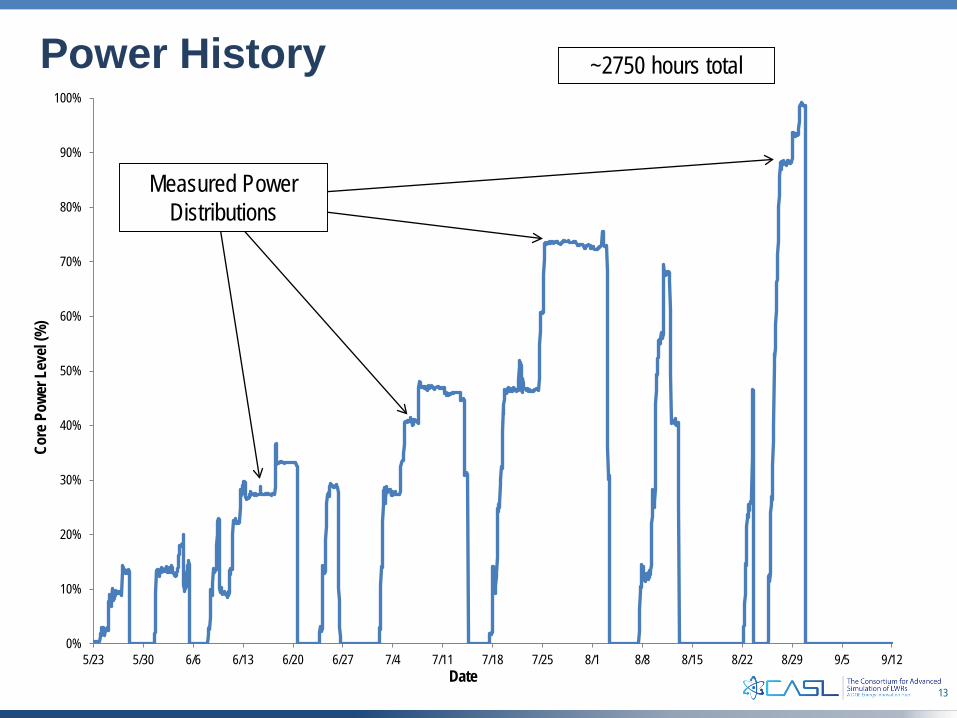
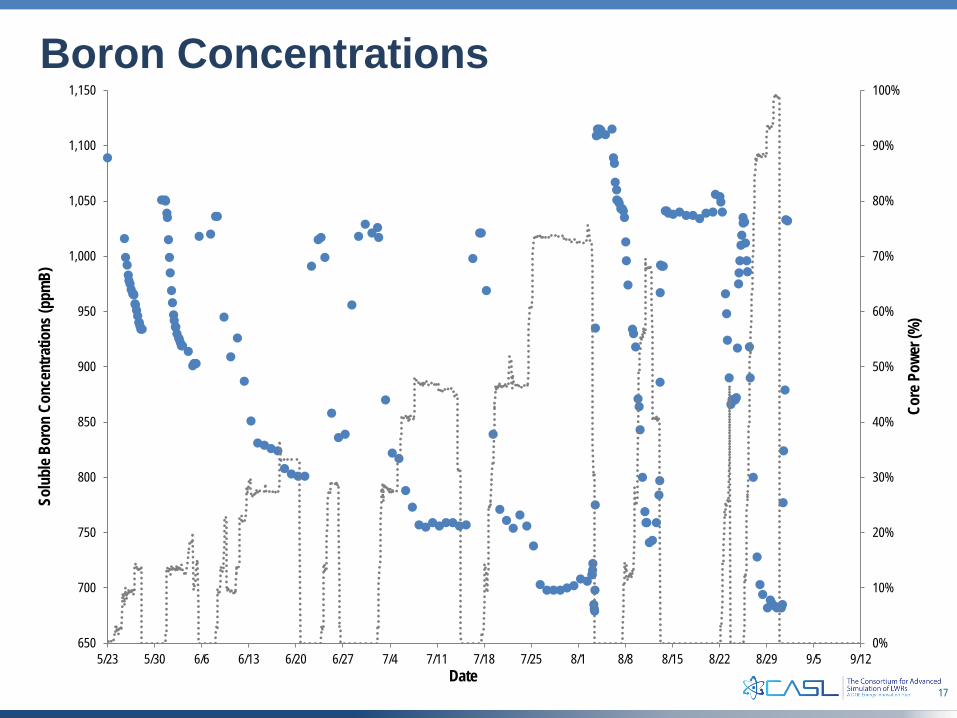
Power Ascension Testing• Power escalation began May 23, 2016• Plan requires ~90 days from criticality to commercial
operations• TVA has provided power history data and measurements• VERA has been used to follow the startup procedure with
hourly statepoints• Oak Ridge Leadership Computing Facility has supported
all calculations over the last 3½ months with priority on Eos supercomputer
• Comparisons to measured data have included:– Critical boron concentrations at operating conditions– Subsequent critical conditions after shutdowns– Measured neutron flux distributions at certain checkpoints
The Largest Simulation Ever Performed by CASL!
13
0%
10%
20%
30%
40%
50%
60%
70%
80%
90%
100%
5/23 5/30 6/6 6/13 6/20 6/27 7/4 7/11 7/18 7/25 8/1 8/8 8/15 8/22 8/29 9/5 9/12
Core
Pow
er L
evel
(%)
Date
Power History
Measured Power Distributions
~2750 hours total
14
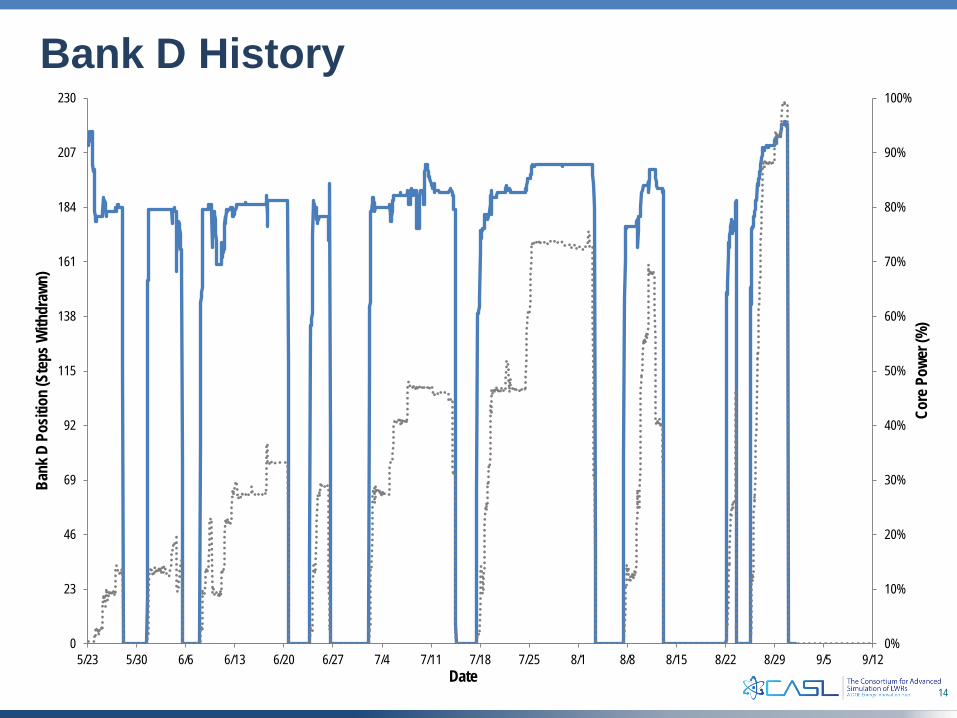
Bank D History
0%
10%
20%
30%
40%
50%
60%
70%
80%
90%
100%
0
23
46
69
92
115
138
161
184
207
230
5/23 5/30 6/6 6/13 6/20 6/27 7/4 7/11 7/18 7/25 8/1 8/8 8/15 8/22 8/29 9/5 9/12
Core
Pow
er (%
)
Bank
D P
ositi
on (S
teps
With
draw
n)
Date
15
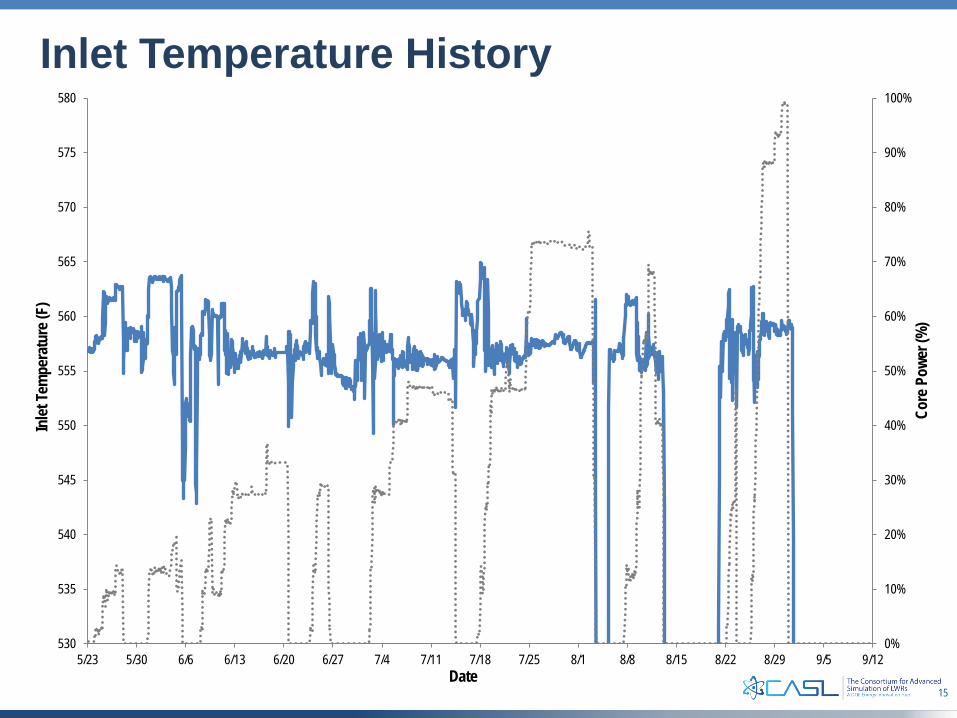
Inlet Temperature History
0%
10%
20%
30%
40%
50%
60%
70%
80%
90%
100%
530
535
540
545
550
555
560
565
570
575
580
5/23 5/30 6/6 6/13 6/20 6/27 7/4 7/11 7/18 7/25 8/1 8/8 8/15 8/22 8/29 9/5 9/12
Core
Pow
er (%
)
Inlet
Tem
pera
ture
(F)
Date
16
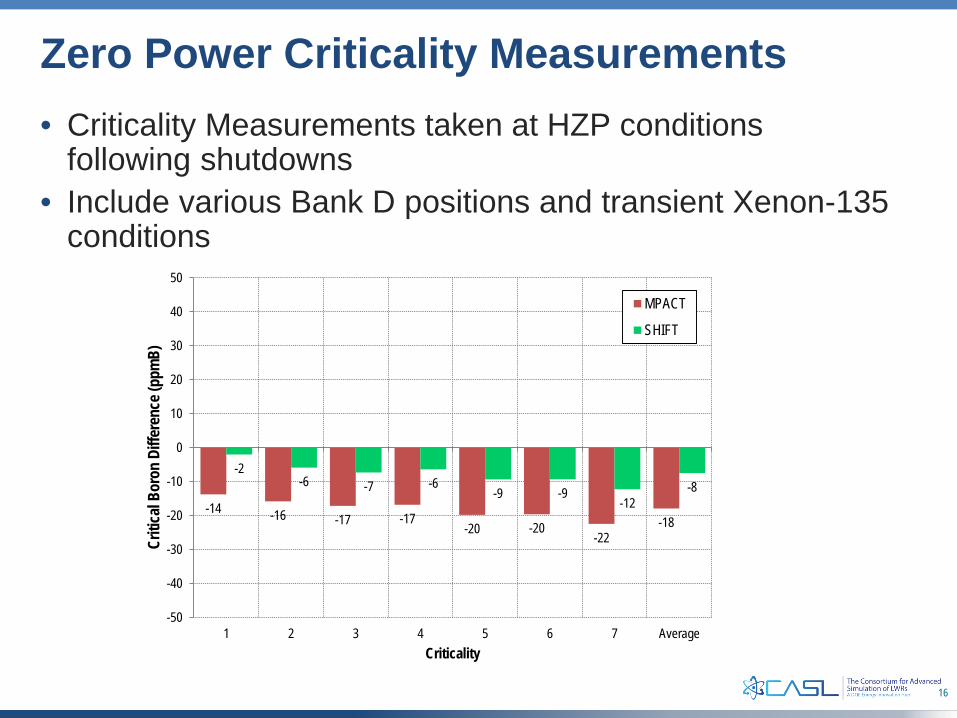
Zero Power Criticality Measurements • Criticality Measurements taken at HZP conditions
following shutdowns• Include various Bank D positions and transient Xenon-135
conditions
-14 -16 -17 -17-20 -20
-22-18
-2-6 -7 -6
-9 -9-12
-8
-50
-40
-30
-20
-10
0
10
20
30
40
50
1 2 3 4 5 6 7 Average
Criti
cal B
oron
Diff
eren
ce (p
pmB)
Criticality
MPACT
SHIFT
17
Boron Concentrations
0%
10%
20%
30%
40%
50%
60%
70%
80%
90%
100%
650
700
750
800
850
900
950
1,000
1,050
1,100
1,150
5/23 5/30 6/6 6/13 6/20 6/27 7/4 7/11 7/18 7/25 8/1 8/8 8/15 8/22 8/29 9/5 9/12
Core
Pow
er (%
)
Solu
ble B
oron
Con
cent
ratio
ns (p
pmB)
Date
18
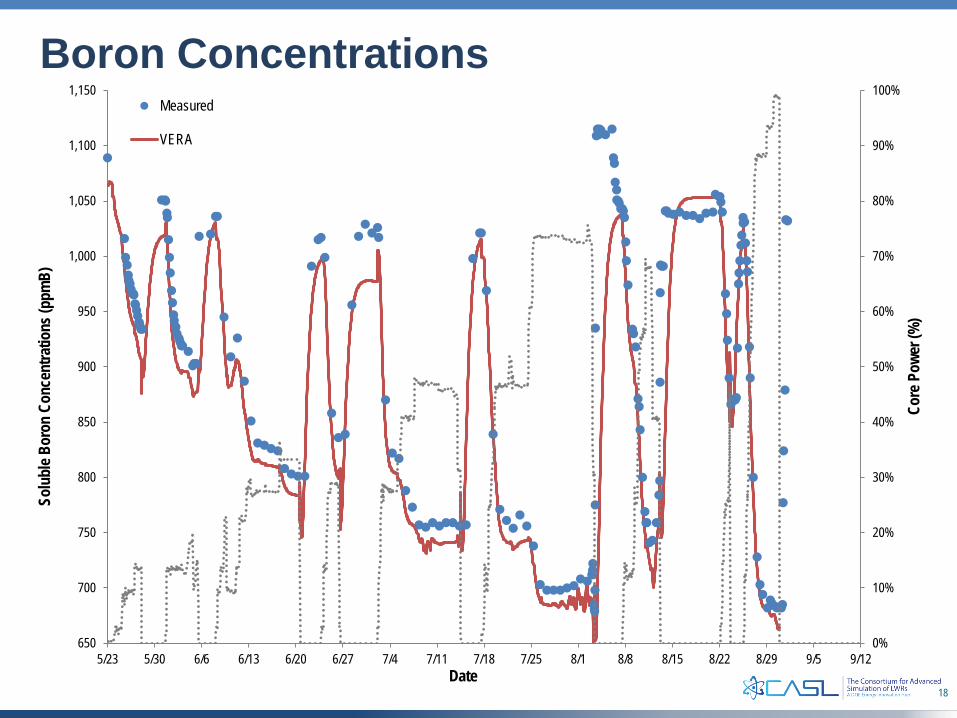
Boron Concentrations
0%
10%
20%
30%
40%
50%
60%
70%
80%
90%
100%
650
700
750
800
850
900
950
1,000
1,050
1,100
1,150
5/23 5/30 6/6 6/13 6/20 6/27 7/4 7/11 7/18 7/25 8/1 8/8 8/15 8/22 8/29 9/5 9/12
Core
Pow
er (%
)
Solu
ble B
oron
Con
cent
ratio
ns (p
pmB)
Date
Measured
VERA
19
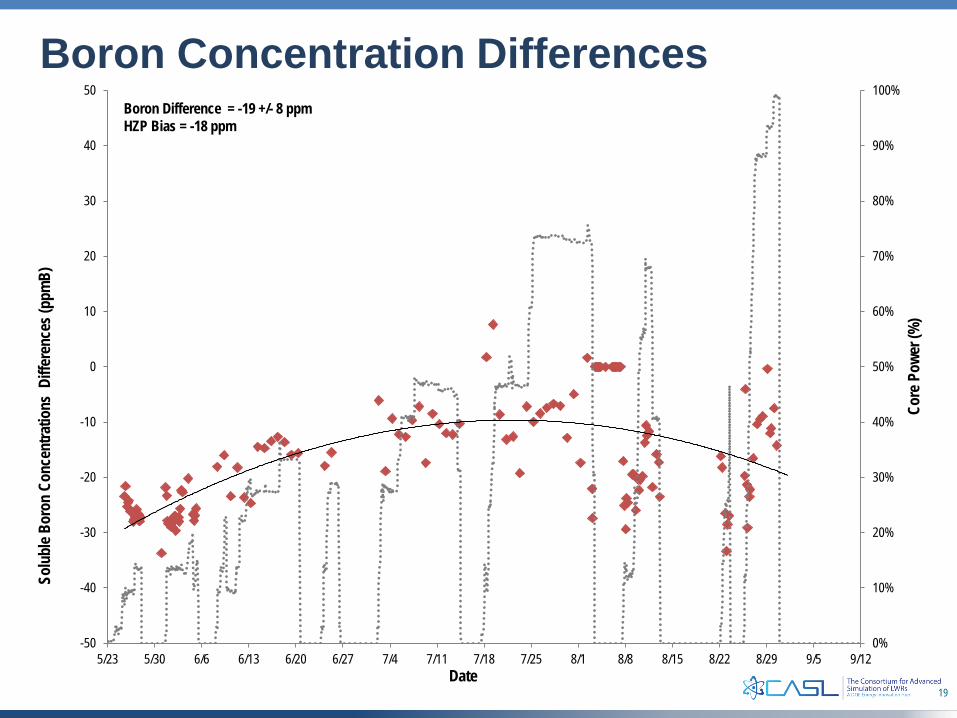
Boron Concentration Differences
0%
10%
20%
30%
40%
50%
60%
70%
80%
90%
100%
-50
-40
-30
-20
-10
0
10
20
30
40
50
5/23 5/30 6/6 6/13 6/20 6/27 7/4 7/11 7/18 7/25 8/1 8/8 8/15 8/22 8/29 9/5 9/12
Core
Pow
er (%
)
Solu
ble B
oron
Con
cent
ratio
ns D
iffer
ence
s (pp
mB)
Date
Boron Difference = -19 +/- 8 ppmHZP Bias = -18 ppm
20
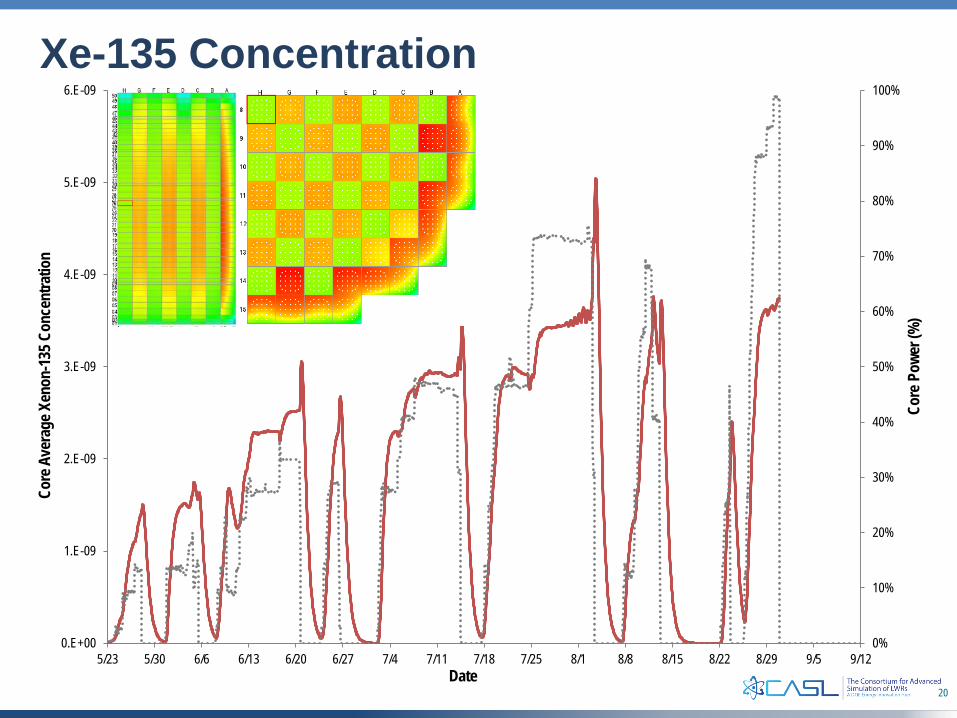
Xe-135 Concentration
0%
10%
20%
30%
40%
50%
60%
70%
80%
90%
100%
0.E+00
1.E-09
2.E-09
3.E-09
4.E-09
5.E-09
6.E-09
5/23 5/30 6/6 6/13 6/20 6/27 7/4 7/11 7/18 7/25 8/1 8/8 8/15 8/22 8/29 9/5 9/12
Core
Pow
er (%
)
Core
Ave
rage
Xen
on-1
35 C
once
ntra
tion
Date
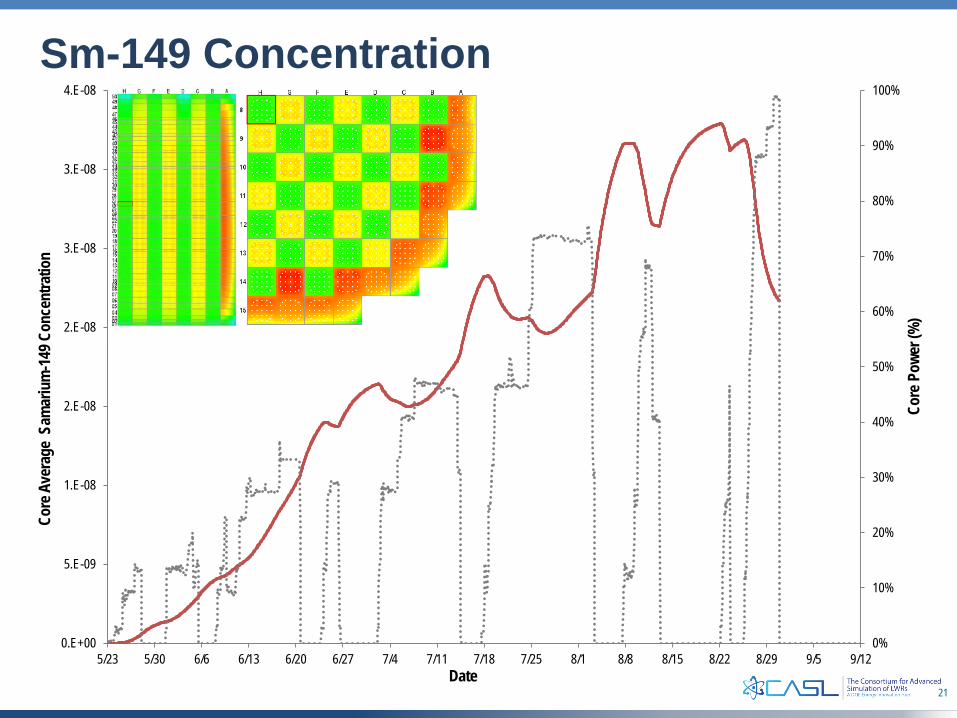
21
Sm-149 Concentration
0%
10%
20%
30%
40%
50%
60%
70%
80%
90%
100%
0.E+00
5.E-09
1.E-08
2.E-08
2.E-08
3.E-08
3.E-08
4.E-08
5/23 5/30 6/6 6/13 6/20 6/27 7/4 7/11 7/18 7/25 8/1 8/8 8/15 8/22 8/29 9/5 9/12
Core
Pow
er (%
)
Core
Ave
rage
Sam
ariu
m-1
49 C
once
ntra
tion
Date
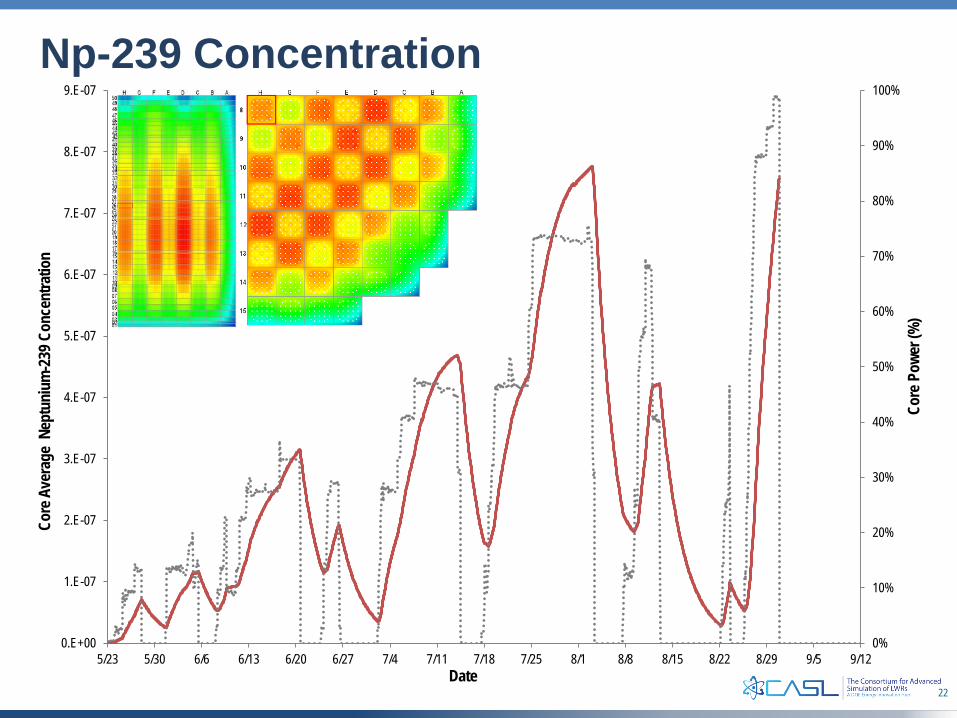
22
Np-239 Concentration
0%
10%
20%
30%
40%
50%
60%
70%
80%
90%
100%
0.E+00
1.E-07
2.E-07
3.E-07
4.E-07
5.E-07
6.E-07
7.E-07
8.E-07
9.E-07
5/23 5/30 6/6 6/13 6/20 6/27 7/4 7/11 7/18 7/25 8/1 8/8 8/15 8/22 8/29 9/5 9/12
Core
Pow
er (%
)
Core
Ave
rage
Nep
tuni
um-2
39 C
once
ntra
tion
Date
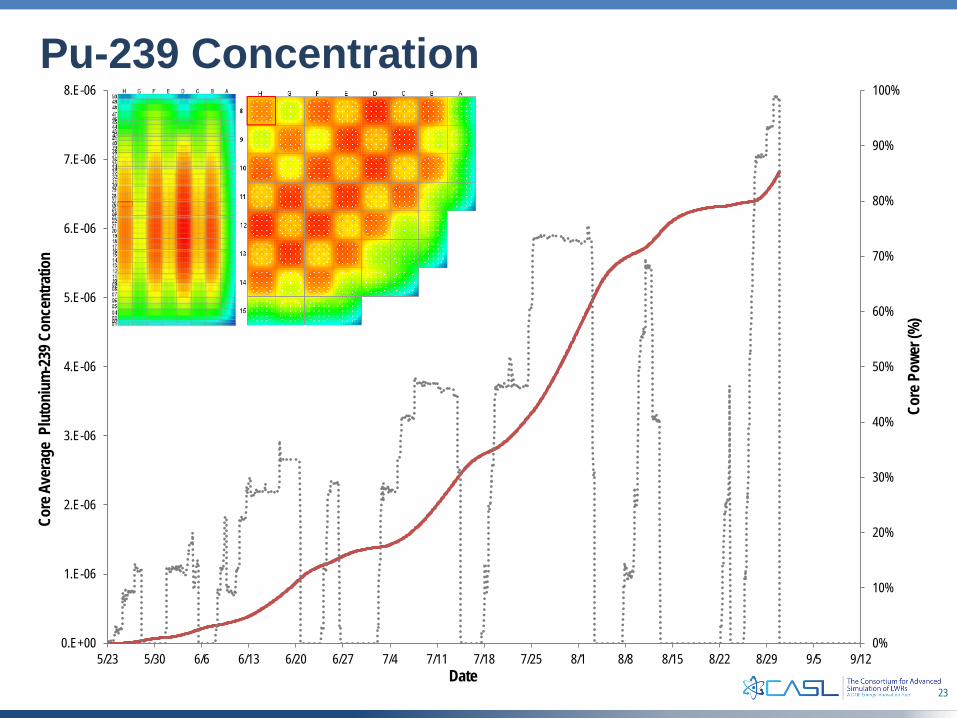
23
Pu-239 Concentration
0%
10%
20%
30%
40%
50%
60%
70%
80%
90%
100%
0.E+00
1.E-06
2.E-06
3.E-06
4.E-06
5.E-06
6.E-06
7.E-06
8.E-06
5/23 5/30 6/6 6/13 6/20 6/27 7/4 7/11 7/18 7/25 8/1 8/8 8/15 8/22 8/29 9/5 9/12
Core
Pow
er (%
)
Core
Ave
rage
Plu
toni
um-2
39 C
once
ntra
tion
Date
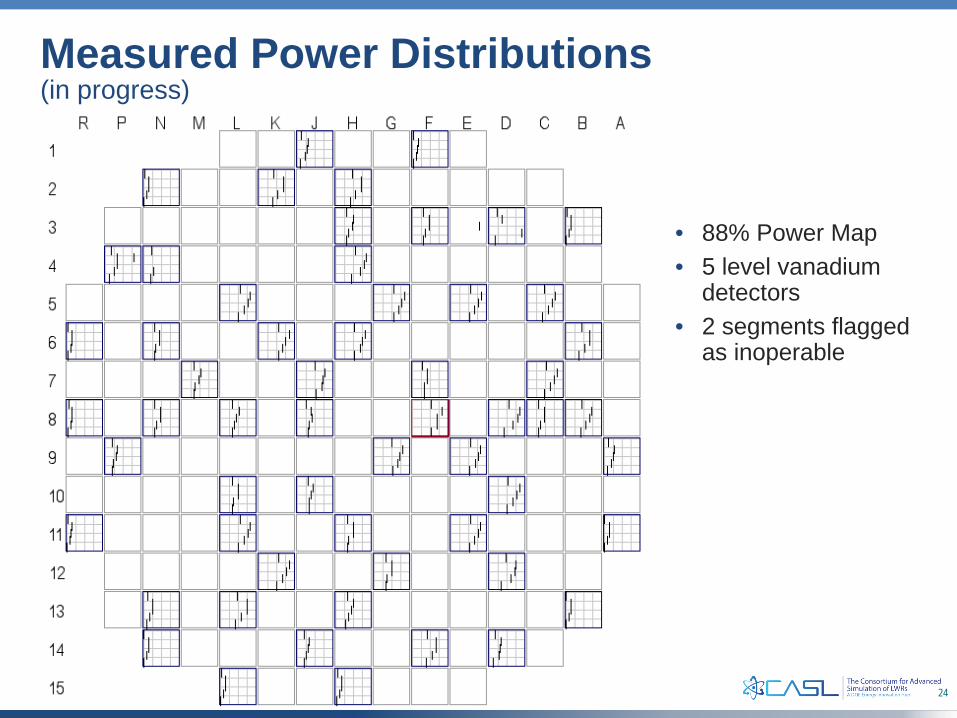
24
Measured Power Distributions(in progress)
• 88% Power Map• 5 level vanadium
detectors• 2 segments flagged
as inoperable
25
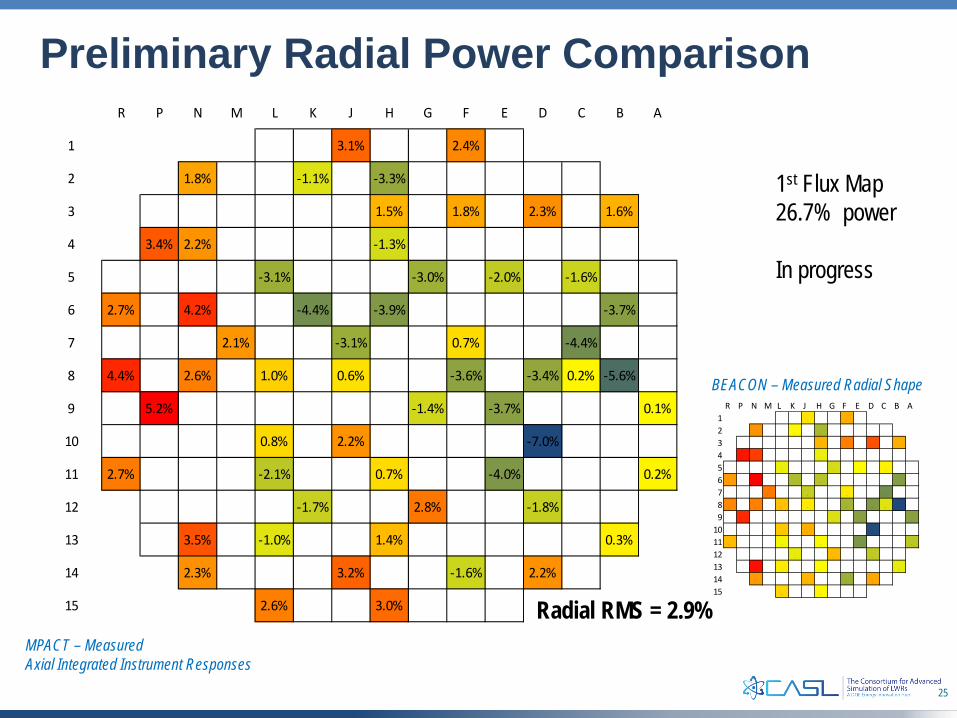
Preliminary Radial Power Comparison
MPACT – Measured Axial Integrated Instrument Responses
Radial RMS = 2.9%
R P N M L K J H G F E D C B A
1 3.1% 2.4%
2 1.8% -1.1% -3.3%
3 1.5% 1.8% 2.3% 1.6%
4 3.4% 2.2% -1.3%
5 -3.1% -3.0% -2.0% -1.6%
6 2.7% 4.2% -4.4% -3.9% -3.7%
7 2.1% -3.1% 0.7% -4.4%
8 4.4% 2.6% 1.0% 0.6% -3.6% -3.4% 0.2% -5.6%
9 5.2% -1.4% -3.7% 0.1%
10 0.8% 2.2% -7.0%
11 2.7% -2.1% 0.7% -4.0% 0.2%
12 -1.7% 2.8% -1.8%
13 3.5% -1.0% 1.4% 0.3%
14 2.3% 3.2% -1.6% 2.2%
15 2.6% 3.0%
R P N M L K J H G F E D C B A1 0.6% 1.8%
2 2.4% 0.1% -2.9%
3 1.7% 2.9% 4.0% 1.8%
4 5.3% 4.4% -0.6%
5 -0.6% -1.4% 0.0% 0.3%
6 2.3% 5.8% -2.8% -2.4% -4.1%
7 3.1% -2.0% 0.5% -4.7%
8 2.7% 2.9% 1.4% 0.5% -3.1% -4.3% -1.1% -7.6%
9 4.9% -1.2% -4.0% -4.0%
10 1.2% 1.8% -7.5%
11 1.5% -0.3% -0.2% -4.4% -2.3%
12 -0.8% 1.5% -2.1%
13 5.5% 0.5% 0.0% -0.8%
14 2.3% 1.7% -3.4% 2.0%
15 0.9% 0.2%
BEACON – Measured Radial Shape
1st Flux Map26.7% power
In progress
26
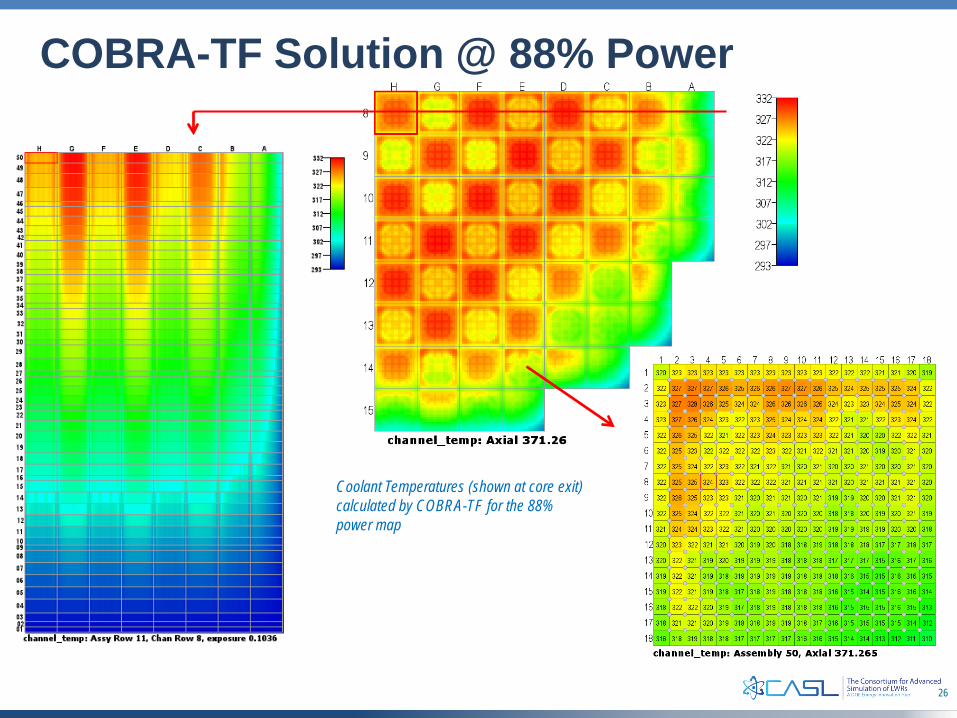
COBRA-TF Solution @ 88% Power
Coolant Temperatures (shown at core exit) calculated by COBRA-TF for the 88% power map
27
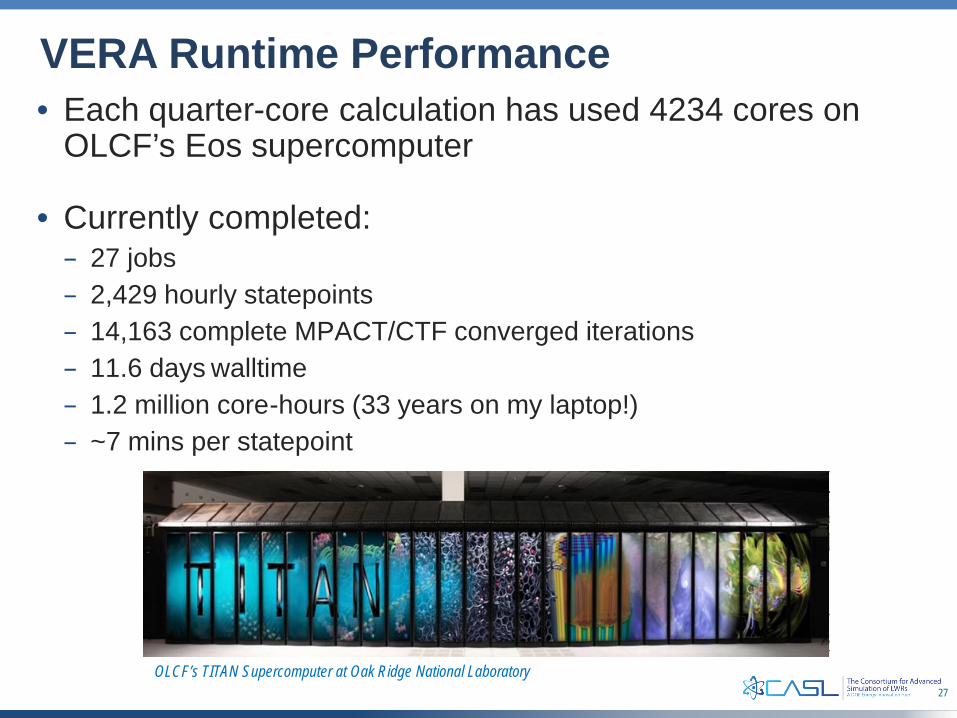
VERA Runtime Performance• Each quarter-core calculation has used 4234 cores on
OLCF’s Eos supercomputer
• Currently completed:– 27 jobs– 2,429 hourly statepoints– 14,163 complete MPACT/CTF converged iterations– 11.6 days walltime– 1.2 million core-hours (33 years on my laptop!)– ~7 mins per statepoint
OLCF’s TITAN Supercomputer at Oak Ridge National Laboratory
28
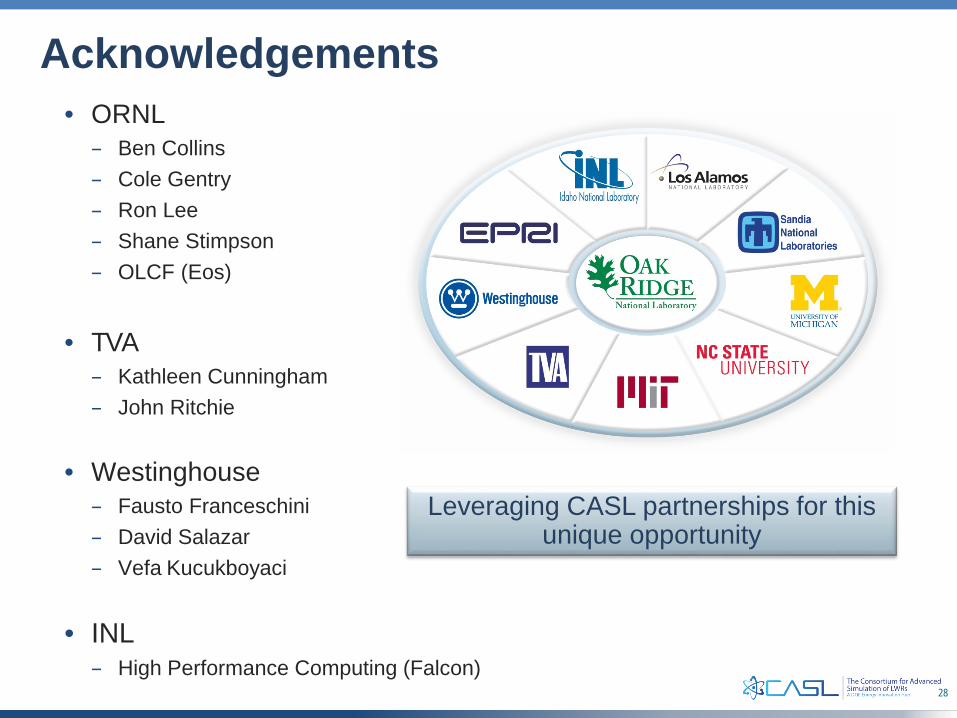
Acknowledgements• ORNL
– Ben Collins– Cole Gentry– Ron Lee– Shane Stimpson– OLCF (Eos)
• TVA– Kathleen Cunningham– John Ritchie
• Westinghouse– Fausto Franceschini– David Salazar– Vefa Kucukboyaci
• INL– High Performance Computing (Falcon)
Leveraging CASL partnerships for this unique opportunity