Embed Size (px)
Citation preview

Watersports and LeisureParticipation Survey 2009
Brought to you by: Sponsored by:

Watersports and Leisure Participation Report 2009 Page 1 of 64
Foreword
By Paul Bayliss, RYA
In this the eighth year of the Watersports and Leisure Participation Survey, we’re delighted to see the project go from strength to strength. Achieving consistency across the years has been paramount in retaining the ability to track trends and this has to be balanced against developing requirements from the partners and sponsors. What started off in 2002 as a fairly modest participation survey now has great depth and width. What’s more, the work is specific to the marine market, industry and environment and paints a valuable picture for those of us who work in the sector.
All of this is only possible because of the continuing support of the four partners the British Marine Federation, the Maritime and Coastguard Agency, the Royal National Lifeboat Institution and the Royal Yachting Association, and the grateful support of our sponsor YBW.com. This work is important when defining the future direction and strategy for all the parties involved, often for very different reasons.
When reading this report, it’s important to bear in mind that each survey is only a snapshot in time and is subject to normal statistical inaccuracies as well as natural variations in actual activity. It is therefore much safer to compare the results across a number of years and this is where eight years worth of consistent data is so valuable.
I hope you find the report interesting and informative.
Long may the project continue.

Watersports and Leisure Participation Report 2009 Page 2 of 64
ContentsForeword ..................................................................................................................... 1
Contents...................................................................................................................... 2
Key Findings ................................................................................................................ 3
Executive Summary...................................................................................................... 4
1. Introduction ....................................................................................................... 12The Questions............................................................................................................ 12The Data ................................................................................................................... 13
2. Participation in Surveyed Leisure Activities 2009................................................... 14Overall trends in participation ..................................................................................... 17Trends in Activities ..................................................................................................... 17Participation by Socio-Demographic Group................................................................... 19
Participation by Gender........................................................................................... 19Participation by Age................................................................................................ 22Participation by SEG ............................................................................................... 25Participation by Ethnicity......................................................................................... 27Participation by Life stage ....................................................................................... 28Regional Participation ............................................................................................. 30
3. Participation History............................................................................................ 35Last Participation........................................................................................................ 35First Participation ....................................................................................................... 35Churn Rate ................................................................................................................ 36Reasons for Starting Participation................................................................................ 36Reasons for Stopping Participation .............................................................................. 39
4. Frequency of Participation................................................................................... 41
5. Where the Balance of Participation is Taking Place ............................................... 47
6. Combinations of Activities ................................................................................... 47
7. Seasonal Participation......................................................................................... 48
8. Distribution between Inland and Coastal Areas..................................................... 50
9. Club Membership................................................................................................ 54
10. Boat Ownership .............................................................................................. 56Boat ownership penetration in UK households.............................................................. 56Boats owned in the UK and abroad.............................................................................. 60Number of boats owned overall................................................................................... 62
Points of Contact........................................................................................................ 64
Watersports and Leisure Participation Report 2009 Page 3 of 64
Key FindingsCommissioned by BMF, MCA, RNLI and RYA, sponsored by YBW.com
7.2% of those surveyed participated in at least one of the 12 boating activities* in 2009(compared to 6.2% in 2008 and 7.84% in 2007). This means that up to 3.7 million UK adults participate in these boating activities.
26.3% of those surveyed have participated in the 21 watersports and water based leisure activities# in 2009 (23% in 2008 and 29.63% in 2007). This means that up to 13.2 million UK adults participate in these watersports and water based leisure activities.
There has been no significant change from last year in participation for 13 of these activities; water skiing, using personal watercraft, motor boating/cruising, yacht cruising, small sail boat racing, canal boating, yacht racing, kitesurfing, angling (from a boat), angling (from the shore), cliff climbing, coastal walking, leisure sub-aqua diving (from the shore and boat).
The remaining activities show significant increases compared to 2008, most notably for spending general leisure time at the beach and outdoor swimming, both activities which had dropped significantly in 2008.
The average number of times people participate has seen a drop in several activities, suggesting that more casual participants have returned to these activities after stopping in 2008.
Males show higher participation rates in almost all of the activities, although females have an increasing trend for participation in boating activities over the last eight years while the trend for males is showing a decline.
Participation rates are marginally increasing for those aged over 34 whilst the participation rate in the 16-34 age group continues to decline. People in the 35-54 age group are the most active across ‘any activity’ whilst the 16-34 age group are still more likely to participate in ‘any boating activity’.
The socio-economic group AB has increased its share of highest participation rates; the group now has the highest participation rates for 19 out of the 21 activities, up from 15 in 2008. The C1 group however has the highest number of actual participants because of its larger overall size.
Families account for the highest number of participants for the majority of activities, whilst student/workers in a house share and couples under 55 have higher participation rates.
2.73% of those surveyed report their household owns at least one boat or craft out of the 12 boating activities*. Thus an estimated 1.1 million boats/craft are owned by UK households. On average, 7% are kept abroad.
* The 12 boating activities making up “Any Boating Activity” includes Small sail boat racing, Small sail boat activities, Yacht racing, Yacht cruising, Power boating, Motor boating/Cruising, Using Personal Watercraft, Rowing, Canoeing, Canal boating, Water skiing and Windsurfing.# The 21 activities making up “Any Activity” includes all of the boating activities above plus Surfboarding, Angling from the shore, Angling from a boat, Outdoor Swimming, Leisure Sub Aqua diving, Cliff Climbing, Coastal Walking, Spending General Leisure time at the beach and Kitesurfing.
Watersports and Leisure Participation Report 2009 Page 4 of 64
Executive Summary
Introduction
This is the eighth year that we have undertaken the Watersports and Leisure Participation Survey.During this time we have established a consistent methodology and firm foundation for assessing trends in participation, and gained invaluable insight into the profile and characteristics of watersports activities.
This year we have for the first time asked about when and why people took up their sport or stopped participating. This has given us new insight into the considerable churn there is each year with many casual participants coming into and leaving the sport annually.
Watersports and Leisure Participation 2009
We measured a considerable drop in participation in 2008, after a period of continuing increases over the two years before that. In 2009 the number of people participating in ‘any boating activity’ has recovered and now stands at up to 3.7 million; the same level as 2006. Any estimate based on a sample of the population (in this case 12,683 respondents) is only accurate within defined statistical confidence intervals. This sample size allows us to be 90% certain that the true number of people participating in ‘Any boating activity’ is estimated at up to 3.7 million adults in 2009 compared to 3.2 million in 2008, 4 million in 2007, 3.7 million in 2006 and 3.5 million in 20051.
The headline participation figures are based on our best estimate for the participation rate for ‘Any boating activity’2 of up to 7.6%, a significant increase of 1.0 percentage point on 2008. When we apply this participation rate to the UK adult population of 49,051,000, we can calculate a UK base participant number of up to 3,719,000 (rounded to the nearest thousand).
This increase could be due to continuing spells of good weather in the UK, especially in spring 2009 (source: Met Office statistics). Alongside the growth in the numbers of participants there has, for several activities, been a decline in the average number of times people participate. This is a reversal of the trend in 2008 and suggests that this year there has been a recovery in casual participants in these activities.
Of the 12 ‘any boating activities’, participation has significantly increased in five of them in 2009. These are (in descending order): Canoeing (+0.60 percentage points) Power boating (+0.58 percentage points) Rowing/sculling (+0.33 percentage points) Small sail boat activities (+0.26 percentage points) Windsurfing (+0.19 percentage points)
Of the remaining seven activities three show statistically insignificant rises (Water skiing; +0.04 percentage points, Small sail boat racing; +0.05 percentage points and Canal boating; +0.11percentage points).
1 When comparing actual numbers of participants over all seven years it needs to be taken into account that prior to 2005 the survey did not include Northern Ireland.2 ‘Any Boating Activity’ includes Small sail boat racing, Small sail boat activities, Yacht racing, Yacht cruising, Powerboating, Motor boating/Cruising, Using Personal Watercraft, Rowing, Canoeing, Canal boating, Water skiing and Windsurfing).
Watersports and Leisure Participation Report 2009 Page 5 of 64
Two activities show statistically insignificant drops (Motor boating/cruising; -0.13 percentage points and Yacht cruising; -0.06 percentage points), while Using personal watercraft and Yacht racing have not changed at all.
There are 3 significant increases for the other activities we track. These are (in descending order): Spending general leisure time at the beach (+2.84 percentage points) Outdoor swimming (+1.78 percentage points) Surfboarding (+0.29 percentage points)
The headline figure when taking all 21 surveyed activities into account3 is up to 13.2 million adults, from 11.6 million in 2008, but still lower than the 14.7 million in 2007. The comparative number for 2006 is 13.8 million and 12.9 million in 2005. This big increase in the overall number of participants in ‘Any activity’ is influenced heavily by an increase in the most popular activities such as outdoor swimming and spending general leisure time at the beach. In 2008 it was a decline in exactly these activities which caused the drop in participation of ‘Any activity’ in that year. Both these activities have seen significant increases this year. The other big activity, coastal walking, has seen a very minor decline.
Our best estimate for the participation rate for ‘Any activity’ is 26.28% of adults in the UK, up from 23.03% in 2008. However, it is still lower than the peak 29.63% reached in 2007. This participation rate applied to the UK adult population, gives us a participant figure of 12,893,000 for ‘Any activity’(rounded to the nearest thousand)4.
The Socio-Demographics of Participation
Gender
As in all previous waves for most activities males show a higher participation rate than females. Males have at least twice the female participation rate in 14 of the 21 activities. This is up on the 8 recorded in 2008, but on par with the 13 recorded 2007. The activities in which males are at least twice as likely to participate in 2009 are (in order of highest to lowest difference): Angling (from the shore) Surfboarding Power boating Angling (from a boat) Leisure sub-aqua diving (from the shore and boat) Cliff climbing Yacht cruising Rowing/Sculling Using personal watercraft Water skiing Windsurfing Small sail boat racing Yacht racing Kitesurfing
3 ‘Any Activity’ includes all of the boating activities above plus surfboarding, angling from the shore, angling from a boat, outdoor swimming, leisure sub aqua diving, cliff climbing, coastal walking, spending general leisure time at the beach and kitesurfing)4 As above, this number is estimated to lie within a range. We are 90% certain that, for ‘Any activity’, the true number of participants ranges between 12,578,000 and 13,207,000 people. In other words, more than one quarter (26%) of the adult UK population has taken part in some form of activity on or next to the water in 2009.

Watersports and Leisure Participation Report 2009 Page 6 of 64
‘Coastal walking’ and’ spending general leisure time at the beach’, are the only two activities where females show a higher participation rate than males, this has been consistently the case for several waves.
Age
The 35-54 age group has the highest participation rate in all aggregated participation categories except ‘any boating activity’ where the youngest age group remains the most active. The 35-54 age group’s participation seems more consistent than their younger counterparts, and over time has held up much better. Over time there has been a significant long term decline in participation among the youngest group.
Looking at the individual activities, the 35-44 age group has the highest participation rate for (in order of highest to lowest difference): Coastal walking Spending general leisure time at the beach Small sail boat activities Angling (from the shore) Canal boating Angling (from a boat) Power boating Yacht cruising Yacht racing
16-34 year olds continue to show higher participation rates in the other, more ‘active’ activities like canoeing, water skiing, kitesurfing, cliff climbing etc.
The 55+ age group are not the most active group in any of the activities in 2009. In 2008 they showed the highest participation rate for canal boating (the first time that this age group had showed the highest participation rate for any activity). However this was largely because of declines in the other age groups rather than any growth in their participation. In 2009 their participation has dropped compared to 2008.
Socio-Economic Group
As in previous years, those from socio-economic group AB record higher participation rates than those in other socio-economic groups in most of the activities (19 out of 21 compared to 15 out of 21 in 2008). Those in socio-economic group C1 have higher participation rates in 2 activities, down from 5 in 2008 (but the same figure as in 2007); the activities are; kitesurfing and angling from the shore. Those in socio-economic group C2DE do not have the highest participation rate in any of the activities. In 2008 they showed the highest rate in angling from the shore.
In spite of higher participation rates, the smaller size of the AB group means that they are the largest group of participants in only 6 of the 19 activities where they have highest participation rates. These activities are (in order of highest to lowest number of participants): Coastal walking Small sail boat activities Power boating Yacht cruising Using personal watercraft Windsurfing

Watersports and Leisure Participation Report 2009 Page 7 of 64
In the following 13 activities those from socio-economic group C1 are the largest single group despite not always being the highest in participation rate (in order of highest to lowest absolute number of participants): Outdoor swimming Canoeing Surfboarding Leisure sub-aqua diving (from the shore and boat) Cliff climbing Rowing/sculling Water skiing Yacht racing Kitesurfing
Despite lower participation rates in all of the activities, those from socio-economic group C2DE are the largest single group in absolute numbers in 6 activities (up from 2 in 2008). Because of the relative size of the C2DE group in the population small increases in the participation rates have a larger impact on the absolute number of participants than for the other socio-economic groups.
Those from the socio-economic group C2DE are the largest single group for the following activities (in order of highest to lowest absolute number of participants): Spending general leisure time at the beach Angling from the shore Angling from a boat Motor boating/cruising Canal boating Small sail boat racing
Ethnicity
Participation rates are highest amongst White Irish in 6 of the 12 ‘any boating activities’, confirming the results from 2008 when this analysis was carried out for the first time. White British have the highest participation rates in 4 activities (up from 3 in 2008). These are in descending order highest to lowest participation rate: Motor boating/cruising Canal boating Surfboarding Leisure sub-aqua diving
White British represent the single largest group in terms of absolute numbers for all activities.
Life stage
Two life stage groups with very similar participation rates:-
‘Couples under 55’ and those ‘living in a family’ have the highest participation rates for ‘any activity’; 32.9% and 32.0% respectively have participated in at least one of the surveyed activities in the past year.
Due to the large number of people in the family category, families account for the majority of participants in absolute numbers for most activities. The only activities where this is not the case are: rowing/sculling, windsurfing, using personal watercraft and kitesurfing in which the largest

Watersports and Leisure Participation Report 2009 Page 8 of 64
participation group are those ‘living in student/ workers house shares’, while for yacht racing ‘singles’are the largest group. As seen in previous years, people who are from the older ‘Grey’ category have the lowest participation rate for both ‘any activity’ and ‘any boating activity’, recording participation rates of 13.2% and 1.7% respectively.
Regional participation
Participants living in the South have the highest participation rates in nine out of the 21 activities. They have the highest participation in ‘any boating’. All the sail boat and yachting activities are also most popular activities amongst residents in this area. Motor boating/cruising activities on other hand show a higher participation rate amongst people living in the East, while participation in ‘any activity’ is highest amongst those from Northern Ireland, mainly due to the very high participation rate for‘Spending general leisure time at the beach’.
Participation History
Last Participation
The majority of those that have not participated in the past 12 months have never done so in the past either. Of those who haven’t participated in ‘sailing’ in the past 12 months, only 12% have actually participated in ‘sailing’ at some point in the past. For ‘power/motor boating’ and ‘other watersports’ these previous participation rates stand at 8% and 19% respectively. For those who had participated at one point in the past, the majority have participated for the last time more than 5 years ago. However approximately 31% of those participating in ‘sailing’ in 2008 stopped in 2009. For ‘power/motor boating’ this rate stands at 33% and ‘other watersports’ at 46%. Combined with the large proportion starting in 2009 this reveals a very high churn rate of watersports activities.
First Participation
Many of those who have participated in at least one activity in the sailing, power/motor boating or watersports categories in the past 12 months have started to participate for the first time in the past 12 months. 43% of participants in ‘sailing’ and ‘other watersports’ started in the last year whilst 46% of participants in ‘power/motor boating’ started in the last 12 months. The other significant group are those who participated in the last 12 months but have not participated previously for more than five years. Only a small proportion of respondents have started in the time scales between these two. Therefore rather than a sustained flow of new people committed to the sport, initial indications are that many people try out watersports each year, but only a minority sustain their participation in subsequent years who are the enthusiasts as opposed to casual participants.
Reasons for starting and stopping to participate
‘Having a go while on holiday’ is an important reason that people started participating in the past 12 months. Other important reasons across all of the categories are ‘another family member starting to participate’, ‘being invited by a family member/friend to use their boat/equipment’ and ‘having wanted to do it for a long time’. Many of these reasons are therefore circumstantial rather than motivational which may be the reason why they do not lead to long term participation.
The main reasons for having stopped participating are: Losing interest in the activity No more time due to work commitments Change in personal circumstances (e.g. having children)

Watersports and Leisure Participation Report 2009 Page 9 of 64
Only participating on holidays, but have done something else in the past 12 months Saving money/ not able to afford it any more
Frequency of Participation
The average number of times people said that they are participating in the UK has dropped in 6 of the 12 ‘any boating activities’. For example average participation in small sail boat activities in 2009 was 5.0 times compared to 7.7 times in 2008 and thus is close to the 4.8 recorded in 2007.
So while more people are taking part in the activities, those that do take part do so less often than they have in 2008. This is likely to reflect a recovery in more casual participation. The four activities from the original 12 that are seeing a drop in the average UK participation are canoeing, windsurfing, using personal watercraft and yacht cruising. Average participation for rowing and canal boating has stayed pretty much the same.
‘Spending general leisure time at the beach’ and ‘kitesurfing’ are showing the largest increase in frequency of participation amongst the other activities.
Where is the Activity Taking Place
UK v Overseas
Overall, a greater proportion of people are participating in the UK than abroad. This is especially true for canal boating where over 85% of respondents exclusively participate in the UK and 97% do at least some of their activity in the UK. For coastal walking and angling from the shore over 90% of respondents are doing at least some of their participation in the UK.
2,797,000 people have participated in at least one boating activity in the UK during the last 12 months and 1,515,000 have participated abroad in at least one boating activity abroad. These categories are however not mutually exclusive; people who have participated in the UK may or may not have participated abroad and vice versa. 2,020,000 people have only participated in the UK, 737,000 have only participated abroad. 777,000 people have participated both in the UK and abroad.
The proportion of respondents who have done at least some of their participation in the UK has increased for 10 activities and dropped for 11 activities compared to 2008. However, few of these changes are statistically significant. The only significant increases are for small sail boat racing and outdoor swimming. The only significant drop is for angling from a boat.
As seen in the past two waves, sub-aqua diving has the highest proportion of respondents saying that they did not participate in the UK in 2009, with the majority of activity focussed overseas.
The number of times people are participating in the activities is also higher in the UK than abroad, which is consistent with past surveys. This is not surprising as most people will be in the UK for most of the year and will only be abroad when on holidays. Compared to 2008 there is a drop in the proportion of respondents who said that they have done at least some of their participation abroad for half of the 12 ‘boating activities’. Neither of these drops is statistically significant. The remaining six ‘boating activities’ have all recorded an increase, only one of which, for small sail boat racing, is statistically significant.

Watersports and Leisure Participation Report 2009 Page 10 of 64
Coast v Inland
In 2009 81% of all participation in ‘any activity’ in the UK took place at the coast, down from 84% in 2008 and similar to the 82% in 2007. Taking an average over the past 3 years this proportion stands at 82.2%, however this figure is dominated by general beach leisure and coastal walking as these activities are by definition coastal activities. 49.1% of participation in ‘any boating activity’ took place at the coast in 2009 (down from 55% in 2008 but slightly up on 2007, when it was 47.5%). This drop in the proportion of events that take place at the coast is due to an increase in absolute numbers of respondents participating in inland events rather than a drop in the number of respondents participating in coastal events which have stayed stable over the last two years.
1,455,000 people have participated in at least one boating activity at the coast and 1,762,000 have participated in at least one boating activity inland. These categories are however not mutually exclusive; people who have participated at the coast may or may not have participated inland, and vice versa. 1,035,000 people have only participated at the coast, 1,342,000 have only participated inland. 420,000 people have participated both at the coast and inland.
Summer v Other Seasons
We also investigate how many times people participate by season. Unsurprisingly the majority of events have every year consistently taken place in the summer. About 50% of events happen in the summer season. The six activities showing the lowest summer participation rates are (in order from the least): Cliff climbing (37.6% in summer) Coastal walking (37.6% in summer) Angling (from the shore) (38.4% in summer) Angling (from a boat) (40.2% in summer) Surfboarding (41.5 % in summer) Canal boating (42.7% in summer)
Club Membership
Club membership for the surveyed activities is generally low but differs by activity. When looking at the 12 ‘boating activities’ 5 of these have less than 10% of participants covered by club membership. When taking all activities into account this rises to 8 activities. Yacht racing records the highest membership rates at over 60%, as it did in 2008.
Small sail boat racing, which recorded a drop in membership rates in 2008 to 33% from over 50% in 2007 has seen membership rates recover to 42.4%. The volatility of the numbers may in part be due to the small sample sizes within individual sports on which to base these estimates.
Club members participate more often in their chosen activity than other people. For example, club members of sub aqua diving account for just under 77% of total events in the UK in that activity in the past year despite the fact that membership rates continue to stand at 23%.

Watersports and Leisure Participation Report 2009 Page 11 of 64
Eight Year Trends
Despite the recent recovery in participation rates for several of the activities, the rate for ‘any boating activity’ shows a steady decline when looking at the overall trend. The trend line for ‘any activity’ also shows a slight decline.
When looking at individual activities, only 2 of the 21 activities show a positive trend in participation over the eight years. Both of these activities are from the 12 ‘any boating activities’.
The activities in order of the highest growth are: Canal boating Motor boating/cruising
The number of activities out of the ‘12 any boating activities’ which show a stable trend in participation in 2009 has increased to four from only two in 2008. These activities are: motor boating/cruising, yacht cruising, yacht racing and power boating.
Looking at participation trends by gender over the past eight years it can be seen that female participation rates are more stable than those for males. Females’ trends are also more positivegiven they show an increasing trend for ‘any boating activity’ and a stable trend for ‘any activity’, whereas male participation is declining.
Despite the increasing trend in female participation, males are still showing higher participation rates in almost all of the activities.
When looking at participation over the years by age groups there is a declining trend for any boating activity for the 16-34 age group, whereas the 35-54 age group and the 55+ age group show small increases.
Boat Ownership
The proportion of households owning any type of boat has increased to 2.7% from 2.5% in 2008. In 2007 this figure was 2.7%. This translates to 681,000 households, to the nearest thousand, owning a boat in 2009. The increase from 2008 to 2009 is mainly due to an increase in the proportion of households owning a canoe/kayak (in line with the big increase in participation in this activity). Households in the socio-economic group AB are more likely to own any boat, as are those who have participated in ‘any boating activity’.
Canoes/kayaks remain the boat type with the highest average number of boats owned per household (1.8 up from 1.6 in 2008). Windsurfers and personal watercraft follow with 1.7 and 1.7 respectively. The majority of boats are kept in the UK.

Watersports and Leisure Participation Report 2009 Page 12 of 64
1. Introduction
The purpose of the Watersports and Leisure Participation Survey is to provide robust estimates of the level of participation in a range of watersports and water based leisure activities across the United Kingdom.
The research has been continuously conducted by Arkenford since 2003. Surveys in 2002, 2003 and 2004 (jointly commissioned by the BMF (British Marine Federation), RYA (Royal Yachting Association) and Sunsail) had a sample of 6,000 UK residents and covered a list of 12 watersports. In 2004 Arkenford also conducted independent research for the MCA (Maritime and Coastguard Agency) into participation in 20 leisure based watersport and coastal activities. From 2005 MCA and RNLI joined the consortium and sample sizes were pooled allowing the annual sample to grow to 12,000 and the list of activities to be extended to 21 water based activities. After the 2007 survey YBW.com became the new sponsor of this project.
The 2009 results enable us to give an insight into trends by activity over an 8 year period for the 12 ‘any boating activities’, and trends over the past 5 years for the additional 9 activities first surveyed for the MCA in 2004. The data on which the analysis has been based comes from a nationally representative sample of around 12,000 respondents across the United Kingdom (England, Scotland, Wales and Northern Ireland). The surveys prior to 2005 had a sample of 6,000 and only covered Great Britain (England, Scotland and Wales), as there was no omnibus survey facility in place covering Northern Ireland. The weighted sample provides information representative of the UK population in terms of age, gender, socio-economic grouping and origin.
The Questions
Each respondent is asked if they have taken part in each of the 21 leisure based watersports/activities over the 12 months preceding September when the survey is conducted. As far as possible the descriptions of each activity are provided in layman’s terms to allow all respondents, whatever their level of expertise, to give accurate replies. Small sail boat racing (dinghies) Small sail boat activities (dinghies) Using Personal watercraft (jetski or similar)
Additional explanation is provided when requested by the respondent for the following activities:- dinghies are small open sailing boats (not including seaside inflatables and beach toys) which
tend to be brought ashore after use whereas Yachts are usually left in the water. power boating is defined as craft that plane over water whilst motor boating / cruising is
defined as river boating or coastal motor cruising
For those activities which respondents have taken part in within the last 12 months, they are asked how often they participated. The question is split into two parts covering: Participation in the UK (this was asked of all 21 activities) Participation abroad (asked of the 12 any boating activities)
These three questions form the core of the original 2002 questionnaire. We ensure that the extension of the activity list does not affect the participation rates of the 12 any boating activities, retaining year on year comparability. This is achieved by asking about the 12 original activities before any of the 9 added activities.

Watersports and Leisure Participation Report 2009 Page 13 of 64
From 2005 four additional questions were specified by the MCA. The MCA share the information from these questions with all other consortium members. The questions cover: If the respondents have taken part in the activities in the UK in the last 12 months, they are
asked how often they have participated by season (winter, spring summer and autumn). They are then asked about how often they participate at the coast or inland, and whether
they are a club member for these activities.
In 2007 a new question was added to the survey which looked into boat ownership. In 2008 and 2009 these questions were included again and refined to find out about boat ownership overall as well as boats kept in the UK. The questions regarding boat ownership are asked of the respondent in reference to the whole household with the following definitions added for each boat type:- Small sailing boat (a dinghy, day boat or other small keelboat, usually taken out of water at
end of use) Sailing Yacht (usually with cooking facilities and a place suitable for sleeping) Power Boat (a craft that can plane over water excluding RIBS/Sportsboats) Day Motor Boat (river or coastal boat without cooking facilities and a place suitable for
sleeping) Other Motor Boat (river or coastal boat with cooking facilities and a place suitable for
sleeping) Canal Boat (narrowboat or boat designed for inland waterways) Sportsboats and RIBS/Inflatables (excluding power boats - usually with an engine and not
including seaside inflatables) Personal Watercraft e.g. Jetski
In 2009 two new questions were added to the questionnaire. These questions were asked of activity categories, i.e. sailing activities, power/motor boating activities and watersport activities rather than individual activities. Respondents who had not participated in any of the activities in a given category in the past
12 months were asked whether they had participated in the past. If this was the case, they were asked why they had stopped participating.
Respondents who had participated in at least one activity in the respective category in the past 12 months were asked when they started to participate and what made them start.
The Data
A brief overview of how to interpret the tables is given with Table 1. Each section of the report is supported by written commentary explaining any assumptions made and to assist interpretation of the data. All figures from 2005 onwards include participants in Northern Ireland.
When assessing the contents of this report it must be remembered that only a small number of people from the surveyed sample take part in some of the measured activities. Small base sizes for these activities mean that small fluctuations in numbers have a sizeable effect on the weighted data that is reported. Activities where the base sizes are very small and therefore the results should be taken as indicative only have been marked with a ‘*’.

Watersports and Leisure Participation Report 2009 Page 14 of 64
In the next column we convert our best estimate participation rate for 2009 into an estimate of likely numbers of participants in each activity. These are based on a total population 16+ of 49,051,000 in the UK.In the next 2 columns we show the participant numbers at the 90% confidence interval. E.g. we are 90% confident that the number of participants in coastal walking lies between 4,703,000 and 5,215,000 people. The population numbers prior to 2005 did not include Northern Ireland and this should be taken into account when making comparisons with earlier numbers.
The next four columns give an indication of our lower and upper estimates of participation within different levels of confidence. For example, we are 90% confident, that the participation rate for Yacht racing lies between 0.14% and 0.27% of the UK adult population in 2009.
The first column of Table 1 titled ‘% for 2009’ is our best estimate of participation rates for each activity in 2009. The figure of 26.28% is our best estimate for participation in ‘any’ of the 21 activities. We also show the best estimate of actual participation in any of the original 12 watersports as measured by the survey. This participation rate is 7.21% (labelled ‘Any boating activity’). However, it should be borne in mind that any estimate based on a sample of the population is only accurate within the statistical confidence interval outlined above.
2. Participation in Surveyed Leisure Activities 2009
Table 1 Watersports and Leisure Participation 2009 of UK Respondents
Min Max Min 90% Max 90%
% for 2009 95% 90% 90% 95%Number of
participantsNumber of
participantsAny Activity 26.28% 25.52% 25.64% 26.93% 27.05% 12,892,598 12,578,000 13,207,000Any boating activity 7.21% 6.76% 6.83% 7.58% 7.66% 3,534,359 3,350,000 3,719,000Small sailboat activities or yacht cruising 1.77% 1.54% 1.58% 1.97% 2.00% 869,754 775,000 964,000Small sailboat racing or yacht racing 0.44% 0.33% 0.35% 0.54% 0.56% 218,067 171,000 266,000Motor boating / cruising or canal boating 1.60% 1.38% 1.42% 1.78% 1.82% 783,693 694,000 873,000Canoeing 2.57% 2.30% 2.34% 2.80% 2.85% 1,262,478 1,149,000 1,376,000Water skiing 0.64% 0.50% 0.53% 0.76% 0.78% 315,233 258,000 372,000Small sail boat activities 1.13% 0.95% 0.98% 1.29% 1.32% 555,432 480,000 631,000Rowing/Sculling 0.71% 0.57% 0.59% 0.84% 0.86% 349,587 290,000 410,000Windsurfing 0.54% 0.41% 0.43% 0.64% 0.67% 263,982 212,000 316,000Using personal watercraft 0.69% 0.54% 0.57% 0.81% 0.83% 336,472 278,000 395,000Motor boating/Cruising 0.96% 0.79% 0.82% 1.10% 1.13% 472,233 402,000 542,000Yacht cruising 0.78% 0.63% 0.65% 0.91% 0.94% 383,615 321,000 447,000Power boating 1.16% 0.98% 1.01% 1.32% 1.35% 569,881 493,000 646,000Small sail boat racing 0.30% 0.21% 0.22% 0.38% 0.40% 147,566 108,000 187,000Canal boating 0.65% 0.51% 0.54% 0.77% 0.79% 320,213 263,000 378,000Yacht racing 0.20% 0.12% 0.14% 0.27% 0.28% 99,049 67,000 131,000Surfboarding 1.32% 1.12% 1.15% 1.48% 1.52% 645,827 564,000 727,000Kitesurfing 0.11% 0.06% 0.07% 0.16% 0.17% 56,397 32,000 81,000Angling (from a boat) 0.97% 0.80% 0.82% 1.11% 1.14% 474,110 404,000 544,000Angling (from the shore) 1.74% 1.52% 1.55% 1.94% 1.97% 855,934 762,000 949,000Cliff climbing 0.80% 0.65% 0.67% 0.93% 0.96% 393,897 330,000 458,000Coastal walking 10.03% 9.50% 9.59% 10.46% 10.55% 4,917,530 4,703,000 5,132,000Outdoor swimming 10.19% 9.66% 9.75% 10.63% 10.72% 4,998,774 4,783,000 5,215,000Leisure sub-aqua diving (from the shore and boat) 0.91% 0.74% 0.77% 1.05% 1.07% 444,868 377,000 513,000Spending general leisure time at the beach 11.85% 11.29% 11.38% 12.32% 12.41% 5,812,279 5,581,000 6,043,000Base 12,683 49,051,000 49,051,000 49,051,000
Participation rate 2009 Number of participants 2009 (including Northern Ireland)
Number of participants for
2009
Source: Watersports and Leisure Omnibus Survey 2009 (Base: all respondents - 12,683 adults aged 16+)

Watersports and Leisure Participation Report 2009 Page 15 of 64
Table 2 compares the participation rates as established in the 2009 survey with 2008 participation rates for comparison.
The 2009 data shows a significant increase in participation rates for ‘any activity’ and ‘any boating activity’ compared with 2008, by individual activity: 8 show statistically significant rises, 6 show insignificant rises, 2 activities have stayed stable, and 5 show a drop insignificant drops participation ratesSignificant changes are highlighted in bold in the table below.
In interpreting the figures it is important to consider whether they reflect a real change in participation or a random fluctuation measurement5. As the degree of change increases, the likelihood that it is caused by random variation declines and it is increasingly likely to reflect a real change. The figures in the column ‘Significance Measure’ indicate how likely it is that the observed changes is real. The figures are highlighted in red if the change is great enough to make us more than 90% confident that it is a real change. The 90% confidence level indicates that in less than 1 in 10 cases is a change of this magnitude likely to be just a random fluctuation. In 2009 a third of all the changes are considered to be large enough to indicate reliable changes in participation.
Table 2 Difference in Participation Rates 2009-2008
Participation rate 2009
Participation rate 2008
Change (percentage
points) SignificanceAny Activity 26.28% 23.03% 3.26% 100.0%Any boating activity 7.21% 6.20% 1.01% 99.9%Small sailboat activities or yacht cruising 1.77% 1.62% 0.15% 65.1%Small sailboat racing or yacht racing 0.44% 0.38% 0.06% 57.2%Motor boating / cruising or canal boating 1.60% 1.60% 0.00% 1.7%Canoeing 2.57% 1.98% 0.60% 99.9%Water skiing 0.64% 0.60% 0.04% 34.4%Small sail boat activities 1.13% 0.87% 0.26% 96.2%Rowing/Sculling 0.71% 0.38% 0.33% 100.0%Windsurfing 0.54% 0.35% 0.19% 97.7%Using personal watercraft 0.69% 0.69% 0.00% 0.4%Motor boating/Cruising 0.96% 1.09% -0.13% 70.2%Yacht cruising 0.78% 0.85% -0.06% 42.3%Power boating 1.16% 0.58% 0.58% 100.0%Small sail boat racing 0.30% 0.25% 0.05% 54.3%Canal boating 0.65% 0.54% 0.11% 76.2%Yacht racing 0.20% 0.20% 0.00% 4.2%Surfboarding 1.32% 1.02% 0.29% 97.0%Kitesurfing 0.11% 0.13% -0.02% 32.1%Angling (from a boat) 0.97% 0.82% 0.14% 77.3%Angling (from the shore) 1.74% 1.90% -0.15% 64.3%Cliff climbing 0.80% 0.72% 0.09% 58.0%Coastal walking 10.03% 10.42% -0.40% 70.5%Outdoor swimming 10.19% 8.42% 1.78% 100.0%Leisure sub-aqua diving (from the shore and boat) 0.91% 0.73% 0.17% 87.3%Spending general leisure time at the beach 11.85% 9.01% 2.84% 100.0%Base 12,683 12,637 Source Watersports and Leisure Omnibus Surveys 2009 and 2008 (Base: all respondents – 12,683 and 12,637 adults aged 16+)
5 For example in 2008 we estimated Water skiing participation at 0.60%, in 2009 we have estimated it at 0.64%. This is an increase of 0.04 percentage points. This increase is significant only at a confidence level of 34.4%. It is usual to only consider changes above the 90% confidence level as statistically significant therefore this increase is interpreted as likely to be a result of random data fluctuation rather than a real change in the participation rate.
Watersports and Leisure Participation Report 2009 Page 16 of 64
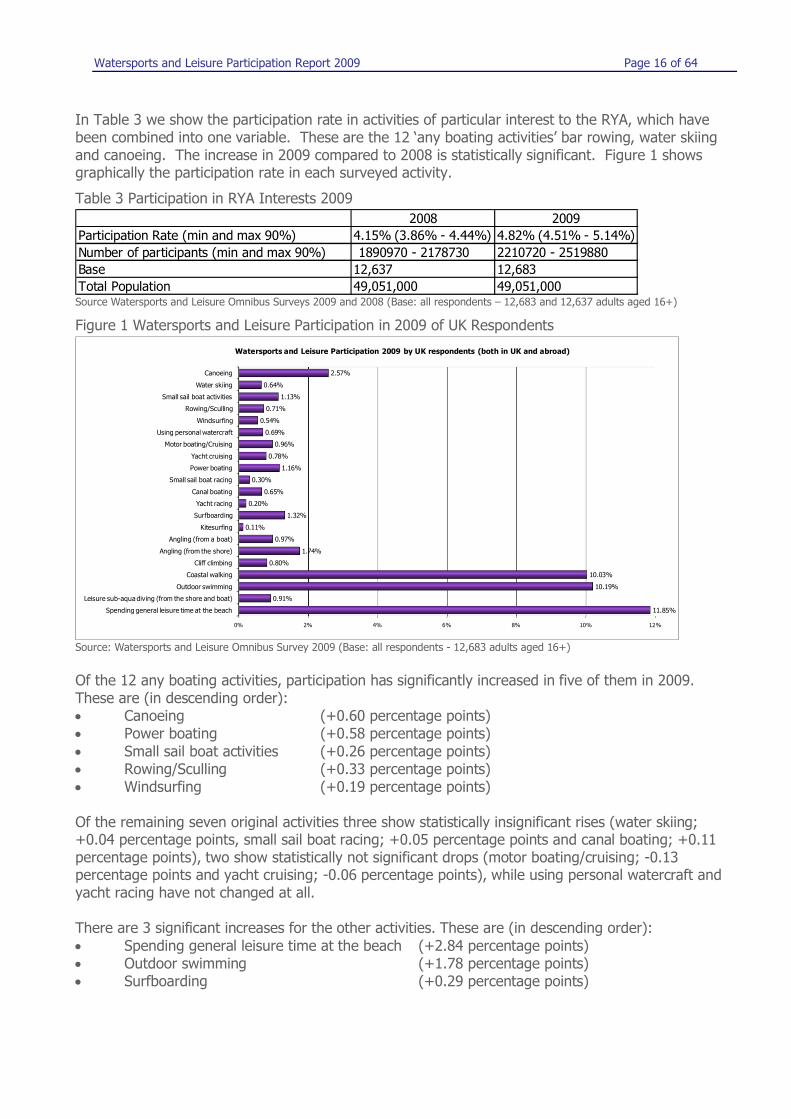
In Table 3 we show the participation rate in activities of particular interest to the RYA, which have been combined into one variable. These are the 12 ‘any boating activities’ bar rowing, water skiing and canoeing. The increase in 2009 compared to 2008 is statistically significant. Figure 1 shows graphically the participation rate in each surveyed activity.
Table 3 Participation in RYA Interests 20092008 2009
4.15% (3.86% - 4.44%) 4.82% (4.51% - 5.14%)1890970 - 2178730 2210720 - 2519880
12,637 12,68349,051,000 49,051,000Total Population
Base
Participation Rate (min and max 90%)Number of participants (min and max 90%)
Source Watersports and Leisure Omnibus Surveys 2009 and 2008 (Base: all respondents – 12,683 and 12,637 adults aged 16+)
Figure 1 Watersports and Leisure Participation in 2009 of UK Respondents
0% 2% 4% 6% 8% 10% 12%
Canoeing
Water skiing
Small sail boat activities
Rowing/Sculling
Windsurfing
Using personal watercraft
Motor boating/Cruising
Yacht cruising
Power boating
Small sail boat racing
Canal boating
Yacht racing
Surfboarding
Kitesurfing
Angling (from a boat)
Angling (from the shore)
Cliff climbing
Coastal walking
Outdoor swimming
Leisure sub-aqua diving (from the shore and boat)
Spending general leisure time at the beach
2.57%
0.64%
1.13%
0.71%
0.54%
0.69%
0.96%
0.78%
1.16%
0.30%
0.65%
0.20%
1.32%
0.11%
0.97%
1.74%
0.80%
10.03%
10.19%
0.91%
11.85%
Watersports and Leisure Participation 2009 by UK respondents (both in UK and abroad)
Source: Watersports and Leisure Omnibus Survey 2009 (Base: all respondents - 12,683 adults aged 16+)
Of the 12 any boating activities, participation has significantly increased in five of them in 2009. These are (in descending order): Canoeing (+0.60 percentage points) Power boating (+0.58 percentage points) Small sail boat activities (+0.26 percentage points) Rowing/Sculling (+0.33 percentage points) Windsurfing (+0.19 percentage points)
Of the remaining seven original activities three show statistically insignificant rises (water skiing; +0.04 percentage points, small sail boat racing; +0.05 percentage points and canal boating; +0.11 percentage points), two show statistically not significant drops (motor boating/cruising; -0.13 percentage points and yacht cruising; -0.06 percentage points), while using personal watercraft and yacht racing have not changed at all.
There are 3 significant increases for the other activities. These are (in descending order): Spending general leisure time at the beach (+2.84 percentage points) Outdoor swimming (+1.78 percentage points) Surfboarding (+0.29 percentage points)

Watersports and Leisure Participation Report 2009 Page 17 of 64
Overall trends in participation
With each year we track participation we can be increasingly confident about the general levels of participation in each activity and can perceive long term trends within the data. Figure 2 shows a linear trend line for ‘Any boating activity’ from 2002 to 2009 (blue line) and the actual rises and falls in participation (purple dotted line). The regression line for ‘Any boating activity’ shows a slight declining trend, which over the 8 year period suggests a reduction in participation of approximately 12%.
Figure 2 Overall Trends in Participation for Any Boating Activity 2002 – 2009
8.2%
7.2%
8.1%
6.8% 7.3%
7.8%
6.2%
7.2%
0.0%
1.0%
2.0%
3.0%
4.0%
5.0%
6.0%
7.0%
8.0%
9.0%
2002 2003 2004 2005 2006 2007 2008 2009
Any boating activity
Figure 3 shows the trends for ‘any activity’ from 2005-2009. The participation rate is now at the same level as in 2005 however we interpret the trend as a long term decline despite the upturn in 2009. The trend is very much influenced by participation rates in popular activities such as ‘outdoor swimming’ and ‘spending general leisure time at the beach’.
Figure 3 Overall Trends in Participation for Any Activity 2002 – 2009
26.3%
28.0% 29.6%
23.0%
26.3%
0.0%
5.0%
10.0%
15.0%
20.0%
25.0%
30.0%
35.0%
2005 2006 2007 2008 2009
Any activity
Trends in Activities
The following charts give insight into the participation trends for activities group into three categories: sailing sports - (small sail boat racing, other small sail boat activities, yacht racing, yacht cruising and windsurfing); power sports - (power boating, general motor boating, canal boating, and using personal watercraft); manual sports - (canoeing, rowing and water-skiing)
Yacht sailing, yacht cruising and small sail boat racing have stayed stable over the past years; the very small fluctuations that have taken place are not significant. Conversely the other sailing sports, windsurfing and other small sail boat activities, have experienced a significant increase in 2009 after a drop in 2008. In power sports, power boating shows considerable growth after reaching a low point in 2008. Canal boating has increased slightly and motor boating/cruising shows a slight decline. Using personal watercraft has remained stable to last year. Manual sports, after showing consistent downward trends in previous years, now show increases for two activities (canoeing and rowing), while participation in water skiing has remained stable.

Watersports and Leisure Participation Report 2009 Page 18 of 64
After large declines in activity in 2008 from 2007 ‘spending general leisure time at the beach’ and ‘outdoor swimming’ both record increases in 2009. ‘Coastal walking’, and ‘angling from the shore’ on the other hand continue to decline. Most of the other activities show slight increases or stable developments.
Since 2002, motor boating/cruising and canal boating remain the only activities which show an upwards trend line of the 12 any boating activities and power boating and yacht cruising show a stable trend.
Figure 4 Trends in Watersports and Leisure Participation 2002 to 2009
0.0%
0.5%
1.0%
1.5%
2.0%
2002 2003 2004 2005 2006 2007 2008 2009
Trends in participation of sailing sports
Small sail boat activitiesWindsurfing
Yacht cruising
Small sail boat racing
Yacht racing
0.0%
0.5%
1.0%
1.5%
2.0%
2002 2003 2004 2005 2006 2007 2008 2009
Trends in participation of power sports
Using personal watercraftMotor boating/Cruising
Power boating
Canal boating
0.0%
0.5%
1.0%
1.5%
2.0%
2.5%
3.0%
2002 2003 2004 2005 2006 2007 2008 2009
Trends in participation of manual sports
Canoeing
Water skiing
Rowing/Sculling
0.0%
2.0%
4.0%
6.0%
8.0%
10.0%
12.0%
14.0%
2004 2005 2006 2007 2008 2009
Trends in other activities (1)
Coastal walking
Outdoor swimming
Spending general leisure time at the beach
0.0%
0.5%
1.0%
1.5%
2.0%
2.5%
3.0%
2004 2005 2006 2007 2008 2009
Trends in other activities (2)
Surfboarding
Kitesurfing
Angling (from a boat)
Angling (from the shore)
Cliff climbing
Leisure sub-aqua diving (from the shore and boat)
Watersports and Leisure Participation Report 2009 Page 19 of 64
Participation by Socio-Demographic Group
The following tables show participation by age, gender, socio-economic group (SEG) as well as lifestage and ethnicity. For each of these groups there are two tables. One showing the participation rates as a percentage and a second that that converts these percentages into participant numbers for the UK adult population (those aged 16+), i.e. Great Britain and Northern Ireland.
Participation by Gender
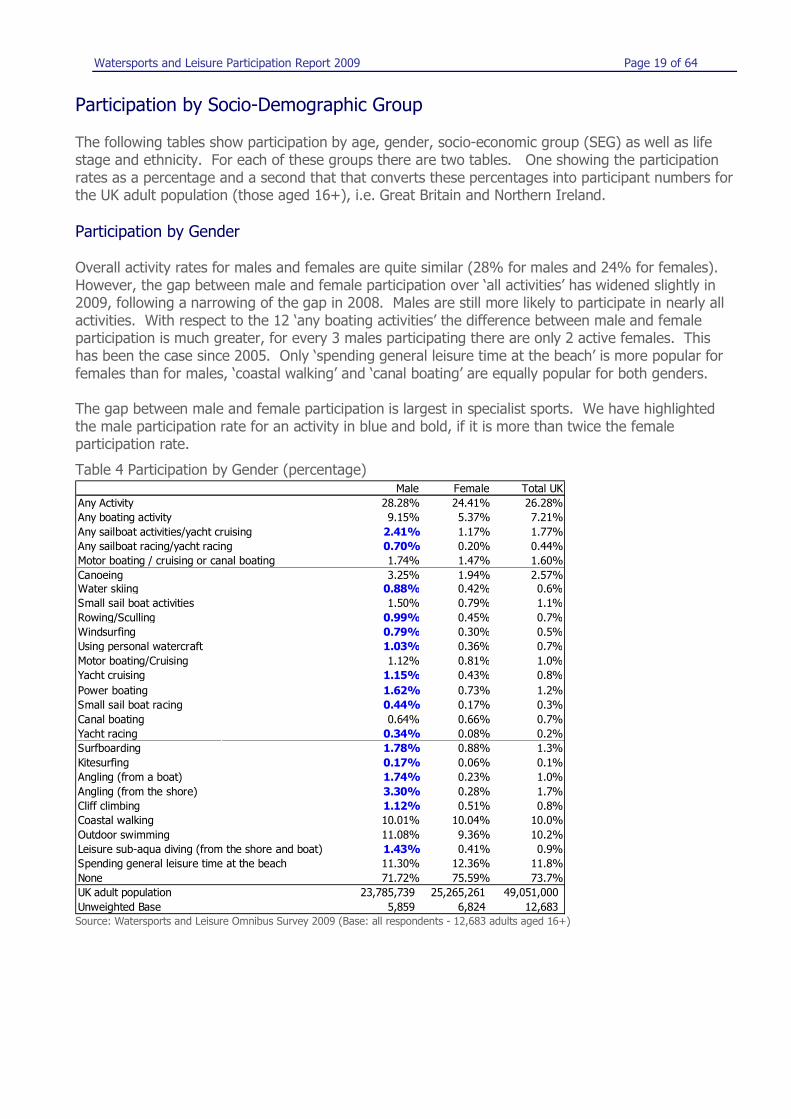
Overall activity rates for males and females are quite similar (28% for males and 24% for females). However, the gap between male and female participation over ‘all activities’ has widened slightly in 2009, following a narrowing of the gap in 2008. Males are still more likely to participate in nearly all activities. With respect to the 12 ‘any boating activities’ the difference between male and female participation is much greater, for every 3 males participating there are only 2 active females. This has been the case since 2005. Only ‘spending general leisure time at the beach’ is more popular for females than for males, ‘coastal walking’ and ‘canal boating’ are equally popular for both genders.
The gap between male and female participation is largest in specialist sports. We have highlighted the male participation rate for an activity in blue and bold, if it is more than twice the female participation rate.
Table 4 Participation by Gender (percentage)Male Female Total UK
Any Activity 28.28% 24.41% 26.28%Any boating activity 9.15% 5.37% 7.21%Any sailboat activities/yacht cruising 2.41% 1.17% 1.77%Any sailboat racing/yacht racing 0.70% 0.20% 0.44%Motor boating / cruising or canal boating 1.74% 1.47% 1.60%Canoeing 3.25% 1.94% 2.57%Water skiing 0.88% 0.42% 0.6%Small sail boat activities 1.50% 0.79% 1.1%Rowing/Sculling 0.99% 0.45% 0.7%Windsurfing 0.79% 0.30% 0.5%Using personal watercraft 1.03% 0.36% 0.7%Motor boating/Cruising 1.12% 0.81% 1.0%Yacht cruising 1.15% 0.43% 0.8%Power boating 1.62% 0.73% 1.2%Small sail boat racing 0.44% 0.17% 0.3%Canal boating 0.64% 0.66% 0.7%Yacht racing 0.34% 0.08% 0.2%Surfboarding 1.78% 0.88% 1.3%Kitesurfing 0.17% 0.06% 0.1%Angling (from a boat) 1.74% 0.23% 1.0%Angling (from the shore) 3.30% 0.28% 1.7%Cliff climbing 1.12% 0.51% 0.8%Coastal walking 10.01% 10.04% 10.0%Outdoor swimming 11.08% 9.36% 10.2%Leisure sub-aqua diving (from the shore and boat) 1.43% 0.41% 0.9%Spending general leisure time at the beach 11.30% 12.36% 11.8%None 71.72% 75.59% 73.7%UK adult population 23,785,739 25,265,261 49,051,000Unweighted Base 5,859 6,824 12,683 Source: Watersports and Leisure Omnibus Survey 2009 (Base: all respondents - 12,683 adults aged 16+)

Watersports and Leisure Participation Report 2009 Page 20 of 64
Table 5 Participation by Gender (participants)Male Female Total UK
Any Activity 6,725,455 6,167,143 12,892,598Any boating activity 2,177,288 1,357,072 3,534,359 Any sailboat activities/yacht cruising 573,002 296,752 869,754 Any sailboat racing/yacht racing 166,784 51,282 218,067 Motor boating / cruising or canal boating 412,754 370,939 783,693 Canoeing 772,293 490,185 1,262,478 Water skiing 208,127 107,105 315,233 Small sail boat activities 355,855 199,578 555,432 Rowing/Sculling 235,807 113,781 349,587 Windsurfing 186,964 77,019 263,982 Using personal watercraft 245,692 90,780 336,472 Motor boating/Cruising 266,547 205,686 472,233 Yacht cruising 274,523 109,092 383,615 Power boating 385,326 184,555 569,881 Small sail boat racing 103,665 43,901 147,566 Canal boating 152,926 167,287 320,213 Yacht racing 79,928 19,121 99,049 Surfboarding 422,955 222,873 645,827 Kitesurfing 40,036 16,361 56,397 Angling (from a boat) 415,024 59,086 474,110 Angling (from the shore) 785,449 70,485 855,934 Cliff climbing 265,709 128,188 393,897 Coastal walking 2,381,248 2,536,282 4,917,530 Outdoor swimming 2,634,867 2,363,907 4,998,774 Leisure sub-aqua diving (from the shore and boat) 341,219 103,649 444,868 Spending general leisure time at the beach 2,688,560 3,123,719 5,812,279 None 17,060,284 19,098,118 36,158,402UK adult population 23,785,739 25,265,261 49,051,000Unweighted Base 5,859 6,824 12,683 Source: Watersports and Leisure Omnibus Survey 2009 (Base: all respondents - 12,683 adults aged 16+)
We also looked male and female participation rates over the past 8 years by activity. Changes in male participation by activity tend to follow the overall trend for most activities. Overall the male trends is stable or downward for most activities. Female participation rates show less variation year on year, and the overall trend in female participation for many activities is very slightly positive.
Table 6 Participation Trends by Gender (percentage)
2002 2003 2004 2005 2006 2007 2008 2009Any activity n/a n/a n/a 28.3% 29.6% 31.6% 24.4% 28.3%Any boating activity 11.0% 10.1% 11.1% 8.6% 8.9% 9.6% 7.4% 9.2%
Small sailboat activities or yacht cruising 2.7% 1.9% 2.5% 2.2% 1.8% 2.4% 1.9% 2.4%
Small sailboat racing or yacht racing 1.2% 1.5% 1.4% 0.6% 0.7% 1.1% 0.6% 0.7%
Motor boating / cruising or canal boating 1.9% 1.8% 1.9% 1.9% 2.2% 2.5% 1.8% 1.7%Canoeing 3.6% 3.1% 3.6% 2.9% 3.0% 2.6% 2.4% 3.2%Water skiing 2.3% 1.8% 1.8% 1.0% 1.0% 1.2% 0.7% 0.9%Small sail boat activities 1.7% 0.9% 1.5% 1.4% 1.2% 1.4% 1.0% 1.5%Rowing 1.8% 1.6% 2.0% 1.2% 1.2% 1.0% 0.5% 1.0%Windsurfing 1.6% 1.1% 1.7% 0.8% 0.7% 0.7% 0.6% 0.8%Using personal watercraft 1.9% 1.8% 1.9% 1.1% 0.7% 0.7% 1.0% 1.0%Motor boating/Cruising 1.3% 1.3% 1.3% 1.4% 1.6% 1.5% 1.2% 1.1%Yacht cruising 1.3% 1.0% 1.2% 0.9% 0.7% 1.1% 1.1% 1.2%Power boating 1.1% 1.2% 1.5% 1.0% 1.0% 1.0% 0.8% 1.6%Small sail boat racing 0.9% 1.2% 1.2% 0.4% 0.5% 0.7% 0.4% 0.4%Canal boating 0.5% 0.7% 0.8% 0.5% 0.7% 1.1% 0.6% 0.6%Yacht racing 0.5% 0.4% 0.4% 0.2% 0.3% 0.5% 0.3% 0.3%Surfboarding n/a n/a 1.8% 1.7% 1.7% 1.8% 1.3% 1.8%Kitesurfing n/a n/a 0.3% 0.4% 0.1% 0.3% 0.3% 0.2%Angling (from a boat) n/a n/a 2.4% 1.7% 2.0% 2.2% 1.4% 1.7%Angling (from the shore) n/a n/a 4.5% 3.5% 4.0% 4.5% 3.4% 3.3%Cliff climbing n/a n/a 1.4% 1.3% 1.1% 1.4% 0.9% 1.1%Coastal walking n/a n/a 10.9% 12.3% 12.2% 13.3% 10.4% 10.0%Outdoor swimming n/a n/a 12.9% 10.9% 12.7% 12.1% 8.5% 11.1%Leisure sub-aqua diving (from the shore and boat) n/a n/a 2.3% 1.7% 0.9% 1.2% 0.8% 1.4%Spending general leisure time at the beach n/a n/a 10.5% 10.6% 11.4% 11.9% 8.2% 11.3%
Male
Watersports and Leisure Participation Report 2009 Page 21 of 64
2002 2003 2004 2005 2006 2007 2008 2009Any activity n/a n/a n/a 24.4% 26.6% 27.7% 21.7% 24.4%Any boating activity 5.6% 4.5% 5.3% 5.2% 5.7% 6.2% 5.1% 5.4%
Small sailboat activities or yacht cruising 1.4% 1.1% 1.6% 1.2% 1.6% 1.3% 1.3% 1.2%
Small sailboat racing or yacht racing 0.6% 0.5% 0.4% 0.3% 0.5% 0.4% 0.2% 0.2%
Motor boating / cruising or canal boating 1.1% 1.0% 1.1% 1.5% 1.8% 2.2% 1.5% 1.5%Canoeing 1.6% 1.4% 1.7% 1.4% 1.5% 1.7% 1.6% 1.9%Water skiing 1.2% 0.7% 0.6% 0.5% 0.4% 0.4% 0.5% 0.4%Small sail boat activities 0.9% 0.7% 1.1% 0.8% 1.0% 0.9% 0.8% 0.8%Rowing 0.8% 0.8% 0.8% 0.8% 0.6% 0.4% 0.3% 0.5%Windsurfing 0.8% 0.4% 0.5% 0.4% 0.4% 0.3% 0.1% 0.3%Using personal watercraft 0.5% 0.3% 0.3% 0.4% 0.4% 0.4% 0.4% 0.4%Motor boating/Cruising 0.8% 0.6% 0.5% 1.0% 0.8% 1.3% 1.0% 0.8%Yacht cruising 0.6% 0.5% 0.6% 0.4% 0.7% 0.5% 0.6% 0.4%Power boating 0.6% 0.6% 0.5% 0.5% 0.5% 0.4% 0.4% 0.7%Small sail boat racing 0.6% 0.4% 0.4% 0.2% 0.3% 0.3% 0.1% 0.2%Canal boating 0.4% 0.5% 0.6% 0.6% 0.9% 0.9% 0.5% 0.7%Yacht racing 0.2% 0.1% 0.2% 0.1% 0.2% 0.2% 0.1% 0.1%Surfboarding n/a n/a 0.7% 0.9% 0.9% 0.8% 0.7% 0.9%Kitesurfing n/a n/a 0.1% 0.1% 0.1% 0.1% 0.0% 0.1%Angling (from a boat) n/a n/a 0.3% 0.3% 0.3% 0.3% 0.3% 0.2%Angling (from the shore) n/a n/a 0.5% 0.5% 0.6% 0.5% 0.5% 0.3%Cliff climbing n/a n/a 0.8% 0.6% 0.7% 0.7% 0.5% 0.5%Coastal walking n/a n/a 10.1% 12.0% 12.3% 13.4% 10.5% 10.0%Outdoor swimming n/a n/a 11.6% 10.3% 12.0% 10.8% 8.4% 9.4%Leisure sub-aqua diving (from the shore and boat) n/a n/a 0.8% 0.7% 0.7% 0.6% 0.6% 0.4%Spending general leisure time at the beach n/a n/a 9.9% 12.3% 13.6% 14.3% 9.8% 12.4%
Female
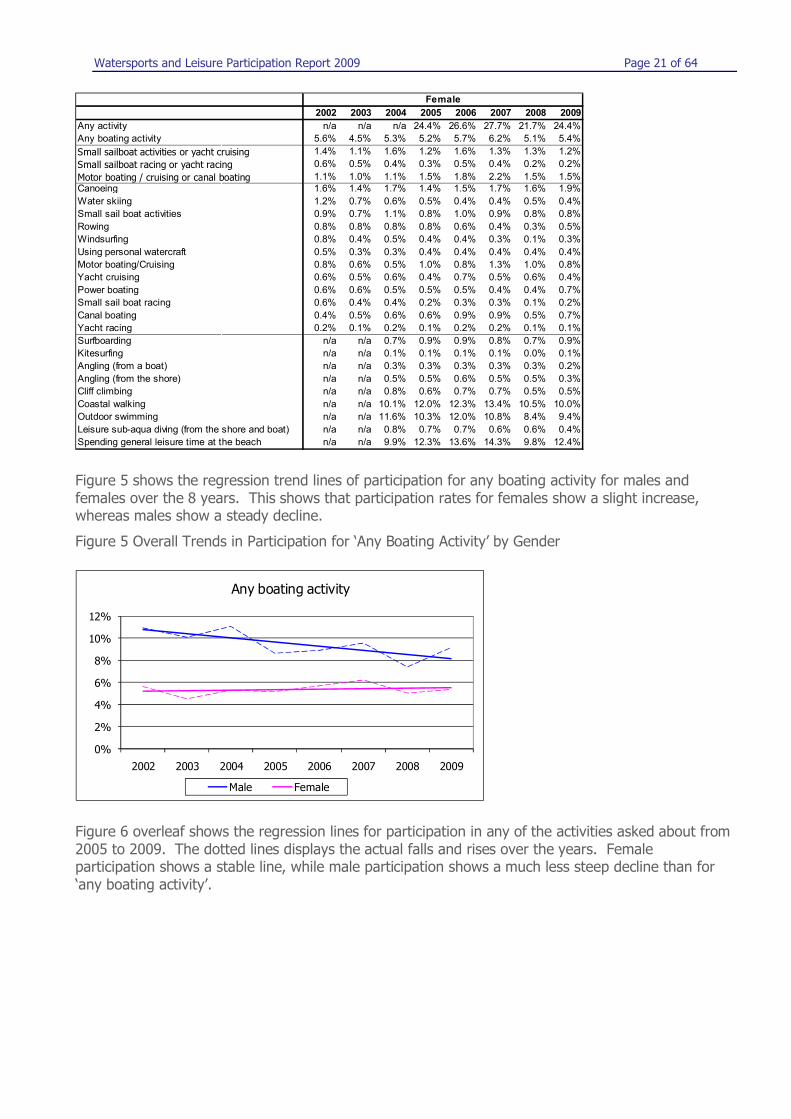
Figure 5 shows the regression trend lines of participation for any boating activity for males and females over the 8 years. This shows that participation rates for females show a slight increase, whereas males show a steady decline.
Figure 5 Overall Trends in Participation for ‘Any Boating Activity’ by Gender
0%
2%
4%
6%
8%
10%
12%
2002 2003 2004 2005 2006 2007 2008 2009
Any boating activity
Male Female
Figure 6 overleaf shows the regression lines for participation in any of the activities asked about from 2005 to 2009. The dotted lines displays the actual falls and rises over the years. Female participation shows a stable line, while male participation shows a much less steep decline than for ‘any boating activity’.

Watersports and Leisure Participation Report 2009 Page 22 of 64
Figure 6 Overall Trends in Participation for ‘Any Activity’ by Gender
0%
2%
4%
6%
8%
10%
12%
2005 2006 2007 2008 2009
Any activity
Male Female
Participation by Age
After a drop in activity across all age groups in 2008 the 2009 participation rates in most activities show a recovery. As in previous years people in the 35-54 age group are the most active across ‘any activity’, and the under 35s remain the most active age group for the more strenuous ‘any boating activities’. For each activity the age group with the highest proportion of participants has been highlighted in blue and bold.
35 to 54 year olds, had reduced their participation in 2008 in 20 out of the 21 activities, but in 2009 have increases in 15 activities. The under 35s have also seen an increase in 15 activities while for the 55+ it is 11 activities.
31% of the 35-54 age group participated in at least one activity over the last 12 months. They recorded a smaller decline in participation in 2008 than the younger age group and in 2009 they show a smaller increase, suggesting that they are more stable in their participation patterns.

Watersports and Leisure Participation Report 2009 Page 23 of 64
Table 7 Participation by Age Group (percentage)
16-34 35-54 55+ Total UKAny Activity 29.69% 30.95% 18.51% 26.28%Any boating activity 10.13% 8.64% 3.18% 7.21%Any sailboat activities/yacht cruising 1.80% 2.20% 1.31% 1.77%Any sailboat racing/yacht racing 0.55% 0.55% 0.24% 0.44%Motor boating / cruising or canal boating 1.67% 1.87% 1.26% 1.60%Canoeing 4.21% 3.13% 0.58% 2.57%Water skiing 1.33% 0.53% 0.16% 0.64%Small sail boat activities 1.16% 1.48% 0.75% 1.13%Rowing/Sculling 1.44% 0.51% 0.29% 0.71%Windsurfing 0.92% 0.64% 0.09% 0.54%Using personal watercraft 1.64% 0.51% 0.04% 0.69%Motor boating/Cruising 1.07% 1.06% 0.77% 0.96%Yacht cruising 0.78% 0.89% 0.67% 0.78%Power boating 1.60% 1.73% 0.19% 1.16%Small sail boat racing 0.42% 0.38% 0.12% 0.30%Canal boating 0.61% 0.81% 0.53% 0.65%Yacht racing 0.21% 0.23% 0.17% 0.20%Surfboarding 2.73% 1.30% 0.10% 1.32%Kitesurfing 0.29% 0.06% 0.02% 0.11%Angling (from a boat) 1.05% 1.20% 0.66% 0.97%Angling (from the shore) 1.97% 2.17% 1.11% 1.74%Cliff climbing 1.51% 0.84% 0.15% 0.80%Coastal walking 7.58% 13.04% 9.04% 10.03%Outdoor swimming 13.58% 12.84% 4.51% 10.19%Leisure sub-aqua diving (from the shore and boat) 1.33% 1.18% 0.25% 0.91%Spending general leisure time at the beach 12.08% 14.71% 8.70% 11.85%None 70.31% 69.05% 81.49% 73.72%UK adult population 14,695,003 17,447,606 16,908,391 49051000Unweighted Base 3,358 4,097 5,228 12683
Age groups
Source: Watersports and Leisure Omnibus Survey 2009 (Base: all respondents - 12,683 adults aged 16+)
The larger number of people in the 35-54 age groups reduces the absolute differences, for example the number of people participating in ‘any boating activity’ is higher in the 35-54 age group despite the fact that 16-34 year olds have a higher participation rate. For each activity the age group with the highest absolute number of participants has been highlighted in blue and bold.
Table 8 Participation by Age Group (participants)
16-34 35-54 55+ Total UKAny Activity 4,362,939 5,399,563 3,130,097 12,892,598 Any boating activity 1,488,265 1,507,684 538,410 3,534,359 Any sailboat activities/yacht cruising 264,758 384,037 220,959 869,754 Any sailboat racing/yacht racing 81,372 95,472 41,223 218,067 Motor boating / cruising or canal boating 245,435 325,745 212,512 783,693 Canoeing 618,123 545,846 98,508 1,262,478 Water skiing 196,117 92,372 26,744 315,233 Small sail boat activities 170,666 257,394 127,373 555,432 Rowing/Sculling 211,648 89,431 48,508 349,587 Windsurfing 135,787 112,390 15,805 263,982 Using personal watercraft 240,658 89,007 6,807 336,472 Motor boating/Cruising 157,307 185,246 129,681 472,233 Yacht cruising 114,575 156,028 113,012 383,615 Power boating 235,065 302,004 32,812 569,881 Small sail boat racing 61,295 65,664 20,608 147,566 Canal boating 90,163 140,499 89,552 320,213 Yacht racing 30,407 40,331 28,311 99,049 Surfboarding 401,504 226,623 17,700 645,827 Kitesurfing 42,323 10,280 3,795 56,397 Angling (from a boat) 154,146 209,103 110,862 474,110 Angling (from the shore) 289,611 378,205 188,118 855,934 Cliff climbing 221,599 146,113 26,185 393,897 Coastal walking 1,114,154 2,275,679 1,527,697 4,917,530 Outdoor swimming 1,995,585 2,239,818 763,372 4,998,774 Leisure sub-aqua diving (from the shore and boat) 195,766 206,736 42,366 444,868 Spending general leisure time at the beach 1,775,211 2,566,642 1,470,425 5,812,279 None 10,332,064 12,048,044 13,778,294 36,158,402 UK adult population 14,695,003 17,447,606 16,908,391 49,051,000 Unweighted Base 3,358 4,097 5,228 12683
Age groups
Source: Watersports and Leisure Omnibus Survey 2009 (Base: all respondents - 12,683 adults aged 16+)

Watersports and Leisure Participation Report 2009 Page 24 of 64
When looking at participation by age over the past 8 years, despite occasional annual increases the 16-34 age group has been in significant overall decline for all measured activities (except canal boating). The 35-54 age group has seen a slight increase in participation and the 55+ age group shows a stable picture for most activities.
Table 9 Participation Trends by Age 2002 -2009
2002 2003 2004 2005 2006 2007 2008Any activity n/a n/a n/a 32.0% 32.7% 33.7% 29.7%Any boating activity 15.0% 12.8% 12.9% 11.4% 10.6% 10.9% 10.1%Any sailboat activities/yacht cruising 2.5% 2.1% 2.9% 2.1% 2.1% 2.0% 1.8%Any sailboat racing/yacht racing 1.6% 1.7% 1.6% 0.7% 0.8% 0.9% 0.6%Motor boating / cruising or canal boating 2.0% 2.1% 1.8% 2.1% 2.4% 2.5% 1.7%Canoeing 5.5% 4.7% 5.3% 4.3% 3.8% 3.7% 4.2%Water skiing 3.6% 2.8% 2.3% 1.6% 1.3% 1.4% 1.3%Small sail boat activities 1.6% 1.1% 2.3% 1.7% 1.5% 1.3% 1.2%Rowing/Sculling 2.5% 2.5% 2.8% 1.9% 1.6% 1.2% 1.4%Windsurfing 2.1% 1.3% 1.9% 1.2% 1.1% 0.8% 0.9%Using personal watercraft 2.7% 2.5% 1.8% 1.5% 1.1% 1.1% 1.6%Motor boating/Cruising 1.6% 1.4% 1.3% 1.5% 1.7% 1.6% 1.1%Yacht cruising 1.3% 1.0% 0.9% 0.6% 0.7% 0.7% 0.8%Power boating 1.5% 1.7% 1.4% 1.2% 0.9% 0.9% 1.6%Small sail boat racing 1.3% 1.3% 1.4% 0.6% 0.5% 0.7% 0.4%Canal boating 0.3% 0.9% 0.5% 0.6% 0.8% 1.0% 0.6%Yacht racing 0.6% 0.5% 0.4% 0.1% 0.3% 0.3% 0.2%Surfboarding n/a n/a 2.4% 2.7% 3.0% 2.3% 2.7%Kitesurfing n/a n/a 0.4% 0.5% 0.2% 0.3% 0.3%Angling (from a boat) n/a n/a 1.5% 1.1% 1.3% 1.1% 1.0%Angling (from the shore) n/a n/a 2.9% 2.2% 2.2% 2.5% 2.0%Cliff climbing n/a n/a 2.0% 2.2% 1.8% 1.8% 1.5%Coastal walking n/a n/a 8.3% 10.9% 11.0% 11.1% 7.6%Outdoor swimming n/a n/a 15.8% 14.9% 16.8% 15.7% 13.6%Leisure sub-aqua diving (from the shore and boat) n/a n/a 2.6% 2.0% 0.9% 1.3% 1.3%Spending general leisure time at the beach n/a n/a 10.6% 12.8% 14.6% 14.2% 12.1%
16-34
2002 2003 2004 2005 2006 2007 2008 2009Any activity n/a n/a n/a 17.4% 18.8% 20.4% 17.0% 18.5%Any boating activity 2.8% 2.2% 2.8% 2.7% 3.0% 3.3% 3.0% 3.2%Any sailboat activities/yacht cruising 1.2% 1.1% 1.2% 1.3% 0.8% 1.1% 1.2% 1.3%Any sailboat racing/yacht racing 0.2% 0.6% 0.4% 0.3% 0.2% 0.3% 0.2% 0.2%Motor boating / cruising or canal boating 1.0% 0.7% 0.6% 1.0% 1.5% 1.5% 1.4% 1.3%Canoeing 0.3% 0.4% 0.3% 0.4% 0.5% 0.2% 0.2% 0.6%Water skiing 0.2% 0.0% 0.2% 0.1% 0.1% 0.1% 0.0% 0.2%Small sail boat activities 0.6% 0.6% 0.4% 0.8% 0.3% 0.5% 0.5% 0.8%Rowing/Sculling 0.2% 0.3% 0.4% 0.2% 0.3% 0.1% 0.2% 0.3%Windsurfing 0.1% 0.1% 0.1% 0.0% 0.0% 0.1% 0.0% 0.1%Using personal watercraft 0.1% 0.0% 0.2% 0.1% 0.0% 0.1% 0.0% 0.0%Motor boating/Cruising 0.6% 0.3% 0.2% 0.5% 0.9% 0.8% 0.9% 0.8%Yacht cruising 0.7% 0.5% 0.8% 0.5% 0.6% 0.7% 0.8% 0.7%Power boating 0.3% 0.3% 0.0% 0.3% 0.3% 0.4% 0.2% 0.2%Small sail boat racing 0.2% 0.4% 0.3% 0.1% 0.2% 0.1% 0.1% 0.1%Canal boating 0.4% 0.4% 0.5% 0.6% 0.6% 0.7% 0.6% 0.5%Yacht racing 0.0% 0.2% 0.1% 0.1% 0.1% 0.2% 0.2% 0.2%Surfboarding n/a n/a 0.1% 0.1% 0.1% 0.1% 0.1% 0.1%Kitesurfing n/a n/a 0.0% 0.0% 0.0% 0.0% 0.0% 0.0%Angling (from a boat) n/a n/a 0.7% 0.5% 0.5% 1.0% 0.7% 0.7%Angling (from the shore) n/a n/a 1.2% 0.7% 1.4% 1.4% 1.6% 1.1%Cliff climbing n/a n/a 0.2% 0.1% 0.2% 0.2% 0.1% 0.2%Coastal walking n/a n/a 9.2% 9.8% 9.9% 11.2% 9.9% 9.0%Outdoor swimming n/a n/a 5.2% 4.7% 5.9% 4.8% 4.1% 4.5%Leisure sub-aqua diving (from the shore and boat) n/a n/a 0.4% 0.3% 0.2% 0.2% 0.2% 0.3%Spending general leisure time at the beach n/a n/a 5.8% 7.3% 7.8% 8.7% 6.0% 8.7%
55+
Figure 7 shows the best fit trend lines of participation for ‘any boating activity’ for the 3 age groups over the 8 years. The very significant decline in participation among 16-34 year olds is a cause for concern as this age group will be essential to maintain future active participation.

Watersports and Leisure Participation Report 2009 Page 25 of 64
Figure 7 Overall Trends in Participation for ‘Any Boating Activity’ by Age
0%
2%
4%
6%
8%
10%
12%
14%
16%
2002 2003 2004 2005 2006 2007 2008 2009
Any boating activity
16-34 35-54 55+
Figure 8 Overall Trends in Participation for ‘Any activity’ by Age
0%
5%
10%
15%
20%
25%
30%
35%
40%
2005 2006 2007 2008 2009
Any activity
16-34 35-54 55+
Participation by SEG
The socio-economic group AB6 has generally a substantially higher participation rate than the other groups. 39% of this group participated in at least one of the measured activities over the last 12 months (up from 35% in 2008). The gap for all activities between the AB and C1 groups has stayed very similar in 2009 compared to 2008, with a difference of 8.6% between these two groups in 2009 compared to 8.8% in 2008.
In 2009 only two activities - kitesurfing and angling from the shore - are more popular in the C1-E groups than in the AB group. This is similar to 2007, however in 2008 there were 6 activities with higher participation rates in the C1-E groups. For each activity the age group with the highest proportion of participants has been highlighted in blue and bold in Table 10.
6 Broadly, ABs are managerial and professional occupations; higher or intermediate managerial, administrative and professional roles. C1s are junior managerial, administrative and professional roles, supervisory or clerical. C2DEs are manual roles (skilled, semi and unskilled) or those who have never worked or are long-term unemployed.

Watersports and Leisure Participation Report 2009 Page 26 of 64
Table 10 Participation by SEG (percentages)
AB C1 C2DE Total UKAny Activity 38.79% 30.20% 19.04% 26.28%Any boating activity 12.20% 8.46% 4.49% 7.21%Any sailboat activities/yacht cruising 4.07% 1.87% 0.80% 1.77%Any sailboat racing/yacht racing 0.65% 0.54% 0.30% 0.44%Motor boating / cruising or canal boating 2.63% 1.64% 1.16% 1.60%Canoeing 4.28% 3.42% 1.41% 2.57%Water skiing 1.00% 0.90% 0.35% 0.64%Small sail boat activities 2.66% 1.16% 0.51% 1.13%Rowing/Sculling 1.18% 0.99% 0.36% 0.71%Windsurfing 1.17% 0.54% 0.29% 0.54%Using personal watercraft 1.25% 0.65% 0.48% 0.69%Motor boating/Cruising 1.61% 1.01% 0.68% 0.96%Yacht cruising 1.78% 0.86% 0.34% 0.78%Power boating 2.11% 1.33% 0.69% 1.16%Small sail boat racing 0.46% 0.34% 0.21% 0.30%Canal boating 1.09% 0.63% 0.49% 0.65%Yacht racing 0.31% 0.25% 0.13% 0.20%Surfboarding 2.12% 1.76% 0.74% 1.32%Kitesurfing 0.10% 0.20% 0.07% 0.11%Angling (from a boat) 1.18% 1.01% 0.85% 0.97%Angling (from the shore) 1.54% 1.85% 1.77% 1.74%Cliff climbing 1.12% 1.06% 0.53% 0.80%Coastal walking 18.07% 11.40% 6.02% 10.03%Outdoor swimming 15.70% 12.80% 6.49% 10.19%Leisure sub-aqua diving (from the shore and boat) 1.31% 1.27% 0.54% 0.91%Spending general leisure time at the beach 17.68% 13.03% 8.84% 11.85%None 61.21% 69.80% 80.96% 73.72%UK adult population 9,902,680 14,316,459 24,831,861 49,051,000 Unweighted Base 2,334 3,263 7,086 12683
SEG
Source: Watersports and Leisure Omnibus Survey 2009 (Base: all respondents - 12,683 adults aged 16+)
The much greater number of people in the C1 and C2DE socio-economic group compared to those in the AB group means that despite lower participation rates for most of the activities, they are often the largest participation group in absolute numbers. For example, the participation rate for canoeing is 4.3% for AB and 3.4% for the C1 group, however this equates to 423,989 and 489,423 people respectively. For each activity the socio-economic group with the highest absolute number of participants has been highlighted in blue and bold.
Table 11 Participation by SEG (participants)
AB C1 C2DE Total UKAny Activity 3,841,676 4,323,721 4,727,202 12,892,598 Any boating activity 1,208,397 1,211,853 1,114,110 3,534,359 Any sailboat activities/yacht cruising 403,320 268,081 198,352 869,754 Any sailboat racing/yacht racing 64,613 78,000 75,455 218,067 Motor boating / cruising or canal boating 260,200 234,680 288,813 783,693 Canoeing 423,989 489,423 349,066 1,262,478 Water skiing 98,600 128,691 87,942 315,233 Small sail boat activities 263,886 165,964 125,582 555,432 Rowing/Sculling 116,907 142,242 90,438 349,587 Windsurfing 115,387 76,598 71,997 263,982 Using personal watercraft 123,632 93,384 119,456 336,472 Motor boating/Cruising 159,362 144,286 168,586 472,233 Yacht cruising 175,912 122,763 84,940 383,615 Power boating 208,752 190,884 170,244 569,881 Small sail boat racing 45,886 48,385 53,295 147,566 Canal boating 107,558 90,395 122,261 320,213 Yacht racing 30,702 35,857 32,490 99,049 Surfboarding 209,723 252,337 183,768 645,827 Kitesurfing 10,095 28,790 17,512 56,397 Angling (from a boat) 117,133 144,746 212,231 474,110 Angling (from the shore) 152,159 265,274 438,502 855,934 Cliff climbing 110,512 151,152 132,232 393,897 Coastal walking 1,789,805 1,631,816 1,495,909 4,917,530 Outdoor swimming 1,554,981 1,833,170 1,610,624 4,998,774 Leisure sub-aqua diving (from the shore and boat) 129,374 181,479 134,016 444,868 Spending general leisure time at the beach 1,750,473 1,865,971 2,195,834 5,812,279 None 6,061,004 9,992,738 20,104,659 36,158,402 UK adult population 9,902,680 14,316,459 24,831,861 49,051,000 Unweighted Base 2,334 3,263 7,086 12683
SEG
Source: Watersports and Leisure Omnibus Survey 2009 (Base: all respondents - 12,683 adults aged 16+)
Watersports and Leisure Participation Report 2009 Page 27 of 64
Participation by Ethnicity
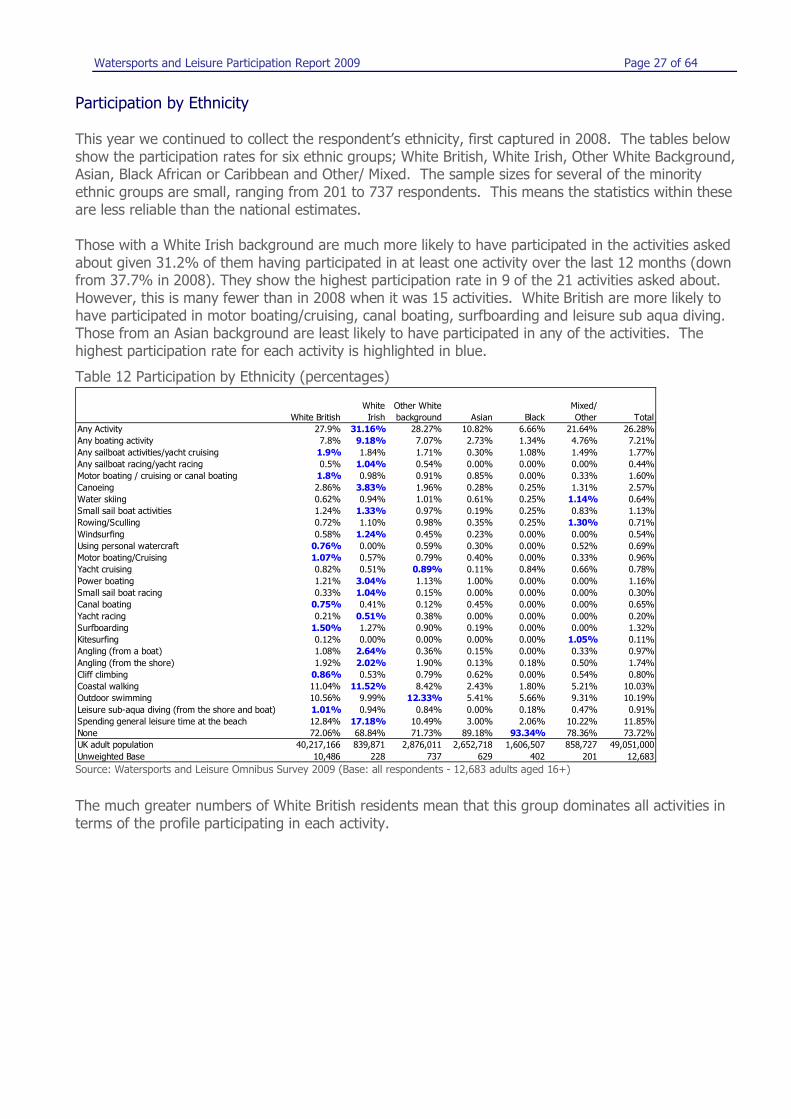
This year we continued to collect the respondent’s ethnicity, first captured in 2008. The tables below show the participation rates for six ethnic groups; White British, White Irish, Other White Background, Asian, Black African or Caribbean and Other/ Mixed. The sample sizes for several of the minority ethnic groups are small, ranging from 201 to 737 respondents. This means the statistics within these are less reliable than the national estimates.
Those with a White Irish background are much more likely to have participated in the activities asked about given 31.2% of them having participated in at least one activity over the last 12 months (down from 37.7% in 2008). They show the highest participation rate in 9 of the 21 activities asked about. However, this is many fewer than in 2008 when it was 15 activities. White British are more likely to have participated in motor boating/cruising, canal boating, surfboarding and leisure sub aqua diving. Those from an Asian background are least likely to have participated in any of the activities. The highest participation rate for each activity is highlighted in blue.
Table 12 Participation by Ethnicity (percentages)
White BritishWhite Irish
Other White background Asian Black
Mixed/ Other Total
Any Activity 27.9% 31.16% 28.27% 10.82% 6.66% 21.64% 26.28%Any boating activity 7.8% 9.18% 7.07% 2.73% 1.34% 4.76% 7.21%Any sailboat activities/yacht cruising 1.9% 1.84% 1.71% 0.30% 1.08% 1.49% 1.77%Any sailboat racing/yacht racing 0.5% 1.04% 0.54% 0.00% 0.00% 0.00% 0.44%Motor boating / cruising or canal boating 1.8% 0.98% 0.91% 0.85% 0.00% 0.33% 1.60%Canoeing 2.86% 3.83% 1.96% 0.28% 0.25% 1.31% 2.57%Water skiing 0.62% 0.94% 1.01% 0.61% 0.25% 1.14% 0.64%Small sail boat activities 1.24% 1.33% 0.97% 0.19% 0.25% 0.83% 1.13%Rowing/Sculling 0.72% 1.10% 0.98% 0.35% 0.25% 1.30% 0.71%Windsurfing 0.58% 1.24% 0.45% 0.23% 0.00% 0.00% 0.54%Using personal watercraft 0.76% 0.00% 0.59% 0.30% 0.00% 0.52% 0.69%Motor boating/Cruising 1.07% 0.57% 0.79% 0.40% 0.00% 0.33% 0.96%Yacht cruising 0.82% 0.51% 0.89% 0.11% 0.84% 0.66% 0.78%Power boating 1.21% 3.04% 1.13% 1.00% 0.00% 0.00% 1.16%Small sail boat racing 0.33% 1.04% 0.15% 0.00% 0.00% 0.00% 0.30%Canal boating 0.75% 0.41% 0.12% 0.45% 0.00% 0.00% 0.65%Yacht racing 0.21% 0.51% 0.38% 0.00% 0.00% 0.00% 0.20%Surfboarding 1.50% 1.27% 0.90% 0.19% 0.00% 0.00% 1.32%Kitesurfing 0.12% 0.00% 0.00% 0.00% 0.00% 1.05% 0.11%Angling (from a boat) 1.08% 2.64% 0.36% 0.15% 0.00% 0.33% 0.97%Angling (from the shore) 1.92% 2.02% 1.90% 0.13% 0.18% 0.50% 1.74%Cliff climbing 0.86% 0.53% 0.79% 0.62% 0.00% 0.54% 0.80%Coastal walking 11.04% 11.52% 8.42% 2.43% 1.80% 5.21% 10.03%Outdoor swimming 10.56% 9.99% 12.33% 5.41% 5.66% 9.31% 10.19%Leisure sub-aqua diving (from the shore and boat) 1.01% 0.94% 0.84% 0.00% 0.18% 0.47% 0.91%Spending general leisure time at the beach 12.84% 17.18% 10.49% 3.00% 2.06% 10.22% 11.85%None 72.06% 68.84% 71.73% 89.18% 93.34% 78.36% 73.72%UK adult population 40,217,166 839,871 2,876,011 2,652,718 1,606,507 858,727 49,051,000Unweighted Base 10,486 228 737 629 402 201 12,683Source: Watersports and Leisure Omnibus Survey 2009 (Base: all respondents - 12,683 adults aged 16+)
The much greater numbers of White British residents mean that this group dominates all activities in terms of the profile participating in each activity.

Watersports and Leisure Participation Report 2009 Page 28 of 64
Table 13 Participation by Ethnicity (participants)
White BritishWhite
IrishOther White background Asian Black
Mixed/ Other Total
Any Activity 11,237,905 261,708 813,111 287,146 106,914 185,814 12,892,598Any boating activity 3,119,290 77,113 203,230 72,357 21,475 40,895 3,534,359 Any sailboat activities/yacht cruising 767,075 15,451 49,135 7,899 17,398 12,795 869,754 Any sailboat racing/yacht racing 193,908 8,748 15,411 - - - 218,067 Motor boating / cruising or canal boating 723,824 8,222 26,105 22,674 - 2,868 783,693 Canoeing 134,361 8,748 4,457 - - - 147,566 Water skiing 500,328 11,172 27,879 5,030 3,938 7,087 555,432 Small sail boat activities 83,816 4,279 10,954 - - - 99,049 Rowing/Sculling 331,583 4,279 25,714 2,869 13,460 5,709 383,615 Windsurfing 485,548 25,503 32,415 26,414 - - 569,881 Using personal watercraft 431,074 4,786 22,792 10,714 - 2,868 472,233 Motor boating/Cruising 301,504 3,436 3,313 11,960 - - 320,213 Yacht cruising 1,151,023 32,178 56,466 7,496 4,077 11,239 1,262,478 Power boating 287,786 9,201 28,047 9,303 4,077 11,173 349,587 Small sail boat racing 234,616 10,402 12,840 6,124 - - 263,982 Canal boating 248,414 7,871 29,160 16,067 3,938 9,783 315,233 Yacht racing 307,114 - 17,042 7,861 - 4,455 336,472 Surfboarding 604,230 10,707 25,860 5,030 - - 645,827 Kitesurfing 47,347 - - - - 9,050 56,397 Angling (from a boat) 434,790 22,148 10,272 4,032 - 2,868 474,110 Angling (from the shore) 773,707 16,968 54,687 3,340 2,967 4,265 855,934 Cliff climbing 345,816 4,469 22,661 16,328 - 4,624 393,897 Coastal walking 4,440,489 96,752 242,170 64,492 28,894 44,734 4,917,530 Outdoor swimming 5,165,763 144,292 301,680 79,703 33,093 87,748 5,812,279 Leisure sub-aqua diving (from the shore and boat) 4,245,954 83,943 354,510 143,383 90,998 79,986 4,998,774 Spending general leisure time at the beach 405,898 7,879 24,175 - 2,869 4,047 444,868 None 28,979,261 578,163 2,062,900 2,365,571 1,499,593 672,913 36,158,402UK adult population 40,217,166 839,871 2,876,011 2,652,718 1,606,507 858,727 49,051,000Unweighted Base 10,486 228 737 629 402 201 12,683
Source: Watersports and Leisure Omnibus Survey 2009 (Base: all respondents - 12,683 adults aged 16+)
Participation by Life stage
The following tables show the participation rates for the individual activities by life stage. The life stage definitions have been constructed from the information available and are defined as below.
Figure 9 Life Stage Explanation
Life Stage DefinitionStudent/Workers house share
Two or more adults not living as a couple, without children (up to the age of 54).
Single One person living alone either single/widowed/divorced/separated.Couple under 55 Two married or living as married no children and under 55.Single parents One parent with one child or several children in household.Family Household of 2 adults with children.Empty nesters Two people 55 to 65 living in house with no children Greys Two or more people over 64 living in house with no children or living alone and
over 64
Overall couples under the age of 55 remain the most active group, 33.9% participating in at least one activity in 2009.
As in previous years, families record the highest participation for ‘spending general leisure time at the beach’, followed by couples under 55 and empty nesters. Single parents, who were the second most likely group to have spent some time on the beach in 2007, fell to fourth in 2008 and have now dropped to fifth place because of greater growth among other groups.
For the more active activities like canoeing, kitesurfing, windsurfing and cliff climbing, the highest participation rates remain among those living as ‘students/workers in a house-share’. However, in
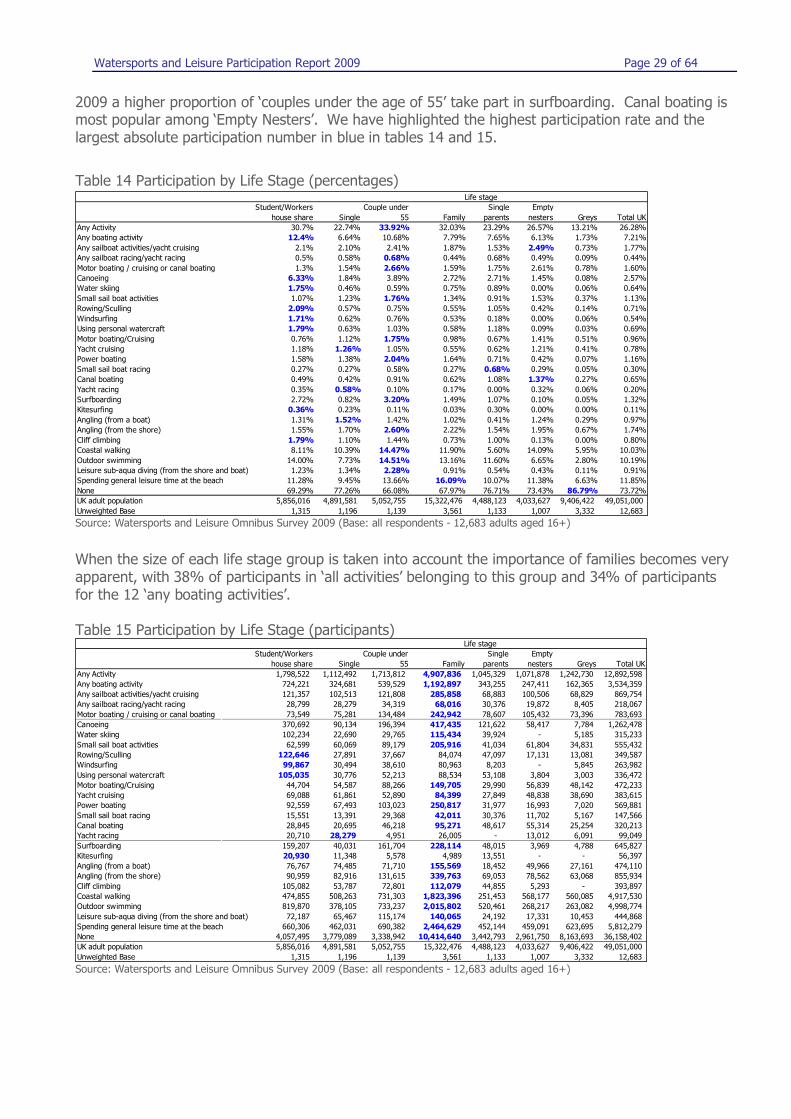
Watersports and Leisure Participation Report 2009 Page 29 of 64
2009 a higher proportion of ‘couples under the age of 55’ take part in surfboarding. Canal boating is most popular among ‘Empty Nesters’. We have highlighted the highest participation rate and the largest absolute participation number in blue in tables 14 and 15.
Table 14 Participation by Life Stage (percentages)
Student/Workers house share Single
Couple under 55 Family
Single parents
Empty nesters Greys Total UK
Any Activity 30.7% 22.74% 33.92% 32.03% 23.29% 26.57% 13.21% 26.28%Any boating activity 12.4% 6.64% 10.68% 7.79% 7.65% 6.13% 1.73% 7.21%Any sailboat activities/yacht cruising 2.1% 2.10% 2.41% 1.87% 1.53% 2.49% 0.73% 1.77%Any sailboat racing/yacht racing 0.5% 0.58% 0.68% 0.44% 0.68% 0.49% 0.09% 0.44%Motor boating / cruising or canal boating 1.3% 1.54% 2.66% 1.59% 1.75% 2.61% 0.78% 1.60%Canoeing 6.33% 1.84% 3.89% 2.72% 2.71% 1.45% 0.08% 2.57%Water skiing 1.75% 0.46% 0.59% 0.75% 0.89% 0.00% 0.06% 0.64%Small sail boat activities 1.07% 1.23% 1.76% 1.34% 0.91% 1.53% 0.37% 1.13%Rowing/Sculling 2.09% 0.57% 0.75% 0.55% 1.05% 0.42% 0.14% 0.71%Windsurfing 1.71% 0.62% 0.76% 0.53% 0.18% 0.00% 0.06% 0.54%Using personal watercraft 1.79% 0.63% 1.03% 0.58% 1.18% 0.09% 0.03% 0.69%Motor boating/Cruising 0.76% 1.12% 1.75% 0.98% 0.67% 1.41% 0.51% 0.96%Yacht cruising 1.18% 1.26% 1.05% 0.55% 0.62% 1.21% 0.41% 0.78%Power boating 1.58% 1.38% 2.04% 1.64% 0.71% 0.42% 0.07% 1.16%Small sail boat racing 0.27% 0.27% 0.58% 0.27% 0.68% 0.29% 0.05% 0.30%Canal boating 0.49% 0.42% 0.91% 0.62% 1.08% 1.37% 0.27% 0.65%Yacht racing 0.35% 0.58% 0.10% 0.17% 0.00% 0.32% 0.06% 0.20%Surfboarding 2.72% 0.82% 3.20% 1.49% 1.07% 0.10% 0.05% 1.32%Kitesurfing 0.36% 0.23% 0.11% 0.03% 0.30% 0.00% 0.00% 0.11%Angling (from a boat) 1.31% 1.52% 1.42% 1.02% 0.41% 1.24% 0.29% 0.97%Angling (from the shore) 1.55% 1.70% 2.60% 2.22% 1.54% 1.95% 0.67% 1.74%Cliff climbing 1.79% 1.10% 1.44% 0.73% 1.00% 0.13% 0.00% 0.80%Coastal walking 8.11% 10.39% 14.47% 11.90% 5.60% 14.09% 5.95% 10.03%Outdoor swimming 14.00% 7.73% 14.51% 13.16% 11.60% 6.65% 2.80% 10.19%Leisure sub-aqua diving (from the shore and boat) 1.23% 1.34% 2.28% 0.91% 0.54% 0.43% 0.11% 0.91%Spending general leisure time at the beach 11.28% 9.45% 13.66% 16.09% 10.07% 11.38% 6.63% 11.85%None 69.29% 77.26% 66.08% 67.97% 76.71% 73.43% 86.79% 73.72%UK adult population 5,856,016 4,891,581 5,052,755 15,322,476 4,488,123 4,033,627 9,406,422 49,051,000Unweighted Base 1,315 1,196 1,139 3,561 1,133 1,007 3,332 12,683
Life stage
Source: Watersports and Leisure Omnibus Survey 2009 (Base: all respondents - 12,683 adults aged 16+)
When the size of each life stage group is taken into account the importance of families becomes very apparent, with 38% of participants in ‘all activities’ belonging to this group and 34% of participants for the 12 ‘any boating activities’.
Table 15 Participation by Life Stage (participants)Student/Workers
house share SingleCouple under
55 FamilySingle
parentsEmpty
nesters Greys Total UKAny Activity 1,798,522 1,112,492 1,713,812 4,907,836 1,045,329 1,071,878 1,242,730 12,892,598Any boating activity 724,221 324,681 539,529 1,192,897 343,255 247,411 162,365 3,534,359 Any sailboat activities/yacht cruising 121,357 102,513 121,808 285,858 68,883 100,506 68,829 869,754 Any sailboat racing/yacht racing 28,799 28,279 34,319 68,016 30,376 19,872 8,405 218,067 Motor boating / cruising or canal boating 73,549 75,281 134,484 242,942 78,607 105,432 73,396 783,693 Canoeing 370,692 90,134 196,394 417,435 121,622 58,417 7,784 1,262,478 Water skiing 102,234 22,690 29,765 115,434 39,924 - 5,185 315,233 Small sail boat activities 62,599 60,069 89,179 205,916 41,034 61,804 34,831 555,432 Rowing/Sculling 122,646 27,891 37,667 84,074 47,097 17,131 13,081 349,587 Windsurfing 99,867 30,494 38,610 80,963 8,203 - 5,845 263,982 Using personal watercraft 105,035 30,776 52,213 88,534 53,108 3,804 3,003 336,472 Motor boating/Cruising 44,704 54,587 88,266 149,705 29,990 56,839 48,142 472,233 Yacht cruising 69,088 61,861 52,890 84,399 27,849 48,838 38,690 383,615 Power boating 92,559 67,493 103,023 250,817 31,977 16,993 7,020 569,881 Small sail boat racing 15,551 13,391 29,368 42,011 30,376 11,702 5,167 147,566 Canal boating 28,845 20,695 46,218 95,271 48,617 55,314 25,254 320,213 Yacht racing 20,710 28,279 4,951 26,005 - 13,012 6,091 99,049 Surfboarding 159,207 40,031 161,704 228,114 48,015 3,969 4,788 645,827 Kitesurfing 20,930 11,348 5,578 4,989 13,551 - - 56,397 Angling (from a boat) 76,767 74,485 71,710 155,569 18,452 49,966 27,161 474,110 Angling (from the shore) 90,959 82,916 131,615 339,763 69,053 78,562 63,068 855,934 Cliff climbing 105,082 53,787 72,801 112,079 44,855 5,293 - 393,897 Coastal walking 474,855 508,263 731,303 1,823,396 251,453 568,177 560,085 4,917,530 Outdoor swimming 819,870 378,105 733,237 2,015,802 520,461 268,217 263,082 4,998,774 Leisure sub-aqua diving (from the shore and boat) 72,187 65,467 115,174 140,065 24,192 17,331 10,453 444,868 Spending general leisure time at the beach 660,306 462,031 690,382 2,464,629 452,144 459,091 623,695 5,812,279 None 4,057,495 3,779,089 3,338,942 10,414,640 3,442,793 2,961,750 8,163,693 36,158,402UK adult population 5,856,016 4,891,581 5,052,755 15,322,476 4,488,123 4,033,627 9,406,422 49,051,000Unweighted Base 1,315 1,196 1,139 3,561 1,133 1,007 3,332 12,683
Life stage
Source: Watersports and Leisure Omnibus Survey 2009 (Base: all respondents - 12,683 adults aged 16+)

Watersports and Leisure Participation Report 2009 Page 30 of 64
Regional Participation
Participation by Residence - ITV Regions
Table 16 provides an indication of the variations in participation in 2009 depending on theresidential area in which the country respondents live. ITV regions have been grouped to provide larger sample sizes and therefore more robust estimates of participation. However, the sample sizes in some of the grouped regions are still relatively small varying between 369 and 4,212. This means the statistics are less reliable than the national estimates.
We have highlighted participation rates where changes are statistically significant compared with 2008. The darker grey (or orange in colour copies) is used to indicate rises in the participation the lighter grey (or blue) to indicate an apparent decline. The numbers of respondents from each region are provided at the bottom of the table. The regions are defined as follows:
Figure 10 ITV RegionsLondon, South East and East England
South, South East, East and London ITV regions (covered by Meridian, LWT & Carlton and Anglia)
The West Wales, South West and West ITV regions (covered by West country, HTV and Central)
Midlands Midlands ITV region (covered by Central)
Northern England North West, North East and Yorkshire ITV regions (covered by Granada, Yorkshire and Tyne Tees)
Scotland Border and Scotland ITV regions (covered by Grampian, Scottish and Border)
Northern Ireland Northern Ireland
In 2009, not surprisingly, there are more significant increases in regional participation rates than there were in 2008. Participation rates for ‘any activity’ have increased significantly for those living across all regions bar Wales/West/South West and Northern Ireland.
‘Any boating activity’ has seen significant increases in London/East/South East, North West/North East/Yorkshire and Midlands, Northern Ireland shows a drop while the remaining regions show insignificant rises. London/East/South East shows the highest number of significant increases (7 activities), closely followed by North West/North East/Yorkshire (6 increases). The only 2 regions with significant drops are Northern Ireland and Wales/West/South West, both showing significantdecreases in 3 activities.
Those living in Wales/West/South West continue to display the highest participation rate for ‘any activity’ of all mainland regions. Overall 32% of those living in Wales/West or South West participated in at least one activity during 2009. Participation in ‘any boating activity’ is highest in the London/East/South East region, as are both sailing categories.
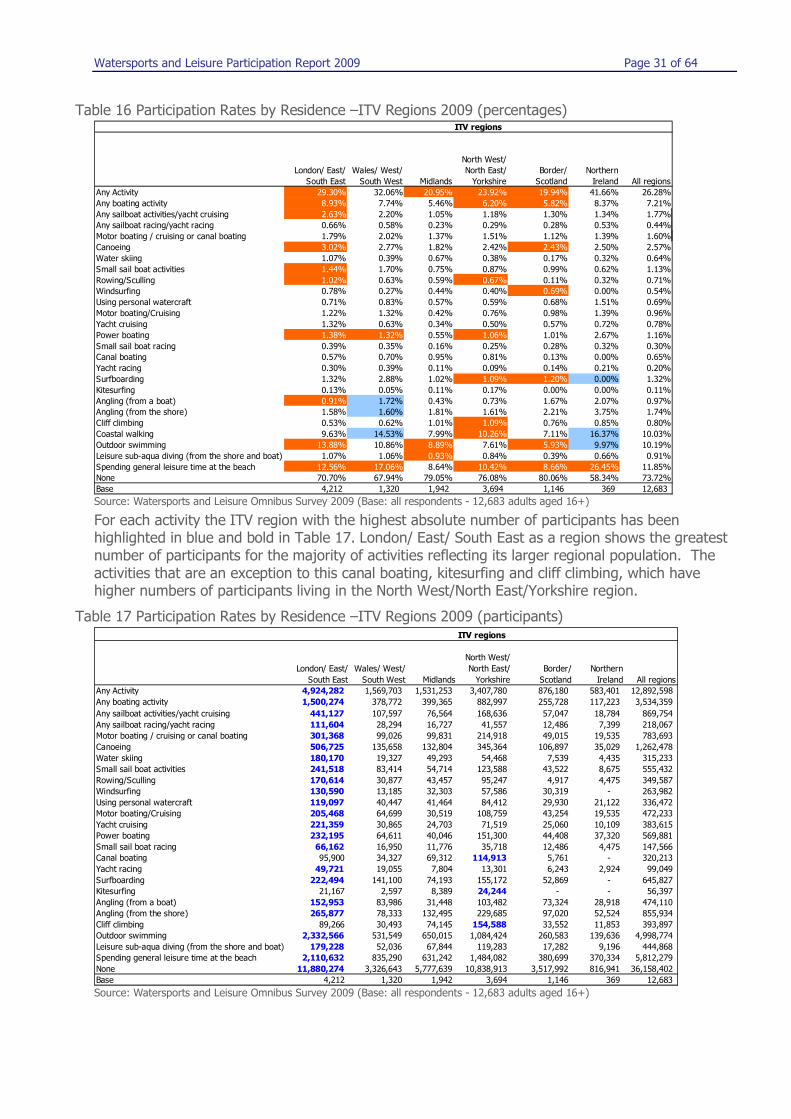
Watersports and Leisure Participation Report 2009 Page 31 of 64
Table 16 Participation Rates by Residence –ITV Regions 2009 (percentages)
London/ East/ South East
Wales/ West/ South West Midlands
North West/ North East/
YorkshireBorder/
ScotlandNorthern
Ireland All regionsAny Activity 29.30% 32.06% 20.95% 23.92% 19.94% 41.66% 26.28%Any boating activity 8.93% 7.74% 5.46% 6.20% 5.82% 8.37% 7.21%Any sailboat activities/yacht cruising 2.63% 2.20% 1.05% 1.18% 1.30% 1.34% 1.77%Any sailboat racing/yacht racing 0.66% 0.58% 0.23% 0.29% 0.28% 0.53% 0.44%Motor boating / cruising or canal boating 1.79% 2.02% 1.37% 1.51% 1.12% 1.39% 1.60%Canoeing 3.02% 2.77% 1.82% 2.42% 2.43% 2.50% 2.57%Water skiing 1.07% 0.39% 0.67% 0.38% 0.17% 0.32% 0.64%Small sail boat activities 1.44% 1.70% 0.75% 0.87% 0.99% 0.62% 1.13%Rowing/Sculling 1.02% 0.63% 0.59% 0.67% 0.11% 0.32% 0.71%Windsurfing 0.78% 0.27% 0.44% 0.40% 0.69% 0.00% 0.54%Using personal watercraft 0.71% 0.83% 0.57% 0.59% 0.68% 1.51% 0.69%Motor boating/Cruising 1.22% 1.32% 0.42% 0.76% 0.98% 1.39% 0.96%Yacht cruising 1.32% 0.63% 0.34% 0.50% 0.57% 0.72% 0.78%Power boating 1.38% 1.32% 0.55% 1.06% 1.01% 2.67% 1.16%Small sail boat racing 0.39% 0.35% 0.16% 0.25% 0.28% 0.32% 0.30%Canal boating 0.57% 0.70% 0.95% 0.81% 0.13% 0.00% 0.65%Yacht racing 0.30% 0.39% 0.11% 0.09% 0.14% 0.21% 0.20%Surfboarding 1.32% 2.88% 1.02% 1.09% 1.20% 0.00% 1.32%Kitesurfing 0.13% 0.05% 0.11% 0.17% 0.00% 0.00% 0.11%Angling (from a boat) 0.91% 1.72% 0.43% 0.73% 1.67% 2.07% 0.97%Angling (from the shore) 1.58% 1.60% 1.81% 1.61% 2.21% 3.75% 1.74%Cliff climbing 0.53% 0.62% 1.01% 1.09% 0.76% 0.85% 0.80%Coastal walking 9.63% 14.53% 7.99% 10.26% 7.11% 16.37% 10.03%Outdoor swimming 13.88% 10.86% 8.89% 7.61% 5.93% 9.97% 10.19%Leisure sub-aqua diving (from the shore and boat) 1.07% 1.06% 0.93% 0.84% 0.39% 0.66% 0.91%Spending general leisure time at the beach 12.56% 17.06% 8.64% 10.42% 8.66% 26.45% 11.85%None 70.70% 67.94% 79.05% 76.08% 80.06% 58.34% 73.72%Base 4,212 1,320 1,942 3,694 1,146 369 12,683
ITV regions
Source: Watersports and Leisure Omnibus Survey 2009 (Base: all respondents - 12,683 adults aged 16+)
For each activity the ITV region with the highest absolute number of participants has been highlighted in blue and bold in Table 17. London/ East/ South East as a region shows the greatest number of participants for the majority of activities reflecting its larger regional population. The activities that are an exception to this canal boating, kitesurfing and cliff climbing, which have higher numbers of participants living in the North West/North East/Yorkshire region.
Table 17 Participation Rates by Residence –ITV Regions 2009 (participants)
London/ East/ South East
Wales/ West/ South West Midlands
North West/ North East/
YorkshireBorder/
ScotlandNorthern
Ireland All regionsAny Activity 4,924,282 1,569,703 1,531,253 3,407,780 876,180 583,401 12,892,598Any boating activity 1,500,274 378,772 399,365 882,997 255,728 117,223 3,534,359 Any sailboat activities/yacht cruising 441,127 107,597 76,564 168,636 57,047 18,784 869,754 Any sailboat racing/yacht racing 111,604 28,294 16,727 41,557 12,486 7,399 218,067 Motor boating / cruising or canal boating 301,368 99,026 99,831 214,918 49,015 19,535 783,693 Canoeing 506,725 135,658 132,804 345,364 106,897 35,029 1,262,478 Water skiing 180,170 19,327 49,293 54,468 7,539 4,435 315,233 Small sail boat activities 241,518 83,414 54,714 123,588 43,522 8,675 555,432 Rowing/Sculling 170,614 30,877 43,457 95,247 4,917 4,475 349,587 Windsurfing 130,590 13,185 32,303 57,586 30,319 - 263,982 Using personal watercraft 119,097 40,447 41,464 84,412 29,930 21,122 336,472 Motor boating/Cruising 205,468 64,699 30,519 108,759 43,254 19,535 472,233 Yacht cruising 221,359 30,865 24,703 71,519 25,060 10,109 383,615 Power boating 232,195 64,611 40,046 151,300 44,408 37,320 569,881 Small sail boat racing 66,162 16,950 11,776 35,718 12,486 4,475 147,566 Canal boating 95,900 34,327 69,312 114,913 5,761 - 320,213 Yacht racing 49,721 19,055 7,804 13,301 6,243 2,924 99,049 Surfboarding 222,494 141,100 74,193 155,172 52,869 - 645,827 Kitesurfing 21,167 2,597 8,389 24,244 - - 56,397 Angling (from a boat) 152,953 83,986 31,448 103,482 73,324 28,918 474,110 Angling (from the shore) 265,877 78,333 132,495 229,685 97,020 52,524 855,934 Cliff climbing 89,266 30,493 74,145 154,588 33,552 11,853 393,897 Outdoor swimming 2,332,566 531,549 650,015 1,084,424 260,583 139,636 4,998,774 Leisure sub-aqua diving (from the shore and boat) 179,228 52,036 67,844 119,283 17,282 9,196 444,868 Spending general leisure time at the beach 2,110,632 835,290 631,242 1,484,082 380,699 370,334 5,812,279 None 11,880,274 3,326,643 5,777,639 10,838,913 3,517,992 816,941 36,158,402Base 4,212 1,320 1,942 3,694 1,146 369 12,683
ITV regions
Source: Watersports and Leisure Omnibus Survey 2009 (Base: all respondents - 12,683 adults aged 16+)

Watersports and Leisure Participation Report 2009 Page 32 of 64
In Table 18 we have combined the 2007 to 2009 samples to provide an aggregate estimate of participation rate over the last three years.
Table 18 Watersports Participation by Residence - ITV Regions– Average 2007-2009Average 2007-2009 ITV region
London/ East/ South East
Wales/ West/ South West Midlands
North West/ North East/
YorkshireBorder/
ScotlandNorthern
Ireland All regionsAny Activity 28.45% 35.93% 22.03% 23.64% 16.69% 44.37% 26.31%Any boating activity 8.33% 7.90% 6.12% 6.25% 4.80% 9.60% 7.08%Any sailboat activities/yacht cruising 2.41% 1.84% 1.37% 1.29% 1.32% 1.87% 1.76%Any sailboat racing/yacht racing 0.75% 0.51% 0.28% 0.40% 0.19% 0.82% 0.51%Motor boating / cruising or canal boating 2.16% 2.00% 1.94% 1.55% 1.04% 2.93% 1.84%Canoeing 2.28% 2.77% 1.90% 2.33% 1.59% 2.42% 2.24%Water skiing 0.94% 0.46% 0.79% 0.52% 0.16% 1.03% 0.68%Small sail boat activities 1.30% 1.21% 1.00% 0.83% 0.90% 0.76% 1.05%Rowing/Sculling 0.85% 0.55% 0.51% 0.51% 0.14% 0.39% 0.59%Windsurfing 0.64% 0.34% 0.38% 0.35% 0.44% 0.23% 0.46%Using personal watercraft 0.64% 0.86% 0.63% 0.53% 0.50% 1.64% 0.64%Motor boating/Cruising 1.47% 1.29% 0.87% 0.86% 0.84% 2.55% 1.16%Yacht cruising 1.29% 0.70% 0.43% 0.54% 0.55% 1.11% 0.82%Power boating 0.95% 1.01% 0.46% 0.73% 0.70% 1.62% 0.82%Small sail boat racing 0.50% 0.24% 0.24% 0.31% 0.19% 0.24% 0.34%Canal boating 0.72% 0.74% 1.19% 0.73% 0.20% 0.64% 0.73%Yacht racing 0.36% 0.36% 0.11% 0.14% 0.06% 0.58% 0.24%Surfboarding 1.21% 3.05% 1.19% 0.78% 0.64% 0.83% 1.20%Kitesurfing 0.20% 0.13% 0.07% 0.15% 0.04% 0.13% 0.14%Angling (from a boat) 0.76% 2.01% 0.77% 0.81% 1.30% 2.63% 1.01%Angling (from the shore) 1.75% 2.97% 1.89% 1.87% 2.00% 4.65% 2.04%Cliff climbing 0.68% 1.12% 0.99% 0.84% 0.75% 1.53% 0.85%Coastal walking 11.32% 18.91% 9.23% 9.98% 6.48% 21.15% 11.26%Outdoor swimming 12.50% 12.49% 9.45% 8.09% 4.82% 10.90% 10.02%Leisure sub-aqua diving (from the shore and boat) 1.00% 1.11% 0.66% 0.75% 0.55% 0.53% 0.84%Spending general leisure time at the beach 11.54% 17.16% 9.37% 10.26% 6.21% 24.06% 11.32%Base 16,541 5,280 6,663 15,419 4,580 1,470 49,953
Source: Watersports and Leisure Omnibus Surveys 2007 - 2009 (Base: all respondents – 49,953 adults aged 16+)
Participation by Residence - Postal Area
The following tables show participation rates in the various activities for respondents living in different postal areas. The regions are made of the following postal areas:
Table 19 Postcode RegionsRegion Postcode AreaSouth SO, PO, GU, BN, RHSouth East CT, TN, ME, SS, CM, SG, AL, LU, HP, SL, MK, OX, RGLondon KT, TW, UB, HA, WD, EN, IG, RM, DA, BR, CR, SM, SW, W, NW, N, E, SE, WC, ECSouth West TR, PL, TQ, EX, TA, DT, BA, BS, GL, SN, SP, BHNorth East DL, TS, DH, SR, NENorth West CW, CH, SK, WA, L, WN, M, OL, BL, PR, FY, BB, LA, CAYorkshire S, WF, LS, DN, HU, YO, HG, BD, HX, HDWest Midlands B, WR, HR, DY, WV, TF, ST, WS, DE, CVEast Midlands NN, PE, LE, NG, LNEast CO, CB, IP, NRScotland DG, TD, EH, ML, KA, PA, G, FK, KY, DD, PH, HS, IV, AB, KW, ZEWales SA, CF, NP, LD, SY, LLNorthern Ireland BT
The sample sizes in some of the regions are still relatively small varying between 369 and 1,930. This means the statistics are less reliable than the national estimates. The region with the largest participation rate (Table 20) and the largest absolute participant number (Table 21) in each activity is highlighted in blue. The tables show that respondents living in the southern regions are more likelythan those living elsewhere to take part in ‘any boating activity’, ‘any sailing/yacht cruising activity’ and ‘any sailboat/yacht racing activity’. Participation rates for ‘any motor boating/cruising or canal boating activity’ are highest in the East. In 2008 the highest participation rate for this boating category was also recorded in the southern regions. Respondents from Northern Ireland are more likely to have participated in ‘any activity’, as was the case in 2008. Maybe not surprisingly, coastal walking is most popular in the South West, given the existence of many accessible coastal paths in this region.

Watersports and Leisure Participation Report 2009 Page 33 of 64
Table 20 Participation Rates by Residence Regions based on Postal Area (percentages)
Source: Watersports and Leisure Omnibus Survey 2009 (Base: all respondents - 12,683 adults aged 16+)
When taking the population of the various regions into account the importance of London becomes more apparent. London records the highest absolute number of participants for 9 of the 21 activities (compared with 10 out of 21 in 2008).
SouthSouth
East LondonSouth West
North East
North West Yorkshire
West Midlands
East Midlands East Scotland Wales
Northern Ireland Total UK
Any Activity 41.3% 32.4% 24.2% 36.6% 18.7% 24.1% 29.9% 20.2% 20.5% 26.1% 17.6% 18.7% 41.7% 26.3%Any boating activity 13.0% 9.5% 7.6% 9.1% 6.1% 5.6% 7.8% 5.6% 5.5% 6.7% 5.1% 4.4% 8.4% 7.2%Any sailboat activities/yacht cruising 4.0% 2.9% 2.2% 2.7% 1.0% 1.6% 1.1% 1.0% 0.7% 2.0% 1.0% 1.0% 1.3% 1.8%Any sailboat racing/yacht racing 1.7% 0.7% 0.5% 0.4% 0.0% 0.5% 0.4% 0.4% 0.0% 0.2% 0.1% 0.5% 0.5% 0.4%Motor boating / cruising or canal boating 2.0% 1.8% 1.5% 2.3% 1.7% 1.2% 1.9% 1.5% 2.1% 2.4% 0.9% 0.8% 1.4% 1.6%Canoeing 5.7% 3.6% 1.9% 3.4% 2.7% 2.7% 2.7% 1.9% 1.8% 1.8% 1.7% 1.6% 2.5% 2.6%Water skiing 1.8% 0.8% 1.2% 0.4% 0.3% 0.5% 0.3% 0.7% 0.7% 0.3% 0.2% 0.3% 0.3% 0.6%Small sail boat activities 2.3% 1.5% 1.1% 2.2% 1.0% 1.0% 0.9% 0.6% 0.7% 1.9% 0.8% 0.6% 0.6% 1.1%Rowing/Sculling 1.1% 1.1% 0.9% 0.8% 0.2% 0.3% 1.5% 0.8% 0.1% 1.5% 0.0% 0.2% 0.3% 0.7%Windsurfing 1.3% 0.9% 0.8% 0.3% 0.0% 0.6% 0.4% 0.7% 0.3% 0.0% 0.6% 0.0% 0.0% 0.5%Using personal watercraft 1.5% 0.7% 0.6% 0.8% 0.2% 0.6% 0.7% 0.5% 0.5% 0.2% 0.7% 0.9% 1.5% 0.7%Motor boating/Cruising 1.5% 0.8% 1.0% 1.4% 1.0% 0.8% 1.0% 0.4% 0.8% 2.0% 0.8% 0.8% 1.4% 1.0%Yacht cruising 2.0% 1.5% 1.3% 0.7% 0.0% 1.0% 0.4% 0.5% 0.2% 0.4% 0.2% 0.4% 0.7% 0.8%Power boating 1.3% 1.5% 1.4% 1.3% 1.2% 0.8% 1.5% 0.7% 0.6% 1.2% 0.9% 0.8% 2.7% 1.2%Small sail boat racing 1.0% 0.4% 0.3% 0.3% 0.0% 0.5% 0.2% 0.3% 0.0% 0.0% 0.1% 0.2% 0.3% 0.3%Canal boating 0.5% 0.9% 0.5% 0.9% 1.0% 0.5% 0.9% 1.1% 1.2% 0.4% 0.1% 0.0% 0.0% 0.7%Yacht racing 0.6% 0.5% 0.2% 0.3% 0.0% 0.2% 0.1% 0.1% 0.0% 0.2% 0.0% 0.3% 0.2% 0.2%Surfboarding 2.4% 1.8% 1.1% 2.8% 1.6% 1.1% 1.0% 1.1% 0.8% 0.3% 1.0% 1.7% 0.0% 1.3%Kitesurfing 0.2% 0.0% 0.2% 0.1% 0.2% 0.3% 0.1% 0.1% 0.2% 0.1% 0.0% 0.0% 0.0% 0.1%Angling (from a boat) 2.0% 0.8% 0.4% 2.3% 0.7% 0.9% 0.9% 0.4% 0.5% 1.2% 1.4% 0.6% 2.1% 1.0%Angling (from the shore) 3.9% 1.4% 0.8% 1.8% 0.2% 1.8% 2.5% 1.9% 1.8% 1.9% 1.9% 1.3% 3.8% 1.7%Cliff climbing 0.4% 0.6% 0.5% 0.4% 0.9% 0.9% 1.5% 1.4% 1.3% 0.4% 0.4% 0.5% 0.8% 0.8%Coastal walking 16.6% 9.2% 8.0% 18.2% 5.5% 10.7% 14.0% 8.7% 7.5% 5.6% 5.5% 6.6% 16.4% 10.0%Outdoor swimming 16.8% 15.5% 13.4% 13.0% 6.2% 7.1% 9.5% 9.2% 8.2% 8.0% 5.3% 4.8% 10.0% 10.2%Leisure sub-aqua diving (from the shore and boat)0.9% 1.6% 0.7% 1.4% 0.7% 0.5% 1.1% 1.2% 0.7% 1.2% 0.4% 0.3% 0.7% 0.9%Spending general leisure time at the beach 15.8% 14.3% 10.5% 17.8% 7.8% 10.1% 14.5% 8.8% 7.9% 11.0% 7.4% 10.8% 26.4% 11.8%None 58.7% 67.6% 75.8% 63.4% 81.3% 75.9% 70.1% 79.8% 79.5% 73.9% 82.4% 81.3% 58.3% 73.7%Base 568 1,292 1,930 1,081 583 1,500 1,205 1,205 762 463 1,099 626 369 12,683
Postcode Area

Watersports and Leisure Participation Report 2009 Page 34 of 64
Table 21 Participation Rates by Residence Regions based on Postal Area (participants)
Source: Watersports and Leisure Omnibus Survey 2009 (Base: all respondents - 12,683 adults aged 16+)
South South East LondonSouth West
North East North West Yorkshire
West Midlands
East Midlands East Scotland Wales
Northern Ireland Total UK
Any Activity 923,514 1,661,036 1,884,661 1,470,261 429,513 1,395,125 1,398,617 914,535 590,507 466,157 740,733 434,538 583,401 12,892,598Any boating activity 290,980 489,086 592,262 366,911 139,922 325,867 363,613 253,989 158,077 120,320 213,745 102,363 117,223 3,534,359Any sailboat activities/yacht cruising 88,618 148,520 174,765 108,931 22,016 89,782 49,532 47,233 20,351 35,866 42,283 23,074 18,784 869,754Any sailboat racing/yacht racing 36,993 35,219 39,008 15,774 0 26,644 17,127 17,903 0 3,238 6,243 12,520 7,399 218,067Motor boating / cruising or canal boating 44,916 90,735 112,844 90,580 38,782 71,598 90,481 67,345 59,393 42,202 37,716 17,567 19,535 783,693Canoeing 128,518 185,462 149,943 135,817 62,589 158,270 127,744 87,549 50,647 32,842 69,971 38,098 35,029 1,262,478Water skiing 40,976 38,872 92,876 16,959 6,455 30,042 12,716 32,239 19,010 5,163 7,539 7,950 4,435 315,233Small sail boat activities 52,280 76,061 82,657 89,166 22,016 57,906 41,728 25,960 20,351 33,192 31,986 13,454 8,675 555,432Rowing/Sculling 25,177 53,908 70,842 32,130 4,042 16,204 71,548 35,895 3,679 27,240 0 4,448 4,475 349,587Windsurfing 29,741 45,720 58,448 13,185 0 35,970 19,115 29,914 7,813 0 24,076 0 0 263,982Using personal watercraft 34,041 37,653 47,799 30,358 3,918 37,277 33,544 22,732 13,013 4,418 29,930 20,669 21,122 336,472Motor boating/Cruising 33,370 42,923 75,062 56,253 22,489 46,515 48,326 18,617 24,409 35,213 31,955 17,567 19,535 472,233Yacht cruising 45,033 75,312 100,566 26,447 0 55,199 16,972 21,273 5,517 7,271 10,297 9,620 10,109 383,615Power boating 28,442 77,762 106,101 52,171 26,659 46,762 69,286 31,436 16,467 21,471 38,165 17,836 37,320 569,881Small sail boat racing 23,413 18,812 26,790 11,259 0 26,644 11,288 12,952 0 0 6,243 5,691 4,475 147,566Canal boating 11,546 47,811 37,783 34,327 23,012 27,116 42,154 48,728 34,984 6,990 5,761 0 0 320,213Yacht racing 13,580 23,539 12,218 12,226 0 13,705 5,839 4,951 0 3,238 0 6,829 2,924 99,049Surfboarding 52,921 93,534 85,119 113,668 37,071 61,423 45,778 48,745 22,516 4,614 41,569 38,870 0 645,827Kitesurfing 4,455 0 14,319 2,597 4,840 16,176 3,228 3,795 4,595 2,393 0 0 0 56,397Angling (from a boat) 44,267 39,752 34,080 91,104 14,935 54,082 41,829 17,111 14,055 21,755 58,007 14,215 28,918 474,110Angling (from the shore) 87,822 70,995 65,700 70,833 5,293 105,925 115,466 84,718 52,705 33,564 80,857 29,531 52,524 855,934Cliff climbing 9,726 30,496 40,434 17,713 21,582 54,295 68,307 63,652 37,176 8,042 17,840 12,780 11,853 393,897Coastal walking 371,099 473,004 621,742 729,802 125,970 617,688 654,892 394,294 216,153 100,673 230,375 152,537 229,302 4,917,530Outdoor swimming 375,842 795,649 1,038,427 520,855 143,184 408,551 444,696 418,507 235,152 142,721 224,341 111,214 139,636 4,998,774Leisure sub-aqua diving (from the shore and boat)19,130 81,306 56,632 57,425 15,788 30,738 52,019 56,297 20,786 21,441 17,282 6,829 9,196 444,868Spending general leisure time at the beach 353,231 734,205 816,445 713,986 179,556 585,522 677,080 397,210 226,584 197,200 309,264 251,661 370,334 5,812,279None 1,314,805 3,463,589 5,890,486 2,549,723 1,866,050 4,395,951 3,275,482 3,615,305 2,292,579 1,321,680 3,466,075 1,889,736 816,941 36,158,402Base 568 1,292 1,930 1,081 583 1,500 1,205 1,205 762 463 1,099 626 369 12,683
Postcode Area

Watersports and Leisure Participation Report 2009 Page 35 of 64
3. Participation History
In 2009 several new questions were added to the watersports and leisure participation survey designed to find out whether those who participated in a boating activity in the past 12 months have done so for the first time, as well as whether those that have not participated in the past 12 months had done so at an earlier time in their life. Respondents who had started to participate within the first 12 months were asked for their reason for starting, while those who had participated at some point in the past but not in the past 12 months were asked why they had stopped participating. A list of reasons was read out and the respondent was able to say which reasons applied in their case.
These questions were asked per category, rather than for individual activities. The categories used were as follows:
Category Contributing activitiesSailing activities Small sail boat racing, small sail boat activities, yacht racing, yacht
cruising, windsurfingPower/Motor boating activities Power boating, motor boating/cruising, canal boatingOther Watersports activities Canoeing, rowing, using personal watercraft and water skiing
Last Participation
The majority of those who have not participated in the various categories in the past 12 months have never participated (between 80% for other watersports and over 90% for power/motor boating). This number could include people who fail to include any casual participation (e.g. on holidays, or when invited by somebody else) because they do not count this as ‘proper’ participation in an activity. Table 22 shows that a significant number of participants ending their participation each year. It appears to be evenly distributed over time scales suggesting a consistent pattern of departures. (The category ‘last participation longer than 5 years ago’ records a higher proportion of past participants because it covers a lot longer time frame than the other two categories.)
Table 22 Last Time Participated (if not participated this year)
13 months to 2 years ago 3-5 years ago
Longer than 5 years ago
Never participated
Number of respondents -
Weighted
Number of respondents -
UnweightedSailing 1.3% 1.7% 8.6% 88.1% 47,880,829 12,418Power/Motor boating 1.5% 1.9% 5.1% 91.4% 47,754,476 12,386Other Watersports 3.5% 3.2% 12.7% 80.2% 47,091,992 12,261Source: Watersports participation survey 2009 (Base: all respondents who have not participated in the respective activity categories in the last 12 months)
First Participation
Of those who have participated in the past 12 months, over 40% have participated for the first time during the past 12 months ie they started participating in 2009. It shows the sports are attracting significant numbers trying out their activity each year.
The proportion of respondents who record that the first participated in the past 12 months might appear inflated because casual participants who dip in and out of an activity may only count their latest phase of participation. However, the fact that so few seemed to have started participating 2-5 years ago suggests that most of this annual influx do not continue to participate consistently each year.
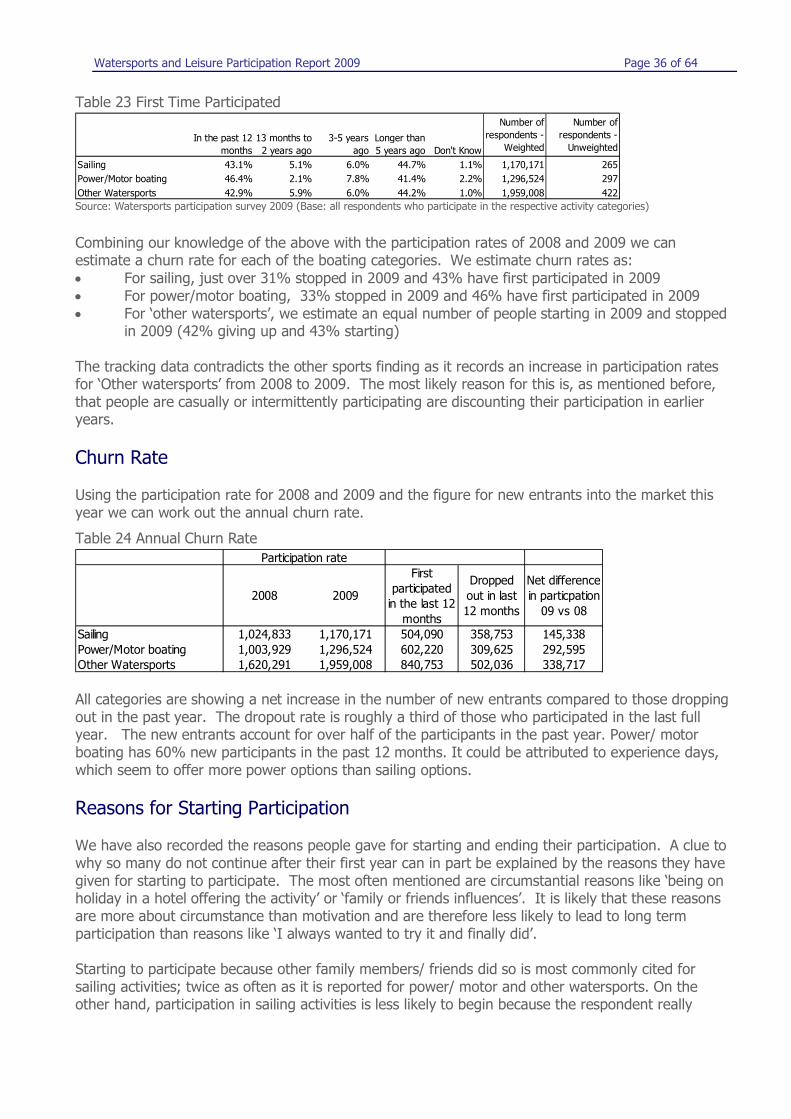
Watersports and Leisure Participation Report 2009 Page 36 of 64
Table 23 First Time Participated
In the past 12 months
13 months to 2 years ago
3-5 years ago
Longer than 5 years ago Don't Know
Number of respondents -
Weighted
Number of respondents -
Unweighted
Sailing 43.1% 5.1% 6.0% 44.7% 1.1% 1,170,171 265Power/Motor boating 46.4% 2.1% 7.8% 41.4% 2.2% 1,296,524 297Other Watersports 42.9% 5.9% 6.0% 44.2% 1.0% 1,959,008 422Source: Watersports participation survey 2009 (Base: all respondents who participate in the respective activity categories)
Combining our knowledge of the above with the participation rates of 2008 and 2009 we can estimate a churn rate for each of the boating categories. We estimate churn rates as: For sailing, just over 31% stopped in 2009 and 43% have first participated in 2009 For power/motor boating, 33% stopped in 2009 and 46% have first participated in 2009 For ‘other watersports’, we estimate an equal number of people starting in 2009 and stopped
in 2009 (42% giving up and 43% starting) The tracking data contradicts the other sports finding as it records an increase in participation rates for ‘Other watersports’ from 2008 to 2009. The most likely reason for this is, as mentioned before, that people are casually or intermittently participating are discounting their participation in earlier years.
Churn Rate
Using the participation rate for 2008 and 2009 and the figure for new entrants into the market this year we can work out the annual churn rate.
Table 24 Annual Churn Rate
2008 2009
First participated
in the last 12 months
Dropped out in last 12 months
Net difference in particpation
09 vs 08
Sailing 1,024,833 1,170,171 504,090 358,753 145,338Power/Motor boating 1,003,929 1,296,524 602,220 309,625 292,595Other Watersports 1,620,291 1,959,008 840,753 502,036 338,717
Participation rate
All categories are showing a net increase in the number of new entrants compared to those dropping out in the past year. The dropout rate is roughly a third of those who participated in the last full year. The new entrants account for over half of the participants in the past year. Power/ motor boating has 60% new participants in the past 12 months. It could be attributed to experience days, which seem to offer more power options than sailing options.
Reasons for Starting Participation
We have also recorded the reasons people gave for starting and ending their participation. A clue to why so many do not continue after their first year can in part be explained by the reasons they have given for starting to participate. The most often mentioned are circumstantial reasons like ‘being on holiday in a hotel offering the activity’ or ‘family or friends influences’. It is likely that these reasons are more about circumstance than motivation and are therefore less likely to lead to long term participation than reasons like ‘I always wanted to try it and finally did’.
Starting to participate because other family members/ friends did so is most commonly cited forsailing activities; twice as often as it is reported for power/ motor and other watersports. On the other hand, participation in sailing activities is less likely to begin because the respondent really

Watersports and Leisure Participation Report 2009 Page 37 of 64
wanted to try it. This bias towards circumstantial rather than motivational reasons for starting suggests participation in sailing activities is likely to be more casual.
Power/motor boating and other watersports activities show similar reasons for starting.
Table 25 to Table 27 show all reasons for starting participating in the boating category in the past 12 months by gender. There are differences in the reasons mentioned by males and females that made them start participating in a sailing activity in the past 12 months. Male reasons are more self referential – ie it is something they want to do, for females they often relate to what family and friends are doing. Males on the other hand are more likely to have wanted to do something new that they haven’t tried before, wanted to find a new hobby or were introduced through a club/training centre. Boating events/shows are also only mentioned by males. The results are highlighted in red if they are at least 20% higher than the results for all respondents, and highlighted in blue if they are at least 20% lower.
Table 25 Reasons for Starting to Participate in Sailing by GenderMale Female All
Other family members\friends started participating so I started it as well 18.7% 25.0% 20.8%I participated on holiday as the hotel\resort offered it 17.7% 24.5% 20.0%Family member\friend bought a boat\equipment and invited me on it\to use it 10.8% 12.6% 11.4%I wanted to do something new that I have never tried before 12.9% 2.4% 9.4%I always wanted to try it and finally did 9.9% 5.5% 8.4%I started participating as a child and continued when I turned 16 3.2% 12.8% 6.5%I wanted to find a new hobby so I thought I would give it a try 8.1% 1.6% 5.9%Club\training centre introduced me to it 6.5% 1.4% 4.8%I have participated in a different boating activity before and wanted to try this one 3.7% 3.6% 3.7%I was given a boating experience\training as a gift 3.8% 2.7% 3.4%My personal circumstances have changed (e.g. retired, children now older) and therefore am able to do it now 2.7% 0.0% 1.8%I read about it in a book\magazine and decided to try it 0.0% 3.3% 1.1%Went to a boating event\boat show which influenced me 1.4% 0.0% 0.9%I moved and now have easy access to water 0.0% 0.0% 0.0%I have seen a TV programme (e.g. TV series\sports etc) where it was featured and decided to try it 0.0% 0.0% 0.0%I saw marketing\advertising (e.g. brochures, adverts on TV\radio\press) and decided to give it a try 0.0% 0.0% 0.0%Other 13.2% 9.3% 11.9%Don't Know 7.4% 4.4% 6.4%Unweighted Base 74 41* 115 Source: Watersports participation survey 2009 (Base: all respondents who participate in the respective activity categories and have done so for the first time in the last 12 months)*Caution: small base size
For power/motor activities participation as part of a holiday is the most important reason, and more so for women than men. Men are more likely to have been started off by other family members or through a boating experience/training gift. There is a large proportion of respondents who apparently don’t know why they participated and also ‘other reason’ not specified. In the next survey we should clarify which other reasons these are.

Watersports and Leisure Participation Report 2009 Page 38 of 64
Table 26 Reasons for Starting to Participate in Power/Motor Boating by GenderMale Female All
I participated on holiday as the hotel\resort offered it 20.9% 29.8% 24.7%I always wanted to try it and finally did 12.2% 12.6% 12.4%Family member\friend bought a boat\equipment and invited me on it\to use it 10.5% 13.5% 11.8%I wanted to do something new that I have never tried before 13.0% 8.3% 11.0%Other family members\friends started participating so I started it as well 12.3% 5.9% 9.6%I was given a boating experience\training as a gift 4.8% 1.4% 3.4%I have participated in a different boating activity before and wanted to try this 3.4% 1.7% 2.7%Club\training centre introduced me to it 1.4% 3.6% 2.3%I started participating as a child and continued when I turned 16 3.5% 0.0% 2.0%My personal circumstances have changed (e.g. retired, children now older) and therefore am able to do it now 1.3% 1.4% 1.3%I moved and now have easy access to water 1.8% 0.0% 1.0%Went to a boating event\boat show which influenced me 0.7% 1.0% 0.8%I wanted to find a new hobby so I thought I would give it a try 1.1% 0.0% 0.6%I have seen a TV programme (e.g. TV series\sports etc) where it was featured and decided to try it 0.0% 0.0% 0.0%I read about it in a book\magazine and decided to try it 0.0% 0.0% 0.0%I saw marketing\advertising (e.g. brochures, adverts on TV\radio\press) and decided to give it a try 0.0% 0.0% 0.0%Other 7.8% 13.9% 10.4%Don't Know 9.3% 11.8% 10.4%Unweighted Base 75 63 138 Source: Watersports participation survey 2009 (Base: all respondents who participate in the respective activity categories and have done so for the first time in the last 12 months)
For other watersports participation on holiday is by far the most important reason for having participated for the first time in the past 12 months, almost a third or respondents mentioning it. Males are more likely to have looked for a new hobby and giving it a try.
Table 27 Reasons for Starting to Participate in Other Watersports by GenderMale Female All
I participated on holiday as the hotel\resort offered it 26.1% 36.4% 30.5%I always wanted to try it and finally did 13.2% 16.2% 14.5%Other family members\friends started participating so I started it as well 9.7% 10.6% 10.1%I wanted to find a new hobby so I thought I would give it a try 12.5% 5.2% 9.3%I started participating as a child and continued when I turned 16 6.7% 9.2% 7.8%Family member\friend bought a boat\equipment and invited me on it\to use it 6.5% 6.7% 6.6%I wanted to do something new that I have never tried before 3.8% 5.9% 4.7%Club\training centre introduced me to it 5.0% 2.1% 3.7%I have participated in a different boating activity before and wanted to try this one 4.5% 0.0% 2.6%My personal circumstances have changed (e.g. retired, children now older) and therefore am able to do it now 4.4% 0.0% 2.5%I was given a boating experience\training as a gift 2.7% 1.1% 2.0%I moved and now have easy access to water 0.7% 1.3% 1.0%Went to a boating event\boat show which influenced me 0.0% 1.3% 0.6%I have seen a TV programme (e.g. TV series\sports etc) where it was featured and decided to try it 0.8% 0.0% 0.5%I read about it in a book\magazine and decided to try it 0.0% 0.0% 0.0%I saw marketing\advertising (e.g. brochures, adverts on TV\radio\press) and decided to give it a try 0.0% 0.0% 0.0%Other 7.9% 10.0% 8.8%Don't Know 1.7% 5.6% 3.4%Unweighted Base 101 83 184 Source: Watersports participation survey 2009 (Base: all respondents who participate in the respective activity categories and have done so for the first time in the last 12 months)

Watersports and Leisure Participation Report 2009 Page 39 of 64
Reasons for Stopping Participation
We also asked respondents who said that they had participated at some point in the past but not in the past 12 months were asked why they had stopped participating. Losing interest is in the top three for all activity categories.
As mentioned earlier, it needs to be taken into account that some respondents will discount past activity if they do not consider it as proper participation. Therefore ‘holiday’ reasons achieve fewer mentions than we might anticipate.
Change of personal circumstances (e.g. having children), is a more important reason to stop participating in sailing for women than it is for men. Women are also more likely to stop when their family member stops probably as they were simply supporting them. This follows from what is seen earlier, that women are more likely to start because somebody else in the family does. Men are more likely to have swapped to a different hobby than women.
Table 28 Reasons Why Stopped Participating in Sailing by GenderMale Female All
I lost interest in the activity 17.3% 15.9% 16.7%I didn't have time to take part due to work commitments 13.3% 9.1% 11.5%My personal circumstances have changed (e.g got married\had a child\went to university etc) 8.7% 13.7% 10.7%Only participated as a child at school\summer camp etc 9.4% 11.9% 10.4%I only participate on holiday and we did something different\didn't go last year 6.6% 8.2% 7.2%I only participated because other family members\friends were involved and when they stopped, so did I 5.2% 9.9% 7.1%I am trying to save money\cannot afford it 7.4% 6.2% 6.9%Health reasons meant I couldn't take part 6.6% 6.6% 6.6%I moved and no longer have easy access to suitable water 5.9% 5.6% 5.8%I have new hobbies\activities which I prefer spending time doing instead 7.3% 3.5% 5.7%I am at the time of my life now where it is too physically\mentally challenging 5.9% 5.4% 5.7%No interest 1.9% 1.7% 1.8%I had to sell my boat\equipment 2.0% 1.5% 1.8%The weather was not good enough in the last 12 months 1.2% 2.5% 1.7%No opportunity 0.9% 2.0% 1.4%No time (unspecified) 1.6% 0.7% 1.2%No access to a boat 1.1% 1.2% 1.1%I only went once 1.1% 0.9% 1.0%Fear of water / can't swim 0.2% 1.6% 0.8%I have swapped to do a different boating category\watersport and stopped 0.7% 0.4% 0.5%Left job which involved activity 0.5% 0.0% 0.3%My boat\equipment needs replacing and I haven't got round to buying new 0.1% 0.3% 0.2%Don't like boats 0.0% 0.1% 0.0%Other 0.9% 0.9% 0.9%Don't Know 6.2% 5.6% 6.0%Unweighted Base 753 580 1,333 Source: Watersports participation survey 2009 (Base: all respondents who have not participated in the respective activity categories in the last 12 months but have done so at some point in the past)
Lack of opportunities on holiday are a major reason for Power/motor boating. Trying to save money is also mentioned more often as a reason not to have participated in power/motor boating than the other activity categories. As seen for sailing, women are more likely to stop when the another person in the household stops. They are also more likely to have participated at summer school when they were children. Males cite money reasons more often than females.

Watersports and Leisure Participation Report 2009 Page 40 of 64
Table 29 Reasons Why Stopped Participating in Power/Motor Boating by GenderMale Female All
I only participate on holiday and we did something different\didn't go last year 17.6% 18.1% 17.8%I lost interest in the activity 14.8% 15.0% 14.9%I am trying to save money\cannot afford it 10.6% 6.3% 8.8%I didn't have time to take part due to work commitments 10.1% 6.9% 8.8%My personal circumstances have changed (e.g got married\had a child\went to university etc) 8.1% 8.8% 8.4%I only participated because other family members\friends were involved and when they stopped, so did I 6.5% 10.8% 8.3%Health reasons meant I couldn't take part 5.9% 6.0% 5.9%Only participated as a child at school\summer camp etc 4.1% 6.0% 4.9%I moved and no longer have easy access to suitable water 5.2% 4.3% 4.8%I have new hobbies\activities which I prefer spending time doing instead 4.9% 4.7% 4.8%I am at the time of my life now where it is too physically\mentally challenging 3.4% 3.5% 3.4%I had to sell my boat\equipment 3.1% 1.4% 2.4%No interest 1.3% 2.1% 1.7%The weather was not good enough in the last 12 months 1.1% 2.2% 1.6%No time (unspecified) 0.6% 2.1% 1.2%Fear of water / can't swim 0.9% 1.2% 1.0%I only went once 1.3% 0.5% 1.0%No opportunity 0.9% 0.9% 0.9%No access to a boat 1.0% 0.6% 0.8%My boat\equipment needs replacing and I haven't got round to buying new 0.4% 0.3% 0.4%I have swapped to do a different boating category\watersport and stopped 0.1% 0.5% 0.3%Left job which involved activity 0.4% 0.0% 0.2%Don't like boats 0.0% 0.5% 0.2%Other 1.0% 1.4% 1.1%Don't Know 6.1% 6.1% 6.1%Unweighted Base 535 431 966 Source: Watersports participation survey 2009 (Base: all respondents who have not participated in the respective activity categories in the last 12 months but have done so at some point in the past)
More males than females name work commitments as a reason that they no longer participate in watersports. Dropping it for another hobby that now takes up their time is also more prevalent amongst males.
Table 30 Reasons Why Stopped Participating in Other Watersports by GenderMale Female All
I lost interest in the activity 16.1% 16.6% 16.3%I didn't have time to take part due to work commitments 15.6% 9.8% 13.2%My personal circumstances have changed (e.g got married\had a child\went to university etc) 10.2% 11.3% 10.7%Only participated as a child at school\summer camp etc 9.2% 11.2% 10.0%I only participate on holiday and we did something different\didn't go last year 8.5% 11.3% 9.7%Health reasons meant I couldn't take part 6.0% 9.0% 7.2%I have new hobbies\activities which I prefer spending time doing instead 8.4% 4.1% 6.6%I am trying to save money\cannot afford it 6.0% 5.3% 5.7%I am at the time of my life now where it is too physically\mentally challenging 5.4% 5.8% 5.6%I moved and no longer have easy access to suitable water 5.0% 5.6% 5.2%I only participated because other family members\friends were involved and when they stopped, so did I 3.3% 3.8% 3.5%The weather was not good enough in the last 12 months 2.2% 2.9% 2.5%No interest 1.6% 2.7% 2.0%No time (unspecified) 1.8% 1.0% 1.4%I only went once 0.7% 1.2% 0.9%No opportunity 0.5% 1.3% 0.8%Fear of water / can't swim 0.2% 1.2% 0.6%I have swapped to do a different boating category\watersport and stopped 0.6% 0.5% 0.5%I had to sell my boat\equipment 0.6% 0.2% 0.4%Left job which involved activity 0.4% 0.2% 0.3%No access to a boat 0.4% 0.2% 0.3%My boat\equipment needs replacing and I haven't got round to buying new 0.4% 0.1% 0.3%Don't like boats 0.0% 0.0% 0.0%Other 1.7% 1.7% 1.7%Don't Know 6.5% 5.4% 6.0%Unweighted Base 1,230 916 2,146 Source: Watersports participation survey 2009 (Base: all respondents who have not participated in the respective activity categories in the last 12 months but have done so at some point in the past)

Watersports and Leisure Participation Report 2009 Page 41 of 64
4. Frequency of Participation
Each participant in an activity was asked how often they had participated over the last 12 months. This is compared to the number of actual events a respondent reports later in the survey to improve the accuracy of the estimates. If there is a discrepancy between the two estimates, the respondent is asked which one they think is a better reflection of their participation. For those participating more than 25 times in an activity their actual participation rate was taken into account when calculating the average participation.
The average participation is estimated from this data, taking into account the checks described above. For the frequency of participation categories below, mean values are used to calculate the average participation (1 for once, 3.5 for 2-5, 9 for 6-12 and 19 for 13-25, actual reported figure for 25+).
Table 33 and Table 34 show how that for most activities many more events take place in the UK than abroad. For example, the average participation for canoeing is 6.9 times a year in the UK, compared to 1.3 times while abroad. Canal boating, as in previous years, is the activity people are least likely to do abroad. 2,797,000 people have participated in at least one boating activity in the UK during the last 12 months and 1,515,000 have participated abroad in at least one boating activity abroad. These categories are however not mutually exclusive; people who have participated in the UK may or may not have also participated abroad, and vice versa. 2,020,000 people have only participated in the UK, 737,000 have only participated abroad. 777,000 people have participated both in the UK and abroad.
Leisure sub-aqua diving continues to be the activity most likely to be undertaken exclusively abroad. In 2009, as was the case in 2008, more than half those participating in leisure sub-aqua diving only did so abroad. In 2009, two activities record a greater number of people participating abroad than in the UK; windsurfing and waterskiing. Using personal watercraft, which in 2008 had more people participating abroad than in the UK, is in 2009 more common in the UK. However, the difference between participant numbers in the UK and abroad is very small. One in four of those who participated in personal watercraft activities did so exclusively abroad.
Between 2006 and 2007 we recorded an increase in the participation taking place abroad. In 2008 average participation abroad had either stayed stable or dropped slightly for most activities. In 2009 the trends vary with around a third of activities staying relatively stable (canoeing, small sail boat activities, windsurfing, canal boating), three have seen an increase (water skiing, yacht cruising and yacht racing) and the remainder recording a drop in average participation abroad.
Table 34 shows that windsurfing and using a personal watercraft are the most popular activities that take place abroad. Overall, this results in a reduction of participation abroad and we suspect this is a reflection of the decline in the number of holidays taken abroad in 2009, and a reduction in spend while abroad.
Table 33 also shows variations in the average number of times people are participating in an activity in the UK. Angling from the shore has the largest proportion of people participating very frequently in the UK; a fifth of those angling from the shore do so in the UK more than 25 times a year. Indeed Figure 11 shows that this behaviour has remained stable from 2008. The biggest drop in UK participation is for kitesurfing (Figure 11). Some activities have low base numbers, which needs to be taken into account when interpreting these figures.
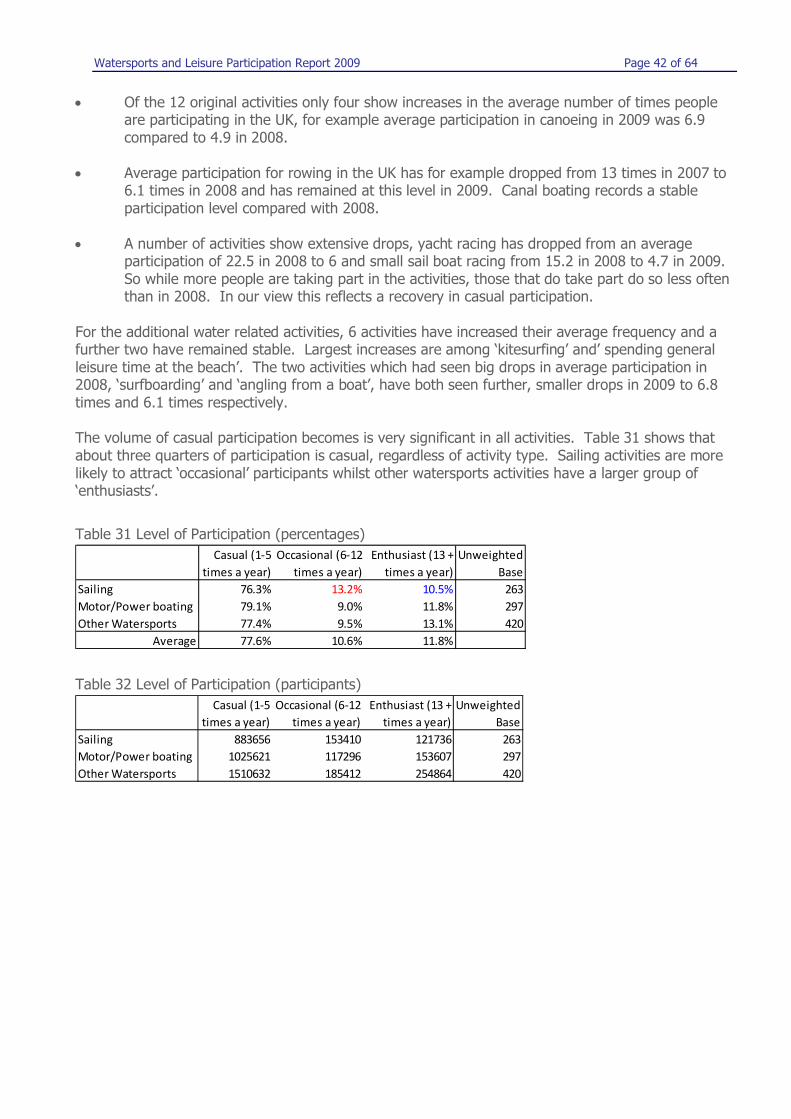
Watersports and Leisure Participation Report 2009 Page 42 of 64
Of the 12 original activities only four show increases in the average number of times people are participating in the UK, for example average participation in canoeing in 2009 was 6.9 compared to 4.9 in 2008.
Average participation for rowing in the UK has for example dropped from 13 times in 2007 to 6.1 times in 2008 and has remained at this level in 2009. Canal boating records a stable participation level compared with 2008.
A number of activities show extensive drops, yacht racing has dropped from an average participation of 22.5 in 2008 to 6 and small sail boat racing from 15.2 in 2008 to 4.7 in 2009. So while more people are taking part in the activities, those that do take part do so less often than in 2008. In our view this reflects a recovery in casual participation.
For the additional water related activities, 6 activities have increased their average frequency and a further two have remained stable. Largest increases are among ‘kitesurfing’ and’ spending general leisure time at the beach’. The two activities which had seen big drops in average participation in 2008, ‘surfboarding’ and ‘angling from a boat’, have both seen further, smaller drops in 2009 to 6.8 times and 6.1 times respectively.
The volume of casual participation becomes is very significant in all activities. Table 31 shows that about three quarters of participation is casual, regardless of activity type. Sailing activities are more likely to attract ‘occasional’ participants whilst other watersports activities have a larger group of ‘enthusiasts’.
Table 31 Level of Participation (percentages)Casual (1-5
times a year)Occasional (6-12
times a year)Enthusiast (13 +
times a year)Unweighted
BaseSailing 76.3% 13.2% 10.5% 263Motor/Power boating 79.1% 9.0% 11.8% 297Other Watersports 77.4% 9.5% 13.1% 420
Average 77.6% 10.6% 11.8%
Table 32 Level of Participation (participants)Casual (1-5
times a year)Occasional (6-12
times a year)Enthusiast (13 +
times a year)Unweighted
BaseSailing 883656 153410 121736 263Motor/Power boating 1025621 117296 153607 297Other Watersports 1510632 185412 254864 420

Watersports and Leisure Participation Report 2009 Page 43 of 64
Table 33 Frequency of Participation in the UK
Never Once 2-5 times 6-12 times 13-25 timesMore than
25 times Base 2009 2008 2007 2006 2005 2004 2003Canoeing 20.1% 27.2% 33.1% 9.3% 4.4% 6.0% 270 6.9 4.9 3.9 4.3 5.7 3.6 3.6Water skiing 39.5% 19.9% 19.8% 6.3% 8.8% 5.6% 69 6.3 8.7 4.7 4.5 5.7 1.6 3.4Small sail boat activities 20.1% 24.6% 32.7% 14.9% 2.5% 5.3% 123 5.0 7.7 4.8 4.9 5.1 4.4 5.2Rowing/Sculling 9.9% 41.1% 31.3% 8.1% 2.9% 6.6% 75 6.1 6.1 13.0 9.2 9.6 5.0 5.7Windsurfing 39.7% 18.4% 30.4% 3.5% 4.5% 3.5% 58 4.1 3.5 1.6 4.0 5.3 3.7 3.4Using personal watercraft 40.0% 21.1% 25.4% 2.1% 3.5% 7.8% 71 4.4 3.4 2.2 4.9 4.1 4.1 3.8Motor boating/Cruising 24.6% 34.3% 25.7% 9.3% 1.6% 4.4% 110 4.5 4.8 4.8 4.7 4.5 4.7 4.1Yacht cruising 27.7% 26.1% 20.4% 14.7% 4.6% 6.5% 90 5.4 4.5 6.1 4.0 3.9 4.7 2.6Power boating 32.8% 20.2% 20.4% 10.5% 7.5% 8.6% 123 6.8 8.7 5.2 6.0 5.1 4.5 5.7Small sail boat racing* 10.4% 30.5% 46.2% 4.1% 3.9% 4.9% 33* 4.7 15.2 9.1 4.3 8.7 4.6 4.1Canal boating 2.0% 59.1% 27.8% 4.0% 3.3% 3.8% 77 3.8 3.7 2.7 2.3 2.3 3.7 2.3Yacht racing* 3.0% 31.5% 42.7% 13.3% 0.0% 9.6% 21* 6.0 22.5 13.3 4.6 8.8 8.9 7.6Surfboarding 18.4% 29.0% 34.2% 8.7% 4.1% 5.5% 135 6.8 7.9 14.1 5.3 7.4 9.0 n/aKitesurfing* 45.2% 29.8% 10.7% 0.0% 5.7% 8.6% 13* 5.0 2.1 2.9 1.8 4.0 4.4 n/aAngling (from a boat) 21.2% 26.3% 37.2% 6.6% 4.2% 4.5% 107 6.1 6.4 11.4 7.0 4.9 7.5 n/aAngling (from the shore) 8.5% 13.1% 31.8% 18.3% 8.0% 20.3% 195 13.4 12.5 12.7 13.1 9.5 10.4 n/aCliff climbing 18.8% 30.3% 30.1% 13.2% 3.7% 3.9% 83 5.9 5.8 5.8 4.0 4.2 4.2 n/aCoastal walking 5.7% 16.0% 40.9% 20.0% 6.6% 10.8% 1173 13.2 12.1 12.7 11.2 10.9 9.9 n/aOutdoor swimming 34.5% 18.3% 29.6% 10.1% 3.9% 3.6% 1140 5.1 3.8 4.8 9.3 4.1 4.1 n/aLeisure sub-aqua diving 52.4% 9.4% 17.2% 9.6% 8.6% 2.7% 97 4.5 3.1 4.2 4.8 3.2 8.4 n/aSpending general leisure time at the beach 12.2% 15.6% 35.9% 19.9% 7.6% 8.8% 1402 9.9 7.4 7.6 6.0 8.0 5.0 n/a
Frequency of participation Average participation
Source: Watersports participation survey 2009 (Base: all respondents who participate in the respective activities)*Caution: small base size

Watersports and Leisure Participation Report 2009 Page 44 of 64
Table 34 Frequency of Participation Abroad
Never Once 2-5 times 6-12 times13-25 times
More than 25 times Base 2009 2008 2007 2006 2005 2004 2003
Canoeing 66.4% 18.5% 10.8% 2.4% 0.5% 1.5% 270 1.3 1.4 1.7 0.8 1.4 0.8 1.6Water skiing 35.1% 18.9% 26.9% 11.6% 2.1% 5.5% 69 4.2 1.5 3.3 2.3 2.2 3.1 1.7Small sail boat activities 57.7% 20.0% 17.9% 3.0% 0.0% 1.3% 123 1.5 1.6 1.7 1.3 1.4 2.2 1.5Rowing/Sculling 70.0% 10.8% 17.2% 2.0% 0.0% 0.0% 75 0.9 1.4 1.5 0.3 0.4 1.0 1.7Windsurfing 37.7% 24.6% 33.5% 1.8% 0.0% 2.5% 58 2.3 2.2 2.6 1.7 1.9 2.1 1.8Using personal watercraft 41.4% 31.8% 21.0% 4.3% 0.0% 1.5% 71 1.9 2.4 2.8 2.3 3.4 2.3 2.1Motor boating/Cruising 57.3% 24.5% 13.5% 3.2% 0.9% 0.6% 110 1.4 1.1 1.8 2.0 1.4 1.8 0.5Yacht cruising 51.8% 22.7% 17.8% 3.0% 2.3% 2.4% 90 2.3 0.7 1.6 1.1 1.6 0.9 0.9Power boating 53.9% 24.2% 18.3% 1.1% 0.7% 1.7% 123 1.6 1.9 2.2 2.0 1.6 2.5 1.9Small sail boat racing* 62.0% 21.0% 14.1% 0.0% 0.0% 3.0% 33* 1.6 3.4 1.3 1.3 1.8 2.1 1.4Canal boating 88.6% 9.6% 0.9% 0.9% 0.0% 0.0% 77 0.2 0.3 0.3 0.1 0.0 0.7 0.2Yacht racing* 55.7% 4.6% 22.9% 12.2% 0.0% 4.7% 21* 3.4 2.2 1.8 1.0 1.1 1.8 2.0
Frequency of participation Average participation
Source: Watersports participation survey 2009 (Base: all respondents who participate in the respective activities)*Caution: small base size
Table 35 and Table 36 convert the participation rates into estimates of how many people are participating how frequently in each sport. The category of participation with the highest number of participants has been highlighted in blue and bold.
Table 35 Frequency of Participation in the UK (participants) 2009
Never Once 2-5 times 6-12 times 13-25 timesMore than
25 times
Total Number of people
participating in the UK Base
Canoeing 253,739 343,524 417,558 117,267 55,051 75,337 1,008,738 270 Water skiing 124,559 62,701 62,480 19,894 27,792 17,807 190,674 69 Small sail boat activities 111,479 136,372 181,419 82,731 13,928 29,504 443,953 123 Rowing/Sculling* 34,527 143,779 109,571 28,307 10,171 23,233 315,060 75 Windsurfing* 104,755 48,507 80,311 9,358 11,880 9,171 159,227 58 Using personal watercraft 134,678 71,152 85,488 6,909 11,886 26,360 201,795 71 Motor boating/Cruising 116,216 162,120 121,429 44,066 7,556 20,845 356,017 110 Yacht cruising 106,098 100,176 78,285 56,506 17,612 24,937 277,517 90 Power boating 186,754 115,340 116,243 59,567 42,778 49,199 383,127 123 Small sail boat racing* 15,297 45,052 68,141 6,124 5,722 7,231 132,269 33*Canal boating 6,484 189,377 88,945 12,910 10,420 12,077 313,729 77 Yacht racing* 2,924 31,195 42,249 13,147 - 9,535 96,125 21*Surfboarding 119,063 187,247 221,065 56,361 26,384 35,707 526,764 135 Kitesurfing* 25,505 16,813 6,011 - 3,228 4,840 30,892 13*Angling (from a boat) 100,732 124,544 176,165 31,211 19,969 21,489 373,378 107 Angling (from the shore) 72,776 112,313 272,483 156,480 68,358 173,524 783,158 195 Cliff climbing 73,996 119,200 118,464 52,118 14,578 15,541 319,901 83 Coastal walking 280,993 784,644 2,011,435 982,828 326,705 530,926 4,636,538 1,173Outdoor swimming 611,656 778,705 1,794,626 993,790 378,376 441,622 4,387,119 1,140Leisure sub-aqua diving 153,521 81,588 131,600 44,822 17,445 15,892 291,348 97 Spending general leisure time at the beach 3,042,812 548,013 1,002,006 560,114 499,773 159,560 2,769,466 1,402
Frequency of participation
Source: Watersports participation survey 2009 (Base: all respondents who participate in the respective activities)*Caution: small base size
Table 36 Frequency of Participation Abroad (participants) 2009
Never Once 2-5 times 6-12 times13-25 times
More than 25 times
Total Number of people
participating abroad Base
Canoeing 838,087 232,930 136,437 30,411 5,748 18,866 424,391 270Water skiing 110,569 59,469 84,662 36,644 6,628 17,261 204,663 69Small sail boat activities 320,602 111,198 99,678 16,907 - 7,047 234,831 123Rowing/Sculling 244,782 37,822 60,023 6,961 - - 104,806 75Windsurfing 99,463 64,840 88,302 4,753 - 6,624 164,519 58Using personal watercraft 139,192 107,119 70,573 14,425 - 5,163 197,281 71Motor boating/Cruising 270,797 115,679 63,561 15,102 4,485 2,610 201,437 110Yacht cruising 198,765 86,978 68,334 11,611 8,652 9,275 184,849 90Power boating 307,403 137,888 104,543 6,243 3,853 9,949 262,477 123Small sail boat racing* 91,456 30,917 20,737 - - 4,457 56,110 33*Canal boating 283,729 30,648 2,869 2,967 - - 36,485 77Yacht racing* 55,146 4,515 22,651 12,046 - 4,692 43,903 21*
Frequency of participation
Source: Watersports participation survey 2009 (Base: all respondents who participate in the respective activities)*Caution: small base size

Watersports and Leisure Participation Report 2009 Page 45 of 64
Table 37 shows the changes in the proportion of people carrying out any participation in the UK and abroad from 2008 to 2009. Significant rises are highlighted in red and bold, significant drops in blue and bold. Ten activities have seen an increase in the proportion of people who carry out some of their in the UK in 2009. Two of these increases are statistically significant; small sail boat racing and outdoor swimming. Ten activities have seen a drop decrease in the proportion of people participating at least sometimes in the UK. However, only the drop for angling from a boat is statistically significant.
Table 37 Changes in the Location of Participation 2008 to 2009
Change 2009 2008 Change 2009 2008 Base 2009 Base 2008
Canoeing -4.6% 79.9% 84.5% -4.3% 33.6% 37.9% 270 211 Water skiing -11.3% 60.5% 71.7% 11.8% 64.9% 53.1% 69 62 Other small sail boat activities -4.9% 79.9% 84.8% 4.8% 42.3% 37.5% 123 94 Rowing/Sculling -0.5% 90.1% 90.6% 4.2% 30.0% 25.8% 75 43*Windsurfing 2.2% 60.3% 58.1% -5.4% 62.3% 67.8% 58 36*Using personal watercraft 8.9% 60.0% 51.1% -10.6% 58.6% 69.2% 71 72 General Motor boating 0.8% 75.4% 74.6% -2.3% 42.7% 44.9% 110 125 Yacht cruising -2.9% 72.3% 75.3% 3.6% 48.2% 44.6% 90 91 Power boating -9.9% 67.2% 77.2% 5.5% 46.1% 40.6% 123 65 Small sail boat racing* 16.4% 89.6% 73.3% -13.2% 38.0% 51.2% 33* 28*Canal boating 5.9% 98.0% 92.1% -2.7% 11.4% 14.1% 77 64 Yacht racing* 1.5% 97.0% 95.5% 15.2% 44.3% 29.1% 21* 22*Surfboarding -3.8% 81.6% 85.3% n/a n/a n/a 135 114 Kitesurfing* -22.6% 54.8% 77.4% n/a n/a n/a 13* 14*Angling (from a boat) -9.0% 78.8% 87.8% n/a n/a n/a 107 95 Angling (from the shore) -0.2% 91.5% 91.7% n/a n/a n/a 195 218 Cliff climbing -3.8% 81.2% 85.0% n/a n/a n/a 83 76 Coastal walking 0.0% 94.3% 94.3% n/a n/a n/a 1,173 1,208 Outdoor swimming 5.8% 65.5% 59.7% n/a n/a n/a 1,140 926 Leisure sub-aqua diving (from the shore and boat) 0.5% 47.6% 47.2% n/a n/a n/a 97 77 Spending general leisure time at the beach 4.8% 87.8% 83.0% n/a n/a n/a 1,402 1,041
UK AbroadProportion of participants participating in
Table 38 shows the proportion of respondents from 2003 to 2009 in each of the 12 ‘any boating activities’ who said that at least some of their participation is taking place in the UK.
Figure 11 shows these trends in graphical format for the different groups of activities: sail, manual and power sports. From 2005 the overall sample includes Northern Ireland, which needs to be taken into account when comparing figures across the years.
There have been ups and downs in the proportion of respondents taking part in the UK over the years. Yacht racing in the UK showed a continuous decline to 2007, then increased in 2008 and has seen a further increase in 2009. In 2009 small sail boat racing has seen an increase in and is now even slightly above the prior peak of 2006. Small sail boat activities show the opposite behaviour, having seen a rise in 2008 and a decline in 2009. Power activities show little consistency with participation rates changing year on year probably affected by holiday behaviour. Using personal watercraft is consistently the activity most likely to take place abroad. The manual sports canoeing and water skiing show similar trends to each other, both of which show a drop in 2009 after an increase in 2008 and a drop in 2007.

Watersports and Leisure Participation Report 2009 Page 46 of 64
Table 38 Trends in Participation in the UK 2003-20092003 2004 2005 2006 2007 2008 2009
Any boating activity 81.0% 77.4% 78.6% 74.6% 78.7% 78.7% 79.1%Sailing Sports Small sail boat activities 71.6% 69.7% 83.9% 85.2% 75.1% 84.8% 79.9%
Windsurfing 65.0% 68.8% 72.6% 76.0% 72.1% 58.1% 60.3%Yacht cruising 80.9% 83.7% 71.0% 82.9% 78.1% 75.3% 72.3%Small sail boat racing 74.9% 75.1% 78.2% 88.8% 86.4% 73.3% 89.6%Yacht racing 100.0% 100.0% 87.1% 87.6% 81.9% 95.5% 97.0%
Power Sports Using personal watercraft 64.9% 54.7% 58.7% 43.9% 52.5% 51.1% 60.0%Motor boating/Cruising 84.8% 88.0% 69.5% 77.6% 71.9% 74.6% 75.4%Power boating 74.5% 71.6% 71.6% 72.1% 72.3% 77.2% 67.2%Canal boating 86.4% 98.0% 93.7% 96.3% 90.4% 92.1% 98.0%
Manual Sports Canoeing 79.9% 80.5% 83.6% 82.1% 76.3% 84.5% 79.9%Water skiing 52.7% 52.8% 65.0% 63.4% 61.6% 71.7% 60.5%Rowing/Sculling 90.8% 87.1% 90.3% 92.6% 88.3% 90.6% 90.1%
Figure 11 Trends in Participation in the UK 2003-2009
0%
10%
20%
30%
40%
50%
60%
70%
80%
90%
100%
2003 2004 2005 2006 2007 2008 2009
Trends in participation in the UK of sailing sports
Small sail boat activitiesWindsurfingYacht cruisingSmall sail boat racingYacht racing
0%
10%
20%
30%
40%
50%
60%
70%
80%
90%
100%
2003 2004 2005 2006 2007 2008 2009
Trends in participation in the UK of power sports
Using personal watercraftMotor boating/CruisingPower boatingCanal boating
0%
10%
20%
30%
40%
50%
60%
70%
80%
90%
100%
2003 2004 2005 2006 2007 2008 2009
Trends in participation in the UK of manual sports
CanoeingWater skiingRowing/Sculling

Watersports and Leisure Participation Report 2009 Page 47 of 64
5. Where the Balance of Participation is Taking Place
For the 12 original watersports we are able to examine where the balance of people’s participation is taking place. This set of results is derived from bringing together each person’s reported activity in both the UK and abroad. Their activities are then categorised into six groups to show where each person is doing their sport.
UK only Only participated in UKHigh in UK low abroad Participated more than 5 times in UK and less than 6 times
abroad.Low in UK and abroad Less than 6 times in UK and abroad.High in UK and abroad More than 5 times in UK and abroad.Low in UK and high abroad Participated less than 6 times in UK and more than 5 times
abroad.Abroad only Only participated abroad.
The data is presented as a table and pie charts for each activity. It should be borne in mind that the numbers of people interviewed for some sports are small and therefore the data should only be taken as indicative of the overall patterns of participation.
Table 39 Where Participation is Taking Place - 2009
UK only
High in UK low
abroad
Low in UK and
Abroad
High in UK and
Abroad
Low in UK and high
AbroadAbroad
only Base Canoeing 66.4% 3.0% 9.2% 1.3% 0.0% 20.2% 270Water skiing 35.1% 4.3% 9.4% 8.7% 3.7% 38.8% 69Small sail boat activities 57.7% 3.2% 15.6% 3.1% 0.0% 20.3% 123Rowing/Sculling 70.0% 2.9% 15.2% 2.0% 0.0% 9.9% 75Windsurfing 37.7% 3.7% 14.7% 4.3% 0.0% 39.7% 58Using personal watercraft 41.4% 0.0% 17.1% 1.5% 0.0% 40.0% 71Motor boating/Cruising 57.3% 4.3% 12.8% 1.0% 0.0% 24.6% 110Yacht cruising 51.8% 7.4% 8.1% 4.7% 0.0% 28.0% 90Power boating 53.9% 4.9% 4.9% 1.5% 2.0% 32.8% 123Small sail boat racing* 62.0% 1.9% 25.7% 0.0% 0.0% 10.4% 33*Canal boating 88.6% 0.6% 7.8% 0.0% 0.9% 2.0% 77Yacht racing* 55.7% 9.5% 17.9% 9.6% 4.3% 3.0% 21*
6. Combinations of Activities
Below we compare cross participation between the 3 aggregated watersports groups described earlier. These 3 groups contain the 12 original ‘any boating activities’. Table 40 presents numbers and percentages of the proportion of people who do each type of sport who also participate in other types of watersports. For example, 24% of those participating in a power activity also take part in a sailing activity.
Table 40 Grouped Watersports Combination 2009Also do
People who do Sail Power ManualNo. % No. % No. %
Sail 1,170,171 100% 282,474 18% 400,248 23%Power 282,474 24% 1,537,620 100% 344,981 20%Manual 400,248 34% 344,981 22% 1,713,508 100%
In Table 41 we have combined data from 2007 to 2009. This increases the robustness of theestimates for individual activities; however some of the smaller sports still have relatively small numbers of participants for the cross activity analysis. Proportions have been highlighted in blue and bold if they are greater than 20%. For example, just over 20% of people who participate in

Watersports and Leisure Participation Report 2009 Page 48 of 64
windsurfing also participate in small sail boat activities, and 43% of people participating in yacht racing also participate in yacht cruising.
Table 41 Watersports Combinations – Average 2007-2009
CanoeingWater skiing
Small sail boat
activities Rowing
Using personal
watercraft
Motor boating/C
ruisingYacht
cruisingPower
boating
Small sail boat
racing WindsurfingCanal
boatingYacht
racingBase 2007-
2009People who do… % % % % % % % % % % % %
Any boating activity 31.7% 9.5% 14.9% 8.3% 9.2% 16.4% 11.7% 11.5% 4.8% 6.4% 10.2% 3.4% 2,450 Canoeing 100.0% 5.1% 11.4% 7.5% 4.6% 6.3% 5.6% 6.4% 2.6% 5.6% 3.4% 2.1% 742 Water skiing 17.4% 100.0% 11.4% 7.7% 9.4% 11.0% 5.0% 15.0% 2.7% 12.4% 4.2% 3.9% 218 Small sail boat activities 24.3% 7.3% 100.0% 9.2% 4.3% 9.8% 10.9% 9.9% 7.2% 8.8% 4.2% 5.8% 369 Rowing/Sculling 27.8% 8.7% 16.7% 100.0% 4.3% 13.1% 5.7% 8.1% 3.9% 6.4% 5.5% 2.3% 245 Using personal watercraft 16.7% 8.7% 6.9% 4.6% 100.0% 14.0% 3.4% 15.0% 5.1% 8.1% 2.3% 3.9% 193 Motor boating/Cruising 12.5% 6.3% 9.2% 7.0% 8.2% 100.0% 5.7% 9.2% 3.7% 3.4% 3.8% 3.3% 403 Yacht cruising 15.1% 4.3% 14.1% 4.6% 2.7% 8.3% 100.0% 8.8% 9.8% 6.0% 3.3% 13.1% 260 Power boating 17.8% 12.6% 11.9% 5.8% 12.1% 14.7% 8.5% 100.0% 8.0% 6.6% 4.3% 6.2% 282 Small sail boat racing 15.6% 5.9% 24.5% 6.5% 10.5% 12.8% 24.3% 20.3% 100.0% 22.8% 6.8% 22.8% 125 Windsurfing 27.4% 18.8% 20.3% 8.1% 12.9% 8.7% 10.2% 12.1% 16.4% 100.0% 4.8% 8.9% 164 Canal boating 11.2% 3.9% 6.4% 4.5% 2.0% 6.1% 4.0% 4.7% 3.2% 2.8% 100.0% 2.4% 285 Yacht racing 19.4% 11.0% 26.3% 4.5% 10.9% 16.5% 43.4% 22.9% 32.1% 17.0% 7.2% 100.0% 79
Also do…
7. Seasonal ParticipationRespondents who participated in each activity in the UK were asked in which seasons they did their activities. The seasons were defined as follows:
Summer 2009 June to AugustSpring 2009 March to MayWinter 2008/2009 December to FebruaryAutumn 2009 September to November
In order to collect accurate event numbers the question allows the respondent to give a number of times they participated in each season and cross checks this result with a parallel question.shows the proportion of events happening in each activity by season. Unsurprisingly, the majority of events take place in the summer (almost 50% of all events). Outdoor swimming, motor boating/cruising and small sail boating are the activities most concentrated in the summer. Coastal walking and angling are more year round activities.

Watersports and Leisure Participation Report 2009 Page 49 of 64
Table 42 Proportion of Events per Season
Summer Spring Winter Autumn TotalRespondent
numberTotal all activities 47.1% 22.0% 14.1% 16.9% 100.0% 2685Total boating activities 50.8% 22.2% 11.7% 15.3% 100.0% 626Any small sail boat racing or yacht racing 60.6% 21.1% 7.5% 10.9% 100.0% 154Any small sail boat activities or yacht cruising 57.1% 21.3% 8.8% 12.8% 100.0% 43Any motor boating/cruising or canal boating 58.3% 21.8% 8.6% 11.3% 100.0% 154Canoeing 44.4% 22.0% 15.6% 18.0% 100.0% 216 Water skiing* 47.7% 23.6% 7.7% 21.0% 100.0% 42*Small sail boat activities 64.3% 21.0% 3.6% 11.2% 100.0% 101 Rowing/Sculling 44.2% 24.9% 14.7% 16.1% 100.0% 68 Windsurfing* 48.8% 24.5% 13.8% 13.0% 100.0% 33*Using personal watercraft* 57.8% 26.1% 3.3% 12.8% 100.0% 43*Motor boating/Cruising 66.4% 16.2% 8.1% 9.4% 100.0% 81 Yacht cruising 55.5% 21.3% 12.7% 10.4% 100.0% 65 Power boating 48.2% 20.7% 14.6% 16.5% 100.0% 83 Small sail boat racing* 60.4% 22.8% 8.0% 8.7% 100.0% 29*Canal boating 42.7% 32.6% 9.7% 15.1% 100.0% 75 Yacht racing* 53.2% 19.6% 9.6% 17.6% 100.0% 20*Surfboarding 41.5% 22.7% 17.3% 18.4% 100.0% 110 Kitesurfing* 46.1% 32.1% 9.0% 12.8% 100.0% 7*Angling (from a boat) 40.2% 21.9% 18.4% 19.6% 100.0% 86 Angling (from the shore) 38.4% 24.1% 18.5% 19.0% 100.0% 177 Cliff climbing 37.6% 26.7% 19.0% 16.7% 100.0% 68 Coastal walking 37.6% 24.4% 17.6% 20.4% 100.0% 1,108 Outdoor swimming 68.6% 16.5% 5.7% 9.1% 100.0% 735 Leisure sub-aqua diving (from the shore and boat)* 53.3% 20.7% 10.1% 15.9% 100.0% 44*Spending general leisure time at the beach 49.0% 20.8% 13.6% 16.6% 100.0% 1,229
Proportion of events in seasons
Base: all respondents who participate in an activity in the UKSource: Watersports participation survey 2009*Caution: small base size
Table 43 shows the actual number of events taking place in each season. To put the numbers in context there were a total of 27,693,048 ‘boating activity’ events in the UK last year (up from 25,006,821 in 2008 and also higher than the 26,627,034 in 2007). Of these, a total of 14,094,300events took place in the summer (which is 51% of all boating events).
Table 43 Number of Events per Season
Summer Spring Winter Autumn TotalRespondent
numberTotal any activity 92,092,369 43,020,542 27,514,341 33,076,522 195,703,775 2685Total boating activity 14,094,300 6,161,802 3,235,674 4,230,423 27,722,199 626Any small sail boat racing or yacht racing 2,839,333 989,474 349,180 508,520 4,686,507 154Any small sail boat activities or yacht cruising 698,076 260,636 107,301 157,160 1,223,174 43Any motor boating/cruising or canal boating 1,837,214 687,391 271,280 357,364 3,153,249 154Canoeing 3,724,415 1,843,257 1,313,176 1,514,821 8,395,669 216 Water skiing* 989,504 489,419 160,077 436,321 2,075,320 42*Small sail boat activities 1,743,042 568,423 97,891 302,457 2,711,813 101 Rowing/Sculling 899,168 505,466 299,539 327,994 2,032,168 68 Windsurfing* 503,950 252,964 142,100 134,296 1,033,310 33*Using personal watercraft* 796,228 359,103 45,850 175,833 1,377,014 43*Motor boating/Cruising 1,374,655 334,161 166,654 193,617 2,069,086 81 Yacht cruising 1,096,291 421,051 251,289 206,063 1,974,693 65 Power boating 1,806,411 774,091 547,171 618,115 3,745,788 83 Small sail boat racing* 394,864 149,186 52,387 56,899 653,336 29*Canal boating 462,559 353,231 104,626 163,747 1,084,163 75 Yacht racing* 303,212 111,451 54,915 100,261 569,838 20*Surfboarding 1,794,638 982,512 748,321 794,390 4,319,860 110 Kitesurfing* 123,815 86,240 24,198 34,535 268,789 7*Angling (from a boat) 1,108,417 604,110 506,803 539,570 2,758,900 86 Angling (from the shore) 4,309,516 2,699,989 2,078,131 2,131,699 11,219,335 177 Cliff climbing 851,498 603,592 430,692 378,059 2,263,842 68 Coastal walking 24,095,190 15,626,386 11,233,290 13,048,977 64,003,844 1,108 Outdoor swimming 17,005,232 4,099,024 1,404,251 2,265,487 24,773,994 735 Leisure sub-aqua diving (from the shore and boat)* 1,037,445 404,032 196,497 309,266 1,947,240 44*Spending general leisure time at the beach 27,672,319 11,752,855 7,656,484 9,344,114 56,425,772 1,229
Number of events in seasons
Base: all respondents who participate in an activity in the UKSource: Watersports participation survey 2009*Caution: small base size

Watersports and Leisure Participation Report 2009 Page 50 of 64
8. Distribution between Inland and Coastal Areas
Respondents participating in the UK were asked how many of the events took place at the coast or inland. Respondents participating in surfboarding, coastal walking and spending general leisure time at the beach were not asked this question, as these activities are by definition coastal activities.
Table 44 Proportion of Coastal and Inland Events in the UK
Proportion of events that take
place at the coast
Proportion of events that take place
inlandNumber of
respondentsTotal any activity 81% 19% 2685Total boating activity 49% 51% 626Total small sail boat racing or yacht racing 47% 53% 154Total small sail boat activities or yacht cruising 68% 32% 43Total motor boating/cruising or canal boating 41% 59% 154Canoeing 35% 65% 216 Water skiing* 34% 66% 42*Small sail boat activities 55% 45% 101 Rowing/Sculling 34% 66% 68 Windsurfing* 79% 21% 33*Using personal watercraft* 66% 34% 43*Motor boating/Cruising 61% 39% 81 Yacht cruising 86% 14% 65 Power boating 66% 34% 83 Small sail boat racing* 25% 75% 29*Canal boating 3% 97% 75 Yacht racing* 72% 28% 20*Surfboarding 100% 0% 110 Kitesurfing* 63% 37% 7*Angling (from a boat) 52% 48% 86 Angling (from the shore) 33% 67% 177 Cliff climbing 21% 79% 68 Coastal walking 100% 0% 1,108 Outdoor swimming 55% 45% 735 Leisure sub-aqua diving (from the shore and boat)* 72% 28% 44*Spending general leisure time at the beach 100% 0% 1,229 Base: all respondents who participate in an activity in the UKSource: Watersports participation survey 2009 *Caution: small base size
Table 44 shows the proportion of coastal and inland events in 2009. Over 80% of yacht cruising and over 70% of windsurfing, yacht racing and leisure sub-aqua diving take place at the coast whereas the coast is the location for a quarter or less for small sail boat racing, cliff climbing and canal boating events. Table 45 shows the actual number of events taking place in the UK and abroad.

Watersports and Leisure Participation Report 2009 Page 51 of 64
Table 45 Number of Coastal and Inland Events in the UK
Number of coastal events
Number of inland events
Number of total events
Number of respondents
Total any activity 159,045,994 36,657,781 195,703,775 2685Total boating activity 13,620,933 14,101,265 27,722,199 626Total small sail boat racing or yacht racing 575,012 648,162 1,223,174 154Total small sail boat activities or yacht cruising 3,197,517 1,488,990 4,686,507 43Total motor boating/cruising or canal boating 1,288,989 1,864,260 3,153,249 154Canoeing 2,977,215 5,418,454 8,395,669 216 Water skiing* 702,018 1,373,303 2,075,320 42*Small sail boat activities 1,501,948 1,209,866 2,711,813 101 Rowing/Sculling 684,685 1,347,483 2,032,168 68 Windsurfing* 820,993 212,316 1,033,310 33*Using personal watercraft* 903,276 473,739 1,377,014 43*Motor boating/Cruising 1,252,351 816,736 2,069,086 81 Yacht cruising 1,695,569 279,124 1,974,693 65 Power boating 2,471,227 1,274,560 3,745,788 83 Small sail boat racing* 164,125 489,211 653,336 29*Canal boating 36,639 1,047,524 1,084,163 75 Yacht racing* 410,888 158,951 569,838 20*Surfboarding 4,319,860 - 4,319,860 110 Kitesurfing* 170,082 98,707 268,789 7*Angling (from a boat) 1,442,411 1,316,488 2,758,900 86 Angling (from the shore) 3,667,082 7,552,254 11,219,335 177 Cliff climbing 478,435 1,785,407 2,263,842 68 Coastal walking 64,003,844 - 64,003,844 1,108 Outdoor swimming 13,520,184 11,253,810 24,773,994 735 Leisure sub-aqua diving (from the shore and boat)* 1,397,391 549,850 1,947,240 44*Spending general leisure time at the beach 56,425,772 - 56,425,772 1,229 Base: all respondents who participate in an activity in the UKSource: Watersports participation survey 2009. *Caution: small base size
Table 48 below shows which proportion of the events shown in Table 45 are happening at the coast in 2009 and over the last 3 year period in order to provide an idea of trends. Significant changes are highlighted in red and bold. There are three significant drops in the proportion of events taking place on the coast: Small sail boat racing (down to 25.1% from a 3 year average of 49.1%) Cliff climbing (down to 21.1% from a 3 year average of 37.4%) Outdoor swimming (down to 54.6% from a 3 year average of 59.2%)
However, it needs to be borne in mind that the base size for two of these activities (small sail boat racing and cliff climbing) are small. As Table 46 shows, these decreases in the proportion of events that take place at the coast is due to an increase in absolute numbers of respondents participating in inland events rather than a decrease in the number of respondents participating in coastal events.
Only one activity shows a significant increase in the proportion of events that take place at the coast; rowing/sculling (increased to 33.7% from a 3 year average of 18%).

Watersports and Leisure Participation Report 2009 Page 52 of 64
Table 46 Number of Coastal and Inland Events for 2009 and 2008Number of
coastal events 2009
Number of inland events
2009
Number of coastal
events 2008
Number of inland events
2008Total any activity 159,045,994 36,657,781 129,488,563 24,716,754 Total boating activity 13,620,933 14,101,265 13,713,862 11,292,958 Total small sail boat racing or yacht racing 575,012 648,162 2,419,398 1,611,513 Total small sail boat activities or yacht cruising 3,197,517 1,488,990 3,363,113 1,686,757 Total motor boating/cruising or canal boating 1,288,989 1,864,260 1,795,693 1,681,468 Canoeing 2,977,215 5,418,454 1,895,214 2,704,828 Water skiing* 702,018 1,373,303 831,236 1,678,942 Small sail boat activities 1,501,948 1,209,866 1,758,708 1,470,226 Rowing/Sculling 684,685 1,347,483 298,336 823,094 Windsurfing* 820,993 212,316 441,941 159,091 Using personal watercraft* 903,276 473,739 883,190 244,873 Motor boating/Cruising 1,252,351 816,736 1,768,161 717,754 Yacht cruising 1,695,569 279,124 1,604,404 216,531 Power boating 2,471,227 1,274,560 1,785,743 702,392 Small sail boat racing* 164,125 489,211 1,258,398 611,158 Canal boating 36,639 1,047,524 27,532 963,714 Yacht racing* 410,888 158,951 1,161,000 1,000,355 Surfboarding 4,319,860 - 3,931,593 - Kitesurfing* 170,082 98,707 135,512 9,933 Angling (from a boat) 1,442,411 1,316,488 1,946,380 510,114 Angling (from the shore) 3,667,082 7,552,254 4,427,974 7,018,214 Cliff climbing 478,435 1,785,407 1,014,294 999,250 Coastal walking 64,003,844 - 61,314,061 - Outdoor swimming 13,520,184 11,253,810 10,524,775 4,729,220 Leisure sub-aqua diving (from the shore and boat)* 1,397,391 549,850 938,938 157,065 Spending general leisure time at the beach 56,425,772 - 31,541,175 - Base: all respondents who participate in an activity in the UKSource: Watersports participation survey 2009 and 2008*Caution: small base size
1,455,000 people have participated in at least one boating activity at the coast and 1,762,000 have participated in at least one boating activity inland. These numbers are rounded to the nearest 1000. Table 47 shows the exact numbers participating in at least one activity at the coast and inland. It must be borne in mind that these categories are not mutually exclusive; people who have participated at the coast may or may not have also participated inland, and vice versa. To the nearest thousand, 1,035,000 people have only participated at the coast, 1,342,000 have only participated inland. 420,000 people have participated both at the coast and inland.

Watersports and Leisure Participation Report 2009 Page 53 of 64
Table 47 Number of People Participating in at Least One Coastal or Inland Event
Number of people who have participated at
least once at the coast
Number of people who have participated at
least once inlandAny activity 9,752,541 1,654,950
Any boating activity 1,455,134 1,276,861
Small sailboat activities or yacht cruising 869,754 327,153
Small sailboat racing or yacht racing 218,067 488,314
Motor boating / cruising or canal boating 783,693 276,692
Small sail boat racing 65,871 81,078
Small sail boat activities 261,599 75,239
Yacht racing 85,443 230,147
Yacht cruising 249,464 10,682
Power boating 270,613 46,545
Motor boating/Cruising 174,243 147,248
Canal boating 24,642 205,014
Canoeing 398,460 292,053
Rowing/Sculling 82,402 742,555
Windsurfing 109,353 236,914
Water skiing 88,599 64,922
Using personal watercraft 135,547 125,998
Surfboarding 526,764 72,490
Kitesurfing 24,881 -
Angling (from a boat) 283,512 14,078
Angling (from the shore) 413,558 123,223
Cliff climbing 186,080 444,385
Coastal walking 4,636,538 185,632
Spending general leisure time at the beach 5,101,082 -
Outdoor swimming 2,408,635 -
Leisure sub-aqua diving (from the shore and boat) 163,735 1,195,120
In 2009 a total of 81% of all events were recorded as taking place on the coast, the average across 3 years is 82%. For the 12 ‘any boating activities’ 49% of events took place at the coast compared to 50% when taking an average across the past 3 years. This is illustrated in Table 48.
Table 48 Proportion of Coastal events 2009-2008 Comparison
Base: all respondents who participate in an activity in the
UK
Proportion of Coastal Events
2009
Proportion of Coastal Events Average 2007-
2009Change in 2009
(percentage po ints)
Number of respondents
2009Number of respondents
2007-2009Total any activity 81.3% 82.2% -1.0% 2685 7956Total boating activity 49.1% 50.4% -1.3% 626 1836Total sail boat racing or yacht racing 47.0% 59.7% -12.7% 154 458Total sail boat activities or yacht cruising 68.2% 67.3% 0.9% 43 138Total motor boating/cruising or canal boating 40.9% 41.9% -1.1% 154 514Canoeing 35.5% 38.6% -3.2% 216 570Water skiing* 33.8% 34.8% -1.0% 42* 134Small sail boat activities 55.4% 58.2% -2.9% 101 277Rowing/Sculling 33.7% 18.0% 15.7% 68 173Windsurfing* 79.5% 71.1% 8.3% 33* 90Using personal watercraft* 65.6% 69.2% -3.6% 43* 111Motor boating/Cruising 60.5% 57.3% 3.2% 81 291Yacht cruising 85.9% 79.9% 5.9% 65 209Power boating 66.0% 71.0% -5.1% 83 189Small sail boat racing* 25.1% 49.1% -24.0% 29* 90Canal boating 3.4% 4.8% -1.4% 75 236Yacht racing* 72.1% 70.1% 2.0% 20* 69Surfboarding* 100.0% 100.0% 0.0% 110 320Kitesurfing* 63.3% 80.5% -17.3% 7* 30Angling (from a boat)* 52.3% 57.5% -5.2% 86 288Angling (from the shore) 32.7% 36.8% -4.1% 177 624Cliff climbing* 21.1% 37.4% -16.3% 68 220Coastal walking 100.0% 100.0% 0.0% 1108 3717Outdoor swimming 54.6% 59.2% -4.6% 735 2118Leisure sub-aqua diving (from the shore and boat)* 71.8% 74.1% -2.4% 44* 123Spending general leisure time at the beach 100.0% 100.0% 0.0% 1229 3413
Source: Watersports participation survey 2007-2009*Caution: small base size

Watersports and Leisure Participation Report 2009 Page 54 of 64
9. Club Membership
Respondents are asked if they are a member of a club for the activity or activities they participate in. For obvious reasons, this question was not asked of people participating in ‘spending general leisure time at the beach’.
Table 49 shows club membership rates of over 60% for yacht racing and over 45% for leisure sub-aqua diving. Many other activities show extremely low club membership rates.
There have been no significant changes in the proportion of participants who are club members between 2009 and 2008.
Table 49 Club Membership
2009 2008
Change (percentage
po ints)
Significance Measure
Number of respondents
2009
Number of respondents
2008Canoeing 7.1% 5.1% 2.0% 59% 216 179Water skiing* 9.7% 13.1% -3.4% 38% 42* 44*Small sail boat activities 20.6% 17.0% 3.6% 46% 101 80Rowing/Sculling 14.2% 8.7% 5.6% 60% 68 39*Windsurfing* 14.6% 29.2% -14.5% 81% 33* 21*Using personal watercraft* 3.0% 6.2% -3.2% 50% 43* 37*Motor boating/Cruising 9.2% 12.7% -3.5% 54% 81 94Yacht cruising 30.2% 25.9% 4.3% 43% 65 71Power boating 14.6% 6.7% 7.9% 83% 83 51Small sail boat racing* 42.4% 33.3% 9.1% 48% 29* 20*Canal boating 6.7% 5.3% 1.4% 27% 75 60Yacht racing* 60.5% 60.5% 0.0% 0% 20* 21*Surfboarding 5.3% 2.8% 2.5% 63% 110 98Kitesurfing* 10.4% 0.0% 10.4% 73% 7* 11*Angling (from a boat) 13.4% 15.8% -2.4% 34% 86 83Angling (from the shore) 15.1% 20.2% -5.0% 80% 177 200Cliff climbing 17.9% 13.2% 4.7% 55% 68 64Coastal walking 1.1% 1.1% 0.0% 6% 1108 1142Outdoor swimming 2.6% 2.5% 0.1% 9% 735 553Leisure sub-aqua diving (from the shore and boat)* 46.9% 41.6% 5.4% 37% 44* 37*Spending general leisure time at the beach n/a n/a n/a n/a n/a n/aBase: all respondents who participate in an activity in the UKSource: Watersports participation survey 2007 and 2008*Caution: small base size
Table 50 shows the number of times club members and non-club members who participated in 2009. It shows, as was the case in previous years, that for some activities there is a clear relationship between the number of events and club membership. For example, only 21% of respondents who participate in small sail boat activities in the UK said they are a club member, but these people contribute 44% of the total events in that activity in 2009. Club members for leisure sub-aqua diving generate 77% of the total events and club members for yacht racing account for almost 90% of total events in the UK. As with the other tables in this report, the small base size for several of these activities needs to be taken into account when interpreting the results.

Watersports and Leisure Participation Report 2009 Page 55 of 64
Table 50 Number of Events by Club Membership Status
Number of coastal events
Number of inland events
Total Number of events
UK participant number
Number of respondents
Number of coastal events
Number of inland events
Total number of events
UK participant
numberNumber of
respondents
Total number of
respondentsCanoeing 968,751 2,113,077 3,081,828 71,875 13 2,008,465 3,305,376 5,313,841 936,863 203 216 Water skiing* 19,265 497,083 516,348 18,455 4 682,753 876,219 1,558,972 172,219 38 42*Small sail boat activities 516,272 682,594 1,198,867 91,349 22 985,675 527,271 1,512,947 352,605 79 101 Rowing/Sculling 530,730 862,425 1,393,155 44,862 10 153,955 485,057 639,012 270,198 58 68 Windsurfing* 267,020 104,153 371,173 23,290 4 553,973 108,164 662,137 135,937 29 33*Using personal watercraft* 18,371 - 18,371 6,124 1 872,419 467,496 1,339,915 195,671 42 43*Motor boating/Cruising 355,572 205,252 560,824 32,601 7 896,779 611,484 1,508,263 323,416 74 81 Yacht cruising 885,789 35,184 920,973 83,909 20 805,323 243,940 1,049,263 193,608 45 65 Power boating 693,393 518,504 1,211,897 56,085 12 1,777,835 756,056 2,533,891 327,042 71 83 Small sail boat racing* 28,504 388,307 416,811 56,018 12 135,621 100,904 236,525 76,252 17 29*Canal boating - 112,581 112,581 20,979 5 36,639 934,943 971,582 292,750 70 75 Yacht racing* 351,018 158,951 509,969 58,167 13 59,870 - 59,870 37,958 7 20*Surfboarding 1,386,451 - 1,386,451 27,803 5 2,933,409 - 2,933,409 498,962 105 110 Kitesurfing* 32,276 32,276 64,553 3,228 1 137,806 66,430 204,236 27,664 6 7*Angling (from a boat) 188,899 159,155 348,053 50,102 11 1,253,513 1,157,334 2,410,846 323,276 75 86 Angling (from the shore) 899,236 1,628,153 2,527,389 118,282 30 2,767,846 5,924,100 8,691,946 664,876 147 177 Cliff climbing 85,408 1,010,936 1,096,344 57,388 11 393,027 774,471 1,167,498 262,513 57 68 Coastal walking 908,758 - 908,758 49,329 14 63,095,086 - 63,095,086 4,587,209 1,094 1,108 Outdoor swimming 814,359 1,821,047 2,635,406 85,158 18 12,705,826 9,432,763 22,138,589 3,188,577 717 735 Leisure sub-aqua diving (from the shore and boat)* 996,785 510,863 1,507,648 99,463 19 400,606 38,986 439,592 112,511 25 44*Spending general leisure time at the beach - - - - - 56,425,772 - 56,425,772 5,101,082 1,229 1,229
Club member Non-club member
Base: all respondents who participate in an activity in the UKSource: Watersports participation survey 2009*Caution: small base size

Watersports and Leisure Participation Report 2009 Page 56 of 64
10. Boat OwnershipThe boat ownership questions were asked for the first time in 2007. These questions were asked of each respondent, whether they had participated in any of the activities asked about earlier in the questionnaire or not. They refer to the household (not personal) ownership.
In the 2009 questionnaire Motor boats were split out into Day Motor boats and Other Motor boats7. In all tables we are showing an overall total for Motor Boats (Day or Other), which is used to compare results with previous waves, as well as the separate results for Day and Other Motor boats.
Boat ownership penetration in UK households
In 2008 the small sailing boat numbers showed an unusually large drop compared to the numbers reported in the 2007 survey. Our investigations at the time suggested that the scale of decline did not reflect what was actually happening in the market. Therefore an adjusted estimate was reported in 2008. Analysing the data collected in 2009 reveals that the boat ownership rate for small sailing boats in 2009 is exactly the same as the pre-adjusted rate of 2008. Therefore it seems that the ownership rate reported in 2007 was too high rather than the 2008 figure too low. In the following tables we are therefore using the pre-adjusted 2008 figures for 2008 and ‘any boat’.
2.73% of all those surveyed said their household owns at least one craft from the list of boat types presented. We also show the lower and upper 90% confidence intervals around this estimate in the table below. For example, we can be 90% certain that the true figure of households owning any type of boat from the list below lies between 2.50% and 2.97% in 2009 (compared to 2.24% and 2.69% in 2008 and 2.58% and 3.07% in 2007).
We can use a UK household estimate of 24.9 million households to convert these proportions into an estimate of the number of households owning any type of boat. Using this method, c. 681,000 of UK households own any kind of boat. The boat may be kept either at home or abroad (see next section). It should be borne in mind that though this is a factual question it is still subject to respondent’s perceptions. For example a boat left unused will at some point be discounted by a respondent.
Table 51 Penetration of Boat Ownership in UK Households% of
households owning a
boat Min 90% Max 90%
Number of households
owning a boat
Min 90% number
Max 90% number
Any boat 2.73% 2.50% 2.97% 680,835 621,701 739,968 Small sailing boat 0.54% 0.43% 0.64% 134,056 107,522 160,590 Sailing yacht 0.24% 0.16% 0.31% 58,648 41,071 76,225 Power Boat 0.22% 0.15% 0.28% 53,797 36,961 70,633 Motor boat (Day or Other) 0.36% 0.27% 0.45% 89,386 67,700 111,072 Day Motor boat 0.22% 0.15% 0.29% 54,441 37,505 71,378 Other Motor boat 0.14% 0.09% 0.19% 34,945 21,371 48,519 Canal boat 0.05% 0.02% 0.09% 13,128 4,805 21,452 Canoe\Kayak 1.10% 0.95% 1.25% 273,344 235,561 311,126 Rowing boat 0.07% 0.03% 0.10% 16,357 7,067 25,648 RIBs\Inflatables or sportsboats 0.12% 0.07% 0.17% 29,926 17,363 42,489 Windsurfer 0.28% 0.20% 0.35% 68,540 49,542 87,538 Personal watercraft 0.13% 0.08% 0.18% 32,889 19,719 46,058 Base 12,683 24,900,000Source: Watersports and Leisure Omnibus Survey 2009 (Base: all respondents - 12,683 adults aged 16+)
7 A ‘Day Motor Boat’ is a river or coastal boat without cooking facilities and a place suitable for sleeping). An ‘Other Motor Boat’ is a river or coastal boat with cooking facilities and a place suitable for sleeping.

Watersports and Leisure Participation Report 2009 Page 57 of 64
The following table shows boat ownership penetration in UK households for 2009 and compares these with the results from 2008. The proportion of UK households owning any kind of boat from the list has increased in 2009 to 2.73% from 2.47% in 2008 but is still slightly lower than the 2.83% recorded in 2007. The increase in ownership of any type of boat is driven by an increase in canoes/kayaks ownership. However, this increase in overall ownership is not statistically significant.
Ownership of canoes/kayaks is the only significant increase in boat ownership by boat type between 2008 and 2009.
There are two significant drops: Rowing boats RIBs (Rigid Inflatable Boats)/inflatables or sportsboats
Boat ownership for four other boat types has decreased slightly but not significantly. These are (in order from biggest to smallest decrease): Power boats Sailing yachts Canal boats Windsurfers
The remaining boats types have stayed stable.
Table 52 Penetration of Boat Ownership in UK Households 2009 vs 2008
2009 2008
Difference (percentage
points)Significance
MeasureAny boat 2.73% 2.47% 0.27% 82%Small sailing boat 0.54% 0.54% 0.00% 2%Sailing yacht 0.24% 0.28% -0.04% 52%Power Boat 0.22% 0.28% -0.06% 69%Motor boat (Day or Other) 0.36% 0.36% 0.00% 0%Day Motor boat 0.22% n/a n/a n/aOther Motor boat 0.14% n/a n/a n/aCanal boat 0.05% 0.09% -0.04% 76%Canoe\Kayak 1.10% 0.73% 0.36% 100%Rowing boat 0.07% 0.14% -0.07% 93%RIBS\Inflatables or sportsboats 0.12% 0.21% -0.09% 91%Windsurfer 0.28% 0.29% -0.02% 19%Personal watercraft 0.13% 0.13% 0.00% 1%Base 12,683 12,637
% of households owning a boat
Source: Watersports and Leisure Omnibus Survey 2009 and 2008 (Base: all respondents - 12,683 and 12,637 adults aged 16+ respectively)
Table 53 shows that there is a relationship between a household owning a boat and whether or not arespondent has participated in the activity. Those who own boats are consistently more likely to participate in any boating activity than those who do not.
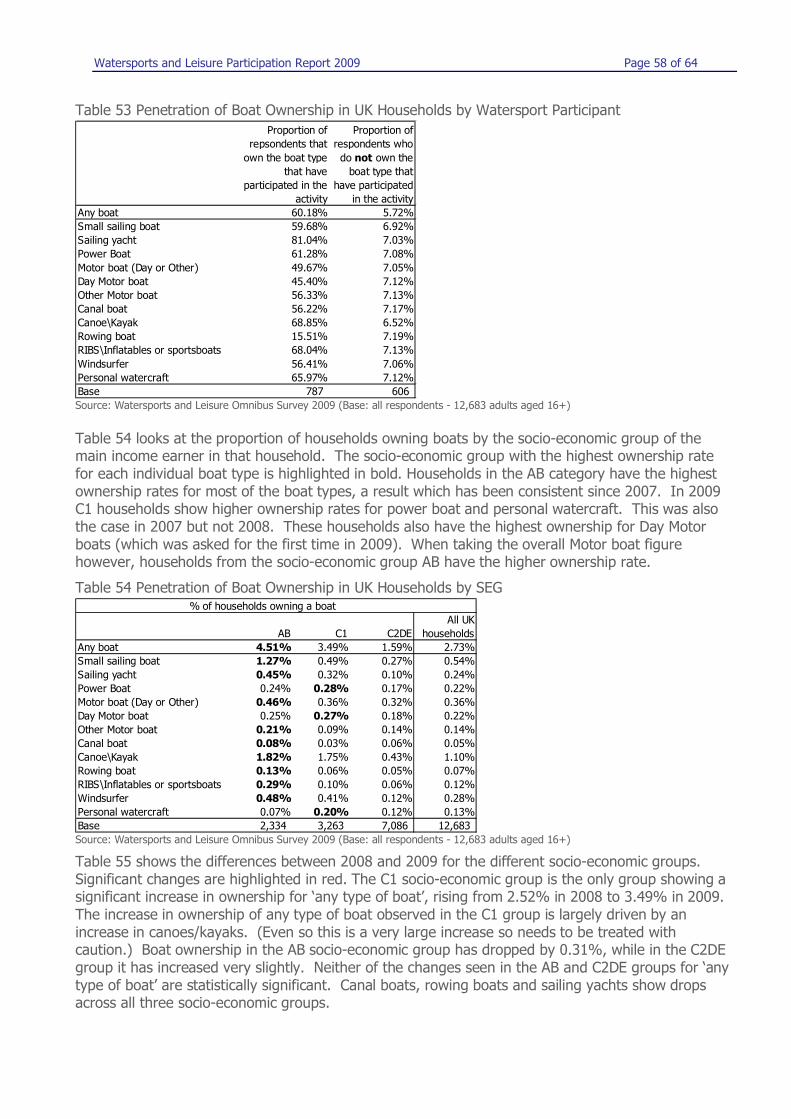
Watersports and Leisure Participation Report 2009 Page 58 of 64
Table 53 Penetration of Boat Ownership in UK Households by Watersport ParticipantProportion of
repsondents that own the boat type
that have participated in the
activity
Proportion of respondents who do not own the
boat type that have participated
in the activityAny boat 60.18% 5.72%Small sailing boat 59.68% 6.92%Sailing yacht 81.04% 7.03%Power Boat 61.28% 7.08%Motor boat (Day or Other) 49.67% 7.05%Day Motor boat 45.40% 7.12%Other Motor boat 56.33% 7.13%Canal boat 56.22% 7.17%Canoe\Kayak 68.85% 6.52%Rowing boat 15.51% 7.19%RIBS\Inflatables or sportsboats 68.04% 7.13%Windsurfer 56.41% 7.06%Personal watercraft 65.97% 7.12%Base 787 606 Source: Watersports and Leisure Omnibus Survey 2009 (Base: all respondents - 12,683 adults aged 16+)
Table 54 looks at the proportion of households owning boats by the socio-economic group of the main income earner in that household. The socio-economic group with the highest ownership rate for each individual boat type is highlighted in bold. Households in the AB category have the highest ownership rates for most of the boat types, a result which has been consistent since 2007. In 2009 C1 households show higher ownership rates for power boat and personal watercraft. This was also the case in 2007 but not 2008. These households also have the highest ownership for Day Motor boats (which was asked for the first time in 2009). When taking the overall Motor boat figure however, households from the socio-economic group AB have the higher ownership rate.
Table 54 Penetration of Boat Ownership in UK Households by SEG% of households owning a boat
AB C1 C2DEAll UK
householdsAny boat 4.51% 3.49% 1.59% 2.73%Small sailing boat 1.27% 0.49% 0.27% 0.54%Sailing yacht 0.45% 0.32% 0.10% 0.24%Power Boat 0.24% 0.28% 0.17% 0.22%Motor boat (Day or Other) 0.46% 0.36% 0.32% 0.36%Day Motor boat 0.25% 0.27% 0.18% 0.22%Other Motor boat 0.21% 0.09% 0.14% 0.14%Canal boat 0.08% 0.03% 0.06% 0.05%Canoe\Kayak 1.82% 1.75% 0.43% 1.10%Rowing boat 0.13% 0.06% 0.05% 0.07%RIBS\Inflatables or sportsboats 0.29% 0.10% 0.06% 0.12%Windsurfer 0.48% 0.41% 0.12% 0.28%Personal watercraft 0.07% 0.20% 0.12% 0.13%Base 2,334 3,263 7,086 12,683 Source: Watersports and Leisure Omnibus Survey 2009 (Base: all respondents - 12,683 adults aged 16+)
Table 55 shows the differences between 2008 and 2009 for the different socio-economic groups. Significant changes are highlighted in red. The C1 socio-economic group is the only group showing a significant increase in ownership for ‘any type of boat’, rising from 2.52% in 2008 to 3.49% in 2009. The increase in ownership of any type of boat observed in the C1 group is largely driven by an increase in canoes/kayaks. (Even so this is a very large increase so needs to be treated with caution.) Boat ownership in the AB socio-economic group has dropped by 0.31%, while in the C2DE group it has increased very slightly. Neither of the changes seen in the AB and C2DE groups for ‘any type of boat’ are statistically significant. Canal boats, rowing boats and sailing yachts show drops across all three socio-economic groups.

Watersports and Leisure Participation Report 2009 Page 59 of 64
Table 55 Percentage Change in Penetration of Boat Ownership in UK Households by SEG 2009 vs. 2008
% of households owning a boatAB C1 C2DE All UK
Any boat -0.31% 0.97% 0.08% 0.27%Small sailing boat -0.08% -0.10% 0.09% 0.00%Sailing yacht -0.12% -0.04% -0.02% -0.04%Power Boat -0.19% 0.05% -0.08% -0.06%Motor boat (Day or Other) -0.15% 0.06% 0.02% 0.00%Day Motor boat n/a n/a n/a n/aOther Motor boat n/a n/a n/a n/aCanal boat -0.05% -0.07% -0.02% -0.04%Canoe\Kayak 0.42% 0.92% 0.01% 0.36%Rowing boat -0.29% -0.04% -0.01% -0.07%RIBS\Inflatables or sportsboats -0.10% -0.24% 0.01% -0.09%Windsurfer -0.30% 0.12% 0.02% -0.02%Personal watercraft -0.24% 0.13% 0.02% 0.00%
The table below converts the proportion of households owning a boat in the UK by SEG into an absolute number of households. The overall number of households in the different socio-economic groups is an estimate based on the total number of households as given by the ONS and the distribution of households by SEG as presented in the 2008 Marketing Pocket Book.
Table 56 Number of UK Households Owning a Boat by SEGNumber of households owning a boat
AB C1 C2DEAll UK
householdsAny boat 290,975 252,334 177,838 680,835 Small sailing boat 81,879 35,648 30,538 134,056 Sailing yacht 29,000 23,114 11,360 58,648 Power Boat 15,618 20,234 18,897 53,797 Motor boat (Day or Other) 29,707 26,172 35,457 89,386 Day Motor boat 16,183 19,622 19,625 54,441 Other Motor boat 13,523 6,551 15,832 34,945 Canal boat 5,326 1,921 6,260 13,128 Canoe\Kayak 117,295 126,406 48,617 273,344 Rowing boat 8,071 4,054 5,321 16,357 RIBS\Inflatables or sportsboats 18,784 7,247 7,103 29,926 Windsurfer 31,100 29,587 12,907 68,540 Personal watercraft 4,735 14,326 13,137 32,889 All households 6,449,100 7,221,000 11,205,000 24,900,000Base 2,334 3,263 7,086 12,683 Source: Watersports and Leisure Omnibus Survey 2009 (Base: all respondents - 12,683 adults aged 16+)
Table 57 shows the proportion of households owning a boat by residence in ITV region. This does not mean that the boats are actually kept in these regions, but is based on household residence only. It should be borne in mind that very small changes in ownership will affect the relative position of each region to others in the list.
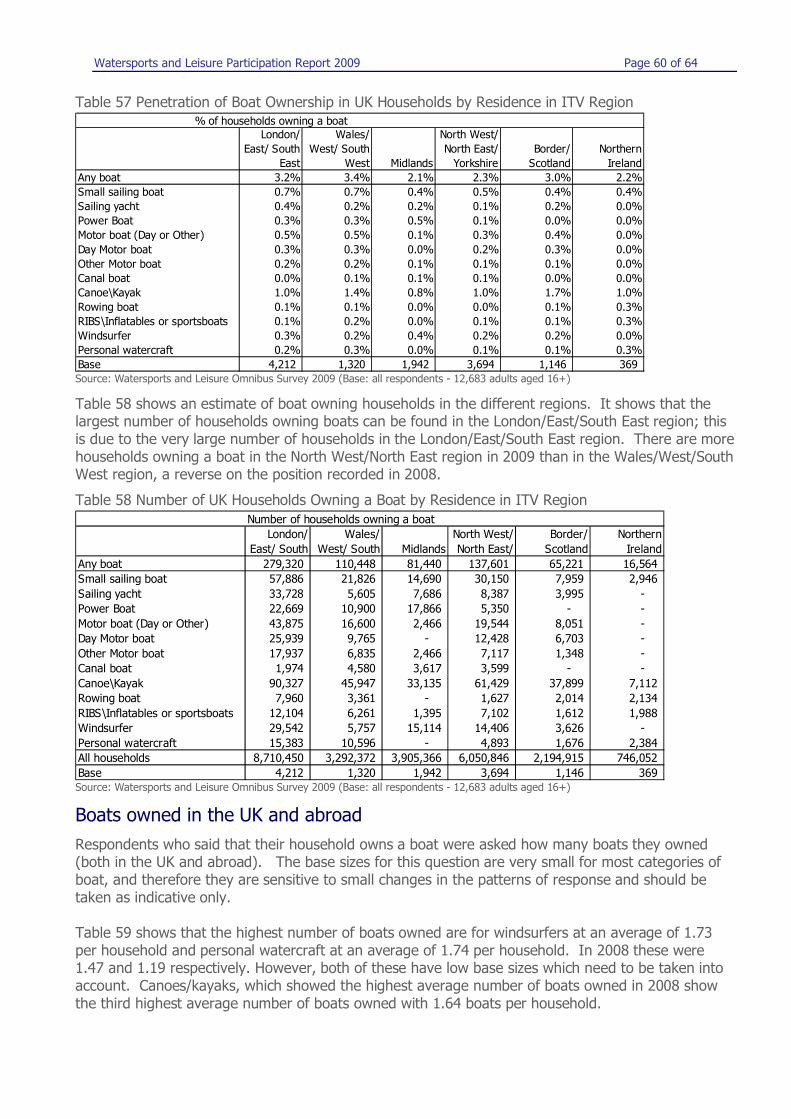
Watersports and Leisure Participation Report 2009 Page 60 of 64
Table 57 Penetration of Boat Ownership in UK Households by Residence in ITV Region% of households owning a boat
London/ East/ South
East
Wales/ West/ South
West Midlands
North West/ North East/
YorkshireBorder/
ScotlandNorthern
IrelandAny boat 3.2% 3.4% 2.1% 2.3% 3.0% 2.2%Small sailing boat 0.7% 0.7% 0.4% 0.5% 0.4% 0.4%Sailing yacht 0.4% 0.2% 0.2% 0.1% 0.2% 0.0%Power Boat 0.3% 0.3% 0.5% 0.1% 0.0% 0.0%Motor boat (Day or Other) 0.5% 0.5% 0.1% 0.3% 0.4% 0.0%Day Motor boat 0.3% 0.3% 0.0% 0.2% 0.3% 0.0%Other Motor boat 0.2% 0.2% 0.1% 0.1% 0.1% 0.0%Canal boat 0.0% 0.1% 0.1% 0.1% 0.0% 0.0%Canoe\Kayak 1.0% 1.4% 0.8% 1.0% 1.7% 1.0%Rowing boat 0.1% 0.1% 0.0% 0.0% 0.1% 0.3%RIBS\Inflatables or sportsboats 0.1% 0.2% 0.0% 0.1% 0.1% 0.3%Windsurfer 0.3% 0.2% 0.4% 0.2% 0.2% 0.0%Personal watercraft 0.2% 0.3% 0.0% 0.1% 0.1% 0.3%Base 4,212 1,320 1,942 3,694 1,146 369 Source: Watersports and Leisure Omnibus Survey 2009 (Base: all respondents - 12,683 adults aged 16+)
Table 58 shows an estimate of boat owning households in the different regions. It shows that the largest number of households owning boats can be found in the London/East/South East region; this is due to the very large number of households in the London/East/South East region. There are more households owning a boat in the North West/North East region in 2009 than in the Wales/West/South West region, a reverse on the position recorded in 2008.
Table 58 Number of UK Households Owning a Boat by Residence in ITV RegionNumber of households owning a boat
London/ East/ South
Wales/ West/ South Midlands
North West/ North East/
Border/ Scotland
Northern Ireland
Any boat 279,320 110,448 81,440 137,601 65,221 16,564 Small sailing boat 57,886 21,826 14,690 30,150 7,959 2,946 Sailing yacht 33,728 5,605 7,686 8,387 3,995 - Power Boat 22,669 10,900 17,866 5,350 - - Motor boat (Day or Other) 43,875 16,600 2,466 19,544 8,051 - Day Motor boat 25,939 9,765 - 12,428 6,703 - Other Motor boat 17,937 6,835 2,466 7,117 1,348 - Canal boat 1,974 4,580 3,617 3,599 - - Canoe\Kayak 90,327 45,947 33,135 61,429 37,899 7,112 Rowing boat 7,960 3,361 - 1,627 2,014 2,134 RIBS\Inflatables or sportsboats 12,104 6,261 1,395 7,102 1,612 1,988 Windsurfer 29,542 5,757 15,114 14,406 3,626 - Personal watercraft 15,383 10,596 - 4,893 1,676 2,384 All households 8,710,450 3,292,372 3,905,366 6,050,846 2,194,915 746,052 Base 4,212 1,320 1,942 3,694 1,146 369 Source: Watersports and Leisure Omnibus Survey 2009 (Base: all respondents - 12,683 adults aged 16+)
Boats owned in the UK and abroadRespondents who said that their household owns a boat were asked how many boats they owned (both in the UK and abroad). The base sizes for this question are very small for most categories of boat, and therefore they are sensitive to small changes in the patterns of response and should be taken as indicative only.
Table 59 shows that the highest number of boats owned are for windsurfers at an average of 1.73 per household and personal watercraft at an average of 1.74 per household. In 2008 these were 1.47 and 1.19 respectively. However, both of these have low base sizes which need to be taken into account. Canoes/kayaks, which showed the highest average number of boats owned in 2008 show the third highest average number of boats owned with 1.64 boats per household.

Watersports and Leisure Participation Report 2009 Page 61 of 64
Table 59 Average Number of Boats Owned in Boat Owning UK Households
Caution: very low base sizesSource: Watersports and Leisure Omnibus Survey 2009 (Base: all respondents owning a boat)
The vast majority of boats, 93%, are kept in the UK. This is the same as the figure in 2008. Personal watercraft shows the highest proportion of boats that are kept abroad with 30% (26% in 2008). Canal boats are exclusively kept in the UK. This was also the case in 2008. All this can be seen in Table 61. NB as the base sizes are very small for some boat types below is a combined table for the last two years to provide more robust data by boat type e.g. for rowing boats.
Table 60 Proportion of Boats Owned That Are Kept in the UK and Abroad% of boats kept in
the UK% of boats
kept abroad BaseAnyboat 93% 7% 311Small sailing boat 99% 1% 66Sailing yacht 88% 12% 30Power Boat 88% 12% 25Motor boat (Day or Other) 90% 10% 42Day Motor boat 92% 8% 24Other Motor boat 89% 11% 18Canal boat 100% 0% 7Canoe\Kayak 98% 2% 119Rowing boat 78% 22% 8RIBS\Inflatables or sportsboats 87% 13% 15Windsurfer 90% 10% 30Personal watercraft 70% 30% 14Caution: very low base sizesSource: Watersports and Leisure Omnibus Survey 2009 (Base: all respondents owning a boat)
Average number
of boats owned by
owning
households
Average
number of
boats kept in
the UK
Average
number of
boats kept
abroad Base
Any boat 1.35 1.26 0.09 311
Small sailing boat 1.16 1.14 0.02 66
Sailing yacht 1.03 0.91 0.12 30
Power Boat 1.07 0.94 0.13 25
Motor boat (Day or Other) 1.10 1.00 0.11 42
Day Motor boat 1.08 0.99 0.09 24
Other Motor boat 1.13 1.01 0.13 18
Canal boat 1.00 1.00 - Canoe\Kayak 1.64 1.61 0.02 119
Rowing boat 1.00 0.78 0.22 8
RIBS\Inflatables or sportsboats 1.12 0.97 0.15 15
Windsurfer 1.73 1.56 0.17 30
Personal watercraft 1.74 1.22 0.53 14
7

Watersports and Leisure Participation Report 2009 Page 62 of 64
Table 61 Proportion of Boats Owned That Are Kept in the UK and Abroad 2008 and 2009% of boats
the UK kept abroad BaseAny boat 93% 7% 588Small sailing boat 96% 4% 126Sailing yacht 89% 11% 63Power Boat 91% 9% 56Motor boat (Day or Other) 92% 8% 82Day Motor boat 92% 8% 24Other Motor boat 89% 11% 18Canal boat 100% 0% 20Canoe\Kayak 97% 3% 200Rowing boat 92% 8% 23RIBs\Inflatables or sportsboats 87% 13% 38Windsurfer 92% 8% 60Personal watercraft 72% 28% 29
% of boats kept in
Number of boats owned overall
Using the estimated number of households owning each of the different types of boats as established in Table 51 and the average number of boats owned as shown in
Table 59 we can calculate an estimated number of boats owned by households in the UK which are kept in the UK and the number of boats owned by UK households which are kept abroad.
For example, based on our estimate that there are around 273,344 households in the UK owning a canoe/ kayak and the average number of canoe/ kayaks owned in these households is 1.64 on average, the total number of canoes/ kayaks owned by UK households is 448,248. Of these, 485,686 are kept in the UK and only 6,736 are kept abroad.
Table 62 Number of Boats Owned in UK and Abroad by UK Households
Total number of boats owned by
households
Total number of
boats kept in the UK
Total number of boats kept abroad
Number of boat owning households
All boats 1,099,444 1,037,878 61,566 680,835 Small sailing boat 155,122 152,859 2,262 134,056 Sailing yacht 60,287 53,205 7,081 58,648 Power Boat 57,508 50,615 6,893 53,797 Motor boat (Day or Other) 98,463 89,009 9,454 89,386 Day Motor boat 58,833 53,869 4,964 54,441 Other Motor boat 39,630 35,140 4,490 34,945 Canal boat 13,128 13,128 - 13,128 Canoe\Kayak 448,208 441,412 6,796 273,344 Rowing boat 16,357 12,684 3,673 16,357 RIBS\Inflatables or sportsboats 33,637 29,143 4,494 29,926 Windsurfer 118,272 106,813 11,459 68,540 Personal watercraft 57,374 39,980 17,394 32,889 Source: Watersports and Leisure Omnibus Survey 2009 (Base: all respondents owning a boat)
Table 63 compares the number of boats owned in 2007, 2008 and 2009. Seven of the boat types show a drop in 2009 compared to 2008, three show an increase. The number of canal boats shows a continuing decline, as do rowing boats. Personal watercraft numbers have returned to the level seen in 2007 after a drop in 2008.

Watersports and Leisure Participation Report 2009 Page 63 of 64
Table 63 Number of Boats Owned by UK Households in 2007-2009
Total number of boats owned by
households
Number of boat owning households
Total number of boats owned by
households
Number of boat owning households
Total number of boats owned by
households
Number of boat owning households
All boats 1,099,444 680,835 952,934 614,083 1,169,482 703,923 Small sailing boat 155,122 134,056 157,843 133,362 249,217 199,265 Sailing yacht 60,287 58,648 69,844 69,844 80,645 69,210 Power Boat 57,508 53,797 73,966 69,494 68,717 61,916 Motor boat (Day or Other) 98,463 89,386 99,713 89,350 116,785 107,277 Day Motor boat 58,833 54,441 n/a n/a n/a n/aOther Motor boat 39,630 34,945 n/a n/a n/a n/aCanal boat 13,128 13,128 23,102 23,102 31,294 31,294 Canoe\Kayak 448,208 273,344 292,637 182,949 310,606 182,162 Rowing boat 16,357 16,357 38,251 34,630 49,203 44,806 RIBS\Inflatables or sportsboats 33,637 29,926 51,213 51,213 61,040 51,176 Windsurfer 118,272 68,540 106,851 72,543 143,675 73,439 Personal watercraft 57,374 32,889 39,515 33,090 58,301 45,201
2009 2008 2007
Source: Watersports and Leisure Omnibus Survey 2009 (Base: all respondents owning a boat)
Table 64 is a summary of the total number of boats owned by UK households, grouped into boating categories. In total, there are over just under 1.1 million boats owned by UK households and about 1 million are kept in the UK.
Table 64 Estimate of Total Number of Boats Owned by UK Households
Average number of boats owned by
households
Average number of
boats kept in the UK
Average number of boats kept
abroad
Number of boat owning households
All boats 1,099,444 1,037,878 61,566 680,835 Sailing Boats 249,045 235,207 13,838 262,002 Motor Boats 389,063 348,130 40,932 156,311 Manual Craft 461,336 454,541 6,796 318,530 Source: Watersports and Leisure Omnibus Survey 2009 (Base: all respondents owning a boat)

Watersports and Leisure Participation Report 2009 Page 64 of 64
Points of Contact
BMF (British Marine Federation)Statistics & Market ResearchMarine HouseThorpe Lea RoadEghamSurreyTW20 8BFTel: 01784 437 377Email: [email protected]: www.britishmarine.co.uk
MCA (Maritime & Coastguard Agency)Research and Planning BranchSpring Place105 Commercial RoadSouthamptonHampshireSO15 1EGTel: 023 803 29100Email: [email protected]: www.mcga.gov.uk
RNLI (Royal National Lifeboat Institution)West Quay Road PooleDorset BH15 1HZ Tel: 0800 328 0600Email: [email protected]: www.rnli.org.uk
RYA (Royal Yachting Association)Marketing DepartmentRYA HouseEnsign WayHambleSouthamptonHampshireSO31 4YATel: 0845 345 0329Email: [email protected]: www.rya.org.uk
YBW.comIPC Marine MediaThe Blue Fin Building110 Southwark StreetLondonSE1 OSU
Tel: +44 (0)20 3148 5000Fax: +44 (0)20 3148 6439
YBW.com EditorDaniel FoleyTel: +44 (0) 20 3148 4920E-mail: [email protected]
Advertisement ManagerJane SmithTel: +44 (0) 1202 440 824E-mail: [email protected]