Embed Size (px)
Citation preview
Watershed Deforestation and Down-Estuary Transformations Alter
Sources, Transport, and Export ofSuspended Particles in Panamanian
Mangrove Estuaries
I. Valiela,1* M. Bartholomew,1 A. Giblin,1 J. Tucker,1 C. Harris,1
P. Martinetto,2 M. Otter,1 L. Camilli,3 and T. Stone4
1Marine Biological Laboratory, The Ecosystems Center, Woods Hole, Massachusetts 02543, USA; 2Instituto de Investigaciones Marinas
y Costeras, Consejo Nacional de Investigaciones Cientıficas y Tecnicas, Universidad Nacional de Mar del Plata, CC573 Mar del Plata,
Argentina; 3Biology Department, Woods Hole Oceanographic Institution, Woods Hole, Massachusetts 02543, USA; 4Woods HoleResearch Center, Falmouth, Massachusetts 02540, USA
ABSTRACT
We identified eight Panamanian watersheds in
which conversion from wet tropical forest to pas-
tures differed and assessed the effects of degree of
deforestation, and down-estuary transformations,
on the suspended particulate matter discharged from
the watersheds, entering, traversing through man-
grove estuaries, and emerging into coastal waters.
Deforested watersheds discharged larger concen-
trations of suspended particulate matter, with lower
% C and N, higher mineral content, and heavier
isotopic signatures into fresh reaches of estuaries.
Down-estuary, sediment entrainment increased
non-organic content of particulates, and watershed-
derived imprints of deforestation on composition of
particulate matter were mostly erased by within-
estuary transformations. Isotopic signatures of C, N,
and S in particulate matter demonstrated strong
land-sea couplings, and indicated that the direction
of the coupling was asymmetrical, with terrestrial
and estuarine sources delivering particulate materi-
als to coastal waters and sediments. Mangrove
estuaries therefore both act as powerful modulators
of human activities on land, while also exporting
particulate materials to sea.
Key words: land–sea coupling; mangrove forests;
stable isotopes; coastal sediment; carbon; nitrogen;
sulfur; tropical wet forest.
INTRODUCTION
The widely reported deforestation of tropical
watersheds (Wassenaer and others 2007; Scanlon
and others 2007; Downing and others 1999) is a
major agent of ecosystem change in tropical lati-
tudes, with regional- and global-scale effects on
climate (Gash and others 1996; IPCC 2007; Davin
and Noblet-Ducoudre 2010), regional precipitation
and water supply (Bosch and Hewlett 1982;
Received 26 June 2013; accepted 29 July 2013;
published online 5 September 2013
Electronic supplementary material: The online version of this article
(doi:10.1007/s10021-013-9709-5) contains supplementary material,
which is available to authorized users.
Author Contribution: IV and AG conceived the work, obtained the
funding, drafted the paper, and guided all the field and analytic work; MB
worked on statistical analyses and graphics; JT, CH, PM, and LC were in-
volved in the field work and chemical analyses; MO did the mass spec-
trometry and elemental analysis; TS was responsible for the remote sensing
work; all authors reviewed and edited the many versions of the text.
*Corresponding author; e-mail: [email protected]
Ecosystems (2014) 17: 96–111DOI: 10.1007/s10021-013-9709-5
� 2013 Springer Science+Business Media New York
96
Vorosmarty and others 2000; Sun and others 2006;
Scanlon and others 2007) and carbon sequestration
(Wolf and others 2011).
Deforestation may alter discharges of water and
nutrients from watersheds. Where plant biomass is
lower, there is less transpiration, and lower surface
area for evaporative loss (Lewis and others 1999;
Lewis 2002), which favor greater water discharge.
Lower biomass may also have varied effects on
interception, sequestering, and transport of sedi-
ments and nutrients down hydrological gradients
to receiving waters (Williams and Melack 1997;
Williams and others 1997; Cleveland and others
1999; Neill and others 2001; Zhang and others
2001; Bruijnzeel 2004; Nosetto and others 2005; Li
and others 2007; Bahn and others 2010).
Discharges of materials from deforested water-
sheds could have further consequences because
tropical streams in most circumstances grade into
mangrove-lined estuaries, and these ecosystems
could themselves be affected. The notion of wet-
lands, including mangrove estuaries, as compo-
nents of coastal landscapes essential in the coupling
of land and sea, whereby energy-rich exports of
terrestrial and estuarine materials support marine
food webs has been widely argued, with diverse
results from mass balance and stable isotope studies
(Jennerjahn and Ittekkot 2002; Dittmar and others
2006; Kristensen and others 2008). If indeed there
are mechanisms that couple terrestrial watersheds
to streams and estuaries, and to coastal waters,
deforestation of tropical forests could have conse-
quences for the receiving down-gradient ecosys-
tems.
To understand land–sea couplings and possible
effects of deforestation of tropical watersheds on
down-gradient mangrove estuaries and adjacent
coastal waters, we investigated the fate of materials
transported and transformed as they coursed
through coupled land–estuary–coastal ecosystems in
the Pacific coast of Panama. By initial surveys, we
followed the lead of earlier papers (Martinelli and
others 1999; Ralison and others 2008), and identi-
fied eight watershed-mangrove estuaries whose
watersheds were subject to different degrees of land
use, in our case, conversion from forest to pastures
(Figure 1) by targeted artisanal-level burning, and
where pastures were maintained by machete-based
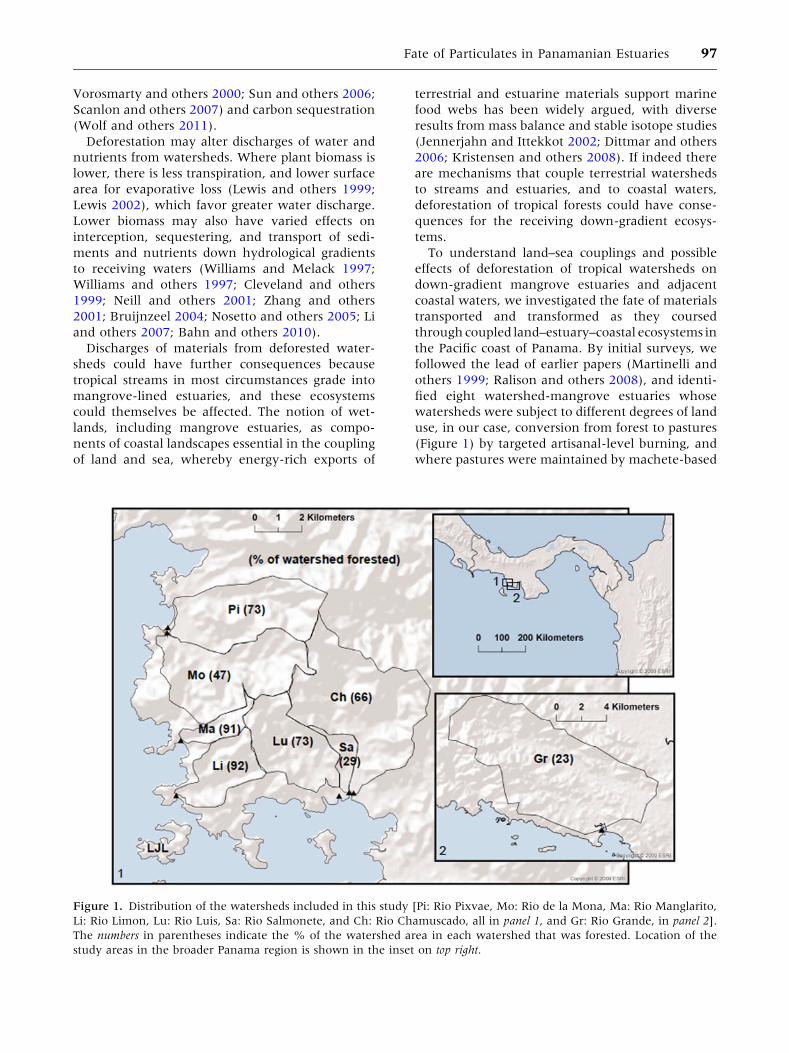
Figure 1. Distribution of the watersheds included in this study [Pi: Rio Pixvae, Mo: Rio de la Mona, Ma: Rio Manglarito,
Li: Rio Limon, Lu: Rio Luis, Sa: Rio Salmonete, and Ch: Rio Chamuscado, all in panel 1, and Gr: Rio Grande, in panel 2].
The numbers in parentheses indicate the % of the watershed area in each watershed that was forested. Location of the
study areas in the broader Panama region is shown in the inset on top right.
Fate of Particulates in Panamanian Estuaries 97

removal of invasive or re-growing woody plants.
These eight watershed–estuary systems constituted a
landscape-level experimental setting in which we
could assess consequences of different degrees of
terrestrial watershed deforestation on land–sea
coupling. Further details of land covers and defor-
estation were included in Valiela and others (2012,
2013, and in press) and additional features of the
watersheds are added in Table 1.
Previous studies on the Pacific coast of Panama
revealed that inter-annual increases in rainfall
associated with La Nina severely altered salinity re-
gimes (Valiela and others 2012), and altered fate and
transport of dissolved nutrients. Nutrient retention
within-watersheds was high, and forested water-
sheds discharged larger concentrations of dissolved
inorganic nitrogen to streams than pasture-domi-
nated watersheds. The imprint conferred by degree
of deforestation on export of dissolved materials
exported was detectable in fresh reaches of the
streams, but was erased by active down-estuary
biogeochemical transformations (Valiela and others
2013). In spite of the substantial transformations,
and net interception within watersheds and estuar-
ies, the export of dissolved nutrients to adjacent
coastal sea from mangrove estuaries was still signif-
icant because of the extremely nutrient depauperate
condition of the coastal waters of the region.
In this paper, we focus on particulate materials in
transit from the watersheds to the streams and
down the estuarine gradient to sea. The fate of
particulates is of interest because deforestation of
some watersheds increased downstream transport
of suspended particulate matter (Martinelli and
others 1999; Houser and others 2006) by erosion of
soils, stream banks, stream beds, and transport of
plant matter, and hence could increase consequent
transport of particles out of watersheds and out to
sea (Marechal and others 2009). To evaluate effects
of deforestation, we compared measurements ta-
ken from the eight Panamanian stream–estuary
systems whose watersheds suffered different de-
grees of deforestation. We report concentrations,
fates, and export of particulates in water, and assess
sources and transformations by measuring con-
centration, % nitrogen, % carbon, and stable iso-
topic signatures of suspended material. To
document down-estuary changes we sampled the
water column of each stream–estuary along the
entire range from fresh to seawater within estuaries
and beyond the mouth of the estuaries. To capture
possible inter-annual or seasonal variation, we re-
peated the sampling at the end of the dry and wet
seasons, during 2009–2012.
METHODS
Study Sites
The watershed-estuaries included in this study
(Figure 1) are located in the Veraguas Province of
Panama, and discharge into the Pacific Ocean. We
selected the eight coupled watershed–estuary sys-
tems (rios) because they offered a range of con-
versions from forest to pasture land covers, with
forest cover ranging from 23 to 92%. Terrain on the
watersheds was generally steep, and largely first
order streams carried mostly baseline freshwater
discharge (with surface runoff after large rainfall
events) down-gradient through mangrove estuar-
ies, and eventually to the Pacific. Details of geo-
logical setting, precipitation, and other information
were provided in Valiela and others (2012, 2013).
Some of that information, plus added details, is
summarized in Table 1.
Table 1. Selected Properties of the Watershed–Stream–Estuary Systems (Rios) Included in This Study
Rio Area (ha) Maximum
elevation (m)
Maximum
length (m)
Maximum
slope (%)
Mean
angle (�)% Forest
cover
Pixvae 1,429 629 6,410 9.8 5.6 73
de la Mona 1,575 462 6,468 7.1 4.1 47
Manglarito 239 340 3,626 9.4 5.4 91
Limon 665 382 4,220 9.1 5.2 92
Luis 1,007 382 5,109 7.5 4.3 73
Salmonete 197 330 3,814 8.7 4.9 29
Chamuscado 2,229 599 8,229 7.3 4.2 66
Grande 9,639 662 15,109 4.4 2.5 23
Data obtained from Aster Satellite imagery acquired February 7, 2006 for Rio Grande, and from Quickbird imagery acquired April 5, 2003 for the rest of the Rios. Data onarea and % forest cover, plus additional data on land covers, appeared in Valiela and others (2012, 2013). Tide range in all these rios averages 4 m, and owing to the steeptopography, freshwater residence times within the rios is about a day; depths within the rios vary with location and tide state, over a range of less than 1 to less than 10 m., anddepth increases sharply seaward of the estuary mouth.
98 I. Valiela and others

Water Sampling
To determine concentrations of suspended partic-
ulate matter (SPM) in water that just exited
watersheds and entered freshwater streams, moved
through estuaries and out to sea, we sampled water
during ebbing tides at six stations spaced between
the fresh reaches and the mouth of each of the
eight estuaries. This set of stations captured the
fresh to seawater salinity gradient within each
estuary (Valiela and others 2012). During each
sampling trip, location of stations 1–6 was adjusted
to make sure the sampling captured the changing
gradient from freshwater to full salinity and nutri-
ents. The gradient shifted location owing to differ-
ences in tidal state and stream flows from one
sampling trip to the next. Locations of the many
sampling stations in each of the rios are indicated in
Figures SI2–SI9 in supplementary information.
Within-estuary sampling was done at one depth
because during ebb tides water columns were
mostly shallow (<1.5 m) and well mixed verti-
cally. Some vertical stratification was present, but
was spatially highly variable because of un-even
bathymetry, fast down-gradient flow, and a large
tidal excursion (well over 4 m for most tides). To
assess what happened to the SPM once estuarine
water emerged off the estuaries, we followed the
ebb plume in each estuary and sampled at three
distances away from the estuary discharge (stations
7–9), which, very roughly, were located about 50,
100, and 300 m off each estuary mouth.
The within- and outside-estuary sampling in
stations 1–9 was repeated during periods of
3 weeks each during March 2009, December 2009,
March 2010, December 2010, April 2011, and
January 2012. This sampling schedule insured data
were collected during the end of dry season (gen-
erally January–April) and the end of the wet season
(generally May–December), across a span of
4 years.
Water Quality and SPM Measurements
Methods and results regarding nutrient concen-
trations in the samples collected were discussed in
Valiela and others (2013). Salinity, oxygen, and
temperature were measured in all stations with an
YSI 85-10 unit. Water samples to measure SPM and
chlorophyll were collected in 20 l carboys and kept
cool during transportation to the lab. Water was
first passed through a 210-lm mesh to remove
zooplankton that would have compromised stable
isotope measurements of SPM. SPM samples were
then obtained by filtering 0.5–1.5 L of water
through pre-ashed and pre-weighed 0.7 mm GF/F
filters. Filters were rinsed, dried in a drying oven
for 2 days at 60�C and then reweighed. SPM con-
centrations (in mg l-1) were calculated as (final
filter weight-original filter weight)/volume of wa-
ter filtered. What we refer to as suspended partic-
ulate matter or SPM here can also be thought of as
seston of less than 210 lm in diameter.
To measure chlorophyll a we filtered water
through a 47-mm GF/F filter until clogged using a
vacuum pump. The volumes varied between 0.8
and 3 l. The filters were then frozen until we were
ready for analysis. In our Woods Hole laboratories,
the filters were thawed and sonicated in 90%
buffered acetone to lyse the cells, and chlorophyll
was measured after 12 h of incubation, on a Turner
Designs 10AU fluorometer for fluorescence before
and after acidification. Chlorophyll a concentra-
tions were calculated as
chla ¼ Fi r= r � 1ð Þð Þ Rb�sam � Ra�samð ÞVacetone=Vsample
� �;
where Fi is the slope of the calibration curve, Rb-sam
is the reading of the sample before being acidified,
Ra-sam is the reading of the sample after being
acidified, r is the ratio of the fluorescence values of
a pure chl a solution/acidified pure chl a solution,
Vacetone is the volume of the extract (ml), Vsample is
the volume of water filtered (ml).
Isotopic and Elemental Analysis
N, C, and S stable isotope and elemental analyses of
SPM were performed by mass spectrometry at The
Ecosystems Center, Marine Biological Laboratory,
Woods Hole, MA. Solid samples were analyzed for
d15N, d13C, and d34S using an Europa 20-20 con-
tinuous-flow isotope ratio mass spectrometer
interfaced with an Europa ANCA-SL elemental
analyzer. The analytical precision, based on repli-
cate analyses of isotopically homogeneous NIST
Standard reference materials, was ± 0.1 & for d15N and d 13C measurements, ±0.3& for d 34S, and
about ±1% for %N, %C, and %S measurements.
Stable isotope ratios were reported as per mil (&)
using delta notation determined as
d15N; d13C, or d34S &ð Þ¼ Rsample � Rstandard
� �=Rstandard
� �� 103;
where R was 15N/14N, 13C/12C, or 34S/32S. To aid
interpretation of sources, composition, and trans-
port of SPM, we determined N, C, and S contents of
SPM samples analyzed for isotopic signatures. To
constrain costs of isotopic and elemental analysis
Fate of Particulates in Panamanian Estuaries 99
for sulfur, a subset of samples of SPM, collected
during 2009 and 2010, were selected for analysis.
These were randomly chosen from the larger set of
samples of SPM, from estuaries within the entire
range of % forest cover on their watershed.
To compare the isotopic signatures of SPM to
those of the various potential sources of suspended
materials, we first collected surface sediments
within each estuary by taking 1-cm deep, 5-cm
diameter cores in the stations down-estuary, and
measured stable isotope and elemental contents as
in the case of SPM samples. Second, we also sam-
pled large particulate organic matter (POM) being
transported down-estuary by installing a 30-cm
diameter plankton net near the mouth of estuaries
during ebbing tide. Third, to compare SPM values
to those of mangrove trees, we used stable isotopic
ratios and elemental values in mangrove tree leaves
sampled within the same estuaries, reported in
Valiela and others (in press). Fourth, we also re-
viewed published data on tropical terrestrial trees,
soils, and coastal sediments as additional compari-
sons.
Statistical Analyses
SPM concentrations measured during our sam-
plings varied substantially. In this paper we high-
light effects of degree of watershed deforestation
and down-estuary gradients, and what took place
within the mangrove estuaries, and outside the
estuaries. We acknowledge that variation in
amount and quality of SPM can be influenced by
inter-annual, seasonal, tidal elevation, meteoro-
logical differences, as well as watershed differences
in topography, soils, and vegetation. We did not try
to partition and evaluate all sources of variation,
but instead focused on assessing whether the effects
of watershed deforestation and estuarine gradi-
ent—scaled by salinity—were robust enough to
emerge through the large variation in SPM con-
centrations in samples collected within estuaries or
outside estuaries.
Comparisons of the eight different estuaries,
sampled on five different dates, and with nine
stations located from the fresh to marine salinity
ranges proved rather cumbersome. To make com-
parisons practical and more accessible, we stratified
the eight watershed–estuaries into three groups,
representing high (91–92%, Limon and Manglari-
to, Figure 1), intermediate (47–76%, Chamuscado,
Luis, de la Mona, and Pixvae, Figure 1), and low
(23–29%, Grande and Salmonete, Figure 1) forest
cover on the surface of contributing watersheds
(see also Table 1).
We applied two types of analysis. To first docu-
ment the link of SPM to both forest cover and
salinity down-estuary, while simultaneously
showing the entire data sets, we regressed SPM
variables versus salinity for each of the three forest
cover groups, and then compared the regressions
among the forest groups, by either ANCOVA or,
where slopes differed, by an equivalent procedure
involving t tests of intercepts and slopes among
regression equations. These analyses were sepa-
rately applied to measurements taken within
estuaries, and outside estuaries. Second, to then
partition the effects of forest cover, salinity, and
sampling trip (which included seasonal and inter-
annual variation), and test their significance versus
the residual from remaining sources of variation,
we used a random factor three-way ANOVA with
unequal replication. We used a random factors
model because initial examination showed that
high residual variation made effects of nested
structure of sampling and repeated measures
undetectable. Statistical analyses were run in R
software.
Below we first document the down-estuary
course of SPM concentrations and assess the effect
of watershed deforestation. Then, we sort out some
of the components that made up the SPM that we
measured, and end with a consideration of the
sources, connections, and transport of particulate
materials in these coupled adjoined watershed–
stream–mangrove estuary–coastal water ecosys-
tems.
RESULTS AND DISCUSSION
Effects of Deforestation and Down-Estuary Gradients on Amount of SPM
Within-Estuary Effects
In spite of substantial variability in concentration of
SPM measured within estuaries, water emerging
from deforested watersheds contained significantly
larger concentrations of SPM compared to water
derived from watersheds with greater forest cover
(Figure 2). The contrasts were evident in regres-
sions of SPM and down-estuary salinity, which
revealed three significant features (Figure 2 left):
(1) water emerging from deforested watersheds
had higher concentrations of particles to fresh
reaches of receiving estuaries: concentrations
of SPM delivered to fresh reaches of the estu-
aries (evaluated as the intercept of the regres-
sions, where salinity = 0) were three times
larger in watersheds with greater conversion to
100 I. Valiela and others
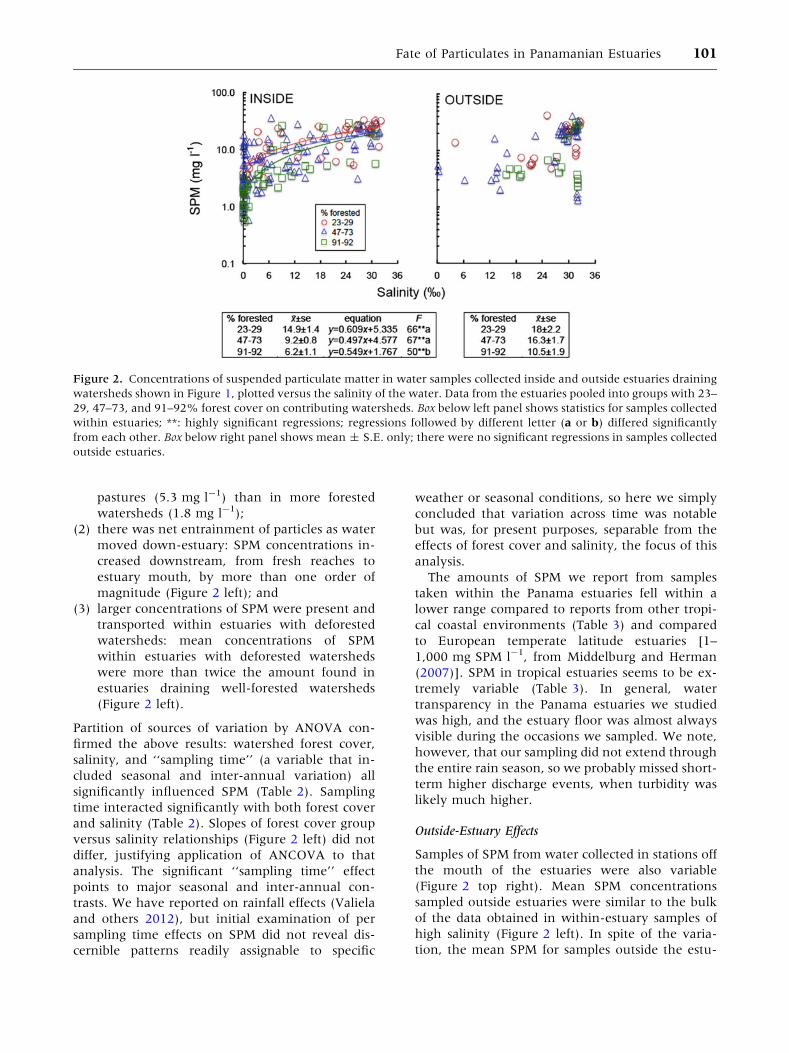
pastures (5.3 mg l-1) than in more forested
watersheds (1.8 mg l-1);
(2) there was net entrainment of particles as water
moved down-estuary: SPM concentrations in-
creased downstream, from fresh reaches to
estuary mouth, by more than one order of
magnitude (Figure 2 left); and
(3) larger concentrations of SPM were present and
transported within estuaries with deforested
watersheds: mean concentrations of SPM
within estuaries with deforested watersheds
were more than twice the amount found in
estuaries draining well-forested watersheds
(Figure 2 left).
Partition of sources of variation by ANOVA con-
firmed the above results: watershed forest cover,
salinity, and ‘‘sampling time’’ (a variable that in-
cluded seasonal and inter-annual variation) all
significantly influenced SPM (Table 2). Sampling
time interacted significantly with both forest cover
and salinity (Table 2). Slopes of forest cover group
versus salinity relationships (Figure 2 left) did not
differ, justifying application of ANCOVA to that
analysis. The significant ‘‘sampling time’’ effect
points to major seasonal and inter-annual con-
trasts. We have reported on rainfall effects (Valiela
and others 2012), but initial examination of per
sampling time effects on SPM did not reveal dis-
cernible patterns readily assignable to specific
weather or seasonal conditions, so here we simply
concluded that variation across time was notable
but was, for present purposes, separable from the
effects of forest cover and salinity, the focus of this
analysis.
The amounts of SPM we report from samples
taken within the Panama estuaries fell within a
lower range compared to reports from other tropi-
cal coastal environments (Table 3) and compared
to European temperate latitude estuaries [1–
1,000 mg SPM l-1, from Middelburg and Herman
(2007)]. SPM in tropical estuaries seems to be ex-
tremely variable (Table 3). In general, water
transparency in the Panama estuaries we studied
was high, and the estuary floor was almost always
visible during the occasions we sampled. We note,
however, that our sampling did not extend through
the entire rain season, so we probably missed short-
term higher discharge events, when turbidity was
likely much higher.
Outside-Estuary Effects
Samples of SPM from water collected in stations off
the mouth of the estuaries were also variable
(Figure 2 top right). Mean SPM concentrations
sampled outside estuaries were similar to the bulk
of the data obtained in within-estuary samples of
high salinity (Figure 2 left). In spite of the varia-
tion, the mean SPM for samples outside the estu-
Figure 2. Concentrations of suspended particulate matter in water samples collected inside and outside estuaries draining
watersheds shown in Figure 1, plotted versus the salinity of the water. Data from the estuaries pooled into groups with 23–
29, 47–73, and 91–92% forest cover on contributing watersheds. Box below left panel shows statistics for samples collected
within estuaries; **: highly significant regressions; regressions followed by different letter (a or b) differed significantly
from each other. Box below right panel shows mean ± S.E. only; there were no significant regressions in samples collected
outside estuaries.
Fate of Particulates in Panamanian Estuaries 101

aries still retained a trace of effect of watershed
deforestation, with larger SPM values associated
with discharges from estuaries with deforested
watersheds (Figure 2 right). Most samples of SPM
collected outside the estuaries resembled values
recorded at high salinities inside the estuaries, with
some notable exceptions. Samples with salinity
lower than 22 were from a December 2010 sam-
pling that followed unusually high wet season
rainfall that substantially freshened and diluted
concentrations (Valiela and others 2012). Some
samples collected outside the estuaries showed
lower SPM, probably a measure of particle sinking
toward the sea floor after the water mass emerged
from the estuaries. Below, we will return to this
likely directional flux from estuaries to coastal
sediments. SPM measured outside the Panama
estuaries fell within the lower range of values
measured elsewhere in the tropics (Table 3).
Effects on composition of SPM
To evaluate the effect of deforestation and down-
estuary transport on organic and inorganic com-
position of SPM, we plotted carbon, nitrogen,
mineral content, and chlorophyll of SPM versus the
% of the watershed that was deforested, for sam-
ples collected within salinity ranges of less than 5,
5–25, and greater than 25 inside the estuaries
(Figure 3).
Table 2. Three-way, Random Factor Analysis of Variance with Unequal Replication, for Within-estuarySPM Data of Figure 1 (left), Done with R
Source of variation Degrees of freedom Mean squares F
For weight of SPM
Sampling time 4 2666.5 120.3***
Forest cover 2 925.9 41.8***
Salinity 2 2409.0 108.7***
Sampling time 9 forest cover 8 147.8 6.7***
Sampling time 9 salinity 8 220.8 10.0***
Forest cover 9 salinity 4 31.5 1.4 ns
Sampling time 9 forest cover 9 salinity 13 31.4 1.4 ns
Residual 229 22.2
For % carbon
Forest cover 2 46.70 4.708*
Salinity 2 39.00 3.932*
Sampling time 1 0.29 0.030 ns
Forest cover 9 Salinity 4 9.40 0.947 ns
Forest cover 9 Sampling time 2 3.41 0.343 ns
Salinity 9 Sampling time 1 0.00 0.000 ns
Residual 19 9.92
For % nitrogen
Forest cover 2 0.6281 4.252*
Salinity 2 0.4515 3.057 ns
Sampling time 1 0.0017 0.011 ns
Forest cover 9 Salinity 4 0.1178 0.798 ns
Forest cover 9 Sampling time 2 0.0135 0.091 ns
Salinity 9 Sampling time 1 0.0001 0.001 ns
Residual 19 0.1477
For chlorophyll a
Forest cover 2 3.659 10.541***
Salinity 2 18.691 53.847***
Sampling time 4 5.133 14.787***
Forest cover 9 salinity 4 0.649 1.870 ns
Forest cover 9 sampling time 8 0.651 1.876 ns
Salinity 9 sampling time 7 1.026 2.955**
Forest cover 9 salinity 9 sampling time 10 0.482 1.387 ns
Residual 153 0.347
‘‘Sampling time’’ variable included sampling trips during 2009–2011, and wet and dry seasons. ‘‘Forest cover’’ refers to land covers on contributing watersheds (Table 1;Figure 1). ‘‘Salinity’’ is a proxy for down-estuary gradient. Comparisons of P level at, or < 0.001 are shown as ***, at, or <0.01 are shown as **, and at, or <0.05 areshown as *, not significant shown as n.s
102 I. Valiela and others

Carbon Content of SPM
Deforestation on the contributing watersheds sig-
nificantly lowered the carbon content of SPM de-
rived from watersheds (Figure 3, top panels;
Table 1). % C in SPM discharged from watersheds
with 91–92% forest cover into fresh reaches of
receiving estuaries was more than seven times
larger than in SPM discharged from watersheds
with forest covers of 23–29% (Figure 3; and
regression intercepts in Table 2).
The forest cover imprint on % C diminished down-
estuary (Figure 3; Table 2, compare slopes of the
regressions). By the time salinity in the estuary water
column exceeded 25, %C in SPM in all estuaries
converged to about 1% C, regardless of the forest
cover on the contributing watershed (Figure 3).
These results suggest that, first, the lability of
organic matter in SPM, as well as the amounts of
SPM, likely diminished with deforestation. Second,
the watershed imprints conveyed by degree of
forest cover were erased during down-estuary
transit of the particulate materials.
Nitrogen Content and C/N of SPM
The %N in SPM collected within fresh reaches
depended on forest cover on the contributing wa-
tershed (Table 1). %N was significantly higher in
SPM released into fresh reaches from the most
forested watersheds (Figure 3, second row of pan-
els, and note >6-fold difference in intercepts in
Table 2). The imprint of forest cover, however, was
soon erased during transit down-estuary, and %N
Table 3. Comparison of Suspended Particulate Matter (SPM) Measured Within and Outside DifferentTropical Estuaries
Locality SPM (mg l-1) Source
Within estuaries Outside estuaries
Papua-New Guinea 23–775 6–42 Robertson and others (1993)
Mexico 60–260 – Rivera-Monroy and others (1995)
Ecuador 42–696 50–100 Cifuentes and others (1996)
Kenya 24.5–3,179 3–1,512 Kitheka and others (2005)
Australia 12.3–97.7 – Smith and others (2012)
Panama 0.5–40 1–50 This study
Figure 3. Rows: %
carbon, nitrogen, and
mineral content, and
chlorophyll
concentrations in
suspended particulate
matter in water samples
collected inside estuaries.
All variables plotted
versus the % of the
watershed area covered
by forests. Columns data
for each row variable,
stratified into salinity
groups (<5, 5–25, and
>25&) to show down-
estuary transitions.
Fate of Particulates in Panamanian Estuaries 103
in SPM converged toward lower values character-
istic of the most deforested watersheds.
C/N values within SPM were relatively
unchanging in these estuaries, remaining near
about 10 throughout the salinity gradient to sea. A
ratio of 10 is fairly N-rich, compared to the 17 most
suitable to support heterotrophic animal activity
(Valiela 1995, p. 208) so that, whatever the
amount of SPM exported from the estuaries, these
exports were likely to subsidize consumers in
receiving coastal food webs. The range of C/N val-
ues we recorded in Panama SPM are within those
reported for inside and emerging from other trop-
ical estuaries [3.3–22, Robertson and others (1993);
7.3–9.3, Gonneea and others (2004); 13–14.2,
Prasad and Ramanathan (2009)]
Mineral Content of SPM
SPM emerging from deforested watersheds held
much larger fractions of mineral matter than SPM
from forested watersheds. To assess mineral con-
tent of SPM, we used our measurements of the %
carbon data of SPM, assumed that, on average,
carbon made up 45% of organic matter, and cal-
culated the % organic content for each sample of
SPM, and then, by difference, obtained the %
mineral content as the remainder of SPM weights.
Seventy to 99% of SPM was mineral matter, with
the lower values only found in fresh reaches of
streams receiving inputs from well-forested water-
sheds (Figure 3; Table 2, note 12-fold difference in
intercepts with zero salinity).
Mineral content of SPM increased during down-
estuary transit, from 70 to 98% in fresh reaches, to
94–98% at intermediate salinities, to 98–99%
mineral content at full salinity (Figure 3). This
trend may be the joint effect of degradation of labile
organic matter derived from forested watersheds
plus entrainment of sediment during transit down-
estuary.
Chlorophyll in SPM
Chlorophyll concentrations were low in the fresher
reaches of the estuaries, most likely because
groundwater seeping into streams obviously lacks
chlorophyll, and these fast-flowing streams allowed
too short a time for much cell division (Figure 3
bottom row of panels). Concentrations increased
somewhat down-estuary, with an indication that
there was more growth of cells within water col-
umns of estuaries with less-forested watersheds
(Figure 3, note significant slopes in saltier reaches
of the estuaries). This response may be a result of
greater light availability in streams where the
riparian forest canopy is less dense. The response
does not seem related to nutrient supply, because
in waters with salinity greater than 5, available N/P
in water varied, but averaged around 16:1, the
critical Redfield ratio (Valiela and others 2013).
Deegan and others (2011) argued that light may
play a similar role affecting algal nitrogen uptake
and use in Amazonian streams surrounded by
pasture dominated vegetation. An additional fea-
ture to note in the Panama data was the contrast in
mean chlorophyll concentrations emerging into
coastal waters from the estuaries with different
forest cover on contributing watersheds (Table 3):
larger amounts of chlorophyll were associated with
passage through estuaries with more deforested
watersheds (Table 3). The concentrations of chlo-
rophyll emerging from the mouth of the estuaries
(in water with higher salinity) were modest (Fig-
ure 3 bottom row), but similar to the lower range
that others found elsewhere in the tropics (Rob-
ertson and others 1993; Bouillon and others 2007;
Ralison and others 2008). Nevertheless, the exports
of chlorophyll constituted a significant addition of
cells to the receiving coastal water column, because
concentrations of chlorophyll leaving the estuaries
were higher than chlorophyll concentrations
measured in surface water 1–6 km off estuary
mouths (Table 3). Robertson and others (1993)
found similar contrasts, with 0.3–5.1 lg chloro-
phyll l-1 measured within estuaries, and only 0.3–
0.7 lg chlorophyll l-1 outside estuaries. Deforested
watersheds therefore made greater contributions of
chlorophyll-bearing cells that could then either
grow or were consumed in near-shore food webs.
Deforestation increased land-to-sea connectivity
and subsidies furnished by terrestrial to marine
ecosystems.
To approximate the contribution of chlorophyll
to total SPM mass, we used a mean ratio of cell
weight to chlorophyll of 70 (calculated from data in
MacIntyre and others 2002; Li and others 2010; Xiu
and Chai 2012; Wang and others 2013; Harrison
and others 1997). The calculated mass of phyto-
plankton ranged 0.07–0.56 mg chlorophyll l-1,
expressed as % of SPM mass (which we estimated
as 1–30% organic matter, estimated from %C/0.45,
Figure 3). The contribution of chlorophyll was
therefore quite small compared to the mass of SPM
(0.7–40 mg SPM l-1, from Figure 2). Chlorophyll
therefore ranges between 0.014 and 0.1% of the
SPM. The minor contribution of chlorophyll to
tropical estuarine SPM was also found by Robert-
son and others (1993), Machas and Santos (1999),
and Bouillon and others (2007) (Table 4).
104 I. Valiela and others
Terrestrial and Estuarine Influences onStable Isotope Values of SPM
Isotopic Comparisons Within Panama Estuaries
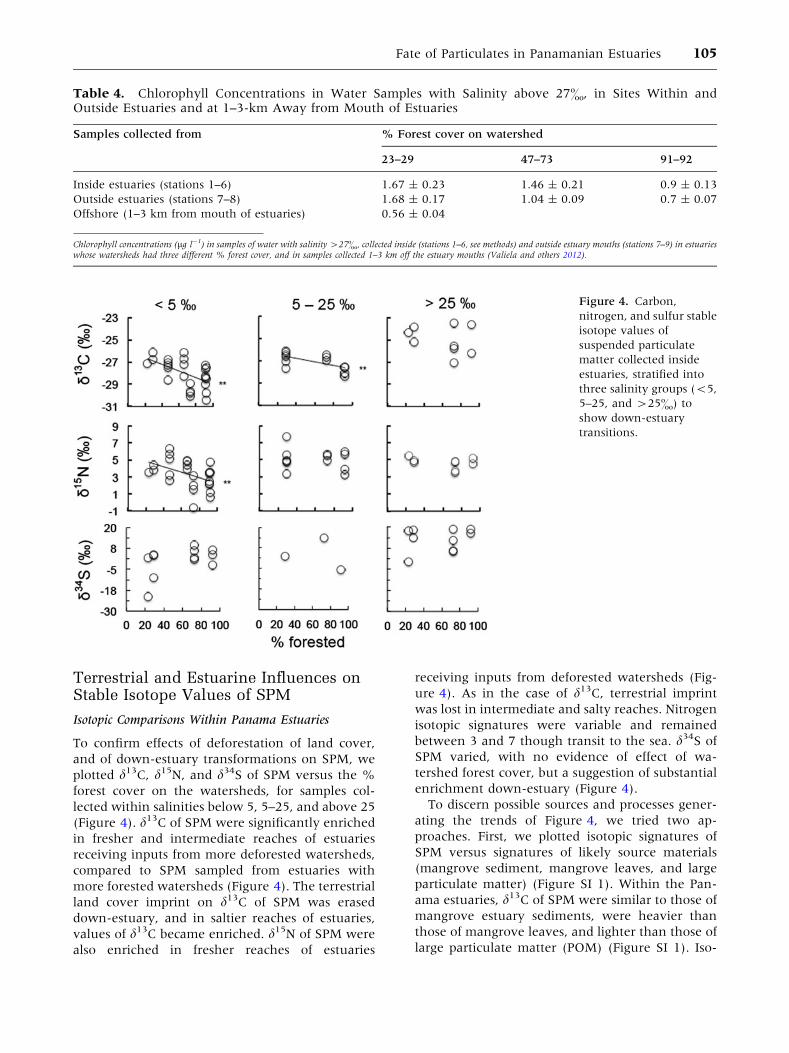
To confirm effects of deforestation of land cover,
and of down-estuary transformations on SPM, we
plotted d13C, d15N, and d34S of SPM versus the %
forest cover on the watersheds, for samples col-
lected within salinities below 5, 5–25, and above 25
(Figure 4). d13C of SPM were significantly enriched
in fresher and intermediate reaches of estuaries
receiving inputs from more deforested watersheds,
compared to SPM sampled from estuaries with
more forested watersheds (Figure 4). The terrestrial
land cover imprint on d13C of SPM was erased
down-estuary, and in saltier reaches of estuaries,
values of d13C became enriched. d15N of SPM were
also enriched in fresher reaches of estuaries
receiving inputs from deforested watersheds (Fig-
ure 4). As in the case of d13C, terrestrial imprint
was lost in intermediate and salty reaches. Nitrogen
isotopic signatures were variable and remained
between 3 and 7 though transit to the sea. d34S of
SPM varied, with no evidence of effect of wa-
tershed forest cover, but a suggestion of substantial
enrichment down-estuary (Figure 4).
To discern possible sources and processes gener-
ating the trends of Figure 4, we tried two ap-
proaches. First, we plotted isotopic signatures of
SPM versus signatures of likely source materials
(mangrove sediment, mangrove leaves, and large
particulate matter) (Figure SI 1). Within the Pan-
ama estuaries, d13C of SPM were similar to those of
mangrove estuary sediments, were heavier than
those of mangrove leaves, and lighter than those of
large particulate matter (POM) (Figure SI 1). Iso-
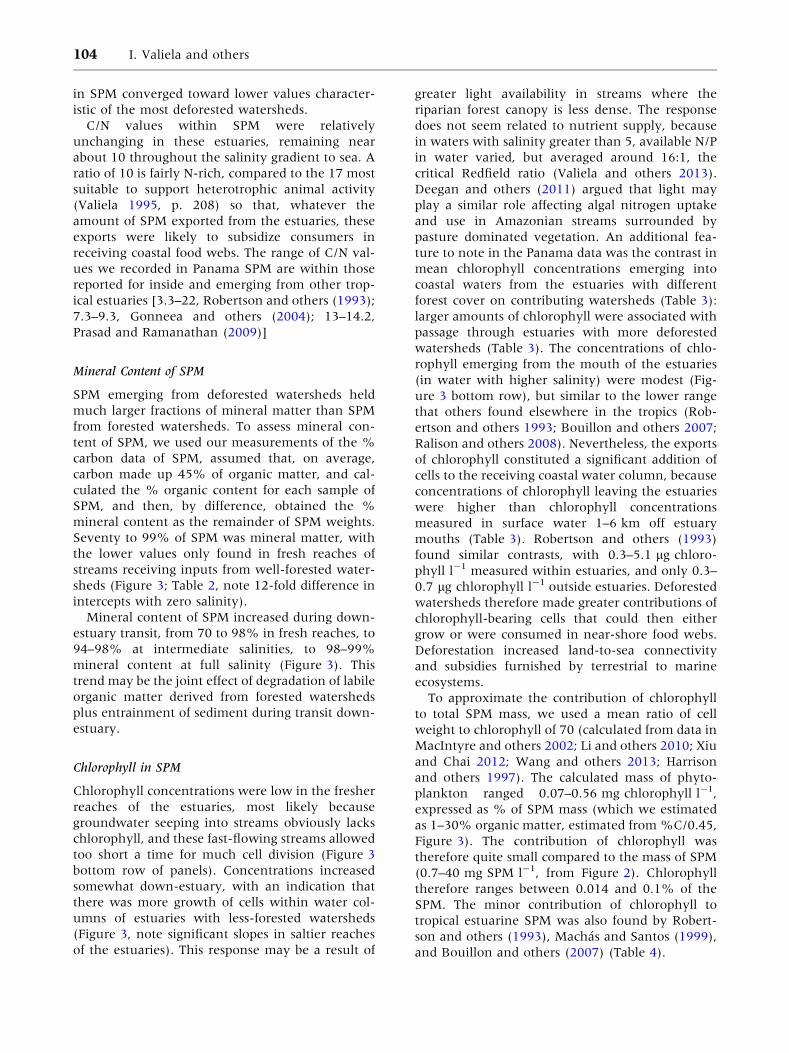
Table 4. Chlorophyll Concentrations in Water Samples with Salinity above 27&, in Sites Within andOutside Estuaries and at 1–3-km Away from Mouth of Estuaries
Samples collected from % Forest cover on watershed
23–29 47–73 91–92
Inside estuaries (stations 1–6) 1.67 ± 0.23 1.46 ± 0.21 0.9 ± 0.13
Outside estuaries (stations 7–8) 1.68 ± 0.17 1.04 ± 0.09 0.7 ± 0.07
Offshore (1–3 km from mouth of estuaries) 0.56 ± 0.04
Chlorophyll concentrations (lg l-1) in samples of water with salinity >27&, collected inside (stations 1–6, see methods) and outside estuary mouths (stations 7–9) in estuarieswhose watersheds had three different % forest cover, and in samples collected 1–3 km off the estuary mouths (Valiela and others 2012).
Figure 4. Carbon,
nitrogen, and sulfur stable
isotope values of
suspended particulate
matter collected inside
estuaries, stratified into
three salinity groups (<5,
5–25, and >25&) to
show down-estuary
transitions.
Fate of Particulates in Panamanian Estuaries 105

topic C signatures of SPM therefore could readily
have originated from erosion of sediments [which
may make up 70–100% of SPM (Figure 3)], plus a
mix of leaf and other plant fragments [leaves tend
to have lighter carbon signatures than woody parts
(Martinelli and others 1998; Ometto and others
2006; Nardoto and others 2008)]. d15N of SPM
were heavier than those of sediment and man-
groves, and generally lighter than those of POM
(Figure SI). These results imply that SPM contained
nitrogen remaining after some microbial reworking
had preferentially removed the lighter isotope of N
during transit in the water column.
Second, to make more evident the spatial distri-
bution of the potential sources of SPM, and its fate
during transit through and out of estuaries, we
plotted the stable isotopic signatures of C, N, and S
in SPM versus salinity, and added, for comparison,
the ranges in isotopic values, culled from the lit-
erature and our own data, for a variety of potential
sources (Figure 5). This depiction shows changes
during down-estuary trajectories, compares the
effects of deforestation, and shows possible links of
signatures in SPM to potential sources.
Judging from d13C values, the SPM that entered
the fresh reaches of the streams were a mix of
Figure 5. Carbon, nitrogen, and sulfur stable isotope
values of suspended particulate matter (samples from
all stations), plotted versus salinity to reveal the down-
and outside-estuary spatial gradients. The shaded bars
show the ranges of values for different potential sour-
ces of the SPM; degree of shading indicates likely po-
sition of source contribution along the gradient from
fresh to coastal waters. The ranges of isotopic values for
the various sources obtained from our own and pub-
lished data: for tropical tree leaves: Cordell and Sandquist
2008, Courty and others 2011, Domingues and others
2007, Jennerjahn and others 2004, Martinelli and
others 1998, Martinelli and others 1999, Muzuka 1999,
Nardoto and others 2008, Norstrom and others 2012,
Ometto and others 2006, Pessenda and others 2004,
Peterson and Howarth 1987, Szpak and others 2013,
Tamooh and others 2012; for tropical soils: Bouillon and
others 2007, Desjardins and others 2006, Gao and oth-
ers 2012, Nardoto and others 2008, Ometto and others
2006, Alkhatib and others 2007, Alongi and others
1989, Bouillon and others 2002, Bouillon and oth-
ers 2008, Gonneea and others 2004, Loneragan and
others 1997, Okada and Sadaki 1998, Prasad and
Ramanathan 2009, Ralison and others 2008, Tue and
others 2012, Wooller and others 2004; for mangrove
sediments: Alkhatib and others 2007, Alongi and others
1989, Alongi and others 2004, Bouillon and oth-
ers 2002, Bouillon and others 2007, Canfield and oth-
ers 1998, Gao and others 2012, Jennerjahn and
Ittekkot 2002, Jennerjahn and others 2004, Ku and
others 1999, Loneragan and others 1997, Norstrom
and others 2012, Pereira and others 2010, Pessenda and
others 2004, Pessenda and others 2012 (only recent
samples), Prasad and Ramanathan 2009, Ralison and
others 2008, Ranjan and others 2011, Tamooh and
others 2012, Tue and others 2012a; for coastal SPM:
Alkhatib and others 2007, Bouillon and others 2002,
Bouillon and others 2007, Bouillon and others 2008,
Bouillon and others 2007a, Cifuentes and others 1996,
Dunn and others 2008, Gonneea and others 2004,
Jennerjahn and others 2004, Kitheka and others 2005,
Loneragan and others 1997, Martinelli and others
1999, Martinelli and others 2012, Maya and others
2011, Miranda and others 2009, Prasad and Ramana-
than 2009, Ralison and others 2008, Robertson and
others 1993, Tamooh and others 2012, Tue and others
2012a; for coastal sediments: Alkhatib and others 2007,
Alongi and others 1989, Barros and others 2010,
Baumgart and others 2010, Bouillon and others 2002,
Boning and others 2004, Bruchert and Pratt 1999,
Canfield and others 1998, Dunn and others 2008, Gao
and others 2012, Harji and others 2010, Jennerjahn
and Ittekkot 2002, Jennerjahn and others 2004,
Mazumdar and others 2012, Miranda and others 2009,
Muzuka 1999, Norstrom and others 2012, Pereira and
others 2010, Peterson and Howarth 1987, Prasad and
Ramanathan 2009, Ralison and others 2008, Robinson
and others 2012, Sampaio and others 2010, Strauss and
others 2012, Tamooh and others 2012, Tue and others
2012a, Wijsman and others 2001, Zhu and others 2013.
b
106 I. Valiela and others

material derived from terrestrial vegetation and
soils. d13C values of SPM, regardless of the degree
of forest cover on the corresponding watersheds,
resembled signatures characteristic of tropical trees
and tropical soils. We could have expected some
influence of C4 grasses growing on the pastures,
but such sources were not in evidence in SPM
collected at the fresh reaches of the estuaries (Fig-
ure 5). Even in watersheds with only 23% forest
cover, the effect of the C4 grasses did not dominate,
a result also found by Deegan and others (2011).
Whatever trend to heavier carbon isotope signa-
tures may be present, we could not attribute the
shift entirely to C4 grasses, as there were algae and
C3 aquatic plants present in the fresh reaches that
might have contributed carbon.
Figure 5 includes tropical soil data from sites
supporting largely C3 vegetation, even though
vegetative covers in certain of our watersheds likely
held an undetermined portion of C4 plants. Pasture
and forest soils are isotopically distinguishable
within certain specific inland sites (Bernoux and
others 1998; Yonekura and others 2012), but the
sorting out of C3 and C4 carbon in watersheds with
wet tropical soils is complicated by a number of
issues (Powers and Veldcamp (2005). Soils mostly
developed under long-term forest cover, carbon
added by forest and grassland sources decay and
survive at different rates, and tropical pastures of-
ten are a combination of C4 and C3 grasses. In
addition, in many tropical pastures there are often
remnant C3 trees left within or near pastures.
Moreover, there is often a riparian edge in many
tropical streams, populated with C3 plants, where
interception of particulate materials from pastures
inland might take place. Because of these compli-
cations, it is not surprising to not find a clear-cut C4
imprint in our isotopic data for particulate materials
entering fresh reaches of estuaries, and so we did
not include data from C4 pasture soils in Figure 5.
The link of stream SPM and tropical trees was
rapidly lost as salinity increased (Figure 5 top). The
erasure of the terrestrial imprint seemed likely to be
a result of the order-of-magnitude increase in total
SPM as salinities increased, visible in Figure 2,
where the added material, contributed by a mix of
mangrove sediment and mangrove biomass, over-
whelmed the terrestrial signatures. The dominance
of mangrove material extended through the salin-
ity gradient. At higher salinities near the mouth of
the estuaries and beyond, d13C of SPM became
further enriched (and resembled what the litera-
ture reports as coastal SPM in many coastal sys-
tems). Finally, the d13C of some of the SPM in the
saltiest part of the gradient matched the d13C
reported for coastal sediments. The pattern therefore
seems to be that terrestrial inputs to upper reaches of
streams were distinctive in the relatively clear wa-
ters of fresh reaches, but were overwhelmed by
larger amounts of particles derived from the man-
grove estuary as water became saltier. Once SPM left
the estuaries, additional enrichment took place, and
carbon signatures of SPM then shifted to levels near
those of coastal surface sediments.
The pattern for d15N of SPM seemed similar to
that of d13C, but somewhat more variable and less
marked (Figure 5 middle panel). There were a
number of relatively low values of d15N in SPM
released into fresh reaches, which suggests the
influence of nitrogen fixation (by symbiosis in le-
gumes, orchids, bromeliads, cyanobacteria on tree
leaves, and free-living bacteria). There were no
other evident effects of degree of deforestation on
isotopic signatures of SPM. In studies in much
deeper coastal environments, Robinson and others
(2012) reviewed the complex possibilities that
sharply alter d15N of nitrogen within sediments,
once SPM was deposited. There may be no such
processes operating in the shallow systems we
sampled, because the range of d15N of SPM we
measured overlap comfortably with reported val-
ues for coastal surface sediments. This lack of fur-
ther fractionation merits further study.
The emergent pattern revealed by the carbon and
nitrogen isotopic data is that the down-estuary
gradients in SPM indeed revealed land-sea linkages
in this Panamanian coastal zone. SPM signatures
made evident the effects of terrestrial and mid-
estuary mangrove sources, of active transformation
within the estuaries, and, showed that after transit
and export, the isotopic signatures of SPM that
managed to be exported from estuaries resembled
those characteristic of coastal surface sediments. So
far, therefore, the isotopic data demonstrated that
SPM transport links land, estuary, and coastal
sediments, but do not unambiguously tell us the
direction of fluxes: the d13C gradient, for example,
could have merely resulted from a passive mixing
of terrestrial and marine sources.
The down-estuary pattern of the d34S signatures
(Figure 5 bottom) significantly adds to our inter-
pretation of the fate of land- and mangrove-derived
SPM. In fresh reaches, d34S of SPM resembled those
of terrestrial trees. As water became saltier, the
isotopic signatures of SPM spanned a rather vari-
able mix that might have been from mangrove
leaves or sediments. The resulting exported SPM,
however, converged on higher values (around
15&), quite similar to values reported for SPM
from a variety of coastal environments (Figure 5
Fate of Particulates in Panamanian Estuaries 107

bottom). This resemblance points to some com-
mon, likely terrestrial-estuarine, sources for SPM
found in many coastal sites.
The novel aspect that the sulfur isotope data add
is that the exported SPM was, however, notably
enriched compared to signatures characteristic of
coastal surface sediments (by about 10&, a signif-
icant contrast, Figure 5 bottom). The major point
here is that sulfur signatures of SPM measured in
our samples, and in those from many other tropical
coastal waters, differ from those characteristic of
coastal sediments (Figure 5). Coastal sea floor sul-
fur signatures are usually dominated by reduced
sulfide (FeS, FeS2, or elemental S). This contrast
points out that the likely direction of transport, in
these Panamanian ecosystems, and probably others
elsewhere, is likely to be from land and estuarine
toward the coastal seas. If we were, instead, dealing
with a passive mixing of estuarine and coastal
sediments, we might not find what we found: a
large gap in isotopic values between SPM that just
emerged from estuaries, and isotopic values on
surface sediments under near-shore waters. The
estuarine SPM thus seem most likely to flux out of
the estuaries, and sink to the coastal sea floor (re-
call SPM data collected outside estuaries in Figure 2
right). These results suggest that it is the land, and
more so, the mangrove estuaries, that export par-
ticulate materials to coastal waters. The direction of
the ecosystem-level couplings of watershed-man-
grove-coastal waters by suspended particulate
matter is asymmetrical, with terrestrial and man-
grove exports dominating over marine sources.
The results we report on exports confirm the sig-
nificant exports from estuarine and wetland eco-
systems to coastal waters, reported for tropical
(Jennerjahn and Ittekkot 2002; Dittmar and others
2006) as well as temperate systems (Valiela and Teal
1979). These papers used a variety of data to make
such inferences. In the data of Figure 5 we show a
first demonstration of the detailed trajectory of
materials that show the mechanisms involved
through the couplings of land, estuary and sea, and
confirm the suspected exports toward marine eco-
systems. Many references conclude that there are
significant exports of terrestrial material to coastal
waters. Some ambitious efforts are cast at rather
large spatial scales, even global estimates (Milliman
and others 2008; Mayorga and others 2010). These
large-scale efforts focus on mass river transport, and
elide over details such as the effects of watershed
land covers, or the relative inputs via groundwater
versus surface runoff, details that might be impor-
tant to understand mechanisms that govern land–
sea coupling in adjoined watershed–mangrove
estuary–coastal water ecosystems. For example, in
an earlier paper (Valiela and others 2013) we
showed that exports of dissolved inorganic nitrogen
from the estuaries studied here differed significantly
depending on the land cover on the contributing
watersheds. As it turns out, from the results of the
present paper, particulate matter exports seem, in
contrast, less affected by watershed land covers, at
least in the Panama systems. Such contrasts might be
important in assessing large-scale budgets.
In more general terms, there is no doubt that
mangrove estuaries play a significant function in
such land-sea couplings. First, results from this
paper and Valiela and others (2013), and those ci-
ted elsewhere (Kristensen and others 2008; Bre-
ithaupt and others 2012, among others) make the
point that there is rather substantial transforma-
tions, interception, and sequestering of watershed-
derived dissolved and particulate materials within
mangrove estuaries. Second, our results, and those
of others (Jennerjahn and Ittekkot 2002; Dittmar
and others 2006) also suggest that, in spite of the
within-mangrove estuary retention and intercep-
tion, there are exports of particulate matter from
the coupled watershed-mangrove ecosystems to
adjoined coastal waters, exports that compared to
the depauperate condition of the receiving tropical
waters are likely to be biologically meaningful. The
joint, countering effects of within-estuary inter-
ception and the significant export, means that the
biogeochemical functioning of these coastal wet-
land systems is even more quantitatively important
than we might have known by just considering
exports. Losses of mangrove estuaries, among the
largest affecting any environment (Valiela and
others 2001) might result in large—and, depending
on the trajectories of land cover on the watersheds
and rainfall regimes, unpredictable—shifts in
sequestration and transfer of land-derived exports
to receiving coastal waters throughout the tropics.
REFERENCES
Alkhatib M, Jennerjahn TC, Samiaji J. 2007. Biogeochemistry of
the Dumai River estuary, Sumatra, Indonesia, a tropical black-
water river. Limnol Oceanogr 52:2410–17.
Alongi DM, Boto KG, Tirendi F. 1989. Effect of exported man-
grove litter on bacterial productivity and dissolved organic
carbon fluxes in adjacent tropical nearshore sediments. Mar-
ine Ecol Prog Ser 56:133–44.
Alongi DM, Sasekumar A, Chong VC, Pfitzner J, Trott LA,
Tirendi F, Dixon P, Brunskill GJ. 2004. Sediment accumula-
tion and organic material flux in a managed mangrove eco-
system: estimates of land—ocean—atmosphere exchange in
peninsular Malaysia. Marine Geol 208:383–402.
108 I. Valiela and others
Bahn M, Reichstein M, Davidson EA et al. 2010. Soil respiration
at mean annual temperature predicts annual total across
vegetation types and biomes. Biogeosciences 7:2147–57.
Barros GV, Martinelli LA, Oliveria Novais TM, Ometto JPHB,
Zuppi GM. 2010. Stable isotopes of bulk organic matter to
trace carbon and nitrogen dynamics in an estuarine ecosystem
in Babitonga Bay (Santa Catarina, Brazil). Sci Total Environ
408:2226–32.
Baumgart A, Jennerjahn T, Mohtadi M, Hebbeln D. 2010. Dis-
tribution and burial of organic carbon in sediments from the
Indian Ocean upwelling region off Java and Sumatra, Indo-
nesia. Deep-Sea Res I 57:458–67.
Bernoux M, Cerri CC, Neill C, de Moraes JFL. 1998. The use of
stable carbon isotopes for estimating soil organic matter
turnover rates. Geoderma 82:43–58.
Boning P, Brumsack HJ, Bottcher ME, Schnetger B, Kriete C,
Kallmeyer J, BorchersSL.2004. Geochemistry of Peruvian near-
surface sediments. Geochim Cosmochim Acta 68:4429–51.
Bosch JM, Hewlett JD. 1982. A review of catchment experi-
ments to determine the effects of vegetation changes on water
yield and evapotranspiration. J Hydrol 55:3–23.
Bouillon S, Raman AV, Dauby P, Dehairs F. 2002. Carbon and
nitrogen stable isotope ratios of subtidal benthic invertebrates
in an estuarine mangrove ecosystem (Andhra Pradesh, India).
Estuar Coast Shelf Sci 54:901–13.
Bouillon S, Dehairs F, Velimirov B, Abril G, Borges AV. 2007a.
Dynamics of organic and inorganic carbon across contiguous
mangrove and seagrass systems (Gazi Bay, Kenya). J Geophys
Res 112:G02018. doi:10.1029/2006JG000325.
Bouillon S, Middelburg JJ, Deharis F, Borges AV, Abril G, Flindt
MR, Ulomi S, Kristensen E. 2007b. Importance of intertidal
sediment processes and porewater exchange on the water
column biogeochemistry in a pristine mangrove creek (Ras
Dege, Tanzania). Biogeosciences 4:311–22.
Bouillon S, Connolly RM, Lee SY. 2008. Organic matter ex-
change and cycling in mangrove ecosystems: recent insights
from stable isotope studies. J Sea Res 59:44–58.
Breithaupt JL, Smoak JM, Smith TJ, Sanders CJ Hoare A. 2012.
Organic carbon burial rates in mangrove sediments:
strengthening the global budget. Glob Biogeochem Cycles 26:
GB3011. doi:10.1029/2012GB004375.
Bruchert V, Pratt LM. 1999. Stable sulfur isotopic evidence for
historical changes of sulfur cycling in estuarine sediments
from Northern Florida. Aquat Geochem 5:249–68.
Bruijnzeel LA. 2004. Hydrological functions of tropical forests:
not seeing the soil for the trees? Agric Ecosyst Environ
104:185–228.
Canfield DE, Boudreau BP, Mucci A, Gundersen JK. 1998. The
early diagenetic formation of organic sulfur in the sediments
of Mangrove Lake, Bermuda. Geochim Cosmochim Acta
62:767–81.
Cifuentes LA, Coffin RB, Solorzano L, Cardenas W, Espinoza J,
Twilley RR. 1996. Isotopic and elemental variations of carbon
and nitrogen in a mangrove estuary. Estuar Coast Shelf Sci
43:781–800.
Cleveland CC, Townsend AR, Schimel DS et al. 1999. Global
patterns of terrestrial biological nitrogen (N2) fixation in nat-
ural systems. Glob Biogeochem Cycles 13:623–45.
Cordell S, Sandquist DR. 2008. The impact of an invasive African
bunchgrass (Pennisetum setaceum) on water availability and
productivity of canopy trees within a tropical dry forest in
Hawaii. Funct Ecol 22:1008–17.
Courty PE, Walder F, Boller T, Ineichen K, Wiemken A, Rous-
teau A, Selosse MA. 2011. Carbon and nitrogen metabolism in
mycorrhizal networks and mycoheterotrophic plants of trop-
ical forest: a stable isotope analysis. Plant Physiol 156:952–61.
Davin EL, Noblet-Ducoudre N. 2010. Climatic impact of global-
scale deforestation: radiative versus non-radiative processes. J
Climatol 23:97–112.
Deegan LA, Neill C, Haupert CL, Ballester MVR, Krusche AV,
Victoria RL, Thomas SM, de Moor E. 2011. Amazon defores-
tation alters small stream structure, nitrogen biogeochemistry
and connectivity to larger rivers. Biogeochemistry 105:53–74.
Desjardins T, Folgarait PJ, Pando-Bahuon A, Girardin C, Lavelle
P. 2006. Soil organic matter dynamics along a rice chronose-
quence in north-eastern Argentina: evidence from natural 13C
abundance and particle size fractionation. Soil Biol Biogeo-
chem 38:2753–61.
Dittmar T, Hertkorn N, Kattner G, Lara RJ. 2006. Mangroves a
major source of dissolved organic carbon to the oceans. Glob
Biogeochem Cycles 20:GB1012. doi:10.1029/2005GB002570.
Domingues TF, Martinelli LA, Ehleringer JR. 2007. Ecophysio-
logical traits of plant functional groups in forest and pasture
ecosystems from eastern Amazonia, Brazil. Plant Ecol
193:101–12.
Downing JA, McClain M, Twilley R et al. 1999. The impact of
accelerating land-use change on the N-cycle of tropical
aquatic ecosystems: current conditions and projected changes.
Biogeochemistry 46:109–48.
Dunn RJK, Welsh DT, Teasdale PR, Lee SY, Lemckert CJ,
Meziane T. 2008. Investigating the distribution and sources of
organic matter in surface sediment of Coombabah Lake
(Australia) using elemental, isotopic and fatty acid biomark-
ers. Cont Shelf Res 28:2535–49.
Gao X, Yang Y, Wang C. 2012. Geochemistry of organic carbon
and nitrogen in surface sediments of coastal Bohai Bay in-
ferred from their ratios and stable isotopic signatures. Mar
Pollut Bull 64:1148–55.
Gash JHC, Nobre CA, Roberts JM et al. 1996. Amazonian
deforestation and climate. Chichester, UK: Wiley.
Gonneea ME, Paytan A, Herrera-Silveira JA. 2004. Tracing or-
ganic mater sources and carbon burial in mangrove sediments
over the past 160 years. Estuar Coast Shelf Sci 61:211–27.
Harji RR, Bhosle NB, Garg A, Sawant SS, Venkat K. 2010.
Sources of organic matter and microbial community structure
in the sediments of the Visakhapatnam harbor, east coast of
India. Chem Geol 276:309–17.
Harrison PJ, Khan N, Yin K, Saleem M, Bano N, Nisa M, Ahmed
SI, Rizvi N, Azam F. 1997. Nutrient and phytoplankton
dynamics in two mangrove tidal creeks of the Indus River
delta, Pakistan. Mar Ecol Progr Ser 157:13–19.
Houser JN, Mulholland PJ, Maloney KO. 2006. Upland distur-
bance affects headwater stream nutrients and suspended
sediments during baseflow and stormflow. J Environ Qual
35:352–65.
IPCC. 2007. Climate Change 2007: Mitigation. Contribution of
working group III to the fourth report of the intergovern-
mental panel on climate change. Cambridge University Press,
Cambridge, UK.
Jennerjahn TC, Ittekkot V. 2002. Relevance of mangroves for
the production and deposition of organic matter along tropical
continental margins. Naturwissenschaften 89:23–30.
Jennerjahn TC, Ittekkot V, Klopper S, Adi S, Nugroho SP, Sudiana
N, Yusmal A, Prihartanto , Gaye-Haake B. 2004. Biogeochem-
Fate of Particulates in Panamanian Estuaries 109
istry of a tropical river affected by human activities in its
catchment: Brantas River estuary and coastal waters of Madura
Strait, Java. Indonesia. Estuar Coast Shelf Sci 60:503–14.
Kitheka JU, Obiero M, Nthenge P. 2005. River discharge sedi-
ment transport and exchange in the Tana Estuary, Kenya.
Estuar Coast Shelf Sci 63:455–68.
Kristensen E, Bouillon S, Dittmar T, Marchand C. 2008. Organic
carbon dynamics in mangrove ecosystems: a review. Aquat
Bot 89:201–19.
Ku TCW, Walter LM, Coleman ML, Blake RE, Martini AM. 1999.
Coupling between sulfur recycling and syndepositional car-
bonate dissolution: evidence from oxygen and sulfur isotope
composition of pore water sulfate, South Florida Platform,
USA. Geochim Cosmochim Acta 63:2529–46.
Lewis WM. 2002. Yield of nitrogen from minimally disturbed
watersheds of the United States. Biogeochemistry 57–58:375–
85.
Lewis WM, Melack JM, McDowell WH et al. 1999. Nitrogen
yields from undisturbed watersheds in the Americas. Bio-
geochemistry 46:149–62.
Li KY, Coe MT, Ramankutty N et al. 2007. Modeling the
hydrological impact of land-use change in West Africa. J
Hydrol 337:258–68.
Li QP, Franks PJS, Landry MR, Goericke R, Taylor AG. 2010.
Modeling phytoplankton growth rates and chlorophyll to
carbon ratios in California coastal and pelagic ecosystems. J
Geophys Res. doi:10.1029/2009JG001111.
Loneragan NR, Bunn SE, Kellaway DM. 1997. Are mangroves
and seagrasses sources of organic carbon for penaeid prawns
in a tropical Australian estuary? A multiple stable-isotope
study. Mar Biol 130:289–300.
Machas R, Santos R. 1999. Sources of organic matter in Ria
Formosa revealed by stable isotope analysis. Acta Oecol
20:463–9.
MacIntyre HL, Kana TM, Anning T, Geider RJ. 2002. Photo-
acclimation of photosynthesis irradiance response curves and
photosynthetic pigments in microalgae and cyanobacteria. J
Phycol 38:17–38.
Marechal JC, Varma MRR, Riotte J et al. 2009. Indirect and
direct recharges in a tropical forested watershed: Mule Hole,
India. J Hydrol 364:272–84.
Martinelli LA, Almeida S, Brown IF, Moreira MZ, Victoria RL,
Sternberg LSL, Ferreira CAC, Thomas WW. 1998. Stable car-
bon isotope ratio of three leaves, boles and fine litter in a
tropical forest in Rondonia, Brazil. Oecologia 114:170–9.
Martinelli LA, Piccolo MC, Townsend AR, Vitousek PM, Cuevas
E et al. 1999. Nitrogen stable isotopic composition of leaves
and soil: tropical versus temperate forests. Biogeochemistry
46:45–65.
Martinelli LA, Ballester MV, Krusche AV, Victoria RL, de Cam-
argo PB, Bernardes M, Ometto JPHB. 2012. Landcover
changes and d13C composition of riverine particulate organic
matter in the Piracicaba river basion (Southeast Region of
Brazil). Limnol Oceanogr 44:1826–33.
Maya MV, Soares MA, Agnihotri R, Pratihary AK, Karapurkar S,
Naik H, Naqvi SWA. 2011. Variations in some environmental
characteristics including C and N stable isotopic composition
of suspended organic matter in the Mandovi estuary. Environ
Monit Assess 175:501–17.
Mayorga E, Seitzinger SP, Harrison JA, Dumont E, Beusen
AHW, Bouwman AF, Fekete BM, Kroeze C, van Drecht G.
2010. Global nutrient export from watersheds 2 (NEWS 2):
model development and implementation. Environ Model
Software 25:837–53.
Mazumdar A, Peketi A, Joao H, Dewangan P, Borole DV,
Kocherla M. 2012. Sulfidization in a shallow coastal deposi-
tional setting: diagenetic and paleoclimatic implications.
Chem Geol 322–323:68–78.
Middelburg JJ, Herman PJM. 2007. Organic matter processing in
tidal estuaries. Mar Chem 106:127–47.
Milliman JD, Farnsworth KL, Jones PD, Xu KH, Smith LC. 2008.
Climatic and anthropogenic factors affecting river discharge to
the global ocean, 1951–2000. Glob Planet Chang 62:187–94.
Miranda MCDC, Rossetti DDF, Pessenda LCR. 2009. Quaternary
paleoenvironments and relative sea-level changes in Marajo
Island (Northern Brazil): facies d13C, d15N and C/N. Palaeo-
geogr Palaeoclimatol Palaeoecol 282:19–31.
Muzuka AN. 1999. Isotopic compositions of tropical East African
flora and their potential as source indicators of organic matter
in coastal marine sediments. J Afr Earth Sci 28:757–66.
Nardoto GB, Ometto JPHB, Ehleringer JR, Higuchi N, da Cunha
Bustamante MM, Martinelli LA. 2008. Understanding the
influences of spatial patterns of N availability within the
Brazilian Amazon forest. Ecosystems 11:1234–46.
Neill C, Deegan LA, Thomas SM et al. 2001. Deforestation for
pasture alters nitrogen and phosphorus in small Amazonian
streams. Ecol Appl 11:1817–28.
Norstrom E, Risberg J, Grondahl H, Holmgren K, Snowball I,
Mugabe JA, Sitoe SR. 2012. Coastal paleo-environment and
sea-level change at Macassa Bay, southern Mozambique,
since c 6600 cal BP. Quat Int 260:153–63.
Nosetto MD, Jobbagy EG, Paruelo JM. 2005. Land-use change
and water losses: the case of grassland afforestation across a
soil textural gradient in central Argentina. Glob Chang Biol
11:1101–17.
Okada N, Sadaki A. 1998. Sulfur isotopic composition of man-
groves. Isot Environ Health Stud 34:61–5.
Ometto JPHB, Ehleringer JR, Domingues TF, Berry JA, Ishida
FY, Mazzi E, Higuchi N, Flanagan LB, Nardoto GB, Martinelli
LA. 2006. The stable carbon and nitrogen isotopic composition
of vegetation in tropical forest of the Amazon basin. Biogeo-
chemistry 79:251–74.
Pereira AA, van Hattum B, de Boer J, van Bodegom PM, Rez-
ende CE, Salomons W. 2010. Trace elements and carbon and
nitrogen stable isotopes in organisms from a tropical coastal
lagoon. Arch Environ Contam Toxicol 59:464–77.
Pessenda LCR, AdS Ribeiro, Gouveia SEM, Aravena R, Boulet R,
Bendassolli JA. 2004. Vegetation dynamics during the late
Pleistocene in the Barreirinhas region, Maranhao State,
northeastern Brazil, based on carbon isotopes in soil organic
matter. Quat Res 62:183–93.
Pessenda LCR, Vidotto E, De Oliveria PE, Busco AA Jr, Cohen
MCL, Fatima Rossetti D, Ricardi-Branco F, Bendassolli JA.
2012. Late quaternary vegetation and coastal environmental
changes at Ilha do Cardoso mangrove, southeastern Brazil.
Palaeogeogr Palaeoclimatol Palaeoecol 363–364:57–68.
Peterson BJ, Howarth RW. 1987. Sulfur, carbon, and nitrogen iso-
topes used to trace organic matter flow in the salt-marsh estuaries
of Sapelo Island, Georgia. Limnol Oceanogr 32:1195–213.
Powers JS, Veldcamp E. 2005. Regional variation in soil carbon
and d13C in forests and pastures of northeastern Costa Rica.
Biogeochemistry 72:315–36.
Prasad MBK, Ramanathan AL. 2009. Organic matter character-
ization in a tropical estuarine-mangrove ecosystem of India:
110 I. Valiela and others
preliminary assessment by using stable isotopes and lignin
phenols. Estuar Coast Shelf Sci 84:617–24.
Ralison OH, Borges AV, Dehairs F, Middelburg JJ, Bouillon S.
2008. Carbon biogeochemistry of the Betsiboka estuary
(north-western Madagascar). Org Geochem 39:1649–58.
Ranjan RK, Routh J, Ramanathan AL, Val Klump JV. 2011.
Elemental and stable isotope records of organic matter input
and its fate in the Pichavaram mangrove-estuarine sediments
(Tamil Nadu, India). Mar Chem 126:163–72.
Rivera-Monroy VH, Day JW, Twilley RR, Vera-Herrera F,
Coronado-Molina C. 1995. Flux of nitrogen and sediment in a
fringe mangrove forest in Terminos Lagoon, Mexico. Estuar
Coast Shelf Sci 40:139–60.
Robertson AI, Daniel PA, Dixon P, Alongi DM. 1993. Pelagic
biological processes along a salinity gradient in the Fly delta
and adjacent river plume (Papua New Guinea). Cont Shelf Res
13:205–24.
Robinson RS, Kienast M, Albuquerque AL, Altabet M, Contreras S,
De Pol Holz R, Dubois N, Francois R, Galbraith E, Hsu TC, Iva-
nochko T, Jaccard S, Kao SJ, Kiefer T, Kienast S, Lehmann M,
Martinez P, McCarthy M, Mobius J, Pedersen T, Quan TM,
Ryabenko E, Schmittner A, Schneider R, Schneider-Mor A, Shi-
gemitsu M, Sinclair D, Somes C, Studer A, Thunell R, Yang JY.
2012.Areviewofnitrogen isotopicalteration inmarine sediments.
Paleoceanography 27:PA4203. doi:10.1029/2012PA002321.
Sampaio L, Freitas R, Maguas C, Rodrigues A, Quintino V. 2010.
Coastal sediments under the influence of multiple organic
enrichment sources: an evaluation using carbon and nitrogen
stable isotopes. Mar Pollut Bull 60:272–82.
Scanlon BR, Jolly I, Sophocleous M et al. 2007. Global impacts of
conversions from natural to agricultural ecosystems on water
resources: quantity versus quality. Water Resour Res
43:W03437. doi:10.1029/2006WR005486.
Smith J, Burford MA, Revill AT, Haese RR, Fortune J. 2012.
Effects of nutrient loading on biogeochemical processes in
tropical tidal creeks. Biogeochemistry 108:359–80.
Strauss H, Bast R, Cording A, Diekrup D, Fumann A, Garbe-
Schonberg D, Lutter A, Oeser M, Rabe K, Reinke D, Teichert
BMA, Westernstroer U. 2012. Sulphur diagenesis in the sedi-
ments of the Kiel Bight, SW Baltic Sea, as reflected by multiple
stable sulphur isotopes. Isot Environ Health Stud 48:166–79.
Sun G, Zhou G, Zhang Z et al. 2006. Potential water yield reduction
due to forestation across China. J Hydrol 328:548–58.
Szpak P, White CD, Longstaffe FJ, Millaire JF, Sanchez VFV.
2013. Carbon and nitrogen isotopic survey of northern
Peruvian plants: baselines for paleodietary and paleoecological
studies. PLoS ONE 8:e53763.
Tamooh F, Van den Meersche K, Meysman F, Marwick TR,
Borges AV, Merckx R, Dehairs F, Schmidt S, Nyunja J,
Bouillon S. 2012. Distribution and origin of suspended matter
and organic carbon pools in the Tana River Basin, Kenya.
Biogeosciences 9:2905–20.
Tue NT, Hamaoka H, Sogabe A, Quy TD, Nhuan MT, Omori K.
2012a. Food sources of macro-invertebrates in an important
mangrove ecosystem of Vietnam determined by dual stable
isotope signatures. J Sea Res 72:14–21.
Tue NT, Ngoc NT, Quy TD, Hamaoka H, Nhaun MT, Omori K.
2012b. A cross–system analysis of sedimentary organic carbon
in the mangrove ecosystems of Xuan Thuy National Park.
Vietnam J Sea Res 67:69–76.
Valiela I. 1995. Marine ecological processes. 2nd ed. New York:
Springer.
Valiela I, Bowen JL, York JK. 2001. Mangrove forests: one of the
world’s threatened major tropical environments. BioScience
51:807-15.
Valiela I, Teal JM. 1979. The nutrient budget of a salt marsh
ecosystem. Nature 280:652–6.
Valiela I, Camilli L, Stone T, Giblin A, Crusius J, Fox S, Barth-
Jensen C, Monteiro RO, Tucker J, Martinetto P, Harris C.
2012. Increased rainfall remarkably freshens estuarine and
coastal waters on the Pacific coast of Panama: magnitude and
likely effects on upwelling and nutrient supply. Glob Planet
Chang. doi:10.1016/j.gloplacha.2012.05.006.
Valiela I, Barth-Jensen C, Stone T, Crusius J, Fox S, Bartholo-
mew M. 2013. Deforestation of watersheds of Panama:
nutrient retention and export to streams. Biogeochemistry.
doi:10.007/s10533-013-9836-2.
Valiela I, Viana IG, Pascual J, Giblin A, Barth-Jensen C, Marti-
netto P, Otter M, Stone T, Tucker J, Bartholomew M. In press.
External and local controls on land-sea controls on land-sea
couplings assessed by stable isotopic signatures of mangrove
producers in estuaries of Pacific Panama. Aquat Bot.
Vorosmarty CJ, Fekete BM, Meybeck M et al. 2000. Global
system of rivers: its role in organizing continental land mass
and defining land-to-ocean linkages. Glob Biogeochem Cycles
14:599–621.
Wang X, Murtugudde R, Hackert E, Maranon E. 2013. Phyto-
plankton carbon and chlorophyll distributions in the equato-
rial Pacific and Atlantic: a basin-scale comparative study. J
Mar Syst 109–110:138–48.
Wassenaer T, Gerber P, Verburg PH et al. 2007. Projecting land
use changes in the Neotropics: the geography of pasture
expansion into forest. Glob Environ Chang 17:86–104.
Wijsman JWM, Middleburg JJ, Herman PMJ, Bottcher ME, Heip
CHR. 2001. Sulfurand iron speciation in surface sediments along
the northwester margin of the Black sea. Mar Chem 74:261–78.
Williams MR, Melack JM. 1997. Solute export from forested and
partially deforested catchments in the central Amazon. Bio-
geochemistry 38:67–102.
Williams MR, Fisher TR, Melack JM. 1997. Chemical composi-
tion and deposition of rain in the central Amazon, Brazil.
Atmosphere Environ 31:207–17.
Wolf S, Eugster W, Potvin C et al. 2011. Carbon sequestration
potential of tropical pasture compared with afforestation in
Panama. Glob Chang Biol 17:2763–80.
Wooller MJ, Behling H, Smallwood BJ, Fogel M. 2004. Man-
grove ecosystem dynamics and elemental cycling at Twin
Cays, Belize, during the Holocene. J Quat Sci 19:703–11.
Xiu P, Chai F. 2012. Spatial and temporal variability in phyto-
plankton carbon, chlorophyll, and nitrogen in the North Pa-
cific. J Geophys Res 117:C11023. doi:10.1029/2012JC008067.
Yonekura Y, Ohta S, Kiyono Y, Aksa D, Morisada K, Tanaka N,
Tayasu I. 2012. Dynamiocs of soil carbon following destruc-
tion of tropical rainforest and the subsequent establishment of
Imperata grassland in Indonesian Borneo using stable carbon
isotopes. Glob Chang Biol 18:2606–16.
Zhang L, Dawes WR, Walker GR. 2001. Response of mean an-
nual evapotranspiration to vegetation changes at catchment
scales. Water Resour Res 37:701–8.
Zhu MX, Shi XN, Yang GP, Hao XC. 2013. Formation and burial
of pyrite and organic sulfur in mud sediments of the East
China Sea inner shelf: constraints from solid-phase sulfur
speciation and stable sulfur isotope. Cont Shelf Res 54:24–36.
Fate of Particulates in Panamanian Estuaries 111