Embed Size (px)
Citation preview

TREATING AND HANDLING MANURE ON DAIRY FARMS TO PROTECT THE ENVIRONMENT
Part 2: Biodrying System
Prepared for
WATERSHED AGRICULTURAL COUNCIL FOR THE NYC WATERSHEDS, INC. Walton, NY
Co-sponsors
THE NEW YORK STATE ENERGY RESEARCH AND DEVELOPMENT AUTHORITY
Albany, NY
Tom Fiesinger, Project Manager
NEW YORK STATE ELECTRIC & GAS, INC. Ithaca, NY
John Zabliski, Manager
Agricultural Sales & Marketing
NATIONAL GRID CORPORATION Syracuse, NY
Edward Neuhauser, Environmental Analyst
CORNELL UNIVERSITY, PRO-DAIRY
Ithaca, NY
Peter Wright, Manure Management Specialist
Prepared by
DLTECH, INC. PO Box 3910
Ithaca, NY 14852
David C. Ludington, Ph.D., Project Coordinator
479-99 9 March, 2006

NOTICE
This report was prepared by DLtech, Inc. and Cornell University in the course of performing work contracted for and sponsored by the New York State Energy Research and Development Authority and by the Watershed Agricultural Council for the NYC Watersheds, Inc., New York State Electric and Gas, Inc., National Grid Corporation., and Cornell University, PRO-DAIRY (hereafter the “Sponsors”). The opinions expressed in this report do not necessarily reflect those of the Sponsors or the State of New York, and reference to any specific product, service, process, or method does not constitute an implied or expressed recommendation or endorsement of it. Further, the Sponsors and the State of New York make no warranties or representations, expressed or implied, as to the fitness for particular purpose or merchantability of any product, apparatus, or service, or the usefulness, completeness, or accuracy of any processes, methods, or other information contained, described, disclosed, or referred to in this report. The Sponsors, the State of New York, and the contractor make no representation that the use of any product, apparatus, process, method, or other information will not infringe privately owned rights and will assume no liability for any loss, injury, or damage resulting from, or occurring in connection with, the use of information contained, described, disclosed, or referred to in this report.

vii
ACKNOWLEDGEMENTS
The following organizations provided funding or in kind contributions to this Project. New York State Energy Research and Development Authority Watershed Agricultural Council for the NYC Watersheds, Inc New York State Electric and Gas, Inc National Grid Corporation Cornell University, PRO-DAIRY The following people are recognized for their assistance in the Project. Farm Cooperators John J. Farber, Farber Farm Owner John Verhoeven, Farber Farm Manager Randy Inman, Mar-bil Farm UAdvisory Committee *Dana Chapman, ACS Project & Construction Mgr 7723 Weedsport-Sennett Rd. Auburn, NY 13021 716-314-5312
*David Ludington, DLtech, Inc. Project Coordinator Box 3910 Ithaca, NY 14852 607-266-6401
*Stan Weeks 4 Ashlor Drive Middle Grove, NY 12850 413-775-1562
*Curt Gooch, Cornell Sr. Ext. Assoc. 334 Riley Robb Hall Cornell University Ithaca, NY 14853 607-255-2088
Ed Neuhauser National Grid 300 Erie Blvd. West Syracuse, NY 13202-4250 315-428-3355
*Peter Wright, Cornell Sr. Ext. Assoc. 328 Riley Robb Hall Cornell University Ithaca, NY 14853 607-255-2803
Tom Fiesinger, NYSERDA Project Manager 17 Columbia Circle Albany, NY 12203-6399 518-862-1090 x3218
Dick Peterson, NATC Box 1002 95 Brown Rd. Ithaca, NY 14852 607-266-9007
John Zabliski, NYSEG Mgr, Ag. Sales & Marketing 79 Clark St. Canandaigua, NY14424 585-771-2660, ext. 2609
*Scott Inglis, Cornell 330 Riley Robb Hall Cornell University Ithaca, NY 14853 607-255-8578
Kim Scamman, WAC Watershed Agricultural Council 33195 State Highway 10 Walton, NY 13856 607-865-7090
* Project Working Group

v
TABLE OF CONTENTS C USection U UPageU
EXECUTIVE SUMMARY.........................................................................................................................S-1 1 BACKGROUND................................................................................................................................... 1-1 2 BIODRYING SYSTEM........................................................................................................................ 2-1
Introduction ............................................................................................................................................. 2-1 Description of Biodrying System ............................................................................................................ 2-2 On-Farm Procedures................................................................................................................................ 2-4
Methods ............................................................................................................................................... 2-4 Results ..................................................................................................................................................... 2-5 Findings................................................................................................................................................. 2-13 Cryptosporidium Data ........................................................................................................................... 2-13 Economic Analysis of Manure Handling and Treatment at the Mar-bil Farm...................................... 2-14 Conclusions ........................................................................................................................................... 2-17 Recommendations ................................................................................................................................. 2-18
APPENDIX A ............................................................................................................................................ A-1 APPENDIX B ............................................................................................................................................ B-1
Excerpts from Inactivation of Ascaris suum in a biodrying compost system......................................... B-1 APPENDIX C ............................................................................................................................................ C-1
Disclaimer .............................................................................................................................................. C-1 Publications ............................................................................................................................................ C-1

vi
TABLE OF FIGURES
UFigure U UPageU
2-1 Successful Composting Run with Good Fan Control and Drying, Bay 1.......................................... 2-7 2-3 Composting Run with Heifer Manure, Resulting in Inadequate Air for Moisture Removal, Bay 5 ................................................................................................ 2-9 2-4 Composting Run with Over Aeration in Cold Weather, Bay 6........................................................ 2-10 2-5 Low Heat Composting Run with Minimum Fan On Time in Cold Weather, Bay 8........................ 2-11 2-6 The Pile Temperature and Percent per Hour the Fan Ran for Bay 1 in Negative Pressure.............. 2-12 2-7 The Pile Temperature and Percent per Hour the Fan Ran for Bay 5 in Negative Pressure.............. 2-12 A-1 Schematic of Biodrying System on a Farm Showing Estimated Daily Amounts ............................ A-1 A-2 Biodrying Building........................................................................................................................... A-2

vii
TABLE OF TABLES
UTableU UPageU
2-1 Manure Analysis Report .................................................................................................................... 2-5 2-2 Operating Parameters for Biodrying Composting Runs .................................................................... 2-6 2-3 Manure Systems Analysis Projections - Mar-bil Farm .................................................................... 2-15 A-1 Manure Systems Analysis Projections, Mar-bil Farm, Original System.......................................... A-3 A-2 Manure Systems Analysis Projections, Mar-bil Farm, Liquid System including Storage without Aeration ................................................................... A-4 A-3 Manure Systems Analysis Projections, Mar-bil Farm, Liquid System including Storage with Aeration................................................................................................ A-5 A-4 Manure Systems Analysis Projections, Mar-bil Farm, Biodrying System, Sell All Compost, Based on Potential Production.................................................................... A-6 A-5 Manure Systems Analysis, Mar-bil Farm, Spread Compost On-Farm, Based on Potential Production ................................................................................................. A-7 A-6 Manure Systems Analysis Projections, Mar-bil Farm, Biodrying System, Sell All Compost, Based on Actual Amount Processed ........................................................... A-8 A-7 Manure Systems Analysis Projections, Mar-bil Farm, Spread Compost On-Farm, Based on Actual Amount Processed......................................................................................... A-9

S-1
EXECUTIVE SUMMARY Part 2: Biodrying System
Dairy farmers are coming under increasing pressure to control the release of contaminants from their
establishments to air and water. Comprehensive Nutrient Management Plans (CNMP) to protect water
quality often prescribed long-term manure storage as the Best Management Practices (BMP).
Unfortunately, objectionable odors were produced during storage and then released to the atmosphere
during mixing of the storage and during spreading. Thus a conflict existed between BMP for water quality
and air contamination by the release of odors. Alternative manure treatment and handling systems were
needed. Two systems were assembled and demonstrated at two dairy farms in the New York City
Watershed. The first system treated the separated liquid in an anaerobic digester while the solids would be
composted and sold. The initial digester used a fixed film and was designated as “ANFF”. This system is
reported on in Final Report, Part I. The second system treated the manure aerobically as a solid. The
system was designated as “biodrying”. This system is reported on in this Final Report, Part 2.
The intent of the biodrying system was to reduce the weight of the manure, control odor and concentrate
the phosphorus making it easier to haul longer distances, out of a watershed if necessary. The system was
designed to use the heat produced during composting, an aerobic biological process, to evaporate water,
thus reducing the weight of the mixture. If managed carefully, the heat generated would provide the
energy to reduce the moisture content (MC) from 88 percent to 40 percent. Forced air composting, under a
roof, with airflow carefully controlled is needed to optimize this process. Composting works best when
initial moisture content is below 70 percent. Initially, recycled compost or a mix of compost and sawdust
or other amendment would be spread in the cow alleys to absorb one days manure production. By-product
sales are the most important factor in reducing the cost of this manure treatment system. Costs of the
system have been estimated to decrease from around $748 per cow-yr at a market price of $5 per cubic
yard (cy) to a profit of $209 per cow-yr if all the manure were composted for nine months of the year and
the product were sold for $30 per cyP
P.
The biodrying system was designed and installed at the Mar-bil Farm in Delaware County. The
composting building was 40 ft wide by 100 ft long. Curtains like those used in freestall barns were
installed on the backside of the barn, and plastic shade cloth was installed on the open end to keep snow
from blowing into the barn. The barn was divided into twelve-8 ft bays, each with three air channels in the
floor and a 2 hp centrifugal blower. The aeration system was controllable by a personal computer with
analog input/output hardware and feedback from thermocouples inserted in the center of the composting
piles.

S-2
The biodrying process would be successful if:
• The cost of operating the system minus the additional benefits including off site sales was found
to be less than the cost of conventional storage and land spreading that would meet the
environmental regulations for the farm.
• The system produced usable solids for recycling into the barn gutters and alleyways
• The system produced compost that could be sold off the farm
• The biodrying produced compost with a moisture content below 40% after composting 21 days
Over the duration of the study the producer utilized the system such that the cost of the biodrying system
was less than that of a conventional liquid storage system, and was comparable to the costs of the existing
daily spreading practice. The production of usable solids for recycling into the barn gutters and alleyways
was not achieved. The production of compost for sale off the farm was achieved, however not at the
projected production rate. The production of biodried material below 40% after 21 days was only achieved
a few times during the project period.
The project confirmed the understanding that successful composting requires that the material, manure and
amendment, have enough pore space for good air movement. Good air movement was found to be difficult
to achieve when compost mixes had moisture contents exceeding 60 percent . To limit restriction of air
flow it was also found important not to pile the compost mixture more than 4 ft deep. During cold weather
and positive pressure air flow, moisture condensed at the surface of the pile causing a wet layer. Reversing
the air flow through the pile (negative pressure) removed moisture from this surface layer and improved air
flow. However this moisture condenses at the junction of the in-floor channels and the vertical pipe from
the air plenum. During construction a low point was inadvertently produced at this junction. This collected
water and restricted water from flowing out of the channel which in-turn restricts air flow. This water can
be removed by returning to a positive pressure air flow. Careful management of the system and good
control of the air handling system is essential.
A test was run using Ascaris sum eggs to test the effectiveness of the biodrying system to reduce
pathogens. Ascaris sum eggs are generally more robust than Crytosporidium parvum Oocysts. Initial
results showed that after 4 days in the compost pile the cysts were no longer viable which led to the
conclusion that most pathogens in the compost were dying.

1-1
SECTION 1
BACKGROUND
Dairy farmers are coming under increasing pressure to control the release of contaminants from their
establishments. Comprehensive Nutrient Management Plans (CNMP) as described by EPA and USDA to
protect water quality will often prescribe long-term manure storage. Unfortunately, stored manure will
produce significant amounts of objectionable odors that will be released when the storage is mixed prior to
spreading and during spreading. Thus a conflict arises between Best Management Practice (storage) to
reduce the potential for water pollution and practices (daily spreading) that would reduce odor
development. There was a need for alternative manure treatment and handling systems that address both
the water quality and quality of life (odor) issues simultaneously. The New York City Watershed wanted to investigate alternative manure treatment and handling systems
that will reduce odors and the population of viable pathogenic organism and develop a product that would
allow exporting nutrients out of a watershed. Two alternative manure treatment and handling system were
assembled and demonstrated. The first system treated the separated liquid in an anaerobic fixed film
digester. The separated solid would be composted or sold directly. This system is designated as “ANFF”. The second system treated the manure as a solid with aerobic biodrying. This system is designated as
“biodrying”.

2-1
SECTION 2
BIODRYING SYSTEM
INTRODUCTION
There is an increased need for manure treatment that concentrates the phosphorous and reduces manure
mass making it easier to haul longer distances. There is increasing pressure to reduce pathogens or
indicator organisms in the sources of drinking water and contact recreational water. Treatment systems
that reduce pathogens will be needed in the future. Using an all solid treatment and storage will reduce the
risk of major losses to the environment during storage and spreading. A method of composting dairy
manure called “biodrying” holds potential for meeting these needs..
Biodrying of dairy manure is the process of drying manure with the heat of aerobic reactions. Biodrying of
the manure using forced air static piles, and recycling dry compost as a litter in the cow alleys has been
proposed (Wright et al., 2002). Odor, volume, weight, and pathogen reduction would occur. Equipment
for solids handling exists on most farms, allowing for adoption by many producers. Composted material
after curing may be marketed as an income source and to move the nutrients off the farm. The
management of the drying process will be critical, and the costs of the operation may be high. Additional
amendment may be required.
Using the heat of composting to evaporate water and dry compost has been practiced in municipal systems
for quite some time (Haug et al., 1998). Biodrying had been shown to work on animal wastes (Jewell et
al., 1984, and Richard and Choi, 1996), but the in-vessel machinery was seen as too expensive and
complex to run on a dairy farm. Recent catastrophic failures of liquid storages, high costs of liquid
handling and the odor problems associated with liquid manure storage started the search for a solid
handling system for dairy manure. Systems that quickly composted and dried the solids under a roof and
without turning made biodrying in a composting shed seem possible. This idea has been reinforced by
studies showing that composting could remove significant moisture when liquid manure was added.
If managed carefully, the heat generated by aerobic composting can provide the energy to reduce 88%
moisture content (MC) raw manure, mixed with an amendment to a mixture MC of 60%, down to a 40%
MC residual. Forced air composting, under a roof, with the airflow carefully controlled can be used to
optimize this process. Composting works best with products with initial moisture content below 70%.
Recent applications of composting operations have shown the feasibility of this process by using forced air
to compost layers of manure 6 ft deep in 21 days. Recycled compost or a mix of compost and sawdust, or

2-2
other amendment, at 40% MC could be spread in the cow alleys about 8 inches thick to absorb one day’s
production of 88% MC manure. Theoretically, the resulting mixture could be scraped into a shed, piled 6
ft deep and aerated to produce 40% MC compost in about three weeks (Wright et al., 2001).
To explore the idea of biodrying on a farm, a biodrying facility on an 85-cow dairy farm in the NYC
watershed was designed and built. This consisted of designing and building a composting shed with a
forced air system. The purpose was to optimize and document the process. Evaluating the on-going
process in varying weather conditions would allow adjustment of the operating procedures to obtain the
best compost, the least amount of amendment, and lowest cost for the farm operation. Documenting the
operating procedures would allow this process to be adopted by many dairy farms. This process would be
successful if
• The cost of operating the system minus the additional benefits including off site sales were less
than the cost of conventional storage and land spreading that would meet the environmental
regulations for the farm.
• The system produced usable solids for recycling into the barn gutters and alleyways
• The system produced compost that could be sold off the farm
• The biodrying produced compost with a moisture content below 40% after composting 21 days
DESCRIPTION OF BIODRYING SYSTEM
The biodrying system was installed at the Mar-bil Farm, owned by Randy and Lynette Inman. The farm
has 85 cows in a tiestall bedded with sawdust and shavings, 100 heifers in straw bedded pack, and 30
calves in a fabric covered calf facility bedded with straw.
This system consisted of a three-sided composting shed with a forced aeration system installed in the floor.
The composting shed was designed large enough to compost manure mix piled 6 ft high for a 21-day
period. Additional storage for the completed compost would be provided on a pad with controls for
rainwater runoff.
A cross sectional view, plan view, and front elevation for the 100 ft x 40 ft biodrying building are shown in
Figure A-2. The building was designed with a high overshot roof peak, open sidewalls, and four-foot
eaves to provide good ventilation while keeping the process protected from precipitation. Plastic shade
cloth was installed on the open ends of the barn to keep snow from blowing into the barn. Conventional
curtains used in freestall dairy barns were installed on the back side of the composting barn. Manure and

2-3
recycled compost can be loaded from either side, although generally a side delivery manure spreader
working from the open side of the barn can build a 6 ft high pile, 8 ft wide and 40 ft long. A backstop was
suspended from tracks on the back wall to stop the manure and amendment mixture from shooting through
the barn as it was placed in the piles. To make piles the same depth across the barn, some of the mixture
was loaded from the backside of the building.
Twelve, 2 hp blowers were installed, one for each composting area or “bay”. Each blower had a rated
capacity of 700 cubic feet per minute (cfm) at 5.5 in of water column (wc). Half of the blowers had
stainless steel housing while the other half were painted steel. The blowers were mounted under the eves
at the plate on the backside of the barn. Channels to deliver air to the piles were 4 in x 4 in and were
formed in the floor 32 in on-center. There are three channels per bay or blower. Each bay is 8 ft wide. The
airflow rate was designed to provide 0.36 cfm of air for each cubic foot of compost. Although the fans are
rated at 700 cfm with 5.5 in wc static pressure, the maximum measured static pressure of the fans was
found to be lower than designed at 3 in wc. This creates doubt that the fans actually created the airflow
needed to properly run the system.
The aeration was designed to dry the compost so that the resulting material could then be mixed with an
amendment, if needed, and remixed with manure. This recycle loop could be continued indefinitely. The
expectation was that one-third of the compost produced each day would not need to be recycled and would
be stock piled for sale or land application on the farm. This process could potentially compost all of the
manure produced with little additional amendment needed.
The control for the aeration system utilized a personal computer with analog input/output hardware. Type
T thermocouples are inserted in the center of the composting pile to get a representative temperature. The
temperatures were inputs for a timing algorithm programmed with LabVIEW™ software. The control
system for the blowers was equipped with variable frequency drives (VFD). The controls were initially set
to run the fans 5 minutes per hour when the temperature of the compost was below 130°F. At temperatures
above 130°F, the fans would run continuously. When the temperature falls below 120°F, the compost
would be aerated for 5 minutes per hour again. After 14 days the fans would run continuously to dry the
compost. Temperature control included a provision to shut off the fans in the drying phase if the
temperature in the compost fell below 40°F.
During the winter, as saturated warm air leaves the compost, some of the moisture would condense and
saturate the compost on the top surface. With VFDs on the fan motors, the rotation of the fans could be
reversed with a signal from the control system in the winter to bring air down through the pile such that

2-4
condensation would occur in the floor channels instead of the top of the pile. A gravity drain was installed
to allow this water to leave while still maintaining the pressure [positive and negative] in the air channels.
ON-FARM PROCEDURES
Each composting pile, 8 ft wide and 40 ft long, was made using fresh manure from either the dairy tiestall
or the heifer bedded pack. No recycled compost was placed in the tiestall barn as first planned. The
manure was mixed primarily with poor quality alfalfa hay. Other materials were used when available.
Between September 2001and July 2003, 400 bales of old hay each weighing 900 lbs were chopped and
utilized as amendment. The employees filled the side delivery manure spreader with half of the manure
produced in the tiestall building then added amendment until the mix was considered dry enough or the
manure spreader was full. All composting runs were actively composted for 21 days in the building. The
amount of time the fans ran was adjusted with ambient temperature and compost temperature. Use of the
system started in early September 2001.
UMethods
Samples for analysis were obtained by taking grab samples at various locations within the pile. These
grab samples were mixed and a sub-sample removed for analysis.
The moisture content of the composting material was determined using a standard procedure developed for
measuring dry matter in forage. Drying was done in a microwave. If the material was in the 50 to 70
percent range a sample was placed in the oven for 4 minutes. (If the sample is drier, then this first drying
time would be reduced.) The sample was weighed and placed in the oven for an additional minute. This
process was repeated using shorter times in the oven until the change in weight was less than 2 grams or
there was charring. If there was charring, the previous weight was used to calculate dry matter. There
were not enough samples analyzed to perform any statistical analysis of the moisture content.
Samples for chemical analysis were sent to UDairy OneU for analysis. [Dairy One Cooperative, Inc., Ithaca,
NY]. The wet basis (as sampled) results from the analysis of one initial mix and one finished compost
composite sample taken on 12/6/2001 are given in Table 2-1. The results show little change in the
components between the two samples, except for an increase in ammonia nitrogen. Additional testing
would be needed to make conclusions about what changes in components would be expected during
successful steady state composting..

2-5
Table 2-1. Manure Analysis Report.
Component Initial Mix Finished compost
Total Nitrogen (N), % 1.01 1.01 Ammonia Nitrogen (NH3-N), %
0.08 0.18
Organic Nitrogen (N), % 0.93 0.82 Phosphorus (P), % 0.18 0.21 Potassium (K), % 1.12 1.19 Total Solids, % 29.9 31.8 Ash, % 5.30 6.74
RESULTS
Over the duration of the project there were 40 runs made in the biodrying facility. This report includes
seven [7] runs that were representative of the 40 runs that were completed. The bays for the other 33 runs
also were loaded with compost mixes with moisture contents between 60 – 65%. These included material
that was a mix of fresh manure from the barn mixed with amendment, and runs that were re-mixed or
fluffed windrows already 21 days old. Data on other runs not graphed in this report are available from
Scott Inglis at Cornell University.
Seven [7] runs made in the biodrying facility during this study are analyzed below. The consistency of the
initial manure and amendment mixture was different for each run. Each run used one bay. Generally, at
any one time, there was more than one bay being utilized. At no time was it possible to develop a
continuous operation where the finished compost (21-day-old) was used as amendment, along with other
amendment when needed, to start a second bay with the nearly the same initial conditions. In other words,
“steady state” was not achieved for any of the runs.
A list of the operating parameters for the seven composting runs is shown in Table 2-2. Five of the runs
were conducted with a positive pressure (air moving up through the pile) and two runs were conducted
with negative pressure (air moving down through the pile).

2-6
Table 2-2. Operating Parameters for Biodrying Composting Runs.
Figure 2-1 shows temperature and fan operation for a pile that was composed of fresh manure from the
dairy barn, chopped alfalfa hay, unfinished composted manure and moldy corn silage. The pile was 4 ft
deep. The mixture had an initial moisture content of 60% and a final moisture content of 30%. The
performance of this pile was exactly what was anticipated. In hindsight the warm fall temperatures and
low humidity for this time period may have contributed to the drying and excellent performance of this
composting pile. The 4 ft depth allowed the pile to reach a temperature 132 °F and the fan control system
maintained the temperatures in the pile for 8 days.
Figure No.
Mixture Initial Moisture Content
Depth ft
Final Moisture Content
Pressure Date
2-1 Fresh Manure – dairy barn Chopped alfalfa hay Unfinished compost Moldy corn silage
60 4 30
Positive 9/11/01 –
9/27/01
2-2 Fresh manure – dairy barn Chopped moldy alfalfa hay Unfinished compost
65 6 60 Positive 11/8/01 –
11/29/01 2-3 Heifer manure from bedded
pack, Unfinished compost, Alfalfa hay
60 6 58 Positive 11/14/01 –
11/29/01 2-4 Fresh manure – dairy barn
Alfalfa hay Composted dairy manure
65 6 60 Positive 12/6/01 –
1/3/02 2-5 Fresh manure – dairy barn
Alfalfa hay Unfinished compost
6 Positive 12/22/01 –
1/3/02 2-6 Fresh manure – low quality
chopped Alfalfa hay Unfinished compost
60 50 Negative 11/26/02 –
12/7/02 2-7 Fresh manure – low quality
chopped Alfalfa hay Unfinished compost
65 59 Negative 12/5/02 –
12/26/02

2-7
Drying removed moisture from the top few inches of the pile so no wet layer was present at the finish of
the pile. The fans ran at full speed [90% = full speed] for nearly 3 days before the pile temperature reached
70°F. The corn silage amendment may have given the pile more energy and porosity so airflow was
maintained throughout the entire pile. Of the seven runs described in this repot, this was the most
successful run achieved with the composting process in this system.
The results shown in Figure 2-2 came from a pile constructed of chopped moldy alfalfa hay, unfinished
compost manure and fresh dairy manure. The pile documented in Figure 2-2 was 6 ft deep. Within 24
hours the pile settled to a depth of 4 ft decreasing the porosity Additional material was added increasing the
depth of the pile from 4 ft to 6 ft. This caused further compaction. The initial moisture content of this pile
was 65% and ending moisture content had decreased to only 60%. The airflow in the pile became
preferential and some areas of the pile did not get ample airflow. A 3 in layer of wet compost formed at
the top of the pile where moisture, leaving the lower portions of the pile, condensed. This resulted in low
moisture loss from the pile. The airflow to the pile did not affect the temperature of the pile and did not
reduce the moisture of the pile as expected. Manometer readings indicated a pressure of 3 in wc at the air
inlet to air channel. This is less than the 5 in wc of static pressure the system was designed for indicating
that there was sufficient air flow through the pile and the average porosity was good. Initially the fans
came on as the temperature exceeded 130P
oPF. Continuous blower operation did not significantly reduce the
temperature. At the end of the 14-day period there was about 1 day where the fans held the temperature at
130 P
oPF. After 14 days the program controls the fans to run continuously but yet the pile was not cool below
about 120 P
oPF.
0
20
40
60
80
100
120
140
09/10/01 09/15/01 09/20/01 09/25/01 09/30/01Date
Tem
p (F
)
0
20
40
60
80
100
% F
an o
n ea
ch h
our
Pile Temp Outside Temp % Fan on
Figure 2-1. Successful Composting Run with Good Fan Control and Drying, Bay 1.

2-8
A pile was produced using heifer manure from a bedded pack mixed with unfinished composted dairy
manure and some alfalfa hay. The initial mixture piled in the compost barn had a 60% MC, and compost
removed after 21 days at 58% moisture. The conditions during composting are shown in Figure 2-3. The
initial and final manometer readings on this pile were 2 in wc. The pile was 6 ft deep. The manure from
the bedded pack was already partially decomposed. The manure and hay from the bedded pack was
initially 60% moisture, so little amendment was added. This material was not well mixed as the mixture
left the side delivery manure spreader. Large clumps of heavily compacted manure from the bedded pack
went into the pile. These pieces helped maintain the structure of the pile for ample airflow. However,
these pieces did not compost thus reducing the energy available to heat the pile. This combined with lower
ambient temperatures limited the fan operation. This lack of heat production and air movement limited the
evaporation of moisture from the pile to only a 2% reduction in moisture content.
020406080
100120140160180
11/05/01 11/10/01 11/15/01 11/20/01 11/25/01 11/30/01 12/05/01
Date
Tem
p (F
)
0102030405060708090100
% F
an o
n ea
ch h
our
Pile Temp Outside Temp % Fan on
Figure 2-2. Unsuccessful Composting Run with Inadequate Air Delivery, Bay 1.

2-9
Figure 2-4 shows the results from a test on a pile constructed with alfalfa hay, composted dairy manure and
fresh dairy manure. Initial moisture content was 65%, and the ending moisture content was 60%.
Manometer readings for this pile were initially 1.5" wc and ended at 3" wc of static pressure. This pile was
6 ft deep. The cold outdoor temperatures and snow drifting into the building over the composting piles
may have contributed to the failure to achieve satisfactory moisture content. Missing data is due to a loss
of the computer control system. The computer was repaired and returned to service on December 21,
2001. This pile heated well initially. The cold ambient temperatures and over aeration of the pile cooled
the pile quickly in the first few days. When the fans were turned off, the pile regained temperature within a
few days. On an intermittent schedule of 5 minutes on and 55 minutes off, the pile slowly lost heat without
losing moisture. This pile developed a 3 in wet layer on the top of the pile where moisture condensed
before the air left the pile. This layer may have held other water in the pile in the later stages of
composting. After January 1, 2002 a fault in the variable frequency drive kept the fan off for the last few
days of composting. During this time the pile temperature gained about 8 degrees before the fan started
and the pile was cooled to 60 P
oPF.
020406080
100120140160
11/1
3
11/1
5
11/1
7
11/1
9
11/2
1
11/2
3
11/2
5
11/2
7
11/2
9
12/1
Date, 2001
Tem
p (F
)
0102030405060708090100
% F
an o
n ea
ch h
our
Pile Temp Outside Temp % Fan on
Figure 2-3. Composting Run with Heifer Manure, Resulting in Inadequate Air for Moisture Removal, Bay 5.

2-10
-20
0
20
40
60
80
100
120
140
160
12/05/01 12/10/01 12/15/01 12/20/01 12/25/01 12/30/01 01/04/02 01/09/02
Date
Tem
p (F
)
0
10
20
30
40
50
60
70
80
90
100
% F
an o
n ea
ch h
our
Pile Temp Outside Temp % Fan on
Figure 2-4. Composting Run with Over Aeration in Cold Weather, Bay 6.
Figure 2-5 shows a pile that was 6 ft deep created from alfalfa hay, fresh dairy manure, and unfinished
composted dairy manure. The initial and ending manometer reading was 3" wc static pressure. The cold
ambient temperatures during this run kept the pile at low temperatures throughout the composting process.
At this point the computer program was changed to reduce the minimum time the fans would run to
maintain an aerobic composting process without over cooling the composting pile. The 5 minutes of on
time and 55 minutes of off time did not allow the pile to reach the 140F target temperature. The target
temperature for this run was changed to conserve electricity and to allow for colder ambient air entering the
bottom of the pile. The on time was changed to 1 minute with an off time to 59 minutes. The pile stayed
below 104°F for the duration. All fan-off time was caused by a fault in the variable frequency drive that
went unnoticed.

2-11
Negative pressure trials were run on 6 bays from 11/7 – 11/21/02. These trials produced drier compost
material. The negative pressure mode did require increased management time because the air channels
plugged with condensate every few days. When designed, the slope of the air channels was set to drain
any condensation to an outlet. When the channels were constructed, the connection of the sloped air
channels in the floor and the vertical pipe from the plenum created a choke point in the system, resulting in
a constriction that prevented free drainage and then occasionally blocked the air flow. To remove the plug,
the airflow needed to be reversed for 10 min or more to blow the water away to drain. After the airway has
been cleared, negative airflow could be reestablished. Temperature and percent “on” fan curves below
show the results of the negative pressure usage. Figure 2-6 shows the results from bay 1. The starting
moisture content was 60% and the final M.C. after mixing was 50%. Bay 5, shown in Figure 2-7 started
with a M.C. of 65%. The final M.C. was 59% after mixing. The pile that started at 60% lost enough water
to reduce the M.C. by 10 percent, while for the pile starting at 65% M.C., the reduction was only 6%.
-20
0
20
40
60
80
100
120
12/21/01 12/23/01 12/25/01 12/27/01 12/29/01 12/31/01 01/02/02 01/04/02 01/06/02
Date
Tem
p (F
)
0
10
20
30
40
50
60
70
80
90
100
% F
an o
n ea
ch h
our
Pile Temp Outside Temp % Fan on
Figure 2-5. Low Heat Composting Run with Minimum Fan On-Time in Cold Weather, Bay 8.

2-12
-50
0
50
100
150
200
11/24/02 11/26/02 11/28/02 11/30/02 12/02/02 12/04/02 12/06/02 12/08/02 12/10/02 12/12/02
Date
Tem
p (F
)
0
10
20
30
40
50
60
70
80
90
100
% F
an o
n ea
ch h
our
Pile temp Outside temp % Fan on
Figure 2-6: The Pile Temperature and Percent per Hour the Fan Ran for Bay 1 in Negative Pressure.
-50
0
50
100
150
200
11/30/02 12/05/02 12/10/02 12/15/02 12/20/02 12/25/02 12/30/02
Date
Tem
p (F
)
0
10
20
30
40
50
60
70
80
90
100
% F
an o
n ea
ch h
our
Pile temp Outside temp % Fan on
Figure 2-7: The Pile Temperature and Percent per Hour the Fan Ran for Bay 5 in Negative Pressure.

2-13
FINDINGS
• The fan control system has the potential to maintain pile temperatures by cycling the fans and
to dry the compost after the composting process was finished.
• The moisture of the mixture (fresh manure and amendment) must have a moisture content of
less than 60 percent when piled, in order to have enough void spaces for good air movement.
This will obviously require that more amendment be added which increases the volume of
mixture being composted.
• Piles should not be more than 4 ft deep to avoid compression of the lower layers that will
restrict air flow.
• The amendment must have enough structural strength and size to support the pile to maintain
void space. Piles built with poor quality chopped alfalfa hay and dairy manure settled to
approximately half their original height in the first few days of composting. This complicates
getting good air flow through out the pile.
• Negative pressure aeration was successful in preventing the buildup of condensation in the
top layer of the piles. Better design of the channels would reduce the accumulation of
condensate in the channel and reduce the need to reverse the air flow to blow out the
condensate.
• Rain and snow must be kept from entering the composting barn as this adds more moisture
which must be evaporated. There is limited energy from composting to evaporate water to
say nothing about melting snow.
• The electrical energy used by the blowers in the compost barn averaged about 14 kWh per
ton of compost. This was based 8,932 kWh used in 371 days during which 628 tons (from 30
bays) of compost were produced from 1/15/02 – 1/21/03. The compost averaged 890 ± 120
lbs/cu yd.
CRYPTOSPORIDIUM DATA
To document the system’s ability to reduce pathogens one trial was run from 9/24/02 – 10/15/02 with 130
sentry chambers with Ascaris suun eggs placed at three levels throughout the composting pile. Twelve of
these chambers were removed every 4 days to determine if there were any viable cysts left. Initial results
show that after 4 days in the pile the cysts are no longer viable. The temperature in the pile reached 160 P
oPF.
The Ascaris suun eggs are generally more robust than the Cryptosporidium parvum Oocysts so the
conclusion can be drawn with some confidence that most such pathogens in the mixture/ composts are

2-14
dying. This testing cost $4,500. The final reporting was submitted January 2, 2003 and is available by
request from Scott Inglis at Cornell University. An excerpt from the results and discussion is presented in
Appendix B.
ECONOMIC ANALYSIS OF MANURE HANDLING AND TREATMENT AT THE MAR-BIL
FARM
When this Project was initiated at the Mar-bil Farm, the major concern was the level of nutrient loading of
the farm land, timely spreading of manure, and reducing pathogens and odor. Several systems were
considered. 1) The first included on-farm liquid storage that would permit application of manure to land
when there was the greatest need for nutrients and less danger of runoff. However, this system would
increase the odor problem and would not facilitate the movement of nutrients out of the watershed. 2) The
second system would add aeration to the liquid storage to reduce the odor level and perhaps remove some
nitrogen prior to land application. 3) The third system was the biodrying system that was designed to treat
the manure aerobically in a solid form. This process would greatly reduce the odor, reduce the mass of
material to be handled thus affording the possibility of economically transporting manure (nutrients) out of
the watershed. When applied to the land in a solid state the possibility of runoff would be reduced and
there was the possibility that proper composting would reduce the viable population of pathogens. For the
biodrying alternative two scenarios were evaluated based on different disposition of the compost produced:
3a where all the compost would be sold and 3b where all the compost would be spread on the farm land.
The economic analyses also include the costs of managing the milking center wastes, with different
projections depending on whether the alternatives are liquid or solid based systems.
The projected economic analyses for these five systems, including the original, are presented in Tables A1-
A5 in Appendix A. Tables A4 and A5 show what the biodrying system could do if all the manure
collected from the barn was loaded for a 21 day retention time. Two additional tables, Tables A-6 and A-7
adjust the biodrying cost estimates to account for the project finding that not all the collected dairy manure
was composted in the biodrying process. These two tables show revised estimates based on about 40% of
the collected manure being processed through the biodrying system with the remainder being land applied
as before.
A summary of the findings is presented in Table 2-3. The original system appeared to have an annual cost
of $36,695. The liquid system increased the fixed costs by a factor of 6, added between $22,000 and
$28,000 to the annual costs, and because of farm specific problems, would still not have provided for an
adequate solution

2-15
Table 2-3. Manure Systems Analysis Projections – Mar-bil Farm.
System Description Total Annual Fixed Costs
Annual Manure System Operation Costs
Annual Other Systems Operating Costs
Revenue Generated Due to Manure
Total Annual Operating Costs
Total Net Annual Costs
Original System $6,368 $23,467 $6,860 $0 $30,327 $36,695 Liquid System Including Storage without Aeration $33,665 $19,631 $5,360 $0 $24,991 $58,656 Liquid System Including Storage with Aeration $35,465 $23,931 $5,360 $0 $29,291 $64,756
Biodrying System, Sell All Compost, Based on Potential Production* $25,772 $45,772 $8,360 $97,680 -$43,548
-$17,776
Biodrying System, Spread Compost On-Farm, Based on Potential Production* $25,772 $58,854 $2,360 $0 $61,214 $86,986 Biodrying System, Sell All Compost, Based on Actual Amount Processed** $25,772 $35,215 $7,505 $33,300 $9,420 $35,192 Biodrying System, Spread Compost On-Farm, Based on Actual Amount Processed** $25,772 $40,051 $6,215 $0 $46,266 $72,038 *Biodrying System operated using manure collected for 9 months per year. **Biodrying System processed 40% of manure collected for 9 months per year with the rest spread on-farm.
The biodrying system was the alternative installed at the Mar-bil Farm. Figure A-1 contains a schematic
diagram showing the projected quantities of materials flowing through the biodrying process steps based
on the Mar-bil Farm’s typical operation in which cows are on pasture 3 months per year and manure is
collected and managed for the remaining 9 months. The fixed and operating costs shown in Table 2-3 for
the first two biodrying system alternatives are projected based on how the system would work if all the
manure collected over the 9 months was put through the composting barn. The estimates for the final two
biodrying systems are based on how the composting system was actually used, to compost about 40% of
2-16
the manure collected. . Thus the design and costs for all biodrying systems analyzed are for 9 months, with
the later two adjusted for the reduced composting and more land spreading that actually took place due to
reduced use of the composting system during those 9 months of manure collection.
.In all cases the fixed costs of the biodrying systems was projected to increase by a factor of 4 over the
original system while the operating costs were projected to increase by a factor of 2.5. One reason the
operating costs are high is the purchase cost of big bales of amendment at a price of $22 per bale. If the
farm had run all the manure through the system, 3,256 cy of compost would be produced (88 piles or bays
with 37 cy of compost from each pile).
The sale price for the solids product was set at $30 per cy. For the projection assuming all manure
collected during the 9 months is composted, this revenue offsets the total operating costs and leaves a
projected profit of $17,776. Based on these projections the break-even price for the compost of $25 per cy
would result in a projected zero annual cost for management of the farms collected manure and milk house
waste. Furthermore comparing the projected annual profit of $17,776 to the current annual cost of
$36,695, a total net improvement of $54,000 can be projected. Based on this projected improvement, the
farm would still have a reduced cost of managing manure and milk house waste even if the price it received
for compost were less than $25 per cy.
As the system was actually run by the farm, not all the manure collected over the 9 months was biodried
and the farm produced about1, 110 cy of compost (30 piles or bays with 37 cy of compost from each pile).
At the solids sale price of $30 per cy the revenue generated from the sale of the composted solids reduced
the cost of the system to a level that is comparable to the cost of the original system.. In order to achieve a
projected zero cost for management of the farm’s collected manure and milk house waste, the break even
price for the sale of compost with 30 bays a year would have to be approximately $62 per cy.
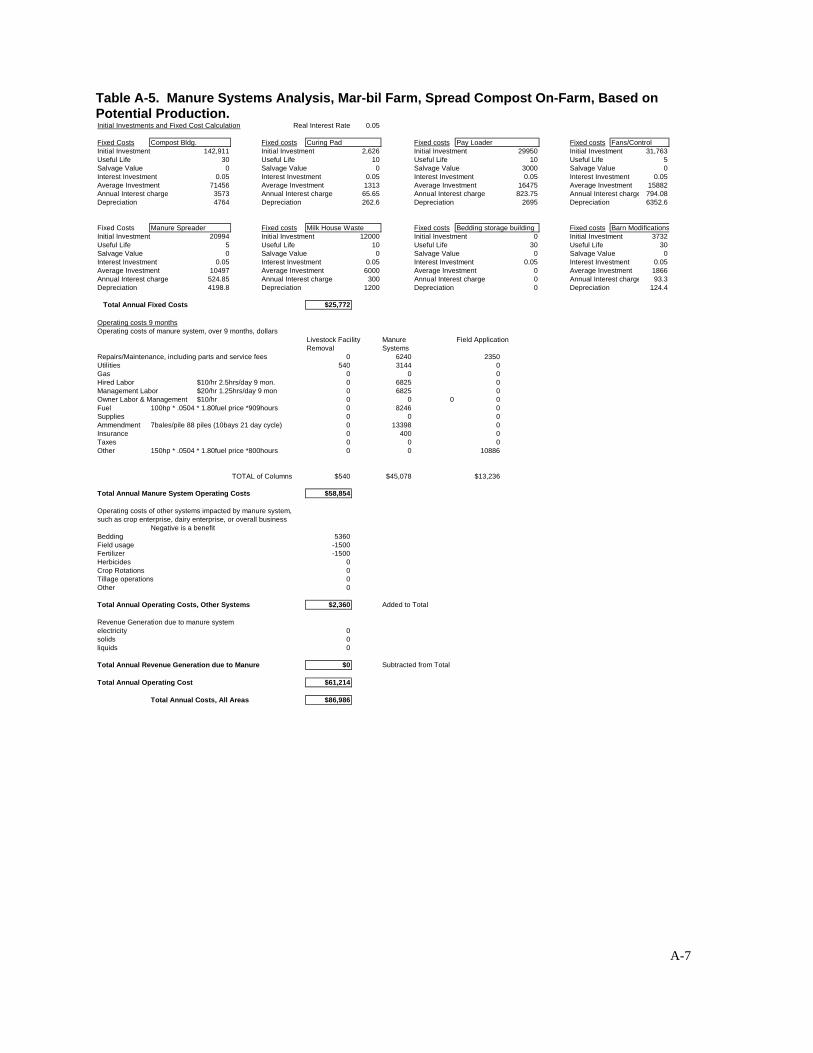
The last scenario studied was the situation where all the solids product of the biodrying facility was spread
on the farm land. This was the most expensive treatment system because there was no revenue except for a
relatively small credit for the fertilizer value of the compost and for the ability to use better fields.
Obviously there is the possibility of selling some of the compost for revenue and land spread the remainder
of the compost.

2-17
CONCLUSIONS
With some modifications in the design of the compost facility and enhancements of the control system, the
biodrying system could be an alternative treatment and handling system for small dairy farms. The system
accomplished all the following goals set forth: odor was controlled so that land application was not limited;
the quality of solids produced made it possible to export nutrients out of the watershed; and the potential
for runoff following land spreading was reduced. Testing also indicated that the composting could reduce
the concentration of viable pathogens.
The economic feasibility of biodrying systems and widespread adoption will require modification of the
system design and operation to produce better moisture removal. Other important requirements include
the availability of low cost amendment and adequate and reliable compost markets. It is likely that the
biodrying system will not be adopted until daily spreading is discouraged and compost marketing is more
feasible.
Modifications to the process include reducing the initial moisture content of the feedstock and lowering the
height of the compost piles from 6ft to 4ft should reduce the density and increase the air flow making
drying more likely. To achieve both of these changes the composting barn would have to be built larger.
To control the moisture content initially better management will be needed to control the mixing of
amendment with the incoming raw manure. These changes would increase both the operating cost of this
system and increase the capital cost of future systems.
Reduced costs of a quality amendment are critical for the success of this system. Purchasing significant
amounts of amendment will increase the cost of the system. Purchasing the amendment with more energy
and more structure may be beneficial. The piles in this study were built primarily from poor quality alfalfa
hay and fresh dairy manure. These piles settled to half their original height in the first few days of
composting making good airflow through the piles difficult. Tree bark and appropriate spoiled silage may
be considered as a bulking agent for the compost to create greater porosity and more energy. Keeping the
amendment dry is also important. This may require an even larger roofed area.
By-product sales are the most important factor in reducing the cost of such manure handling systems.
Marketing the by-products from the manure can help pay for treatment systems. For this 85 cow farm,
costs of the system have been estimated to decrease from around $748 per cow per year with sales at $5 per
cy to a profit of around $209 per cow per year if the compost is sold for $30 per cy. To consistently
achieve this, higher priced roofed storage for the completed compost may be needed as part of the system.
2-18
Meeting environmental concerns with traditional liquid storage will increase costs and create potential odor
problems. While existing manure management costs at different farms range from $50 per cow per year to
$350 and more, the costs for alternative manure handling systems that meet environmental objectives may
increase these cost considerably. The costs for a traditional liquid storage and handling system on the
example farm have been estimated to be $690 per cow per year.
For any proposed alternative manure handling method on farms verification of the actual functioning and
costs of the system is needed.
RECOMMENDATIONS FOR FURTHER WORK
1. Modify the air delivery system to eliminate the restriction. 2. Modify the control system to take advantage of the adjustable frequency drives on the blowers
using better automatic controls with temperature static pressure feedback.
3. Add amendment storage for better control quality.
4. Investigate amendment choppers, mixers and loading equipment.
5. Establish good operating procedures when the weather is favorable in preparation for operating when the weather is less desirable.

A-1
APPENDIX A
Figure A-1. Schematic of Biodrying System on a Farm Showing Estimated Daily Amounts.
Blowers 12 @ 2 hp.
Barns 85 milking cows, tiestall barn
Manure: 15,150 lbs. 269 cu. ft. @ 90% MC
Manure & Amendment: 26,150 lbs.
640 cu. ft. @ 65% MC
Moisture Removed from 65 to 50% MC
Amendment as needed (old hay) Up to 11,000 lbs.
10,560 lbs. 320 cu. ft. @ 50% MC
Composting Barn 21 day retention
100 x 40 ft. @ 4 ft. deep
Outdoor Storage one year
yearly = 3,244 cy or 1,445 tons

A-2
Figure A-2. Biodrying Building.

A-3
Table A-1. Manure Systems Analysis Projections, Mar-bil Farm, Original System. Initial Investments and Fixed Cost Calculation Real Interest Rate 0.05
Fixed Costs V Spreader Fixed costs LoaderInitial Investment 15000 Initial Investment 20,000Useful Life 7 Useful Life 10Salvage Value 0 Salvage Value 2000Interest Investment 0.05 Interest Investment 0.05Average Investment 7500 Average Investment 11000Annual Interest charge 375 Annual Interest charge 550Depreciation 2143 Depreciation 1800
Fixed costs Milk House WasteInitial Investment 12000Useful Life 10Salvage Value 0Interest Investment 0.05Average Investment 6000Annual Interest charge 300Depreciation 1200
Total Annual Fixed Costs $6,368
Annual Operating CostsOperating costs of manure system, over annual period, dollars
Livestock Facility Manure Field ApplicatioRemoval Systems
Repairs/Maintenance, including parts and service fees 0 0 3100Utilities 540 0 0Gas 0 0 0Hired Labor 0 0 0Management Labor $15/hr 462 hrs 0 6390 0Owner Labor & Management 0 0 0Fuel 40hp * .0504 * 1.80fuel price *60hours 0 0 257Supplies 0 0 0Consulting 0 0 0Insurance 0 400 0Taxes 0 0 0Other Tractor Rent, 30 dollars an hour, 426 hrs. 0 0 12780
TOTAL of Columns 540 6790 16137
Total Annual Manure System Operating Costs $23,467
Operating costs of other systems impacted by manure system, such as crop enterprise, dairy enterprise, or overall business
Negative is a benefitBedding 5360Field usage 0Fertilizer 1500Herbicides 0Crop Rotations 0Tillage operations 0Other Improved soils 0
Total Annual Operating Costs, Other Systems $6,860 Added to Total
Revenue Generation due to manure systemelectricity 0solids 0liquids 0related farm products 0
Total Annual Revenue Generation due to Manure $0 Subtracted from Total
Total Annual Operating Costs $30,327
Total Annual Costs, All Areas $36,695

A-4
Table A-2. Manure Systems Analysis Projections, Mar-bil Farm, Liquid System including
Storage without Aeration. Initial Investements and Fixed Cost Calculation Real Interest Rate 0.05
Fixed Costs Slurry Storage Fixed costs Pipes,Valves, Loading Pump Fixed costs Access RoadInitial Investement 168000 Initial Investement 72,000 Initial Investement 12000Useful Life 20 Useful Life 10 Useful Life 20Salvage Value 8400 Salvage Value 0 Salvage Value 0Interest Investement 0.05 Interest Investement 0.05 Interest Investement 0.05Average Investement 88200 Average Investement 36000 Average Investement 6000Annual Interest charge 4410 Annual Interest charge 1800 Annual Interest charge 300Depreciation 7980 Depreciation 7200 Depreciation 600
Fixed Costs Truck Mounted Spreader Fixed costs Milk House Waste Fixed costs Box Spreader Initial Investement 70000 Initial Investement 4800 Initial Investement 5000Useful Life 8 Useful Life 10 Useful Life 10Salvage Value 3500 Salvage Value 0 Salvage Value 0Interest Investement 0.05 Interest Investement 0.05 Interest Investement 0.05Average Investement 36750 Average Investement 2400 Average Investement 2500Annual Interest charge 1838 Annual Interest charge 120 Annual Interest charge 125Depreciation 8313 Depreciation 480 Depreciation 500
Total Annual Fixed Costs $33,665
Annual Operating CostsOperating costs of manure system, over annual period, dollars
Livestock Facility Manure Field ApplicationRemoval Systems
Repairs/Maintenance, including parts and service fees 0 1800 3500Utilities 540 0 0Gas 0 0 0Hired Labor 0 0 0Management Labor $20/hr 312 hrs 0 6240 0Owner Labor & Management 0 0 0Fuel 250hp * .0504 * 1.80fuel price *228hours 0 0 5171Supplies 0 0 0Consulting 0 0 0Insurance 0 400 0Taxes 0 0 0Other Tractor Rent, 30 / hr. (includes all cots), 66 hrs. 0 0 1980
TOTAL of Columns $540 $8,440 $10,651
Total Annual Manure System Operating Costs $19,631
Operating costs of other systems impacted by manure system, such as crop enterprise, dairy enterprise, or overall business Negative is a benefitBedding 5360Field usage 0Fertilizer 0Herbicides 0Crop Rotations 0Tillage operations 0Other Improved soils 0
Total Annual Operating Costs, Other Systems $5,360 Added to Total
Revenue Generation due to manure systemgas 0electricity 0solids 0liquids 0related farm products 0
Total Annual Revenue Generation due to Manure $0 Subtracted from Total
Total Annual Operating Cost $24,991
Total Annual Costs, All Areas $58,656

A-5
Table A-3. Manure Systems Analysis Projections, Mar-bil Farm, Liquid System including Storage with Aeration. Initial Investments and Fixed Cost Calculation Real Interest Rate 0.05
Fixed Costs Slurry Storage Fixed costs Pipes,Valves, Loading Pump Fixed costs Access RoadInitial Investement 168000 Initial Investement 72,000 Initial Investement 12000Useful Life 20 Useful Life 10 Useful Life 20Salvage Value 8400 Salvage Value 0 Salvage Value 0Interest Investement 0.05 Interest Investement 0.05 Interest Investement 0.05Average Investement 88200 Average Investement 36000 Average Investement 6000Annual Interest charge 4410 Annual Interest charge 1800 Annual Interest charge 300Depreciation 7980 Depreciation 7200 Depreciation 600
Fixed Costs Truck Mounted Spreader Fixed costs Milk House Waste Fixed costs Box Spreader Initial Investement 70000 Initial Investement 4800 Initial Investement 5000Useful Life 8 Useful Life 10 Useful Life 10Salvage Value 3500 Salvage Value 0 Salvage Value 0Interest Investement 0.05 Interest Investement 0.05 Interest Investement 0.05Average Investement 36750 Average Investement 2400 Average Investement 2500Annual Interest charge 1838 Annual Interest charge 120 Annual Interest charge 125Depreciation 8313 Depreciation 480 Depreciation 500
Fixed Costs AeratorInitial Investement 8000Useful Life 5Salvage Value 0Interest Investement 0.05Average Investement 4000Annual Interest charge 200Depreciation 1600
Total Annual Fixed Costs $35,465
Annual Operating CostsOperating costs of manure system, over annual period, dollars
Livestock Facility Manure Field ApplicationRemoval Systems
Repairs/Maintenance, including parts and service fees 0 2600 3500Utilities 540 3500 0Gas 0 0 0Hired Labor 0 0 0Management Labor $20/hr 312 hrs 0 6240 0Owner Labor & Management 0 0 0Fuel 250hp * .0504 * 1.80fuel price *228hours 0 0 5171Supplies 0 0 0Consulting 0 0 0Insurance 0 400 0Taxes 0 0 0Other Tractor Rent, 30 dollars an hour, 49 hours + 17 hrs. 0 0 1980
TOTAL of Columns $540 $12,740 $10,651
Total Annual Manure System Operating Costs $23,931
Operating costs of other systems impacted by manure system, such as crop enterprise, dairy enterprise, or overall business Negative is a benefitBedding 5360Feed usage 0Fertilizer 0Herbicides 0Crop Rotations 0Tillage operations 0Other Improved soils 0
Total Annual Operating Costs, Other Systems $5,360
Revenue Generation due to manure systemgas 0electricity 0solids 0liquids 0related farm products 0
Total Annual Revenue Generation due to Manure $0 Subtracted from Total
Total Annual Operating Cost $29,291
Total Annual Costs, All Areas $64,756

A-6
Table A-4. Manure Systems Analysis Projections, Mar-bil Farm, Biodrying System, Sell All Compost, Based on Potential Production. Initial Investments and Fixed Cost Calculation Real Interest Rate 0.05
Fixed Costs Compost Bldg. Fixed costs Curing Pad Fixed costs Pay loader Fixed costs Controls/FansInitial Investment 142911 Initial Investment 2,626 Initial Investment 29950 Initial Investment 31763Useful Life 30 Useful Life 10 Useful Life 10 Useful Life 5Salvage Value 0 Salvage Value 0 Salvage Value 3000 Salvage Value 0Interest Investment 0.05 Interest Investment 0.05 Interest Investment 0.05 Interest Investment 0.05Average Investment 71456 Average Investment 1313 Average Investment 16475 Average Investment 15881.5Annual Interest charge 3573 Annual Interest charge 65.65 Annual Interest charge 823.75 Annual Interest charge 794.075Depreciation 4764 Depreciation 262.6 Depreciation 2695 Depreciation 6352.6
Fixed Costs Manure Spreader Fixed costs Milk House Waste Fixed costs bedding storage building Fixed costs barn modificationsInitial Investment 20994 Initial Investment 12000 Initial Investment 0 Initial Investment 3732Useful Life 5 Useful Life 10 Useful Life 10 Useful Life 30Salvage Value 0 Salvage Value 0 Salvage Value 0 Salvage Value 0Interest Investment 0.05 Interest Investment 0.05 Interest Investment 0.05 Interest Investment 0.05Average Investment 10497 Average Investment 6000 Average Investment 0 Average Investment 1866Annual Interest charge 524.85 Annual Interest charge 300 Annual Interest charge 0.0 Annual Interest charge 93.3Depreciation 4198.8 Depreciation 1200 Depreciation 0 Depreciation 124.4
Total Annual Fixed Costs $25,772
Operating Costs, 9 monthsOperating costs of manure system, over 9 month period, dollars
Livestock Facility Manure Field ApplicationRemoval Systems
Repairs/Maintenance, including parts and service fees 0 6240 0Utilities 540 3144 0Gas 0 0 0Hired Labor $10/hr 2.5hrs/day 9 mon. 0 6825 0Management Labor $20/hr 1.25hrs/day 9 mon 0 6825 0Owner Labor & Management 0 0 0Fuel 100hp * .0504 * 1.80fuel price *909hours 0 8246 0Supplies 0 0 0Ammendment 7bales/pile 88 piles (10bays 21 day cycle) 0 13552 0Insurance 0 400 0Taxes 0 0 0Other 0 0 0
TOTAL of Columns $540 $45,232 $0
Total Annual Manure System Operating Costs $45,772
Operating costs of other systems impacted by manure system, such as crop enterprise, dairy enterprise, or overall business
Negative is a benefitBedding 5360Field usage 0Fertilizer 3000Herbicides 0Crop Rotations 0Tillage operations 0Other
Total Annual Operating Costs, Other Systems $8,360 Added to Total
Revenue Generation due to manure system
gas 0electricity 0solids Marketed Compost - $30/yc 88 piles, 37yd/bay 97680liquids 0related farm products 0
Total Annual Revenue Generation due to Manure $97,680 Subtracted from Total
Total Annual Operating Cost -$43,548
Total Annual Costs, All Areas -$17,776
A-7
Table A-5. Manure Systems Analysis, Mar-bil Farm, Spread Compost On-Farm, Based on Potential Production. Initial Investments and Fixed Cost Calculation Real Interest Rate 0.05
Fixed Costs Compost Bldg. Fixed costs Curing Pad Fixed costs Pay Loader Fixed costs Fans/ControlInitial Investment 142,911 Initial Investment 2,626 Initial Investment 29950 Initial Investment 31,763Useful Life 30 Useful Life 10 Useful Life 10 Useful Life 5Salvage Value 0 Salvage Value 0 Salvage Value 3000 Salvage Value 0Interest Investment 0.05 Interest Investment 0.05 Interest Investment 0.05 Interest Investment 0.05Average Investment 71456 Average Investment 1313 Average Investment 16475 Average Investment 15882Annual Interest charge 3573 Annual Interest charge 65.65 Annual Interest charge 823.75 Annual Interest charge 794.08Depreciation 4764 Depreciation 262.6 Depreciation 2695 Depreciation 6352.6
Fixed Costs Manure Spreader Fixed costs Milk House Waste Fixed costs Bedding storage building Fixed costs Barn ModificationsInitial Investment 20994 Initial Investment 12000 Initial Investment 0 Initial Investment 3732Useful Life 5 Useful Life 10 Useful Life 30 Useful Life 30Salvage Value 0 Salvage Value 0 Salvage Value 0 Salvage Value 0Interest Investment 0.05 Interest Investment 0.05 Interest Investment 0.05 Interest Investment 0.05Average Investment 10497 Average Investment 6000 Average Investment 0 Average Investment 1866Annual Interest charge 524.85 Annual Interest charge 300 Annual Interest charge 0 Annual Interest charge 93.3Depreciation 4198.8 Depreciation 1200 Depreciation 0 Depreciation 124.4
Total Annual Fixed Costs $25,772
Operating costs 9 monthsOperating costs of manure system, over 9 months, dollars
Livestock Facility Manure Field ApplicationRemoval Systems
Repairs/Maintenance, including parts and service fees 0 6240 2350Utilities 540 3144 0Gas 0 0 0Hired Labor $10/hr 2.5hrs/day 9 mon. 0 6825 0Management Labor $20/hr 1.25hrs/day 9 mon 0 6825 0Owner Labor & Management $10/hr 0 0 0 0Fuel 100hp * .0504 * 1.80fuel price *909hours 0 8246 0Supplies 0 0 0Ammendment 7bales/pile 88 piles (10bays 21 day cycle) 0 13398 0Insurance 0 400 0Taxes 0 0 0Other 150hp * .0504 * 1.80fuel price *800hours 0 0 10886
TOTAL of Columns $540 $45,078 $13,236
Total Annual Manure System Operating Costs $58,854
Operating costs of other systems impacted by manure system, such as crop enterprise, dairy enterprise, or overall business
Negative is a benefitBedding 5360Field usage -1500Fertilizer -1500Herbicides 0Crop Rotations 0Tillage operations 0Other 0
Total Annual Operating Costs, Other Systems $2,360 Added to Total
Revenue Generation due to manure systemelectricity 0solids 0liquids 0
Total Annual Revenue Generation due to Manure $0 Subtracted from Total
Total Annual Operating Cost $61,214
Total Annual Costs, All Areas $86,986

A-8
Table A-6. Manure Systems Analysis Projections, Mar-bil Farm, Biodrying System, Sell All Compost, Based on Actual Amount Processed. Initial Investments and Fixed Cost Calculation Real Interest Rate 0.05
Fixed Costs Compost Bldg. Fixed costs Curing Pad Fixed costs Pay loader Fixed costs Controls/FansInitial Investment 142911 Initial Investment 2,626 Initial Investment 29950 Initial Investment 31763Useful Life 30 Useful Life 10 Useful Life 10 Useful Life 5Salvage Value 0 Salvage Value 0 Salvage Value 3000 Salvage Value 0Interest Investment 0.05 Interest Investment 0.05 Interest Investment 0.05 Interest Investment 0.05Average Investment 71456 Average Investment 1313 Average Investment 16475 Average Investment 15882Annual Interest charge 3573 Annual Interest charge 66 Annual Interest charge 824 Annual Interest charge 794Depreciation 4764 Depreciation 263 Depreciation 2695 Depreciation 6353
Fixed Costs Manure Spreader Fixed costs Milk House Waste Fixed costs bedding storage building Fixed costs barn modificationsInitial Investment 20994 Initial Investment 12000 Initial Investment 0 Initial Investment 3732Useful Life 5 Useful Life 10 Useful Life 10 Useful Life 30Salvage Value 0 Salvage Value 0 Salvage Value 0 Salvage Value 0Interest Investment 0.05 Interest Investment 0.05 Interest Investment 0.05 Interest Investment 0.05Average Investment 10497 Average Investment 6000 Average Investment 0 Average Investment 1866Annual Interest charge 525 Annual Interest charge 300 Annual Interest charge 0 Annual Interest charge 93Depreciation 4199 Depreciation 1200 Depreciation 0 Depreciation 124
Total Annual Fixed Costs $25,772
Operating Costs, 9 monthsOperating costs of manure system, over 9 month period, dollars
Livestock Facility Manure Field ApplicationRemoval Systems
Repairs/Maintenance, including parts and service fees 0 6240 1209Utilities 540 1071 0Gas 0 0 0Hired Labor 2hr/day $10/hr 9months 0 5475 0Management Labor 1hr/day $20/hr 9 months 0 5475 0Owner Labor & Management 0 0 0Fuel 100hp * .0504 * 1.80fuel price *303hours 0 3000 0Supplies 0 0 0Ammendment 7bales/pile 30 piles $22/bale 0 4620 0Insurance 0 400 0Taxes 0 0 0Other 150hp * .0504 * 1.80fuel price*528hours 0 0 7185
TOTAL of Columns $540 $26,281 $8,394
Total Annual Manure System Operating Costs $35,215
Operating costs of other systems impacted by manure system, such as crop enterprise, dairy enterprise, or overall business
Negative is a benefitBedding 5360Field usage 0Fertilizer 2145Herbicides 0Crop Rotations 0Tillage operations 0Other 0
Total Annual Operating Costs, Other Systems $7,505 Added to Total
Revenue Generation due to manure systemelectricity 0solids Marketed Compost - $30/yd 30 bays, 37yd/bay 33300liquids 0Total Annual Revenue Generation due to Manure 33,300$ Subtracted from Total
Total Annual Operating Cost $9,420
Total Annual Costs, All Areas $35,192

A-9
Table A-7. Manure Systems Analysis Projections, Mar-bil Farm, Spread Compost On-Farm, Based on Actual Amount Processed. Initial Investments and Fixed Cost Calculation Real Interest Rate 0.05
Fixed Costs Compost Bldg. Fixed costs Curing Pad Fixed costs Pay Loader Fixed costs Fans/ControlInitial Investment 142,911 Initial Investment 2,626 Initial Investment 29950 Initial Investment 31,763Useful Life 30 Useful Life 10 Useful Life 10 Useful Life 5Salvage Value 0 Salvage Value 0 Salvage Value 3000 Salvage Value 0Interest Investment 0.05 Interest Investment 0.05 Interest Investment 0.05 Interest Investment 0.05Average Investment 71456 Average Investment 1313 Average Investment 16475 Average Investment 15882Annual Interest charge 3573 Annual Interest charge 65.65 Annual Interest charge 823.75 Annual Interest charge 794.08Depreciation 4764 Depreciation 262.6 Depreciation 2695 Depreciation 6352.6
Fixed Costs Manure Spreader Fixed costs Milk House Waste Fixed costs Bedding storage building Fixed costs Barn ModificationsInitial Investment 20994 Initial Investment 12000 Initial Investment 0 Initial Investment 3732Useful Life 5 Useful Life 10 Useful Life 30 Useful Life 30Salvage Value 0 Salvage Value 0 Salvage Value 0 Salvage Value 0Interest Investment 0.05 Interest Investment 0.05 Interest Investment 0.05 Interest Investment 0.05Average Investment 10497 Average Investment 6000 Average Investment 0 Average Investment 1866Annual Interest charge 524.85 Annual Interest charge 300 Annual Interest charge 0 Annual Interest charge 93.3Depreciation 4198.8 Depreciation 1200 Depreciation 0 Depreciation 124.4
Total Annual Fixed Costs $25,772
Annual Operating CostsOperating costs of manure system, over annual period, dollarsLivestock Facility Manure Field Application
Removal SystemsRepairs/Maintenance, including parts and service fees 0 6240 2350Utilities 540 1071 0Gas 0 0 0Hired Labor 2hr/day $10/hr 0 5475 0Management Labor 1hr/day $20/hr 0 5475 0Owner Labor & Management$10/hr 0 0 0Fuel 100hp * .0504 * 1.80fuel price *303hours 0 3000Supplies 0 0 0Ammendment 7bales/pile 30 piles $22/bale 0 4620 0Insurance 0 0 0Taxes 0 400 0Other 150hp * .0504 * 1.80fuel price *800hours 0 0 10880
0 0 0
TOTAL of Columns $540 $26,281 $13,230
Total Annual Manure System Operating Costs $40,051
Operating costs of other systems impacted by manure system, such as crop enterprise, dairy enterprise, or overall business
Negative is a benefitBedding 5360Field usage -645Fertilizer 1500Herbicides 0Crop Rotations 0Tillage operations 0Other 0
Total Annual Operating Costs, Other Systems $6,215 Added to Total
Revenue Generation due to manure systemgas 0electricity 0solids 0liquids 0related farm products 0
Total Annual Revenue Generation due to Manure $0 Subtracted from Total
Total Annual Operating Cost $46,266
Total Annual Costs, All Areas $72,038

B-1
APPENDIX B
Excerpts from:
Inactivation of Ascaris suum in a biodrying compost system, unpublished, Amy S. Collick
“Sentinel Chambers™ have proven effective in monitoring the survival of Ascaris suum in the biodrying
system. The high viability results from the control chambers ensured the initial viability of the A. suum eggs
and the efficacy of the chamber processing and egg extraction and incubation methods. Therefore, the
inactivation observed in the compost chamber samples was caused by the biodrying process and not by
laboratory processing.
Two key factors most likely causing the inactivation of A. suum eggs exposed to the biodrying system were
high temperatures (>55oC) in much of the pile and the drying out of the bottom portion of the pile. The
influence of time and temperature on Ascaris eggs has been extensively studied. According to a compilation of
several of these studies, total inactivation of Ascaris eggs occurred in less than 2 hours in conditions in which
temperatures remained above 55oC (Feachem et al., 1983). Eggs subjected to temperatures of 55oC and below
in various conditions required more than 1 year for complete inactivation (Feachem et al., 1983). The
inactivation of the top chamber samples (B- and B-samples) can be explained by the high temperatures
observed in proximity of these samples. However, the chambers located in the bottom of the pile were
associated with temperatures near 30oC, and the eggs in these chambers also experienced total inactivation
within 4 days. Therefore, other factors besides temperature were responsible for the rapid inactivation of the
eggs in the chambers situated in the bottom of the pile. For example, desiccation is deleterious to Ascaris eggs
(Feachem et al., 1983). The extent of drying that occurred in the bottom portion of the compost pile may have
been the cause of the inactivation. Other microbial and composting processes may also be important factors
responsible for inactivating A. suum eggs.
Aerobic composting with the addition of a bulking agent has been effective in eliminating Ascaris eggs in other
studies, as well (Feachem et al., 1983). Careful composting process management through the regulation of
moisture content, carbon-nitrogen ratio, and pile temperature was necessary to inactivate the eggs. Pile
temperature was deemed the crucial factor in the elimination of the eggs (Feachem et al., 1983). The biodrying
system provided additional proof to the effectiveness of temperature and moisture regulation on the
management of pathogens in composting processes.
Although additional adjustments to the biodrying system may be required to ensure a thoroughly dried and

B-2
composted product, the complete elimination of A. suum eggs justifies continued research into this system as a
potentially feasible and environmentally sound manure storage and handling practice for small and medium
dairy farms.”

C-1
APPENDIX C
Disclaimer
This report was prepared by the Watershed Agriculture Council in the course of performing work contracted
for the New York State Energy Research and Development Authority (NYSERDA). However, any opinions,
findings, conclusions or recommendations expressed herein are those of the author(s) and do not necessarily
reflect the views of NYSERDA.
PUBLICATIONS
Wright, P., C. Gooch, S. Inglis. 2001. Biodrying dairy manure: Initial experiences. ASAE Annual Meeting
Paper No. 012292. St. Joseph, Mich: ASAE.
Inglis, S., Wright, P., and C. Gooch. 2002. Computerized Control System for Static Pile Composting of Dairy
Manure. 2002 ASAE Annual Meeting Paper No. 024140. Chicago, Illinois: ASAE.
Wright, P.. and S. Inglis. 2002. Biodrying Manure. Composting and Compost Utilization. 2002 International
Symposium, Columbus, Ohio. Compost Science & Utilization, 419 State Avenue, Emmaus, PA 18049.
Wright, P. and S. Inglis. 2002. Moisture, Density and Porosity Changes as Dairy Manure is Biodried. ASAE
Annual Meeting Paper No. 024151. Chicago, Illinois: ASAE.