Embed Size (px)
Citation preview

W A T E R F O W L M A N A G E M E N T H A N D B O O K
13.1.1. Nutritional Values of Waterfowl Foods
Leigh H. Fredrickson and Fredric A. Reid Gaylord Memorial Laboratory School of Forestry, Fisheries and Wildlife University of Missouri−Columbia Puxico, MO 63960
Over 40 species of North American waterfowl use wetland habitats throughout their annual cycles. Survival, reproduction, and growth are dependent on the availability of foods that meet nutritional requirements for recurring biological events. These requirements occur among a wide variety of environmental conditions that also influence nutritional demands. Recent work on nesting waterfowl has identified the female’s general nutrient needs for egg laying and incubation. Far less is known about nutritional requirements for molt and other portions of the life cycle, particularly those during the nonbreeding season. Although information on specific requirements for amino acids and micronutrients of wild birds is meager, the available information on waterfowl requirements can be used to develop waterfowl management strategies. For example, nutrient content of foods, nutritional requirements of waterfowl, and the cues waterfowl use in locating and selecting foods are all kinds of information that managers need to encourage use of habitats by feeding waterfowl. Waterfowl nutritional needs during the annual cycle and the nutritional values of natural foods and crops will be discussed below.
Composition of Waterfowl Foods
Compared to the nutritional information on many agricultural crops, the composition of wild
foods is poorly documented. Nevertheless, the available information on nutritional quality of wild foods, in conjunction with known waterfowl requirements, provides general guidelines for management. Terminology commonly used when discussing the nutritional values of foods or requirements for waterfowl include the following:
Basal metabolic rate (BMR)—The lowest level of metabolism necessary for basic body functions for an animal at rest. Gross energy—The amount of energy (often expressed in 1000 calories = 1 kcal) produced when a food sample is ignited in a bomb calorimeter. Gross energy represents the most common nutritional information available, because techniques to determine gross energy are relatively simple and costs are minimal. Metabolizable energy—The amount of energy that can be utilized for metabolic processes by an animal. Metabolizable energy is more complicated to determine than gross energy—animals must be fed a diet of food containing a known amount of gross energy, and the portion excreted as feces, urine, and gases must be identified and quantified. Proximate analysis—A chemical process to identify the major components in foods. Samples must be handled carefully to ensure that chemical composition represents the nutritional content. The food is first ground to a fine homogenate, then dried to determine water content. Components identified by proximate analysis include the following:
• Fats or lipids —The most concentrated energy sources in foods. Fats occur as structural components and serve as insulation or as energy stores.
• Ash—Mineral content.
Fish and Wildlife Leaflet 13.1.1. • 1988 1

• Crude Fiber—Least digestable fraction in foods that includes cellulose, hemicellulose, or lignin. Waterfowl lack rumens; thus, little fiber is digested.
• Nitrogen-free extract (NFE)—Highly digestible carbohydrates.
• Protein—Compounds containing nitrogen that are major components of muscle tissue, animal cell membranes, and feathers; also active as enzymes, hormones, and clotting factors in blood. These serve many different functions.
More sophisticated testing provides identification of the specific composition of proteins and fats:
• Amino acids—Mixtures of 20 to 25 different amino acids, linked by peptide bonds, form plant and animal proteins.
• Essential amino acids —The 10 amino acids that must come from the diet because of the inability of an animal’s metabolic pathway to produce them.
• Fatty acids—Components of fats with varying molecular weight and number of double bonds. Unsaturated fatty acids such as palmitoleic, oleic, and linoleic acids are important in waterfowl.
Information is generally available on the gross energy of foods (Tables 1 and 2), but metabolizable energy and outputs of proximate analyses including
the amount of fat, fiber, ash, or nitrogen-free extract of these same foods are rarely identified (Table 3). Proteins supply the essential amino acids and are in high demand during egg laying and molt. Fats or lipids serve as energy reserves, as structural elements in cells, and as sterol hormones. Ash indicates the mineral content. Crude fiber is a measure of the least digestible food components, whereas NFE provides an estimate of the highly digestible carbohydrates.
Food quality is best predicted when information is available on metabolizable energy, ash, protein, fat, and NFE. Protein values are reported for about half of the foods that have energy values, but the content of fat, fiber, ash, or NFE is identified for less than one-third. Foods with a very high fiber content generally have lower levels of metabolizable or usable energy because fiber is poorly digested by waterfowl. In some cases, values from chemical analyses can be misleading. Crude protein content may be high, but the form of the protein or chemical inhibitors within the food may reduce the amount usable by the bird. For example, soybeans have a high level of crude protein, but only a small portion is available to waterfowl because of inhibitors. Waterfowl require a balance of amino acids. Some foods, such as crustaceans, usually have a better balance of amino acids than do insects and spiders. Certain
Table 1. Chemical composition of some common waterfowl plant foods. Values represent averages from the literature.
Gross energy Common namea (kcal/g) Fat Fiber Ash NFE Protein
Sticktights 5.177 15.0 19.7 7.2 27.5 25.0 Schreber watershield 3.790 2.9 36.7 4.8 45.9 9.3 Pecan hickory 7.875 40.8 19.0 12.6 35.1 8.4 Chufa flatsedge (tubers) 4.256 6.9 9.0 2.5 55.4 6.7 Hairy crabgrass 4.380 3.0 11.1 9.7 59.4 12.6 Barnyardgrass 3.900 2.4 23.1 18.0 40.5 8.3 Rice cutgrass 3.982 2.0 10.6 9.5 57.8 12.0 Fall panicum 4.005 3.1 16.8 16.1 50.1 12.3 Smartweed 4.423 2.8 22.0 7.5 — 9.7 Pennsylvania smartweed 4.315 2.3 21.8 4.9 65.3 9.0 Pin oak 5.062 18.9 14.7 1.6 58.6 6.4 Willow oak 5.296 20.6 14.0 1.7 55.3 5.1 Curly dock 4.278 1.2 20.4 6.9 — 10.4 Duck potato 4.736 9.0 10.8 4.9 55.5 20.0 Milo 4.228 3.1 6.0 3.5 72.2 10.2 Corn 4.435 3.8 2.3 1.5 79.8 10.8 Common soybean 5.451 20.5 5.4 6.2 27.1 39.6 Common duckweed 4.235 3.5 11.3 10.7 49.8 25.7 River bulrush (rhizomes) 4.010 — — — — — a For alternative common names and scientific names consult Appendix.
2 Fish and Wildlife Leaflet 13.1.1. • 1988

Table 2. Chemical composition of some common waterfowl invertebrate foods.
Gross energy Protein Invertebrate (kcal/g) (%)
Water boatmen 5.2 71.4 Back swimmers 5.7 64.4 Midges 4.6 61.2 Water fleas 4.0 49.7 Amphipods (Hyallela azteca) 4.9 47.6 Amphipods (Gammarus spp.) 3.8 47.0 Cladocera (unclassified) 2.7 31.8 Pond snails 1.0 16.9 Orb snails 1.0 12.2
amino acids can be synthesized by waterfowl, but the essential amino acids must be acquired in the diet.
Because values for metabolizable energy are reported for individual food items rather than as combinations of foods normally consumed by wild waterfowl, nutritional information is not always accurate. Synergistic interactions among foods during digestion are more difficult to identify compared to the usable energy available from a single food item fed separately. Thus, providing a nutritionally balanced diet from wild and domestic foods, alone or in combination, continues to be a perplexing challenge facing wetland managers.
The Energetic Costs of Waterfowl Activities
Wild animals must provide for general body maintenance and for processes that require additional nutrients, such as growth, reproduction, and migration. The BMR includes the demands for energy of an animal that is at rest. Basal costs for locomotion, digestion, reproduction, or thermoregu
lation at extreme temperature ranges are not included. Large body sizes allow waterfowl to use their body reserves to meet the demands of maintenance and other demanding processes. For example, arctic−nesting geese transport all of their protein and energy needs for laying and incubation with them to arctic nesting grounds. Such species may lose nearly 50% of their body weight by the time their clutches hatch. Reserves for migration are particularly important in some waterfowl such as Pacific populations of brant. In their 3,000−mile journey from Alaska to Mexico, they lose one-third of their body weight (about 1.87 lb of fat) in a few days.
Waterfowl engage in a variety of activities that have high energetic costs. The locality and the environmental conditions under which these activities occur determine the energetic expenditures for each event. These are usually expressed in relation to the basal metabolic rate for an animal at rest.
Activities such as swimming, preening, foraging, or courtship are more energetically costly. Flight is the most expensive activity with estimates ranging from 12−15 × BMR. Diving is less costly (i.e., 3.5 × BMR). Furthermore, temperatures have important effects on energetic requirements. For example, captive mallards will increase their metabolic rate above the basal level by 2.1 × at 0°C and by 2.7 × at −20°C. Wild ducks and geese reduce the frequency of their feeding flights under extreme cold to conserve energy. Determining actual energetic costs of activities is difficult in the field; hence, the values for wild birds are usually based on estimates rather than actual measurements.
The general nutritional requirements for biological events in the annual cycle are known for an increasing number of waterfowl. The best estimates are those for breeding birds (Table 4), whereas far less is known about nonbreeding requirements.
Table 3. Metabolizable energy of some common waterfowl foods.
Metabolizable energy Taxon Test animal (kcal/g)
Water flea Blue-winged teal 0.82 Amphipod (Gammarus spp.) Blue-winged teal 2.32 Pond snail Blue-winged teal 0.59 Coast barnyardgrass Duck (male) 2.63 Coast barnyardgrass Duck (female) 2.99 Rice cutgrass Duck (male) 3.00 Common duckweed Blue-winged teal 1.07 Pennsylvania smartweed Dabbling duck (male) 1.12 Pennsylvania smartweed Dabbling duck (female) 1.10
Fish and Wildlife Leaflet 13.1.1. • 1988 3

Table 4. Nutritional requirements for breeding waterfowl compared to the composition of corn and common native foods.
Requirements breeding Plants Foods
ducks/geese Corn Acorns Barnyardgrass Pigweed
Energy 2,900a 3,430a 5,577b 4,442b 4,623b
Protein (%) 19 8.7 6.0 12.5 22.0 Methioninec 2.0 0.18 — — — Ca (%) 2.7 0.02 0.24 0.13 1.72 Mg (ppm) 350 5 — 69 35 a = kcal ME/kg b = Gross energy (not metabolizable energy) c = % of protein
Note that no single food supplies a diet that meets all energy, protein, or micronutrient needs of breeding waterfowl. Likewise, activities other than breeding have varying costs in relation to specific nutrient energy and differ greatly from reproduction, where a mix of energy, minerals, and protein are required to supply the needs of egg-laying females.
Food Quality in Relation to Deterioration and Habitat Conditions
The quality of plant foods is largely determined by heredity, but other factors, such as soil nutrients and environmental conditions during the growing season, are important. For example, seeds having a high fat content may vary greatly in energy content among seasons because of environmental conditions. The supply of minerals is closely related to the mineral concentrations in water.
One of the major problems facing waterfowl managers is deterioration of seeds during flooding, but information on rates of deterioration is only available for a few seeds. Soybeans break down very rapidly; nearly 90% of the energy content is lost during 3 months of flooding, whereas corn loses only 50% during a similar period of flooding (Table 5). Breakdown of wild seeds is variable. Hard seeds such as bulrush decompose slowly, whereas softer seeds such as common barnyardgrass deteriorate 57% after 90 days under water. Such variations have important implications for the timing of flooding for waterfowl (Table 6). If some seeds are submerged for a month or more before waterfowl are present, much of the food value will be lost because of deterioration.
Supplying Nutritional Needs for Waterfowl
The large body sizes of waterfowl enable them to store nutrients as body reserves. In some cases nutrients for an upcoming stage in the life cycle are acquired at a distant wetland and transported as body reserves. The best known examples are the transport of fats, calcium, and protein by arctic-nesting geese from wintering and migrational stopovers to breeding habitats. Because waterfowl store body reserves, managers should make an effort to supply required nutrients throughout the annual cycle rather than supplying nutrients solely for events at the time they occur.
Identifying shortfalls in nutritional needs is becoming more of a reality as the requirements for free-living animals are identified. Waterfowl are well adapted to the dynamics of natural wetland systems. Mobility and foraging adaptability are behav-
Table 5. Deterioration of selected seeds after 90 days of flooding.
Decomposition Plant name (%)
Soybean 86 Barnyardgrass 57 Corn 50 Common buckwheat 45 Milo 42 Giant bristlegrass 22 Pennsylvania smartweed 21 Cultivated rice 19 Water oak (acorns) 4 Hemp sesbania 4 Horned beakrush 2 Saltmarsh bulrush 1
4 Fish and Wildlife Leaflet 13.1.1. • 1988

Table 6. Comparison of deterioration of 100 lb of five selected seeds in relation to different flooding schedules. Estimates assume a constant daily rate of deterioration.
Percent Remaining 15 September 15 October 15 Novemeber 15 December
Flooding Date
18 August Soybeans 71 43 14 0 Corn 83 67 50 33 Millet 81 62 43 24 Giant bristlegrass 93 85 78 71 Smartweed 93 85 79 72
Total percent remaining 84 68 53 40
15 September Total percent remaining 84 68 53
15 October Total percent remaining 84 68
15 November Total percent remaining 84
ioral characteristics that enable waterfowl to acquire needed resources. Dynamic wetlands supply a variety of food resources that allow waterfowl to feed selectively and to formulate nutritionally adequate diets from a variety of sites. Although a single wetland site may not provide adequate food for all requirements, management areas with a variety of wetlands or flooding regimes usually have a mix of habitats that provide all nutritional requirements.
Because a variety of strategies exists within and among waterfowl species (wintering, migration, or breeding), not all individuals or species require similar resources simultaneously. Thus, a diverse habitat base is a logical approach to meet the various needs of waterfowl. Furthermore, when suitable food and cover are within daily foraging range, acquisition of required resources is enhanced. A good rule of thumb is to provide many wetland types or food choices within a 10-mile radius of waterfowl concentrations. Some species such as snow geese have far greater foraging ranges, but they are the exception rather than the rule.
Appropriate management requires preservation, development, and manipulation of manmade and natural wetland complexes. Such an approach provides nutritionally balanced diets for diverse waterfowl populations. Where natural wetlands remain intact, they should be protected as unique components of the ecosystems. The protection of
natural systems and the development and management of degraded systems increases choices of habitats and foods for waterfowl. Likewise, the provision of adequate refuge areas where birds are protected from disturbance is an essential ingredient to ensure that food resources are available to waterfowl and can be used efficiently.
Suggested Reading
Hoffman, R.B., and T.A. Bookhout. 1985. Metabolizable energy of seeds consumed by ducks in Lake Erie marshes. Trans. N. Am. Wildl. Nat. Resour. Conf. 50:557−565.
National Research Council. 1977. Nutrient requirements of domestic animals. No. 1. Nutrient requirements of poultry. Natl. Acad. Sci., Washington, D.C. 62 pp.
Neely, W.W. 1956. How long do duck foods last underwater? Trans. N. Am. Wildl. Conf. 21:191−198.
Prince, H.H. 1979. Bioenergetics of postbreeding dabbling ducks. Pages 103−117 in T.A. Bookhout, ed. Waterfowl and wetlands: an integrated review. Proc. 1977 Symp., North Cent. Sect., The Wildl. Soc., Madison, Wis. 147 pp.
Robbins, C.T. 1983. Feeding and wildlife nutrition. Academic Press, New York. 343 pp.
Sugden, L.G. 1971. Metabolizable energy of small grains for mallards. J. Wildl. Manage. 35:781−785.
Fish and Wildlife Leaflet 13.1.1. • 1988 5

Appendix. Common and Scientific Names of Plants and Animals Named in Text.
Plants Pigweed . . . . . . . . . . . . . . . . . . . . . . . . . . . . . . . . . . . . . Amaranthus sp. Devils beggarticks or sticktights . . . . . . . . . . . . . . . . . . . . . . . . Bidens frondosa Schreber watershield . . . . . . . . . . . . . . . . . . . . . . . . . . . . . . Brasenia schreberi Pecan hickory . . . . . . . . . . . . . . . . . . . . . . . . . . . . . . . . . . Carya illinoensis Chufa flatsedge . . . . . . . . . . . . . . . . . . . . . . . . . . . . . . . . . Cyperus esculentus Hairy crabgrass . . . . . . . . . . . . . . . . . . . . . . . . . . . . . . . . . Digitaria sanguinalis Common barnyardgrass or Japanese millet . . . . . . . . . . . . . . . . . . Echinochloa crusgalli Coast barnyardgrass, wild millet, or watergrass . . . . . . . . . . . . . . . Echinochloa walteri Common buckwheat . . . . . . . . . . . . . . . . . . . . . . . . . . . . . . Fagopyrum esculentum Common soybean . . . . . . . . . . . . . . . . . . . . . . . . . . . . . . . . Glycine max Rice cutgrass . . . . . . . . . . . . . . . . . . . . . . . . . . . . . . . . . . Leersia oryzoides Common duckweed . . . . . . . . . . . . . . . . . . . . . . . . . . . . . . . Lemna minor Cultivated rice . . . . . . . . . . . . . . . . . . . . . . . . . . . . . . . . . Oryza sativa Fall panicum or panic grass . . . . . . . . . . . . . . . . . . . . . . . . . . Panicum dichotomiflorum Curltop ladysthumb or smartweed . . . . . . . . . . . . . . . . . . . . . . Polygonum lapathifolium Pennsylvania smartweed . . . . . . . . . . . . . . . . . . . . . . . . . . . . Polygonum pensylvanicum Pin oak . . . . . . . . . . . . . . . . . . . . . . . . . . . . . . . . . . . . . Quercus palustris Willow oak . . . . . . . . . . . . . . . . . . . . . . . . . . . . . . . . . . . Quercus phellos Water oak . . . . . . . . . . . . . . . . . . . . . . . . . . . . . . . . . . . . Quercus nigra Horned breakrush . . . . . . . . . . . . . . . . . . . . . . . . . . . . . . . Rhynchospora corniculata Curly dock . . . . . . . . . . . . . . . . . . . . . . . . . . . . . . . . . . . . Rumex crispus Common arrowhead or duck potato . . . . . . . . . . . . . . . . . . . . . . Sagittaria latifolia River bulrush or three-square bulrush . . . . . . . . . . . . . . . . . . . . Scirpus fluviatilus Saltmarsh bulrush or bulrush . . . . . . . . . . . . . . . . . . . . . . . . . Scirpus robustus Hemp sesbania . . . . . . . . . . . . . . . . . . . . . . . . . . . . . . . . . Sesbania exalta Giant bristlegrass or giant foxtail . . . . . . . . . . . . . . . . . . . . . . . Setaria magna Common sorghum or milo . . . . . . . . . . . . . . . . . . . . . . . . . . . Sorghum vulgare Indian corn or corn . . . . . . . . . . . . . . . . . . . . . . . . . . . . . . . Zea mays
Birds Blue-winged teal . . . . . . . . . . . . . . . . . . . . . . . . . . . . . . . . Anas discors Mallard . . . . . . . . . . . . . . . . . . . . . . . . . . . . . . . . . . . . . Anas platyrhynchos Brant . . . . . . . . . . . . . . . . . . . . . . . . . . . . . . . . . . . . . . Branta bernicla Snow goose . . . . . . . . . . . . . . . . . . . . . . . . . . . . . . . . . . . Chen caerulescens
Invertebrates (Families) Midges . . . . . . . . . . . . . . . . . . . . . . . . . . . . . . . . . . . . . . Chironomidae Water boatmen . . . . . . . . . . . . . . . . . . . . . . . . . . . . . . . . . Corixidae Water fleas . . . . . . . . . . . . . . . . . . . . . . . . . . . . . . . . . . . Daphnidae Pond snails . . . . . . . . . . . . . . . . . . . . . . . . . . . . . . . . . . . Lymnaeidae Back swimmers . . . . . . . . . . . . . . . . . . . . . . . . . . . . . . . . . Notonectidae Orb snails . . . . . . . . . . . . . . . . . . . . . . . . . . . . . . . . . . . . Planorbidae
����������������������������������������
������������������������� ���������������������������� ����������������� •• � ����
6 Fish and Wildlife Leaflet 13.1.1. •• 1988

W A T E R F O W L M A N A G E M E N T H A N D B O O K
13.1.2 Life History Traits and Management of the Gadwall
James K. Ringelman Colorado Division of Wildlife 317 West Prospect Road Fort Collins, CO 80526
The gadwall is widely distributed throughout the western two-thirds of North America. Although its primary breeding habitat is in the drought-prone and degraded waterfowl habitats of the northern Great Plains, its continental population has remained relatively stable while those of most other dabbling ducks have declined. Some unique life history traits may in part be responsible for the resilience of gadwall populations. These unique attributes, which are important for gadwall management, are the subject of this leaflet. Readers interested in general references on gadwall biology and natural history are referred to Bellrose (1980) or Palmer (1976).
Distribution Gadwall breeding populations reach their high
est densities in the mixed-grass prairies of the northern Great Plains and the intermountain valleys of the western United States (Fig. 1). The parklands and shortgrass prairies contain relatively fewer breeding birds. Some portions of the Pacific, Atlantic, and Alaskan coasts also have important breeding populations.
The primary migration corridor for gadwalls originates in the prairies and extends through the low plains region of the United States, including Nebraska, Kansas, eastern Colorado, Oklahoma, Texas, Louisiana, and into Mexico. Secondary mi-
Species Profile—Gadwall
Scientific name: Anas strepera Weight in pounds (grams):
Adults—male 2.1 (953), female 1.8 (835) Immatures—male 1.9 (858), female 1.7 (776)
Age at first breeding: 1 or 2 years Clutch size: 10, range 5 to 13 Incubation period: 25 days Age at fledging: 48−52 days Nest sites: Tall, dense herbaceous vegetation or
small shrubs within 1,000 feet of water, often near the site used the previous year
Food habits: Herbivorous, except during spring when some aquatic invertebrates are consumed
gration routes link the prairies with the Pacific Northwest, northern and central California, and northern Utah. From Utah, birds migrate to wintering areas in central and southern California and Mexico. Gadwall also migrate along diagonal routes from the Great Plains to the central and southern Atlantic coast.
Major wintering areas include coastal areas of Louisiana and Texas, south along the east coast of Mexico to the Yucatan Peninsula; the central and southern Atlantic coast; the Central Valley of California; and much of the west coast of Mexico.
Population Status and Harvest
Despite drought and widespread waterfowl habitat destruction in the 1970’s and 1980’s, the size of the gadwall population in North America has re-
Fish and Wildlife Leaflet 13.1.2. •• 1990 1

Fig. 1. Distribution of breeding and wintering gadwalls in North America.
mained relatively stable compared with populations of mallards and northern pintails (Fig. 2). Breeding gadwall are increasing in the Great Basin region, the intermountain valleys of the Rocky Mountains, and in the Pacific Flyway. The reproductive success of gadwall may be enhanced because of the tendency of this species to use semipermanent wetlands, home to traditional nesting sites where hens were previously successful, and to concentrate in secure nesting locations such as islands. The gadwall is also a lightly-harvested species; gadwall make up 4.2% of the continental population of breeding ducks but compose only 2.5% of the duck harvest.
Spring Migration and Breeding
Gadwalls depart wintering areas by March or early April (Fig. 3). They are among the last birds to arrive on the nesting grounds, and yearlings usually arrive later than older birds. Three to four weeks pass before most birds begin laying, during which time females acquire the fat and protein reserves needed for egg production. Compared to other dabbling ducks, a high percentage of yearling gadwalls do not attempt to nest. Birds older than
one year initiate nests first, often in mid-May. Most female gadwall that nest successfully return to areas used the previous year. When drought occurs on their prairie breeding grounds, many gadwalls migrate north into central and northern Canada.
Shortly after arrival on the nesting grounds, pairs establish territories on seasonal and semipermanent wetlands. Gadwall also tend to use open
Fig. 2. Continental breeding population of gadwalls (1970−89) compared with breeding populations of mallards and northern pintails.
2 Fish and Wildlife Leaflet 13.1.2. •• 1990
brackish or alkaline waters. Since semipermanent ponds are less susceptible to annual drought events than are ephemeral and temporary wetlands, the gadwall’s preference for deepwater habitats may be beneficial during drought.
Aquatic invertebrates make up about half of the gadwall’s diet during spring and summer (Table 1), and up to 72% during egg laying. Gadwalls consume the green portions of aquatic plants almost exclusively during the non-nesting season (Table 1). Most plants and animals consumed by gadwalls are adapted to semipermanent or permanent wetlands, so drawdowns of managed impoundments should be infrequent (6−8 years) in wetlands managed for this species. A small percentage of ponds in a wetland community should be drawn down during a single season, so that several "familiar" wetlands remain within the home range of gadwall pairs.
Nests are usually located in dry upland sites under clumps of shrubs or in herbaceous vegetation. Although nests average 1,000 feet (300 m) from water, sites up to 1.2 miles (1.9 km) away may be used. Nests in the valleys of the intermountain West are commonly found in baltic rush, nettle, and under small shrubs. In the northern Great Plains, fields of seeded native grasses usually receive the greatest use, followed by introduced grasses and unplowed, native prairie. Shrubs such as western snowberry and Woods rose also provide attractive nesting cover. Growing grainfields receive little use, and gadwalls avoid stubble and summer fallow areas.
Areas of dense vegetation, such as a grass-legume mixture, provide beneficial nesting cover for gadwalls. Residual cover from the previous year’s growing season, although not as important for the late-nesting gadwalls as it is for other early-nesting
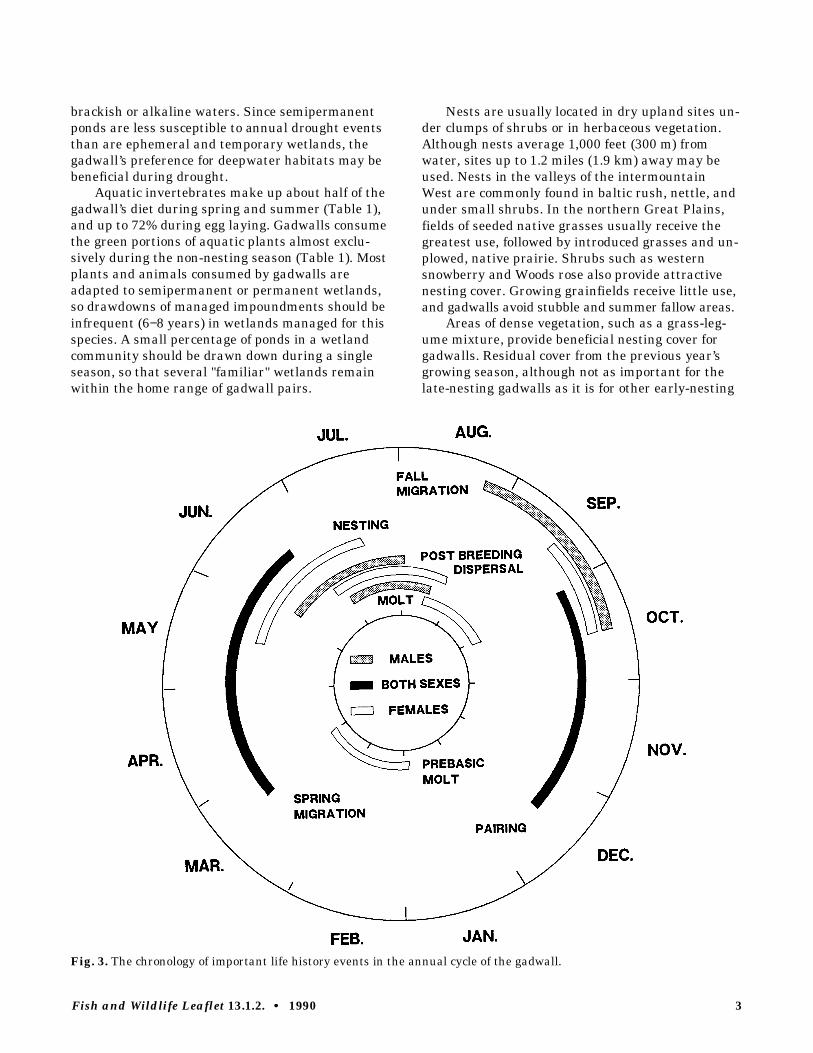
Fig. 3. The chronology of important life history events in the annual cycle of the gadwall.
Fish and Wildlife Leaflet 13.1.2. •• 1990 3

Table 1. Seasonal food habits of adult gadwall. Within seasons, the list of food items is arranged in order of importance in the diet.Vegetative foods refer to green portions of plants unless otherwise noted.
Season, food type, and % volume in diet Common name Habitat and location
Spring and summer Plant foods (54%) Filamentous algae Brackish, subsaline, and
Widgeongrass saline wetlands of Muskgrass North Dakota. Sago pondweed Elodea
Animal foods (46%) Fairy shrimp Seed shrimp Water fleas Midges Beetle larvae
Fall and winter Plant foods (95%) Filamentous algae Fresh, intermediate, and
Dwarf spikerush brackish marshes in Widgeongrass Louisiana Spiked watermilfoil Baby pondweed
Animal foods (5%) Seed shrimp Plant foods (91%) Fragrant flatsedge Fresh and brackish tidal
Redroot sedge impoundments in South Widgeongrass Carolina
Animal foods none listed
ducks, nonetheless affords important cover in many nesting habitats. Residual cover can become lodged and matted over several years, so burning or mechanical manipulations are sometimes needed to rejuvenate nesting areas.
Gadwalls often use islands as nesting sites because the water barrier reduces nest losses from mammalian predators. The high nest success typical of islands, coupled with the homing tendencies of gadwalls, contribute to nesting densities as high as 200 nests/acre (493 nests/ha). Suitable nesting islands should be 0.2−1.2 acres (0.1−0.5 ha) in size, elongated in shape, and separated from the mainland by at least 500 feet (150 m) of water that remains 3 feet (0.9 m) deep during the nesting season. Although islands can be incorporated into the initial impoundment designs or constructed when a wetland has been dewatered, the construction cost is high even when amortized over the expected life of the island. Additionally, vegetation can be difficult to establish on newly constructed islands. A more cost-effective approach is to cut-off an existing peninsula from the mainland, thereby saving most of the cost of earth moving and vegetation establishment. As valuable as nesting islands can be, managers must provide a diversity of wetlands for
pairs and broods to complement the secure nesting habitat afforded by islands.
Brood-rearing hens will move ducklings up to 1.2 miles (1.9 km) to brood habitat. Gadwall ducklings initially consume equal amounts of plant and animal foods, but consumption of animal food peaks at 2 weeks of age as vegetative matter begins to dominate their diet (Table 2). The average brood size at time of fledging (50 days old) is 6.2 ducklings per brood.
Post-breeding Dispersal
After hens have incubated for about 2 weeks, males abandon their breeding territories and concentrate on large permanent or semipermanent wetlands near the nesting area. Males, which are flightless for 25−28 days beginning in mid-July, form molting rafts of several hundred to thousands of individuals. These birds often occupy open water areas that contain beds of submersed aquatic vegetation, their primary food (Table 1). Unlike mallards and other secretive species that seek heavy vegetative cover when flightless, gadwalls often associate with American wigeons and diving ducks and loaf on the bare shorelines of islands or main-
Fish and Wildlife Leaflet 13.1.2. •• 1990 4

Table 2. Food habits of gadwall ducklings. The list of food items is arranged in order of importance in the diet. Vegetative foods refer to green portions of plants unless otherwise noted.
Food type and % dry weight in diet Common name Habitat and location
Plant foods (90%) Baby pondweed Freshwater prairie wetlands Filamentous algae in southern Alberta Slough grass seeds Duckweed Muskgrass Coontail
Animal foods (10%) Beetle larvae Midges Water fleas
land stretches that are free from human disturbance. Female gadwalls molt 20−40 days after the males, usually singly or in small flocks. However, moderate- to large-sized wetlands of a permanent or semipermanent nature, expanses of open water with submersed vegetation, and open shorelines secure from human disturbance are important characteristics of molting habitat for both sexes.
Fall Migration
Most gadwalls begin their fall migration in early September, and none remain on northern breeding grounds by late October. However, because of their late breeding and molt chronology, some females remain flightless into late September and early October. These birds, which are probably hens that successfully completed second nests after their first clutch was destroyed, may be subject to hunting before they fully regain flight capabilities. Since opening of the hunting season typically occurs as early as possible (the first week in October) in the northern Great Plains and intermountain basins of the West, some local populations of late-molting female gadwalls may be subject to high hunting mortality during early fall.
Because gadwall consume a diet composed almost exclusively of green, submersed aquatic vegetation during fall (Table 1), traditional wetland management techniques such as moist-soil impoundments, which encourage the production of seed producing annuals, are not as attractive to gadwalls as they are to most other dabbling ducks. Cereal grains and row crops so highly sought by mallards, pintails, and green-winged teal also receive little use by gadwalls, but flooded ricefields are used by gadwalls in the Central Valley of California. Wetland management to benefit gadwall
should be directed at maintaining large wetlands with stable water levels suitable for the growth of submersed aquatic vegetation. Although it is most desirable to promote the growth of native vegetation present in a wetland, managers can establish stands of submersed vegetation by seeding or transplanting tubers and whole plants. Wildlife plant nurseries sell seeds and tubers for this purpose. Extreme water level fluctuations or poor water quality may inhibit the growth of submersed vegetation. Stabilization of water levels through control structures or augmentation of water flows during dry periods may be necessary. Removal of rough fishes, which increase water turbidity and degrade water quality, often dramatically improves stands of submersed vegetation.
Winter
Gadwalls reach their highest winter densities on the fresh, intermediate, and brackish marshes of the Louisiana coast. There, as elsewhere, their diet is composed almost entirely of vegetative foods (Table 1) obtained in water 6−26 inches (15−66 cm) deep. Plant foods consumed by gadwalls are lower in protein and energy and higher in fiber than the seeds and animal foods eaten by other ducks. Because gadwalls rely on low-quality foods, they feed throughout the day and night. Their strategy for nutrient acquisition is therefore more similar to that of geese than to other ducks; they consume large quantities of food to meet nutritional and energetic demands. Unlike geese, however, gadwalls do not have the capacity to store food obtained during intermittent feeding bouts. Wintering gadwalls may be susceptible to nutritional deficiencies if continual disturbance alters their feeding regimes.
Fish and Wildlife Leaflet 13.1.2. •• 1990 5

Suggested Reading
Bellrose, F. C., editor. 1980. Ducks, geese, and swans of North America. 3rd ed. Stackpole Books, Harrisburg, Pa. 540pp.
Crabtree, R. L., L. S. Broome, and M. L. Wolfe. 1989. Effects of habitat characteristics on gadwall nest predation and nest-site selection. J. Wildl. Manage. 53:129−137.
Gates, J. M. 1962. Breeding biology of the gadwall in northern Utah. Wilson Bull. 74:43−67.
Lokemoen, J. T., H. F. Duebbert, and D. E. Sharp. 1990. Homing and reproductive habits of mallards,
gadwalls, and blue-winged teal. Wildl. Monogr. 106. 28pp.
Palmer, R. S., editor. 1976. Handbook of North American birds. Vol. 2. Waterfowl. Yale University Press, New Haven, Conn. 521pp.
Paulus, S. L. 1982. Feeding ecology of gadwalls in Louisiana in winter. J. Wildl. Manage. 46:71−79.
Serie, J. R., and G. A. Swanson. 1976. Feeding ecology of breeding gadwalls on saline wetlands. J. Wildl. Manage. 40:69−81.
Sugden, L. G. 1973. Feeding ecology of pintail, gadwall, American widgeon and lesser scaup ducklings in southern Alberta. Can. Wildl. Serv. Rep. Ser. 24. 44pp.
Appendix. Common and Scientific Names of Plants and Animals Named in Text.
Plants Slough grass . . . . . . . . . . . . . . . . . . . . . . . . . . . . . . . . . Beckmannia syzigachne Coontail . . . . . . . . . . . . . . . . . . . . . . . . . . . . . . . . . . . . . . . Ceratophyllum spp. Muskgrass . . . . . . . . . . . . . . . . . . . . . . . . . . . . . . . . . . . . . . . . . Chara spp. Filamentous algae . . . . . . . . . . . . . . . . . . . . . . . . . . . . . . . . . . . Chlorophyceae Fragrant flatsedge . . . . . . . . . . . . . . . . . . . . . . . . . . . . . . . . . . Cyperus odoratus Dwarf spikerush . . . . . . . . . . . . . . . . . . . . . . . . . . . . . . . . . . Eleocharis parvula Baltic rush . . . . . . . . . . . . . . . . . . . . . . . . . . . . . . . . . . . . . . . Juncus balticus Redroot sedge . . . . . . . . . . . . . . . . . . . . . . . . . . . . . . . . . Lachnanthes caroliniana Common duckweed . . . . . . . . . . . . . . . . . . . . . . . . . . . . . . . . . . . . Lemna minor Spiked watermilfoil . . . . . . . . . . . . . . . . . . . . . . . . . . . . . . Myriophyllum spicatum Sago pondweed . . . . . . . . . . . . . . . . . . . . . . . . . . . . . . . . Potamogeton pectinatus Baby pondweed . . . . . . . . . . . . . . . . . . . . . . . . . . . . . . . . . . Potamogeton pusillus Woods rose . . . . . . . . . . . . . . . . . . . . . . . . . . . . . . . . . . . . . . . . Rosa woodsii Widgeongrass . . . . . . . . . . . . . . . . . . . . . . . . . . . . . . . . . . . . . Ruppia maritima Western snowberry . . . . . . . . . . . . . . . . . . . . . . . . . . . . Symphoricarpos occidentalis Stinging nettle . . . . . . . . . . . . . . . . . . . . . . . . . . . . . . . . . . . . . . Urtica dioica
Birds Northern pintail . . . . . . . . . . . . . . . . . . . . . . . . . . . . . . . . . . . . . . Anas acuta American wigeon . . . . . . . . . . . . . . . . . . . . . . . . . . . . . . . . . . . . Anas americana Green-winged teal . . . . . . . . . . . . . . . . . . . . . . . . . . . . . . . . . . . . . Anas crecca Mallard . . . . . . . . . . . . . . . . . . . . . . . . . . . . . . . . . . . . . . . Anas platyrhynchos Gadwall . . . . . . . . . . . . . . . . . . . . . . . . . . . . . . . . . . . . . . . . . . Anas strepera
Invertebrates Fairy shrimp . . . . . . . . . . . . . . . . . . . . . . . . . . . . . . . . . . . . . . . . . Anostraca Midges . . . . . . . . . . . . . . . . . . . . . . . . . . . . . . . . . . . . . . . . . . . Chironomidae Water fleas . . . . . . . . . . . . . . . . . . . . . . . . . . . . . . . . . . . . . . . . . . Cladocera Beetles . . . . . . . . . . . . . . . . . . . . . . . . . . . . . . . . . . . . . . . . . . . . Coleoptera Seed shrimp . . . . . . . . . . . . . . . . . . . . . . . . . . . . . . . . . . . . . . . . . . Ostracoda
����������������������������������������
������������������������� ���������������������������� ����������������� •• � ����
6 Fish and Wildlife Leaflet 13.1.2. •• 1990

WATERFOWL MANAGEMENT HANDBOOK
13.1.3. Life History Strategies and Habitat Needs of the Northern Pintail
Leigh H. Fredrickson Gaylord Memorial Laboratory The School of Natural Resources University of Missouri–Columbia Puxico, MO 63960
and
Mickey E. Heitmeyer Ducks Unlimited 9823 Old Winery Place, Suite 16 Sacramento, CA 95827
The northern pintail (hereafter pintail) is a common dabbling duck distributed throughout the Northern Hemisphere. Since 1955, the breeding population in North America has averaged 5,566,000, fluctuating between 10,124,000 (1956) and 2,471,000 (1989; Fig. 1). Pintail numbers are especially sensitive to habitat conditions that reflect the wet–dry cycle in the shortgrass prairie breeding areas of south-central Canada and the northern Great Plains of the United States. Populations of pintails also are affected by habitat conditions in key wintering areas, such as the Central Valley of California and Gulf Coast marshes. When wintering areas are fairly dry, birds have fewer resources and subsequent spring recruitment is lowered.
Through the 1970’s, continental populations recovered when wetland conditions on breeding and wintering areas were good but fell when the prairies were dry and wetland conditions in wintering areas were poor. Unfortunately, habitat
Species Profile—Northern Pintail
Scientific name: Anas acuta Weight in pounds (grams): Adults—male 2.3 (1,040 g), female 1.9 (860 g) Immatures—male 2 (910 g), female 1.8 (820 g) Age of first breeding: 1 year Clutch size: 8, range 3–14 Incubation period: 22–23 days Age at fledging: 36–43 days in Alaska, 42–57 days on prairies Nest sites: Low, sparse vegetation, often far from water Food habits: Omnivore; primarily moist-soil seeds, as well as chufa nutlets; cultivated grains, especially rice and barley. Animal foods: aquatic insects, especially chironomids, snails, terrestrial earthworms, and spiders.
losses and degradation of prairie habitats caused by agricultural practices have coincided with prolonged drought since the early 1980’s. This combination of detrimental factors resulted in declining pintail numbers in the past decade. The long-term downward trend in pintail numbers has focused renewed attention on this species.
This leaflet describes aspects of pintail life history that may be important for pintail management. It is not intended as a general reference on pintail biology. Readers interested in this should consult Bellrose (1980).
Fish and Wildlife Leaflet 13.1.3 •• 1991 1

1955 1960 1965 1970 1975 1980 1985
1,000
8,000
6,000
4,000
2,000
0
Distribution
The northern pintail is the most widely distributed dabbling duck in the Northern Hemisphere. Although pintails regularly breed in the shortgrass prairies of the northern United States and southern Canada, their breeding distribution in North America extends from the
Fig. 1. Fluctuations in the continental population of northern pintails based on breeding population estimates, 1955–90.
Great Basin into the northern boreal forest and the arctic coastal plain of Alaska and Canada (Fig. 2).
In recent years, about 16% of the continental population of pintails (counted in May) occurred on the 26,000 square miles of high-latitude wetlands along the arctic coastal plain in Alaska. Pintails compose 90% of the dabbling ducks that use these habitats; thus, they are the most abundant dabbling duck in this region. Drakes account for about 32% of this total, whereas pairs account for
Northern Pintail
Breeding concentrations
Winter concentrations
Migration concentrations
Fig. 2. Distribution of important breeding, wintering, and migration areas for northern pintails.
2 Fish and Wildlife Leaflet 13.1.3 •• 1991

12% and groups about 57%. Pintails are well known for overflight into more northern wetland habitats when wetland habitat conditions on more southern habitats are poor; therefore, their numbers fluctuate erratically in Alaska.
Most pintails in the Pacific Flyway have traditionally wintered from the Central Valley of California to the west coast of Mexico, but the river deltas of the Pacific Northwest also provide important habitats. Large numbers of pintails also winter in coastal marshes and rice belt habitats in Texas, Louisiana, Arkansas, and the Atlantic Coast, especially South Carolina.
Spring Migration and Breeding
Pintails migrate early in spring and move northward as soon as wetlands become ice-free. They normally initiate nesting earlier in spring and summer than other dabblers (Fig. 3). These early-nesting females often encounter light
snowfall while laying and incubating. Open habitats with sparse, low vegetation provide favored nesting sites. The shortgrass habitats of the Canadian prairie provinces have traditionally held the highest breeding populations. In the northern United States and southern Canada, first nests appear in early April during normal years, but inclement weather can delay nesting until the second week of May. Nesting activity in the more northern prairies peaks during the first 2 weeks of May. Pintails nest later in the boreal forest; the peak of first nests in Alaska’s interior occurs during mid-May. Birds moving to tundra habitats on the Yukon–Kuskokwim Delta and the North Slope do not nest until late May or as late as mid-June.
Pintails lay an average clutch of 8 eggs, but clutch size ranges from 3 to 14. Incubation lasts 22 or 23 days. Pintail broods can move long distances between the nest site and rearing habitats or among different brood habitats. Recent studies suggest that pintails are well adapted to making these movements and that neither mortality nor
Jul Aug
Sep
Oct
Nov
Dec
JanFeb
Mar
Apr
May
Jun
PostbreedingDispersal
Molt
Fall Migration
Males
Females
Nesting
Prebasic MoltSpring
Migration
Pairing
Both Sexes
Fig. 3. The chronology of important life history events in the annual cycle of the northern pintail.
Fish and Wildlife Leaflet 13.1.3 •• 1991 3

body condition of ducklings is greatly influenced by movements of less than 3 miles. Fledging time varies with latitude and is undoubtedly influenced by the length of daylight and the daily time available to forage. Females stay with the brood until the young reach flight stage. Soon after, the female initiates the summer molt and becomes flightless (Fig. 3).
Postbreeding Dispersal and Fall Migration
Males congregate in postbreeding flocks once females begin incubation (Fig. 3). Males may move to southern or northern habitats, where they often form large aggregations and begin the Prebasic molt, becoming flightless for about 3 weeks. After regaining flight in August, they often migrate south to the ultimate wintering areas. For some pintails, the fall migration is a more gradual shift south that extends over several months. Early migrant males begin to move southward in abundance in late August or early September and
usually concentrate on seasonally flooded wetlands, where they select seeds from native vegetation or from agricultural crops, especially rice.
Following brood rearing, successful females form small flocks, enter the molt, become flightless, and regrow their flight feathers in rapid succession (Fig. 3). Because males generally leave the breeding area before females are flightless, the latter use habitats distinctly different than those used by males for several months. During this time, females remain on more northern habitats and feed in semipermanent marshes, where invertebrates are important in their diet (Fig. 4). Females gradually join males on migratory and winter sites in October and November. As fall progresses, the two sexes gradually intermix and pair formation begins.
Winter Behavior and Pairing
Pintails are highly social and have loosely formed pair bonds compared to mallards and most other Northern Hemisphere dabblers. Pair formation by pintails begins on the wintering
5% 20% 15% 40%
35% 56% 77% 29%
Fall Migration Winter Unpaired Winter Paired Female Prebasic (Winter)
Spring Migration Prelaying Laying Postlaying
Nesting Females
Fig. 4. Invertebrate consumption by northern pintails during selected events in the annual cycle. Includes both sexes unless indicated otherwise.
4 Fish and Wildlife Leaflet 13.1.3 •• 1991

grounds, and most females are paired by January. Courtship flights often contain large numbers of males and traverse great distances, reach great heights, and last for extended periods. On the breeding grounds, these spectacular flights were once believed to distribute the nesting pairs widely among available habitats, but recent studies have not always confirmed this assumption—instead, they suggest active competition in mate selection and breeding opportunities among males in spring.
During winter, pintails undergo several important events in the annual cycle (Fig. 3). After completing the Prealternate molt, they form pairs; then, females initiate the Prebasic molt. By late winter and early spring, both sexes have accumulated large body fat reserves subsequently used in migration and for breeding. Females departing from the Central Valley of California to Tule Lake in late winter reach weights of 950 g, and of this total, 220 g is fat necessary to fuel migration and eventual reproduction.
Pintails are early migrants in spring and are especially attracted to large expanses of shallow open water where visibility is good and small seeds and invertebrates are readily available. Their preferred prairie nesting areas are short grasses where temporary ponds are abundant nearby.
Nesting habitat requirements in boreal forest and tundra habitats are less well known.
Foraging Ecology
Pintails are opportunistic omnivores. They primarily consume small seeds, but underground plant parts or small tubers, such as chufa nutlets, also are important (Table 1). If available, native foods are predominant in the diet, especially those associated with moist-soil habitats, including millet, smartweed, bulrush, toothcup, panicum, and swamp timothy. Pintails also exploit seeds and tubers of aquatic pondweeds and bulrushes. Although they consume seeds of all sizes, they are particularly adept at harvesting smaller seeds such as toothcup, panicum, swamp timothy, and sprangletop. These native foods provide a well-balanced diet to meet nutritional needs (Table 2). Favored cereal grains include rice and barley; pintails are less likely to eat corn than are mallards.
Animal foods are important throughout the life cycle but particularly so during molt and egg laying (Fig. 4). Some of the more important invertebrates
Table 1. Foods appearing in northern pintail diets during different events in the annual cycle.
Fall Winter Food migration Unpaired Paired
Prebasic Spring Summer Fall molt migration Nesting Ducklings molt staging
Plant Millet ++ ++ ++ Swamp timothy ++ ++ ++ Smartweed ++ ++ ++ Sprangletop + ++ ++ Toothcup + ++ ++ Curly dock +Panicum ++ ++ ++ Bulrush ++ + +Chufa + ++ ++ Pondweeds +Sedges + Agricultural
grains ++ ++ ++
++ ++ + + ++ ++ ++ + + ++ ++ + + ++ + +
+ + ++ ++ + + +
+ ++ ++ ++ ++ ++
+ ++ ++ ++ ++ ++ ++ + ++ ++
+ + ++
Animal Chironomids ++ ++ ++ Snails ++ Odonates + Ostracods
++ ++ ++ ++ ++ ++ ++ + ++ ++ ++ +
+ +
Fish and Wildlife Leaflet 13.1.3 •• 1991 5

consistently appearing in the diet are snails and chironomids. Chironomids, especially, are preferred by pintails and are extremely abundant on emergence from shallow wetlands immediately after ice-out. The arrival of pintails on many migration and breeding habitats tends to coincide with this period of emergence, and pintails forage voraciously on chironomids in such newly thawed wetlands.
Pintails strip seeds from the culms of native vegetation before seeds drop in fall. Once seeds have dropped onto the substrates, pintails dabble for these foods in shallow water (4 to 6 inches). As water deepens, pintails forage by upending, but this mode of feeding is restricted to waters <18 inches deep. Pintails have a tendency to avoid areas that are flooded too deeply if shallow sites also are present.
Habitat Management
Migration and Winter
Pintails are noted for their use of large expanses of shallow, open habitats. These wetlands
often provide an abundance of food and good visibility for avoidance of predators and other disturbances during the day. At night, habitats with greater, robust cover are often sought. Although they forage in openings in southern hardwoods, pintails generally do not use flooded sites in the forest interior. Similarly, they are less apt to use woody riparian corridors than are mallards or wood ducks.
Many well-managed wetlands have the potential to provide an abundant supply of high-energy and nutritionally complete foods for pintails when water depths are <18 inches and preferably <6 inches. Gradual flooding and draining of impoundments at appropriate times during spring and fall migration create conditions that allow optimal foraging opportunities over extended periods. When impoundments vary in depth by more than 18 inches, gradual flooding increases the potential for pintails to consume more available seeds. Waters >18 inches can still provide important roost sites and give security from predators. Newly developed wetland areas are more easily managed for pintails if levees and other water control structures are configured to provide the maximum area in optimal foraging depths of ≤18 inches.
Table 2. Nutritional valuesa of some important foods consumed by northern pintails.
Plant foods Energy kcal/g
Gross Metabolized Fat Fiber Percent
Ash NFEb Protein
Nodding smartweed 4.6 — 2.7 22.0 7.5 — 9.7 Big-seeded smartweed 4.3 1.1 2.6 19.1 3.8 67.3 10.6 Wild millet 3.9 — 2.4 23.1 18.0 40.5 9.1 Walter’s millet 4.5 2.8 3.9 13.7 5.8 55.7 16.8 Sticktights 5.0 — 13.2 20.9 8.9 27.5 23.1 Rice cutgrass 3.9 3.0 2.0 10.6 9.3 57.8 12.0 Fall panicum 4.0 — 6.1 16.8 16.1 50.1 12.0 Hairy crabgrass 4.4 — 3.0 11.1 9.7 59.4 12.6 Redrooted sedge 5.2 — — — — — — Curly dock 4.3 — 1.2 20.4 6.9 — 10.4 Bulrush 3.5 0.8 3.0 23.6 4.3 59.1 7.2 Pondweed 3.9 0.4 2.1 20.6 15.0 50.6 14.0 Chufa seeds — — 22.0 5.6 5.1 58.9 8.4 Chufa tubers 4.3 — 10.6 7.3 3.1 57.1 7.0 Barley — 2.9 2.1 7.1 3.1 — 20.0 Rice — 2.3 9.3 11.4 9.7 73.5 10.8 Corn 4.4 3.7 4.0 2.3 1.5 77.4 11.6
aValues are averages calculated from published information. Because of wide variation in values for some seeds and inconsistency in sample sizes for each nutrient, the sum of values may not be 100%.
bNFE = Nitrogen-free extract (highly digestible carbohydrates)
6 Fish and Wildlife Leaflet 13.1.3 •• 1991

Because waste grains from agricultural Summary production are of great importance to pintails, refuge or farm programs that make these grains available after harvest have special value for pintails in certain areas. Pintail use is increased by shallow flooding of any crop or by manipulating rice stubble by rolling or burning. Barley and rice usually are preferred over corn, although corn is consumed extensively in some locations such as the Sacramento–San Joaquin Delta of California. Maintaining ideal foraging conditions throughout winter and during spring migration provides required resources for molt, migration, and deposition of reserves for breeding. Stable water levels are undesirable, but gradual drawdowns have the potential to increase the vulnerability of invertebrate prey and to make seeds within mud substrates accessible. Furthermore, some good foraging sites should be protected from disturbance by hunters, bird watchers, aircraft, and boaters, as well as from management activities throughout fall and winter.
Breeding
The highest nesting densities occur in open habitats where vegetation is low and sparse. Common plants in these locations include prairie grasses, whitetop, nettle, spike rush, rushes, and buckbrush. Pintails nest in agricultural lands more frequently than other dabblers and readily use pastures, stubble fields, roadsides, hayfields, fallow fields, and the edges or margins around grain fields. In the boreal forest, nesting is concentrated on more open areas with sedge or grass meadows.
Establishment of tall, dense cover is a common practice to provide nesting sites for some dabblers. This practice is less valuable for pintails because they prefer sparser cover for nesting. Grazing programs that leave good residue ground cover but remove robust growth can enhance nesting cover for pintails. Well-conceived farm programs that protect habitats and ephemeral wetlands are especially important for breeding pintails. Because pintails regularly nest in agricultural lands, programs that provide benefits to farmers for delaying haying or for protecting nesting cover surrounding wetlands have the greatest potential to increase pintail recruitment.
Pintails offer a great challenge to waterfowl managers because they associate with many habitats that are used intensively by agricultural interests. Their preference for open areas and small, shallow wetlands in areas with little rainfall and recurring droughts puts a large part of their breeding area in jeopardy regarding consistent conditions. Developing farm programs compatible with pintail life history requirements offers the greatest opportunities for habitat enhancement, and therefore population recoveries by pintails on the prairies. Northern boreal and tundra habitats must be protected from loss or degradation.
Adequate migration and wintering habitats must be protected, restored, and enhanced. This will require continued acquisitions or other means of protection of key habitats and more effective management of public and private wetlands. One of the greatest opportunities to enhance wintering and migration habitats is to identify scenarios that will benefit rice culture and simultaneously provide needed resources for pintails. This adaptable, highly mobile species has a history of responding rapidly to good habitat conditions across the continent. By providing these habitats to pintails, we can assure their survival and abundance in the future.
Suggested Reading
Bellrose, F. C., editor. 1980. Ducks, geese, and swans of North America. 3rd ed. Stackpole Books, Harrisburg, Penn. 540 pp.
Fredrickson, L. H., and F. A. Reid. 1988. Nutritional values of waterfowl foods. U.S. Fish Wildl. Serv., Fish Wildl. Leafl. 13.1.1. 6 pp.
Krapu, G. L., and G. A. Swanson. 1975. Some nutritional aspects of reproduction in prairie nesting pintails. J. Wildl. Manage. 39:156–162.
Miller, M. R. 1986. Northern pintail body condition during wet and dry winters in the Sacramento Valley, California. J. Wildl. Manage. 50:189–198.
Raveling, D. G., and M. E. Heitmeyer. 1989. Relationships of population size and recruitment of pintails to habitat conditions and harvest. J. Wildl. Manage. 53:1088–1103.
Note: Use of trade names does not imply U.S. Government endorsement of commercial products.
Fish and Wildlife Leaflet 13.1.3 •• 1991 7

Appendix. Common and Scientific Names of Plants and Animals Named in Text.
Plants Toothcup or Ammania Ammania coccinea Sticktights Bidens sp. Sedges Carex spp. Redroot flatsedge Cyperus erythrorhizos Chufa flatsedge Cyperus esculentus Hairy crabgrass Digitaria sanguinalis Japanese millet Echinochloa crusgalli Walter’s millet or wild millet Echinochloa walteri Spike rush Eleocharis sp. Swamp timothy Heleochloa schoenoides Barley Hordeum vulgare Rush Juncus sp. Rice cutgrass Leersia oryzoides Sprangletop Leptochloa spp. Rice (cultivated) Oryza sativa Panicum or panic grass Panicum spp. Nodding smartweed or smartweed Polygonum lapathifolium Big-seeded smartweed or Pennsylvania smartweed Polygonum pensylvanicum Pondweeds Potamogeton spp. Curly dock Rumex spp. Bulrush Scirpus sp. Whitetop Scolochloa festucacea Buckbrush or snowberry Symphoricarpos spp. Nettle Urtica spp. Corn or Indian corn Zea mays
Birds Wood duck Aix sponsa Northern pintail Anas acuta Mallard Anas platyrhynchos
Invertebrates (Families) Chironomids Chironomidae Earthworms Lumbricidae
UNITED STATES DEPARTMENT OF THE INTERIOR FISH AND WILDLIFE SERVICE
Fish and Wildlife Leaflet 13 Washington, D.C. •• 1991
8

W A T E R F O W L M A N A G E M E N T H A N D B O O K
13.1.6. Life History and Habitat Needs of the Wood Duck
Katie M. Dugger Gaylord Memorial Laboratory The School of Natural Resources University of Missouri—Columbia Puxico, Missouri 63960
and
Leigh H. Fredrickson Gaylord Memorial Laboratory The School of Natural Resources University of Missouri—Columbia Puxico, Missouri 63960
The wood duck is North America’s most widely distributed endemic species, and most of its wintering and breeding range falls within the 48 contiguous states (Fig. 1). The wood duck inhabits forested wetlands and, because of its need for nest cavities, is closely tied to North America’s remaining forest resources. Habitat destruction, market hunting, and liberal hunting seasons contributed to drastic declines and, in some cases, regional eradication of local wood duck populations. Subsequent implementation of hunting restrictions and the high reproductive rate of the species are responsible for the recovery of wood duck populations to current stable levels.
As prairie duck populations continue to decline, hunting pressure on the wood duck continues to increase. The wood duck is popular with hunters and consistently ranks high among species in Atlantic and Mississippi flyway duck harvests.
Species Profile—Wood Duck
Scientific name: Aix sponsa Weight in pounds (grams): Adults—male 1.5 (682), female 1.5 (673) Immatures—male 1.5 (668), female 1.4 (614) Age at first breeding: 1 year Clutch size: 12, normal range 7−15 Incubation period: 30 days, range 26−37 Age at fledging: 56−70 days Nest sites: Tree cavities or artificial nest boxes
within about 0.6 mi (1 km) of water. Food habits: Omnivorous. Plant foods include
primarily acorns, maple samaras, elm seeds, and moist-soil plant seeds. Animal foods consist mainly of aquatic-associated and nonaquatic insects, but also some aquatic invertebrates.
Harvest pressure and continued degradation of riparian and lowland hardwood forests increases the need for a thorough understanding of wood duck population dynamics. Equally important to sustaining current wood duck population levels is an understanding of annual life cycle events and requirements.
Distribution
Three distinct wood duck populations occur in North America: the Atlantic, Interior, and Pacific. The Atlantic population includes states of the
Fish and Wildlife Leaflet 13.1.6. •• 1992 1

Fig. 1. Current wood duck breeding distribution (after Fredrickson et al. 1990).
Atlantic Flyway and southeastern Canada, the extreme northern range of the wood duck. The Interior population includes wood ducks throughout the Mississippi Flyway, part of Ontario, and the eastern tier of states in the Central Flyway. Historically, the Rocky Mountains and treeless portions of the Great Plains created a discontinuity between the Interior and Pacific populations. As woody riparian corridors developed in the plains, a westward expansion by breeding wood ducks occurred throughout the Great Plains states after the 1960’s (Fig. 1). Currently, northern portions of the Pacific and Interior populations are contiguous. The Pacific population ranges principally from British Columbia southward into Washington, Oregon, California, northwestern Idaho, and western Montana, but small numbers of breeding wood ducks are also present in Nevada, Utah, New Mexico, and Arizona. Wood ducks breed throughout most of their range but are at particularly high breeding densities in the
Mississippi alluvial valley (Fig. 1). Wintering wood ducks use the more southern habitats throughout their range; habitats of greatest importance include California’s Central Valley and the southern states of the Mississippi and Atlantic flyways (Fig. 2).
Population Status and Harvest
Traditional aerial census techniques are ineffective in forested habitats; thus, the current status of wood duck populations can only be approximated.
The average annual wood duck harvest before 1963 was <165,000 birds, but during 1980−1989, an annual average of 1,067,000 wood ducks was harvested in the United States (Frank Bellrose, personal communication). While the dramatic increase in wood duck harvest levels since the 1960’s can be attributed to an overall increase in the continental wood duck population, the interactions between wood duck population
Fig. 2. Wood duck winter distribution (after Bellrose 1980).
2 Fish and Wildlife Leaflet 13.1.6. •• 1992

dynamics and harvest levels is poorly understood. Current research and historic events suggest harvest regulations can have an effect on wood duck populations in some situations. For example, female wood ducks breeding in northern areas are extremely susceptible to hunting during early seasons that open before the onset of migration. In addition, northern birds are subjected to continued harvest pressure as they migrate southward to winter because waterfowl hunting seasons open in succession from north to south.
Spring Migration and Breeding
In southern regions, wood ducks breed and winter in essentially the same areas. Birds that nest farther north begin northward movements in late winter. Wood duck nests are initiated as early as late January in the South, early March in the Midwest, and mid March to early April in the North. Migrating female wood ducks lack the fat and protein reserves necessary for egg production when they arrive on the breeding grounds. Therefore, upon arrival, wood duck pairs disperse into forested and riparian habitats where females forage intensively in preparation for egg laying.
During this time, nesting pairs also begin searching for suitable cavities, primarily in tracts of forest adjacent to important waterways. Although natural cavities within 0.3 mile (0.5 km) of water and near forest canopy openings are preferred, wood ducks will nest ≥0.6 mile (1 km)
from water when necessary. The availability of suitable cavities varies within the wood duck’s range (Table 1) because some tree species develop cavities more readily than others. Large trees, ≥12 inches (30 cm) dbh (diameter breast height), produce the most important cavities for wood ducks. Cavities with an entrance size of ≥3.5 inches (8.9 cm), an interior basal area of ≥40 square inches (258 cm2), and height ≥6 feet (2 m) above the ground are preferred for nesting.
Average clutch size is 12 eggs, but more than one female may contribute to a clutch (dump nest), which can result in clutches of more than 60 eggs. These huge clutches are rarely incubated, but successful dump nests of less than 30 eggs are common in nest boxes. A wood duck clutch is incubated for an average of 30 days at middle latitudes and a few days less in the South.
Female wood ducks and their broods are highly mobile. Initial movements by broods after leaving a nest can be up to 2.4 miles (4 km) but average 0.8 mile (1.3 km), mostly along waterways. Shallowly flooded habitat with good understory cover, such as shrub−scrub or emergent vegetation, is the most important habitat for wood duck broods. Duckling survival ranges from 36 to 65% with most mortality (86−91%) occurring the first week after hatching. Common duckling predators include mink, raccoon, snapping turtle, bullfrog, largemouth bass, and other large predatory fishes.
The bond between the female and her brood begins to weaken after about 4 weeks; ducklings fledge between 6 and 8 weeks. Some early-nesting
Table 1. Nest cavity density in some North American tree species.
Cavity density Location Species Number/acre Number/hectare
Southeastern Missouri Blackgum, green ash, pumpkin ash, red maple 0.13 0.33
Illinois Black oak, bitternut hickory, mockernut hickory, 0.21 0.51 blackjack oak, red oak, American elm, hackberry
Massachusetts Apple, ash, maple — —
New Brunswick Silver maple, American elm 2.23 5.50
Indiana American beech, American sycamore, red maple 0.50 1.23
Minnesota Quaking aspen, American elm, sugar maple, basswood 1.70 4.20
Wisconsin Silver maple, sugar maple, basswood, quaking aspen 0.26 0.65
Mississippi American sycamore, American beech, blackgum, 0.08 0.19 shagbark hickory, water oak, cherrybark oak
Overcup oak, slippery elm, sugarberry 0.09 0.23
Fish and Wildlife Leaflet 13.1.6. •• 1992 3

females in southern latitudes renest, successfully producing two broods before finishing the Prebasic molt (Table 2). Females begin the Prebasic molt in early spring, but it is interrupted during nesting and is not completed until late summer (Fig. 3), when the females regain their flight feathers. Conversely, males may acquire their eclipse plumage as early as mid-May. After the female begins incubation, the male wood duck begins the Prebasic molt and becomes flightless about 3 weeks later. After regaining flight (in about 22 days), the male begins the Prealternate molt and returns to Alternate plumage by late summer.
Post-breeding Dispersal and Fall Migration
After completing the Prebasic molt and before southward migration begins, adult and immature males, as well as some immature females, disperse radially from their breeding and natal areas into new habitats. At southern latitudes, this dispersal tends to be lateral, but in central and northern regions, northward dispersal is most common. In late September, wood ducks begin migrating south. During peak migration in October and November, wood duck numbers fluctuate erratically at migration stopovers where they form large roosting flocks (>100 birds). On the wintering grounds, smaller groups (<30 birds) are more common.
Behavior and Pairing
Wood ducks begin courting before fall migration. Courting activity drops off during harsh weather in winter and resumes in spring. Courtship activity is more intense in fall than in spring; courting parties are larger and displays are longer and more frequent. Wood ducks breed as yearlings, but evidence suggests that only about 40% of the surviving yearling females nest each season. Yearling females produce smaller clutches and fledge fewer young than experienced nesters. The productivity of young male wood ducks may also be low. When compared with adult drakes, yearling males do not perform courtship displays with the proper orientation and timing. Thus, early pairing by inexperienced males is unlikely.
Table 2. Length of breeding season and frequency of double brooding in wood ducks.
Mean length Double- Mean interval of breeding Captured brooding between
season females females clutches Location (days) (n) (%) (days)
Alabama 159 231 9.2 37 South Carolina 157 275 7.6 47 California 134 1,540 3.6 26 ± 1.7 Missouri 132 924 2.2 33 ± 1.8 Massachusetts 95 — — —
Foraging Ecology
Food habits of adult wood ducks are sex related and seasonally driven (Fig. 4). During winter, nearly 100% of the diet of wood ducks consists of plant foods, of which 75% may be acorns. An increase in animal foods in the diet (to about 35%) occurs in both sexes in early spring. This percentage remains constant for the male wood duck through summer and fall while undergoing the Prebasic and Prealternate molts, but increases to about 80% for the female during egg laying. Female wood ducks increase the amount of invertebrates in the diet to meet daily protein needs during egg laying. After egg-laying, animal foods compose less of the female’s diet, while consumption of high-energy seeds increases to meet the daily dietary requirements of incubation (Fig. 4).
Wood ducks consume a variety of plant and animal foods (see Appendix), typically by pecking or dabbling at foods on the surface. Subsurface and bottom feeding are rare. Therefore, shallow depths are important to make food available to foraging wood ducks. Because wood ducks feed mainly on the surface or at the edge of wetlands, nonaquatic and aquatic-associated invertebrates make up a large percentage of the invertebrates consumed. Live-forest and emergent vegetation are common wood duck foraging habitats. Wood ducks do not forage readily in agricultural fields unless shallowly flooded, live-forest habitats are not available.
Habitat Management
The wood duck carries out its entire annual cycle within a forested wetland complex, including a mixture of habitats such as live forest, greentree
4 Fish and Wildlife Leaflet 13.1.6. •• 1992

reservoirs, rivers, oxbows, riparian corridors, beaver ponds, shrub−scrub, and robust emergent vegetation. Such habitats have been destroyed or modified across the continent. For example, only 17% of the original forest acreage remains in the Mississippi alluvial valley today. In addition, certain management practices have detrimental effects on tree vigor and mast production. Flooding before fall senescence or beyond dormancy into the growing season reduces mast production, causes
Fig. 3. The chronology of important life history events in the annual cycle of the wood duck.
tree damage, and may eventually kill trees. Improper flooding regimes change tree species composition in a stand from desirable oak species that produce small acorns, easily eaten by waterfowl, to the more water-tolerant overcup oak, which produces very large acorns that are unsuitable for waterfowl food. Water depths ≤8 inches (20 cm) are ideal for foraging wood ducks, while loafing and roosting sites can be maintained where water levels are higher.
Fig. 4. Proportion of plant (open) and animal (dark) foods consumed by wood ducks throughout their annual cycle.
Fish and Wildlife Leaflet 13.1.6. •• 1992 5

Timber management within greentree reservoirs and naturally flooded forests is an important component of habitat management for wood ducks. Most timber harvest practices remove large, overmature trees, the primary source of wood duck nest cavities. Although selective thinning within a stand promotes regeneration of desirable shade-intolerant red oak species, some large and overmature trees should be preserved as potential wood duck nest sites. In addition, a mix of species within a stand should be encouraged because desirable mast species may not form cavities. Elm and maple are important components of most wood duck habitat because they provide protein-rich samaras in spring and suitable nest cavities (Table 1).
Nest boxes are a useful management tool where natural cavities are scarce but good brood habitat is available. Currently, nest box management may contribute approximately 150,000 juvenile wood ducks to fall flights in the Mississippi and Atlantic flyways. Although this constitutes only a small portion of the juvenile component in the eastern fall flight, nest boxes, when properly erected and maintained, can substantially increase local populations.
Wood ducks will readily nest in boxes constructed of wood, metal, or plastic. Rough-cut cypress boxes are durable, economical, and blend well with the environment within a few years. Although plastic and metal boxes are durable, internal temperatures of boxes placed in the direct sun in the South are high enough to kill developing embryos.
Whatever the construction material, boxes must be predator-proof. Inverted conical shields or smooth, wide pieces of metal wrapped around the pole or tree beneath a box can keep raccoons and some snakes from entering boxes. Predation can also be discouraged by placing boxes on poles over water or by mounting boxes on bent metal brackets that suspend them 2 feet (0.6 m) from a tree or post.
Annual maintenance and repair of boxes is necessary for continued use by wood ducks. Boxes with unsuccessful nests are unavailable for use until debris from the nest is removed. The frequency of box checks necessary for maintenance depends on climatic conditions and the types of use boxes receive during winter (e.g., screech-owl roosts, squirrel or raccoon dens).
Number and placement patterns of nest boxes within habitats influence box use, nest success,
and dump-nesting rates. When box management began 50 years ago, some local wood duck populations were small, and box use was higher when boxes were placed in highly visible, clumped arrangements rather than as widely spaced single units. As wood duck populations grew, high dump-nesting rates, nesting interference, and overall decreases in production occurred. In some situations, single, well-spaced boxes may decrease dump-nesting and nesting interference; however, in prime wood duck breeding habitats hidden boxes simply require more effort to maintain. Boxes acceptable to nesting wood ducks must also be accessible to managers for maintenance and data collection. Although wood duck boxes can increase local production, the preservation of bottomland hardwoods and proper water and timber management in these habitats are paramount to the continued success of continental wood duck populations.
Summary
Although current wood duck populations are stable, continued preservation and proper management of bottomland hardwood and riparian forest resources are imperative. Wood duck population estimates are inaccurate; hence, managers have little knowledge about population cycles or the effect of increased hunting pressure on the continental population. Moreover, protecting North America’s remaining forest resources in the face of increasing agricultural and commercial development remains difficult. In particular, forest resources in the lower Mississippi alluvial valley must be carefully preserved and managed to continue providing wintering habitat for a large percentage of the continental wood duck and mallard populations.
At the local level, wood duck populations can be boosted by production from nest boxes, but more information is needed on the density-dependent effects of box placement on nesting interference. Nest box maintenance can be expensive and time consuming. Thus, management for natural cavities should be encouraged. Flooding of greentree reservoirs should simulate natural hydrology and reflect wood duck water depth needs. Remaining forested habitats should be protected and maintained in the best possible condition to sustain larger numbers of birds throughout their annual cycle as high quality habitat continues to disappear.
Fish and Wildlife Leaflet 13.1.6. •• 1992 6

Suggested Reading
Bellrose, F. C. 1980. Ducks, geese and swans of North America. Third ed. Stackpole Books, Harrisburg, Penn. 540 pp.
Delnicke, D., and K. J. Reinecke. 1986. Mid-winter food use and body weights of mallards and wood ducks in Mississippi. Journal of Wildlife Management 50:43−51.
Fredrickson, L. H., G. V. Burger, S. P. Havera, D. A. Graber, R. E. Kirby, and T. S. Taylor, editors. 1990.
Proceedings of the 1988 North American Wood Duck Symposium, St. Louis, Mo. 390 pp.
Grice, D., and J. P. Rogers. 1965. The wood duck in Massachusetts. Massachusetts Division of Fish and Game, Final Report Federal Aid in Wildlife Restoration Project W-19-R. 96 pp.
Trefethen, J. B., editor. 1966. Wood duck management and research: a symposium. Wildlife Management Institute, Washington, D.C. 212 pp.
Appendix. Common and Scientific Names of Plants and Animals Named in Text.
Plants Red maple . . . . . . . . . . . . . . . . . . . . . . . . . . . . . . . . . . . . . . . . . . . . . . . . . . . . . Acer rubrum Silver maple . . . . . . . . . . . . . . . . . . . . . . . . . . . . . . . . . . . . . . . . . . . . . . . . . Acer saccharinum Sugar maple . . . . . . . . . . . . . . . . . . . . . . . . . . . . . . . . . . . . . . . . . . . . . . . . . . Acer saccharum
*Maple . . . . . . . . . . . . . . . . . . . . . . . . . . . . . . . . . . . . . . . . . . . . . . . . . . . . . . . . Acer spp. *Asiatic dayflower . . . . . . . . . . . . . . . . . . . . . . . . . . . . . . . . . . . . . . . . . . . . . . Aneilema keisak *Beggarticks . . . . . . . . . . . . . . . . . . . . . . . . . . . . . . . . . . . . . . . . . . . . . . . . . . . . Bidens spp. *Watershield . . . . . . . . . . . . . . . . . . . . . . . . . . . . . . . . . . . . . . . . . . . . . . . . Brassenia schreberi Bitternut hickory . . . . . . . . . . . . . . . . . . . . . . . . . . . . . . . . . . . . . . . . . . . . . . Carya cordiformis Shagbark hickory . . . . . . . . . . . . . . . . . . . . . . . . . . . . . . . . . . . . . . . . . . . . . . . . . Carya ovata Mockernut hickory . . . . . . . . . . . . . . . . . . . . . . . . . . . . . . . . . . . . . . . . . . . . . Carya tomentosa Sugarberry . . . . . . . . . . . . . . . . . . . . . . . . . . . . . . . . . . . . . . . . . . . . . . . . . . Celtis laevigata Hackberry . . . . . . . . . . . . . . . . . . . . . . . . . . . . . . . . . . . . . . . . . . . . . . . . . . Celtis occidentalis
*Buttonbush . . . . . . . . . . . . . . . . . . . . . . . . . . . . . . . . . . . . . . . . . . . . Cephalanthus occidentalis *Barnyard grass . . . . . . . . . . . . . . . . . . . . . . . . . . . . . . . . . . . . . . . . . . . . Echinochloa crusgalli *Barnyard grass . . . . . . . . . . . . . . . . . . . . . . . . . . . . . . . . . . . . . . . . . . . . Echinochloa muricata American beech . . . . . . . . . . . . . . . . . . . . . . . . . . . . . . . . . . . . . . . . . . . . . . . Fagus grandifolia Green ash . . . . . . . . . . . . . . . . . . . . . . . . . . . . . . . . . . . . . . . . . . . . . . Fraxinus pennsylvanica
*Ash . . . . . . . . . . . . . . . . . . . . . . . . . . . . . . . . . . . . . . . . . . . . . . . . . . . . . . . . Fraxinus spp. Pumpkin ash . . . . . . . . . . . . . . . . . . . . . . . . . . . . . . . . . . . . . . . . . . . . . . . Fraxinus tomentosa
*Soybeans . . . . . . . . . . . . . . . . . . . . . . . . . . . . . . . . . . . . . . . . . . . . . . . . . . . . . . Glycine max *St. John’s-wort . . . . . . . . . . . . . . . . . . . . . . . . . . . . . . . . . . . . . . . . . . . . . . Hypericum walteri *Rice cutgrass . . . . . . . . . . . . . . . . . . . . . . . . . . . . . . . . . . . . . . . . . . . . . . . . Leersia oryzoides *Sweetgum . . . . . . . . . . . . . . . . . . . . . . . . . . . . . . . . . . . . . . . . . . . . . Liquidambar stryraciflua *Primrose willow . . . . . . . . . . . . . . . . . . . . . . . . . . . . . . . . . . . . . . . . . . . . . Ludwigia leptocarpa *Water milfoil . . . . . . . . . . . . . . . . . . . . . . . . . . . . . . . . . . . . . . . . . . . . . Myriophyllum pinnatum *White waterlily . . . . . . . . . . . . . . . . . . . . . . . . . . . . . . . . . . . . . . . . . . . . . . Nymphaea odorata Blackgum . . . . . . . . . . . . . . . . . . . . . . . . . . . . . . . . . . . . . . . . . . . . . . . . . . . Nyssa sylvatica
*Panic grasses . . . . . . . . . . . . . . . . . . . . . . . . . . . . . . . . . . . . . . . . . . . . . . . . . . Panicum spp. *Floating paspalum . . . . . . . . . . . . . . . . . . . . . . . . . . . . . . . . . . . . . . . . . . . . Paspalum fruitans American sycamore . . . . . . . . . . . . . . . . . . . . . . . . . . . . . . . . . . . . . . . . . . . Platanus occidentalis
*Smartweeds . . . . . . . . . . . . . . . . . . . . . . . . . . . . . . . . . . . . . . . . . . . . . . . . . . Polygonum spp. Quaking aspen . . . . . . . . . . . . . . . . . . . . . . . . . . . . . . . . . . . . . . . . . . . . . Populus tremuloides
*Pondweeds . . . . . . . . . . . . . . . . . . . . . . . . . . . . . . . . . . . . . . . . . . . . . . . . . . Potamogeton spp. Apple . . . . . . . . . . . . . . . . . . . . . . . . . . . . . . . . . . . . . . . . . . . . . . . . . . . . . . . . Pyrus malus Cherrybark oak . . . . . . . . . . . . . . . . . . . . . . . . . . . . . . . . . . . . . . . . . . . . . . . . Quercus falcata Overcup oak . . . . . . . . . . . . . . . . . . . . . . . . . . . . . . . . . . . . . . . . . . . . . . . . . . Quercus lyrata Blackjack oak . . . . . . . . . . . . . . . . . . . . . . . . . . . . . . . . . . . . . . . . . . . . . . Quercus marilandica
*Water oak . . . . . . . . . . . . . . . . . . . . . . . . . . . . . . . . . . . . . . . . . . . . . . . . . . . . Quercus nigra *Nuttall oak . . . . . . . . . . . . . . . . . . . . . . . . . . . . . . . . . . . . . . . . . . . . . . . . . Quercus nuttallii *Pin oak . . . . . . . . . . . . . . . . . . . . . . . . . . . . . . . . . . . . . . . . . . . . . . . . . . . . Quercus palustris *Willow oak . . . . . . . . . . . . . . . . . . . . . . . . . . . . . . . . . . . . . . . . . . . . . . . . . . . Quercus phellos Red oak . . . . . . . . . . . . . . . . . . . . . . . . . . . . . . . . . . . . . . . . . . . . . . . . . . . . Quercus rubra
*Post oak . . . . . . . . . . . . . . . . . . . . . . . . . . . . . . . . . . . . . . . . . . . . . . . . . . . . Quercus stellata Oak . . . . . . . . . . . . . . . . . . . . . . . . . . . . . . . . . . . . . . . . . . . . . . . . . . . . . . . . Quercus spp.
Fish and Wildlife Leaflet 13.1.6. •• 1992 7

Black oak . . . . . . . . . . . . . . . . . . . . . . . . . . . . . . . . . . . . . . . . . . . . . . . . . . . Quercus velutina *Blackberry . . . . . . . . . . . . . . . . . . . . . . . . . . . . . . . . . . . . . . . . . . . . . . . . . Rubus cuneifolius *Sassafras . . . . . . . . . . . . . . . . . . . . . . . . . . . . . . . . . . . . . . . . . . . . . . . . . . Sassafras albidum *Slough grass . . . . . . . . . . . . . . . . . . . . . . . . . . . . . . . . . . . . . . . . . . . . . . . . Sclera reticularis *Big duckweed . . . . . . . . . . . . . . . . . . . . . . . . . . . . . . . . . . . . . . . . . . . . . . . Spirodela polyrrhiza *Baldcypress . . . . . . . . . . . . . . . . . . . . . . . . . . . . . . . . . . . . . . . . . . . . . . . . Taxodium distichum Basswood . . . . . . . . . . . . . . . . . . . . . . . . . . . . . . . . . . . . . . . . . . . . . . . . . . . Tilia americana American elm . . . . . . . . . . . . . . . . . . . . . . . . . . . . . . . . . . . . . . . . . . . . . . . Ulmus americana Slippery elm . . . . . . . . . . . . . . . . . . . . . . . . . . . . . . . . . . . . . . . . . . . . . . . . . . . Ulmus rubra Elm . . . . . . . . . . . . . . . . . . . . . . . . . . . . . . . . . . . . . . . . . . . . . . . . . . . . . . . . . Ulmus spp. Black haw . . . . . . . . . . . . . . . . . . . . . . . . . . . . . . . . . . . . . . . . . . . . . . . Viburnum prunifolium Grapes . . . . . . . . . . . . . . . . . . . . . . . . . . . . . . . . . . . . . . . . . . . . . . . . . . . . . . . . Vitus spp.
Vertebrates Wood duck . . . . . . . . . . . . . . . . . . . . . . . . . . . . . . . . . . . . . . . . . . . . . . . . . . . . . Aix sponsa Mallard . . . . . . . . . . . . . . . . . . . . . . . . . . . . . . . . . . . . . . . . . . . . . . . . . . Anas platyrhynchos Snapping turtle . . . . . . . . . . . . . . . . . . . . . . . . . . . . . . . . . . . . . . . . . . . . . Chelydra serpentina Largemouth bass . . . . . . . . . . . . . . . . . . . . . . . . . . . . . . . . . . . . . . . . . . . . Micropterus salmoides Mink . . . . . . . . . . . . . . . . . . . . . . . . . . . . . . . . . . . . . . . . . . . . . . . . . . . . . . . Mustela vison Screech-owl . . . . . . . . . . . . . . . . . . . . . . . . . . . . . . . . . . . . . . . . . . . . . . . . . . . . . . Otus spp. Raccoon . . . . . . . . . . . . . . . . . . . . . . . . . . . . . . . . . . . . . . . . . . . . . . . . . . . . . . Procyon lotor Bullfrog . . . . . . . . . . . . . . . . . . . . . . . . . . . . . . . . . . . . . . . . . . . . . . . . . . . Rana catesbeiana
Invertebrate taxa *Spiders . . . . . . . . . . . . . . . . . . . . . . . . . . . . . . . . . . . . . . . . . . . . . . . . . . . . . . . . Araneida *Crayfish . . . . . . . . . . . . . . . . . . . . . . . . . . . . . . . . . . . . . . . . . . . . . . . . . . . . . . . Astacidae *Midges . . . . . . . . . . . . . . . . . . . . . . . . . . . . . . . . . . . . . . . . . . . . . . . . . . . . . . Chironomidae *Water boatmen . . . . . . . . . . . . . . . . . . . . . . . . . . . . . . . . . . . . . . . . . . . . . . . . . . . . Corixidae *Scuds . . . . . . . . . . . . . . . . . . . . . . . . . . . . . . . . . . . . . . . . . . . . . . . . . . . . . . Gammarus sp. *Whirligig beetles . . . . . . . . . . . . . . . . . . . . . . . . . . . . . . . . . . . . . . . . . . . . . . . . . . . Gyrinidae *Sowbugs . . . . . . . . . . . . . . . . . . . . . . . . . . . . . . . . . . . . . . . . . . . . . . . . . . . . . . . . Isopoda *Back swimmers . . . . . . . . . . . . . . . . . . . . . . . . . . . . . . . . . . . . . . . . . . . . . . . . . Notonectidae *Damselflies . . . . . . . . . . . . . . . . . . . . . . . . . . . . . . . . . . . . . . . . . . . . . . . . . . . . . . Odonata *Dragonflies . . . . . . . . . . . . . . . . . . . . . . . . . . . . . . . . . . . . . . . . . . . . . . . . . . . . . . Odonata *Orb snails . . . . . . . . . . . . . . . . . . . . . . . . . . . . . . . . . . . . . . . . . . . . . . . . . . . . . Planorbis sp. *Caddis flies . . . . . . . . . . . . . . . . . . . . . . . . . . . . . . . . . . . . . . . . . . . . . . . . . . . . . Trichoptera
*Common wood duck foods.
Note: Use of trade names does not imply U.S. Government endorsement of commercial products.
UNITED STATES DEPARTMENT OF THE INTERIOR FISH AND WILDLIFE SERVICE
Fish and Wildlife Leaflet 13 Washington, D.C. •• 1992
8

WAT E R F O W L M A N A G E M E N T H A N D B O O K
�������������������������������
���������������������������
��������������������������������
13.1.8. Life History and Management of the Blue-winged Teal
James H. Gammonley Colorado Division of Wildlife 317 W. Prospect Road Fort Collins, CO 80526
and
Leigh H. Fredrickson Gaylord Memorial Laboratory The School of Natural Resources University of Missouri-Columbia Puxico, MO 63960
The blue-winged teal is a small dabbling duck that is common in North America and northern South America. The species is highly mobile and has an opportunistic life history strategy. Breeding populations respond to variable wetland conditions in the drought-prone prairie regions of the north-central United States and southern Canada. Extensive habitat loss and degradation has occurred on the prairies and on neotropical wintering areas in recent decades. Renewed interest in the ecology and management of blue-winged teal has resulted from these environmental pressures. We review life history characteristics of blue-winged teal that are important to managers. Readers should consult Bennett (1938) and Bellrose (1980) for general references on the biology of blue-winged teal.
Species Profile—Blue-winged Teal
Scientific Name: Anas discors Weight in pounds (grams):
Adults—male 1.0 (454), female 0.9 (410) Immatures—male 1.0 (454), female 0.9 (410)
Age at first breeding: 1 year Clutch size: 10, range 6 to 15 Incubation period: 23 days Age at fledging: 35−44 days Nest sites: Herbaceous vegetation, primarily
grasses and sedge meadows, at variable distances from water up to 1 mile (1.6 km)
Food habits: Omnivorous; plant foods include vegetative parts of duckweeds, coontail, muskgrass and pondweeds, and seeds of bulrushes, sedges, spikerushes, water lilies, and grasses. Animal foods predominate in diet during breeding and include snails, aquatic insects, fairy shrimp, and crustaceans
Distribution Blue-winged teal concentrate breeding in the
Prairie Pothole Region (PPR) of the north-central United States and southern Canada (Fig. 1). Breeding pairs are especially abundant in mixed-prairie grasslands of North and South Dakota and southern Canada, and highest densities occur in southwestern Manitoba. The proportion of blue-winged teal breeding in the PPR
Waterfowl Management Handbook 13.1.8. •• 1995 1

Fig. 1. Breeding, wintering, and migration areas for blue-winged teal.
is correlated with annual numbers of ponds in May. Blue-winged teal are also common in parts of the northeastern United States and the Great Lakes region. Few blue-winged teal nest in northern boreal forest or arctic habitats, although some birds are displaced to these areas when drought conditions occur in the PPR. Significant breeding populations also occur in Kansas and Nebraska, and blue-winged teal regularly breed along the Gulf Coast of the United States. Blue-winged teal are largely replaced by the cinnamon teal in the Great Basin and western intermountain regions, but small breeding populations are present.
Blue-winged teal winter farther south than other ducks that breed in North America. Major wintering concentrations occur along the Gulf Coast of Mexico and in Caribbean coastal areas of Venezuela, Colombia, and Guyana (Fig. 1). In these areas, blue-winged teal occupy coastal lagoons and lowland marshes, as well as large interior wetland systems. In recent decades, large numbers of
blue-winged teal have wintered along the Gulf Coast of the United States.
Spring Migration and Breeding
Blue-winged teal are one of the last species of ducks to arrive on northern breeding areas. Those wintering in South America begin moving north through Mexico in January, but the majority of spring migrants does not arrive on prairie breeding areas until late April or May (Fig. 2). Courtship occurs on wintering areas and continues during spring migration, and most blue-winged teal are paired before arrival at the nesting location. Nest initiation begins shortly after arrival; peak nesting usually occurs in late May in the United States and in early June in Canada. Most yearling females nest.
Blue-winged teal have low rates of breeding philopatry when compared with other dabbling ducks. Females change breeding sites from year to year in response to changes in wetland conditions. When habitat conditions in the PPR are unfavorable, large portions of the breeding population may occupy other parts of the breeding range. Males defend discrete breeding territories, usually consisting of one or two small ponds within the home range. Breeding pairs prefer shallowly flooded temporary and seasonal wetlands, and pair densities are correlated with densities of flooded wetland basins. In years when temporary and seasonal wetlands are dry, gently sloping semipermanent basins that provide shallow water are important.
Typically, nests are located in upland grasses or wet meadow sedges. Nest cover is provided by matted residual herbacous vegetation. Nests usually are located near water, but may be as far as 1 mile (1.6 km) from the nearest wetland. Cereal grain and forage production and livestock grazing limit available nesting cover throughout the prairie region, although alfalfa and bluegrass in cultivated or grazed areas can provide suitable nesting cover. Blue-winged teal seem to prefer to nest in native grass communities in good range condition. Success of breeding pairs is higher in native plant communities than in exotic vegetation communities.
Clutch size ranges from 6 to 15 eggs, and averages 10. Females incubate for 23 days. As with most upland-nesting ducks in the PPR, large numbers of nests are lost to mammalian and avian predators. Nests in hay fields (e.g., alfalfa) often are destroyed during harvest. Females commonly
Waterfowl Management Handbook 13.1.8. •• 1995 2

renest if nest loss occurs early in laying, but hens that lose clutches during incubation are less likely to renest. Renesting, even by hens losing clutches late in incubation, is more likely to occur when wetland conditions are good.
Semipermanent wetlands located near nests are important habitats for broods. Stock ponds with well-developed emergent vegetation provide locally important brood habitat. Seasonal wetlands also provide excellent brood habitat, but because blue-winged teal are relatively late nesters, seasonal wetlands are often unavailable when ducklings leave nests. Females lead newly hatched ducklings overland to wetlands with suitable brood habitat. Broods are more active and more easily observed in early morning and late afternoon. Most duckling mortality occurs within the first 14 days after hatch. Young are able to fly at 35−44 days of age.
Postbreeding Dispersal and Fall Migration
Males leave breeding territories 2 to 3 weeks after incubation begins to molt (Fig. 2). Males form groups on some breeding areas during molt, or congregate in large flocks of hundreds or thousands on large marshes away from areas used during
Fig. 2. Important life history events in the annual cycle of the blue-winged teal.
breeding. Males remain flightless for 26−36 days, feed at night, and conceal themselves in wetland vegetation during the day. Females begin wing molt after young are fledged, although some females may initiate molt in late stages of brood-rearing.
Blue-winged teal begin fall migration earlier than most other duck species. Upon regaining flight in mid- to late August, males begin moving southward in small groups. Males begin the prealternate molt in early fall, but often lack their characteristic white facial crescent during migration (Fig. 2). Successfully breeding females migrate after most males, and by late September migrating flocks are comprised primarily of adult females and immatures (Fig. 2). Most migrant blue-winged teal arrive at wintering areas along the U.S. Gulf Coast by late summer. Large numbers move through Mexico in August, and most continue on to wintering areas in Central and South America.
Winter
As on breeding areas, winter distribution is variable in response to habitat conditions. Standardized counts of wintering populations in Central and South America are lacking. In some
Waterfowl Management Handbook 13.1.8. •• 1995 3
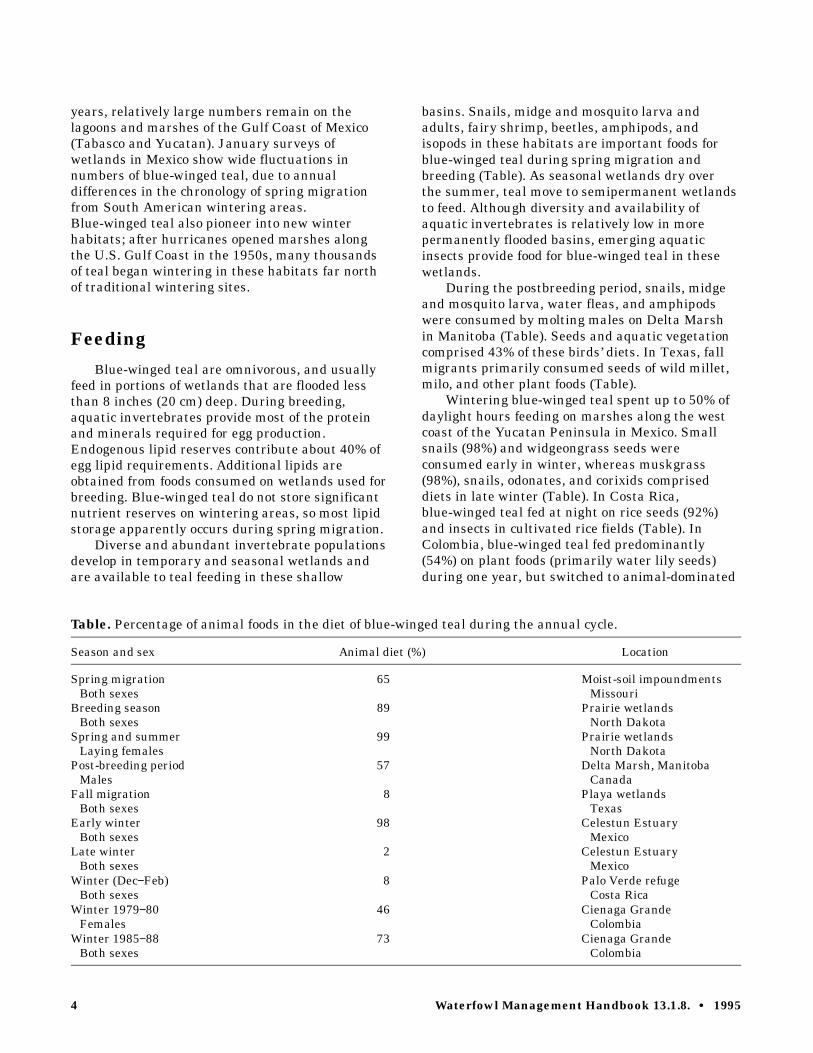
years, relatively large numbers remain on the lagoons and marshes of the Gulf Coast of Mexico (Tabasco and Yucatan). January surveys of wetlands in Mexico show wide fluctuations in numbers of blue-winged teal, due to annual differences in the chronology of spring migration from South American wintering areas. Blue-winged teal also pioneer into new winter habitats; after hurricanes opened marshes along the U.S. Gulf Coast in the 1950s, many thousands of teal began wintering in these habitats far north of traditional wintering sites.
Feeding
Blue-winged teal are omnivorous, and usually feed in portions of wetlands that are flooded less than 8 inches (20 cm) deep. During breeding, aquatic invertebrates provide most of the protein and minerals required for egg production. Endogenous lipid reserves contribute about 40% of egg lipid requirements. Additional lipids are obtained from foods consumed on wetlands used for breeding. Blue-winged teal do not store significant nutrient reserves on wintering areas, so most lipid storage apparently occurs during spring migration.
Diverse and abundant invertebrate populations develop in temporary and seasonal wetlands and are available to teal feeding in these shallow
basins. Snails, midge and mosquito larva and adults, fairy shrimp, beetles, amphipods, and isopods in these habitats are important foods for blue-winged teal during spring migration and breeding (Table). As seasonal wetlands dry over the summer, teal move to semipermanent wetlands to feed. Although diversity and availability of aquatic invertebrates is relatively low in more permanently flooded basins, emerging aquatic insects provide food for blue-winged teal in these wetlands.
During the postbreeding period, snails, midge and mosquito larva, water fleas, and amphipods were consumed by molting males on Delta Marsh in Manitoba (Table). Seeds and aquatic vegetation comprised 43% of these birds’ diets. In Texas, fall migrants primarily consumed seeds of wild millet, milo, and other plant foods (Table).
Wintering blue-winged teal spent up to 50% of daylight hours feeding on marshes along the west coast of the Yucatan Peninsula in Mexico. Small snails (98%) and widgeongrass seeds were consumed early in winter, whereas muskgrass (98%), snails, odonates, and corixids comprised diets in late winter (Table). In Costa Rica, blue-winged teal fed at night on rice seeds (92%) and insects in cultivated rice fields (Table). In Colombia, blue-winged teal fed predominantly (54%) on plant foods (primarily water lily seeds) during one year, but switched to animal-dominated
Table. Percentage of animal foods in the diet of blue-winged teal during the annual cycle.
Season and sex Animal diet (%) Location
Spring migration 65 Moist-soil impoundments Both sexes Missouri Breeding season 89 Prairie wetlands Both sexes North Dakota Spring and summer 99 Prairie wetlands Laying females North Dakota Post-breeding period 57 Delta Marsh, Manitoba Males Canada Fall migration 8 Playa wetlands Both sexes Texas Early winter 98 Celestun Estuary Both sexes Mexico Late winter 2 Celestun Estuary Both sexes Mexico Winter (Dec−Feb) 8 Palo Verde refuge Both sexes Costa Rica Winter 1979−80 46 Cienaga Grande Females Colombia Winter 1985−88 73 Cienaga Grande Both sexes Colombia
4 Waterfowl Management Handbook 13.1.8. •• 1995

diets (snails, corixids, and insects) in years when water salinity increased (Table).
Population Status and Harvest Management
The target population for blue-winged teal in the North American Waterfowl Management Plan is 5,300,000 birds. Breeding population estimates have averaged 4,138,000 since 1955, ranging from 5,829,000 in 1975 to 2,776,000 in 1990 (Fig.3). These estimates are subject to considerable bias and error, however. Annual surveys are conducted in May to coincide with the peak of mallard nesting, and in some years many blue-winged teal do not arrive on surveyed areas until after counts are conducted. Furthermore, significant proportions of the blue-winged teal breeding population may occupy locations outside the surveyed area, particularly in years when habitat conditions are poor in the PPR (e.g., the 1980s).
Based on annual breeding ground estimates, blue-winged teal comprise over 14% of the continental duck population. This species is lightly hunted, averaging less than 6% of the total annual duck harvest in the United States. Because blue-winged teal migrate earlier in fall than most other North American ducks, special harvest regulations have been used in some years since the 1960s to increase hunting opportunities for teal. September teal-only seasons of up to 9 days and bonus blue-winged teal bag limits have been used in some states in the Central, Mississippi, and Atlantic flyways. When offered, the teal harvest in September has averaged 201,991 birds, or 32% of
the total blue-winged teal harvested in the United States. Most blue-winged teal are harvested in the Mississippi (61%) and Central (21%) flyways during the combined September and regular seasons. September teal seasons were suspended in 1988, but were reinstated in many states in 1992.
Harvest rates south of the United States are less well-documented. Through 1980, 21% of all reported recoveries of leg-bands from blue-winged teal were from south of the United States. Most (37%) of these recoveries were from South America, followed by Mexico (28%), the Caribbean (25%), and Central America (10%). Many bands recovered in the neotropics may go unreported, however, complicating the use of banding data to determine blue-winged teal distribution and harvest.
Relatively low harvest and band recovery rates have also limited estimates of annual survival for blue-winged teal. Available estimates are similar to but slightly lower than those reported for other dabbling ducks: adult females—0.52, adult males—0.59, juvenile females—0.32, juvenile males—0.44. Females are more vulnerable to predators than males during nesting, but do not seem to suffer significantly greater mortality than females of other dabbling duck species. Factors affecting survival rates in winter are not well known.
Habitat Management
Blue-winged teal exploit a diversity of wetland habitats to meet their nutritional and behavioral requirements during the annual cycle. During spring migration and nesting, pairs find an
Fig. 3. Estimates of the continental breeding population (millions of birds) of blue-winged teal, 1955−1994.
Waterfowl Management Handbook 13.1.8. •• 1995 5

abundance of aquatic invertebrates in highly productive temporary and seasonally flooded wetlands. Semipermanent wetlands with gently sloping basins and both emergent and submergent vegetation provide foraging and brood-rearing sites, and are very important in dry years on the drought-prone prairies. High densities of these wetland types in areas with high-quality nesting cover allow teal to establish nesting territories and avoid long overland brood movements. Restoration of temporary and seasonal wetlands is particularly needed in agricultural landscapes.
Breeding success of blue-winged teal is enhanced when extensive areas of suitable upland nesting cover are available near wetlands used by pairs and broods. In native prairie grass communities, dead vegetation should accumulate over several growing seasons to provide matted mulch used for nest sites. Periodic disturbance is required to keep grass cover from becoming too dense. Burning, mowing, and grazing can be used effectively to maintain range condition for blue-winged teal nesting. Optimal intervals between grassland disturbance are dependent upon local conditions. When possible, grassland disturbance should be performed after the peak hatching period of blue-winged teal. Seeded dense nesting cover used by mallards and gadwalls seems to be less attractive to blue-winged teal.
The high mobility and low breeding philopatry of blue-winged teal are important to the development and evaluation of management strategies for breeding populations. Breeding pairs may select home ranges opportunistically in response to wetland conditions encountered during spring moves. Use by blue-winged teal of areas that have undergone intensive habitat management may depend largely upon habitat quality in the surrounding regional landscape.
Development of partnerships by agencies in numerous countries is essential to ensure the
long-term availability of high-quality wetland systems for use by blue-winged teal. Wetland loss and degradation in neotropical wintering areas have been as great or greater than in northern prairie breeding habitats. Effective wetland management, protection, and restoration are important throughout the range of the blue-winged teal.
Suggested Reading
Bellrose, F. C., editor. 1980. Ducks, geese, and swans of North America. 3rd ed. Stackpole Books, Harrisburg, Penn. 540 pp.
Bennett, L. J. 1938. The blue-winged teal: its ecology and management. Collegiate Press, Inc., Ames, Iowa. 144 pp.
Botero, J. E., and D. H. Rusch. 1994. Foods of blue-winged teal in two neotropical wetlands. Journal of Wildlife Management 58:561-565.
Dubowy, P. J. 1985. Feeding ecology and behavior of postbreeding male blue-winged teal and northern shovelers. Canadian Journal of Zoology 63:1292-1297.
Kaiser, P. H., S. S. Berlinger, and L. H. Fredrickson. 1979. Response of blue-winged teal to range management on waterfowl production areas in southeastern South Dakota. Journal of Wildlife Management 32:295-298.
Swanson, G. A., M. I. Meyer, and J. R. Serie. 1974. Feeding ecology of breeding blue-winged teals. Journal of Wildlife Management 38:396-407.
Swanson, G. A., and M. I. Meyer. 1977. Impact of fluctuating water levels on feeding ecology of breeding blue-winged teal. Journal of Wildlife Management 41:426-433.
Taylor, T. S. 1978. Spring foods of migrating blue-winged teals on seasonally flooded impoundments. Journal of Wildlife Management 42:900-903.
Weller, M. W. 1979. Density and habitat relationships of blue-winged teal nesting in northwestern Iowa. Journal of Wildlife Management 43:367-374.
6 Waterfowl Management Handbook 13.1.8. •• 1995

Appendix. Common and Scientific Names of Plants and Animals Named in Text.
Plants Muskgrass . . . . . . . . . . . . . . . . . . . . . . . . . . . . . . . . . . . . . . . . . Chara spp. Duckweed . . . . . . . . . . . . . . . . . . . . . . . . . . . . . . . . . . . . . . . . . . Lemna spp. Coontail . . . . . . . . . . . . . . . . . . . . . . . . . . . . . . . . . . . . . . . Ceratophyllum spp. Pondweed . . . . . . . . . . . . . . . . . . . . . . . . . . . . . . . . . . . . . . . Potamogeton spp. Bulrush . . . . . . . . . . . . . . . . . . . . . . . . . . . . . . . . . . . . . . . . . . . Scirpus spp. Sedge . . . . . . . . . . . . . . . . . . . . . . . . . . . . . . . . . . . . . . . . . . . . . Carex spp. Spikerush . . . . . . . . . . . . . . . . . . . . . . . . . . . . . . . . . . . . . . . . Eleocharis spp. Water lily . . . . . . . . . . . . . . . . . . . . . . . . . . . . . . . . . . . . . . . . Nymphaea spp. Alfalfa . . . . . . . . . . . . . . . . . . . . . . . . . . . . . . . . . . . . . . . . . . Medicago sativa Bluegrass . . . . . . . . . . . . . . . . . . . . . . . . . . . . . . . . . . . . . . . . . Poa pratensis Millet . . . . . . . . . . . . . . . . . . . . . . . . . . . . . . . . . . . . . . . Echinochloa crusgalli Milo . . . . . . . . . . . . . . . . . . . . . . . . . . . . . . . . . . . . . . . . . . Sorghum vulgare Rice . . . . . . . . . . . . . . . . . . . . . . . . . . . . . . . . . . . . . . . . . . . . . Oryza sativa Widgeongrass . . . . . . . . . . . . . . . . . . . . . . . . . . . . . . . . . . . . . Ruppia maritima
Birds Blue-winged teal . . . . . . . . . . . . . . . . . . . . . . . . . . . . . . . . . . . . . . Anas discors Cinnamon teal . . . . . . . . . . . . . . . . . . . . . . . . . . . . . . . . . . . . Anas cyanoptera Mallard . . . . . . . . . . . . . . . . . . . . . . . . . . . . . . . . . . . . . . . Anas platyrhynchos Gadwall . . . . . . . . . . . . . . . . . . . . . . . . . . . . . . . . . . . . . . . . . . Anas strepera
Invertebrates Snails . . . . . . . . . . . . . . . . . . . . . . . . . . . . . . . . . . . . . . . . . . . . Gastropoda Midges . . . . . . . . . . . . . . . . . . . . . . . . . . . . . . . . . . . . . . . . . . . Chironomidae Isopods . . . . . . . . . . . . . . . . . . . . . . . . . . . . . . . . . . . . . . . . . . . . . Isopoda Beetles . . . . . . . . . . . . . . . . . . . . . . . . . . . . . . . . . . . . . . . . . . . . Coleoptera Mosquitos . . . . . . . . . . . . . . . . . . . . . . . . . . . . . . . . . . . . . . . . . . . Culicidae Fairy shrimp . . . . . . . . . . . . . . . . . . . . . . . . . . . . . . . . . . . . . . . . . Anostraca Water fleas . . . . . . . . . . . . . . . . . . . . . . . . . . . . . . . . . . . . . . . . . . Cladocera Dragonflies . . . . . . . . . . . . . . . . . . . . . . . . . . . . . . . . . . . . . . . . . . . Odonata Water boatmen . . . . . . . . . . . . . . . . . . . . . . . . . . . . . . . . . . . . . . . . Corixidae
���������������������������������������� ���������������������������
�������������������������������� ����������������� •� ����
Waterfowl Management Handbook 13.1.8. •• 1995 7

W A T E R F O W L M A N A G E M E N T H A N D B O O K
13.1.11. Life History Traits and Habitat Needs of the Redhead
Christine Mitchell Custer U.S. Fish and Wildlife Service Northern Prairie Wildlife Research Center P.O. Box 2226 La Crosse, Wisconsin 54602
Redheads are one of five common diving duck species in North America. They are in the same taxonomic group as the pochards or bay ducks and are most similar in appearance and behavior to the canvasback. Smaller body size, late breeding, wintering in southern areas, and tolerance to salt in winter and in breeding areas differentiate the redhead from the canvasback and suggest an evolutionary origin in the arid areas of the West. Parasitism of other waterfowl nests is more pronounced in redheads than in other North American waterfowl. These and other aspects of the biology of the redhead are the subject of this leaflet. Readers who are interested in general references on redheads are referred to Palmer (1976) or Bellrose (1980).
Distribution
Redheads breed in unforested areas with semipermanently to permanently flooded palustrine wetlands that support persistent emergent vegetation. The highest numbers of redheads breed in the prairies and parklands of Manitoba, Saskatchewan, North Dakota, and South Dakota
Species Profile—Redhead
Scientific name: Aythya americana (Eyton) Weight in pounds (grams):
Adults—male 2.4 (1,087), female 2.1 (953) Immatures—male 2.1 (953), female 1.9 (862)
Age at first breeding: 1 or 2 years Clutch size: 7−10 eggs Incubation period: 24−25 days Age of fledging: 10−12 weeks Nest sites: Semipermanently and seasonally
flooded palustrine wetlands with persistent emergent vegetation.
Food habits: Omnivorous, except in winter; shoalgrass rhizomes and wildcelery winter buds during winter; tubers, rhizomes, and parts of aquatic vegetation, and aquatic invertebrates (insects, crustaceans, and mollusks) during spring, summer, and fall.
(nest densities = 10−25/mile2 [4−10/km2]). Nest densities are highest in the marshes of Nevada and Utah (180−550/mile2 [69−214/km2]; Fig. 1) where this species may have first evolved.
Redheads winter on brackish to hypersaline waters in the southern United States and in Mexico. An estimated 80% of redheads winter on the hypersaline Laguna Madre along the Gulf Coast of northern Mexico and southern Texas, but some select other parts of the Gulf Coast and the southern Atlantic Coast (Fig. 1). Migration routes to
Fish and Wildlife Leaflet 13.1.11. •• 1993 1

Fig. 1. Distribution of important breeding and wintering areas of redheads.
these wintering areas do not follow flyways. Redheads that breed in the Pacific Flyway and in the Central Flyway winter in the Central Flyway. Few redheads migrate through the Mississippi Flyway.
Spring Migration
Most redheads depart wintering areas in the Laguna Madre within 2 weeks in early March and wintering areas on the Atlantic Coast in mid-March (Fig. 2). They move through Iowa, Kansas, and Nebraska in March and reach Canada by mid-April. They are considered midseason migrants because they migrate later than mallards, green-winged teals, and northern pintails but earlier than gadwalls and ruddy ducks.
Breeding
Wetland Habitats
In the prairie potholes of Montana and northwestern Iowa and in the intermountain West, redheads use two types of permanently and semipermanently flooded palustrine wetlands for breeding. When they first arrive (prelaying period), redheads feed in large, deep, open areas (>1 acre [0.4 ha]) with submersed aquatic vegetation (Fig. 2). They use smaller, more shallow permanent to semipermanent wetlands with blocks of dense emergent vegetation for nesting (laying and incubating eggs). Wetlands that redheads use during prelaying and brood rearing are similar. Essential elements include a good supply of preferred foods such as invertebrates and submergent plants, ample water depth for escape
2 Fish and Wildlife Leaflet 13.1.11. •• 1993

(>4 ft [>1.2 m]), and large open areas where approaching predators are visible.
Redheads use widgeongrass in saline lakes or energy-rich seeds in shallow, temporary ponds during the prelaying and laying periods in North Dakota. They rely on deep, open areas during droughts when shallow-water areas are not available. Because of low rates of nutrient recycling and a scarcity of feeding areas in open water, the quantity of food may not be as great as in shallow-water areas. Broods in all areas use shallow (<2 ft [ <0.6 m]) ponds if emergent vegetation is available for escape cover.
Impoundments and other intensively managed wetland complexes in California and Wisconsin are used by redheads. In Wisconsin, redheads nest in semipermanently flooded cattail marshes or hardstem-bulrush marshes but feed in nearby seasonally flooded impoundments managed for moist-soil plants (rice cutgrass and smartweed). Initially, broods use areas with abundant insect larvae (such as seasonally flooded impoundments) and later move to more open areas (such as
Fig. 2. The chronology of important life history events in the annual cycle of the redhead.
semipermanent impoundments) with pondweeds and duckweed.
Nest Site Requirements
Wetlands that are 5 acres (2.0 ha) or larger and not farther than 0.25 miles (0.4 km) from large permanent or semipermanent lakes provide optimum nesting habitat. Females usually place nests in dense bulrush or cattail stands that are interspersed with small (2−3 yd2 [1.7−2.5 m2]) areas of open water. Wetlands that are smaller than 1 acre (<0.4 ha) must contain large blocks of emergent vegetation for adequate seclusion and protection of nesting redheads.
Redheads begin building nests over water with remnants of the previous year’s vegetation and use new vegetation as it becomes available. Redheads seem to prefer to nest in hardstem, slender, and Olney bulrushes but also use river and awned sedges, narrow-leaved and common cattails, and whitetop. These plants offer a firm structural framework for the nest and cover for above the nest. A residual stem density of 35−45 bulrush
Fish and Wildlife Leaflet 13.1.11. •• 1993 3
stems/ ft2 (350−450 stems/m2) or 3−5 cattail stems/ ft2 (32−52 stems/m2) provides adequate cover and a foundation for the nest.
The presence of water seems more important than specific vegetation for nesting. Although redheads do not always nest over water, their nests are usually placed within 10−13 ft (3−4 m) of open water. However, redhead nests have been reported as far away as 755 ft (230 m) from open water. Stable water levels are important to nesting success. The bottom of the nest is usually between 2 and 10 inches (4−24 cm) above the water. If water levels rise, nests may be lost to flooding if females cannot raise the level of the nests. If the wetland dries, nests may be destroyed by predators or deserted.
Brood Size and Chronology
The brood size of redheads averaged 7 in Iowa and 5 in Nevada; most losses of young occurred within the first few days of life. The female usually deserts her brood when the ducklings are about 8 weeks old and still flightless. In contrast, ring-necked ducks and many dabbling duck species do not desert their yet-flightless young. Young redheads fly at 10−12 weeks.
Food Habits
During spring migration and the breeding season, adult redheads are opportunistic and omnivorous. In spring in North Dakota and Canada, redheads feed primarily on protein-rich invertebrates, including Diptera larvae and Trichoptera (>50% by volume). Much of their remaining diet consists of bulrush seeds and sago pondweed buds (≤15% by volume). In North Dakota and Wisconsin, breeding redheads may rely on seeds of moist-soil plants (smartweed, rice cutgrass, bulrush) when invertebrates are scarce. In Nevada, adult redheads consume bass eggs, odonate nymphs, and seeds and vegetative parts of sago pondweed, alkali bulrush, and muskgrass.
Studies in North Dakota did not reveal diet shifts, but some studies in Wisconsin revealed different proportions of invertebrates, seeds, and vegetation in the diet among prelaying, laying, and postlaying females. Redheads may have a physiological need for a seasonal shift in diet, but such a shift may not always occur because the desirable foods are not available.
Redhead ducklings eat a wide variety of foods, including insect larvae, seeds, muskgrass oogonia,
and tubers. The ducklings usually move from a diet that is high in animal matter just after they hatch to a diet of almost exclusively plant matter as they approach fledging. In Wisconsin, ducklings eat mainly Hemiptera nymphs and adults, Diptera larvae, and bulrush seeds during the first 3 weeks of life. As they grow older, ducklings switch to a diet of mainly vegetation such as sago and slender pondweed, duckweed, and bulrush achenes.
Reproductive Strategy Redheads may lay as much as 75% of their
eggs in the nests of other waterfowl; as much as 50% of a redhead’s production is from parasitic eggs. Redheads seem to follow a dual strategy. In favorable years (abundant food, normal water levels and weather conditions), redheads increase their fecundity by laying 6−10 parasitic eggs before they initiate normal nesting. Parasitic eggs are produced without the time, energy, and risk associated with nest building, incubation, and brood rearing. In poor years (less abundant food or drier water conditions), younger females usually are entirely parasitic and older females nest normally, but neither age class does both. Although the hatching rate of parasitic eggs is about half that of nonparasitic eggs (90% hatching rate), females that also nest normally increase their fecundity with parasitic eggs.
The number of parasitic eggs per host nest averages between 3 and 5 in nests of canvasbacks, 4 in nests of lesser scaups, and 3 in nests of other species. Parasitism lowers the productivity of the host species because there are fewer host eggs in parasitized nests. Some of the host’s eggs are pushed from the nest during the intrusion by the parasitic redhead. Redhead parasitism rates increase with increasing densities of other duck species. Redheads also parasitize nests of mallards, northern pintails, northern shovelers, gadwalls, American wigeons, blue-winged and cinnamon teals, ruddy ducks, and other redheads. The selection of host species may result from overlapping nest chronologies and selection of similar nesting habitat.
Postbreeding Dispersal and Fall Migration
The postbreeding dispersal of males and nonbreeding females begins in June (Fig. 2), and breeding females disperse when their young are 8
Fish and Wildlife Leaflet 13.1.11. •• 1993 4

weeks old or older. Redheads of both sexes and all ages usually move north from their breeding locations to large lakes and reservoirs before molting and the subsequent fall migration. Large lakes may provide molting, flightless redheads with protection from predators and a rich food source. One very important lake for staging and molting, especially for males, is Lake Winnipegosis in Manitoba. At peak migration in 1975, an estimated 144,000 redheads were on that lake. In Utah, flightless adults usually remain in the wetland complex where they nested.
Males are flightless during late July and early August. Females become flightless approximately 6 weeks after they desert their broods. Flightless redheads usually swim or dive to escape; unlike many dabbling ducks, they rarely flap across the water.
Postbreeding adults in Manitoba eat primarily winter buds and parts of sago pondweed and muskgrass. They also ingest lesser amounts (<5% dry weight) of bulrush achenes, widgeongrass, and midge larvae and adults.
Winter Habitats and Behavior
Eighty percent of all redheads winter on the Laguna Madre of Texas and Mexico. When redheads first arrive on the hypersaline Laguna Madre, they make daily trips to adjacent freshwater ponds. They also select feeding sites with the lowest possible salinities (approximately ≤30 ppt) in the Laguna Madre. As their salt glands increase in size, the requirement for fresh water daily diminishes. By mid- to late December, fewer redheads travel to freshwater wetlands each day. The number of redheads that seek fresh water later in winter is determined by salinities in the Laguna Madre. Where salinities are high (45−60 ppt), 50% or more of the redheads are on fresh water daily throughout winter. Where salinities are lower (30−35 ppt), fewer than 15% visit fresh water daily. Freshwater sites that redheads frequent usually have salinities of less than 15 ppt and are usually within 2−4 miles (4−7 km) of feeding areas. Redheads use freshwater sites for drinking, preening, and bathing but not for feeding.
Although redheads are diving ducks, they feed most often by head dipping or tipping up (>75% of the time) in 5−12-inch-deep (12−30-cm) water on the Gulf Coast. Redheads spend about 5 h each day feeding in this manner. Feeding by diving requires
Fish and Wildlife Leaflet 13.1.11. •• 1993
about 3 times as much time and costs more energy than feeding by head dipping or tipping up. Redheads may dabble for food during the breeding season.
Food Habits During winter, redheads in the Laguna Madre
eat shoalgrass rhizomes almost exclusively, even though other vegetation is also available. As much as 15% of the food by volume (approximately 20% by weight) can be mollusks, mainly small snails such as dovesnails, variable ceriths, and virgin nerites. Whether these mollusks are ingested selectively or only incidentally to rhizome gathering is not known. In the Chesapeake Bay, wintering redheads eat winter buds of wildcelery and sago pondweed.
Courtship and Pairing Redheads begin pairing during winter. In
southern Texas, approximately 30% of the redhead females were already paired by late December and nearly 50% by late February. Females are the more aggressive member of the pair and are usually responsible for pair defense. Paired redheads continue their courtship on the breeding areas but do not copulate until the pair bond is well established.
Population Status and Harvest
The target of the North American Waterfowl Management Plan for redheads is a population size of 760,000 birds. The average population size has been at this level for the past 2 decades (759,800 during 1970−79 and 825,800 during 1980−89). The successful maintenance of redhead populations at targeted levels may have been in part the result of closed seasons and restricted bag limits for this species. Populations also may be stable because redheads use permanent and semipermanent wetlands for breeding. Because these wetland types usually persist during droughts, redheads are more likely to have a place to nest than are other waterfowl species that rely on temporarily or intermittently flooded wetlands. Furthermore, redheads are less traditional than canvasbacks in their choice of breeding areas and are therefore more likely to move into different breeding areas to take advantage of adequate water conditions.
Redheads make up 2% of the North American ducks but less than 1% of the harvested ducks in
5

the United States. The average number of harvested redheads per year was 184,000 during 1971−79 and 171,100 in 1982 and 1983 but only 37,400 during 1989−91. The reduction in number of harvested redheads between the 1970’s and 1989−91 is paralleled by a reduction in the number of hunter days and the size of the seasonal bag per hunter. Most redheads are harvested in the Central Flyway (1−3% of the total duck harvest), and fewest are taken in the Atlantic Flyway (0.1−0.6% of the total duck harvest).
Implications for Management
Because redheads need a combination of habitats during the breeding season and are specialists during the postbreeding and wintering portions of their life cycle, they offer a challenge to managers. Management for redheads in the prairies should focus on wetland complexes. Deeper water with invertebrates or shallow water with moist-soil plants should be made available during the prelaying period. Water levels should be kept constant during the laying and incubation periods to reduce losses of clutches from flooding or from predators if the area becomes too dry. Recently flooded areas with high invertebrate populations should be available during the first few weeks of the brood period and should be followed by access to deeper water with ample pondweeds.
The parasitic nature of redheads also offers a challenge to managers. An increase in the numbers of nesting redheads may be at the expense of other waterfowl species. Females whose nests are parasitized by redheads have a lower productivity than conspecifics whose nests are not parasitized.
Large concentrations of postbreeding redheads occur on only a few large lakes that provide protection from predators, a rich food supply, and minimal human disturbance. Because these traditional postbreeding areas are limited, they have to be preserved.
During winter, redheads on the Laguna Madre prefer shallow (5−12 inches [12−30 cm] deep), open water with shoalgrass on the bottom. Especially early in winter before they have acclimated to
hypersaline conditions, redheads also require a source of fresh drinking water within 4−5 miles (6−8 km) of their feeding sites. Since the 1960’s, monotypic shoalgrass meadows declined by over 50% in certain parts of the Laguna Madre. Concurrently, recreational and industrial uses of these coastal areas increased. Important areas for redheads, especially areas in shallow water, need to be identified and protected from human disturbance and further loss of shoalgrass. When wildcelery disappeared from the Chesapeake Bay, redheads (unlike canvasbacks) did not switch to an alternate food such as Baltic macomas—they abandoned the area. This may indicate their lack of flexibility in food choice during winter and emphasize the need to protect remaining wintering habitat.
Suggested Reading
Bellrose, F. C., editor. 1980. Ducks, geese & swans of North America. 3rd ed. Stackpole Books, Harrisburg, Pa. 544 pp.
Howard, R. J., and H. A. Kantrud. 1983. Habitat suitability index models: redhead (wintering). U.S. Fish and Wildlife Service, FWS/OBS−82 / 10.53. 14 pp.
Lokemoen, J. T. 1966. Breeding ecology of the redhead duck in western Montana. Journal of Wildlife Management 30:668−681.
Low, J. B. 1945. Ecology and management of the redhead, Nyroca americana, in Iowa. Ecological Monographs 15:35−69.
Mitchell, C. A., T. W. Custer, and P. J. Zwank. 1994. Herbivory on shoalgrass by wintering redheads in Texas. Journal of Wildlife Management 58:131−141.
Palmer, R. S., editor. 1976. Handbook of North American birds. Vol. 3. Yale University Press, New Haven, Conn. 560 pp.
Sorenson, M. D. 1991. The functional significance of parasitic egg laying and typical nesting in redhead ducks: an analysis of individual behavior. Animal Behavior 42:771−796.
Weller, M. W. 1964. Distribution and migration of the redhead. Journal of Wildlife Management 28:64−103.
Woodin, M. C., and G. A. Swanson. 1989. Foods and dietary strategies of prairie-nesting ruddy ducks and redheads. Condor 91:280−287.
6 Fish and Wildlife Leaflet 13.1.11. •• 1993

Appendix. Common and Scientific Names of the Plants and Animals Named in the Text.
Plants Awned or slough sedge . . . . . . . . . . . . . . . . . . . . . . . . . . . . . . . Carex atherodes River sedge . . . . . . . . . . . . . . . . . . . . . . . . . . . . . . . . . . . . . . . . C. lacustris Muskgrass . . . . . . . . . . . . . . . . . . . . . . . . . . . . . . . . . . . . . . . . . Chara sp. Shoalgrass . . . . . . . . . . . . . . . . . . . . . . . . . . . . . . . . . . . . . Halodule wrightii Rice cutgrass . . . . . . . . . . . . . . . . . . . . . . . . . . . . . . . . . . . . Leersia oryzoides Duckweeds . . . . . . . . . . . . . . . . . . . . . . . . . . . . . . . . . . . . . . . . Lemna spp. Smartweeds . . . . . . . . . . . . . . . . . . . . . . . . . . . . . . . . . . . . . Polygonum spp. Sago or fennelleaf pondweed . . . . . . . . . . . . . . . . . . . . . . . Potamogeton pectinatus Slender pondweed . . . . . . . . . . . . . . . . . . . . . . . . . . . . . . . . . . . . . P. pusillus Widgeongrass . . . . . . . . . . . . . . . . . . . . . . . . . . . . . . . . . . . Ruppia maritima Hardstem bulrush . . . . . . . . . . . . . . . . . . . . . . . . . . . . . . . . . . Scirpus acutus Slender bulrush . . . . . . . . . . . . . . . . . . . . . . . . . . . . . . . . . . . S. heterochaetus Olney bulrush . . . . . . . . . . . . . . . . . . . . . . . . . . . . . . . . . . . . . . . . S. olneyi Alkali bulrush . . . . . . . . . . . . . . . . . . . . . . . . . . . . . . . . . . . . . S. paludosus Whitetop . . . . . . . . . . . . . . . . . . . . . . . . . . . . . . . . . . . . Scolochloa festucacea Narrow-leaved cattail . . . . . . . . . . . . . . . . . . . . . . . . . . . . . . Typha angustifolia Common cattail . . . . . . . . . . . . . . . . . . . . . . . . . . . . . . . . . . . . . . T. latifolia Wildcelery . . . . . . . . . . . . . . . . . . . . . . . . . . . . . . . . . . Vallisneria americana
Invertebrates—Arthropoda Flies, midges . . . . . . . . . . . . . . . . . . . . . . . . . . . . . . . . . . . . . . . . . Diptera True bugs . . . . . . . . . . . . . . . . . . . . . . . . . . . . . . . . . . . . . . . . . Hemiptera Dragonflies and damselflies . . . . . . . . . . . . . . . . . . . . . . . . . . . . . . . . . Odonata Caddisflies . . . . . . . . . . . . . . . . . . . . . . . . . . . . . . . . . . . . . . . . Trichoptera
Invertebrates—Mollusca Greedy dovesnail . . . . . . . . . . . . . . . . . . . . . . . . . . . . . . . . . . . Anachis avara Variable cerith (sometimes called horn shell) . . . . . . . . . . . . . . . . . Cerithium lutosum Baltic macoma (sometimes called Baltic clam) . . . . . . . . . . . . . . . . . . Macoma balthica Lunar dovesnail . . . . . . . . . . . . . . . . . . . . . . . . . . . . . . . . . . . Mitrella lunata Virgin nerite . . . . . . . . . . . . . . . . . . . . . . . . . . . . . . . . . . . . Neritina virginea
Birds Northern pintail . . . . . . . . . . . . . . . . . . . . . . . . . . . . . . . . . . . . . Anas acuta American wigeon . . . . . . . . . . . . . . . . . . . . . . . . . . . . . . . . . . . A. americana Northern shoveler . . . . . . . . . . . . . . . . . . . . . . . . . . . . . . . . . . . . A. clypeata Green-winged teal . . . . . . . . . . . . . . . . . . . . . . . . . . . . . . . . . . . . . . A. crecca Cinnamon teal . . . . . . . . . . . . . . . . . . . . . . . . . . . . . . . . . . . . . A. cyanoptera Blue-winged teal . . . . . . . . . . . . . . . . . . . . . . . . . . . . . . . . . . . . . . A. discors Mallard . . . . . . . . . . . . . . . . . . . . . . . . . . . . . . . . . . . . . . . A. platyrhynchos Gadwall . . . . . . . . . . . . . . . . . . . . . . . . . . . . . . . . . . . . . . . . . . A. strepera Lesser scaup . . . . . . . . . . . . . . . . . . . . . . . . . . . . . . . . . . . . . . Aythya affinis Redhead . . . . . . . . . . . . . . . . . . . . . . . . . . . . . . . . . . . . . . . . A. americana Canvasback . . . . . . . . . . . . . . . . . . . . . . . . . . . . . . . . . . . . . . A. valisineria Ruddy duck . . . . . . . . . . . . . . . . . . . . . . . . . . . . . . . . . . . Oxyura jamaicensis
Fish Largemouth bass . . . . . . . . . . . . . . . . . . . . . . . . . . . . . . Micropterus salmoides
UNITED STATES DEPARTMENT OF THE INTERIOR FISH AND WILDLIFE SERVICE
Fish and Wildlife Leaflet 13 Washington, D.C. •• 1993
Note: Use of trade names does not imply U.S. Government endorsement of commercial products.
Fish and Wildlife Leaflet 13.1.11. •• 1993 7

WAT E R F O W L M A N A G E M E N T H A N D B O O K
13.1.15. Life History and Habitat Needs of the Black Brant
Dirk V. Derksen and David H. Ward U.S. Fish and Wildlife Service Alaska Fish and Wildlife Research Center 1011 East Tudor Road Anchorage, AK 99503
The black brant is a sea goose that depends on coastal habitats from high arctic nesting sites in Canada, Alaska, and Russia to wintering areas in the Pacific coastal states, the Baja California peninsula, and mainland Mexico estuaries. Population estimates are based on aerial surveys in Mexico, California, Oregon, and Washington during mid-winter. Despite much annual variability in estimates, a plot of the counts from 1964 to 1992 reveals a significant downward trend in the winter populations (Fig. 1). Three of four major colonies on the Yukon−Kuskokwim (Y−K) delta declined an average of 60% during the first half of the 1980’s. This is significant because about 79% of the world population of the black brant nest in these colonies (Table). Because few other breeding colonies have been consistently monitored, we have little understanding of their dynamics.
Spring subsistence harvest in western Alaska coupled with fox predation on reduced Y−K delta populations, has limited the recovery of key nesting colonies. Degradation and loss of important staging and winter estuarine habitats from commercial and recreational development and disturbance are largely responsible for population reductions in British Columbia and the Pacific coastal states. In
Species Profile—Black Brant
Scientific name: Branta bernicla nigricans Weight* in pounds (grams): Adults—male 3.6 (1,802), female 3.3 (1,648) Immatures—male 3.4 (1,710), female 2.9
(1,456) Age at first breeding: 2−4 years Clutch size: 3.3−3.5, range 1−7 Incubation period: 24 days Age at fledging: 45−50 days Nest sites: Grass−sedge tundra communities
on islands or peninsulas in large, shallow ponds along low coastal floodplains to 5 miles inland
Food habits: Predominantly herbivorous, except for small amounts of fish eggs, crustaceans, and mollusks
*October weights at Izembek Lagoon, Alaska
Mexico, industrial and recreational development in several estuaries may further limit winter habitats. Wildlife conservation agencies in Canada, Mexico, Russia, and the United States recently cooperated to examine population dynamics and factors that limit recovery of the black brant. This examination revealed important discoveries for management. This leaflet is a summary of these findings. More complete information on the life history of the black brant is in Bellrose (1980) and Palmer (1976).
Fish and Wildlife Leaflet 13.1.15. •• 1993 1

Fig. 1. Status of the black brant based on midwinter aerial surveys with the calculated regression line indicated.
Distribution
The black brant nests from Prince Patrick and Melville islands in the western Canadian high arctic and the Beaufort Sea islands to the coastal plain of Canada and Alaska. Small colonies occur on the north side of the Chukotka Peninsula in Russia and on Wrangel Island. The largest concentration of nesting brants is on the delta of the Yukon and Kuskokwim rivers in western Alaska (Table; Fig. 2).
In the arctic, molting areas support as many as 32,000 birds near Teshekpuk Lake on Alaska’s coastal plain and 4,000 birds on Wrangel Island (Fig. 2). Brants also molt in large but uncounted flocks on the Y−K delta.
Amajor shift in the winter distribution of the black brant occurred during the 1950’s and 1960’s. The species traditionally wintered on the Pacific coast from Puget Sound south to Baja California. In 1958, black brants were discovered using lagoons on the Mexican mainland bordering the Gulf of California. Concomitantly, the number of wintering birds in California declined drastically from a 10-year (1949−1958) mean of 42,000 to a mean of 6,800 between 1959 and 1968. In two years since 1968, no brants have wintered in California. Since 1965, in excess of 80% of the black brants counted during winter surveys in Mexico, California, Oregon, and Washington were observed in Mexico. From 1981 to 1988, an average of 4,400 brants wintered in the Izembek Lagoon area of the Alaska Peninsula. Whether these wintering brants are from specific breeding colonies or their physiological condition prevents them from
Table. Number of nests and percent of total nests in colonies throughout the population of the black brant.
Number Percent Location and colony of nests of total
Alaska Yukon−Kuskokwim Delta
Kigigak Island 1,050 Baird Inlet 10,122 Tutakoke River 6,591 Kokechik Bay 5,874 Small colonies 4,163
Subtotal 27,800 78.9
Seward Peninsula−Chukchi Sea Arctic Lagoon 50 Nugnugaluktuk River 100 Kasegaluk Lagoon 50
Subtotal 200 0.6
North Slope Coastal Plain Meade River Delta 50 Teshekpuk Lake 200 Colville River 400 Prudhoe Bay 500
Subtotal 1,150 3.3
Russia Wrangel Island 100 Ayon Island 50 Anadyr Basin 170
Subtotal 320 0.9
Canada Low Arctic
Liverpool Bay 300 Banks Island 2,250 Victoria Island 1,200
Subtotal 3,750 10.6
High Arctic Prince Patrick Island 500 Melville Island 1,500
Subtotal 2,000 5.7
Total 35,220
migrating from Izembek Lagoon to more southerly habitats is not clear.
Spring Migration and Breeding
Spring migration occurs during a 4-month period (Fig. 3) starting in mid-February when the birds begin northward movement from winter areas to staging habitats in California, Oregon, Washington, and British Columbia. Eelgrass and
2 Fish and Wildlife Leaflet 13.1.15. •• 1993

Fig. 2. Distribution of major black brant colonies and number of nesting pairs.
Fig. 3. The chronology of important life history events in the annual cycle of the black brant (irrespective of sex).
Fish and Wildlife Leaflet 13.1.15. •• 1993 3

sea lettuce and other marine algae are important in the diet of migrants at these staging habitats; they also feed on roe of Pacific herring, on crustaceans, and on mollusks. By late April, brants reach Izembek Lagoon, Alaska, where they may spend from 2 to 4 weeks feeding on eelgrass before emigration to nesting areas.
The birds establish bonds during the winter and arrive at breeding areas as pairs. They attain maximum numbers on the Y−K delta in late May and in arctic and western Canada by mid-June. Preferred nest sites are on peninsulas or islets in large wetland complexes, some of which are subject to tidal action. Most brants first breed when they are 3 years of age; fewer than 50% nest at age 2.
Brants lay from one to seven eggs and an average clutch of 3.5 eggs at Y−K delta colonies and 3.8 eggs at Colville River delta colonies in northern Alaska. The mean incubation period is 24 days. The arctic fox is the most important predator of eggs and goslings on the Y−K delta colonies. Control measures to eliminate foxes enhanced nesting success and significantly increased nesting brants at the Tutakoke River colony on the Y−K delta. Glaucous gulls and parasitic jaegers also take eggs and goslings.
Adults with broods move from colony sites to rearing habitats along tidal flats. Broods sometimes congregate in large creches. Creeping alkali grass and Hoppner sedge are the most important plants in the diet of adults and developing young. Adults with broods begin to molt their flight feathers in the second week of July, and most can fly by the second week of August. Young fledge in 45−50 days, and most birds are capable of flight by mid-August (Fig. 3). Brants remain in family groups throughout the brood-rearing period.
Postbreeding Dispersal and Fall Migration
Brants that lose their clutches or do not nest undertake a molt migration, usually in late June, to secluded areas in the high arctic. They congregate in large numbers on molting areas for a month or more (Fig. 3) until new flight feathers are grown. Important molting areas have been discovered on Alaska’s north slope and Wrangel Island (Fig. 2). These areas, dominated by large freshwater lakes and ocean estuaries, provide essential habitat for tens of thousands of brants
from many different nesting colonies during the annual wing molt. At the Teshekpuk Lake molting area, there are more males (57.2%) than females and more After Second Year (76.6%) than Second Year birds. Failed breeding birds are 61.7% and non-breeding birds are 38.3% of the molting population.
Molt is a nutritionally demanding process in many species of birds, including the black brant. During the molt at Teshekpuk Lake, adult females lose more carcass mass, lipid, and protein than adult males and subadults. Males lose an average 122 g and females 141 g of lipid during the molt process. For brants to complete the molt and regain the necessary lipid reserves for migration, managers must insure minimal disturbance in molting areas. Feeding is the predominant behavior (52% of all activities) of molting brants throughout the 24-h cycle. Protein-rich tufted hairgrass and sedges are the most important plants in the diet of molting brants at Teshekpuk Lake.
Adults with fledged young follow traditional routes from breeding areas to fall migration staging sites along the Siberian, Beaufort, Chukchi, and Bering seas (Fig. 2). The single most critical fall staging habitat is near the tip of the Alaska Peninsula at Izembek Lagoon. Nearly the entire world population of the black brant spends as long as 9 weeks there feeding on the extensive beds of eelgrass. Eelgrass is as much as 99% of their diet during this period. In the Izembek Lagoon complex, brants from high arctic colonies (e.g., Prince Patrick and Melville islands) are spatially segregated from birds that nest in western colonies (Mackenzie and Y−K deltas). This behavior allows assessment of productivity and age ratios of two distinct breeding stocks. Managers can establish appropriate harvest regulations and management for each stock.
Disturbance of staging brants is of concern because it could reduce foraging time and increase energetic costs and thus lower fat deposition, which may compromise successful migration to distant winter habitats. At Izembek Lagoon, aircraft flights were the most frequent (0.57 events/h) type of anthropogenic disturbance. Bald eagles caused 0.25 disturbances/h. All disturbances occurred at 1.07/h. A predictive model shows that if brants were exposed to 45−50 daily disturbances by aircraft, they would not gain any weight at Izembek Lagoon.
4 Fish and Wildlife Leaflet 13.1.15. •• 1993

In late October or early November, brants depart Izembek Lagoon during low pressure systems that generate the favorable southerly winds for transoceanic migration. When meteorological conditions are appropriate, nearly all brants leave Izembek Lagoon within about 12 h, usually at night.
Winter Ecology Black brants arrive in winter habitats in Baja
California within 60−95 h of departure from Izembek Lagoon. They metabolize nearly one-third of their body mass during the 2,600 nautical mile flight across the Pacific Ocean to San Quintin Bay, Baja California, Mexico.
Most brants from the Y−K delta, low arctic Canada, and Russia winter in estuaries on the Baja California peninsula and mainland Mexico. Birds that nest in high arctic colonies in Canada winter in the Puget Sound area.
Black brants forage most (58−87%) of the day on marine plants to replace fat reserves expended during migration. Eelgrass is the primary food in San Quintin Bay. Farther south on the Baja California peninsula at San Ignacio Lagoon, Scammons Lagoon, and Magdalena Bay, brants feed on eelgrass and widgeongrass.
At San Quintin Bay, disturbances by hunters, aircraft, vessels, and avian predators occurred at an average rate of 1.21/h. Boat traffic caused 65% and hunters caused 23% of all disturbances. The level of disturbance is greater in this bay than in molting, staging (see above), and other winter habitats. Disturbance during winter is of special concern because it could harm the physiological condition of prenesting brants and thus lower reproductive success.
Management
Effective management must focus on conservation of the terrestrial and marine habitats on which black brants depend during nesting, staging, and wintering. Some of these areas are protected as state and federal refuges, but many critical habitats remain outside conservation units. Even some habitats that are inside refuge boundaries are not free from activities that may affect brants. Management of refuges and other key habitats should include monitoring and, if necessary, regulation of disturbances, especially
from vessel and aircraft traffic, that may displace birds from traditional foraging areas.
The quality and quantity of important marine food plants such as eelgrass, widgeongrass, and sea lettuce must be maintained. Threats to these resources include increasing pollution, dredging, and other industrial and recreational development in estuaries in British Columbia, the Pacific coastal states, Baja California, and mainland Mexico.
Habitats in Alaska, Russia, and northern Canada are presently relatively secure, but petroleum and related development should be monitored and strategies developed for the protection of colonies, molting areas, and staging sites that are not managed for waterfowl. Methods to protect habitats include acquisitions, land exchanges, easements, and cooperative management agreements.
Suggested Reading
Anthony, R. M., P. L. Flint, and J. S. Sedinger. 1991. Arctic fox removal improves nest success of black brant. Wildlife Society Bulletin 19:176−184.
Bellrose, F. C., editor. 1980. Ducks, geese, and swans of North America. 3rd ed. Stackpole Books, Harrisburg, Penn. 540 pp.
Dau, C. P. 1992. The fall migration of Pacific Flyway brant Branta bernicla in relation to climatic conditions. Wildfowl 43: In press.
Derksen, D. V., W. D. Eldridge, and M. W. Weller. 1982. Habitat ecology of Pacific black brant and other geese moulting near Teshekpuk Lake, Alaska. Wildfowl 33:39−57.
Kramer, G. W., L. R. Rauen, and S. W. Harris. 1979. Populations, hunting mortality and habitat use of black brant at San Quintin Bay, Baja California, Mexico. Pages 242−254 in R. L. Jarvis and J. C. Bartonek, editors. Management and biology of Pacific Flyway geese: a symposium. Oregon State University Book Stores, Inc., Corvallis.
Mickelson, P. G. 1975. Breeding biology of cackling geese and associated species on the Yukon−Kuskokwim Delta, Alaska. Wildlife Monographs 45. 35 pp.
Palmer, R. S., editor. 1976. Handbook of North American birds. Vol. 2. Waterfowl. Yale University Press, New Haven, Conn. 521 pp.
Reed, A., R. A. Stehn, and D. H. Ward. 1989. Autumn use of Izembek Lagoon, Alaska, by brant from different breeding areas. Journal of Wildlife Management 53:720−725.
Smith, R. H. and G. H. Jensen. 1970. Black brant on the mainland coast of Mexico. Transactions of the North American Wildlife and Natural Resources Conference 35:227−241.
Fish and Wildlife Leaflet 13.1.15. •• 1993 5

Spencer, D. L., U. C. Nelson, and W. A. Elkins. 1951. Ward, D. H., and R. A. Stehn. 1989. Response of brant America’s greatest goose-brant nesting area. and other geese to aircraft disturbance at Izembek Transactions of the North American Wildlife Lagoon, Alaska. U.S. Fish and Wildlife Service Conference 16:290−295. Report, Anchorage, Alaska. 193 pp.
Appendix. Common and Scientific Names of the Plants and Animals Named in the Text.
Plants Hoppner sedge . . . . . . . . . . . . . . . . . . . . . . . . . . . . . . . . . . . . Carex subspathacea Sedges . . . . . . . . . . . . . . . . . . . . . . . . . . . . . . . . . . . . . . . . . . . . . . . Carex spp. Tufted hairgrass . . . . . . . . . . . . . . . . . . . . . . . . . . . . . . . . . Deschampsia caespitosa Creeping alkali grass . . . . . . . . . . . . . . . . . . . . . . . . . . . . . . . Puccinellia phraganodes Widgeongrass . . . . . . . . . . . . . . . . . . . . . . . . . . . . . . . . . . . . . . . Ruppia maritima Sea lettuce . . . . . . . . . . . . . . . . . . . . . . . . . . . . . . . . . . . . . . . . . . Ulva lactuca Eelgrass . . . . . . . . . . . . . . . . . . . . . . . . . . . . . . . . . . . . . . . . . . . Zostera marina
Birds Black brant . . . . . . . . . . . . . . . . . . . . . . . . . . . . . . . . . . . Branta bernicla nigricans Bald eagle . . . . . . . . . . . . . . . . . . . . . . . . . . . . . . . . . . . . Haliaeetus leucocephalus Glaucous gull . . . . . . . . . . . . . . . . . . . . . . . . . . . . . . . . . . . . . . Larus hyperboreus Parasitic jaeger . . . . . . . . . . . . . . . . . . . . . . . . . . . . . . . . . . Stercorarius parasiticus
Mammals Arctic fox . . . . . . . . . . . . . . . . . . . . . . . . . . . . . . . . . . . . . . . . . . Alopex lagopus
Fish Pacific herring . . . . . . . . . . . . . . . . . . . . . . . . . . . . . . . . . . . . . . Clupea harengus
Note: Use of trade names does not imply U.S. Government endorsement of commercial products.
UNITED STATES DEPARTMENT OF THE INTERIOR FISH AND WILDLIFE SERVICE
Fish and Wildlife Leaflet 13 Washington, D.C. •• 1993
6

W A T E R F O W L M A N A G E M E N T H A N D B O O K
13.2.1. Waterfowl Use of Wetland Complexes
Leigh H. Fredrickson and Frederic A. Reid Gaylord Memorial Laboratory School of Forestry, Fisheries and Wildlife University of Missouri−Columbia Puxico, MO 63960
Waterfowl are a diverse group of birds that have widely divergent requirements for survival and recruitment. Whistling-ducks, geese, and swans (Anserinae) and ducks (Anatinae) have contrasting life history requirements.
Several goose populations have expanded greatly despite extensive continental wetland losses and degradation. Most expanding populations nest in arctic areas where modifications or disturbance of nesting habitats have been minimal. These grazers often find suitable migratory and wintering habitats in terrestrial or agricultural environments. In contrast, ducks are less terrestrial and populations are influenced more by wetland characteristics, such as quality, total area of wetland basins, and size and configuration of these basins. Because many dabbling ducks nest in upland habitats surrounding wetlands, recruitment of waterfowl is closely tied to both terrestrial and wetland communities. Their primary upland and wetland nesting habitats, as well as migratory and wintering habitats, have been severely degraded or lost to agriculture.
Management for waterfowl in North America is complicated further because each of over 40 species has unique requirements that are associated with different wetland types. Likewise, the requirements for a single species are best supplied from a variety of wetland types.
Fish and Wildlife Leaflet 13.2.1. •• 1988
In recent years, the relations between migrating and wintering habitats have been identified for mallards and arctic-nesting geese. These cross-seasonal effects emphasize the importance of habitats at different latitudes and locations. Thus, effective management requires an appreciation of the general patterns of resource requirements in the annual cycle. Recognition of the adaptations of waterfowl to changing wetland systems provides opportunities for managers to meet the diverse needs of waterfowl.
The Annual Cycle
Waterfowl experience events during a year that necessitate energy and other nutritional requirements above the maintenance level (Fig. 1). These additional requirements, associated with processes such as migration, molt, and reproduction, are obtained from a variety of habitats. Other factors that influence wetland use include sex, dominance, pairing status, flocking, and stage in the life cycle. All these processes influence the resources needed as well as access to habitats where required resources are available.
The large body sizes and high mobility of waterfowl allow them to transfer the required nutrients or energy among widely separated wetlands. The general pattern of reproduction in waterfowl is unusually costly for females at the time of egg laying because eggs (and often clutches) are large. The large egg size of waterfowl requires rapid transfer of protein and lipid stores from the female to the developing egg. In the wood duck, daily costs of egg
1
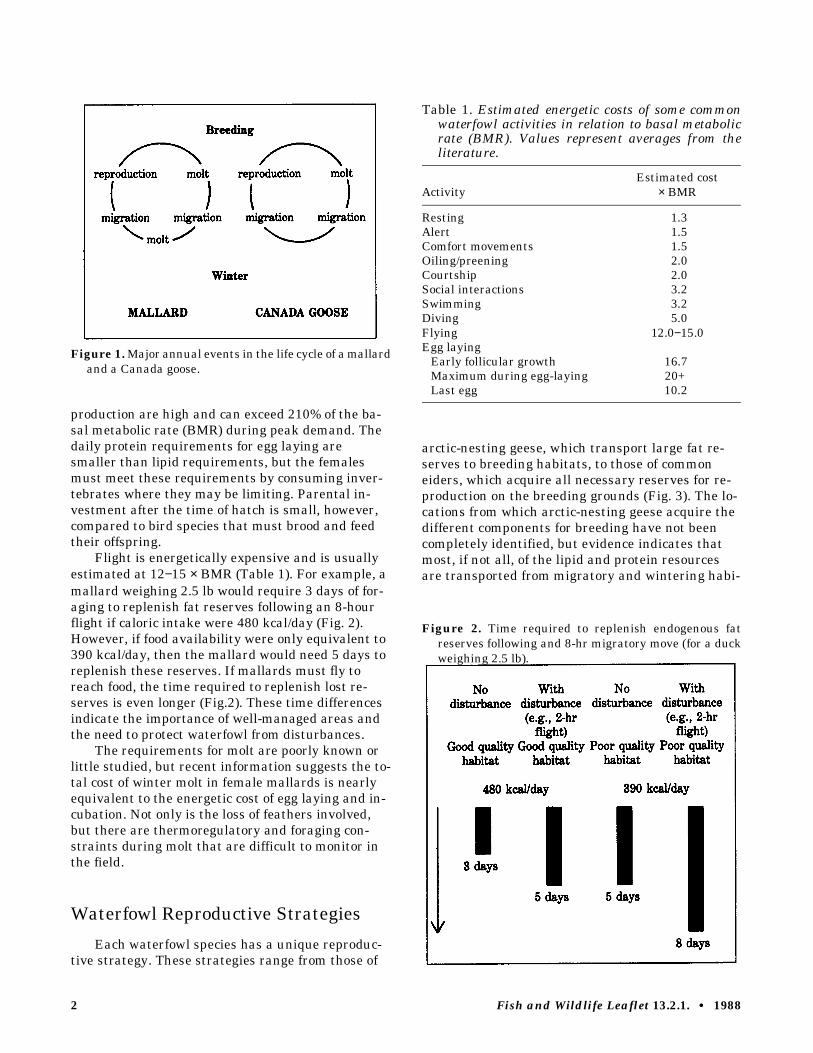
Figure 1. Major annual events in the life cycle of a mallard and a Canada goose.
production are high and can exceed 210% of the basal metabolic rate (BMR) during peak demand. The daily protein requirements for egg laying are smaller than lipid requirements, but the females must meet these requirements by consuming invertebrates where they may be limiting. Parental investment after the time of hatch is small, however, compared to bird species that must brood and feed their offspring.
Flight is energetically expensive and is usually estimated at 12−15 × BMR (Table 1). For example, a mallard weighing 2.5 lb would require 3 days of foraging to replenish fat reserves following an 8-hour flight if caloric intake were 480 kcal/day (Fig. 2). However, if food availability were only equivalent to 390 kcal/day, then the mallard would need 5 days to replenish these reserves. If mallards must fly to reach food, the time required to replenish lost reserves is even longer (Fig.2). These time differences indicate the importance of well-managed areas and the need to protect waterfowl from disturbances.
The requirements for molt are poorly known or little studied, but recent information suggests the total cost of winter molt in female mallards is nearly equivalent to the energetic cost of egg laying and incubation. Not only is the loss of feathers involved, but there are thermoregulatory and foraging constraints during molt that are difficult to monitor in the field.
Waterfowl Reproductive Strategies
Each waterfowl species has a unique reproductive strategy. These strategies range from those of
Table 1. Estimated energetic costs of some common waterfowl activities in relation to basal metabolic rate (BMR). Values represent averages from the literature.
Estimated cost Activity × BMR
Resting 1.3 Alert 1.5 Comfort movements 1.5 Oiling/preening 2.0 Courtship 2.0 Social interactions 3.2 Swimming 3.2 Diving 5.0 Flying 12.0−15.0 Egg laying
Early follicular growth 16.7 Maximum during egg-laying 20+
Last egg 10.2
arctic-nesting geese, which transport large fat reserves to breeding habitats, to those of common eiders, which acquire all necessary reserves for reproduction on the breeding grounds (Fig. 3). The locations from which arctic-nesting geese acquire the different components for breeding have not been completely identified, but evidence indicates that most, if not all, of the lipid and protein resources are transported from migratory and wintering habi-
Figure 2. Time required to replenish endogenous fat reserves following and 8-hr migratory move (for a duck weighing 2.5 lb).
2 Fish and Wildlife Leaflet 13.2.1. •• 1988

Figure 3. Reproductive strategiesof four waterfowl species in relation to time in the annual cycle when the lipids and proteins for breeding are required.
tats as body reserves. Environmental conditions in different seasons and on widely separated habitats may have an important influence on the success of sequential activities in the annual cycle of these arctic-nesting geese.
Mallard breeding strategies are differ from strategies of snow geese. Most of the lipid reserves and as much as half of the protein required for reproduction in mallards are transported to the breeding grounds as body reserves. Wood ducks differ from mallards and geese because they acquire lipid and protein reserves for reproduction primarily from breeding habitats. Lipid reserves are acquired from breeding habitats before laying begins, but protein requirements are obtained solely from daily foraging. Common eiders are like wood ducks in that they acquire reserves for egg laying on the breeding grounds. But, unlike wood ducks, they acquire protein and lipid reserves for breeding and store them as reserves before laying begins.
An understanding of the range of strategies and the timing of these needs enables wetland managers at different latitudes to produce the desired resources in a timely manner.
Relation Among Habitat Variables and Waterfowl Use
Waterfowl managers have long recognized the relation among habitat structure, water depth, and water use by waterfowl. The stage in the annual cy-
Table 2. Water depths and vegetative characteristics at foraging sites of some North American waterfowl.
Water Vegetative Species depth structure
Small Canada dry, mudflat Short herbaceous geese Large Canada dry, mudflat Short herbaceous, rank geese <10 inches seed-producing annuals Northern <10 inches Open water with short, pintail sparse vegetation Mallard <10 inches Small openings, tolerate
robust vegetation Ring-necked >10 inches Scattered, robust duck emergents Lesser scaup >10 inches Open water, scattered
submergents
cle and the associated behavioral adaptations of waterfowl determine which resources managers must provide.
Appropriate water depths should be available for effective waterfowl management. Shallow water is essential for dabblers because the optimum foraging depth is 2−10 in. (Table 2). Although diving ducks can exploit deeper water, there is little justification to provide deep waters when they can reach food resources in shallow water. Such strategies decrease costs associated with pumping or supplying water for waterfowl.
Waterfowl have various tolerances for the height and density of vegetation. Sea ducks and divers are adapted to large bodies of open water. Mallards, wood ducks, and blue-winged teal readily use habitats with dense vegetation; northern pintails prefer shallow, open habitats where visibility is good and vegetation sparse.
Little information is available on how waterfowl make decisions relating to where they feed and which foods they select. Nevertheless, geese are known for their ability to select forage of high nutritional content. Complex habitat and nutritional requirements, in conjunction with recent losses and degradations of wetland habitats, require managers to consider a wide array of factors when attempting to optimize use by waterfowl (Table 3).
When conflicting factors are apparent, advanced planning is essential to optimize and maintain desired use of habitats. Such conflicts are apparent to managers facing difficult decisions because the site may provide habitats for breeding, migratory, and wintering waterfowl. Determining a
Fish and Wildlife Leaflet 13.2.1. •• 1988 3

Table 3. Important considerations to ensure optimum use of wetland complexes by waterfowl.
1) Life cycle event Molt Reproduction Migration
2) Behavioral activities Roosting Social behavior Foraging
3) Habitat structure 4) Water depth/regimes 5) Food quality/type 6) Wetland complex 7) Disease 8) Habitat degradations
Habitat losses Habitat perturbations Toxicants Turbidity Modified hydrology Modified structure
9) Disturbance Hunting Other recreation Fishing Water skiing Bird watching Aircraft—military and commercial Research/management Industrial/commercial
reasonable balance of the resources required to meet seasonal requirements of all populations of waterfowl using a specific refuge undoubtedly is more challenging than determining the species of plants needed to provide food and cover.
Resource Availability and Exploitation by Waterfowl
By understanding how waterfowl use resources managers are able to attract and hold waterfowl on managed habitats. Monocultures should be avoided, whether natural plant communities (such as large expanses of dense cattail) or agricultural crops. Manipulation of soil and water to produce habitat structure or foods essential as life requisites may be a necessary part of refuge management. Production of these requisites does not assure that waterfowl will use the resources.
Foods are only accessible if (1) appropriate water depths are maintained during critical time
periods, (2) habitats are protected from disturbance, and (3) habitats that provide protein and energy are close to one another. Disturbance is particularly damaging, because it affects access to and acquisition of requirements throughout the annual cycle (Table 2, Fig. 2). The subtle effects of bird watchers, researchers, and refuge activities during critical biological events may be as detrimental to waterfowl populations as hunting or other water-related recreational activities (boating, etc.). At certain locations, predators or activities associated with barge traffic, oil exploration, or other industrial or military operations are detrimental.
Identification of the proportions of each wetland type within refuge boundaries, and the potential for management within each wetland type, is essential. Wetlands on private or other public property within 10 miles of the refuge boundary should also be used to estimate resources within the foraging range of most waterfowl. As wetlands are lost on areas surrounding refuges, managers will be able to identify special values or needs for certain habitat types on refuges. For example, producing only row crops on refuge lands in extensive areas of agriculture may be less valuable than supplying natural vegetation and associated invertebrates to complement these high-energy agricultural foods. Furthermore, the presence of toxicants or disease may preclude use of some wetlands.
An important part of management is identification of wetlands that are productive and unmodified. These wetlands should be protected in their natural state rather than changed by development. Where man-made or modified wetlands are managed, manipulations that emulate natural wetland complexes and water regimes provide diverse habitats for a variety of waterbirds. Well-timed, gradual changes in water level are effective approaches that provide good conditions for producing foods and desirable foraging depths for game and nongame birds. In fall, many southern habitats are dry, but having pools full before waterfowl arrive and maintaining pools at capacity until after their departure may reduce access to many resources by waterfowl. By providing changing water depths in greentree reservoirs or elsewhere, managers can enhance cost-effectiveness by assuring that resources produced are also used effectively. For example, a management scenario for modifying the time and pattern of fall flooding in a greentree reservoir or a moist-soil impoundment might include four or more approaches to flooding (Figs. 4 and 5).
4 Fish and Wildlife Leaflet 13.2.1. •• 1988

Figure 4. Suggested flooding regimes for southern greentree reservoirs.
Figure 5. Suggested flooding regimes for seasonally flooded wetlands of the Midwest.
Fish and Wildlife Leaflet 13.2.1. •• 1988 5

By recognizing the importance of natural wetland complexes throughout the annual cycles of waterfowl, managers can provide waterfowl with required resources.
Suggested Reading
Ankney, C.D., and C.D. MacInnes. 1978. Nutrient reserves and reproductive performance of female lesser snow geese. Auk 95:459−471.
Drobney, R.D. 1980. Reproductive bioenergetics of wood ducks. Auk 97:480−490.
Drobney, R.D., and L.H. Fredrickson. 1985. Protein acquisition: a possible proximate factor limiting clutch size in wood ducks. Wildfowl 36:122−128.
Fredrickson, L.H. and R.D. Drobney. 1979. Habitat utilization by postbreeding waterfowl. Pages 119−129 in T.A. Bookhout, ed. Waterfowl and wetlands: an integrated review. Proc. 1977 Symp., North Cent. Sect., The Wildl. Soc., Madison, Wis. 147 pp.
Fredrickson, L.H. and M.E. Heitmeyer. 1988. Waterfowl use of forested wetlands in the southeastern United States—an overview. Pages 307−323 in M.W. Weller,
ed. Waterfowl in winter—a symposium and workshop. University of Minnesota Press, Minneapolis.
Fredrickson, L.H., and T.S. Taylor. 1982. Management of seasonally flooded impoundments for wildlife. U.S. Fish and Wildl. Serv., Resour. Publ. 148. 29 pp.
Heitmeyer, M.E., and L.H. Fredrickson. 1981. Do wetland conditions in the Mississippi Delta hardwoods influence mallard recruitment? Trans. N. Am. Wildl. and Nat. Resour. Conf. 46:44−57.
Krapu, G.L. 1979. Nutrition of female dabbling ducks during reproduction. Pages 59−70 in T.A. Bookhout, ed. Waterfowl and wetlands: an integrated review. Proc. 1977 Symp., North Cent. Sect., The Wildl. Soc., Madison, Wis. 147 pp.
Owen, R.B., Jr., and K.J. Reinecke. 1979. Bioenergetics of breeding dabbling ducks. Pages 71−99 in T.A. Bookhout, ed., Waterfowl and wetlands: an integrated review. Proc. 1977 Symp., North Cent. Sect., The Wildl. Soc., Madison, Wis. 147 pp.
Weller, M.W. 1975. Migratory waterfowl: a hemispheric perspective. Publicaciones Biologicas Instituto de Investigaciones Cientificas U.A.N.L. 1:89−130.
White, D.H., and D. James. 1978. Differential use of freshwater environments by wintering waterfowl of coastal Texas. Wilson Bull. 90:99−111.
Appendix. Common and Scientific Names of Animals Named in Text.
Wood duck . . . . . . . . . . . . . . . . . . . . . . . . . . . . . . . . . . . . . . . . . . Aix sponsa Northern pintail . . . . . . . . . . . . . . . . . . . . . . . . . . . . . . . . . . . . . . Anas acuta Blue-winged teal . . . . . . . . . . . . . . . . . . . . . . . . . . . . . . . . . . . . . . Anas discors Mallard . . . . . . . . . . . . . . . . . . . . . . . . . . . . . . . . . . . . . . . Anas platyrhynchos Lesser scaup . . . . . . . . . . . . . . . . . . . . . . . . . . . . . . . . . . . . . . . Aythya affinis Ring-necked duck . . . . . . . . . . . . . . . . . . . . . . . . . . . . . . . . . . . . Aythya collaris Canada goose . . . . . . . . . . . . . . . . . . . . . . . . . . . . . . . . . . . . Branta canadensis Snow goose . . . . . . . . . . . . . . . . . . . . . . . . . . . . . . . . . . . . . . Chen caerulescens Common eider . . . . . . . . . . . . . . . . . . . . . . . . . . . . . . . . . Somateria mollissima
����������������������������������������
������������������������� ���������������������������� ����������������� •• � ����
6 Fish and Wildlife Leaflet 13.2.1. •• 1988

W A T E R F O W L M A N A G E M E N T H A N D B O O K
13.2.2. The North American Waterfowl Management Plan: A New Approach to Wetland Conservation
Angela V. Graziano U.S. Fish and Wildlife Service North American Waterfowl and Wetlands Office Room 340, Arlington Square Washington, D.C. 20240
Diana H. Cross U.S. Fish and Wildlife Service Office of Information Transfer 1201 Oak Ridge Drive, Suite 200 Fort Collins, Colorado 80525
The decline of waterfowl populations and the loss of wetlands are high-ranking environmental concerns in North America. The importance of these issues is reflected in an ambitious wetland recovery plan, the North American Waterfowl Management Plan. Signed in 1986 by the U.S. and Canadian federal governments, the plan features specific strategies to reverse the declines in waterfowl numbers and wetland acreage. The goal is to restore waterfowl populations to a level common to the 1970’s by improving and securing long-term protection of 6 million acres (2.4 million ha) of habitat in 34 areas of major concern.
The key to achieving this goal is partnerships: federal, state, provincial, territorial, and tribal governments joining forces with private conservation organizations and individuals. Early on, it was clear to authors of the plan that securing habitat for waterfowl would also yield benefits for a wealth of other wildlife and plants. Partners in the
plan looked beyond the protection of individual wetlands and single-species management to integrated management of ecosystems on public and private land.
More recently, national programs such as the North American Wetlands Conservation Act, major agricultural legislation, and agreements with Mexico stimulated new ways of approaching the challenge. Recognizing that objectives have increased since 1986 and that benefits to species other than waterfowl could be more explicitly addressed, the North American Waterfowl Management Plan Committee in 1992 initiated a process to update the plan. The update will reflect a thorough evaluation of the implemented plan. In this paper, we describe the current status of the plan, including accomplishments, benefited species, and plans for future projects.
North American Wetlands Conservation Act
The North American Wetlands Conservation Act, passed in 1989, provides matching grants to public-private partnerships for protecting and managing wetland habitats in North America. A key component of the legislation is "… to sustain an abundance of waterfowl and other migratory birds consistent with the goals of the North American Waterfowl Management Plan …." Proposed projects by partners in Canada, Mexico, and the United States are ranked for their
Fish and Wildlife Leaflet 13.2.2. (revised) •• 1993 1

potential benefits to wetland functions and for their ability to further the national and international goals of the plan. All projects must have at least a one-to-one match of non-federal U.S. dollars. Ducks Unlimited, Inc., the National Fish and Wildlife Foundation, and The Nature Conservancy have been primary sources of these matching dollars. A nine-member council appointed by the Secretary of the Interior recommends projects for approval of funding to the Migratory Bird Conservation Commission. The North American Waterfowl and Wetlands Office of the U.S. Fish and Wildlife Service then administers the projects.
Wetland creation, restoration, and acquisition are in all stages of implementation in the United States and Canada. Money appropriated under this act is also supporting conservation education in Mexico, designed to teach people in local communities the importance of wetlands to migratory birds and to other wetland-dependent wildlife and fishes.
Habitat Joint Ventures
The joint venture concept is based on the development of partnerships to meld resources for maximizing financial, organizational, and other in-kind support toward a common objective in a geographic region. A separate management board establishes priorities and direction for each joint venture, while participating federal, provincial, state, and private partners work through state steering committees to carry out projects at the local level. Although each joint venture has different strategies for accomplishing its stated objectives, all depend on multiple partnerships to protect, restore, and enhance targeted habitats.
Atlantic Coast Joint Venture
Scope: Extends from Maine to South Carolina; habitats range from freshwater inland and coastal marshes to estuaries and adjacent upland ecosystems.
Purpose: To provide habitat protection for fishes, shellfishes, mammals, waterfowl, shorebirds, songbirds, and raptors; initially focused on the American black duck. Coastal habitats were destroyed or degraded by commercial and agricultural industrialization.
Progress: Partners in New Jersey are building a bioreserve to connect protected public and private
lands into an unfragmented tract for the survival of a unique diversity of animals and plants, including the largest known concentration of the sensitive joint vetch. The bioreserve will also provide protection for migrating neotropical birds and nesting bald eagles.
Major Partners: Natural Lands Trust; New Jersey Division of Fish, Game, and Wildlife; New Jersey Green Acres Program; New Jersey Waterfowl Stamp Committee; The Nature Conservancy; and U.S. Fish and Wildlife Service.
Central Valley Joint Venture
Scope: The Central Valley of California where about 60% of the waterfowl in the Pacific Flyway spend the winter. The area is also the sole wintering ground for the endangered Aleutian Canada goose.
Purpose: To protect upland and wetland habitat for 55% of the species listed as threatened or endangered in California. Nearly 95% of the original wetlands in this part of California have been lost, primarily to agricultural drainage. This joint venture will provide additional winter habitat for northern pintails and other waterfowl to help disperse the birds and reduce potential threats from disease.
Progress: Secured 14,000 acres (5,666 ha) at Llano Seco Rancho, one of the largest unprotected parcels of riparian forest and wetland remaining in California’s Central Valley.
Major Partners: California Department of Fish and Game; Dow Chemical Company; Ducks Unlimited, Inc.; National Fish and Wildlife Foundation; Parrott Investment Company; The Nature Conservancy; and U.S. Fish and Wildlife Service.
Eastern Habitat Joint Venture
Scope: Encompasses portions of Ontario, Quebec, New Brunswick, Nova Scotia, Newfoundland, and Prince Edward Island. Its focus is on coastal marshes, interior wetlands, and farmland wetlands.
Purpose: To protect 617,000 acres (249,700 ha) of habitat for breeding, staging, and migrating American black ducks, mallards, ring-necked
Fish and Wildlife Leaflet 13.2.2. (revised) •• 1993 2

Fish and Wildlife Leaflet 13.2.2. (revised) •• 1993
ducks, wood ducks, green-winged teals, and sea ducks as well as Canada geese, snow geese, and shorebirds.
Progress: Improving the quality of wetlands through vegetation management and installation of water-control structures. Partners are seeking agreements with landowners to leave green belts and trees with cavities and to manage beaver impoundments. Special private land programs will affect the management of another 3.9 million acres (1.6 million ha).
Major Partners: Agriculture Canada; Canadian Wildlife Service; Ducks Unlimited, Canada; Ducks Unlimited, Inc.; the provinces of Ontario, Quebec, New Brunswick, Nova Scotia, Newfoundland, and Prince Edward Island; U.S. Fish and Wildlife Service; and Wildlife Habitat Canada.
Gulf Coast Joint Venture
Scope: The coastal area bordering the Gulf of Mexico from Texas to Alabama, one of the most important sites for wintering waterfowl in North America.
Purpose: To protect coastal marshes and wetlands and associated uplands that are habitat for wintering waterfowl, endangered whooping cranes, peregrine falcons, and five species of sea turtles; to protect additional habitat for wintering mallards and northern pintails and to increase the carrying capacity for birds on already acquired lands and water. Implementation of this joint venture will also benefit numerous species of fishes, shellfishes, migrating shorebirds, and other wildlife.
Progress: Enhancing and restoring 23,000 acres (9,308 ha) of permanent and seasonal wetlands under 10-year agreements with private landowners on more than 600 sites in Texas, Louisiana, and Mississippi. Much of the habitat gains will be on actually farmed lands. The remaining acreage will be restored palustrine emergent and forested wetlands.
Partners: More than 100 landowners; state agencies; and U.S. Fish and Wildlife Service.
Lower Great Lakes/St. Lawrence Basin Joint Venture
Scope: Wetlands along the Lower Great Lakes and the St. Lawrence Basin in Vermont, New York, Pennsylvania, Ohio, and Michigan.
Purpose: To protect habitat of breeding and migrating birds by restoring privately owned
3

wetlands and enhancing federal- and state-owned areas.
Progress: The Ohio Division of Wildlife is leading the restoration of 5,200 acres (2,104 ha) of freshwater coastal marshes and estuaries along the Lake Erie shores. The division also plans to create 1,300 acres (526 ha) of wetlands and enhance 2,600 acres (1,052 ha) of state-owned waterfowl habitat.
Major Partners: Ducks Unlimited, Inc.; Ohio Division of Wildlife; Pennsylvania Game Commission and other state agencies; The Nature Conservancy; and U.S. Fish and Wildlife Service.
Lower Mississippi Valley Joint Venture
Scope: Encompasses sections of 10 states: Oklahoma, Texas, Missouri, Arkansas, Louisiana, Illinois, Indiana, Kentucky, Tennessee, and Mississippi. Most mid-continent waterfowl, especially mallards, winter in this area, which is also habitat for songbirds, shorebirds, wading birds, furbearers, reptiles, and invertebrates.
Purpose: To protect 300,000 acres (12,141 ha) of habitat in the Lower Mississippi River Valley and enhance 1.6 million acres (0.6 million ha) of additional habitat for wintering mallards and northern pintails, to increase the carrying capacity for wintering birds on land and water already acquired for waterfowl, and to provide higher quality habitat for other wetland wildlife.
Progress: Partners are compensating farmers for adopting conservation-farming practices and are sharing costs of water-control structures that benefit wildlife while improving soil and water conservation.
Major Partners: Ducks Unlimited, Inc.; state conservation agencies; private landowners; National Fish and Wildlife Foundation; The Nature Conservancy; and U.S. Fish and Wildlife Service.
Pacific Coast Joint Venture
Scope: Stretches from northern California to the Skeena River in British Columbia. This is the first joint venture with habitat in both the United States and Canada; the targeted area consists largely of islands, estuaries, freshwater wetlands, and agricultural lands on the floodplains of the creeks and rivers.
Purpose: Habitat protection sought by the United States for three birds of concern to both countries—the lesser snow goose, the black brant, and the trumpeter swan. Emphasis in Canada will also be placed on these birds as well as on the large
Fish and Wildlife Leaflet 13.2.2. (revised) •• 1993 4

wintering and migrating populations of mallards and northern pintails. Shorebird habitats will be protected in the process.
Progress: Since inception of this joint venture in 1991, 20,000 acres (8,094 ha) of habitat affected at a cost of more than $42 million.
Major Partners: Ducks Unlimited, Inc.; The Nature Conservancy; states.
Playa Lakes Joint Venture Scope: More than 25,000
shallow basins known as playas scattered over the southern high plains in Colorado, Kansas, Oklahoma, Texas, and New Mexico. Playa lakes provide important habitat for migrating and wintering waterfowl and other migratory birds in the Central Flyway.
Purpose: To ensure adequate habitat (land and water) for breeding, migrating, and wintering waterfowl and other migratory birds through land acquisition and management.
Progress: Oklahoma Department of Wildlife Conservation received deed on a playa in Texas County in December 1991; will manage area for waterfowl and other migratory birds. In Kansas, easements to flood playas are in effect with five landowners. The Playa Lakes Joint Venture received recognition by President Bush in the first annual President’s Environmental and Conservation Awards in October 1991.
Major Partners: Landowners joined in partnership with the National Fish and Wildlife Foundation, Phillips Petroleum, all five state wildlife agencies, The Nature Conservancy, and U.S. Fish and Wildlife Service. Because more than 99% of the playa lakes are privately owned, partnerships are critical to management of these unique wetlands.
Prairie Habitat Joint Venture Scope: Prairie and parkland regions
of Manitoba, Saskatchewan, and Alberta, which provide the continent’s most important breeding areas for the mallard, the northern pintail, the blue-winged teal, other prairie ducks, and shorebirds and wading birds.
Fish and Wildlife Leaflet 13.2.2. (revised) •• 1993
Purpose: To protect and enhance about 3.6 million acres (1.5 million ha) of habitat for breeding waterfowl and to preserve wetlands and improve the surrounding upland acres by planting nesting cover.
Progress: Prairie CARE (Conservation of Agriculture, Resources, and the Environment) programs used in the three provinces. Prairie CARE pays farmers to set aside parcels of land as natural habitat or to change management practices. The program also provides financial and technical assistance to farm and conservation associations for field demonstrations, allowing farmers to experiment with new farming methods, such as stubble mulching, fall seeding, direct seeding, and rotational grazing, without financial risk.
Major Partners: Canadian Wildlife Service; Ducks Unlimited Canada; provinces of Alberta, Manitoba, and Saskatchewan; and U.S. Fish and Wildlife Service.
Prairie Pothole Joint Venture
Scope: The prairie pothole region, including some 300,000 square miles from south-central Canada to the north-central United States. Although widely known for its excellent habitat for breeding ducks, the region also supports about 225 other species of birds, including endangered species, and small mammals, fishes, and reptiles.
Purpose: To protect and improve breeding habitat in the mid-continent at a ratio of 3 acres of upland nesting cover/acre of water. During the last 50 years, much of this vital habitat has been lost to increased agricultural production and drainage.
Progress: Partners are developing incentives for landowners who restore wetlands, alter grazing systems, delay hay-cutting to spare nests, cooperate on predator control, and practice no-till or minimum-till cultivation. The joint venture is accomplishing its goals through existing agricultural programs and education.
Major Partners: Ducks Unlimited, Inc.; National Audubon Society; National Wildlife Federation; five state fish and game departments; The Nature Conservancy; U.S. Fish and Wildlife Service; and Wildlife Management Institute.
Rainwater Basin Joint Venture
Scope: The Rainwater Basin of south-central Nebraska, which includes parts of 17 counties in the state that are critical habitat during spring and fall migration for millions of geese and ducks.
5

Purpose: To protect 9,000 acres (3,642 ha) of existing wetlands, restore or create an additional 15,000 acres (6,070 ha), and provide reliable water sources for at least one-third of protected wetlands. These areas have been severely degraded by agricultural operations over the years.
Progress: Recently formed joint venture in process of identifying restoration projects and forging partnerships. So far, the U.S. Fish and Wildlife Service has improved 560 acres (227 ha) of managed wetlands and indirectly benefited the entire 1,163 acres (471 ha) of wetlands on its Funk Lagoon Waterfowl Production Area in Phelps County, Nebraska.
Upper Mississippi River/Great Lakes Region Joint Venture
Scope: Boundaries stretch over Minnesota, Iowa, Missouri, Wisconsin, Illinois, Indiana, and Michigan; include important migration and staging areas that were converted to agriculture.
Purpose: To increase populations of waterfowl and other wetland wildlife by protecting, restoring, creating, and enhancing wetlands and associated upland habitats.
Progress: Partners are striving to increase public awareness through information and education and are providing incentives to private landowners.
Partners: Private landowners; National Fish and Wildlife Foundation; state agencies; and U.S. Fish and Wildlife Service.
Species Joint Ventures In contrast with habitat joint ventures, which
direct efforts to projects on the ground, species joint ventures were established to address critical information gaps for several species. This information is used to identify necessary research and monitoring, to assign priorities from a continental perspective, to promote and encourage funding and participation in priority research, and to facilitate timely dissemination of information.
Arctic Goose Joint Venture Several species of geese nest primarily in arctic
North America where research and monitoring are difficult and costly. As a result, knowledge of the
distribution, productivity, and other life-history factors of geese that nest in the arctic is limited. The goal of this international joint venture is to facilitate research and monitoring of these geese throughout their range and to improve communication among all partners. Attention is focused on subspecies of the brant, the greater white-fronted goose, the Canada goose, and the snow goose.
Black Duck Joint Venture
The American black duck, once the most abundant freshwater duck in eastern North America, reached a population low in the 1980’s after a 30-year decline. Habitat loss, competition with mallards, hunting mortality, and a myriad of other problems contributed to this decline.
The charge of the Black Duck Joint Venture is to coordinate and promote data gathering— surveys, banding, and research—among flyway councils, universities, and federal, provincial, and state conservation agencies to improve population and habitat management. The gathered information will assist the existing habitat-based joint ventures that are central to the historic habitat of the American black duck.
What is in Store for the North American Plan
In January 1992, the North American Waterfowl Management Plan Committee endorsed a comprehensive evaluation to ensure that the habitat management programs are achieving the goals and objectives of the plan. The evaluation will include tracking of accomplishments, monitoring of habitat and population responses, assessing whether ventures are sufficiently extensive and appropriate, and providing information to guide further implementation. Research scientists have a major role in the evaluation.
To meet the challenges of wetland loss requires a shared vision and commitment among a multitude of partners for protecting, restoring, and enhancing critical habitat that supports wetland wildlife. These collective commitments will ensure that the natural areas needed by a diversity of wildlife will be preserved.
6 Fish and Wildlife Leaflet 13.2.2. (revised) •• 1993

Appendix. Common and Scientific Names of the Birds and Plant Named in the Text.
Birds Wood duck . . . . . . . . . . . . . . . . . . . . . . . . . . . . . . . . . . . . . . . . . . . . . . . Aix sponsa Northern pintail . . . . . . . . . . . . . . . . . . . . . . . . . . . . . . . . . . . . . . . . . . . Anas acuta Green-winged teal . . . . . . . . . . . . . . . . . . . . . . . . . . . . . . . . . . . . . . . . . Anas crecca Blue-winged teal . . . . . . . . . . . . . . . . . . . . . . . . . . . . . . . . . . . . . . . . . . Anas discors Mallard . . . . . . . . . . . . . . . . . . . . . . . . . . . . . . . . . . . . . . . . . . . Anas platyrhynchos American black duck . . . . . . . . . . . . . . . . . . . . . . . . . . . . . . . . . . . . . . . Anas rubripes Greater white-fronted goose . . . . . . . . . . . . . . . . . . . . . . . . . . . . . . . . . . Anser albifrons Ring-necked duck . . . . . . . . . . . . . . . . . . . . . . . . . . . . . . . . . . . . . . . . . Aythya collaris Brant . . . . . . . . . . . . . . . . . . . . . . . . . . . . . . . . . . . . . . . . . . . . . . Branta bernicla Black brant . . . . . . . . . . . . . . . . . . . . . . . . . . . . . . . . . . . . . . . . . . . . B. b. nigricans Canada goose . . . . . . . . . . . . . . . . . . . . . . . . . . . . . . . . . . . . . . . . . Branta canadensis Aleutian Canada goose . . . . . . . . . . . . . . . . . . . . . . . . . . . . . . . . . . . . . B. c. leucopareia Snow goose . . . . . . . . . . . . . . . . . . . . . . . . . . . . . . . . . . . . . . . . . . Chen caerulescens Lesser snow goose . . . . . . . . . . . . . . . . . . . . . . . . . . . . . . . . . . . . . . C. c. caerulescens Trumpeter swan . . . . . . . . . . . . . . . . . . . . . . . . . . . . . . . . . . . . . . . Cygnus buccinator Peregrine falcon . . . . . . . . . . . . . . . . . . . . . . . . . . . . . . . . . . . . . . . . Falco peregrinus Whooping crane . . . . . . . . . . . . . . . . . . . . . . . . . . . . . . . . . . . . . . . . . Grus canadensis Bald eagle . . . . . . . . . . . . . . . . . . . . . . . . . . . . . . . . . . . . . . . Haliaeetus leucocephalus
Plant Sensitive joint vetch . . . . . . . . . . . . . . . . . . . . . . . . . . . . . . . . . . Aeschynomene virginia
Note: Use of trade names does not imply U.S. Government endorsement of commercial products.
UNITED STATES DEPARTMENT OF THE INTERIOR FISH AND WILDLIFE SERVICE
Fish and Wildlife Leaflet 13 Washington, D.C. •• 1993
7

W A T E R F O W L M A N A G E M E N T H A N D B O O K
13.2.4. Avian Botulism: Geographic Expansion of a Historic Disease
Louis N. Locke and Milton Friend U.S. Fish and Wildlife Service National Wildlife Health Research Center 6006 Schroeder Road Madison, WI 53711
Synonyms
Limberneck, western duck sickness, duck disease, alkali poisoning
Cause
Avian botulism is a paralytic, often fatal disease of birds resulting from ingestion of toxin produced by the bacterium Clostridium botulinum. Waterfowl die-offs from the botulism are usually caused by type C toxin; sporadic die-offs among fish-eating birds, such as common loons (Gavia immer) and gulls, have been caused by type E toxin.
Not enough is known about avian botulism to precisely identify the factors leading to an outbreak. When an outbreak does occur, it is usually perpetuated by a well-understood bird-maggot cycle (Figure 1).
Clostridium botulinum persists in wetlands in a spore form that is resistant to heat and drying and in some instances remains viable for years. Toxin production occurs during multiplication of the vegetative form of the bacteria following spore germination. The vegetative form requires dead organic matter and a complete absence of oxygen to grow and produce toxin. Optimum growth of the
bacteria occurs at about 25° C (77° F). Toxin production is optimized within a pH range of 5.7 to 6.2 and depends on the protein content of the medium in which the bacteria are growing. All kinds of animal protein are suitable for toxin production. Especially potent toxin is produced in bird, mammal, and a variety of invertebrate carcasses. This entire process is further complicated by a poorly understood but important role of bacteriophages—viruses that infect bacteria. Recent findings show that bacteriophages determine if toxin will be produced during C. botulinum growth and multiplication stages.
Important environmental factors that contribute to initiation of avian botulism outbreaks include water depth, water level fluctuations, and water quality; the presence of vertebrate and invertebrate carcasses; rotting vegetation; and high ambient temperatures.
Shallow water permits rapid warming of the submerged marsh soil during periods of high ambient temperatures. Toxin is produced when these soils contain both the spores of C. botulinum and suitable organic nutrients for spore germination and reproduction of bacterial cells. Fluctuating water levels that produce “feather edge” shorelines contribute to avian botulism outbreaks when terrestrial and aquatic invertebrates die as land areas are flooded and the underwater areas subsequently become dry when the water recedes. Fertilization of a marsh with sewage or run-off from agricultural activities can stimulate plant or invertebrate animal population growth for short periods, but results in plant and vertebrate die-offs once this stimulus subsides. The resulting mass of nutrients is then
Adapted from: Friend, M., editor. 1987. Field guide to wildlife diseases. U.S. Fish Wildl. Serv., Resour. Publ. 167. 225 pp.
Fish and Wildlife Leaflet 13.2.4. •• 1989 1

Figure 1. Avian botulism cycle.
available for growth of C. botulinum and toxin production. Dense vegetation can entrap and thus kill fish, amphibians, or invertebrates, and masses of rotting marsh plants can reduce oxygen levels to the point that aquatic animal life is killed. Both of these conditions provide large amounts of growth material for toxin production. The presence of vertebrate carcasses and high ambient temperatures are also conducive to the buildup of fly populations involved in the bird-maggot cycle for avian botulism transmission.
Species Affected
Many species of birds and some mammals are affected by type C botulism. In the wild, waterfowl and shorebirds are most often affected (Figure 2). Vultures are known to be highly resistant to type C toxin.
Losses vary a great deal from year to year at site-specific locations and from species to species. A few hundred birds may die in 1 year and tens of thousands or more the following year. More than a million deaths from avian botulism have been reported in relatively localized outbreaks in a single year, and outbreaks with losses of 50,000 birds or more have been relatively common (Table 1).
Figure 2. Frequency of botulism in major groups of wild birds.
2 Fish and Wildlife Leaflet 13.2.4. •• 1989

Table 1. Major waterfowl botulism outbreaks.
Location Year Estimated loss
Utah and California 1910 millions Lake Malheur, Oregon 1925 100,000 Great Salt Lake, Utah 1929 100,000−300,000 Tulare Basin, California 1941 250,000 Western United States 1952 4−5 million Montana (near Billings) 1978 50,000 Montana (near Billings) 1979 100,000 Great Salt Lake, Utah 1980 110,000
Distribution
Outbreaks of avian botulism have occurred in the United States and Canada since the beginning of the century, if not earlier. Outbreaks have also been reported to occur in many other countries. Most of these reports are recent, usually within the past 20 years (Table 2). Most type C outbreaks within the United States occur west of the Mississippi River; however, outbreaks have occurred from
Table 2. Initial outbreaks by location of type C avian botulism in wild waterfowl.
Location Year Location Year
The Americas Europe United States 1910 Sweden 1963 Canada 1913 Denmark 1967 Uruguay 1921 England 1969 Mexico 1976 Netherlands 1970 Argentina 1979 East Germany 1971 Brazil 1982 West Germany 1971 Australia-Asia Italy 1973 Australia 1934 Spain 1973 New Zealand 1972 Norway 1975 Japan 1973 Scotland 1977 Africa Czechoslovakia 1981
Union of South Africa 1956 Wales 1983
coast-to-coast and border-to-border (Figure 3). Type E outbreaks in birds are much less frequent and within the conterminous United States have been confined to the Great Lakes region.
Figure 3. Frequency of type C botulism in waterfowl.
Fish and Wildlife Leaflet 13.2.4. •• 1989 3

Seasonality
July through September are the primary months for type C avian botulism outbreaks in the United States and Canada. However, outbreaks occur as late as December and January and occasionally during early spring in southern portions of the United States and in California. Type E outbreaks have occurred during late fall and spring.
Field Signs
Lines of carcasses coinciding with receding water levels generally typify the appearance of major die-offs, although outbreaks have also occurred in impoundments containing several feet of water, lakes with stable water levels, and in large rivers. When receding water conditions are involved, botulism is typically a disease of the water’s edge, and seldom are sick or dead birds found very far from the vegetation bordering the water or the original water’s edge. In impoundments where water levels are relatively stable, affected birds are likely to be found in areas of flooded vegetation. Botulism-affected birds also tend to congregate along vegetated peninsulas and islands.
Healthy birds, sick birds, and recently dead birds will commonly be found together during a botulism outbreak, along with carcasses in various stages of postmortem decay. Often, a variety of species representing two or three or even more orders of birds suffer losses simultaneously.
Avian botulism affects the peripheral nerves and results in paralysis of voluntary muscles. Inability to sustain flight is seen early in botulism. Once the power of flight is lost and paralysis of leg muscles has occurred, ducks suffering from botulism often propel themselves across the water and mud flats with their wings. This sequence of signs contrasts with that of lead-poisoned birds, which retain their ability to walk and run even though flight becomes difficult.
Paralysis of the inner eyelid or nictitating membrane (Figure 4) and neck muscles follows, resulting in inability to hold the head erect (Figure 5). These are the two most easily recognizable signs of avian botulism. Once birds reach this stage, death from drowning often occurs before the bird might otherwise die from the respiratory failure caused by botulinum toxin.
Avian botulism often occurs in the seasons when waterfowl are flightless because of wing molt. Care then must be taken to separate birds in molt
Figure 4. Paralysis of the inner eyelid is a common sign in botulinum-intoxicated birds.
Figure 5. Paralysis of the neck muscles in bitulinumintoxicated birds results in inability to hold the head erect (limberneck). Death by drowning often results.
from those with early stages of intoxication because the behavior of these birds may be similar. Molting birds are difficult to catch and birds that cannot be captured with a reasonable effort should not be pursued further. If these birds are suffering from botulism, they can be easily captured when they become unable to dive to escape pursuit. Birds at this level of intoxication still have a high probability for survival if proper treatment is administered.
Gross Lesions
There are no characteristic or diagnostic gross lesions in waterfowl dying of type C or type E botulism.
Fish and Wildlife Leaflet 13.2.4. •• 1989 4

Diagnosis
The most reliable test for avian botulism is the mouse protection test. Blood is collected from a sick or freshly dead bird and the serum fraction is then inoculated into two groups of laboratory mice, one group of which has been given type-specific antitoxin. The mice receiving antitoxin will survive and those that receive no antitoxin will become sick or die with characteristic signs if botulinum toxin is present in the serum sample.
Control
Management of Environment Control efforts need to focus on three impor
tant factors that contribute to the development and maintenance of avian botulism outbreaks: fluctuating water levels during hot summer months, an abundance of flies, and animal carcasses for toxin production. On areas managed primarily for migratory waterfowl (ducks, geese, swans), reflooding of land that has been dry for a long time is not recommended during summer. Similarly, sharp drawdowns of water should be avoided since they could result in fish-kills and die-offs of aquatic invertebrates whose carcasses could then become centers for the growth of C. botulinum. On those areas managed primarily for shorebirds, water drawdowns are essential, and botulism control must focus on a cleanup of any carcasses that may result.
Prompt removal and proper disposal of vertebrate carcasses by burial or burning are highly effective mechanisms for removing the major sources of toxin production and maggot development. The importance of prompt and thorough carcass removal and proper disposal cannot be overemphasized. Several thousand toxic maggots can be produced from a single waterfowl carcass. Consumption of as few as two to four of these toxic maggots can result in intoxication of a duck, thereby perpetuating the botulism cycle. It is not uncommon to find three or four freshly dead birds within a few feet of a maggot-laden carcass. Failure to carry out adequate carcass removal and disposal programs can result in a rapid buildup of highly toxic materials, and can accelerate losses as well as seed the environment with C. botulinum toxin and spores as the carcasses decompose. Toxin formed in these carcasses is quite stable. This preformed toxin can be taken in by inverte-
Fish and Wildlife Leaflet 13.2.4. •• 1989
brates, remain free in bottom sediments, or become suspended in the water column where it can serve as the source of winter and spring botulism outbreaks when ingested by feeding birds.
Many botulism outbreaks occur on the same wetlands year after year, and within a wetland there may be localized “hot spots.” Also, outbreaks often follow a fairly consistent and predictable time sequence. These conditions have direct management implications that should be applied toward minimizing losses. Specific actions that should be taken include accurately documenting conditions and dates of outbreaks in problem areas, planning for and implementing intensified surveillance and carcass pickup and disposal, and modifying habitats to reduce the potential for botulism losses and deny bird use on major problem areas during the botulism “season.” Surveillance and carcass disposal activities should start 10 to 15 days before the earliest documented cases and continue 10 to 15 days after the end of the botulism “season.” Habitat modifications will primarily involve control of water quality and water levels.
Because fish carcasses can also serve as sites for C. botulinum growth, they should be promptly removed during fish control programs in marsh environments, or fish control programs should be restricted to the cooler months (non-fly season). Power lines that cross marsh environments have been associated with major botulism outbreaks. Bird carcasses from collisions with power lines have served as initial points for toxin production within the marsh environment. Therefore, if possible, power lines should not be placed across marsh environments used by large concentrations of water birds.
Numerous outbreaks of avian botulism have been associated with sewage and other wastewater discharge into marsh environments. This relation is not presently understood, but has occurred often enough that wetland managers should discourage the discharges of these effluents when substantial waterfowl or shorebird use occurs or is likely to occur on an area during the ensuing 30 days.
Treatment of Sick Birds
Studies at Bear River Refuge, Utah, have clearly demonstrated that a high percentage of botulinum-intoxicated waterfowl can be saved. If the birds are provided with fresh water and shade, or injected with antitoxin, recovery rates of 75−90% and higher can result. In contrast with waterfowl,
5

very few American coots (Fulica americana), shorebirds, gulls, and grebes have survived treatment for botulism. Experience to date with these species indicates that rehabilitation efforts are not worthwhile.
When botulinum-intoxicated birds are treated, the birds should be maintained under conditions that provide unrestricted access to fresh water, maximum provision for shade, an opportunity for birds that recover to fly out of the enclosure when they choose to, and minimum disturbance (including presence of humans). It is also important to remove carcasses daily from enclosures to prevent the buildup of toxic maggots within the treatment area, and to monitor the cause of mortality since one cannot assume botulism is the cause. The weakened condition of botulinum-intoxicated birds can result in the eruption of infectious disease such as avian cholera. Should this occur, it is essential to immediately address the infectious disease problem.
Costs associated with capturing and treating sick birds are high. Therefore, the emphasis for dealing with avian botulism should be on prevention and control of this disease rather than on treatment of intoxicated birds. However, antitoxin should be available for use in case endangered species are affected. The National Wildlife Health Research Center has produced and maintains anti
toxin for this purpose. Contact the center’s Resource Health Team for assistance.
Human Health Considerations Botulism in humans is usually the result of
eating improperly home-canned foods and is most often caused by type A or type B botulinum toxin. There have been a few human cases of type E botulism in North America as the result of eating improperly smoked or cooked fish or marine products. Although humans are regarded as being fairly resistant to type C botulinum toxin, at least two cases of type C botulism have been reported, although the origins were unidentified. Thorough cooking destroys botulinum toxin in food.
Suggested Reading Eklund, M. W., and V. R. Dowell, Jr., editors. 1987.
Avian botulism: an international perspective. Charles C. Thomas, Springfield, Ill. xxi + 405 pp.
Friend, M., editor. 1987. Field guide to wildlife diseases. U.S. Fish Wildl. Serv., Resour. Publ. 167. 225 pp.
Rosen, M. N. 1971. Botulism. Pages 100−117 in J. W. Davis, R. C. Anderson, L. Karstad, and D. 0. Trainer, eds. Infectious and parasitic diseases of wild birds. Iowa State University Press, Ames.
Wobeser, G. A. 1981. Diseases of wild waterfowl. Plenum Press, New York. xii + 300 pp.
����������������������������������������
������������������������� ���������������������������� ����������������� •• � ����
6 Fish and Wildlife Leaflet 13.2.4. •• 1989
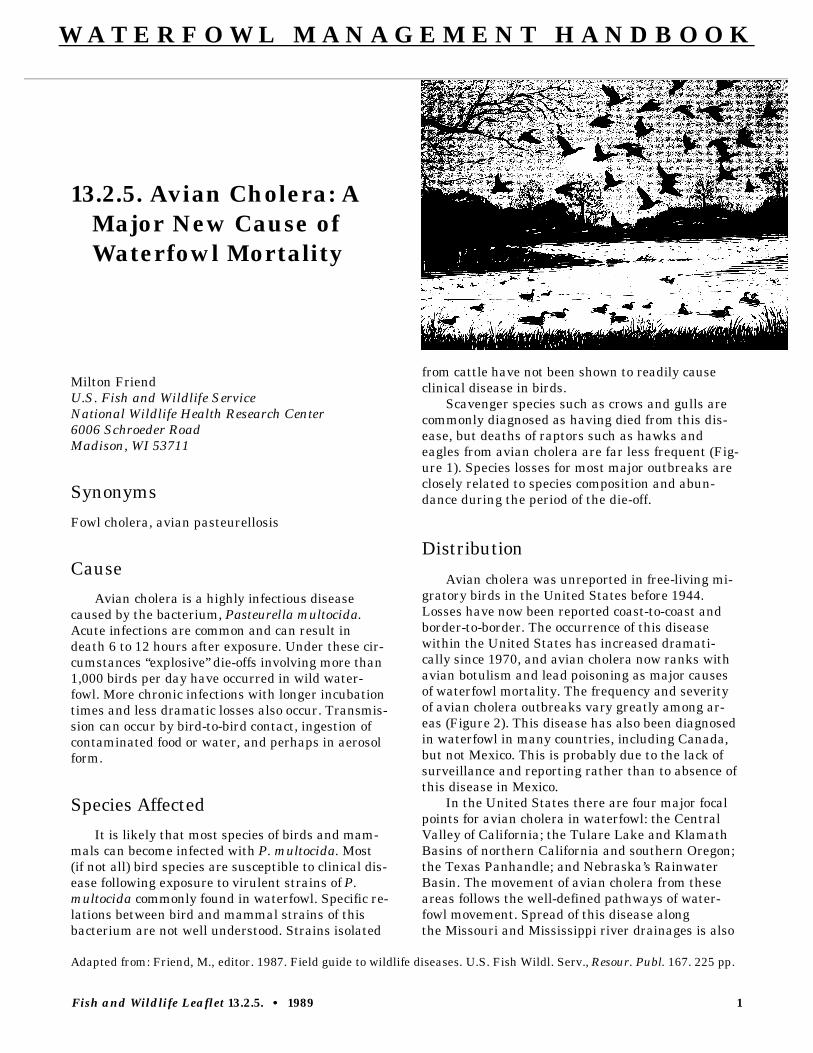
W A T E R F O W L M A N A G E M E N T H A N D B O O K
13.2.5. Avian Cholera: A Major New Cause of Waterfowl Mortality
Milton Friend U.S. Fish and Wildlife Service National Wildlife Health Research Center 6006 Schroeder Road Madison, WI 53711
Synonyms
Fowl cholera, avian pasteurellosis
Cause
Avian cholera is a highly infectious disease caused by the bacterium, Pasteurella multocida. Acute infections are common and can result in death 6 to 12 hours after exposure. Under these circumstances “explosive” die-offs involving more than 1,000 birds per day have occurred in wild waterfowl. More chronic infections with longer incubation times and less dramatic losses also occur. Transmission can occur by bird-to-bird contact, ingestion of contaminated food or water, and perhaps in aerosol form.
Species Affected
It is likely that most species of birds and mammals can become infected with P. multocida. Most (if not all) bird species are susceptible to clinical disease following exposure to virulent strains of P. multocida commonly found in waterfowl. Specific relations between bird and mammal strains of this bacterium are not well understood. Strains isolated
from cattle have not been shown to readily cause clinical disease in birds.
Scavenger species such as crows and gulls are commonly diagnosed as having died from this disease, but deaths of raptors such as hawks and eagles from avian cholera are far less frequent (Figure 1). Species losses for most major outbreaks are closely related to species composition and abundance during the period of the die-off.
Distribution
Avian cholera was unreported in free-living migratory birds in the United States before 1944. Losses have now been reported coast-to-coast and border-to-border. The occurrence of this disease within the United States has increased dramatically since 1970, and avian cholera now ranks with avian botulism and lead poisoning as major causes of waterfowl mortality. The frequency and severity of avian cholera outbreaks vary greatly among areas (Figure 2). This disease has also been diagnosed in waterfowl in many countries, including Canada, but not Mexico. This is probably due to the lack of surveillance and reporting rather than to absence of this disease in Mexico.
In the United States there are four major focal points for avian cholera in waterfowl: the Central Valley of California; the Tulare Lake and Klamath Basins of northern California and southern Oregon; the Texas Panhandle; and Nebraska’s Rainwater Basin. The movement of avian cholera from these areas follows the well-defined pathways of waterfowl movement. Spread of this disease along the Missouri and Mississippi river drainages is also
Adapted from: Friend, M., editor. 1987. Field guide to wildlife diseases. U.S. Fish Wildl. Serv., Resour. Publ. 167. 225 pp.
Fish and Wildlife Leaflet 13.2.5. •• 1989 1

Figure 1. Relative occurrence of avian cholera in wild birds.
consistent with waterfowl movement. No consistent patterns of avian cholera outbreaks exist within the Atlantic Flyway except for periodic occurrences in eiders nesting off the coast of Maine (Figure 3).
Seasonality
Losses can occur at any time of the year. A major loss of snow geese occurred in spring on Canadian breeding grounds, in addition to losses of breeding eiders in Maine and Quebec. Outbreaks in California normally start during fall and continue into spring. Late winter is the peak time for avian cholera in the Texas Panhandle, and spring migration has resulted in annual losses from this disease in Nebraska’s Rainwater Basin since 1975 and in western Saskatchewan, Canada, since 1977.
Field Signs
Few sick birds are seen during avian cholera outbreaks because of the acute nature of this disease. However, the number of sick birds increases when a die-off is prolonged over several weeks. Sick birds often appear lethargic or drowsy and can be
approached quite closely before attempting escape. When captured, these birds often die quickly, sometimes within a few seconds or minutes after being handled. Other birds have convulsions, swim in circles, or throw their heads back between their wings and die. These signs are similar to those seen in duck plague and in some types of pesticide poisoning. Other signs include erratic flight, such as flying upside down before plunging into the water or onto the ground and attempting to land a foot or more above the surface of the water.
Always suspect avian cholera when large numbers of dead waterfowl are found in a short time, few sick birds are seen, and the dead birds appear to be in good flesh. When sick birds are captured and die within a few minutes, avian cholera should also be suspected. None of the signs described above are unique to this disease; their occurrence should be recorded as part of any history being submitted with specimens and must be considered along with lesions seen at necropsy.
Gross Lesions
Under most conditions, birds that have died of avian cholera have substantial amounts of subcutaneous and visceral fat (except for seasonal losses of fat). The most prominent lesions seen at necropsy involve the heart and liver and sometimes the gizzard. Hemorrhages of various sizes are frequently found on the surface of the heart muscle or the coronary band. Hemorrhages are also sometimes visible on the surface of the gizzard. Areas of tissue death that appear as small white to yellow spots are commonly seen within the liver. Where the area of tissue death is greater, the spots are larger and in some instances the area of tissue death is quite extensive.
The lower portions of the digestive tract (below the gizzard) commonly contain thickened yellowish fluid that is heavily laden with P. multocida.
Diagnosis
As with all diseases, isolation of the causative agent is required for a definitive diagnosis. Submitting a whole carcass provides the diagnostician with the opportunity to evaluate gross lesions seen at necropsy and also provides all appropriate tissues for isolation of P. multocida.
When it is not possible to send whole carcasses, tissues should be sent that can be collected in as
Fish and Wildlife Leaflet 13.2.5. •• 1989 2

Figure 2. Reported distribution of avian cholera in wild birds.
Figure 3. The occurrence of avian cholera in waterfowl seems to be closely related to bird movements west of the Mississippi River. There is no apparent pattern for outbreaks along the Atlantic seaboard.
Fish and Wildlife Leaflet 13.2.5. •• 1989 3

sterile a manner as possible in the field. The most suitable tissues for culturing are heart blood, liver, and bone marrow. Remove the entire heart and place in a Whirl-Pak bag for shipment as identified in the “Field Guide to Wildlife Diseases”; do not attempt to remove the blood from the heart. The liver should also be removed and placed in a separate bag; if it cannot be removed intact, submit a major portion of this organ (at least half). Refrigerate these samples as soon as possible after collection and insure that they are kept cool during shipment. When shipment is to be delayed for more than a day or transit time is expected to exceed 24 hours, freeze these specimens.
Pasteurella multocida persists for several weeks to several months in bone marrow. The wings of badly scavenged or decomposed carcasses should be submitted whenever avian cholera is suspected as the cause of death and more suitable tissue samples are not available.
Control
Spread of avian cholera through waterfowl and other migratory bird populations is enhanced by the gregarious nature of most waterfowl species and by dense concentrations of birds that result from habitat limitations. Prolonged environmental persistence of this bacteria further promotes new outbreaks. Pond water remained infective for 3 weeks after dead birds were removed from one area in California; survival in soil for up to 4 months was reported in another study; persistence of this organism in decaying bird carcasses occurred for at least 3 months.
Early detection of avian cholera outbreaks should include frequent surveillance of areas where migratory birds are concentrated, as a first line of defense in controlling this disease. The opportunity to prevent substantial losses is greatest during the early stages of outbreaks. Control actions need to be focused on minimizing exposure of migratory and scavenger bird species to P. multocida and minimizing environmental contamination by this organism.
We recommend rigorous collection and incineration of carcasses as standard procedures. Carcass collection contributes to avian cholera control in several ways. Several milliliters of fluids containing large concentrations of P. multocida are often discharged from the mouths of birds dying from this disease, resulting in heavy contamination of the surrounding area. Carcass decomposition results in additional contamination. These carcasses serve to
attract (decoy) other birds, thereby increasing the probability for infection. Scavenging of carcasses also results in disease transmission through the direct consumption of diseased tissue (oral exposure).
Care must be exercised during carcass collection to minimize the amount of fluid discharged into the environment from the mouths of birds. Pick birds up head first, preferably by the bill, and immediately place in plastic bags. Double-bagging is recommended to prevent fluids leaking from punctures that may occur in the inner bag. Bags of carcasses should always be securely closed before being removed from the area.
Prompt carcass removal also prevents scavenging by birds that can mechanically transport infected material to other sites or by feeding or drinking at other locations following consumption of infected tissue. This situation is aggravated by apparent longer disease incubation times in gulls, crows, and some other avian scavengers. Instead of dying within hours or 1 to 2 days after exposure to virulent strains of P. multocida, death more typically occurs after several days to 1 to 2 weeks. Death may occur at locations far from the site where the bird was exposed. When these birds die, they serve as new potential focal points for contamination.
Population reduction of infected American coots, crows, eiders, gulls, and terns has been used to combat avian cholera. Destruction of migratory birds infected with this disease can be justified only under special circumstances and conditions: (1) the outbreak must be discrete and localized rather than generalized and widespread; (2) techniques must be available that will allow complete eradication without causing widespread dispersal of potentially infected birds; (3) methods used must be specific for target species and pose no significant risk for nontarget species; (4) eradication must be justified on the basis of risk to other populations if the outbreak is allowed to continue; and (5) the outbreak represents a new geographic extension of avian cholera into an important migratory bird population.
Habitat management is another useful tool in combating avian cholera outbreaks. In some instances it may be necessary to prevent further use of a specific wetland or impoundment because it is a focal point for infection of waterfowl migrating into the area. Drainage, in conjunction with creating or enhancing other habitat within the area through water diversion (from other sources), or pumping operations serves to deny bird use of the problem area and redistributes waterfowl into
Fish and Wildlife Leaflet 13.2.5. •• 1989 4

more desirable habitat. Ability to add a large volume of water to a problem area can also help dilute concentrations of P. multocida to less dangerous levels. These actions require careful evaluation of bird movement patterns and the avian cholera disease cycle. Moving birds infected with avian cholera from one geographic location to another site is seldom desirable.
Under extreme conditions, disinfection procedures to kill P. multocida may be warranted in wetlands where large numbers of birds have died during a short time. The environmental effect of such measures needs to be evaluated and appropriate approvals obtained before these actions are undertaken.
Hazing with aircraft has been successfully used to move whooping cranes away from a major outbreak of avian cholera. Eagles can be attracted to other feeding sites using road-killed deer as a food source. During an avian cholera outbreak in South Dakota, a large refuge area was temporarily created to hold infected snow geese in an area by closing hunting. At the same time, a much larger population of snow geese about 10 miles away was moved out of the area to prevent transmission of the disease into that population. The area closed to hunting was reopened once the desired bird movement had occurred.
Vaccination and postexposure treatment of waterfowl have both been successfully used in combatting avian cholera in Canada goose propagation flocks. The National Wildlife Health Research Center has developed and tested a bacterin (a killed vaccine) that totally protected Canada geese from avian cholera for the entire 12 months of a laboratory study. This product has been used for several years with good results in a Canada goose propagation flock that has much contact with free-flying wild waterfowl and field outbreaks of avian cholera. Before use of the bacterin, this same flock of Canada geese suffered an outbreak of avian cholera and was successfully treated with intramuscular injections of 50 mg of oxytetracycline followed by a 30-day regimen of 500 g of tetracycline per ton of feed.
As yet, there is no practical method of immunizing large numbers of free-living migratory birds against avian cholera. However, captive propagation flocks can be protected by this method. Endangered species can be trapped and immunized
if the degree of risk warrants this action. Live vaccines should not be used for migratory birds without adequate safety testing.
Human Health Considerations
Avian cholera is not considered a high risk disease for man because of differences in species susceptibility to different strains of P. multocida. However, P. multocida infections in humans are not uncommon. Most of these infections result from an animal bite or scratch, primarily from dogs and cats. The use of dogs is not recommended for picking up carcasses during avian cholera outbreaks because of potential contamination of their mouths with P. multocida and later exposure of people as a result of licking hands or faces. Regardless, the wisdom of wearing gloves and thoroughly washing skin surfaces is obvious when handling birds that have died from avian cholera.
Infections unrelated to wounds are also common, and in the majority of human cases these involve respiratory tract exposure. This is most apt to occur in confined areas with restricted air movement where a large amount of infected material is present. Processing of carcasses associated with avian cholera die-offs should be done outdoors or in other areas with adequate ventilation. When disposing of carcasses by open burning, avoid direct exposure to smoke from the fire.
Suggested Reading
Brand, C. J. 1984. Avian cholera in the Central and Mississippi Flyways during 1979−80. J. Wildl. Manage. 48:399−406.
Friend, M., editor. 1987. Field guide to wildlife diseases. U.S. Fish Wildl. Serv., Resour. Publ. 167. 225 pp.
Rhoades, K. R., and R. B. Rimler. 1984. Avian pasteurellosis. Pages 141−156 in M. S. Hofstad, H. J. Baarnes, B. W. Calnek, W. M. Reid, and H. W. Yoder, Jr., eds. Diseases of poultry. 8th ed. Iowa State University Press, Ames.
Rosen, M. N. 1971. Avian cholera. Pages 59−74 in J. W. Davis, R. C. Anderson, L. Karstad, and D. 0. Trainer, eds. Infectious and parasitic diseases of wild birds. Iowa State University Press, Ames.
Wobeser, G. A. 1981. Diseases of wild waterfowl. Plenum Press, New York. xxi + 300 pp.
Fish and Wildlife Leaflet 13.2.5. •• 1989 5

Appendix. Common and Scientific Names of Animals Named in Text.
Canada goose . . . . . . . . . . . . . . . . . . . . . . . . . . . . . . . . . . . . . . . Branta canadensis Snow goose . . . . . . . . . . . . . . . . . . . . . . . . . . . . . . . . . . . . . . . . Chen caerulescens Crows . . . . . . . . . . . . . . . . . . . . . . . . . . . . . . . . . . . . . . . . . . . Corvus sp. American coot . . . . . . . . . . . . . . . . . . . . . . . . . . . . . . . . . . . . . . . Fulica americana Whooping crane . . . . . . . . . . . . . . . . . . . . . . . . . . . . . . . . . . . . . . Grus americana Gulls . . . . . . . . . . . . . . . . . . . . . . . . . . . . . . . . . . . . . . . . . . . . Larinae Eiders . . . . . . . . . . . . . . . . . . . . . . . . . . . . . . . . . . . . . . . . . . . Somateria sp. Terns . . . . . . . . . . . . . . . . . . . . . . . . . . . . . . . . . . . . . . . . . . . Sterna sp. Deer . . . . . . . . . . . . . . . . . . . . . . . . . . . . . . . . . . . . . . . . . . . . Odocoileus sp.
U NIT E D ST AT E S DE PAR T ME NT OF T H E INT E R IOR F ISH AND WIL DL IF E SE R VICE
F ish and Wildli feL eaflet 13 Washington, D.C. •• 1989
6 Fish and Wildlife Leaflet 13.2.5. •• 1989

W A T E R F O W L M A N A G E M E N T H A N D B O O K
13.2.6. Lead Poisoning: The Invisible Disease
Milton Friend U.S. Fish and Wildlife Service National Wildlife Health Research Center 6006 Schroeder Road Madison, WI 53711
Synonym
Plumbism
Cause
Lead poisoning is an intoxication resulting from absorption of hazardous levels of lead into body tissues. Lead pellets from shot shells, when ingested, are the most common source of lead poisoning in migratory birds. Other far less common sources include lead fishing sinkers, mine wastes, paint pigments, bullets, and other lead objects that are swallowed.
Species Affected
Lead poisoning has affected every major species of waterfowl in North America and has also been reported in a wide variety of other birds. The annual magnitude of lead poisoning losses for individual species cannot be precisely determined. However, reasonable estimates of lead-poisoning losses in different species can be made on the basis of waterfowl mortality reports and gizzard analyses. Within the United States, annual losses from lead poisoning have been estimated at between 1.6 and 2.4 million waterfowl, based on a fall flight of
100 million birds. Proportional adjustments that reflect current waterfowl populations and increasing use of nontoxic shot should be made when estimating current lead-poisoning losses.
Lead poisoning is common in mallards, northern pintails, redheads, scaup, Canada and snow geese, and tundra swans. The frequency of this disease decreases with increasing specialization of food habits and higher percentages of fish in the diet. Therefore, goldeneyes are seldom affected and mergansers rarely affected (Figure 1). Among land birds, eagles are most frequently reported dying from lead poisoning. Lead poisoning in eagles generally is a result of swallowing lead shot embedded in the flesh of their prey.
Distribution
Losses occur coast-to-coast and border-to-border within the United States. Documented occurrences of lead poisoning in migratory birds vary widely between States and do not necessarily reflect true geographic differences in the frequency of occurrence of this condition. For example, although the geographic distribution of lead poisoning in bald eagles is closely associated with their wintering areas, the number of lead poisoning cases from Wisconsin and Minnesota is disproportionately high. The reported distribution of lead poisoning is more a function of recognition than of frequency of occurrence. The general distribution of this disease in waterfowl on the basis of lead shot ingestion surveys and documented mortality is reflected in Figure 2.
Adapted from: Friend, M., editor. 1987. Field guide to wildlife diseases. U.S. Fish Wildl. Serv., Resour. Publ. 167. 225 pp.
Fish and Wildlife Leaflet 13.2.6. •• 1989 1

Figure 1. Relative occurrence of reported lead poisoning in North American waterfowl.
Lead poisoning has also been reported as a cause of migratory bird mortality in other countries, including Australia, Canada, Denmark, Germany, Great Britain, Italy, Japan, New Zealand, and Sweden.
Seasonality
Losses can occur at any time of the year, although most cases of lead poisoning occur after the waterfowl hunting season has been completed in northern areas and during the later part of the season in southern areas of the United States. January and February are peak months for cases in tundra swans, Canada geese, and puddle ducks. Spring losses are more commonly reported for diving ducks. Tundra swans are also frequently lead poisoned during spring migration.
Field Signs
Lead-poisoned waterfowl are often mistaken for hunting season cripples. Special attention should be given to waterfowl that do not take flight when the flock is disturbed and to small aggregations of waterfowl that remain after most
Figure 2. Relative occurrence of lead exposure in waterfowl based on gizzard analyses and reported mortality.
other birds of that species have migrated from the area. Lead-poisoned birds become reluctant to fly when approached; those that can still fly are often noticeably weak flyers, unable to sustain flight for any distance, flying erratically and landing poorly. Birds that attempt to escape pursuit by running may exhibit an unsteady gait. In lead-poisoned Canada geese, the head and neck position may appear “crooked” or bent in flight; a marked change in the tone of call is also sometimes evident in this species. As the disease progresses and waterfowl become flightless, the wings are held in a characteristic “roof-shaped” position (Figure 3), followed by wing droop as the birds become increasingly moribund. There may be a fluid discharge from the bill, and often there is an absence of escape response.
Lead-poisoned waterfowl are easily captured during advanced stages of intoxication. Because severely affected birds generally seek isolation and protective cover, well-trained retrieving dogs can help greatly to locate and collect these birds. An abundance of bile-stained feces on an area used by waterfowl is suggestive of lead poisoning and warrants ground searches even if other field signs have not been observed. Green-colored feces can also result from feeding on green wheat and other plants, but the coloration is somewhat different.
Gross Lesions
Lead-poisoned waterfowl are often emaciated because of the prolonged course of the illness and its effect on essential body processes. Therefore,
2 Fish and Wildlife Leaflet 13.2.6. •• 1989

Figure 3. Characteristic “roof-shaped” position of the wings in a lead-poisoned mallard (leading bird).
many affected birds appear to be starving; they are light in weight, have a “hatchet-breast” appearance, (Figure 4), and the undersurface of their skin is devoid of fat. The vent area of these birds is often stained with a bright green diarrhea. The heads of Canada geese may appear puffy or swollen because serumlike fluids accumulate in the tissues of the face.
Lesions observed at necropsy of lead-poisoned birds that have died after a prolonged illness generally consist of the following:
•• Severe wasting of the breast muscles.
•• Absent or reduced amounts of visceral fat.
•• Impactions of the esophagus or proventriculus in about 20−30% of affected waterfowl. These impactions may contain food items, or combinations of food, sand, and mud. The extent of impaction may be restricted to the gizzard and proventriculus, extend to the mouth, or lie somewhere between.
•• A prominent gallbladder that is distended, filled with bile, and dark or bright green.
•• Normally yellow gizzard lining discolored a dark or bright green. Gizzard contents are also often bile-stained.
•• Lead pellets or small particles of lead often present among gizzard and proventricular contents. Pellets that have been present for a long time are well worn, reduced in size, and disklike rather than spherical (Figure 5). Careful washing of contents is required to find smaller lead fragments. X-ray examination is
Figure 4. “Hatchet-breast” appearance of a lead-poisoned mallard (top bird) and northern pintail. The skin has been removed from the breast of the pintail to further illustrate the severe loss of muscle tissue.
Figure 5. Lead shot, originally round, have been worn down in a waterfowl gizzard. Note the flattened,disklike shape of many of these pellets.
often used to detect radiopaque objects in gizzards, but recovery of the objects is necessary to separate lead from other metals. Flushing contents through a series of progressively smaller sieves is one method for pellet recovery.
The above field signs and gross lesions provide a basis for a presumptive diagnosis of lead poisoning. However, none of these signs and lesions is diagnostic by itself and all can result from other causes. Also, many of the above signs and lesions are absent in birds that die acutely following an overwhelming lead exposure.
Fish and Wildlife Leaflet 13.2.6. •• 1989 3

Control
Two actions can often be taken to reduce the magnitude of mortality from lead poisoning when die-offs occur: denying bird use in problem areas, and rigorous pickup and proper disposal of dead and moribund birds.
Denying birds use of problem areas requires knowing where the birds are picking up the lead. This is complicated by the fact that signs of intoxication may not appear until a week after lead ingestion, and birds may not start dying until 2 to 3 weeks after lead ingestion. Habitat modification is also useful in some instances, but differences in feeding habits must be considered. For example, placing additional water on an area may protect puddle ducks from reaching lead shot on the bottom of wetlands, but this creates attractive feeding areas for diving ducks. Similarly, draining an area may prevent ingestion of lead shot by waterfowl, but creates an attractive feeding area for shorebirds or ring-necked pheasants. Therefore, control actions must consider the broad spectrum of wildlife likely to use the area at the time action is taken. Rigorous pickup and proper disposal of lead-contaminated waterfowl carcasses is required to prevent raptors and other scavenger species from ingesting them. The high percentage of waterfowl with embedded body shot provides a continual opportunity for lead exposure in raptors that far exceeds the opportunity for ingestion of shot present in waterfowl gizzards.
Other management practices that have been used to reduce losses from lead poisoning on site-specific areas include: (1) tillage programs to turn lead shot below the surface of soil so that shot is not readily available to birds; (2) planting food crops other than corn and other grains that aggravate the effects of lead ingestion; and (3) requiring the use of nontoxic shot on hunting areas. The potential contributions of the first two practices toward reducing lead-poisoning losses among migratory birds are, at best, limited and temporary. The use of nontoxic shot is the only long-term solution for significantly reducing migratory bird losses from lead poisoning.
Medical treatment of lead-poisoned birds is generally not a reasonable approach. However, endangered species or other birds of high individual value that are lead poisoned may warrant medical treatment. In those instances, treatment should be done only by qualified persons familiar
with and skilled in the proper use of lead-chelating chemicals. Under the best of circumstances, results of treatment are unpredictable and the success rate low.
Human Health Considerations
People do inadvertently consume lead-poisoned waterfowl. Although this is not desirable, no appreciable risks to human health exist. Most lead present in the body of a lead-poisoned bird is in soft tissues such as liver and kidneys rather than in the flesh. The dose relation (mg of lead per kg of body weight) and lead excretion processes are such that a great number of lead-poisoned birds would need to be consumed in a relatively short time before toxic levels could build up in the human body. Persons who eat liver, kidney, and other soft tissues from lead-poisoned birds would consume more lead than those who eat only muscle tissue of these birds. Persons who consume waterfowl bone marrow would be additionally exposed to lead, since lead is stored long-term in bone.
There are a few documented eases of humans developing lead poisoning after having accidentally ingested lead shot embedded in the meat they ate. This type of lead poisoning is rare, perhaps due to caution exercised when eating hunter-killed wildlife so as to avoid potential damage to teeth from biting into shot. Lead shot that is ingested can also become lodged in the appendix, resulting in appendicitis. Although this does not happen often, it happens most in people who hunt waterfowl for subsistence.
Suggested Reading
Friend, M., editor. 1987. Field guide to wildlife diseases. U.S. Fish Wildl. Serv., Resour. Publ. 167. 225 pp.
Kraft, M. 1984. Lead poisoning. Are we wasting our waterfowl? Kans. Wildl. 41:13−20.
Sanderson, G. C., and F. C. Bellrose. 1986. A review of the problem of lead poisoning in waterfowl. Illinois National History Survey 172. Spec. Publ. 4.
Trainer, D. 0. 1982. Lead poisoning of waterfowl. Pages 24−30 in G. L. Hoff and J. W. Davis, eds. Noninfectious diseases of wildlife. Iowa State University Press, Ames.
Wobeser, G. A. 1981. Diseases of wild waterfowl. Plenum Press, New York. xii + 300 pp.
4 Fish and Wildlife Leaflet 13.2.6. •• 1989

Appendix. Common and Scientific Names of Animals Named in Text.
Wood duck . . . . . . . . . . . . . . . . . . . . . . . . . . . . . . . . . . . . . . . . . . Aix sponsa Northern pintail . . . . . . . . . . . . . . . . . . . . . . . . . . . . . . . . . . . . . . Anas acuta Shoveler . . . . . . . . . . . . . . . . . . . . . . . . . . . . . . . . . . . . . . . . . . Anas clypeata Mallard . . . . . . . . . . . . . . . . . . . . . . . . . . . . . . . . . . . . . . . Anas platyrhynchos Teal . . . . . . . . . . . . . . . . . . . . . . . . . . . . . . . . . . . . . . . . . . . . . . Anas spp. Redhead . . . . . . . . . . . . . . . . . . . . . . . . . . . . . . . . . . . . . . . Aythya americana Scaup . . . . . . . . . . . . . . . . . . . . . . . . . . . . . . . . . . . . . . . . . . . . Aythya spp. Brant . . . . . . . . . . . . . . . . . . . . . . . . . . . . . . . . . . . . . . . . . . Branta bernicla Canada goose . . . . . . . . . . . . . . . . . . . . . . . . . . . . . . . . . . . . Branta canadensis Goldeneye . . . . . . . . . . . . . . . . . . . . . . . . . . . . . . . . . . . . . . . . Bucephala spp. Snow goose . . . . . . . . . . . . . . . . . . . . . . . . . . . . . . . . . . . . . . Chen caerulescens Ross’ goose . . . . . . . . . . . . . . . . . . . . . . . . . . . . . . . . . . . . . . . . . Chen rossii Tundra swan . . . . . . . . . . . . . . . . . . . . . . . . . . . . . . . . . . . Cygnus columbianus Mute swan . . . . . . . . . . . . . . . . . . . . . . . . . . . . . . . . . . . . . . . . . Cygnus olor Whistling ducks . . . . . . . . . . . . . . . . . . . . . . . . . . . . . . . . . . . . Dendrocygna spp. Bald eagle . . . . . . . . . . . . . . . . . . . . . . . . . . . . . . . . . . . Haliaeetus leucocephalus Mergansers . . . . . . . . . . . . . . . . . . . . . . . . . . . . Lophodytes cucullatus, Mergus spp. Ring-necked pheasant . . . . . . . . . . . . . . . . . . . . . . . . . . . . . . Phasianus colchicus
U NIT E D ST AT E S DE PAR T ME NT OF T H E INT E R IOR F ISH AND WIL DL IF E SE R VICE
F ish and Wildli feL eaflet 13 Washington, D.C. •• 1989
Fish and Wildlife Leaflet 13.2.6. •• 1989 5

W A T E R F O W L M A N A G E M E N T H A N D B O O K
13.2.7. Identifying the Factors That Limit Duck Production
James K. Ringelman Colorado Division of Wildlife 317 West Prospect Road Fort Collins, CO 80526
Low duck populations in the late 1980’s and early 1990’s prompted unprecedented action from the natural resources community. Agencies and private organizations that were traditionally involved with waterfowl management redoubled their efforts, in the process forming partnerships with groups that were relatively new to the waterfowl management arena. Many resource managers who have had relatively little experience with waterfowl habitat management now find themselves expected to manage duck populations for increased production. Decades of waterfowl research and management experience have provided them with many potential management tools. Unfortunately, the absence of general guidelines for directing waterfowl management actions has put these newcomers to the field at a decided disadvantage. This is particularly true for managers who reside outside of the northern Great Plains, a region that has been the focus of most research on breeding ducks.
This leaflet is intended to orient managers to approaches for identifying the factors that limit duck production. The concepts presented here will assist in making logical management choices in regions where little is known about breeding ducks and their habitat. Although it may serve as interim guidance, this leaflet is not intended to substitute
Fish and Wildlife Leaflet 13.2.7. •• 1992
for rigorous, scientific research on waterfowl biology. Readers are urged to use this leaflet as a starting point from which to gather additional knowledge using companion leaflets and technical publications.
The Reproductive Cycle
Although ducks are a diverse group of birds, many dabbling and diving ducks in North America show similarities in general facets of their breeding biology. A basic understanding of the important events and forces that drive reproductive behavior is essential to interpreting premanagement information. The following sections provide a summary of duck breeding biology that, although not strictly accurate for any particular species, is generally representative of the most common North American ducks.
Resource Needs
Most ducks arrive on their breeding grounds from late March to early May. Shortly thereafter they begin to make regular use of wetlands that vary in size, water permanency, and vegetative composition. These wetlands, together with surrounding uplands, constitute the home range of individual pairs. Usually, males become aggressive toward other birds of the same species, defending either wetlands within the home range or space around their mates. These aggressive interactions
1

cause birds to distribute themselves throughout the breeding habitat.
The need for dietary protein during the prenesting and egg-laying periods causes ducks to seek aquatic invertebrate foods, which may compose 75 to 100% of the hen’s diet. Many species maximize food acquisition during this period by capitalizing on the seasonal peaks in aquatic food abundance that differ among wetland types. For example, shallow, temporary wetlands may exist only a few weeks, but during that time they warm quickly and develop invertebrate populations long before permanent ponds. By moving among wetlands and selecting those with the richest invertebrate fauna, ducks are able to quickly acquire the protein necessary for egg production. Thus, small, shallow wetlands contribute as much to ducks during the breeding period as large, permanent cattail marshes. A diverse wetland community is critical to this food acquisition strategy.
Territorial aggression is often initiated when males sight other birds of the same species. This visual spacing limits the number of pairs that an area can support. Habitats with many small ponds on which ducks may isolate themselves, or those with heavy vegetation, bays, or inlets where pairs are visually separated, can reduce encounters between birds and increase pair densities. Wetlands most attractive to dabbling ducks contain about a 50:50 ratio of open water to emergent vegetation. Patches of emergent plants, sparse enough to allow a duck to swim through, are more attractive than large blocks of thick, unbroken vegetation.
Nest Sites
Most diving ducks and some dabbling ducks construct nests over water amid emergent vegetation. In contrast, most dabbling duck nests are made in dead vegetation remaining from the previous growing season. Often, this residual vegetation is found in grassland and shrub habitat located up to a mile from water. Tall, dense grasses or shrubs with low growth forms are usually preferred by dabbling ducks. Islands also provide attractive nesting habitat if adequate vegetative cover is present. Hens explore many potential sites, but select only one to construct a nest. Most ducks lay a single egg each day until a clutch of 9 to 11 eggs is complete.
Incubation
As the clutch nears completion, hens begin an incubation period that ranges from 23 to 30 days for most species, with shorter periods typical of species that lay smaller eggs. Duck nests are often destroyed by mammalian, avian, or reptilian predators. At present, throughout much of the northern Great Plains, predators are abundant, and duck nests are concentrated because nesting cover is limited. Consequently, the percentage of nests that hatch at least one egg (nest success) is often less than 15%. In habitats where nests are dispersed and predators are less common, much higher (40 to 70%) success rates are typical. Most ducks will renest if their initial clutch is destroyed during laying or early in incubation and a sufficient number and diversity of wetlands remain available. In some species, hens that successfully hatch a clutch often return to the vicinity of the successful nest site in subsequent years, and sometimes to the same nest bowl. During incubation, hens leave the nest for a recess three to five times per day. They continue to meet their mates during these recesses until the male leaves his territory and joins groups of other males in preparation for molt. This usually occurs about 1 to 2 weeks into incubation.
Broods
Newly hatched ducklings leave the nest soon after hatching, and may walk through uplands or follow streams to brood-rearing wetlands up to a mile away. Even after reaching a wetland, broods may move among ponds. Ducklings of most species feed almost entirely on aquatic invertebrates until about a month old. Thereafter, ducklings of dabbling duck species gradually increase their consumption of seeds and other vegetation. Because ducklings cannot thermoregulate until they are about 2 weeks old, they are periodically brooded by the hen. Predation and exposure can cause high mortality among ducklings. Contaminants can also cause mortality, either by direct toxicity or, more often, by reducing the abundance of essential invertebrate foods. In many habitats, 20 to 50% of all duck broods are entirely destroyed, and typically only about half of the ducklings in the remaining broods survive. Habitat use by broods differs among species, but is generally related to the need for areas secure from predators and severe weather. Diving duck broods seek security in open water, where they dive to
Fish and Wildlife Leaflet 13.2.7. •• 1992 2

escape predators. Dabbling duck broods usually prefer dense emergent vegetation.
The Limiting Factor
Contemporary waterfowl management generally uses three approaches for guiding management actions. Actions initiated on an international scale, such as in the North American Waterfowl Management Plan, often originate from broad policy directives such as the need to preserve wetlands or increase nesting success. Other initiatives are guided by computer simulations, such as the Mallard Management Model, that recommend actions based on knowledge of waterfowl biology and factors that suppress reproduction. However, similar guidelines are generally unavailable for managing the scattered, diverse duck breeding habitats of North America. In such habitats, management actions are often guided by the manager’s experience and intuition.
Predation, resource limitations, and environmental conditions are factors that may suppress waterfowl populations below their biological potential. However, only one factor is most limiting to populations at any time. Aldo Leopold described the limiting factor as "the one that has to be removed first, and usually the one to which the application of a given amount of effort will pay the highest returns, under conditions as they stand." The effort required to remedy a limiting factor may vary, but until it is removed, activities directed at other, nonlimiting factors will offer relatively little improvement in duck production.
Although many contemporary ecologists view the limiting factor concept as an oversimplification of complex interrelationships, it is nonetheless a useful starting point for considering factors that suppress waterfowl recruitment. Sometimes, a factor that limits duck production can result from deficiencies independent of the breeding habitat, for example, food shortages on wintering areas that prevent the acquisition of fat reserves necessary for successful breeding. Such limitations are usually beyond the control of individual managers. Most factors that are potentially limiting to duck production, however, can be traced to four important requirements of breeding habitat: the ability to attract and retain spring migrants, provide for the resource and social needs of breeding pairs, secure adequate nesting habitat, and provide suitable brood-rearing habitat.
Fish and Wildlife Leaflet 13.2.7. •• 1992
Unfortunately, drought, localized agricultural effects, and other dynamic events may cause deficiencies in these requirements to vary annually. Thus, management to correct long-term habitat deficiencies should be based on average habitat conditions. These average conditions should be determined by evaluating premanagement information collected during more than one breeding season.
Because wetland communities are the basic unit in which ducks live and acquire resources during breeding, premanagement information should be gathered independently for each discrete community, not averaged across several isolated wetland complexes. Although waterfowl researchers are beginning to understand the implications of habitat fragmentation for breeding ducks, it is well established that the benefits of small tracts of waterfowl habitat are often swamped by the effects of habitat degradation on adjacent lands. The protocol described here may still be useful for identifying factors limiting duck production, but management to overcome these deficiencies on small tracts of land may be futile in the face of overwhelming external forces.
Obtaining Premanagement Information
Spring Migrants and Breeding Pairs Information on the number of spring migrants
and resident breeding pairs can be obtained through a series of ground counts beginning with the first influx of spring migrants and continuing through the early incubation period. Spring migrant and pair counts, as well as brood counts, should be conducted on a large block of contiguous habitat that is representative of the management area. Ideally, surveys should be conducted two or three times per week, but in no case less than once a week. Because females typically take incubation recesses early and late in the day, nesting chronology and indices to nest success are most readily interpreted if observers restrict their counts to the period between 1 hour after sunrise to 1 hour before sunset. Observers should quietly walk near wetlands but avoid flushing ducks. If birds flush to nearby areas, observers should avoid duplicate counts on these individuals. During the time when spring migrants move through the region, simply tally the numbers of individuals by species and sex. When the number of ducks and the
3

species composition stabilizes, one may assume that many birds now in the area are beginning to establish home ranges in preparation for breeding. At this time, begin counting male-female pairs and single males, tallying these males as "indicated pairs." These single or "lone" males are usually mates of females who are searching for nest sites, laying eggs, or incubating. For each species, the highest number of pairs plus indicated pairs counted in any census represents the total estimated pairs resident in the wetland community.
Nesting Habitat and Success
The quantity of available nesting habitat is often easy to judge in relation to species requirements. Most diving ducks construct nests over water in robust emergent plants. Map the distribution and vegetative composition of these emergent beds, and note if such areas remain inundated during the incubation period. Cavity-nesting duck species use holes excavated by woodpeckers or created by internal rot in old trees. Note the number and distribution of potential nest trees or actual nest sites and their distances from the wetland. Dabbling ducks and some diving ducks nest in grasses or shrubs adjacent to wetlands. Map the area and distribution of these habitats.
The quality of nesting habitat is difficult to judge for overwater- and cavity-nesting species. However, the height and density of upland sites can be measured using a Robel pole or similar device. Readings obtained at a standardized viewing height and distance can then be compared with minimum standards required by different species. Whenever possible, managers should determine the relative quality of potential nesting habitat.
Duck nesting success is a more indirect index of nesting habitat conditions because it is dependent on the quality and quantity of habitat as well as the density and composition of the local predator community. In grassland habitats, large numbers of nests can often be located using cable-chain drags. In shrubland or wooded areas, hand drags, dogs, or observations of hens returning to nest sites may be necessary to locate nests. When nests are found, note the size of the completed clutch, candle the eggs to determine the stage of incubation, then flag the site by placing a marker at some set distance and direction away from the nest. Excessive disturbance to the nest site must be avoided. Later, revisit the site to
determine the fate of the nest. Nests that were abandoned or destroyed by predators will contain whole eggs and pieces of eggshell with membranes firmly attached. Note the condition of the eggs and look for tracks, scats, or other evidence that may suggest the cause of nest failure. Successful nests are typified by shell membranes that are easily separated from shell fragments.
Brood-rearing Period
Begin duck brood surveys when broods of early-nesting species first appear. Surveys should be conducted in early morning (30 minutes before to 1 hour after sunrise) and in late evening (2 hours before until 30 minutes after sunset). Counts conducted at times other than early and late in the day will census only a fraction of the broods present and will be biased towards diving duck species that use open water areas during brood-rearing. Viewers should quietly observe broods, from elevated vantage points if necessary, and note the species, size of the brood (number of ducklings), and age of the ducklings. Be aware that duck broods may move among wetlands, and try to avoid duplicate counts. If movements between wetlands are uncommon and the number of broods per wetland is low, it is often possible to distinguish individual broods based on a combination of species, size, and age. In such cases, note the number of ducklings in a brood on subsequent observations. If a brood is not observed on subsequent surveys and the likelihood of secondary movements to another rearing wetland is remote, record the possibility that the entire brood perished. To obtain data on duckling attrition, individual broods should be observed every 3 to 5 days, particularly when ducklings are young and mortality rates are highest. The most important index to obtain during the brood-rearing period is the number of young remaining in old (prefledging, or class III) broods.
Identifying the Limiting Factor
Attracting and retaining spring migrants, providing resources for breeding pairs, securing adequate nesting habitat, and providing suitable brood-rearing areas are all interdependent activities, wherein each event is dependent on the success of previous events. The following sections provide a basis for identifying deficiencies in this reproductive chain of events by interpreting the
Fish and Wildlife Leaflet 13.2.7. •• 1992 4

Fig. 1. General management alternatives for addressing factors that limit duck recruitment. Readers should consult technical publications for detailed information on specific alternatives.
Fish and Wildlife Leaflet 13.2.7. •• 1992 5

premanagement data described above. Once a limiting factor has been identified, general management actions for correcting these deficiencies can be considered (Fig. 1). Readers should consult technical publications for information on which management action is most appropriate and how to implement an action.
Attracting and Holding Spring Migrants and Breeding Pairs
Summarize data on the numbers of ducks present in early spring, looking for evidence of a sharp decline indicative of migrants departing the area and resident pairs remaining behind. If large numbers of migrants were present, but later departed, and those migrants were species that normally breed in the area, consider actions to attract and hold spring migrants.
Examine the number of indicated breeding pairs that remain after migrants leave the area, then determine if the habitat is supporting breeding pairs up to its potential. The key to assessing this potential is knowing how many pairs are attracted to good wetland communities in your geographic area. Comparing pair densities on nearby, high quality breeding habitat provides the best basis for contrast. Historical data also can be consulted. Lacking these data, managers should consult state or federal agencies for area-specific data. For example, curves depicting average breeding pair densities as a function of wetland size and type have been developed for the northern Great Plains (e.g., Cowardin et al. 1988). Wetland complexes that fail to attract adequate numbers of breeding pairs can be managed to increase pair numbers.
Enhancing Nesting Habitat and Nest Success
Emergent vegetation suitable for overwater nesters should be dense, have a height of at least 3 feet above water, and remain flooded during the period of nesting. Suitable emergents should occur in wide bands around the periphery of the wetland or as large islands within the wetland basin. Most cavity-nesting species select nest sites within 200 yards (183 m) of a wetland, although wood ducks (Aix sponsa) will use cavities up to 1 mile (1.6 km) from water. If suitable cavities are few or absent within this area, artificial nesting structures can help correct the deficiency. Ducks that nest in upland sites require grasses, legumes, shrubs, or
combinations of the above plants within 1 mile of wetlands. Suitable nesting areas should occur in large (more than 40 acres or, 16 ha), unbroken blocks of habitat.
Nesting cover should meet minimal Robel pole indices for height and density (typically, dense at heights of 18 inches—0.5 m—above the ground), and should be secure from grazing and agricultural manipulations until after the incubation period. If density or height is insufficient, several management actions can be used to enhance the quality of nesting cover.
Data on the fate of marked nests should be corrected for exposure, according to the Mayfield correction technique, then average nest success rates should be calculated for the management area. Generally, nest success rates greater than 40% are acceptable in most habitats, whereas rates lower than 15% are usually insufficient to maintain a stable duck population. Lacking direct measures of nest success, managers may obtain qualitative indices of nest loss through "social indices" that rely on the tendencies of many duck species to renest if their initial nests are destroyed. The simplest of these indices is an analysis of the weekly ratios of indicated pairs (lone males) to actual (male−female) pairs during the egg-laying and incubation period for each species. Local populations experiencing low rates of nest loss often exhibit ratios that increase sharply in the first few weeks, then gradually decline from a high level (e.g., 0.2:1, 1.3:1, 3.4:1, 3.0:1, and 2.8:1). Populations experiencing high nest loss may exhibit an increase, followed by a sharp decrease, then a subsequent increase in these ratios (e.g., 0.2:1, 1.3:1, 3.4:1, 1.8:1, and 2.7:1), indicative of unsuccessful hens rejoining their mates in preparation for a second nesting attempt.
Additional evidence of nest destruction may be derived by examining the hatching chronology of duck broods for each species. This is accomplished by back-dating broods to the date of hatch, using information on duckling ages. A frequency distribution of number of broods hatched within 5-day intervals typically depicts a peak of hatch followed by a much smaller, well-defined, second peak from renesting attempts (Fig. 2). Hatching curves that exhibit pronounced renesting peaks or are relatively flat suggest excessive rates of nest loss.
If the quantity and quality of nesting cover are adequate but nesting success is low, try to determine the cause of nest failure. Predation is
Fish and Wildlife Leaflet 13.2.7. •• 1992 6

Fig. 2. Hypothetical hatching curves for local duck populations experiencing relatively high (top) and low (middle and bottom) nesting success during early incubation.
one common reason for nest failure in many habitats, and may be indicated by evidence left at the nest. However, do not discount the possibilities of flooding, destruction from agricultural operations, or exposure to weather. A wide array of corrective actions are available to enhance nesting success, depending on the cause of nest failure.
Improving Brood-rearing Habitat and Duckling Survival
Duckling mortality is indicated either by loss of complete broods or by brood attrition, wherein the number of ducklings in a brood is reduced over time. Mortality caused by exposure, starvation, or death from pesticides or other contaminants often results in the catastrophic loss of entire broods. In contrast, mortality caused by predation may result in a more gradual decrease in brood size. Generally, an average of five ducklings per prefledging (class III) brood is considered acceptable attrition. Supplemental information, such as, from bait
Fish and Wildlife Leaflet 13.2.7. •• 1992
stations to identify the presence of predators, invertebrate sampling to gauge the abundance of food, and water quality measures to detect contaminants, may be needed to isolate the causes of duckling mortality. Such supplemental data are usually vital for selecting an appropriate management strategy to enhance brood survival.
Rather than remain in undesirable habitat, broods may move to other wetlands. The quality of brood-rearing habitat may therefore be reflected by the number of resident broods, compared with the number of resident breeding pairs that were in the area, after taking into account nest success rates and renesting activity. If the estimated number of broods occupying a wetland complex is far less than the estimated number believed to have hatched, management may be necessary to enhance the quality of brood-rearing habitat. Often, the root causes of low brood usage and poor brood survival are the same, and a single management action may be used to address both problems.
Other Considerations
Before initiating any management measure, consider whether human disturbance or natural forces have sufficiently altered the ecosystem to warrant intervention. Do not use management tools as "weapons" against a healthy landscape. The waterfowl response to management of such areas will be relatively slight when compared with results of the same effort applied to dysfunctional ecosystems. Unfortunately, however, some of the most important waterfowl breeding habitats in North America have been severely degraded. When managing these habitats, overall objectives should be consistent with the natural values of the ecosystem. Not all wetlands are meant to be breeding habitats. Migratory stopover and wintering areas provide essential resources for ducks, and managers should avoid modifying such areas to create breeding habitat if doing so would impair these other seasonal uses. Although management actions can temporarily alter waterfowl habitats for other than natural uses, they do so only with high cost, intensive labor, and possibly detrimental effects to the ecosystem.
Once a limiting factor has been identified and an appropriate management response is devised, managers should resist the temptation to simultaneously initiate more than one action on a single area. Imposing more than one management treatment complicates evaluations of the
7

effectiveness of the actions, and often results in no more success than a single treatment that is selected with reasonable forethought.
Lastly, management actions should be evaluated to determine whether the objectives of the project were attained. The same techniques and data analyses used when collecting premanagement information should be employed during this follow-up evaluation.
Suggested Reading
Bellrose, F. C. 1980. Ducks, geese, and swans of North America. Stackpole Books, Harrisburg, Penn. 543 pp.
Cowardin, L. M., D. H. Johnson, T. L. Shaffer, and D. W. Sparling. 1988. Applications of a simulation model to decisions in mallard management. U.S. Fish and Wildlife Service Technical Report 17. 28 pp.
Higgins, K. F., L. M. Kirsch, H. F. Duebbert, A. T. Klett, J. T. Lokemoen, H. W. Miller, and A. D. Kruse. 1977. Construction and operation of cable−chain drag for
nest searches. U.S. Fish and Wildlife Service Wildlife Leaflet 512. 14 pp.
Johnson, D. H. 1979. Estimating nest success: the Mayfield method and an alternative. Auk 96:651−661.
Kirby, R. E. 1988. American black duck breeding habitat enhancement in the northeastern United States: a review and synthesis. U.S. Fish and Wildlife Service Biological Report 88(4). 50 pp.
Lokemoen, J. T. 1984. Examining economic efficiency of management practices that enhance waterfowl production. Transactions of the North American Wildlife Natural Resources Conference 49:584−607.
Ringelman, J. K. 1991. Evaluating and managing waterfowl habitat. Colorado Division of Wildlife Division Report 16. 48 pp.
Robel, R. J., J. M. Briggs, A. D. Dayton, and L. C. Hulbert. 1970. Relationships between visual obstruction measurements and weight of grassland vegetation. Journal of Range Management 23:295−297.
Weller, M. W. 1956. A simple field candler for waterfowl eggs. Journal of Range Management 20:111−113.
Note: Use of trade names does not imply U.S. Government endorsement of commercial products.
UNITED STATES DEPARTMENT OF THE INTERIOR FISH AND WILDLIFE SERVICE
Fish and Wildlife Leaflet 13 Washington, D.C. •• 1992
8

W A T E R F O W L M A N A G E M E N T H A N D B O O K
13.2.8. Rescue and Rehabilitation of Oiled Birds
Sallie Welte and Lynne Frink Tri-State Bird Rescue and Research, Inc. P.O. Box 289 Wilmington, DE 19899
Oil contamination of waterfowl and seabirds has been documented as a significant cause of morbidity and mortality in birds for more than 50 years. Each year more than one million birds may die from oil contamination in North Atlantic waters alone; worldwide mortality is unknown.
Of special concern is that many of the seabirds commonly affected are not prolific breeders, and assessment of each species’ status is handicapped by the difficulty of accurately monitoring trends in marine bird populations.
Oiled bird rehabilitation is an intensive, crisis-oriented response, requiring an experienced management agency, specialized medical expertise, stockpiles of specially designed equipment, and a tremendous investment of human resources.
Nevertheless, after a major oil spill, the public demands that the affected wildlife species be treated, and the Fish and Wildlife Service, as the mandated response agency for the United States, will be called in to respond to the situation.
Unfortunately, very few organizations have the expertise required to rehabilitate oiled birds. Public interest and involvement in the plight of oiled wildlife have resulted in some disastrous rehabilitation efforts. Oiled birds have been rolled in kitty litter, dipped in melted butter, covered with
cornmeal, and plucked, all with tragic consequences. When overseen by an experienced agency, however, successful oiled bird rehabilitation has occurred. Particular rehabilitation success is seen in swans, geese, and ducks, with average release rates exceeding 90%.
In this chapter we attempt to provide the wildlife professional with a basic understanding of the internal and external effects of oil on birds, and the key components of an effective oil spill response. We emphasize the handling of waterfowl and seabirds. This chapter does not provide the detailed information needed to manage a major oil spill response.
Effects of Oil Contamination
Once a bird is contaminated by oil, a sequence of physiologic and metabolic changes begins which contributes to its decreased chance of survival and reproductive success. Oil exposure, unless excessive, is not immediately incapacitating; most birds remain vigorous enough to avoid capture for one or more days. This delay contributes to avian mortality by complicating rehabilitation efforts and increasing the secondary exposure of eggs, nestlings, scavengers, and predators to oil.
External Effects
An immediate effect of oil exposure on birds is the disruption of their feather structure. The resulting decreases in flight ability and water repellency limit the animal’s ability to forage for
Fish and Wildlife Leaflet 13.2.8. •• 1991 1

Double-crested cormorant contaminated with North Sea crude oil.
food and to escape predation. Contamination and disruption of a bird’s plumage also reduce the insulating properties of its feathers, increasing the bird’s vulnerability to temperature extremes. In addition, a bird’s direct contact with oil components can result in chemical burns and the absorption of toxic chemicals through its skin.
Internal Effects
Internal effects of oil result from the ingestion, aspiration, or absorption of oil components. Although visually less apparent than external oil effects, the internal effects of oil are equally life-threatening and often more difficult to treat. While some damage is specific to the oil fractions and contaminants involved, a general pattern of pathological changes characterizes oil toxicosis. These changes include kidney damage, altered liver function, aspiration pneumonia, and irritation of the intestines.
Birds ingest oil when they preen in an attempt to clean their feathers. The resulting intestinal irritation can exacerbate dehydration and metabolic
imbalances caused by decreased food intake. The bird can no longer absorb nutrients or regulate body fluids and electrolytes adequately, and may even hemorrhage into its intestinal tract. Anemia due to oil toxicosis has been documented. In addition, birds become less tolerant of stress and more susceptible to disease and to the effects of previously accumulated toxins.
Whereas all types of birds can be affected by a spill, some species are more vulnerable than others. Particularly susceptible are the diving birds, such as loons, cormorants, and diving ducks. Entire populations can be at risk when species that have delayed maturity and low reproductive potentials are contaminated. Birds that live in harsh environments may not survive the added stress of oil exposure and reduced food supplies.
Long-term and Secondary Effects
Oiled adults frequently contaminate nests, eggs, and young. Likewise, secondary oiling of other flock members and predators can occur.
Decreased reproductive success has been seen in birds experimentally oiled or force-fed oil. Delayed onset of laying, decreased fertility of eggs, abnormal yolk composition, and altered shell thickness have all been documented. Secondarily exposed embryos may die from suffocation or hatch with gross skeletal and bill abnormalities. Decreased growth rates and body weights of experimentally exposed juveniles may result from the ingestion of contaminated foods or the impaired parenting ability of affected adults.
In major oil spills, habitats are altered, food resources changed, and resident animals subjected to chronic oil exposure through contaminated substrates. The potential for bioaccumulation of toxic substances in invertebrates and lower vertebrates warrants further study.
Rehabilitation of Contaminated Birds
Successful oiled bird rehabilitation involves six basic procedures:
•• prompt intervention and retrieval of contaminated birds;
•• stabilizing the bird;
•• removing oil from the bird’s feathers;
•• removing the cleaning agent from the feathers;
Fish and Wildlife Leaflet 13.2.8. •• 1991 2

•• restoring waterproofing; and
•• acclimating the bird for release.
Effective rehabilitation efforts require coordination of State, Federal, and private agencies. The importance of establishing contingency plans in high-risk areas before oil spills occur cannot be overemphasized.
All field agents should be trained in handling techniques that are nonstressful to birds. A facility having adequate space, ventilation, and a regulated temperature should be identified. Hot-water sources and an approved wastewater disposal system must be located. Basic rehabilitation equipment can be stockpiled in advance, so that medical care, nutritional support, and cleaning efforts can begin without delay. Licensed rehabilitators trained in oil spill response protocols should be contacted as soon as a spill occurs.
Field Assessment, Intervention, and Retrieval
Mechanisms should be in place for all aspects of bird retrieval and management, including:
•• field strategies for aerial overflights, and ground teams to identify birds at risk;
•• procedures for preventing exposure of unaffected animals;
•• protocols for field retrieval, emergency stabilization, and transport of contaminated birds; and
•• risk assessment and safety protocols for field personnel.
Preventing Exposure
Various techniques can be used to disperse uncontaminated animals from a problem area or to concentrate and hold them in clean areas. Efforts to discourage unoiled birds from contaminated areas must be done early in the spill; these can include scare devices such as propane exploders and cracker shells, hazing with motorized equipment, or relocation through baiting at an alternative feeding area. No attempt should be made to disperse oiled birds since this can lead to introduction of oiled animals into uncontaminated populations.
For priority species, unoiled animals can be relocated through capture in cannon nets, drop nets, rocket nets, and swim-in or walk-in traps, and rapidly transported to “safe” areas. The effort
Fish and Wildlife Leaflet 13.2.8. •• 1991
and expense required to trap, examine, and relocate unoiled birds is significantly less than that required to retrieve and rehabilitate oiled animals. Appropriate hazing and trapping techniques differ in each spill situation.
Capture and Transport of Oiled Waterfowl
Human safety should be considered before any retrieval effort is made; hazardous weather conditions, unsafe footing, icy rivers, or dangerous seas may preclude a rescue attempt.
Teamwork is essential to minimize stressing these already compromised animals. As oiled birds lose their waterproofing, they move to shore, first preening on the open beaches and later hiding effectively under tussocks of grass or next to boulders. Birds in this condition should be retrievable by teams on foot; every day’s delay in retrieval significantly increases mortality.
Beached birds should be approached quietly and smoothly from the water’s edge; this technique can be extremely effective if the retrieval crews are in place shortly before dawn. If the capture attempts fail, birds should not be chased. In marine situations, boats and long-handled dip nets can be used for an approach at low tide to birds that have come ashore.
Immobilization is accomplished by placing towels, sheets, or nets over the entire bird, including the head. Heavy gloves, which reduce human dexterity and can thus cause injury to the animal, are not recommended. Birds are carefully handled through light coverings that minimize damage to the birds’ feathers and human exposure to the oil.
Netted birds are gently removed from the netting and completely covered with cloth. Care must be taken to fold the bird’s wings in a normal position against its body. A small bird can be secured against the field agent’s abdomen, at waist level; the bird is cradled in one hand with the other hand placed lightly on the back. Larger waterfowl and some species with sharp bills can be carried in a reverse body hold: the towel-covered bird is placed, facing backward, against the side of the handler’s body, under the arm. Support for the bird’s legs is provided by the hand and forearm, with the bird’s head facing backward between the handler’s upper arm and side of the body.
Aggressive birds such as raptors, cormorants, and herons can seriously injure even experienced handlers. While head restraint is important for all species, it is critical when handling these birds;
3
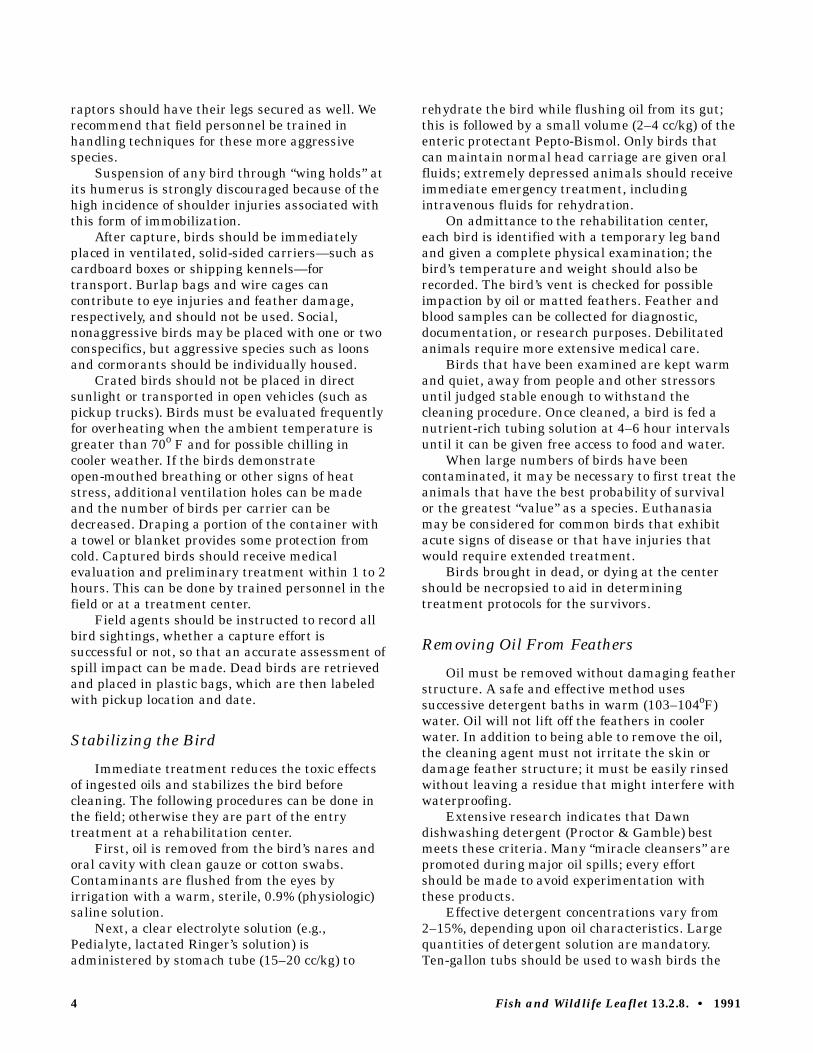
raptors should have their legs secured as well. We recommend that field personnel be trained in handling techniques for these more aggressive species.
Suspension of any bird through “wing holds” at its humerus is strongly discouraged because of the high incidence of shoulder injuries associated with this form of immobilization.
After capture, birds should be immediately placed in ventilated, solid-sided carriers—such as cardboard boxes or shipping kennels—for transport. Burlap bags and wire cages can contribute to eye injuries and feather damage, respectively, and should not be used. Social, nonaggressive birds may be placed with one or two conspecifics, but aggressive species such as loons and cormorants should be individually housed.
Crated birds should not be placed in direct sunlight or transported in open vehicles (such as pickup trucks). Birds must be evaluated frequently for overheating when the ambient temperature is greater than 70o F and for possible chilling in cooler weather. If the birds demonstrate open-mouthed breathing or other signs of heat stress, additional ventilation holes can be made and the number of birds per carrier can be decreased. Draping a portion of the container with a towel or blanket provides some protection from cold. Captured birds should receive medical evaluation and preliminary treatment within 1 to 2 hours. This can be done by trained personnel in the field or at a treatment center.
Field agents should be instructed to record all bird sightings, whether a capture effort is successful or not, so that an accurate assessment of spill impact can be made. Dead birds are retrieved and placed in plastic bags, which are then labeled with pickup location and date.
Stabilizing the Bird
Immediate treatment reduces the toxic effects of ingested oils and stabilizes the bird before cleaning. The following procedures can be done in the field; otherwise they are part of the entry treatment at a rehabilitation center.
First, oil is removed from the bird’s nares and oral cavity with clean gauze or cotton swabs. Contaminants are flushed from the eyes by irrigation with a warm, sterile, 0.9% (physiologic) saline solution.
Next, a clear electrolyte solution (e.g., Pedialyte, lactated Ringer’s solution) is administered by stomach tube (15–20 cc/kg) to
rehydrate the bird while flushing oil from its gut; this is followed by a small volume (2–4 cc/kg) of the enteric protectant Pepto-Bismol. Only birds that can maintain normal head carriage are given oral fluids; extremely depressed animals should receive immediate emergency treatment, including intravenous fluids for rehydration.
On admittance to the rehabilitation center, each bird is identified with a temporary leg band and given a complete physical examination; the bird’s temperature and weight should also be recorded. The bird’s vent is checked for possible impaction by oil or matted feathers. Feather and blood samples can be collected for diagnostic, documentation, or research purposes. Debilitated animals require more extensive medical care.
Birds that have been examined are kept warm and quiet, away from people and other stressors until judged stable enough to withstand the cleaning procedure. Once cleaned, a bird is fed a nutrient-rich tubing solution at 4–6 hour intervals until it can be given free access to food and water.
When large numbers of birds have been contaminated, it may be necessary to first treat the animals that have the best probability of survival or the greatest “value” as a species. Euthanasia may be considered for common birds that exhibit acute signs of disease or that have injuries that would require extended treatment.
Birds brought in dead, or dying at the center should be necropsied to aid in determining treatment protocols for the survivors.
Removing Oil From Feathers
Oil must be removed without damaging feather structure. A safe and effective method uses successive detergent baths in warm (103–104oF) water. Oil will not lift off the feathers in cooler water. In addition to being able to remove the oil, the cleaning agent must not irritate the skin or damage feather structure; it must be easily rinsed without leaving a residue that might interfere with waterproofing.
Extensive research indicates that Dawn dishwashing detergent (Proctor & Gamble) best meets these criteria. Many “miracle cleansers” are promoted during major oil spills; every effort should be made to avoid experimentation with these products.
Effective detergent concentrations vary from 2–15%, depending upon oil characteristics. Large quantities of detergent solution are mandatory. Ten-gallon tubs should be used to wash birds the
Fish and Wildlife Leaflet 13.2.8. •• 1991 4
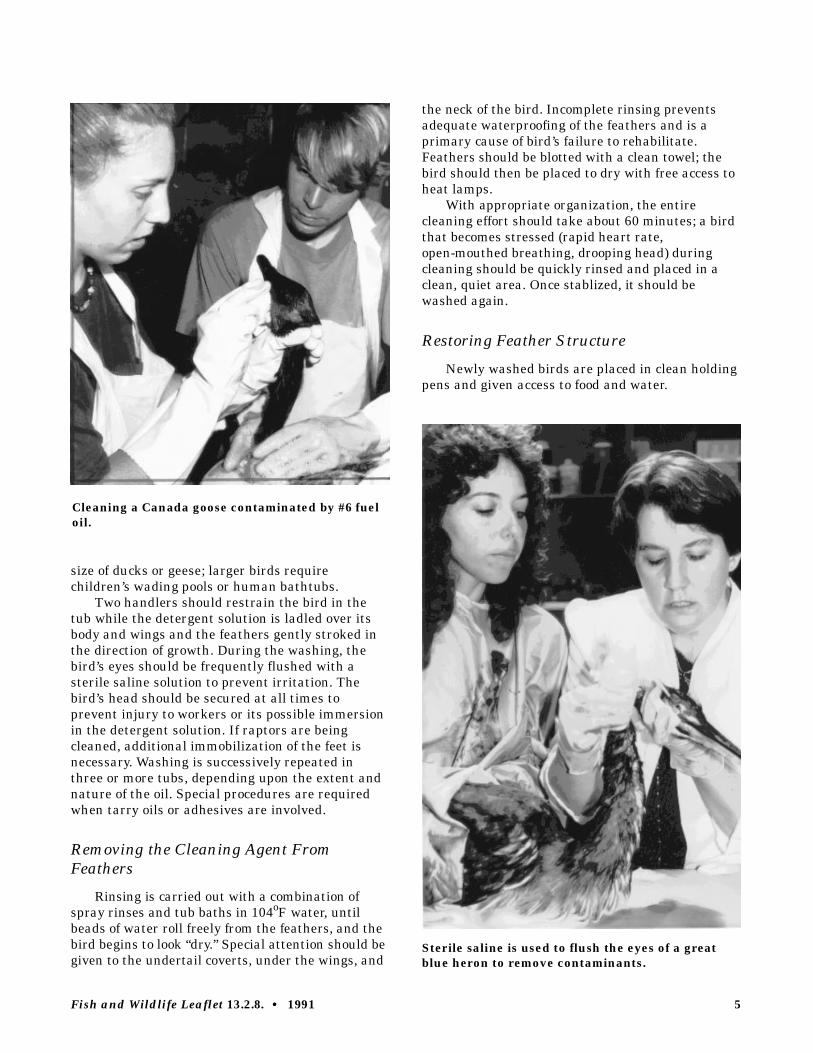
Cleaning a Canada goose contaminated by #6 fuel oil.
size of ducks or geese; larger birds require children’s wading pools or human bathtubs.
Two handlers should restrain the bird in the tub while the detergent solution is ladled over its body and wings and the feathers gently stroked in the direction of growth. During the washing, the bird’s eyes should be frequently flushed with a sterile saline solution to prevent irritation. The bird’s head should be secured at all times to prevent injury to workers or its possible immersion in the detergent solution. If raptors are being cleaned, additional immobilization of the feet is necessary. Washing is successively repeated in three or more tubs, depending upon the extent and nature of the oil. Special procedures are required when tarry oils or adhesives are involved.
Removing the Cleaning Agent From Feathers
Rinsing is carried out with a combination of spray rinses and tub baths in 104oF water, until beads of water roll freely from the feathers, and the bird begins to look “dry.” Special attention should be given to the undertail coverts, under the wings, and
the neck of the bird. Incomplete rinsing prevents adequate waterproofing of the feathers and is a primary cause of bird’s failure to rehabilitate. Feathers should be blotted with a clean towel; the bird should then be placed to dry with free access to heat lamps.
With appropriate organization, the entire cleaning effort should take about 60 minutes; a bird that becomes stressed (rapid heart rate, open-mouthed breathing, drooping head) during cleaning should be quickly rinsed and placed in a clean, quiet area. Once stablized, it should be washed again.
Restoring Feather Structure
Newly washed birds are placed in clean holding pens and given access to food and water.
Sterile saline is used to flush the eyes of a great blue heron to remove contaminants.
Fish and Wildlife Leaflet 13.2.8. •• 1991 5
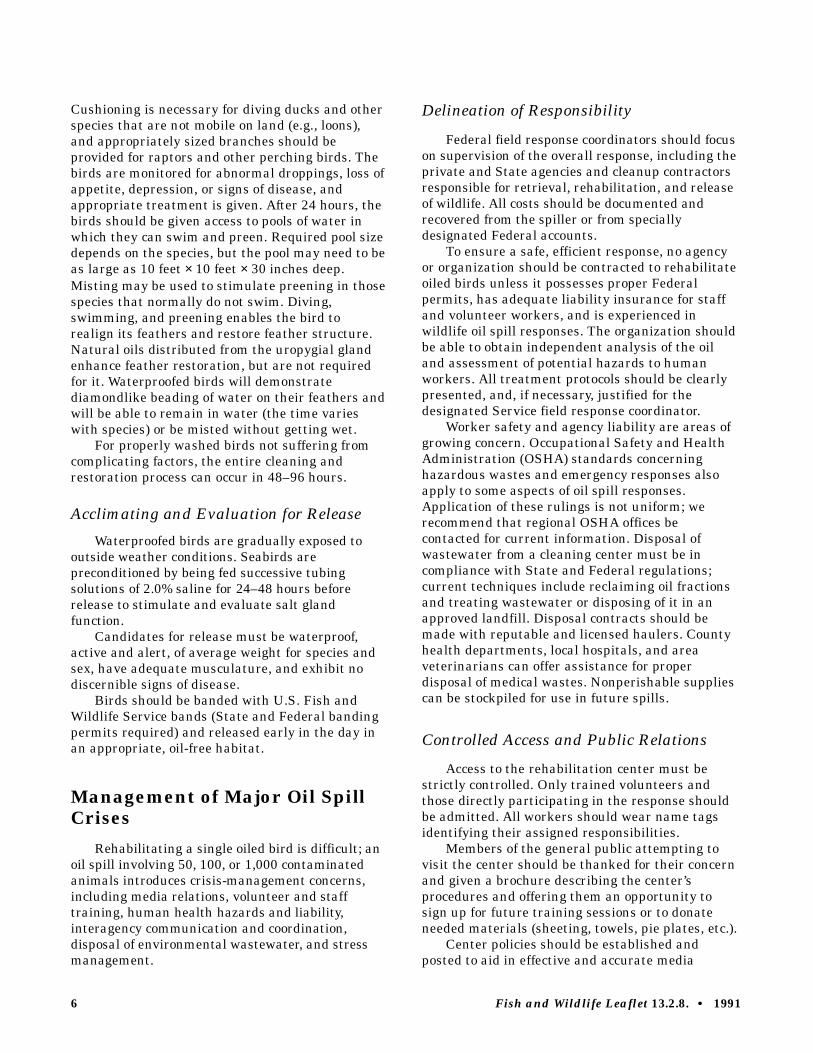
Cushioning is necessary for diving ducks and other species that are not mobile on land (e.g., loons), and appropriately sized branches should be provided for raptors and other perching birds. The birds are monitored for abnormal droppings, loss of appetite, depression, or signs of disease, and appropriate treatment is given. After 24 hours, the birds should be given access to pools of water in which they can swim and preen. Required pool size depends on the species, but the pool may need to be as large as 10 feet × 10 feet × 30 inches deep. Misting may be used to stimulate preening in those species that normally do not swim. Diving, swimming, and preening enables the bird to realign its feathers and restore feather structure. Natural oils distributed from the uropygial gland enhance feather restoration, but are not required for it. Waterproofed birds will demonstrate diamondlike beading of water on their feathers and will be able to remain in water (the time varies with species) or be misted without getting wet.
For properly washed birds not suffering from complicating factors, the entire cleaning and restoration process can occur in 48–96 hours.
Acclimating and Evaluation for Release
Waterproofed birds are gradually exposed to outside weather conditions. Seabirds are preconditioned by being fed successive tubing solutions of 2.0% saline for 24–48 hours before release to stimulate and evaluate salt gland function.
Candidates for release must be waterproof, active and alert, of average weight for species and sex, have adequate musculature, and exhibit no discernible signs of disease.
Birds should be banded with U.S. Fish and Wildlife Service bands (State and Federal banding permits required) and released early in the day in an appropriate, oil-free habitat.
Management of Major Oil Spill Crises
Rehabilitating a single oiled bird is difficult; an oil spill involving 50, 100, or 1,000 contaminated animals introduces crisis-management concerns, including media relations, volunteer and staff training, human health hazards and liability, interagency communication and coordination, disposal of environmental wastewater, and stress management.
Delineation of Responsibility
Federal field response coordinators should focus on supervision of the overall response, including the private and State agencies and cleanup contractors responsible for retrieval, rehabilitation, and release of wildlife. All costs should be documented and recovered from the spiller or from specially designated Federal accounts.
To ensure a safe, efficient response, no agency or organization should be contracted to rehabilitate oiled birds unless it possesses proper Federal permits, has adequate liability insurance for staff and volunteer workers, and is experienced in wildlife oil spill responses. The organization should be able to obtain independent analysis of the oil and assessment of potential hazards to human workers. All treatment protocols should be clearly presented, and, if necessary, justified for the designated Service field response coordinator.
Worker safety and agency liability are areas of growing concern. Occupational Safety and Health Administration (OSHA) standards concerning hazardous wastes and emergency responses also apply to some aspects of oil spill responses. Application of these rulings is not uniform; we recommend that regional OSHA offices be contacted for current information. Disposal of wastewater from a cleaning center must be in compliance with State and Federal regulations; current techniques include reclaiming oil fractions and treating wastewater or disposing of it in an approved landfill. Disposal contracts should be made with reputable and licensed haulers. County health departments, local hospitals, and area veterinarians can offer assistance for proper disposal of medical wastes. Nonperishable supplies can be stockpiled for use in future spills.
Controlled Access and Public Relations
Access to the rehabilitation center must be strictly controlled. Only trained volunteers and those directly participating in the response should be admitted. All workers should wear name tags identifying their assigned responsibilities.
Members of the general public attempting to visit the center should be thanked for their concern and given a brochure describing the center’s procedures and offering them an opportunity to sign up for future training sessions or to donate needed materials (sheeting, towels, pie plates, etc.).
Center policies should be established and posted to aid in effective and accurate media
Fish and Wildlife Leaflet 13.2.8. •• 1991 6

communication. Comments to the media should be restricted to those taken directly from the daily news release, which should be typed every morning and be available to the press.
Interviews and video opportunities should be limited to one or two 15-minute sessions daily, with the times clearly posted at the entrance to the center.
Rehabilitation Center Operations
During the first days of an oil spill response, the center is open almost 24 hours a day, with staff and volunteers working rotating shifts. Certain policies are followed to provide continuity and consistency of operation.
Each area of the facility should be clearly identified and posters describing the treatment protocol for that area should be prominently displayed. An end-of-day report summarizing all pertinent operational and caseload information should be completed each day by the appropriate staff.
At least one person should be on duty during each shift to handle all telephone calls; a second worker should be responsible for weekly scheduling of staff and volunteers. A supplies team should obtain all items necessary for smooth operation of the center.
Even in a small oil spill response, resource needs are tremendous. If the rehabilitation center admitted and treated 30 birds a day, three wash lines would be needed, necessitating 10 bird-cleaning volunteers for each 8-hour shift. As much as 4,500 gallons of clean water would be required, half of which would become oil-contaminated, requiring special disposal. Workers would also be needed for each shift for operations control, medical, and rehabilitation areas, swelling the number of people needed for one 24-hour day to 54.
Conclusion
Bird rehabilitation after a major oil spill is an emergency operation requiring immediate action by prepared, experienced personnel. The key components of an effective response are:
•• contingency planning to identify key agencies, people, and material needs;
•• rapid response;
•• enlisting an experienced response agency to direct wildlife care; and
•• adherence to proven protocols.
Suggested Resources Bayer, R. D. Oiled birds: How to search for and capture
oiled birds at Oregon intertidal areas. Gahmken Press, Newport, Oreg. 30 pp.
Burridge, J., and M. Kane, editors. 1985. Rehabilitating oiled seabirds: a field manual. American Petroleum Institute, Publication 4407. Washington, D.C. 79 pp.
Environment Canada. How to rescue oiled birds. (For information on this 20-minute video, contact Environment Canada, 351 St. Joseph Boulevard, Ottawa, K1A OH3.)
Friend, M. 1987. Field guide to wildlife diseases. Vol 1: General field procedures and diseases of migratory birds. U.S. Fish Wildl. Serv., Resour. Publ. 167. 225 pp.
Frink, L. F., and S. Welte. 1990. Oiled bird rehabilitation: a guide for establishing and operating a treatment facility for oiled birds. Unpublished manual. Tri-State Bird Rescue and Research, Inc., Wilmington, Del. 65 pp.
Leighton, F. 1983. The pathophysiology of petroleum oil toxicity in birds: a review. In D. G. Rosie and S. N. Barnes, eds. The effects of oil on birds: physiological research, clinical applications and rehabilitation. Proceedings of a 17–19 September 1982 conference at the Wetlands Institute, Stone Harbor, N.J.
Experienced Response Agencies International Bird Rescue Research Center, 699 Potter
Street, Berkeley, Calif. 94710. (415)841-9086. Tri-State Bird Rescue and Research, Inc., P.O. Box 289,
Wilmington, Del. 19899. (302)737-7241.
Environment Canada has trained response agencies in Newfoundland, Nova Scotia, and Quebec. Contact: Gilles Lauzon, Contingency Planning Officer, Environmental Emergencies, Environment Canada, PVM, 15th Floor, 351 St. Joseph Blvd., Ottawa, Canada, K1A OH3.
Note: Use of trade names does not imply U.S. Government endorsement of commercial products.
Fish and Wildlife Leaflet 13.2.8. •• 1991 7

UNITED STATES DEPARTMENT OF THE INTERIOR FISH AND WILDLIFE SERVICE
Fish and Wildlife Leaflet 13 Washington, D.C. •• 1991
8

W A T E R F O W L M A N A G E M E N T H A N D B O O K
13.2.10. Decoy Traps for Ducks
James K. Ringelman Colorado Division of Wildlife 317 Prospect Street Fort Collins, CO 80526
Waterfowl managers and researchers must often capture ducks to band, mark, or measure. During fall and winter, cannon nets, walk-in bait traps, or swim-in traps with funnel entrances are commonly used to capture ducks. However, all of these use bait, usually grain, to lure birds. During the breeding and post-breeding periods, when the diet of many dabbling duck species is dominated by aquatic invertebrates, birds often respond poorly to bait traps. Many diving ducks do not respond to bait traps at any time of the year. Decoy traps are an effective alternative to bait traps in spring and early summer because they rely on behavioral responses, not food, to attract and capture birds.
Portable decoy traps employ one or more live "decoy" ducks confined at a highly visible, over-water site. Wild ducks are captured when they attempt to approach these decoy birds. This behavioral reaction seems to be based largely on either a territorial response (territorial individuals approach a conspecific with the intent of ejecting it from a territory) or a mate-seeking response (birds approach a prospective mate). However, since species different from that of a decoy bird are also captured, ducks probably also approach while seeking a place to loaf, preen, or feed.
Trap Design and Construction
Although decoy traps have been designed specifically for both dabbling and diving ducks, differ-
Fish and Wildlife Leaflet 13.2.10. •• 1990
ences in design are more reflective of an evolution in door and trigger mechanisms than a need to tailor traps to a particular species. For example, spring-loaded doors were originally devised because funnel entrances used in early traps were not effective for capturing canvasbacks (Aytha valisineria); later researchers found spring-loaded doors increased capture rates for other species as well. Consequently, managers are advised to construct and deploy traps with the most recent innovations in door and trigger mechanisms. Although these traps are more expensive and complex to assemble, enhanced capture rates and reliability more than offset these disadvantages.
The key design considerations for decoy traps are (1) a central decoy compartment that forces wild birds to enter the trap to get next to the decoy bird, (2) large entrance holes that allow wild birds to view the decoy bird through a single layer of wire mesh, (3) a reliable, yet stable trigger mechanism, and (4) multiple compartments large enough to allow simultaneous capture of pairs.
The most effective decoy trap for both dabbling and diving ducks is constructed from 14-gauge, 1- × 1-in. or 1- × 2-in. mesh, galvanized, welded wire (Figs. 1 and 2). About 29 ft of welded wire, 5 ft wide, is needed for each trap (Fig. 1). Round traps are preferable to square designs because they provide a greater opportunity for multiple catches and are easily transported (rolled) by one person. Hog rings or other wraparound metal fasteners (Valentine Equipment Company, 7510 South Madison St., P.O. Box 53, Hinsdale, Ill. 60521)1 should be used to tightly join seams and hinge doors and treadles. A pair of
1 NOTE: Use of trade names does not imply U.S. Government endorsement of commercial products.
1

utility springs, 8 to 12 in. long and covered with flexible tubing to prevent binding with the wire mesh, are used to close each door. Doors operate independently and, when closed, are designed to overlap entrance holes by 2 in. on all sides. Heavy (6-gauge) wire should be used to reinforce door edges. Treadles are hinged to the bottom of the trap parallel to the doors and 18 to 20 in. from the opening. Monofilament fishing line (20-lb test) connects the trigger to the top end of the treadle, which is positioned just below the water surface.
For the welfare of the decoy bird, the decoy compartment should be constructed of the same gauge welded wire with a top that can be tightly secured with wire or latches to guard against predators. The decoy compartment must be equipped with a loafing platform fastened about 6 in. from the bottom of the compartment. Decoy birds should be provided with a covered food tray. Aluminum window screen fastened to the bottom of the compartment will prevent spilled food from sinking out of reach of
Fig. 1. Layout of decoy trap components cut from 5-ft-wide welded wire with a 1× 2-in. mesh. Blackened areas denote cutouts. All dimensions are in inches.
the decoy bird. The trap diagramed here (Fig. 1) includes a removable decoy cage, which is enclosed within the inner wall of the trap. This feature will aid in replacing the decoy duck without handling birds at the trap site, thus reducing stress on the decoy bird and speeding the process of exchanging decoys.
Trigger mechanisms have been made with either 6-gauge wire, coiled to pivot at about one-third of its length, then bent to form a door release, or with a modified pan and dog from a #1 long-spring, steel leg-hold trap. The former trigger is simple, but difficult to adjust so that it is sensitive enough to release when a bird touches the treadle, yet is insensitive to wind, wave action, and the movements of birds captured in adjoining compartments. The latter design (pictured in Sharp and Lokemoen 1987), although more difficult and expensive to build, is more sensitive and reliable.
Upon completion of the trap, any projecting wire ends should be trimmed back as close as possi
2 Fish and Wildlife Leaflet 13.2.10. •• 1990
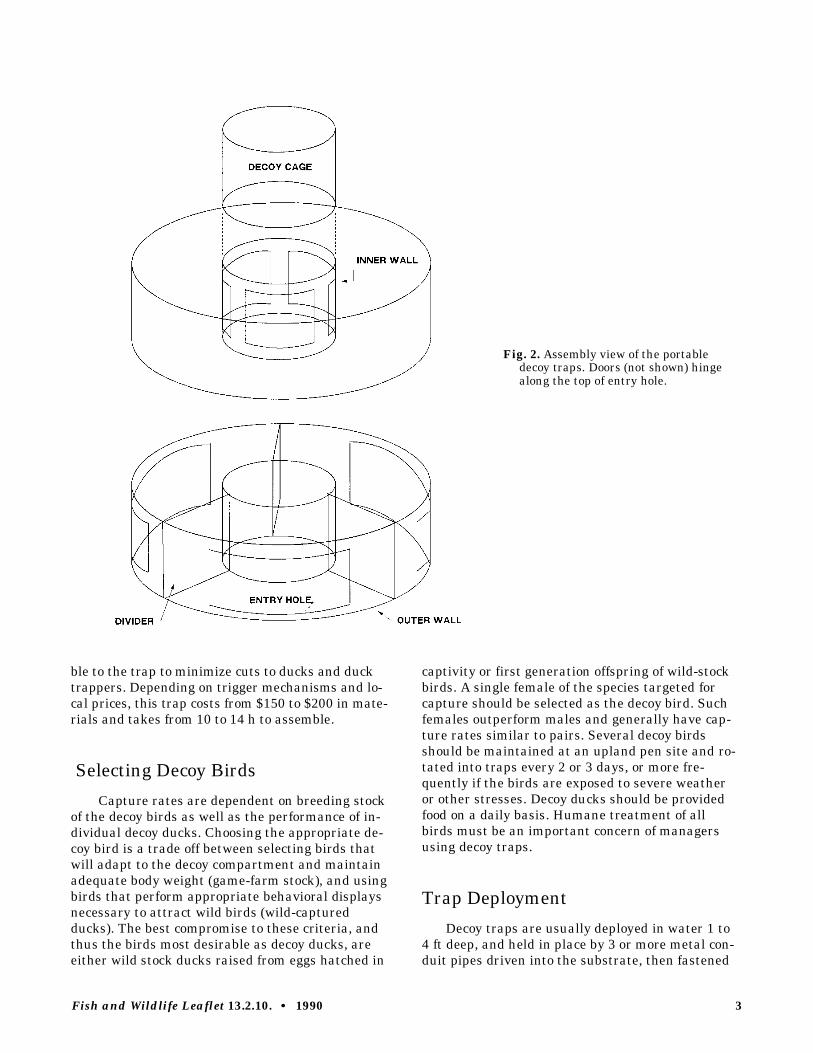
ble to the trap to minimize cuts to ducks and duck trappers. Depending on trigger mechanisms and local prices, this trap costs from $150 to $200 in materials and takes from 10 to 14 h to assemble.
Selecting Decoy Birds
Capture rates are dependent on breeding stock of the decoy birds as well as the performance of individual decoy ducks. Choosing the appropriate decoy bird is a trade off between selecting birds that will adapt to the decoy compartment and maintain adequate body weight (game-farm stock), and using birds that perform appropriate behavioral displays necessary to attract wild birds (wild-captured ducks). The best compromise to these criteria, and thus the birds most desirable as decoy ducks, are either wild stock ducks raised from eggs hatched in
Fig. 2. Assembly view of the portable decoy traps. Doors (not shown) hinge along the top of entry hole.
captivity or first generation offspring of wild-stock birds. A single female of the species targeted for capture should be selected as the decoy bird. Such females outperform males and generally have capture rates similar to pairs. Several decoy birds should be maintained at an upland pen site and rotated into traps every 2 or 3 days, or more frequently if the birds are exposed to severe weather or other stresses. Decoy ducks should be provided food on a daily basis. Humane treatment of all birds must be an important concern of managers using decoy traps.
Trap Deployment
Decoy traps are usually deployed in water 1 to 4 ft deep, and held in place by 3 or more metal conduit pipes driven into the substrate, then fastened
Fish and Wildlife Leaflet 13.2.10. •• 1990 3

to the trap with hose clamps. For deeper water sites, floats with anchors can be used in place of conduit. Traps should be set in wetlands frequented by the target species, and set so that the bottom of the entrance holes are 2 in. below the water surface, thereby allowing ducks to swim into the trap. The loafing platform for the decoy bird should be high enough above the water to remain dry even with wind-driven waves. Decoy traps are most successful if placed out in open water where they are visible to large numbers of ducks. Check traps a minimum of three times per day, usually in early morning, at midday, and at dusk.
Decoy traps are most effective during the pre-and early-nesting periods when pair bonds are strong. As incubation proceeds and males congregate in groups, the effectiveness of these traps usually declines. Even so, decoy traps have been used successfully to capture fully feathered ducklings and postbreeding, flightless ducks in late summer. Although portable decoy traps have not been used during fall and winter, it is doubtful that they would be effective during these seasons.
Capture Rates and Age-Sex Composition
Compared with bait traps used during fall and winter, capture rates of decoy traps are low. However, decoy traps will often capture birds when other techniques will not, and operation of decoy traps is not as labor intensive as techniques such as cannon nets. In the high-density duck breeding habitats of the north-central United States and south-central Canada, capture rates for adult mallards (Anas platyrynchos) average 0.32 males per
trap-day and 0.09 females per trap-day. During the postbreeding period, immature mallards have been captured at a rate of 0.06 immatures per trap-day, while adult capture rates approximated those of adult females during breeding. Capture rates for lesser scaup (Aythya affinis), canvasbacks, and redheads (A. americana) average 0.56, 0.84, and 1.10 ducks per trap-day, respectively.
Among mallards, males typically make up the bulk of the catch. However, in Manitoba, redhead females were captured 1.8 times more often than males in relation to their abundance. Early morning and late evening are usually the most productive periods for trapping. The age ratio of breeding, female canvasbacks captured in decoy traps has been shown not to differ from that of the breeding population, suggesting that at least for this species, decoy traps are not age-biased. An added benefit of decoy traps is that once placed in the breeding territory of a pair, they may recapture the same individuals several times.
Suggested Reading Anderson, M. G., R. D. Sayler, and A. D. Afton. 1980. A
decoy trap for diving ducks. J. Wildl. Manage. 44:217−219.
Blohm, R. J., and P. Ward. 1979. Experience with a decoy trap for male gadwalls. Bird-Banding 50:45−48.
Blums, P. N., V. K. Reders, A. A. Mednis, and J. A. Baumanis. 1983. Automatic drop-door traps for ducks. J. Wildl. Manage. 47:199−203.
Rogers, J. P. 1964. A decoy trap for male lesser scaups. J. Wildl. Manage. 28:408−410.
Sharp, D. E., and J. T. Lokemoen. 1987. A decoy trap for breeding-season mallards in North Dakota. J. Wildl. Manage. 51:711−715.
UNITED STATES DEPARTMENT OF THE INTERIOR FISH AND WILDLIFE SERVICE
Fish and Wildlife Leaflet 13 Washington, D.C. •• 1990
4 Fish and Wildlife Leaflet 13.2.10. •• 1990

W A T E R F O W L M A N A G E M E N T H A N D B O O K
13.2.11. Increasing Waterfowl Nesting Success on Islands and Peninsulas
John T. Lokemoen U.S. Fish and Wildlife Service Northern Prairie Wildlife Research Center Rural Route 1, Box 96C Jamestown, North Dakota 58401-9736
Waterfowl that nest in uplands in the prairie pothole region have had low recruitment rates in recent decades, primarily because of predation. The loss of breeding waterfowl and their progeny has generated interest in management techniques that safeguard incubating hens and their eggs. Developing islands and peninsulas for nesting waterfowl has potential because these sites are naturally attractive to breeding ducks and geese. In fact, dense nesting colonies of ducks developed on some islands when successful females and a portion of their female progeny returned in subsequent years.
Managers have successfully duplicated the beneficial attributes of islands by developing various nesting habitats that are protected by water barriers. This chapter addresses the management of existing islands, the creation of new islands, and the modification of peninsulas into islands to increase nesting success in waterfowl.
Locating Manageable Islands and Peninsulas
Hundreds of natural islands and peninsulas occur in the prairies and plains of the United
Fish and Wildlife Leaflet 13.2.11. •• 1993
States and Canada. Management of islands and peninsulas is most successful here, where waterfowl populations are high and terrestrial mammals are the primary nest predators.
Many existing islands and peninsulas can be located with aerial photographs or with maps of the National Wetlands Inventory. The location of each potentially manageable island and peninsula and pertinent management information should be recorded in a permanent ledger. At each site, factors such as ownership, number of wetlands within 1 mile (1.6 km), type and area of existing nesting cover, and the classification of the present wetland should be recorded (Table).
Management of Islands
A variety of waterfowl, most notably gadwalls, mallards, lesser scaups, and Canada geese, nest on islands (Table). In addition, islands are favored as breeding habitats by some shorebird species, such as American avocets and piping plovers, and by colonial nesters, namely American white pelicans, common terns, and several species of gulls.
Site Selection Factors
The safest nesting islands are usually far from shore in large saline lakes or in open freshwater wetlands. Islands should be at least 425 feet (130 m) from shore and 300 feet (91 m) apart. This distance and separation impede travel of predators
1
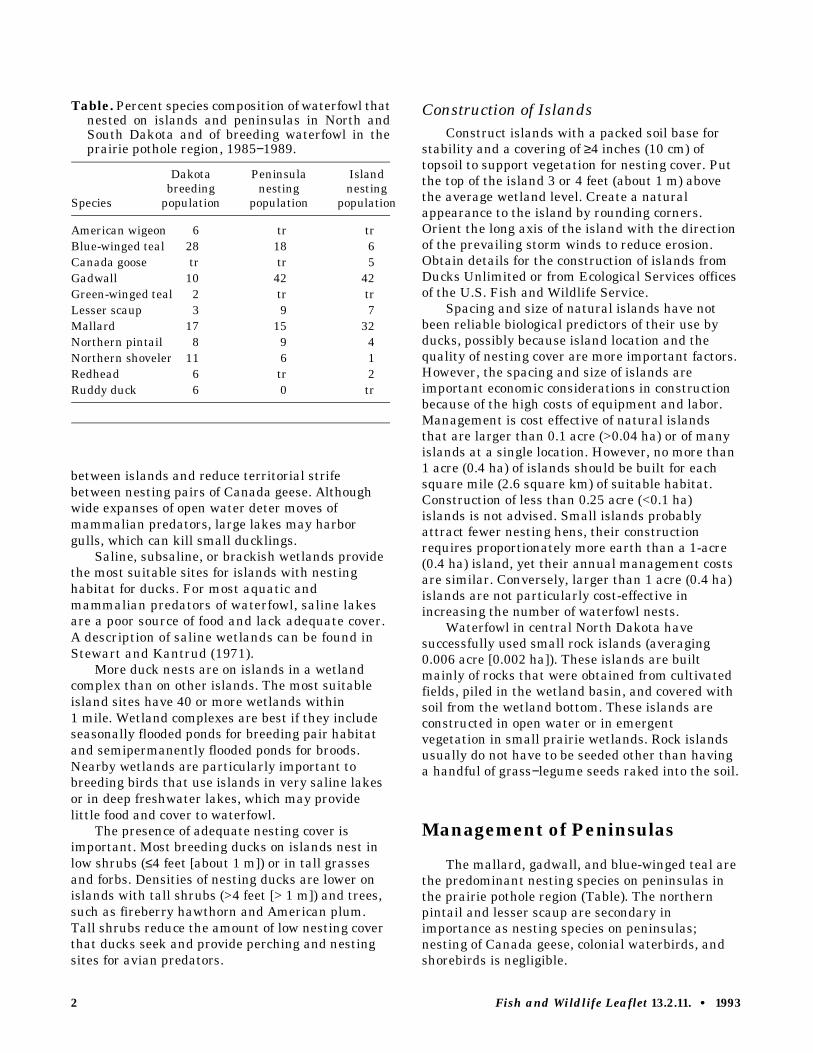
Table. Percent species composition of waterfowl that nested on islands and peninsulas in North and South Dakota and of breeding waterfowl in the prairie pothole region, 1985−1989.
Dakota Peninsula Island breeding nesting nesting
Species population population population
American wigeon 6 tr tr Blue-winged teal 28 18 6 Canada goose tr tr 5 Gadwall 10 42 42 Green-winged teal 2 tr tr Lesser scaup 3 9 7 Mallard 17 15 32 Northern pintail 8 9 4 Northern shoveler 11 6 1 Redhead 6 tr 2 Ruddy duck 6 0 tr
between islands and reduce territorial strife between nesting pairs of Canada geese. Although wide expanses of open water deter moves of mammalian predators, large lakes may harbor gulls, which can kill small ducklings.
Saline, subsaline, or brackish wetlands provide the most suitable sites for islands with nesting habitat for ducks. For most aquatic and mammalian predators of waterfowl, saline lakes are a poor source of food and lack adequate cover. A description of saline wetlands can be found in Stewart and Kantrud (1971).
More duck nests are on islands in a wetland complex than on other islands. The most suitable island sites have 40 or more wetlands within 1 mile. Wetland complexes are best if they include seasonally flooded ponds for breeding pair habitat and semipermanently flooded ponds for broods. Nearby wetlands are particularly important to breeding birds that use islands in very saline lakes or in deep freshwater lakes, which may provide little food and cover to waterfowl.
The presence of adequate nesting cover is important. Most breeding ducks on islands nest in low shrubs (≤4 feet [about 1 m]) or in tall grasses and forbs. Densities of nesting ducks are lower on islands with tall shrubs (>4 feet [> 1 m]) and trees, such as fireberry hawthorn and American plum. Tall shrubs reduce the amount of low nesting cover that ducks seek and provide perching and nesting sites for avian predators.
Construction of Islands Construct islands with a packed soil base for
stability and a covering of ≥4 inches (10 cm) of topsoil to support vegetation for nesting cover. Put the top of the island 3 or 4 feet (about 1 m) above the average wetland level. Create a natural appearance to the island by rounding corners. Orient the long axis of the island with the direction of the prevailing storm winds to reduce erosion. Obtain details for the construction of islands from Ducks Unlimited or from Ecological Services offices of the U.S. Fish and Wildlife Service.
Spacing and size of natural islands have not been reliable biological predictors of their use by ducks, possibly because island location and the quality of nesting cover are more important factors. However, the spacing and size of islands are important economic considerations in construction because of the high costs of equipment and labor. Management is cost effective of natural islands that are larger than 0.1 acre (>0.04 ha) or of many islands at a single location. However, no more than 1 acre (0.4 ha) of islands should be built for each square mile (2.6 square km) of suitable habitat. Construction of less than 0.25 acre (<0.1 ha) islands is not advised. Small islands probably attract fewer nesting hens, their construction requires proportionately more earth than a 1-acre (0.4 ha) island, yet their annual management costs are similar. Conversely, larger than 1 acre (0.4 ha) islands are not particularly cost-effective in increasing the number of waterfowl nests.
Waterfowl in central North Dakota have successfully used small rock islands (averaging 0.006 acre [0.002 ha]). These islands are built mainly of rocks that were obtained from cultivated fields, piled in the wetland basin, and covered with soil from the wetland bottom. These islands are constructed in open water or in emergent vegetation in small prairie wetlands. Rock islands usually do not have to be seeded other than having a handful of grass−legume seeds raked into the soil.
Management of Peninsulas
The mallard, gadwall, and blue-winged teal are the predominant nesting species on peninsulas in the prairie pothole region (Table). The northern pintail and lesser scaup are secondary in importance as nesting species on peninsulas; nesting of Canada geese, colonial waterbirds, and shorebirds is negligible.
2 Fish and Wildlife Leaflet 13.2.11. •• 1993

Site Selection Factors
Like islands, peninsulas for intensive management of waterfowl production should be in saline or open freshwater lakes. Such wetlands are usually free of emergent vegetation and therefore provide good loafing sites for breeding pairs of ducks but little food and cover for aquatic mammalian predators. Peninsulas should be managed in ≥2 feet (0.6 m) deep wetlands because the water barrier is present during most years and fences and moats do not have to extend far to reach >1 foot (0.3 m) deep water. Lakes for the management of peninsulas should be within 1 mile (1.6 km) of suitable wetland habitat for pairs and broods. Duck species that usually nest on peninsulas prefer moderate to tall cover, including low shrubs (<4 feet [1 m]) and grass−forb mixtures. Remove tall shrubs and trees from managed peninsulas and control all subsequent regrowth.
Because managed peninsulas attract breeding pairs from a large surrounding area, the
effectiveness of management increases when sites are 1 mile (1.6 km) or farther apart. Management of peninsulas that are smaller than 2 acres (0.8 ha) is probably not cost-effective. The number of expected ducklings on these small peninsulas is too modest to justify the cost of management.
Construction of Fences The most common barriers to predators at
peninsulas are electric fences. Electric fences should extend across the base of the peninsula and into the water on each side (Fig. 1). Normally, fences have to project only 50 feet (15 m) into open water but must extend into at least 1 foot (0.3 m) deep water.
Most fences have a permanent portion on upland and an attached but removable segment in wetlands. The portion on upland is a wire barrier of 2 pieces of 1-inch (2.5 cm) mesh, 18-gauge (1.2 mm diameter of wire) poultry netting. The netting extends from 1 foot (0.3 m)
Fig. 1. A dry land section and an adjoining wetland section of an electrified barrier fence to bar access of predators to peninsulas. All measurements are in inches.
Fish and Wildlife Leaflet 13.2.11. •• 1993 3

below ground to 5.5 feet (1.7 m) above ground. Use galvanized wire (which also serves as a ground) for the energized wires on the upper part of the fence. Vinyl-clad netting for the lower 2−3 feet (0.6−0.9 m) of the fence, including the 1 foot (0.3 m) below ground, retards rusting. The two wire meshes are woven together with stainless steel wire or fastened together with hog rings. In some situations a zinc-coated knotted fence or "horse fence" is used for the wire barrier. The knotted fence is more flexible for use on uneven ground and more resistant to fire. Where fire is a serious problem, a 3 foot (about 1 m) area on either side of the fence should be cleared of vegetation to prevent flames from scorching the wires.
Two 12.5-gauge (wire diameter = 2.7 mm) energized wires are attached to the side of the wire barrier facing the base of the peninsula. These wires are 4 feet (1.2 m) above ground and 2.5 inches (6.3 cm) and 5.0 inches (12.7 cm) from the poultry netting. The wires are held in place by fiberglass rods that are driven into the wooden posts and by insulators that are attached to the poultry netting. Place another energized wire 5 inches (12.7 cm) above the top of the poultry netting. To deter predators from jumping over the fence, the top 1 foot (0.3 m) should lean toward the base of the peninsula at a 45° angle. Areas without coyotes may not need the 45° overhang. Electrify wires with small high-voltage units such as the E-12 energizer made by Gallagher Power Fence, Inc., San Antonio, Texas. Power the energizer with a solar-charged battery. The poultry netting and the electric wires must be stretched tightly.
To reduce damage to the fences from water and ice, commercially available "cattle panels" (16 feet long by 4.25 feet high [about 5.0 m by 1.3 m]) of heavy steel rod can be used for the removable segment of the fence. Cover each panel with 1-inch (2.5 cm) poultry netting, and place an energized wire 5 inches (12.7 cm) above the top of the panel. The energized wire can be attached to the top of the panels by welding 1 rod to each panel, placing an insulator on the rod, and connecting the wire to the insulator. The panels can be held together by hog-rings or wire, and they can be held upright with fence posts that are driven into the wetland bottom. Extend the panels into the wetland each spring after the ice melts and remove them each fall prior to freezing. Check fences at regular intervals to repair electrical malfunctions and structural damage.
Construction of Moats Open water moats can also be used to bar
access of predators to peninsulas. Moats should have a 3:1 side slope, a ≥200 foot (61 m) width, and a ≥3 foot (≥1 m) water depth at the average wetland level. Because their construction is expensive, moats are most suitably employed at peninsulas with narrow necks because less soil needs to be moved during construction. Soil removed from the excavation is usually used to increase the size of the protected nesting habitat.
Management of Nesting Cover
On islands and peninsulas with poor nesting habitat, establish plant cover that ducks prefer for nesting. Canada geese have no specific requirements for nesting cover but prefer open sites. For nesting cover for ducks on newly constructed sites, immediately establish vegetation, which also prevents soil erosion. Grass-legume cover can be established by seeding with small grain drills after construction is completed in winter. Preferred plant species for nesting cover include intermediate wheatgrass, tall wheatgrass, and smooth brome mixed with alfalfa and small amounts of sweetclover. Grass and legume seed is available at many grain elevators and in seed houses in western states and provinces. Information on seeding rates and seeding techniques can be found in Duebbert et al. (1981).
The vigor and attractiveness of grass−legume plantings decline over time. Plant vigor can be restored by moderate cultivation. Alternatively, existing vegetation can be eliminated by spraying or plowing, and the area can be reseeded. Burning vegetation on islands is usually not recommended because fire eliminates all suitable nesting cover such as tall weeds, grasses, or low shrubs. Burning is advised only for complete restoration of cover.
Another option of establishing low−shrub nesting cover on a portion of the island is the planting of western snowberry or Wood’s rose. The planting and weeding of seedling shrubs require hand labor for the first growing season. However, once established, low shrubs provide excellent nesting cover for many years. Plant low shrubs at a 2.5-foot (0.8 m) spacing during April or May after the last hard frost. Put grass−legume seedings and low shrub plantings into soil where
Fish and Wildlife Leaflet 13.2.11. •• 1993 4

existing plants have been controlled by tillage or chemicals. Shrub seedlings of the described species are usually available at nurseries in most western states and provinces.
Nesting cover that has been reduced by grazing can be restored by excluding livestock with fences. Islands and peninsulas are often grazed in the fall when cattle gain access by crossing wetlands that dried out or became shallow during the summer. Exclusion of cattle may require additional fencing or an agreement with the neighboring landowner to restrain livestock. To prevent cattle damage to fences in the fall, add a low electric wire and keep the fence energized until the cattle are removed.
Management of Predators
It is crucial that skilled trappers maintain islands and peninsulas free of predators. Mammalian predators must be removed annually with quick-kill body traps set in boxes or, if necessary, leg-hold traps. Trap from the time the fences are energized or lakes become ice-free until mid-July when nesting is completed. Set traps only on the managed portion of the peninsulas and islands and not on the adjacent mainland or shoreline. Disperse traps throughout the upland habitats to capture foxes, badgers, skunks, and ground squirrels and along the shorelines to capture minks and raccoons. Most predators are trapped along the fence or moat, along the shoreline, or at natural coverts such as rock piles, dens, or tall emergent plants. During the development of a new site, the placement of 6−12 inch (about 15−30 cm) culverts along the shoreline may be useful for trapping predators. Cover the culvert with soil, but leave the ends open to provide natural pathways for minks, raccoons, and striped skunks. Small islands (<3 acres [<1.2 ha]) are often free of predators, and annual trapping may not be necessary.
In the western United States and Canada, ring-billed and California gulls nest on islands and occasionally feed on ducklings and duck eggs. Breeding gulls can be deterred from nesting on islands by establishing tall cover on potential breeding sites or by adding artificial material to bare areas.
Barrier and Island Management Costs
The average capital cost of constructing barriers in North Dakota in the 1980’s was about $7,600 (mean length = 1,090 feet [332 m]) for fences and $207,000 (mean length = 2,070 feet [631 m]) for moats. The estimated cost of each fledged duck was about $12 from fenced sites and $62 from sites with moats. On existing islands where predator removal was applied, the estimated cost per fledged duckling was about $2. The cost of ducks fledged on constructed islands is the highest because of the high cost of heavy construction ($15,000−$20,000 for a 1-acre [0.4 ha] island).
A feasible strategy for identifying suitable islands and peninsulas for cost-effective management starts with the survey of the management district. First, record the location of all islands that exceed 0.1 acre (0.04 ha) and all peninsulas that exceed 2 acres (0.8 ha). Secondly, visit each site and rate its suitability for waterfowl management based on the lake, its distance from shore, and the number of wetlands within 1 mile. Rate the nesting cover and give preference to islands with low shrubs or tall grass−legume mixtures. On islands with suitable conditions for nesting waterfowl with a history of poor nesting success, only control of predators is needed. Other islands may require management of nesting cover, the addition of low shrubs or a grass-legume mixture, or the removal of tall shrubs and trees. The third most cost-effective option is the construction of electric fences at peninsulas to create island-like nesting habitat. As a final option, islands can be constructed or peninsulas modified at sites with an optimal chance for high use by breeding waterfowl and high nesting success.
Monitoring and Evaluation
Keep a permanent record about information on predators and bird nesting on islands and peninsulas (Fig. 2). Periodically conduct a survey to evaluate nesting and nesting success by waterfowl on islands and peninsulas. Techniques for searching for nests and evaluating nesting success can be found in Klett et al. (1986).
Fish and Wildlife Leaflet 13.2.11. •• 1993 5

Fig. 2. Suggested form for recording data on islands and peninsulas with nesting habitat for waterfowl.
Suggested Reading
Duebbert, H. F., E. T. Jacobson, K. F. Higgins, and E. B. Podoll. 1981. Establishment of seeded grasslands for wildlife habitat in the prairie pothole region. U.S. Fish and Wildlife Service Special Scientific Report—Wildlife 234. 21 pp.
Greenwood, R. J., P. M. Arnold, and B. G. McGuire. 1990. Protecting duck nests from mammalian predators with fences, traps, and a toxicant. Wildlife Society Bulletin 18:75−82.
Johnson, D. H., and T. L. Shaffer. 1990. Estimating nest success: when Mayfield wins. Auk 107:595−600.
Klett, A. T., H. F. Duebbert, C. A. Faanes, and K. F. Higgins. 1986. Techniques for studying nest success
of ducks in upland habitats in the prairie pothole region. U.S. Fish and Wildlife Service Resource Publication 158. 24 pp.
Lokemoen, J. T. 1984. Examining economic efficiency of management practices that enhance waterfowl production. Transactions of the North American Wildlife and Natural Resources Conference 49:584−607.
Lokemoen, J. T., H. F. Duebbert, and D. E. Sharp. 1984. Nest spacing, habitat selection, and behavior of waterfowl on Miller Lake Island, North Dakota. Journal of Wildlife Management 48:309−321.
Stewart, R. E., and H. A. Kantrud. 1971. Classification of natural ponds and lakes in the glaciated prairie region. U.S. Fish and Wildlife Service Resource Publication 92. 57 pp.
6 Fish and Wildlife Leaflet 13.2.11. •• 1993
Appendix. Common and Scientific Names of the Plants and Animals Named in the Text.
Plants Tall wheatgrass . . . . . . . . . . . . . . . . . . . . . . . . . . . . . . . . . Agropyron elongatum Intermediate wheatgrass . . . . . . . . . . . . . . . . . . . . . . . . . . . Agropyron intermedium Smooth brome . . . . . . . . . . . . . . . . . . . . . . . . . . . . . . . . . . . . . . Bromus inermis Fireberry hawthorn . . . . . . . . . . . . . . . . . . . . . . . . . . . . . . . Crataegus chrysocarpa Alfalfa . . . . . . . . . . . . . . . . . . . . . . . . . . . . . . . . . . . . . . . . . Medicago sativa Sweetclovers . . . . . . . . . . . . . . . . . . . . . . . . . . . . . . . . . . . . . . . Melilotus spp. American plum . . . . . . . . . . . . . . . . . . . . . . . . . . . . . . . . . . . Prunus americana Wood’s rose . . . . . . . . . . . . . . . . . . . . . . . . . . . . . . . . . . . . . . . . Rosa woodsii Western snowberry . . . . . . . . . . . . . . . . . . . . . . . . . . . . Symphoricarpos occidentalis
Animals Northern pintail . . . . . . . . . . . . . . . . . . . . . . . . . . . . . . . . . . . . . . Anas acuta American wigeon . . . . . . . . . . . . . . . . . . . . . . . . . . . . . . . . . . . Anas americana Northern shoveler . . . . . . . . . . . . . . . . . . . . . . . . . . . . . . . . . . . . . Anas clypeata Green-winged teal . . . . . . . . . . . . . . . . . . . . . . . . . . . . . . . . . . . . . Anas crecca Blue-winged teal . . . . . . . . . . . . . . . . . . . . . . . . . . . . . . . . . . . . . Anas discors Mallard . . . . . . . . . . . . . . . . . . . . . . . . . . . . . . . . . . . . . . Anas platyrhynchos Gadwall . . . . . . . . . . . . . . . . . . . . . . . . . . . . . . . . . . . . . . . . . . Anas strepera Lesser scaup . . . . . . . . . . . . . . . . . . . . . . . . . . . . . . . . . . . . . . . . Aythya affinis Redhead . . . . . . . . . . . . . . . . . . . . . . . . . . . . . . . . . . . . . . . Aythya americana Canada goose . . . . . . . . . . . . . . . . . . . . . . . . . . . . . . . . . . . . Branta canadensis Coyote . . . . . . . . . . . . . . . . . . . . . . . . . . . . . . . . . . . . . . . . . . . Canis latrans Piping plover . . . . . . . . . . . . . . . . . . . . . . . . . . . . . . . . . . . Charadrius melodus California gull . . . . . . . . . . . . . . . . . . . . . . . . . . . . . . . . . . . . Larus californicus Ring-billed gull . . . . . . . . . . . . . . . . . . . . . . . . . . . . . . . . . . . Larus delawarensis Striped skunk . . . . . . . . . . . . . . . . . . . . . . . . . . . . . . . . . . . . Mephitis mephitis Mink . . . . . . . . . . . . . . . . . . . . . . . . . . . . . . . . . . . . . . . . . . . . Mustela vison Ruddy duck . . . . . . . . . . . . . . . . . . . . . . . . . . . . . . . . . . . . Oxyura jamaicensis American white pelican . . . . . . . . . . . . . . . . . . . . . . . . . . Pelecanus erythrorhynchus Raccoon . . . . . . . . . . . . . . . . . . . . . . . . . . . . . . . . . . . . . . . . . . Procyon lotor American avocet . . . . . . . . . . . . . . . . . . . . . . . . . . . . . . . Recurvirostra americana Ground squirrels . . . . . . . . . . . . . . . . . . . . . . . . . . . . . . . . . . Spermophilus spp. Common tern . . . . . . . . . . . . . . . . . . . . . . . . . . . . . . . . . . . . . . Sterna hirunda Badger . . . . . . . . . . . . . . . . . . . . . . . . . . . . . . . . . . . . . . . . . . . Taxidea taxus Gray fox . . . . . . . . . . . . . . . . . . . . . . . . . . . . . . . . . . . Urocyon cinereoargenteus Red fox . . . . . . . . . . . . . . . . . . . . . . . . . . . . . . . . . . . . . . . . . . Vulpes vulpes
Note: Use of trade names does not imply U.S. Government endorsement of commercial products.
U NIT E D ST AT E S DE PAR T ME NT OF T H E INT E R IOR F ISH AND WIL DL IF E SE R VICE
F ish and Wildli feL eaflet 13 Washington, D.C. •• 1993
Fish and Wildlife Leaflet 13.2.11. •• 1993 7

W A T E R F O W L M A N A G E M E N T H A N D B O O K
13.2.12. Artificial Nest Structures for Canada Geese
I. J. Ball Montana Cooperative Wildlife Research Unit University of Montana Missoula, MT 59812
Under natural conditions, Canada geese are protected from predatory mammals by selecting nest sites on islands, muskrat lodges, cliffs, or snags, or nests made by ospreys or other motors. The limited availability of safe natural sites seems to hold many goose populations below limits set by other habitat factors. The use of artificial structures to provide safe nest sites for Canada geese in North America began more than 50 years ago; structures are now among the most widely used, and most successful, of goose management practices.
Structures are considered any artificial device, with the exception of earthen or rock islands, intended to provide a safe nest site for Canada geese. In some situations artificial islands are preferable to structures, but artificial islands are beyond the scope of this chapter.
Deciding Whether to Use Structures
The purpose of structures is to increase nest success, usually by reducing nest predation or flooding. Structures are quite effective, often supporting nest success rates of 85−90% versus 65−75% on most natural islands or marshes. An increase in the number of pairs that uses structures is not usually accompanied by a proportional or long-term decrease in the number of pairs using adjacent natural sites. Hence, structures tend to increase a population’s base as well as its average productivity. However, a population will not increase if the
Fish and Wildlife Leaflet 13.2.12. •• 1990
additional goslings do not fledge (population limited by brood habitat) or if adult mortality is excessive. Structures can do nothing to improve the former situation, and pioneering use of structures is likely to be very slow if adult mortality is excessive.
Numerous important considerations about structures are not fundamentally biological in nature: aesthetic issues, agency policies, costs, durability, maintenance demands of nest materials, and potential for crop depredation or other nuisance problems that sometimes accompany an increasing goose population. Primary advantages of nest structures for geese are that occupancy and nest success usually are very high, capital costs are relatively low, structures are adaptable and popular for use on private lands, and results usually are rapid and tangible. The need for continuing maintenance is probably the most commonly overlooked disadvantage. In addition, poorly designed or maintained structures can cause accidental goose mortality, and some people object to structures because of their obtrusiveness or artificiality. Nest structure programs for geese probably fail more because of inadequate maintenance than for all other reasons combined. Consequently, a program should not be initiated unless the necessary maintenance can be continued for at least 10 years.
Durability of Structures
Shifting ice is a powerful force and the most important threat to structure durability in most areas. Ice damage is rare on properly installed structures in ponds less than about 50 yards in diameter. However, potential problems increase as the water area increases, and placement of nest structures then be
1

comes exceedingly important. Relative security from ice damage increases as water depth decreases; the distance from shore decreases; the amount of emergent vegetation increases; and the lee protection afforded by points, coves, bays, and islands increases.
Structures installed in relatively deep water are particularly vulnerable to ice damage: ice movement tends to be associated with deeper water, and increasing water depth also multiplies the mechanical advantage or leverage of the ice. Potential structure sites where the water depth (including unconsolidated sediments) exceeds 3 feet should be avoided unless the site is well sheltered or special precautions are taken to prevent ice damage. Ice can damage structures either by bending the structure support pipe or by tipping it (i.e., pushing the upper portion of the pipe laterally through the bottom substrate so that the pipe leans but is not bent). Selecting shallow and sheltered sites helps prevent either problem. In addition, bending can be prevented by increasing the rigidity of the support pipe. This may involve using pipe with thicker walls, adding a “sleeve” of larger pipe that extends from a foot below the bottom substrate to near the water surface, or by filling the pipe with concrete. Tipping, on the other hand, is prevented by seeking a firmer bottom substrate, increasing seating depth of the pipe into the bottom substrate, or by welding fins onto the pipe to increase its resistance to being tipped. Support pipes must be seated at least 3 feet into firm bottom substrate. Support pipes 8−10 feet in length are adequate for most overwater sites (3− 4 feet seating depth, 11⁄2−3 feet water depth, and 3 feet structure height). Substantially longer pipes will be necessary where deeper water or soft bottom substrate occurs.
Along rivers or streams, flood damage may replace ice as the major concern. Placement of structures over water is not recommended in riverine systems except in the most sheltered locations. Shoreline sites on inside bends, oxbows, and the downstream ends of islands tend to be relatively secure, but even these may be vulnerable during floods. Placing structures on or adjacent to islands is not recommended unless persistent problems from predation or flooding are known to occur.
Nest Materials
Under natural conditions, geese often nest and incubate successfully on substrates such as gravel, cobble, ledges, and stick nests, without the fine-tex
tured nest material and cover required by ducks. Geese have nested successfully in structures with no nest material at all, and one was observed nesting successfully in a bald eagle nest-atop the deteriorating carcass of the previous resident! Geese obviously are quite flexible with respect to nest material, but managers still should think carefully about nest material choices. Some materials will last several years without maintenance, while others will deteriorate substantially in a few months or may even be blown away in the first windstorm.
Loose vegetation is the most common material used in structures. Flax straw is preferred because it resists deterioration well and the stems bind together so the risk of removal by wind is decreased. Coarse grass hay or grain straw are acceptable substitutes, although annual replenishment usually will be necessary. Alfalfa hay should not be used because it deteriorates rapidly. Loose vegetation must be protected from wind loss in most types of structures. A simple and effective method to protect material from wind is to construct a sturdy “tic-tactoe” frame from steel rods 1/4 to 3/8 inches in diameter or from 1-inch-diameter willow sticks that are notched and wired securely at the junctions. The center square of this frame should be 18 inches or more across, and the length of the arms must allow the frame to settle within the structure as the nest material deteriorates. Nest material also may be wired down or secured by a 3- to 6-inch-wide sod “collar” laid over the outside edges of the vegetation.
Bales of straw or grass hay can be used as nest material on certain types of structures, and these often last 3 or more years without maintenance. Again, flax is preferred, with coarse grass hay or grain straw acceptable substitutes. The bales are wired tightly together with the cut ends at the top and bottom, then are wired securely to the structure platform. Tightly packed bales are best, but a 2-inch depression, 8−10 inches in diameter, should be cut near the center to reduce the chances of down being blown away during incubation recesses.
Nest material of bark or wood chips will last several years in many types of structures, provided the chips are large enough to resist the wind. Suppliers of landscape materials can provide large decorative bark chips (roughly 1 × 3 × 5 inches). These chips are reasonably wind resistant and are highly acceptable to geese. A mixture of large and small chips (or even flax straw) works well because geese arrange the coarsest chips around the outside edge of the structure, which tends to keep the lighter material
Fish and Wildlife Leaflet 13.2.12. •• 1990 2

from blowing out. Chipped or mulched cedar is highly resistant to deterioration and insect nest parasites but must be mixed with larger, heavier chips to reduce wind losses. Sawdust should not be used because it traps moisture and also is vulnerable to wind. Many other nest materials have been used in structures, and some seem to offer major advantages. Sod, both in large pieces and in strips, is quite durable. A product called expanded shale offers essentially unlimited durability and can be mixed with chips or flax straw; pea gravel probably would work as well but weighs about twice as much.
In summary, careful selection of nest materials can offer major advantages in reduced structure maintenance. In situations where routine annual maintenance is not a problem, then properly installed loose grain straw or grass hay is adequate. Otherwise, more durable materials should be considered.
Avoiding Safety Problems
In many ways, structures are inherently safer than natural nest sites, but safety problems are likely to arise unless care is taken. The most common safety problem in nest structures is for goslings to be trapped in the structure after nest material settles, deteriorates, or blows out. Goslings often cannot negotiate a vertical rise of more than 4 inches. Rigorous maintenance of nest material will prevent this problem, but maintenance often does not occur in spite of the best intentions. Consequently, any nest structure should provide a fail-safe method for gosling exodus regardless of the nest material status. Some practical solutions to this problem include wood shavings fiberglassed to the inside walls of conical fiberglass baskets, escape ports (3 inches in diameter), ramps (6 inches wide and ≤45°) made from wood or 1/2-inch-mesh galvanized wire, and slatted sidewalls with 2-inch vertical gaps.
Other relatively common entrapment problems (and their solutions) include: •• Goslings become entangled in wire mesh (all wire
mesh used in structures should be smaller than 1/2 inch or bigger than 2 inches);
•• Goslings are trapped between a deteriorating large bale and the wire mesh used to wrap it (if you wrap bales, use mesh bigger than 2 inches); and
•• Adults are entangled in cord used to secure nest material (use soft, single-strand wire or other methods to retain nest materials).
Evidence of entrapment mortality disappears rapidly because of scavengers or decomposition, so the appropriate preventive measures must be taken before a problem is recognized.
With the advantage of an elevated nest site, geese are quite effective at protecting their nests from predation. Occasionally, an unusually aggressive raccoon will prove to be the exception. Suspending a 30- × 4-inch PVC pipe around the support pole immediately below the structure, or trapping and removing the offending individual are two effective solutions. On rare occasions, common ravens have learned to raid structures when the geese take incubation breaks. The removal of offending individuals (within legal constraints) is the only known solution.
Placement of Structures
Geese are highly traditional, and populations seem to expand from established areas outward. Usually, the largest water areas in a particular area will be pioneered first. As a general guideline, structures should be placed in or near areas used by geese during the breeding season, but where secure nest sites are either lacking or saturated.
Territorial strife among breeding pairs tends to increase when structures are spaced less than about 100 yards apart, particularly when the two structures are within sight of each other. Providing loafing sites near each structure, reducing line-ofsight visibility by careful placement relative to obstructions, and reducing structure height may help to minimize such conflicts. However, the 100yard spacing rule remains a good guideline for maximizing occupancy and minimizing nest abandonment caused by social strife.
Structures placed 10−15 yards offshore are readily accepted by geese in most areas. These offshore structures provide adequate safety where water depth of 18 inches or more forces potential predators to swim to the site and the structure support provides some resistance to climbing. On certain easily climbed structures such as large bales, greater distance from shore (50 yards or more) and visual isolation provided by emergent vegetation may reduce predation risks. In areas where geese accept structures installed on shore, ice damage is eliminated (although problems with predation or human disturbance may increase). In situations where geese have been slow to accept shoreline structures, some managers have had good results by installing a structure at the site of a previously unsuccessful ground nest or by installing
Fish and Wildlife Leaflet 13.2.12. •• 1990 3

structures 10−15 yards offshore and then moving them progressively closer to shore over 2−3 years of use.
Little objective information exists on preference of geese for structures of different heights, but the following suggestions are offered as practical guidelines. Overwater sites should be high enough to avoid flooding during the highest water levels, with a target of about 3 feet in height during the nesting period. This height seems to deter most swimming predators, reduces visual contact between pairs, and is aesthetically acceptable. For structures installed on land, a height of 7−8 feet is recommended to discourage most leaping predators and to prevent livestock from removing nest material. Additional height over this minimum seems to reduce the effects of human disturbance but also makes installation and maintenance increasingly difficult and dangerous. For tree-mounted structures, heights of 10−20 feet may best reduce the chances that predators will detect the nest and will help decrease obtrusiveness by placing the structure above the lowest branches.
Costs
The initial cost of artificial nest structures varies substantially depending on design and materials. Including labor, the cost ranges from a low of $20 to a high of perhaps $200. To make realistic estimates of cost per gosling produced, managers must consider initial cost (materials and labor), annual maintenance cost, occupancy rates, nest success, and average structure life. Often, managers tend to focus primarily on the material cost of structures with little consideration of installation and maintenance costs. For structures requiring annual maintenance visits, the maintenance cost easily can exceed initial cost over the life of the structure. Average structure life, an extremely important but often overlooked cost variable, ranges from about 2 years for large bales, 10−15 years for most other structures, to perhaps more than 35 years for the most durable designs. Reducing initial cost by using surplus or salvage materials is a common temptation. This may be wise in some instances, but it can represent a serious error if the area begins to resemble a junkyard.
Aesthetics
Placement and structure color are key aesthetic issues-structures that are not easily seen are least likely to offend. In addition, complaints about aes
thetics can be avoided by minimizing the following structure characteristics: height, size, reflectivity or glossiness, complexity of lines, and angularity of lines. Nest structures that are in disrepair (leaning, no nest material, etc.), and those that are recognizable as an everyday item (tires and washtubs, for example), seem to generate the most complaints. Aesthetic issues are important to many people, and the pressure to maintain visually pleasing environments will increase. With recognition and care, the most reasonable aesthetic concerns can be met.
Monitoring
The most important variables in a structure monitoring program are occupancy (percent of structures occupied) and nest success (percent of known-fate nests in which at least one egg hatches). Clutch size and egg viability usually are of lesser interest because they are well documented in the literature. A basic monitoring program documenting occupancy and nest success provides most of the data necessary to evaluate the progress of the structure program, but additional data may be useful to determine annual variation in productivity. Furthermore, changes in egg viability may provide an early warning of developing problems with pesticides or other contaminants.
To minimize risks of nest abandonment, nests should not be checked until late incubation. If structures are checked only once each year (probably the most defensible strategy for most management programs), then the ideal schedule is to begin cheeks immediately after about 90% of the nests have been terminated. The evidence available for determining nest success begins to deteriorate soon after activity in a nest ceases, so delayed monitoring is accompanied by a loss in accuracy. Successful nests contain egg membranes that are leathery, relatively intact, and usually detached from eggshell fragments. Chalky, greenish-white waste products from the goslings often can be found encased in the membranes. Structure location should be marked on a detailed map, and each structure should be marked with a unique identification number (on both the structure and the map). The potential value of monitoring structures is decreased substantially unless occupancy and success rates are summarized and evaluated annually.
Types of Structures
Dozens of structure designs have been used successfully for Canada geese, and managers often
Fish and Wildlife Leaflet 13.2.12. •• 1990 4

develop strong opinions about what design is best. There is little reason to believe that any one type is better or worse than another with respect to acceptability by geese. However, structures do differ substantially in durability, aesthetics, and costs. Choosing the best design involves-careful thought about local conditions: icing patterns; costs and seasonal availability of labor; availability of emergent vegetation for physical protection and visual screening; water depth; substrate firmness; availability of materials; shipping costs for commercially made structures; and availability of trees or other natural supports. The structure types presented here represent examples of designs that have been used successfully in many situations. Detailed plans for these designs are available from the author.
Single-post Structures Advantages of single-post structures (Fig. 1) in
clude durability, simplicity of construction and lines, low to moderate costs, ease of installation (often 15−20 min), and commercial availability if desired. Geese will accept nest compartments varying
from 22 to more than 42 inches in diameter, but 26− 32 inches is probably best for practical reasons. Depth should be 8−12 inches to retain nest material, but provisions must be made for safe exodus by goslings. Shape is not critical, but conical shapes seem to retain nest material particularly well and provide for gosling exodus. Rounded “tank end” or “pot” shapes seem to be most acceptable aesthetically. Fiberglass, rubber, or wood (1 inch or more in thickness and of a rot-resistant species) are preferred materials. Positive drainage must be provided. Structures made of wire (<1/2- or >2-inch mesh size) may be acceptable in some situations, but nest material in wire structures is easily blown away. Wooden structures soon weather to drab colors, but structures made of other materials should be painted to blend with surroundings.
Supports may be wooden posts or metal pipes. Wooden posts (≥6 inches in diameter) are adequate in some situations, but are less resistant to climbing predators than pipe and will rot quickly unless they are treated or remain saturated with water. Furthermore, buoyancy can cause wooden posts to
Fig. 1. Single-post structures. A. Inverted, painted tire attached to threads on the support pipe with a treated plywood disk and a plumbing floor flange. A driving cap is essential to prevent thread damage during installation. The support pipe can be filled with concrete to prevent bending. B. Fiberglass cone basket with welded mounting plate and adjustable ferrule mounts. C. Wooden box with predator guard made of PVC pipe. The box also can be built 12−18 inches deep with slatted sides to maintain nest material but allow goslings to exit through the 2-inch gaps between slats as the fill level drops. D. Fiberglass tub with a mounting plate made from a farm implement disk. The pole is finned to prevent tipping.
Fish and Wildlife Leaflet 13.2.12. •• 1990 5

rise and tip unless they are deeply seated. Steel Tree Structures pipes from 1 1⁄2 to 4 inches in diameter have been used successfully. A useful standard is 2-inch heavy-duty (sometimes called “schedule 80”) pipe with a 2-inch inside diameter and a 23⁄8-inch outside diameter. This pipe is sturdy enough for any but the harshest conditions and is available in many areas at salvage prices as drill stem. If the nest compartment drains to the support pipe, or if standard weight pipe (“schedule 40”) is used, then a hole should be drilled into the pipe a few inches above the water line to prevent flooding of the nest or splitting of the pipe by ice expansion.
Platforms
Platforms (Fig. 2) with four legs seem to offer some advantage in stability where soft bottom substrate occurs and where the upper nest structure is extremely heavy (as when two bales are used as nest material). Costs tend to be relatively high because four supports are required, and because installation is time-consuming (usually 4 or more person hours). The complicated lines of platforms reduce aesthetic acceptability to many people, but using bales as nest material can be a major advantage.
Fig. 2. Platform structures A. This basic version consists of four heavy pipe legs that bolt to a simple angle-iron frame (36 × 48 inches) supporting the wooden platform. Resistance to ice damage can be increased somewhat by constructing a rock crib between the legs. B. The reinforced platform increases ice resistance substantially because structural rigidity of the sturdy 36- × 42-inch frame is transferred to the legs. Two bales are wired to the simple platform or wedged into the upper framework of the reinforced platform.
Most of the considerations for tree structures (Fig. 3) are similar to those for single-post structures. Advantages of tree structures are that the support is provided by nature and that carefully designed and installed tree structures can be extremely inconspicuous. Potential disadvantages are that trees are easily climbed by raccoons and that tree growth often destroys wooden structures.
If the available trees are long-lived and secure, relatively high costs for the structure may be justifiable. Conversely, if short-lived tree species are involved or if many trees are lost annually to beavers or bank erosion, then the more efficient strategy is to use less expensive structures with shorter potential lifespans. Tree structures present difficulties and potential dangers during maintenance, so providing durable nest materials is even more important than in other types of structures.
Large Bales
During the past several decades, the use of large round or rectangular bales as nest structures has become popular in many areas. Potential advantages are that no maintenance is needed between installation and replacement, bales are seen as somewhat natural, and their placement provides a
Fig. 3. Tree structures. A. Expanded steel structure attaches to tree with lag screws and bends to accommodate tree growth. B. Inverted, painted tire with treated plywood disk bottom attaches to tree with ringnails. Attachment may be in a crotch, on a large horizontal limb, or on a sawed-off vertical limb. If logging could occur, aluminum nails should be used.
6 Fish and Wildlife Leaflet 13.2.12. •• 1990

practical and popular activity for public participation. Costs may be relatively low, but are not necessarily so if purchase price increases with demand or if high transportation and salary costs must be paid.
The most serious disadvantage is that bales seldom last more than 3 years, and often last only 1 or 2 years. Wrapping bales in wire mesh may extend their life somewhat, but the wire can trap goslings as the bale shrinks and the wire will remain in the marsh, creating litter or entanglement problems. The best compromise may be to use tight flax bales, double-wrapped with polypropylene twine and banded securely with plastic or metal strapping. This approach provides bales that usually last 2 or 3 years and greatly reduces the amount of litter left in the marsh. In grazed areas, cows will destroy bales if water levels drop. Bales are less resistant to leaping or climbing predators than most other structure types and occasionally provide den sites for predators.
Installation depth is critical for bales, with 18−30 inches strongly preferred. If the total depth of ice and water exceeds 12 inches, many round bales will tip over at ice-out unless the ice is completely removed from the hole and the bale settled firmly on bottom. Tipping, which occurs because the ice melts rapidly at the south side of the bale, reduces occupancy and life of bales. Large rectangular bales usually will drop through the ice with the cut ends up and down if placed on the ice with their long axis oriented north-south.
Culverts One of the few fundamentally new approaches
to nest structures in the past several decades has been the use of culverts tipped on end and filled with soil. Culverts offer the important advantages of being virtually maintenance free and exceedingly long-lived. Disadvantages are that heavy equipment may be needed for installation and that removal (if desired) can be very difficult.
Concrete culverts, as well as those made of smooth or corrugated steel, have been used successfully, although steel will no doubt rust through in time. Corrugated steel has some aesthetic drawbacks, although these can be minimized with careful site selection. Culverts will tip at ice-out nearly every time if merely placed on top of the ice. Culverts less than 30 inches in outside diameter are not recommended because of tipping problems, and the diameter should at least equal the water depth for the same reason. Culvert lengths of 6 feet are
usually best, providing for 3 feet of structure height and 3 feet of water and settling of the culvert into the substrate. The choice of culvert diameter is a trade-off between resistance to tipping and culvert weight. A concrete culvert 30 inches in inside diameter with 3-inch walls weighs about 370 pounds per lineal foot or about 2,200 pounds for a 6-foot section. Even larger culverts (48 inches in inside diameter) have been used with excellent results. These are exceptionally resistant to ice damage, and geese can be excluded from one side of them with 6- × 6-inch wire mesh so that vegetative cover and security for nesting ducks are produced.
Heavy equipment is needed for moving the largest culverts, and installation requires either a dry wetland basin or thick, solid ice conditions. Culverts should be settled firmly into the substrate. Fill material can be rocks or gravel to slightly below waterline, but should be good soil from there up. If the fill is installed dry, it will settle substantially when it gets wet. The two solutions to this problem are to revisit the site after water levels rise and top off the fill or to carry enough water to saturate and settle the fill. Bottom sediments make adequate fill unless there are salinity or alkalinity problems. Culverts can be seeded with preferred plant species or merely allowed to develop with weedy species.
Floating Structures
Floating structures are highly acceptable to geese, but practical problems have plagued most projects. Ice damage usually is severe unless floating structures are removed each fall. Furthermore, floating wooden structures will become waterlogged and will sink unless flotation materials are added. Anchors are apt to drag and anchor cables or ropes often break. Finally, muskrats often destroy unprotected foam flotation material or sink structures by piling debris upon them. For these reasons, floating structures are not recommended for geese unless other options are unavailable and unless extreme care is taken to avoid the most common problems of this kind of structure.
Suggested Reading
Atkins, T. D., and T. L. Fuller. 1979. An improved nesting structure for Canada geese. Wildl. Soc. Bull. 7:192−193.
Brakhage, G. K. 1965. Biology and behavior of tubnesting Canada geese. J. Wildl. Manage. 29:751-771.
Fish and Wildlife Leaflet 13.2.12. •• 1990 7
Appendix A. Common and Scientific Names of Animals Named in Text.
Canada goose . . . . . . . . . . . . . . . . . . . . . . . . . . . . . . . . . . Branta canadensis Beaver . . . . . . . . . . . . . . . . . . . . . . . . . . . . . . . . . . . . . . Castor canadensis Common raven . . . . . . . . . . . . . . . . . . . . . . . . . . . . . . . . . Corvus corax Bald eagle . . . . . . . . . . . . . . . . . . . . . . . . . . . . . . . . . . . . Haliaeetus leucocephalus Muskrat . . . . . . . . . . . . . . . . . . . . . . . . . . . . . . . . . . . . . Ondatra zibethicus Osprey . . . . . . . . . . . . . . . . . . . . . . . . . . . . . . . . . . . . . . Pandion haliaetus Raccoon . . . . . . . . . . . . . . . . . . . . . . . . . . . . . . . . . . . . . Procyon lotor
Appendix B. English-Metric Conversion. 1 inch = 2.5400 centimeters 1 foot = 0.3048 meter 1 yard = 0.9144 meter 1 pound = 0.4536 kilogram
U NIT E D ST AT E S DE PAR T ME NT OF T H E INT E R IOR F ISH AND WIL DL IF E SE R VICE
F ish and Wildli feL eaflet 13 Washington, D.C. •• 1990
Giroux, J., D. E. Jelinski, and R. W. Boychuk. 1983. Use of rock islands and round straw bales by nesting Canada geese. Wildl. Soc. Bull. 11:172−178.
Higgins, K. F., H. W. Miller, and L. M. Kirsch. 1986. Waterfowl nesting on an earth-filled cement culvert. Prairie Nat. 18:115−116.
Mae-key, D. L., W. C. Matthews, Jr., and I. J. Ball. 1988. Elevated nest structures for Canada geese. Wildl. Soc. Bull. 16:362−367.
Messmer, T. A., M. A. Johnson, and F. B. Lee. 1986. Homemade nest sites for giant Canada geese. North Dakota Cooperative Extension Service, North Dakota State University, Fargo. Bull. WL-910. 8 pp.
Rienecker, W. C. 1971. Canada goose nest platforms. Calif. Fish Game 57:113−123.
Will, G. C., and G. I. Crawford. 1970. Elevated and floating nest structures for Canada geese. J. Wildl. Manage. 34:583−586.
8 Fish and Wildlife Leaflet 13.2.12. •• 1990

W A T E R F O W L M A N A G E M E N T H A N D B O O K
13.2.14. Management of Habitat for Breeding and Migrating Shorebirds in the Midwest
Jan Eldridge Bell Museum of Natural History University of Minnesota Minneapolis, MN 55455
Shorebirds have always relied on the extensive network of natural wetlands from Texas to North Dakota. This network has now been fractured by wetland drainage and agriculture to the point where suitable wetlands are absent in much of the Midwest. Habitat loss and the resulting risk of population decline highlight the importance of management of shorebirds on refuges, hunting clubs, and preserves for both breeding and migrating species.
Because shorebirds, like waterfowl, depend on wetlands throughout the year, the loss of natural wetlands in the Midwest poses a real threat. Unfortunately, shorebirds are slow to recover from population declines caused by human disturbance; for example, the Eskimo curlew has never recovered from being overhunted at the turn of the century. Many species, particularly those that nest in the lower 48 states, have declined in this century because of habitat loss. Arctic nesting species are relatively safe in remote breeding grounds, but are vulnerable to degradation of habitats critical to migration through the Midwest.
This chapter provides guidance for wetland managers in midwestern states for attracting migrating and breeding shorebirds. These suggestions will benefit most of the 40 species that migrate or breed in 12 states of the mid-continent
Fish and Wildlife Leaflet 13.2.14. •• 1992
region: Illinois, Indiana, Iowa, Kansas, Michigan, Minnesota, Missouri, Nebraska, North Dakota, Ohio, South Dakota, and Wisconsin (Table). Emphasis is on migrating species because they can benefit the most from the kind of managed wetland habitat usually available on mid-continent refuges. The unique value of managed wetlands is their capacity to buffer the effects of both drought and flooding in surrounding wetland habitat.
Management of Breeding Shorebirds
Management of grassland can create essential upland habitat for breeding shorebirds through grazing, mowing, or prescribed burning. Before European settlement, breeding shorebirds specialized in exploiting the grassland mosaics left in the path of roaming buffalo herds or created by prairie fires. Today the appropriate habitat is becoming increasingly rare because native rangeland is converted to cropland throughout the Midwest. Breeding shorebirds nest in a wide range of habitat from unvegetated wetland beaches to moderately tall, dense grass in the uplands. Long-billed curlews, marbled godwits, willets, killdeer, and mountain plovers forage and nest in the short (<15 cm; <6 inches) sparse vegetation of open grasslands and often nest hundreds of yards from wetlands. Wilson’s phalaropes and upland sandpipers use somewhat taller (10−30 cm;
1

Table. Shorebirds that breed, migrate, or winter in twelve midwestern states.
Species Breeding Migrating Wintering
Snowy plover X Xa
Piping plover X X Mountain plover X X Semipalmated plover X Killdeer X X X Lesser golden-plover X Black-bellied plover X Black-necked stilt X X American avocet X X Spotted sandpiper X X Ruddy turnstone X Upland sandpiper X X Sanderling X Dunlin X Baird’s sandpiper X Red knot X White-rumped sandpiper X Stilt sandpiper X Western sandpiper X Pectoral sandpiper X Least sandpiper X Semipalmated sandpiper X Willet X X Common snipe X X X Short-billed dowitcher X Long-billed dowitcher X Marbled godwit X X Hudsonian godwit X Long-billed curlew X X X Eskimo curlew X Whimbrel X Ruff X American woodcock X X X Lesser yellowlegs X Greater yellowlegs X Solitary sandpiper X X Buff-breasted sandpiper X Red phalarope X Red-necked phalarope X Wilson’s phalarope X X a An X indicates presence in at least one of the states of the
mid-continent region during the indicated time. More detailed accounts of breeding and wintering range can be found in Hayman et al. 1986.
4−12 inches) vegetation for nesting. Phalaropes are often in wet meadows adjacent to permanent or semi-permanent wetlands, but upland sandpipers occupy drier grassland sites not associated with wetlands. American avocets and endangered piping plovers nest on bare to sparsely vegetated beaches of saline wetlands.
Nesting shorebirds avoid tilled fields and prefer native grassland to planted grass. Timely management on native grasslands can increase diversity and provide habitat for many species of breeding shorebirds. Prescribed burning benefits all nesting shorebirds. Moderate to heavy grazing or mowing, especially on wetter sites, may benefit nesting habitat for long-billed curlews, killdeer, mountain plovers, willets, and marbled godwits. Upland sandpipers benefit from light grazing or mowing in the wetter, eastern half of the Midwest. To the west, on drier sites, such management may be unnecessary. Grazing and associated trampling can be effective at controlling vegetation on wetlands managed for godwits and willets; but piping plovers abandon beaches grazed by livestock.
For many breeding shorebirds, landscape context or juxtaposition of habitats is important. During the breeding season, long-billed curlews, killdeer, mountain plovers, and upland sandpipers forage and nest in the same type of upland habitats; but Wilson’s phalaropes, American avocets, piping plovers, marbled godwits, and willets depend on the invertebrates in surrounding wetlands. American avocets and piping plovers require shallow, saline basins for feeding and brood rearing. Wilson’s phalaropes feed in open water to depths of 30 cm (12 inches) in seasonal to permanent wetlands. Marbled godwits and willets are most abundant in areas with a variety of wetland types; they feed at or near shorelines with minimal vegetation. Ephemeral and temporary ponds are important feeding sites early in reproduction, whereas seasonal, semi-permanent, and saline wetlands provide foraging habitat throughout nesting and brood rearing.
Management of Migrating Shorebirds
In the spring, shorebirds that nest in the Arctic usually migrate through the Midwest after the breeding species have already arrived. The migrating shorebirds stop opportunistically to feed. They accumulate fat reserves that are necessary for continued migration and possibly for reproduction. During migration, many species look for a specific combination of habitat elements that include:
•• a wetland in partial drawdown,
•• invertebrate abundance of at least 100 individuals per square meter,
2 Fish and Wildlife Leaflet 13.2.14. •• 1992

•• a combination of open mudflat and shallow water (3 to 5 cm; 1 to 2 inches) in a wetland basin with gradually sloping sides, and
•• very little vegetation.
Any one of these elements may be available, but without invertebrates, the birds do not stay.
The key to managing habitat for migrating shorebirds is to encourage invertebrate production and then make the invertebrates available to the birds. Aquatic invertebrates increase when wetlands are fertilized by mowing and grazing, but water control in the impoundment makes the job easier. The proper regime of drawdown and flooding can stimulate plant growth and decomposition and create a detrital food source for invertebrates. When the water is drawn down slowly (2 to 4 cm per week) during the appropriate times of the year, shorebirds are attracted to the available invertebrates. In general, water depth in which birds forage and body size of the birds correlate; larger birds tend to forage in deeper water. Some species may be attracted by shallow water, others, by mudflats. Some forage at the edge of the receding water line. If the interface between mud and water remains constant, they can deplete the invertebrates available to them. A slow, continuous drawdown provides the birds with new habitat and invertebrates. Each individual shorebird may only stay for a few days, but over several weeks, thousands of individuals of many species may benefit.
Timing of Migration
Shorebirds migrate through the Midwest over a wide span of time in the spring and an even wider span in fall. Because the timing of migration varies with latitude, managers should link drawdowns to the local migration phenology. The following dates are offered only for general guidance. Spring drawdowns should be scheduled for early to mid-April and through May, depending on the latitude of the refuge. Refuges in Missouri, for example, should begin drawdowns in early to mid-April and continue slowly for several weeks. Refuges in Minnesota and Michigan should begin drawdowns in late April to early May and continue until early June. In late summer, drawdowns can be scheduled from July to October throughout the region. If the wildlife area has more than one impoundment, managers should draw them down
asynchronously (see Fish and Wildlife Leaflet 13.4.6).
In terms of shorebird conservation, spring drawdowns may be particularly important in northern refuges because wetlands in drawdown are usually rare at this time of the year (droughts are an exception). In southern refuges, drawdowns may be especially important in fall when shorebird habitat is rare in the surrounding unprotected land.
Food Preferences
Shorebirds feed primarily on Chironomidae (midge) larvae during migration through the Midwest. Whether shorebirds prefer midges or simply eat whatever is most abundant in a wetland during a drawdown is not clear. Shorebirds probably pick the largest and easiest to catch aquatic larval form. For example, a study at the Shiawassee National Wildlife Refuge in Michigan demonstrated that shorebirds preferred slow-moving beetle larvae (Haliplidae) to the much smaller midge larvae.
Several studies revealed that, irrespective of wetland type, midge larvae are often the most abundant invertebrate. This is primarily because midges have solved several basic problems in the wetland environment. They adapted to the enormous variation in conditions that are typical of the average wetland; they can cope with freezing, drying, high temperatures, high salinity, and low oxygen. In a word, they are flexible and, as a result, adaptively radiated into a variety of niches in the wetland basin.
Chironomidae Life History
Midges have four life stages: egg, larva, pupa, and adult. The larvae progress through four instar stages during which they grow from 2 mm to as large as 24 mm. Because development is temperature dependent, four to five generations may be present in a single season in warm southern wetlands, whereas in the Arctic, one generation may take 7 years to pass through all stages. Irrespective of length of development, midges spend most of their life as larvae. The egg, pupa, and adult stages pass quickly, each in a matter of days.
Because midges are such a major component of the wetland environment, it should not be surprising that they follow the general rules of most aquatic invertebrates:
Fish and Wildlife Leaflet 13.2.14. •• 1992 3

•• species diversity increases with structural diversity of vegetation,
•• species diversity increases with water permanence.
However, species diversity may not be the best goal of water management designed specifically for shorebirds. For shorebird management, midge biomass, not diversity, should be the primary goal.
The most important midges for migrating shorebirds are the Chironominae species known as bloodworms, which are usually in the genus Chironomus. The larva are bright red because they contain hemoglobin and can withstand water with low levels of dissolved oxygen. They grow to be as long as 24 mm and are often among the earliest colonizers in newly available habitat. They function in a wetland by burrowing throughout the detritus, and they consume algae, primarily diatoms, that flourish in the detrital layer. Their burrowing churns and aerates the bottom, accelerating decomposition and microbial activity. They are often most abundant in areas of shallow, open water unshaded by submergent and emergent vegetation, thus promoting algal growth. They form tubes of detritus and usually feed from these tubes. Because they flourish in warm, shallow water and are bright red, they are prime targets for foraging shorebirds.
Management of Habitat for Midge Larvae
During spring, shorebirds congregate where large bloodworms have overwintered and are exposed in the shallows of gradually receding wetlands. The purpose of management specifically for shorebirds should be to imitate these conditions. Because many waterfowl hens and broods also consume midge larvae, management of habitat for shorebirds is also beneficial for waterfowl. Early colonizing midges, such as Chironomus tentans, flourish in wetlands maintained in an early successional stage typical of moist-soil-unit management. This keeps the plant and midge community simple and can lead to a large population (and biomass) of detrivorous midge larvae. The community remains simple when water fluctuates annually or biannually. Disking in the moist-soil units also keeps the community of plants in early succession. Wetland managers should try a variety of approaches because the success of any approach varies with location and climate. Although management in spring is stressed, each management regime can be
used in late summer by simply delaying the drawdown until the peak of the southbound shorebird migration. On refuges with more than one managed wetland, water regimes should be manipulated asynchronously so that in any given year some shorebird habitat is available during both spring and fall.
No management is complete without some level of evaluation to determine whether midge larvae and shorebirds have responded as expected to the water management. An attempt should be made to census shorebird populations on the managed wetlands and to sample midge larvae in the wetland sediment. Censuses of shorebirds can be conducted as part of a routine wildlife inventory for the refuge, and core samples can easily be taken for the midge larvae. Cores should be taken with a simple core sampler (a graduated cylinder with a diameter of approximately 7 to 10 cm is an excellent core sampler). The core should be taken to a depth of approximately 3 cm in the mud and should be washed through a screen. The midges can be most accurately counted while they are alive and colorful. The number of midge larvae per square meter of mud flat can be extrapolated from the simple count of larvae in the core sample. This number should be at least 100 midge larvae per square meter to successfully attract and hold shorebirds.
Management Regimes for Shorebirds
Temporary Wetland (Moist Soil Unit) —Winter Drawdown
Begin a slow drawdown in early to mid-July. The slow drawdown allows midge larvae to form cocoons and prepare for desiccation. Leave the wetland moist throughout the summer to encourage production of moist soil (annual) plants. The wetland can remain dry throughout the winter because vegetation decomposes more rapidly if exposed than if inundated. Return water slowly to the basin early the following spring to inundate the decomposing vegetation. Flooding the basin rapidly may float unthawed soil, causing increased turbidity later. The newly flooded wetland has a flush of nutrients and the overwintering larvae grow rapidly. Keep the water shallow and warm to encourage algal growth and nutrients for midge production. At the appropriate time of shorebird
Fish and Wildlife Leaflet 13.2.14. •• 1992 4
migration, start a gradual drawdown, always maintaining at least 3 to 5 cm of water in the wetland basin.
Temporary Wetland (Moist Soil Unit) —Summer Drawdown
Repeat the described steps for a spring drawdown to allow annuals to grow on moist mudflats. Return water to the basin in late summer after substantial annual plant biomass develops. Because midge larvae may die when conditions are too severe, inundate the basin during the winter in areas of late summer drought and hard winter freeze. Larvae continue to grow until late fall and overwinter as larger, older forms, providing spring migrants with a better food resource.
Temporary Wetland (Moist Soil Unit) —Disking and Flooding
Disk the moist soil unit in late summer and flood shallowly so the basin contains an interspersion of mudflat, shallow water, and deeper water to provide habitat as the wetland dries. When the manipulation coincides with fall migration, the shorebirds respond almost immediately.
Semipermanent Wetland—Upland Flooding Flood the uplands surrounding the emergent
vegetation zone in the early spring. This kills the wet meadow plants, and midges rapidly colonize the detritus. Maintain the water high and then slowly lower it to expose the decomposing vegetation during the peak of shorebird migration. Gradually lower the level to normal in the late summer for the southbound migration or draw it down the following spring.
Semipermanent Wetland—Periodic Drawdown
Semipermanent wetlands managed for vegetation and invertebrate diversity undergo drawdown once every 3 to 10 years depending on the size of the basin. This type of management can be coordinated with shorebird migration by drawing the wetland down slowly during the spring or late summer migration. In a complex of wetlands, the drawdowns can be conducted asynchronously so at least one basin is available to shorebirds each year.
Cautions The recommendations outlined here are based
on the assumption that the wetland does not have a history of problems, such as invasion of perennial plants (purple loosestrife, willow, or woolgrass) or outbreaks of avian disease such as botulism.
Conclusions
The management regimes outlined in this report need extensive trial, but, given what is known about shorebird and midge biology, they should prove helpful in attracting shorebirds to refuges. The key to success is to keep upland vegetation grazed or mowed and to time the drawdowns so they coincide with migration in the area of the refuge. Finally, conduct all water manipulations slowly so the invertebrates can adjust to the changes.
Suggested Reading
Driver, E. A. 1977. Chironomid communities in small prairie ponds: some characteristics and controls. Freshwater Biology 7:121−133.
Fredrickson, L. H., and T. S. Taylor. 1982. Management of seasonally flooded impoundments for wildlife. U.S. Fish and Wildlife Service Resource Publication 148. 29 pp.
Hayman, P., J. Marchant, T. Prater. 1986. Shorebirds: an identification guide to the waders of the world. Houghton Mifflin Company, Boston, Mass.
Oliver, D. R. 1971. Life history of the Chironomidae. Annual Reviews of Entomology 16:211−230.
Recher, H. F. 1966. Some aspects of the ecology of migrant shorebirds. Ecology 47:393−407.
Reid, F. A. 1985. Wetland invertebrates in relation to hydrology and water chemistry. Pages 72−79 in M. D. Knighton, editor. Water impoundments for wildlife: a habitat management workshop. U.S. Forest Service, St. Paul, Minn.
Reid, F. A., W. D. Rundle, M. W. Sayre, and P. R. Covington. 1983. Shorebird migration chronology at two Mississippi River Valley wetlands in Missouri. Transactions of the Missouri Academy of Science 17:103−115.
Rundle, W. D., and L. H. Fredrickson 1981. Managing seasonally flooded impoundments for migrant rails and shorebirds. Wildlife Society Bulletin 9:80−87.
Ryan, M. R., R. B. Renken, and J. A. Dinsmore. 1984. Marbled godwit habitat selection in the northern prairie region. Journal of Wildlife Management 48:1206−1218.
Fish and Wildlife Leaflet 13.2.14. •• 1992 5

Swanson, G. A. 1978. A simple lightweight core sampler Wiggins, G. B., R. J. MacKay, and I. M. Smith. 1980. for quantitating waterfowl foods. Journal of Wildlife Evolutionary and ecological strategies of animals in Management 42:426−428. annual temporary pools. Archiv fuer Hydrobiologie
Supplementband 58:97−206.
Appendix. Common and Scientific Names of the Birds Named in Text.
Spotted sandpiper . . . . . . . . . . . . . . . . . . . . . . . . . . . . . . . . . . . . . . . Actitis macularia Ruddy turnstone . . . . . . . . . . . . . . . . . . . . . . . . . . . . . . . . . . . . . . . . Arenaria interpres Upland sandpiper . . . . . . . . . . . . . . . . . . . . . . . . . . . . . . . . . . . . . Bartramia longicauda Sanderling . . . . . . . . . . . . . . . . . . . . . . . . . . . . . . . . . . . . . . . . . . . . . . Calidris alba Dunlin . . . . . . . . . . . . . . . . . . . . . . . . . . . . . . . . . . . . . . . . . . . . . . . Calidris alpina Baird’s sandpiper . . . . . . . . . . . . . . . . . . . . . . . . . . . . . . . . . . . . . . . . . Calidris bairdii Red knot . . . . . . . . . . . . . . . . . . . . . . . . . . . . . . . . . . . . . . . . . . . . . Calidris canutus White-rumped sandpiper . . . . . . . . . . . . . . . . . . . . . . . . . . . . . . . . . . . Calidris fuscicollis Stilt sandpiper . . . . . . . . . . . . . . . . . . . . . . . . . . . . . . . . . . . . . . . . Calidris himantopus Western sandpiper . . . . . . . . . . . . . . . . . . . . . . . . . . . . . . . . . . . . . . . . . Calidris mauri Pectoral sandpiper . . . . . . . . . . . . . . . . . . . . . . . . . . . . . . . . . . . . . . . Calidris melanotos Least sandpiper . . . . . . . . . . . . . . . . . . . . . . . . . . . . . . . . . . . . . . . . Calidris minutilla Semipalmated sandpiper . . . . . . . . . . . . . . . . . . . . . . . . . . . . . . . . . . . . Calidris pusilla Willet . . . . . . . . . . . . . . . . . . . . . . . . . . . . . . . . . . . . . . . Catoptrophorus semipalmatus Snowy plover . . . . . . . . . . . . . . . . . . . . . . . . . . . . . . . . . . . . . . Charadrius alexandrinus Piping plover . . . . . . . . . . . . . . . . . . . . . . . . . . . . . . . . . . . . . . . . . Charadrius melodus Mountain plover . . . . . . . . . . . . . . . . . . . . . . . . . . . . . . . . . . . . . . Charadrius montanus Semipalmated plover . . . . . . . . . . . . . . . . . . . . . . . . . . . . . . . . . Charadrius semipalmatus Killdeer . . . . . . . . . . . . . . . . . . . . . . . . . . . . . . . . . . . . . . . . . . . . Charadrius vociferus Common snipe . . . . . . . . . . . . . . . . . . . . . . . . . . . . . . . . . . . . . . . . Gallinago gallinago Black-necked stilt . . . . . . . . . . . . . . . . . . . . . . . . . . . . . . . . . . . . Himantopus mexicanus Short-billed dowitcher . . . . . . . . . . . . . . . . . . . . . . . . . . . . . . . . . . . Limnodromus griseus Long-billed dowitcher . . . . . . . . . . . . . . . . . . . . . . . . . . . . . . . . . Limnodromus scolopaceus Marbled godwit . . . . . . . . . . . . . . . . . . . . . . . . . . . . . . . . . . . . . . . . . . . Limosa fedoa Hudsonian godwit . . . . . . . . . . . . . . . . . . . . . . . . . . . . . . . . . . . . . . . Limosa haemastica Long-billed curlew . . . . . . . . . . . . . . . . . . . . . . . . . . . . . . . . . . . . . Numenius americanus Eskimo curlew . . . . . . . . . . . . . . . . . . . . . . . . . . . . . . . . . . . . . . . . . Numenius borealis Whimbrel . . . . . . . . . . . . . . . . . . . . . . . . . . . . . . . . . . . . . . . . . . . Numenius phaeopus Red phalarope . . . . . . . . . . . . . . . . . . . . . . . . . . . . . . . . . . . . . . . Phalaropus fulicarius Red-necked phalarope . . . . . . . . . . . . . . . . . . . . . . . . . . . . . . . . . . . . Phalaropus lobatus Wilson’s phalarope . . . . . . . . . . . . . . . . . . . . . . . . . . . . . . . . . . . . . . Phalaropus tricolor Ruff . . . . . . . . . . . . . . . . . . . . . . . . . . . . . . . . . . . . . . . . . . . . . . Philomachus pugnax Lesser golden-plover . . . . . . . . . . . . . . . . . . . . . . . . . . . . . . . . . . . . . . Pluvialis dominica Black-bellied plover . . . . . . . . . . . . . . . . . . . . . . . . . . . . . . . . . . . . . Pluvialis squatarola American avocet . . . . . . . . . . . . . . . . . . . . . . . . . . . . . . . . . . . . Recurvirostra americana American woodcock . . . . . . . . . . . . . . . . . . . . . . . . . . . . . . . . . . . . . . . . Scolopax minor Lesser yellowlegs . . . . . . . . . . . . . . . . . . . . . . . . . . . . . . . . . . . . . . . . . Tringa flavipes Greater yellowlegs . . . . . . . . . . . . . . . . . . . . . . . . . . . . . . . . . . . . . . Tringa melanoleuca Solitary sandpiper . . . . . . . . . . . . . . . . . . . . . . . . . . . . . . . . . . . . . . . . Tringa solitaria Buff-breasted sandpiper . . . . . . . . . . . . . . . . . . . . . . . . . . . . . . . . . . Tryngites subruficollis
Note: Use of trade names does not imply U.S. Government endorsement of commercial products.
UNITED STATES DEPARTMENT OF THE INTERIOR FISH AND WILDLIFE SERVICE
Fish and Wildlife Leaflet 13 Washington, D.C. •• 1992

W A T E R F O W L M A N A G E M E N T H A N D B O O K
13.2.15. Human Disturbances of Waterfowl: Causes, Effects, and Management
Carl E. Korschgen U.S. Fish and Wildlife Service Northern Prairie Wildlife Research Center La Crosse Field Station P.O. Box 2226 La Crosse, WI 54602
and
Robert B. Dahlgren U.S. Fish and Wildlife Service Office of Refuge Biology P.O. Box 2484 La Crosse, WI 54602
Human disturbances of waterfowl can be intentional or unintentional. They may result from overt or directed activities or may be ancillary to activities not initially thought to be of concern to birds. Some of these disturbances are manifested by alertness, fright (obvious or inapparent), flight, swimming, disablement, or death. Therefore, persons responsible for waterfowl management areas should be aware of the problems from human disturbance and should design management and facilities that increase public appreciation of waterfowl.
In the last 20 years, the intensity of water-based recreation increased drastically, especially on inland waters. Waterfowl are wary, seeking refuge from all forms of disturbance, particularly those associated with loud noise and
rapid movement. Occasionally, the problem of human disturbance of waterfowl resulted in formal litigation. In Nevada, for example, the Refuge Recreation Act of 1962 was affirmed to permit recreational use only when it did not interfere with the primary purpose for which the Ruby Lake National Wildlife Refuge was established. Compatibility of an activity is based on site-specific effects on the major purposes for which a refuge was established. In a recent survey of harmful and incompatible uses on national wildlife refuges, 42 use categories were determined that could be potential disturbances of waterfowl.
Activities That Cause Disturbances
Given the frequency of human disturbance of waterfowl, information from research about this issue is scant. A review of several thousand journal articles and books revealed that most disturbances are created by water users (chiefly boaters, anglers, hunters) and aircraft (Table). Human activities cause different degrees of disturbance to waterfowl and may be grouped into four main categories. Listed in order of decreasing disturbance these categories are
1. rapid overwater movement and loud noise (power-boating, water skiing, aircraft);
2. overwater movement with little noise (sailing, wind surfing, rowing, canoeing);
Fish and Wildlife Leaflet 13.2.15. •• 1992 1

3. little overwater movement or noise (wading, swimming); and
4. activities along shorelines (fishing, bird-watching, hiking, and traffic).
Disturbances displaced waterfowl from feeding grounds, increased energetic costs associated with flight, and may have lowered productivity of nesting or brooding waterfowl. Many authors either directly or indirectly implicated themselves as a cause of disturbance during their studies of waterfowl.
Effects on Breeding Waterfowl
Annual increases in waterfowl numbers are determined by several components of reproduction, including the number of breeding pairs, hatching success, and survival of the young. Human disturbance can reduce several of these components, and, in time, result in a declining waterfowl population.
Declining Numbers of Breeding Pairs Disturbances during critical times of the
nesting cycle eventually cause ducks to nest elsewhere or not to nest at all. In Maine, American black ducks and ring-necked ducks did not nest under conditions of excessive human disturbance. Mallards at the Seney National Wildlife Refuge in Michigan failed to nest in areas open to fishing. Some Wisconsin lakes bordered by homes were so heavily used for recreation that breeding ducks did not use otherwise suitable habitat. In Germany, an 85% decrease of the breeding stock of ducks at two small ponds presumably was caused solely by disturbance from an increasing number of anglers during the waterfowl breeding season. Numbers of mallards, green-winged teals, northern shovelers, pochards, and tufted ducks decreased from 26 pairs to 4 pairs during an 8-year period. Human activity on islands can altogether discourage nesting in waterfowl.
Increased Desertion of Nests Studies of several species of waterfowl
identified human disturbances as the cause of desertions or abandonments of nests, especially during early incubation. Disturbance from observers caused a 10% nest abandonment rate by mallards using artificial nest baskets in an Iowa study. Frequent visits to goose nests by biologists
Table. Human disturbances of waterfowl by source of disturbance, effect, and number of citations in 211 journal articles on the subject.
Subject Number of citations
Sources of Disturbance (in alphabetic order)
Aircraft Airplanes 15 Helicopters 10 General 22
Anglers (see fishing) Baiting/artificial feeding 7 Barges/shipping 9 Boating (boats, canoes, rowing, airboats,
sailing) 66 Cats 2 Development (industrial, pollution,
urban, construction) 24 Dogs 6 Farming 19 Fishing
Commercial 5 Sport (angling) 50
Hazing (scaring) 12 Human activity/disturbance, general 58 Hunting
Sport 71 Subsistence 2
Military 5 Noise 22 Recreation
General 18 Aquatic 27
Research/investigator 55 Roads
General 10 Traffic 11
Trains 1 Trapping
Furbearer 1 Waterfowl 5
Effects (in alphabetical order)
Breeding chronology interrupted 2 Brood breakup 14 Brood rearing disrupted 7 Energetic cost (flight) increased 23 Family breakup 6 Feeding interrupted or decreased 52 Molting birds harrassed 9 Nest/nesting
nest disturbed by researchers 55 nest disturbed by others 27 nesting success reduced 14
Predation on clutches and chicks increased because of research 31
Wariness (alertness, tolerance distance) increased 43
Fish and Wildlife Leaflet 13.2.15. •• 1992 2

caused nest desertion rates as high as 40%. Canada geese nesting in southeastern Missouri were very sensitive to persons fishing in their nesting areas. Establishing areas closed to fishing during the nesting period decreased nest desertions.
Reduced Hatching Success
Human disturbance has three basic effects on nesting success, that is:
1. exposure of eggs to heat or cold by flushing of hens may kill the embryos;
2. predation of eggs may increase when hens are flushed from nests; and
3. predation of eggs and hens may increase at nests when humans create trails or leave markers by which predators find nests.
When nests of cackling Canada geese were checked several times before hatch, twice the number of eggs were lost to predators. Where human activities disturbed Canada geese or common eiders that were nesting among black-backed gulls, herring gulls, or parasitic jaegers on islands or tundra colonies, the gulls and jaegers often quickly located and consumed eggs in waterfowl nests unoccupied because of human disturbance.
Decreased Duckling Survival
Disturbance by humans during the brood rearing season can break up and scatter broods or frighten parents into running ahead of their ducklings or goslings. Young waterfowl briefly separated from their mother are vulnerable to predators and susceptible to death from severe weather or lack of experience in obtaining food. Disturbances drastically increase kills by gulls of common eider ducklings. For example, the number of eider ducklings killed by gulls in Sweden was 200−300 times greater when broods were disturbed by boats. In northern Maine, American black duck and ring-necked duck broods averaged two fewer ducklings because of mortality from disturbance by motorboats. Human disturbance caused a higher than normal mortality rate of trumpeter swan cygnets in a study area in Alaska. Human disturbance can be quite brutal and direct; water skiers and power boaters have run over white-winged scoter hens and broods, and some boaters have used paddles to kill ducklings.
Fish and Wildlife Leaflet 13.2.15. •• 1992
Effects on Nonbreeding Waterfowl
Migratory and wintering waterfowl generally attempt to minimize time spent in flight and maximize time for feeding. Flight requires considerably more energy than any other activity, except egg laying. Human disturbance compels waterfowl to change food habits, feed only at night, lose weight, or desert the feeding area. Waterfowl respond both to loud noises and rapid movements, such as boats powered by outboard motors, and to visible features, such as sailing boats. Large flocks of waterfowl are more susceptible to disturbances than small flocks.
Not all waterfowl species are equally sensitive to disturbance, and some may habituate to certain disturbances. Pink-footed geese were disturbed at a distance of 500 m when more than 20 cars per day used a road in the fall. Traffic of as few as 10 cars per day also had a depressing effect on habitat use by geese. Thus, the surrounding buffer area must exceed 500 m to render habitat acceptable to flocks of pink-footed geese. Some waterfowl, especially diving ducks (notably canvasbacks and lesser scaups) and geese (notably brants and snow geese) are especially vulnerable to disturbance. Density and pattern of disturbance may influence diving ducks more than dabbling ducks in most areas. Repeated disturbances also can deny birds access to preferred feeding habitats. Use by diving ducks of several good feeding areas along the Upper Mississippi River has been limited primarily by boating disturbances that cause 90 percent of the waterfowl to concentrate on 28 percent of the study area during daytime.
Increased Energy Expenditure and Depleted Fat Reserves
In the absence of disturbance, brants in Great Britain spent an average of 1.1% of their time in flight, but disturbance on weekends caused the time spent in flight to increase as much as sevenfold and prevented brants from feeding for up to 11.7% of the time. Detailed studies are few, but observations suggest that the effects of intensive recreation during the fall and winter could be deleterious to migrating and wintering waterfowl.
Researchers who attempted to quantify the harm from disturbances on migrating and wintering waterfowl indicated that frequency of disturbance, number of affected birds, and changes
3

in behavior are greater than most suspected. For example, each duck and American coot on Houghton Lake, Michigan, was disturbed on the average of 1.5 times per weekday and more than 2 times during weekend days. On Navigation Pool 7 of the Upper Mississippi River, an average of 17.2 boats passed through the study area each day and resulted in 5.2 disturbances per day and a minimum of over 4 min of additional flight time per disturbance of waterfowl. Birds may have flown up to an additional hour each day because of human disturbances. Over 2500 tundra swans left their most important feeding area on the Upper Mississippi River in response to two small boats.
Changed Migration Patterns
Prolonged and extensive disturbances may cause large numbers of waterfowl to leave disturbed wetlands and migrate elsewhere. These movements can be local in areas of plentiful habitat or more distant and permanent in areas of sparse habitat, causing shifts in flyway migration patterns. Extensive disturbances on migration and wintering areas may limit the use by waterfowl below the carrying capacity of wetlands. Daily disturbance by boaters may have been responsible for eliminating the brant population that once spent November and December on Humboldt Bay, California.
Management Considerations
Fortunately, numbers of breeding waterfowl usually increase in response to reduction or elimination of human disturbances. For the benefit of waterfowl, the harm from human disturbances must be minimized or eliminated. Management alternatives that reduce human disturbances of waterfowl include:
1. increasing the quantity, quality, and distribution of foods to compensate for energetic costs from disturbances;
2. establishing screened buffer zones around important waterfowl roosting and feeding areas;
3. reducing the number of roads and access points to limit accessibility to habitats;
4. creating inviolate sanctuaries; and 5. reducing the sources of loud noises and rapid
movements of vehicles and machines.
Disturbances occur chiefly during all critical parts of the annual cycle of waterfowl—nesting,
brood rearing, migration, and wintering. Each part of the cycle is crucial to the breeding and survival of waterfowl populations. Common to all parts of the cycle is disturbance while feeding, which may increase flight time and decrease feeding time. Disturbances of nesting birds may cause abandonment of the nest, disruption of the pair bond, reduction in clutch size, increased egg mortality, abandonment of the nesting area, and increased predation of the nest. Disturbances during brood-rearing may cause exhaustion of young and an increase in losses from predation. These disturbances can be lessened or their effects mitigated on refuges or other areas managed for waterfowl. Because disturbances are sometimes caused by professional wildlife managers or researchers and private citizens, creation of sanctuaries is often necessary at critical times and locations. Access to roads and trails can be limited for professionals and for bird-watchers. Activities of other users of wildlife, such as trappers and hunters, may have to be restricted in space and time; boating, angling, camping, and picnicking may be restricted similarly. Human disturbance often is increased by viewing platforms and waterfowl can be viewed at a closer distance if the platform is screened with vegetation and made more like a blind. Proper screens and appropriate control of noise let people really enjoy wildlife close at hand.
Structures such as pumping stations and maintenance buildings on wildlife areas should be screened and placed where necessary human visits cause the least disturbance of waterfowl. Disturbances, particularly at critical times of the year, can be reduced notably by restricting access of pedestrians, autos, and boats; by regulating activities such as farming, grazing, bait collecting, camping, hunting, fishing, and trapping; and by prohibiting the use of nets that can entrap diving ducks. Access by dogs and other pets should not be permitted in critical areas during the nesting and brood-rearing periods. Airboats, aircraft, and all-terrain-vehicles are often useful to managers of waterfowl and wetland, but their use must be carefully planned to minimize harm from sight or sound. Construction of dikes, canals, water control structures, roads, and similar structures and military uses of wetlands or refuge areas should be scheduled for non-critical times in the annual activity cycle of waterfowl.
Disturbance of feeding waterfowl can sometimes be mitigated by acquiring feeding areas
Fish and Wildlife Leaflet 13.2.15. •• 1992 4

on privately owned land to create a sanctuary or by practicing moist soil management and thus increasing the availability of highly nutritious foods in the refuge or wetland areas. With careful planning, deleterious effects of human disturbance on waterfowl can be mitigated or eliminated by creating sanctuaries in time and space (Figs. 1 and 2).
Managers must aggressively protect waterfowl from any human disturbance that reduces productivity and health of populations. To accomplish this goal, managers must resolve conflicting interests between needs of the public and needs of wildlife and researchers must gather more data to provide a greater range of management options.
Suggested Reading Åhlund, M., and F. Götmark. 1989. Gull predation on
eider ducklings Somateria mollissima: effects of human disturbance. Biological Conservation 48:115−127.
Bélanger, L., and J. Bédard. 1989. Responses of staging snow geese to human disturbance. Journal of Wildlife Management 53:713−719.
Bouffard, S. H. 1982. Wildlife values versus human recreation: Ruby Lake National Wildlife Refuge. Transactions of the North American Wildlife and Natural Resources Conference 47:553−558.
Braun, C. E., K. W. Harmon, J. A. Jackson, and C. D. Littlefield. 1978. Management of National Wildlife Refuges in the United States: its impacts on birds. Wilson Bulletin 90:309−321.
Burger, J. 1981. The effect of human activity on birds at a coastal bay. Biological Conservation 21:231−241.
Dahlgren, R. B., and C. E. Korschgen. 1992. Human disturbance to waterfowl: an annotated bibliography. U.S. Fish and Wildlife Service Resource Publication 188. 62 pp.
Edington, J. M., and M. A. Edington. 1986. Ecology, recreation, and tourism. Cambridge University Press, New York. 198 pp.
Korschgen, C. E., L. S. George, and W. L. Green. 1985. Disturbance of diving ducks by boaters on a migrational staging area. Wildlife Society Bulletin 13:290−296.
Liddle, M. J., and H. R. A. Scorgie. 1980. The effects of recreation on freshwater plants and animals: a review. Biological Conservation 17:183−206.
Pomerantz, G. A., D. J. Decker, G. R. Goff, and K. G. Purdy. 1988. Assessing impact of recreation on wildlife: a classification scheme. Wildlife Society Bulletin 16:58−62.
Fish and Wildlife Leaflet 13.2.15. •• 1992 5

Spring and Summer
Ducks nest along dikes and in the uplands, and geese nest in tubs on end of lake. Fewer pairs are nesting each year, and many nests are abandoned or destroyed. Predation rates are high, especially in disturbed areas. Disturbance factors seem to be automobiles on tour routes, anglers on shores and in boats on the lake, hikers on trails, and users of the observation tower.
Females hatch large clutches, but survival of young is lower than expected.
Fall and winter
The lake is an important staging area for several species of diving ducks; large numbers of ducks and geese feed in the uplands on and around the refuge. Waterfowl numbers are decreasing despite favorable habitat. The frequency of human disturbance seems to have increased, especially from hunters, late season anglers and boaters, the auto tour, hikers, and wildlife watchers. It is also apparent that refuge staff are spending a lot of time working on minor projects.
Fig. 1. Example of waterfowl refuge with excessive level of human disturbance of waterfowl.
6 Fish and Wildlife Leaflet 13.2.15. •• 1992

Spring and summer
• Provide educational information so that the public knows the effects of disturbances on the predominant species.
• Seasonally close or restrict use of auto tour. Users of auto tour must stay in vehicles and stop in only designated parking areas.
• Seasonally close or restrict use of hiking and canoe trails.
• Close or restrict the fishing season during peak nesting period.
• Permit camping in only designated areas. • Delay hay cutting until most clutches have hatched. • Prioritize and limit special use permits. • Limit access until most young waterfowl are three
weeks old.
Fall and winter
• Provide educational information so that the public knows the migration and wintering requirements of the predominant species.
• Reroute auto tour to areas of secondary importance to waterfowl.
• Move or screen observation towers. • Close selected areas of the refuge to public access. • Create voluntary avoidance areas on federal and state
waterways. • Modify regulations to restrict disturbances from hunting
and trapping. • Move water pumping stations away from bird
concentration areas. • Raise high quality waterfowl foods on refuge land. • Limit size and horsepower of boats on the lake. • Disallow use of airboats. • Obtain short term leases and prevent trespass on
private lands that contain waste grain. • Limit the time that refuge staff spend in high waterfowl
use areas. • Delay construction until non peak seasons.
Fig. 2. Examples of management practices that have reduced the level of human disturbance of waterfowl at a refuge.
Fish and Wildlife Leaflet 13.2.15. •• 1992 7

Appendix. Common and Scientific Names of Birds Named in Text. Ducks
Northern shoveler . . . . . . . . . . . . . . . . . . . . . . . . . . . . . . . . . . . . . . . Anas clypeata Green-winged teal . . . . . . . . . . . . . . . . . . . . . . . . . . . . . . . . . . . . . . . Anas crecca Mallard . . . . . . . . . . . . . . . . . . . . . . . . . . . . . . . . . . . . . . . . . Anas platyrhynchos American black duck . . . . . . . . . . . . . . . . . . . . . . . . . . . . . . . . . . . . . Anas rubripes Lesser scaup . . . . . . . . . . . . . . . . . . . . . . . . . . . . . . . . . . . . . . . . . . Aythya affinis Ring-necked duck . . . . . . . . . . . . . . . . . . . . . . . . . . . . . . . . . . . . . . . Aythya collaris Common pochard . . . . . . . . . . . . . . . . . . . . . . . . . . . . . . . . . . . . . . . Aythya ferina Tufted duck . . . . . . . . . . . . . . . . . . . . . . . . . . . . . . . . . . . . . . . . . Aythya fuligula Canvasback . . . . . . . . . . . . . . . . . . . . . . . . . . . . . . . . . . . . . . . . Aythya valisineria White-winged scoter . . . . . . . . . . . . . . . . . . . . . . . . . . . . . . . . . . . . Melanitta fusca Common eider . . . . . . . . . . . . . . . . . . . . . . . . . . . . . . . . . . . . . Somateria mollissima
Geese Pink-footed goose . . . . . . . . . . . . . . . . . . . . . . . . . . . . . . . . . . Anser brachyrhynchus Snow goose . . . . . . . . . . . . . . . . . . . . . . . . . . . . . . . . . . . . . . . Anser caerulescens Brant . . . . . . . . . . . . . . . . . . . . . . . . . . . . . . . . . . . . . . . . . . . . Branta bernicla Canada goose . . . . . . . . . . . . . . . . . . . . . . . . . . . . . . . . . . . . . . Branta canadensis Cackling Canada goose . . . . . . . . . . . . . . . . . . . . . . . . . . . . . Branta canadensis minima
Swans Trumpeter swan . . . . . . . . . . . . . . . . . . . . . . . . . . . . . . . . . . . . . Cygnus buccinator Tundra swan . . . . . . . . . . . . . . . . . . . . . . . . . . . . . . . . . . . . . Cygnus columbianus
Other American coot . . . . . . . . . . . . . . . . . . . . . . . . . . . . . . . . . . . . . . . Fulica americana Herring gull . . . . . . . . . . . . . . . . . . . . . . . . . . . . . . . . . . . . . . . . Larus argentatus Great black-backed gull . . . . . . . . . . . . . . . . . . . . . . . . . . . . . . . . . . Larus marinus Parasitic jaeger . . . . . . . . . . . . . . . . . . . . . . . . . . . . . . . . . . Stercorarius parasiticus
Note: Use of trade names does not imply U.S. Government endorsement of commercial products.
UNITED STATES DEPARTMENT OF THE INTERIOR FISH AND WILDLIFE SERVICE
Fish and Wildlife Leaflet 13 Washington, D.C. •• 1992
8

W A T E R F O W L M A N A G E M E N T H A N D B O O K
13.3.1. Invertebrate Response to Wetland Management
Leigh H. Fredrickson and Fredric A. Reed Gaylord Memorial Laboratory School of Forestry, Fisheries and Wildlife University of Missouri−Columbia Puxico, MO 63960
By gaining greater understanding and appreciation of wetland environments, managers have developed creative insights for waterfowl conservation. Among the most exciting new developments in the understanding of functional wetlands has been the recognition of the important roles of invertebrates in aquatic ecosystems. These roles include trophic linkage from primary production to secondary consumers such as waterfowl, packaging of specific nutritional components such as amino acids and micronutrients for vertebrate predators, and detrital processing of wetland organic material. Although specific invertebrate responses to various management techniques are not always predictable and may differ among invertebrate species, patterns related to water regimes, water chemistry, and vegetative structure have emerged. Managers should consider the following invertebrate responses to natural and manipulated wetland complexes when managing for waterfowl.
Importance to Waterbirds
Although wetland systems are some of the most productive ecosystems in the world in terms of vegetation biomass, few duck species acquire substantial energetic or nutritional resources directly from consumption of plant material other than seeds. Much
Fish and Wildlife Leaflet 13.3.1. • 1988
of the energy from plants is initially transferred to the primary consumers which include a diverse group of invertebrate species. A variety of invertebrates are consumed by waterfowl. Ducks rely heavily on invertebrates as a major food source throughout the annual cycle. Dabbling and diving ducks use invertebrates extensively during protein-demanding periods, such as egg laying or molt (Table 1). Duck species are adapted to consumption of invertebrate prey by selection of microhabitats, structure of the bill and lamellae and foraging strategies.
Relation to Water Regimes
Long-term hydrologic cycles have shaped the life history strategies of wetland invertebrates. These organisms have developed many adaptations that include: • egg or pupal stages which can tolerate drought
periods, • initiation of egg development only after specific
water/oxygen levels have been reached, • marked seasonality in life cycle, • rapid development, • large number of offspring (high reproductive
potential) • obligate diapause (period of nondevelopment)
tied to seasonal flooding, and • parthenogenic reproduction (as in cladocera). Invertebrates often move into deeper pools, wetland sediments within the water table, and other nearby wetlands when water levels drop or change within a specific wetland. Many species (e.g.,
1

Table 1. Invertebrates consumed by laying female waterfowl collected from 1967 to 1980 in North Dakota. Data expressed as aggregate percent by volume. Modified from Swanson 1984.
Blue-winged Northern Gadwall Gadwall Northern teal shoveler (saline) (fresh) Mallard pintail
Food item (20) (15) (20) (35) (37) (31)
Snails 38 40 0 4 16 15 Insects 44 5 52 36 27 37 Caddis flies 7 tr 1 8 9 1 Beetles 3 2 16 4 5 3 True flies 32 2 26 18 6 3 Midges 20 1 26 17 4 20 Miscellaneous 2 1 9 6 7 0 Crustaceans 14 54 20 32 13 14 Fairy shrimps 5 6 tr 0 4 14 Clam shrimps tr 7 0 14 6 tr Water fleas 0 33 10 10 3 tr Scuds 8 0 0 7 tr tr Miscellaneous 1 8 10 7 tr tr Annelids 1 0 0 tr 13 11 Miscellaneous 2 0 0 0 3 0
Total 99 99 72 72 72 77
leeches, crayfish) will burrow in sediments to avoid desiccation. Adults of several insect groups may fly to other wetlands if conditions become unsuitable. Flight distances may be less than a few yards to another basin within a wetland complex or more than 50 miles to a distant wetland.
Long-term hydrologic changes shape invertebrate life history strategies. Short-term hydrologic regimes may determine the actual occurrence and abundance of invertebrates. Flooding affects wetland invertebrate occurrence, growth, survival, and reproduction. Entirely different invertebrate communities (Fig. 1) are present in wetland basins with differing hydrological regimes (timing, depth, and duration of flooding). As litter is flooded, nutrients and detrital material (as coarse particulate organic matter) are released for a host of aquatic invertebrates (Fig. 2). As material is broken down into finer particles (fine particulate organic matter), organisms that gather detritus or filter feed will take advantage of the newly available foods. Grazing organisms (Fig. 3) feed on free-floating algae or periphyton, which grows on aquatic plant surfaces. When litter material is consumed, invertebrate populations decrease rapidly. Thus, prolonged flooding (longer than 1 year) of uniform depth leads to reduced wetland invertebrate numbers and diversity. Freezing may also lower spring invertebrate populations in northern locations.
Association with Vegetation Structure
Water regimes not only directly affect invertebrate populations, but indirectly affect other fauna through modification of aquatic plant communities. Hydrological regimes influence germination, seed or tuber production and maturation, and plant structure of aquatic macrophytes. Invertebrate associations are influenced by the leaf shape, structure, and surface area of aquatic vegetation. Macrophytes with highly dissected leaves, such as smartweeds, tend to support greater invertebrate assemblages than do plants with more simple leaf structure, such as American lotus (Fig. 4). The composition of invertebrate populations is associated with plant succession.
Discing and other physical treatments are regularly used to modify less desired plant communities. Initial invertebrate response is great following shallow discing in late summer when the shredded plant material is flooded immediately. The shredding of coarse litter material by discing results in quick decomposition in fall, but invertebrate numbers are reduced the following spring. Cutting robust, emergent vegetation above the ice in winter can also result in a rapid invertebrate response, after spring thaw.
2 Fish and Wildlife Leaflet 13.3.1. • 1988

Figure 1. Occurrence of four common invertebrate genera relative to water regimes of five different seasonally flooded basins. Horizontal lines represent presence of water.
Figure 2. Invertebrate detritivore community. CPOM = Coarse particulate organic matter; FPOM = Fine particulate organic matter.
Fish and Wildlife Leaflet 13.3.1. • 1988 3

Figure 3. Invertebrate grazer community. FPOM = Fine particulate organic matter.
Management Implications
Acquisition of wetlands or protection of previously acquired wetland complexes will continue to be the best means to support diverse invertebrate fauna. The restoration of disturbed wetlands has its greatest potential in areas of marginal agricultural lands. Pesticide use should be eliminated on all refuge areas, regardless of proximity to urban sites where mosquito control is a concern, or the quality of such wildlife areas will be reduced. Inflow waters must be monitored for pollutants and pesticides. The timing of water movements should coincide with the exploitation of leaf litter by invertebrates. Waters should not be drained when nutrient export may be high, such as in early stages of leaf litter decomposition. Present knowledge of water manipulations suggests that management for specific aquatic or semi-aquatic plant communities may be the most practical means of increasing invertebrate production. Managers can enhance the potential for invertebrate consumption by waterfowl if peak periods of waterfowl use of wetlands coincide with reduced water levels. Exploitation of invertebrates by waterbirds can be optimized through shallow water levels, partial drawdowns that concentrate prey, and extended (3−5 week) drawdowns with "feather-edge" flooding to increase the available time and area for foraging.
Fish and Wildlife Leaflet 13.3.1. • 1988
Figure 4. Macroinvertebrates associated with water smartweed and American lotus in seasonally flooded wetlands.
4

Suggested Reading Batema, D.L., G.S. Henderson, and L.H. Fredrickson.
1985. Wetland invertebrate distribution in bottomland hardwoods as influenced by forest type and flooding regime. Pages 196−202 in Proc. Fifth Annu. Hardwood Conf., Univ. Ill., Urbana.
Cummins, K.W. 1973. Trophic relations of aquatic insects. Annu. Rev. Entomol. 18:183−206.
Euliss, N.H. Jr., and G. Grodhaus. 1987. Management of midges and other invertebrates for waterfowl wintering in California. Calif. Fish and Game. 73:242−247.
Murkin, H.R., and J.A. Kadlec. 1986. Responses by benthic macroinvertebrates to prolonged flooding of marsh habitat. Can. J. Zool. 64:65−72.
Murkin H.R., R.M. Kaminski, and R.D. Titman. 1982. Responses by dabbling ducks and aquatic invertebrates to an experimentally manipulated cattail marsh. Can. J. Zool. 60:2324−2332.
Nelson, J.W., and J.A. Kadlec. 1984. A conceptual approach to relating habitat structure and macroinvertebrate production in freshwater wetlands. Trans. N. Am. Wildl. Nat. Resour. Conf. 49:262−270.
Reid, F.A. 1985. Wetland invertebrates in relation to hydrology and water chemistry. Pages 72−79 in M.D. Knighton, ed. Water Impoundments for Wildlife: A Habitat Management Workshop. U.S. Dep. Agric. For. Serv., St. Paul, Minn. 136 pp.
Swanson, G.A. 1984. Invertebrates consumed by dabbling ducks (Anatinae) on the breeding grounds. J. Minn. Acad. Sci. 50:37−40
Swanson, G.A. and M.I. Meyer. 1977. Impact of fluctuating water levels on feeding ecology of breeding blue-winged teal. J. Wildl. Manage. 41:426−433.
Wrubleski, D.A. 1987. Chironomidae (Diptera) of peatlands and marshes in Canada. Mem. Ent. Soc. Can. 140:141−161.
Fish and Wildlife Leaflet 13.3.1. • 1988 5

Appendix. Common and Scientific Names of Plants and Animals Named in Text.
Plants American lotus . . . . . . . . . . . . . . . . . . . . . . . . . . . . . . . . . . . . . Nelumbo lutea Smartweed . . . . . . . . . . . . . . . . . . . . . . . . . . . . . . . . . . . . . . . Polygonum spp. Water smartweed or marsh knotweed . . . . . . . . . . . . . . . . . . . . . Polygonum coccineum
Birds Northern pintail . . . . . . . . . . . . . . . . . . . . . . . . . . . . . . . . . . . . . . Anas acuta Northern shoveler . . . . . . . . . . . . . . . . . . . . . . . . . . . . . . . . . . . . Anas clypeata Blue-winged teal . . . . . . . . . . . . . . . . . . . . . . . . . . . . . . . . . . . . . . Anas discors Mallard . . . . . . . . . . . . . . . . . . . . . . . . . . . . . . . . . . . . . . . Anas platyrhynchos Gadwall . . . . . . . . . . . . . . . . . . . . . . . . . . . . . . . . . . . . . . . . . . Anas strepera
Invertebrates (Families) Crayfish . . . . . . . . . . . . . . . . . . . . . . . . . . . . . . . . . . . . . . . . . . . . Astacidae Giant water bugs . . . . . . . . . . . . . . . . . . . . . . . . . . . . . . . . . . . . Belostomatidae Midges . . . . . . . . . . . . . . . . . . . . . . . . . . . . . . . . . . . . . . . . . . . Chronomidae Water boatmen . . . . . . . . . . . . . . . . . . . . . . . . . . . . . . . . . . . . . . . . Corixidae Mosquitoes . . . . . . . . . . . . . . . . . . . . . . . . . . . . . . . . . . . . . . . . . . Culicidae Predaceous diving beetles . . . . . . . . . . . . . . . . . . . . . . . . . . . . . . . . . . Dytiscidae Water striders . . . . . . . . . . . . . . . . . . . . . . . . . . . . . . . . . . . . . . . . . Gerridae Whirligig beetles . . . . . . . . . . . . . . . . . . . . . . . . . . . . . . . . . . . . . . . Gyrinidae Crawling water beetles . . . . . . . . . . . . . . . . . . . . . . . . . . . . . . . . . . . . Haliplidae Water scavenger beetles . . . . . . . . . . . . . . . . . . . . . . . . . . . . . . . . . Hydrophilidae Pond snails . . . . . . . . . . . . . . . . . . . . . . . . . . . . . . . . . . . . . . . . . Lymnaeidae Water scorpions . . . . . . . . . . . . . . . . . . . . . . . . . . . . . . . . . . . . . . . . . Nepidae Back swimmers . . . . . . . . . . . . . . . . . . . . . . . . . . . . . . . . . . . . . . Notonectidae Orb snails . . . . . . . . . . . . . . . . . . . . . . . . . . . . . . . . . . . . . . . . . . Planorbidae Marsh flies . . . . . . . . . . . . . . . . . . . . . . . . . . . . . . . . . . . . . . . . . Sciomyzidae Soldier flies . . . . . . . . . . . . . . . . . . . . . . . . . . . . . . . . . . . . . . . . Stratiomyidae Horseflies . . . . . . . . . . . . . . . . . . . . . . . . . . . . . . . . . . . . . . . . . . . Tabanidae Crane flies . . . . . . . . . . . . . . . . . . . . . . . . . . . . . . . . . . . . . . . . . . Tipulidae
Invertebrates (Orders) Scuds or sideswimmers . . . . . . . . . . . . . . . . . . . . . . . . . . . . . . . . . . . Amphipoda Leeches . . . . . . . . . . . . . . . . . . . . . . . . . . . . . . . . . . . . . . . . . . . . . Annelida Fairy shrimp . . . . . . . . . . . . . . . . . . . . . . . . . . . . . . . . . . . . . . . . . Anostraca Water fleas . . . . . . . . . . . . . . . . . . . . . . . . . . . . . . . . . . . . . . . . . . Cladocera Beetles . . . . . . . . . . . . . . . . . . . . . . . . . . . . . . . . . . . . . . . . . . . . Coleoptera Clam shrimp . . . . . . . . . . . . . . . . . . . . . . . . . . . . . . . . . . . . . . . Conchostraca True flies . . . . . . . . . . . . . . . . . . . . . . . . . . . . . . . . . . . . . . . . . . . . Diptera Mayflies . . . . . . . . . . . . . . . . . . . . . . . . . . . . . . . . . . . . . . . . . Ephemeroptera Water mites . . . . . . . . . . . . . . . . . . . . . . . . . . . . . . . . . . . . . . . . Hydracarina Isopods . . . . . . . . . . . . . . . . . . . . . . . . . . . . . . . . . . . . . . . . . . . . . Isopoda Damselflies, dragonflies . . . . . . . . . . . . . . . . . . . . . . . . . . . . . . . . . . . . Odonata Caddis flies . . . . . . . . . . . . . . . . . . . . . . . . . . . . . . . . . . . . . . . . . Trichoptera
����������������������������������������
������������������������� ���������������������������� ����������������� •• � ����
6 Fish and Wildlife Leaflet 13.3.1. •• 1988

W A T E R F O W L M A N A G E M E N T H A N D B O O K
13.3.2. Initial Considerations for Sampling Wetland Invertebrates
Leigh H. Fredrickson and Frederic A. Reid Gaylord Memorial Laboratory School of Forestry, Fisheries and Wildlife University of Missouri−Columbia Puxico, MO 63960
As the importance of invertebrates to waterbird nutrition and detrital processing has become increasingly evident, the need for effective and efficient invertebrate sampling has grown. Identification of invertebrate responses to management requires sampling and selection of appropriate sampling equipment. Goals must be established according to qualitative or quantitative needs, organism characteristics, and wetland types. Management objectives often can be met by sampling specific invertebrates to index the effect of management rather than through long-term studies requiring large sample sizes and intensive effort. Certain wetland and invertebrate characteristics that should be considered when initiating invertebrate sampling are described below.
Identification of Goals The initial consideration in any collection of
management data is how these data will facilitate more effective management. In most wetland management situations, the first step toward evaluating invertebrate populations is identification of dominant organisms. This can be accomplished by a qualitative approach using simple techniques and relatively few samples. In contrast, when comparisons of sites, techniques, or seasonal and annual variations are desired, quantitative methods are
Fish and Wildlife Leaflet 13.3.2. •• 1988
necessary and require more time and effort. Invertebrate communities can be measured using organism occurrence (presence or absence), density (number of organisms per area), and biomass (weight per sample or area). Species diversity, which embraces number and relative abundance of the species, is also commonly used for comparative purposes when monitoring different wetland sites.
Before a biologist can successfully assess invertebrate responses to management, the appropriate taxonomic classification for target species must be identified. The effort required to identify aquatic invertebrates to genus or species is often unnecessary for management purposes. However, grouping invertebrates above the family level may be too broad a classification to identify the functional roles of the organisms within the wetland system or their life history strategies. In general, identification to family is usually adequate for management studies, whereas identification to genus may be appropriate for research endeavors.
Organism characteristics should be considered when developing sampling regimes. Life history considerations should include type and timing of various developmental stages. Invertebrate survival generally drops rapidly during early age classes (Fig. 1). Because of this characteristic, managers should not become alarmed when observing temporal declines in total numbers within a species. Likewise, year-to-year comparisons should be conducted at approximately the same period in an annual cycle.
A good sampling design requires recognition of varying physical parameters of the wetland and water regime. Stream and lake systems usually are
1

sampled in different ways. Extremes in water depth during the annual water regime may dictate the type of sampling gear that will be most effective (Table 1). Where benthos are sampled, substrate type influences choice of equipment. Density and structure of vegetation influence water column sampling. For example, sturdy, emergent vegetation may prevent effective sampling with a sweep net, whereas activity traps can be used effectively in these vegetated zones.
Sampling Technique
The effectiveness of common sampling apparatus in different invertebrate habits is outlined in Table 1. Benthos samplers include dredges and core samplers. Core samplers are extremely effective and inexpensive and can be small and light weight. Core samplers may be made from light-weight PVC pipe, and plastic or metal edges can be added to cut roots or crusted soils. Dredges are poor choices in
Table 1. The advantages and disadvantages of sampling apparatus for wetland invertebrates.
Microhabitat Apparatus Advantages Disadvantages
Benthos sediments Ekman dredge, Good for deep water sampling from Ineffective in vegetation zones Ponar dredge boat, where bottom sediments or rocks
are soft Difficult to carry Expensive
Stovepipe sampler Good for deep sediment samples in Heavy, difficult to carry in field moderate water depths Expensive
Core sampler Can be used effectively in diversity Must use with SCUBA in deep of habitats water Volume/depth of sampling easily
modified by design Lightweight, inexpensive
Water column Column sampler Can sample both water column and May require long field time for sediments small sample size
Awkward to carry Expensive
Sweep net Provides area-density estimate Variation between collectors Lightweight, easy to carry in field Difficult to use in dense, robust Inexpensive vegetation
Activity trap Standardized procedure Does not give area-density index Reduced field time Predation in traps by fish and Provides samples free of plant/ invertebrates
detrital material Passive sampler—may underestimate sedentary organisms
Aerial Emergence traps Quantified sample Requires trap construction and Density estimates maintenance
Light traps Time index Not an area-density index Ability to collect large qualitative Mainly nocturnal trap samples
Aerial sweep net Qualitative samples Not an area-density index Inexpensive Biased sampling
Shoreline Core samplers Area-density for semi-aquatic/ terrestrial invertebrates Inexpensive
Activity traps/ Good time index for mobile inverte- Passive trap mesh bags brates Need to continually move trap in
Good in leaf-based detritivore dynamic system systems Expensive
2 Fish and Wildlife Leaflet 13.3.2. •• 1988

Figure 1. Type III survival curve—typical survival for most aquatic invertebrate populations.
vegetated zones because the springs are usually activated before reaching the sediments, or the jaws will not close sufficiently to contain the entire sample. Nevertheless, in some deep-water areas they offer an acceptable approach. Stovepipe samplers have been used effectively for benthos, but they are often cumbersome for field work. Samples from all these apparatus may be washed through standard sieves to eliminate mud and roots.
Water column samplers include tubular column samplers, sweep nets, and activity traps. Column samplers are expensive and do not work well when
submergent vegetation is sampled. Sweep nets are easily manipulated, and field time can be decreased if net inserts are used. Net inserts are constructed of fine netting. These inserts are secured in the larger, coarse net, removed after each sweep, placed in a plastic, zip-lock bag, and transported to the lab. Another insert is used for the next sweep. If more than one technician is available, activity traps may be used for sampling, but those traps are expensive and time-consuming to use. Aerial samples may be collected with quantifiable emergence traps, with qualitative light traps, or with sweep nets. Shoreline samples may be collected with core samples or with replicate mesh traps. Manpower, time investment, and technical expertise must be considered when developing sampling schemes. Diversity among wetlands and their invertebrate communities may require complex sampling methods (Table 2). Field collections for quantitative sampling demand a relatively small amount of time compared to the investment required for sorting, identification, and analysis (Fig. 2).
The techniques listed here provide a framework for sampling. More specific sampling gear can be constructed for the needs of a specific study, but standardization for comparison among other regions is also desirable. Sampling of wetland invertebrates can be conducted for broad qualitative surveys, site or treatment comparisons, or as a long-term index. The needs for long-term sampling should be continually reappraised as long-term management goals are modified.
Table 2. Examples of potential apparatus selection based on wetland type and project goal.
Wetland habitat Project goal Considerations* Potential apparatus
Seasonally flooded, Compare general invertebrate fauna Need index Sweep net/activity annual grasses dominant associated with dominant plant type traps
Seasonally flooded, Document peak hatch of midges/ Need to capture Emergence traps annual grasses dominant mayflies for potential swallow emerging
predation subadults
Semipermanent, cattails Compare general invertebrate fauna Need index Activity traps dominant under varying water regimes Robust vegetation
Seasonally flooded, Compare general invertebrate fauna Twig/leaf material Activity traps/mesh pin oak forest between two greentree reservoirs as substrate bags
Lacustrine beach Sample potential foods of a shorebird Sample location of Core sampler and species feeding birds sticky traps
May include terrestrial environments
Deep, large river Sample clam population in diving duck Deep water, current, Ponar/Ekman feeding area and soft substrate dredge
* Viable replication is a concern in each sample.
Fish and Wildlife Leaflet 13.3.2. •• 1988 3

Figure 2. Chronology of steps in wetland invertebrate sampling.
4 Fish and Wildlife Leaflet 13.3.2. •• 1988

Suggested Reading
Edmondson, W.T. and G.G. Winberg, editors. 1971. A manual on methods for the assessment of secondary productivity in freshwaters. International Biome Program Handbook 17. 358 pp.
Elliott, J.M. 1977. Some methods for the statistical analysis of samples of benthic invertebrates. 2nd Ed. Freshwater Biol. Assoc., Spec. Sci. Publ. 25. 160 pp.
Merritt, R.W. and K.W. Cummins, editors. 1984. An introduction to the aquatic insects of North
America. 2nd Ed. Kendall-Hunt Publishers, Dubuque, Iowa. 722 pp.
Murkin, H.R., P.G. Abbott, and J.A. Kadlec. 1983. A comparison of activity traps and sweep nets for sampling nektonic invertebrates in wetlands. Freshwater Invetebr. Biol. 2:99−106.
Pennak, R.W. 1978. Fresh-water invertebrates of the United States. John Wiley & Sons, NY. 2nd Ed. 803 pp.
Swanson, G.A. 1983. Benthic sampling for waterfowl foods in emergent vegetation. J. Wildl. Manage. 47:821−823.
Usinger, R.L. 1956. Aquatic insects of California. Univ. Calif. Press, Berkeley. 508 pp.
����������������������������������������
������������������������� ���������������������������� ����������������� •• � ����
Fish and Wildlife Leaflet 13.3.2. •• 1988 5

W A T E R F O W L M A N A G E M E N T H A N D B O O K
13.3.3. Aquatic Invertebrates Important for Waterfowl Production
Jan Eldridge Bell Museum of Natural History University of Minnesota Minneapolis, MN 55455
Aquatic invertebrates play a critical role in the diet of female ducks during the breeding season. Most waterfowl hens shift from a winter diet of seeds and plant material to a spring diet of mainly invertebrates. The purpose of this chapter is to give managers a quick reference to the important invertebrate groups that prairie-nesting ducks consume.
Waterfowl species depend differentially on the various groups of invertebrates present in prairie wetlands, but a few generalizations are possible. Snails, crustaceans, and insects are important invertebrate groups for reproducing ducks (Table). Most species of laying hens rely on calcium from snail shells for egg production. The northern shoveler and gadwall are dependent on crustaceans that swim in the water and forage on algae and fine organic matter. The northern shoveler has an enlarged bill and finely developed lamellae for sieving crustacea from the water. Early-nesting species such as northern pintails and mallards consume early-emerging midge larvae in addition to earthworms, which are often the most available food in ephemeral wetlands shortly after the snowmelt. The diving ducks consume free swimming amphipods or larger insects such as caddis fly and dragonfly larvae that tend to occur in deeper water.
The community of invertebrates present in a wetland can indicate the history of water changes in
Fish and Wildlife Leaflet 13.3.3. •• 1990
that wetland. For example, invertebrates such as leeches, earthworms, zooplankton, amphipods, isopods, and gastropods are dependent on passive dispersal (they can’t leave the wetland under their own power). As a result, they have elaborate mechanisms to deal with drought and freezing. A second group that includes some beetles and most midges can withstand drought and freezing but requires water to lay eggs in spring. A third group that includes dragonflies, mosquitoes, and phantom midges lays eggs in the moist mud of drying wetlands during summer. A fourth group that includes most aquatic bugs and some beetles cannot cope with drying and freezing, so,they leave shallow wetlands to overwinter in larger bodies of water. Managers can use the presence of these invertebrates to determine the effectiveness of water management regimes designed for waterfowl production.
The following descriptions of invertebrate natural history are based on Pennak (1978).
Invertebrate Natural History
OLIGOCHAETA (Aquatic and Terrestrial Earthworms) Natural History: Earthworms mix the substrate soils and consume algae and detritus. Their distribution is usually not limited by temperature and many truly aquatic forms survive in low oxygen concentrations. Some earthworms form cysts or cocoons that are transported by birds or the wind.
1

Table. Invertebrate classification. The following is a list of the taxonomy of aquatic organisms that will serve most management purposes.
Phylum Class Order
Annelida Oligochaeta (terrestrial and aquatic earthworms) Hirudinea (leeches)
Arthropoda Crustacea Anostraca (fairy shrimp) Conchostraca (clam shrimp) Cladocera (water fleas) Copepoda(copepods) Ostracoda (seed shrimp) Amphipoda (scuds and side
swimmers) Insecta Ephemeroptera
(mayflies) Odonata (dragonflies) Hemiptera (true bugs) Trichoptera (caddis flies) Coleoptera (beetles) Diptera (flies and midges) Lepidoptera (butterflies and moths)
Mollusca Gastropoda (Snails)
Importance to Waterfowl: Terrestrial earthworms in temporarily flooded, ephemeral ponds early in spring are particularly important to early-nesting mallard and northern pintail hens.
HIRUDINEA (Leeches) Natural History: Some leeches are blood sucking and forage on birds, mammals, fish, snails, insects, and earthworms. Leeches prefer warm water, and are common in protected shallows. They are primarily nocturnal and require a substrate of rocks or vegetation, so they are uncommon in wetlands that have pure mud or clay bottoms. Leeches survive winter and droughts by burrowing into the mud and becoming dormant. Importance to Waterfowl: Leeches are not particularly important to waterfowl as food, although they are eaten by mallards in small amounts.
Crustacea
ANOSTRACA (Fairy Shrimp) General Description: Fairy shrimp generally swim on their backs. They have 2 stalked, compound eyes, 11 pairs of swimming legs that resemble paddles, and no hard external covering. Natural History: Fairy shrimp are common in small ephemeral and temporary
ponds early in spring. They glide upside down, beating their legs in a wave-like pattern from tail to head. Their leg action draws food into the ventral groove toward the mouth. They feed on algae, bacteria, protozoa, and bits of detritus.
Fairy shrimp lay two kinds of eggs: summer eggs that hatch soon after laying, and resting eggs that sink to the bottom, where they withstand drying or freezing and hatch the next spring. Larvae develop through a series of "nauplius" instars and mature rapidly; some become adults in as few as 15 days. Importance to Waterfowl: Because fairy shrimp are among the first invertebrates in spring, they are consumed by early laying northern pintail and mallard hens. They also occur in the diets of northern shoveler and blue-winged teal.
CONCHOSTRACA (Clam Shrimp) General Description: This organism is enclosed in a shell-like outer carapace, and resembles a tiny swimming clam. Clam shrimp have 10−32 pairs of legs and 2 pairs of antennae. Natural History: Clam shrimp seem to
prefer brackish water and swim by moving their large biramous antennae in a rowing motion. Their natural history is similar to that of the fairy shrimp. Importance to Waterfowl: Clam shrimp form an important part of the diet of laying gadwall hens, and also occur in the diet of mallards and northern shovelers.
CLADOCERA (Water Fleas) General Description: Water fleas range in size from 0.2 to 3.0 mm long. Superficially, the body appears bivalve with the abdomen and thoracic regions covered by a carapace. The head is compact with two
large, compound eyes. Water fleas have large antennae with two segmented rami extending from a large base. They have five to six pairs of biramous legs that are hidden in the carapace.
2 Fish and Wildlife Leaflet 13.3.3. •• 1990

Natural History: Water fleas use their antennae to swim and appear to hop uncertainly in the water. Their legs produce a current between the valves of their carapace where food collects in the median groove and streams toward the mouth. Algae, detritus, and protozoans are the major items consumed. Water fleas migrate vertically, moving upward in the evening and downward at dawn. They can exist in a variety of temperature and oxygen concentrations.
Water fleas hatch from resting eggs at first thaw. As the water warms they reproduce rapidly, often reaching a large population of 200−500 fleas per liter of water. The population wanes and by summer, few are present in the ponds. Usually they reproduce parthenogenetically; however, as conditions deteriorate later in the season, they produce eggs. Importance to Waterfowl: Water fleas form a major part of the diet of the laying northern shoveler. Cladocera are also consumed by gadwall and mallard hens.
COPEPODA (Copepods) General Description: Most copepods are less than 2.0 mm long. Usually they are drab in color; however, in spring, some species are bright orange, purple, and red. The head and part of the thorax are fused in a cephalot
horax. The remainder of the thorax and abdomen are segmented. Copepods have large antennae and five thoracic segments that have legs that are used for swimming. They have no abdominal appendages. Natural History: Most copepods forage on algae, plankton, and detritus. Some forage by scraping food from the pond bottom and some by filtering plankton from the water. Many swim in a smooth, slow motion that is produced by the feeding movements of the mouthparts and antennae, punctuated by jerky leg movements. The front antennae are held stiff and act as a parachute to keep the copepod from sinking.
Copepods breed throughout summer, and are tolerant of oxygen depleted water and adverse conditions such as drying and freezing. Some survive winter as resting eggs, some go into diapause on the wetland bottom and others form cysts or cocoons. Development is through a series of stages before maturity. The time to maturity varies, depending on the environment and the species. Importance to Waterfowl: Waterfowl do not depend on this group but copepods account for a small portion of the diet of laying northern shoveler and gadwall hens.
OSTRACODA (Seed Shrimp) General Description: Superficially, ostracods resemble tiny seeds. They are usually less than 1 mm long with an opaque, bivalve shell that varies in color.
Natural History: Seed shrimp tolerate a wide range of environments, temperature, and water chemistry. Most species occur in water less than 1 m deep on varying substrates. Omnivorous scavengers, they forage on bacteria, molds, algae, and fine detritus. Eggs can suspend development in dry and freezing conditions and some live as long as 20 years in the dried condition. Importance to Waterfowl: Seed shrimp, like copepods, do not dominate the diet of laying females; however, they are consumed in small amounts by gadwall, northern shoveler, and blue-winged teal.
AMPHIPODA (Scuds, Side-swimmers, or Freshwater Shrimp) General Description: Most amphipods are 5−20 mm long with segmented thorax and abdomen. Their eyes are usually well developed.
Natural History: Amphipods are primarily nocturnal. They swim rapidly just above the substrate, rolling from side to back. Omnivorous scavengers, they consume various plant and animal material. They often browse on the film covering vegetation that is composed of microscopic plants, animals, and detritus.
Amphipods are restricted to cold, shallow water, and an abundance of oxygen is essential. They are generally found in permanent wetlands where they can become abundant, and are not generally adaptable to withstanding droughts. Importance to Waterfowl: Amphipods are very important to scaup, especially in fall, but they are not particularly important for dabbling ducks. Blue-winged teal, gadwalls, and mallards consume small amounts.
Insecta
EPHEMEROPTERA (Mayflies) General Description: The aquatic juvenile stage of a mayfly, known as a nymph, is characterized by a long body with a large head, large eyes, and long antennae. The tracheal gills on the abdominal segments are the important
Fish and Wildlife Leaflet 13.3.3. •• 1990 3

feature for distinguishing the mayfly nymph from other insects. Natural History: Mayflies occur in fresh water with a high oxygen concentration. Most are herbivores or detritivores, however, some are carnivorous and feed on midge larvae. Mayflies are nymphs most of their lives, which can extend for 1−3 years. Adults live 24 h to a few days, mate, lay eggs, and then die. Importance to Waterfowl: Although mayfly nymphs are not an important item in the diets of waterfowl, they are commonly found in wetlands.
ODONATA (Dragonflies, Damselflies) General Description: Nymph— Dragonfly nymphs according to Pennack are "...grotesque creatures, robust or elongated and gray, greenish or somber-colored." The body may be smooth or rough, bearing small
spines; it is often covered with growths of filamentous algae and debris. The most striking feature of the larva is the modified mouthparts that are large and folded under the head and thorax. Natural History: Many dragonflies and damselflies live for 1 year but the large aeschnids live for about 4 years. Odonate nymphs are carnivorous. Nymphs emerge from the water in the morning. Importance to Waterfowl: Dragonfly nymphs are more important to diving ducks than to dabbling ducks.
HEMIPTERA (True Bugs) General Description: True bugs have mouthparts that form a piercing beak. Their wings are leathery at the base and membranous at the tip. Their size and shape varies. Natural History: Aquatic bugs are predaceous, primarily foraging on
other insects. They grasp their prey with specialized front legs and suck body fluids with their beak. They winter as adults hidden in the mud and vegetation. Importance to Waterfowl: Hemiptera occur in small amounts in the diets of gadwall, blue-winged teal, and northern shoveler hens.
TRICHOPTERA (Caddis Flies)
General Description: Adult—Adults are small and inconspicuous. They resemble moths with folded wings and a dodging flight pattern. Caddis
fly larvae are aquatic and most build portable cases of debris. Natural History: Caddis flies occur in a variety of wetland types that have sufficient oxygen concentrations. They may have one or two generations per year and many larvae
overwinter in the wetland. Most are omnivorous but there are grazers, scrapers, suspension feeders, filter feeders, and carnivores. Importance to Waterfowl: Caddis flies are particularly important to laying canvasbacks and they also occur in the diets of mallard, gadwall, blue-winged teal, and redhead hens.
COLEOPTERA (Beetles) General Description: Beetles are easily distinguished as adults—their forewings are modified into horny shields that cover the abdomen. Larvae are long and thin with six legs— three on a side—characteristic of insects.
Natural History: Most adult aquatic beetles are dependent on air. Adults and larvae occur in shallow water near shore, particularly where there are quantities of debris and aquatic vegetation. Beetles are generally absent from wave-swept shores and deep water. Adults overwinter by burrowing into debris or mud on the bottom of the wetland. The aquatic larvae are highly variable; for example, Dytiscidae (predatory diving beetles) are adapted for a carnivorous life style, whereas Haliplidae (crawling water beetles) larvae are vegetarian, sluggish and sticklike in appearance. Aquatic beetles often have terrestrial pupae. Importance to Waterfowl: Aquatic beetles occur in small amounts in the diets of gadwall, mallard, northern pintail, blue-winged teal, northern shoveler, redhead, and canvasback hens.
DIPTERA (Flies and Midges) General Description: This order ineludes all two-winged flies such as horseflies, mosquitoes, crane flies, midges, houseflies, hover flies, and bot flies. Aquatic diptera larvae are highly variable; most are wormlike and lack eyes or jointed thoracic legs. Their bodies are usually soft and
flexible. Some larvae such as midges (Chironomidae) have short, stumpy forelegs.
Fish and Wildlife Leaflet 13.3.3. •• 1990 4

Natural History: Midges are especially important to waterfowl. They occur throughout aquatic vegetation and on the bottom of all types of wetlands. Many hide in fragile tubes they construct of algae and silt. The most abundant type, known as "bloodworms," are bright red in color. Midge larvae are chiefly herbivorous and feed on algae, higher plants, and detritus. Importance to Waterfowl: Aquatic Diptera are of major importance to blue-winged teal, northern pintail, mallard, gadwall, and redhead hens.
LEPIDOPTERA (Butterflies and Moths) General Description: Only one family of Lepidoptera have larvae that are truly aquatic. These larvae resemble terrestrial caterpillars—adults are small and inconspicuous. Natural History: The aquatic moth larvae are found in ponds that are densely overgrown with aquatic vegetation. Larvae often construct cases with two leaves and crawl around with the case. Species winter as immature larvae. Importance to Waterfowl: Moth larvae are only of minor importance to mallard hens.
GASTROPODA (Snails) General Description: Most snails are readily identified because of their coiled shell. Natural History: Most snails are vegetarian. They consume the film of algae that coats submerged surfaces. Many are hermaphroditic and may be self-fertilized or cross-fertilized. Eggs are often deposited in a gelatinous mass in spring, and early development takes place before hatch. When a snail leaves the egg mass, it has taken on the morphological characteristics of the adult. Most snails live 9 to 15 months. In warmer climates, snails may have two to three generations per year.
They overwinter by burrowing into the mud and hibernating.
Snails are most common in shallow water, less than 3 m deep. Most species occur in greatest abundance in slightly alkaline conditions. They need calcium carbonate for shell production. They also need water that is clean and has high levels of dissolved oxygen. Importance to Waterfowl: Snails are very important as a source of calcium for most laying ducks.
Suggested Reading
Drobney, R. D., and L. H. Fredrickson. 1979. Food selection by ducks in relation to breeding status. J. Wildl. Manage. 43:109−l20.
Merritt, R. W., and K. W. Cummins. 1984. An introduction to the aquatic insects of North America. Kendall- Hunt Publishing Company, Dubuque, Iowa. 722 pp.
Pennak, R. W. 1978. Freshwater invertebrates of the United States. John Wiley & Sons, New York. 803 pp.
Swanson, G. A., G. L. Krapu, and J. R. Serie. 1979. Foods of laying female dabbling ducks on the breeding grounds. Pages 47−57 in T. A. Bookhout, ed. Waterfowl and wetlands—an integrated review. North-central Section, The Wildlife Society, Madison, Wis.
Swanson, G. A., M. I. Meyer, and V. A. Adomaitus. 1985. Foods consumed by breeding mallards on wetlands of south-central North Dakota. J. Wildl. Manage. 49:197−203.
van der Valk, A. 1989. Northern prairie wetlands. Iowa State University Press, Ames. 400 pp.
Weller, M. W. 1987. Freshwater marshes: ecology and wildlife management. Second ed. University of Minnesota Press, Minneapolis. 150 pp.
Wiggins, G. B., R. J. MacKay, and I. M. Smith. 1980. Evolutionary and ecological strategies of animals in annual temporary pools. Arch. Hydrobiol. Suppl. 58:97−206.
Fish and Wildlife Leaflet 13.3.3. •• 1990 5

Dietary preferences by laying females of 7 duck species.
6 Fish and Wildlife Leaflet 13.3.3. •• 1990

Appendix. Common and Scientific Names of Animals Mentioned in the Text.
Northern pintail . . . . . . . . . . . . . . . . . . . . . . . . . . . . . . . . . . . . . . . . . . . . . Anas acuta Northern shoveler . . . . . . . . . . . . . . . . . . . . . . . . . . . . . . . . . . . . . . . . . . Anas clypeata Blue-winged teal . . . . . . . . . . . . . . . . . . . . . . . . . . . . . . . . . . . . . . . . . . . . Anas discors Mallard . . . . . . . . . . . . . . . . . . . . . . . . . . . . . . . . . . . . . . . . . . . . . Anas platyrhynchos Gadwall . . . . . . . . . . . . . . . . . . . . . . . . . . . . . . . . . . . . . . . . . . . . . . . Anas strepera Lesser scaup . . . . . . . . . . . . . . . . . . . . . . . . . . . . . . . . . . . . . . . . . . . . . Aythya affinis Redhead . . . . . . . . . . . . . . . . . . . . . . . . . . . . . . . . . . . . . . . . . . . . . Aythya americana Greater scaup . . . . . . . . . . . . . . . . . . . . . . . . . . . . . . . . . . . . . . . . . . . . Aythya marila Canvasback . . . . . . . . . . . . . . . . . . . . . . . . . . . . . . . . . . . . . . . . . . . Aythya valisineria
UNITED STATES DEPARTMENT OF THE INTERIOR FISH AND WILDLIFE SERVICE
Fish and Wildlife Leaflet 13 Washington, D.C. •• 1990
Fish and Wildlife Leaflet 13.3.3. •• 1990 7

W A T E R F O W L M A N A G E M E N T H A N D B O O K
13.3.5. Ecology of Northern Prairie Wetlands
Jan Eldridge Bell Museum of Natural History University of Minnesota Minneapolis, MN 55455
Glaciated wetlands of the prairie pothole region are among the most productive of ecosystems. In terms of primary productivity (vegetation) they rank with the tropical rain forests (Fig. 1). Wetland productivity is controlled by water levels that fluctuate over time. However, primary productivity is highly variable for a variety of reasons including the variance in annual precipitation, the nature of the glacial till, the salinity of the water, the relation of the basin to the groundwater, and the temperature extremes typical of a continental climate.
My purpose is to review the basic patterns that contribute to the productivity of prairie wetlands
Fig. 1. Net primary productivity (vegetation) of selected ecosystems (from Tiner 1984).
Fish and Wildlife Leaflet 13.3.5. •• 1990
with the goal of duplicating some of the essential ingredients in managed marshes. The most effective strategy for meeting this goal is through community management. This requires a basic understanding of the dynamics of the marsh ecosystem.
Influence of Climate
The first axiom of marsh management could be derived from Weller (1978) when he observed, "Stability seems deadly to a marsh system." This is primarily because the community of plants and animals typical of any marsh has adapted to the highly variable and unpredictable annual precipitation in the prairie pothole region. The variance in precipitation results in dynamic water level changes in individual basins over time and is reflected in the annual pond count conducted by the United States and Canada (Fig. 2). Only ponds that contain water are counted; as a result, there are more ponds in years when precipitation is above average, than in dry years. The key to understanding a prairie wetland lies in its water dynamics.
Influence of Geology and Hydrology
The reason that wetlands reflect variability in precipitation can be found in the nature of wetland basins. As the last glacier receded about 10,000 years ago, it left large chunks of ice in the glacial till. As these ice chunks melted, shallow depressions were formed. These depressions soon became wetlands because the till in this region is composed
1

Fig. 2. Pond survey results conducted annually by the United States and Canada.
primarily of impermeable silt and clay. The last glacier was a fairly recent event in geologic time and since its departure, there has not been sufficient time to erode watersheds connecting many of the basins. As a result, the basins fill in response to precipitation in the area and changes in the ground water flow. They drain slowly, often holding water independent of surrounding wetlands.
There is considerable variation between basins in any given area in terms of water permanence and quality. Some wetlands are ephemeral, holding snowmelt only in the spring before the frost leaves the ground. Temporary and seasonal wetlands usually dry by the end of each season. Semipermanent wetlands retain water for a period of years, and permanent wetlands retain their character for decades except in years of extreme drought. Salinity for wetlands usually increases with water permanence.
In a given area, some wetlands may be dry while others are full. Variation in water retention in neighboring wetlands increases habitat diversity for wildlife. The variation can be explained in part by the relation of the basin to the groundwater system. This relation is usually complex and often determines the salinity and permanence of water in the basin. In general, the water level in the basin reflects the local water table. Glacial till is fairly impermeable and as a result, groundwater flow is slow and often uneven. Several patterns in the configuration of groundwater flow have been observed in the prairie pothole region.
•• Fairly permanent, saline wetlands result when the water table slopes into a wetland on all sides, and water seeps into the basin but not out. The only way for water to leave is through evaporation or transpiration. As a result, minerals accumulate and the wetland can become very saline.
•• When the water table slopes away from the wetland, water leaves the basin and enters the water table, usually in the shallow edges of the basin. This type of wetland contributes to groundwater and is fairly fresh and temporary.
•• When the water table slopes into the basin on one side and away from the basin on the other side, the water is brackish and the wetland is semipermanent.
Although these generalized patterns explain some of the variation in wetlands in a particular area, the complete effect of groundwater on wetlands is very complex involving several layers of groundwater flow systems that can extend 10,000 feet below the ground. Other regional climatic patterns also influence salinity in the prairie pothole region. Because the western portion of the region has a drier climate than the eastern portion, evaporation in western wetland basins is greater and, as a result, they become increasingly more saline.
The overriding result of these relations for most wetlands is dynamic fluctuation in water levels and high variance in wetland types within an area. Because basins respond to groundwater, which varies locally, wetlands cycle from wet to dry periods inde
2 Fish and Wildlife Leaflet 13.3.5. •• 1990

pendently. As a result, a group of wetlands in an area forms a diverse set of habitats known as a wetland complex.
Vegetation Structure
Plant species reflect water fluctuations by forming characteristic associations known as zones. Plants within the zones have similar requirements for germination and persistence, and they have similar tolerances for water level permanence and chemistry. For example, in permanently flooded portions of a wetland, submergents such as the widgeon-grass, pondweed, and muskgrass dominate. In semipermanently flooded portions, emergents that require mudflats to germinate but that tolerate flooding dominate. Species such as bulrush and cattail are common. In seasonally flooded portions, moist-soil plants such as burreed, smartweed, white-top, and spikerush dominate, whereas in ephemeral or temporarily flooded areas, species typical of a wet prairie dominate, such as bluestem and prairie cordgrass.
Several basic patterns in the zones can be observed in prairie wetlands.
•• The number of zones usually increases with the size of the basin and the time it holds water during the season, so that ephemeral and temporary wetlands may only have one or two zones, whereas larger, semipermanent wetlands may have all of the zones.
•• In most wetlands, the height of the emergent vegetation increases in areas where water is more permanent (saline wetlands are an exception).
•• The number of different plant species in the zone decreases in areas where water is more permanent.
The plant zones provide structural diversity within the marsh and several zones are more beneficial to vertebrate wildlife than are homogeneous stands. The edge between zones is particularly important; more edge is better for waterfowl because nesting cover becomes more accessible, vegetation diversity increases, and macroinvertebrate production is greater. Macroinvertebrates are particularly important because they are the dominant food of laying hens and broods in wetlands managed for waterfowl production.
Several basic patterns have been reported in plant and invertebrate associations: (1) Invertebrates are more abundant in vegetated areas than in areas devoid of vegetation; (2) invertebrates increase proportionately with plant material, averag-
Fish and Wildlife Leaflet 13.3.5. •• 1990
ing approximately 1 g animal matter to 100 g of plant material; (3) plant species with extensive invertebrate associations are not always the species that ducks consume. Elodea is an example. This plant ranked very low as a food item for waterfowl but was extremely high as a source of cover and habitat for invertebrates (Krull 1970). The plants with more surface structure seem to be ideal for invertebrates.
Vegetation Dynamics and the Food Web
High primary productivity combined with dynamic water fluctuations and severe climate result in rapid nutrient cycling in prairie wetlands. The emergent vegetation acts as a nutrient pump, drawing nutrients from the soil beneath the wetland floor. Much of the aboveground vegetation dies during the winter, so in spring a flush of nutrients enters the wetland in the form of detritus and soluble water-borne nutrients. In addition to seasonal flushes, annual variation in water permanence in the basins results in multi-year variation in nutrient cycles. As the marsh changes, the composition of plant zones changes as plants die and enter the detrital layer.
It is commonly thought that wetland food chains are detritus-driven. In fact, the detritus may function as a substrate for colonizing microorganisms such as various algal types that obtain necessary nutrients directly from the water. The algae are then consumed by larger invertebrates. These larger aquatic invertebrates are the key to the secondary productivity of the marsh ecosystem.
Invertebrates may be divided into a variety of functional groups depending on how they process litter. Shredders and grazers, such as scuds and snails, break up the larger pieces of plant litter. The fine particles of dead plant material are consumed by filter feeders and collectors. Midge larva (Chironomidae) specialize in both functional groups. Some investigators are convinced that these invertebrates consume the detritus to obtain microorganisms, because detritus that is heavily colonized is more rapidly consumed by larger, foraging invertebrates.
In summary, emergent vegetation is high in nutrients, which enter the water column through leaching from standing vegetation that dies, from gradual breakdown of plant litter by larger foraging invertebrates, and from decomposition by microorganisms. There is a flush of nutrients entering the
3

Fig. 3. The four stages of a marsh during a standard wet and dry cycle. Lines represent vegetation zones that become apparent in the regenerating marsh stage, and black represents open water (adapted from van der Valk 1989).
water in the spring, as well as a multi-year nutrient cycle as the vegetation zones respond to changes in the wet and dry cycle.
The vegetation in a marsh responds to dynamic water fluctuations in characteristic ways. This is particularly true for semipermanent wetlands with a capacity to hold water to a depth of 1 m. Four idealized vegetation stages have been identified that correspond to the way the vegetation responds to a typical wet and dry cycle (Fig. 3). Given the variability inherent in the prairies, a typical cyle may be interrupted at any time, but the following stages can be used as a general guide.
Dry Marsh Stage
In the dry marsh stage, a drought exposes part or all of the marsh bottom and many species of annual and perennial emergent plants germinate on the mudflats. Emergents such as cattail require moist mudflats to germinate. As a result, a dense stand of annuals and perennials forms in the wetland basin during a dry year. During this stage, invertebrate production is minimal or nonexistent and the marsh receives relatively little use by wild
life except as a source of cover or for the browse and seeds produced by the annuals.
Regenerating Marsh Stage
In the regenerating marsh stage, water returns to the basin, drowning the moist-soil annuals, but the perennial emergents continue to spread through vegetative propagation. The typical vegetation zones that are characteristic of wetlands develop during this stage. Litter from the annual plants provides an influx of nutrients to the marsh. Some of the soluble nutrients are leached into the water, while other nutrients are consumed by various plankton and detritivores. The emergent stand does not completely close and shade the marsh bottom, so algae flourish on the litter from the dead annuals. The annual litter on the bottom also provides habitat and food for invertebrates such as midges and as a result, invertebrate populations increase. In fact, the substrate and food source provided by the litter from annuals explain the flush of productivity common to newly flooded basins. The rapidly expanding emergent beds also provide
4 Fish and Wildlife Leaflet 13.3.5. •• 1990

Fig. 4. Seasonal water level changes influence water temperature and create a nutrient-rich current between emergent and submergent vegetation (adapted from Nelson and Kadlec 1984).
food for larger herbivores such as muskrats and as a result, their populations increase.
Degenerative Marsh Stage
After the water has remained in the wetland for several years, the emergents become stressed from water, insects, and senescents. In many areas, muskrats also create openings in the emergent stands. The marsh is in the "hemimarsh" stage when there is a 50:50 ratio of emergent vegetation and open water. At this stage, edge between emergent and submergent vegetation is plentiful, invertebrate populations peak, and waterfowl and other wetland birds respond dramatically. This is the most productive stage of the marsh cycle.
The importance of the edge between emergent and submergent vegetation is particularly relevant for management (often this appears to be the edge between emergent stands of vegetation and open water). Waterfowl prefer the cover provided by a hemimarsh and overwater-nesting birds prefer the isolation provided by the mixture of vegetation; however, they also prefer these marshes because invertebrates are readily available. Invertebrate response is due to the cover provided by the vegetation and to the dynamics of the current at the edge between emergent and submergent vegetation.
Differences in temperature between emergent and submergent vegetation establishe a current between the two areas that is rich in small organic particles from the decomposing vegetation. Many invertebrates forage on algae and fine organic particles and concentrate in edge areas because the current there brings them a rich food supply.
One explanation for this phenomenon is that in spring, when wetlands are flooded, litter accumulates in the emergents and provides structure and substrate for algae and a source of fine organic particles (Fig. 4). As spring progresses, the water recedes and warms. Decomposition accelerates and water quality in the emergent litter deteriorates (reduced oxygen and higher temperature). Invertebrates move to the flooded openings where the growing, submerged vegetation provides substrate and the currents provide a source of organic food particles. As a result, invertebrate populations tend to congregate at the edge between submerged and emergent vegetation. More edge means more invertebrates for waterfowl that rely on invertebrates for food during spring and early summer.
Lake Marsh Stage
As time passes, the wetland lake enters the lake marsh stage where only a ring of emergents remains around the outside of the basin. Floating algae may be the dominating vegetation and midge
Fish and Wildlife Leaflet 13.3.5. •• 1990 5

larvae the dominating macroinvertebrate. The marsh may continue at this stage for many years until a drought, begins the cycle again.
Marsh Management
Managed wetlands with water control can hedge against drainage and drought in surrounding land. In wetlands on floodplains, water control can mitigate against damage caused by flooding and fish invasion. Marsh management in impoundments with water-control capability should duplicate the water dynamics of a natural prairie wetland. The basic goals of wetland management for a semipermanent wetland are as follows:
•• Cycle the wetland through drawdown, dense marsh, and open marsh phases.
•• Fluctuate water levels to maximize the amount of edge between vegetation zones for increased invertebrate productivity. The ratio of interspersion between emergent and submergent vegetation should be about 50:50 for as long as possible (2 to 5 years on the average). Many semipermanent wetlands do not have natural openings in the the emergent of vegetation stands because the basin is too shallow to drown out cattails and because muskrats are not common enough to creat openings. In these impoundments, artificial openings can be created through grazing, burning, or tillage.
•• When conditions in the basin deteriorate, cycle the water back as rapidly as possible, depending on the cycle of other basins in the complex.
This water regime outline is typical for semipermanent wetlands; however, a wetland complex includes a variety of wetland types. Seasonal and temporary wetlands can be created by cycling the water each year and allowing the wetland to slowly dry in summer. Water can be returned to the basin in the fall or the following spring. The plant zones will be simple and the invertebrates that inhabit the basin will differ depending on when the water is returned. These seasonally managed wetlands can be very productive and provide an excellent invertebrate food source for waterfowl.
On refuges, the key to successful water management is to provide a variety of wetland habitats. Water levels in a managed complex should be fluctuated so that basins cycle into the most productive stages asynchronously to provide some optimum habitat each year. The management of a group of wetlands should duplicate the diversity
and variation common to a prairie wetland complex by cycling the drawdowns at different times and with differing durations.
The techniques for using drawdowns vary with the area and the latitude of the basins. For example, in the North, nutrient cycling in wetland basins may take longer and the basins may be more vulnerable to damage from overwinter drawdowns, such as invertebrate die-off. In addition, the soil freezes to the surface layer of ice and, in spring, if water returns to the basin before the thaw, the frozen soil will float with the ice. As the ice melts, the soil settles in an unconsolidated layer to the bottom, where it will cause increased turbidity and loss of vegetative growth.
The following guidelines may serve to improve management results:
•• Increase water levels slowly after germination in late summer or fall. Flooding during the growing phase clouds the water and decreases light penetration. This approach has the added advantage of providing easy access to annual seed production for fall migrating waterfowl.
•• Encourage establishment of the hemimarsh stage by artificially clearing trails in dense stands of emergent growth or by encouraging muskrat populations to increase naturally. If muskrats are present, they will harvest the emergent vegetation for lodges and food.
•• Establish submergents vital to invertebrates by allowing several years of stable water levels of moderate depth.
Effective evaluation is the most important aspect of any marsh management program. Evaluations should include inventories of wildlife response to vegetation and of invertebrate response within each managed basin. Overviews and summaries of wildlife response at a refuge may be helpful; however, a basin-specific evaluation will reveal if a management regime is working. The common denominator of all wetlands is variation, so management in each area must vary as well. If management is not accompanied by evaluation, it will be impossible to know if the management regime is providing the habitat necessary for wildlife.
Suggested Reading Fredrickson, L. H., and F. A. Reid. 1988. Waterfowl use
of wetland complexes. U.S. Fish Wildl. Serv., Fish Wildl. Leafl. 13(2.1). 6 pp.
Krull, J. R. 1970. Aquatic plant-invertebrate associations and waterfowl. J. Wildl. Manage. 34:707-718.
Fish and Wildlife Leaflet 13.3.5. •• 1990 6

Nelson, J. W., and J. A. Kadlec. 1984. A conceptual approach to relating habitat structure and macroinvertebrate production in freshwater wetlands. Trans. N. Am. Wildl. Nat. Resour. Conf. 49: 262-270.
Pennak, R. W. 1978. Freshwater invertebrates of the United States. John Wiley & Sons, New York. 803 pp.
Stewart, R.E. and H.A. Kantrud. 1971. Classification of natural ponds and lakes in the glaciated prairie region. U.S. Fish Wildl. Serv., Resour. Publ. 92. 57 pp.
van der Valk, A. 1989. Northern prairie wetlands. Iowa State University Press, Ames. 400 pp.
Tiner, R.W. 1984. Wetlands of the United States: current status and recent trends. U.S. Fish and Wildlife Service, National Wetlands Inventory. 59 pp.
Weller, M. W. 1978. Management of freshwater marshes for wildlife. Pages 267-284 in R. E. Good, D. F. Whigham, and R. L. Simpson, eds. Freshwater wetlands: ecological processes and management potential. Academic Press, New York.
Weller, M. W. 1987. Freshwater marshes: ecology and wildlife management. University of Minnesota Press, Minneapolis. 2nd ed. 150 pp.
Appendix. Common and Scientific Names of Plants and Animals Named in the Text.
Plants Widgeongrass . . . . . . . . . . . . . . . . . . . . . . . . . . . . . . . . . . . . . . . . Ruppia spp. Pondweed . . . . . . . . . . . . . . . . . . . . . . . . . . . . . . . . . . . . . . . Potamogeton spp. Elodea . . . . . . . . . . . . . . . . . . . . . . . . . . . . . . . . . . . . . . . . . . . . Elodea spp. Muskgrass . . . . . . . . . . . . . . . . . . . . . . . . . . . . . . . . . . . . . . . Chara vulgaris Bullrush . . . . . . . . . . . . . . . . . . . . . . . . . . . . . . . . . . . . . . . . . . . Scirpus spp. Cattail . . . . . . . . . . . . . . . . . . . . . . . . . . . . . . . . . . . . . . . . . . . . Typha spp. Burreed . . . . . . . . . . . . . . . . . . . . . . . . . . . . . . . . . . . . . . . . Sparganium spp. Smartweed . . . . . . . . . . . . . . . . . . . . . . . . . . . . . . . . . . . . . . . Polygonum spp. Whitetop . . . . . . . . . . . . . . . . . . . . . . . . . . . . . . . . . . . . . Scolochloa festucacea Spikerush . . . . . . . . . . . . . . . . . . . . . . . . . . . . . . . . . . . . . . . . . . . Eleocharis Bluestem . . . . . . . . . . . . . . . . . . . . . . . . . . . . . . . . . . . . . . . Andropogon spp. Prairie cordgrass . . . . . . . . . . . . . . . . . . . . . . . . . . . . . . . . . . Spartina pectinata
Invertebrates Scuds or Side-swimmers . . . . . . . . . . . . . . . . . . . . . . . . . . . . . . . . . . Amphipoda Snails . . . . . . . . . . . . . . . . . . . . . . . . . . . . . . . . . . . . . . . . . . . . Gastropoda Midges . . . . . . . . . . . . . . . . . . . . . . . . . . . . . . . . . Insecta, Diptera, Chironomidae
Vertebrates Muskrats . . . . . . . . . . . . . . . . . . . . . . . . . . . . . . . . . . . . . . Ondatra zibethicus
����������������������������������������
������������������������� ���������������������������� ����������������� •• � ����
Fish and Wildlife Leaflet 13.3.5. •• 1990 7

W A T E R F O W L M A N A G E M E N T H A N D B O O K
13.3.6. Ecology of Montane Wetlands
James K. Ringelman Colorado Division of Wildlife 317 West Prospect Road Fort Collins, CO 80526
Most waterfowl managers envision typical waterfowl habitat as the undulating or flat terrain characteristic of the prairie pothole region of the north-central United States or the aspen parklands of Canada. However, several other habitats in North America provide valuable resources for breeding and migrating waterfowl. Among these is the Rocky Mountain region of the western United States, which stretches in a band 100−500 miles (160−800 km) wide and 1,240 miles (1,984 km) long from south-central New Mexico to northern Montana (Figure).
Some Rocky Mountain wetland complexes contain waterfowl breeding densities that equal or exceed those of prairie breeding habitat, and also serve as important staging, migratory, and wintering areas. To aid waterfowl management endeavors in this region, this leaflet summarizes aspects of wetland ecology and waterfowl biology in montane habitats. Although emphasis is placed on the Rocky Mountain region, many of the wetland characteristics and waterfowl relationships in this area are similar or identical to those found in other montane regions of the United States.
Comparisons with Prairie Wetlands
As in other regions, waterfowl that breed in montane habitats require suitable upland nesting areas coupled with a diverse wetland community, from which they obtain aquatic invertebrates, plant foods, and isolation from territorial birds of the same species. These wetland complexes also attract spring and fall migrants and, in some instances, wintering waterfowl.
Montane waterfowl habitats have several attributes that set them apart from their grassland counterparts. First, montane wetland communities are relatively intact compared with the widespread wetland degradation typical of the northern Great Plains. This more nearly pristine condition reflects the rugged topography and generally poor soils of the region, which favor ranching, timber harvest, and mining rather than farming. Additionally, some areas are afforded legal protection as wilderness areas or research natural areas. Second, except where locally affected by mining operations and ski areas, for example, upland plant communities are still dominated by native plant species despite some grazing and timber harvest. Third, although the magnitude of the snowpack and rainfall varies annually, precipitation is almost always sufficient to provide adequate spring water for ducks and geese. Thus, montane wetlands are relatively stable compared with those in the prairie states.
Fish and Wildlife Leaflet 13.3.6. •• 1992 1

Figure. Distribution of montane wetlands (shading) in the Rocky Mountain region of western United States.
The geology and topography of montane regions create a greater diversity of wetland types than may be found in the prairies. Rocks weather slowly, and annual primary production decreases with elevation, so wetland succession proceeds much more slowly in montane wetlands than in low-elevation ponds. Elevational gradients interacting with precipitation patterns and growing season affect soil type, nutrient cycling, water chemistry, and associated plant and animal communities. Most high-elevation wetlands are slightly acidic to circumneutral and contain relatively small amounts of dissolved nutrients compared with typical prairie wetlands. Accordingly, only some types of montane wetlands are frequented by waterfowl, unlike their wide use of most prairie ponds. Recognition of the wetland types inhabited by waterfowl and an understanding of basic wetland function is therefore important to the success of any waterfowl management initiative in montane habitats.
Montane Wetlands Important to Waterfowl
Intermountain Basin Wetlands
The intermountain basins or "parks" of the western United States contain the most important habitats for montane waterfowl. The flat or rolling topography typical of mountain parks, which originated from tectonic and volcanic events during the formation of mountain ranges, is underlain by deep layers of alluvial material eroded from the surrounding mountains and transported to nearby basins by wind and water. Although relatively few in number—33 parks have been identified in the Rocky Mountain region—intermountain basins are often several hundred square miles in area. Many parks are considered cool deserts because of the low precipitation created by the rain shadow from surrounding mountains. The average frost-free period may be less than 2 months. Despite low seasonal temperatures, ratios of precipitation to evaporation are usually less than 1, causing the development of pedocal soils. Where alkali deposits occur in poorly drained areas, salt-tolerant plants such as black greasewood and saltgrasses are common. Less saline areas typically contain wheatgrasses, bluegrasses, sedges and rushes, or shrubs such as sagebrush and rabbitbrush. Ranching and hay cultivation are the most common land uses, but some grain crops and cold-weather vegetables are grown in more temperate parks.
Many intermountain basins contain few wetlands; some, such as the 5,000-square-mile (12,950-km2) San Luis Valley in south-central Colorado, possess abundant wetlands. Wetlands are formed by spring runoff, which creates sheet water and recharges the persistently high water tables, and by artesian flows and impoundments. Lakes and reservoirs provide important migratory staging and molting habitats, and lake margins attract breeding waterfowl. Rivers and old oxbows are also frequented by waterfowl. Dissolved nutrients and high amounts of organic matter create some wetlands that rival prairie potholes in their fertility. High densities of aquatic invertebrates such as freshwater shrimp and the larvae of dragonflies, midges, flies, and mosquitos are common in intermountain basin wetlands.
Fish and Wildlife Leaflet 13.3.6. •• 1992 2

Beaver Ponds
Beaver ponds most commonly occur in mid-elevation, montane valleys where slope is less than 15%. Because beaver ponds are often clustered in flowages along suitable lengths of streams and rivers, they provide a valuable wetland community well suited to the needs of breeding waterfowl. Densities of 3 to 6 ponds per mile (5−10 ponds per kilometer) of stream are common, increasing to as many as 26 ponds per mile (42 ponds per kilometer) in excellent habitat with high beaver populations. Wetlands created by beaver possess relatively stable water levels maintained by precipitation and runoff. However, beaver flowages themselves may be somewhat ephemeral in nature, and usually are abandoned within 10−30 years, after beaver deplete their food resources. Floods sometimes destroy beaver dams that are constructed in narrow valleys or on major streams or rivers.
Beaver ponds act as nutrient sinks by trapping sediments and organic matter that otherwise would be carried downstream. This function enhances wetland fertility and the plant and aquatic invertebrate communities exploited by waterfowl. Invertebrates typical of running water systems are replaced by pond organisms such as snails, freshwater shrimp, and the larvae and immature stages of caddisflies, dragonflies, flies, and mosquitos. Structural cover provided by flooded willows, alders, sedges, burreeds, and other emergents affords ideal habitat for waterfowl breeding pairs and broods.
Glacial Ponds
Glacial ponds include (1) small wetlands formed behind lateral and terminal moraines, and (2) kettle ponds created by the same glacial process that found the prairie potholes—large chunks of ice embedded in glacial outwash melt after a glacier retreats, forming depressions that later fill with water. Glacial wetlands most commonly occur in mountainous terrain. Often, these ponds are dependent solely on spring runoff and summer precipitation for water. Therefore, water levels recede during summer, while density and abundance of herbaceous, emergent vegetation increases. Despite dynamic water level fluctuation, natural succession is slow; peat accumulations indicate that some glacial ponds have persisted as wetlands for more than 7,000 years.
Fish and Wildlife Leaflet 13.3.6. •• 1992
Northern mannagrass, sedges, and reedgrasses are common emergent plants in glacial ponds, as are submersed species such as pondweeds, watermilfoils, and cowlilies. Glacial ponds are often surrounded by forested uplands and rocky moraines. These physical features and the relatively small size of glacial ponds may restrict the types of waterfowl using them to dabbling duck species that can take off in confined areas. The shallow water depths typical of kettle ponds often are unsuitable for sustaining fish populations, which might otherwise compete with waterfowl for aquatic invertebrate foods. The absence of fish and the abundant underwater substrate provided by herbaceous vegetation promote a rich invertebrate fauna dominated by larvae or immature stages of caddisflies, dragonflies, beetles, and mosquitos.
Ecological Relations
Elevational changes result in ecosystem regions or life zones characterized by differences in precipitation, humidity, temperature, growing season, wind, exposure, and soil conditions. The four life zones recognized in the Rocky Mountain region—Lower Montane, Upper Montane, Subalpine, and Alpine—possess unique flora and fauna. Only the wetlands found in the first three zones are used extensively by waterfowl. Alpine wetlands receive occasional use by migrating and postbreeding waterfowl, but the duration of the ice-free period and growing season is too brief to enable waterfowl to breed.
Montane habitats separated by relatively small distances often vary markedly in annual precipitation. Much of this variation is attributable to altitude and slope. Western slopes usually receive more snowfall than eastern slopes or areas in the rain shadow of surrounding mountains. For example, portions of the San Luis Valley in south-central Colorado (8,200 feet or 2,500 m elevation) receive less than 7 inches (18 cm) of moisture per year, whereas the nearby western slopes of the San Juan Mountains at the same elevation receive over 40 inches (102 cm) per year. Accordingly, west- and north-facing slopes usually support different plant communities than southern and eastern slopes.
Snowmelt begins in late April and May in Lower and Upper Montane zones but occurs 3 to 4 weeks later in Subalpine areas. The shade provided by a forest canopy further delays snowmelt, thus providing wetlands in forested
3

areas a more constant supply of water. However, the flora and fauna in such wetlands may develop more slowly than in ponds in open terrain. This delayed development is a result of the constant supply of cold snowmelt water, as well as shading from the forest canopy, which reduces sunlight penetration.
The effects of precipitation patterns and snowmelt on floristic and faunal development have important implications for breeding waterfowl. In prairie habitats, breeding waterfowl often use wetlands of different water permanencies to optimize their exploitation of aquatic invertebrates. Temporary prairie wetlands are heavily used in early spring because their invertebrate faunas develop quickly in the warm, shallow water. More permanent wetlands, in which development of invertebrates is delayed, receive increasing use in the spring and summer. In montane habitats, however, this temporal pattern of use in relation to water permanency is superimposed on a spatial component that includes exposure and time of runoff. Small, shallow snowmelt ponds, which are the counterparts of temporary ponds in the prairies, usually lack invertebrate faunas of value to waterfowl. Instead, the shallow margins of permanent wetlands are the areas in which the invertebrate fauna is richest in early spring.
The timing of snowmelt runoff is also critical to understanding waterfowl exploitation of montane habitats. Many species (e.g., mallards and green-winged teal) begin nesting long before runoff begins to fill wetlands in most intermountain basins. The early application of water in such areas by pumping or by releasing water from reservoirs is vital in providing habitat to attract and hold breeding pairs and for promoting development of aquatic invertebrates needed by prelaying female ducks. At higher elevations, where natural kettle ponds, lakes, and beaver flowages have retained water through winter into early spring, runoff often increases water levels through late spring and into early summer, increasing the amount of wetland habitat through the middle of the nesting period.
Nutrient availability is important in regulating wetland primary productivity, which in turn affects periphyton, invertebrate, and waterfowl abundance. Surface runoff is far more important than groundwater flow or direct precipitation in determining water level dynamics and nutrient input to montane wetlands. Thin, coarse soils on granite bedrock tend to be acidic and low in
nutrients, whereas soils near limestone and shale outcroppings are more finely textured, higher in nutrients, and buffered by calcium carbonate. Wetlands fed by runoff from the latter soils tend to receive higher nutrient loads from runoff, and therefore have higher productivity than wetlands associated with granitic soils. Some common wetland plants such as alders and rushes host nitrogen-fixing bacteria that incorporate atmospheric nitrogen into wetlands, providing a supplemental source of nutrients. Waterfowl and beaver are the primary animal groups to import nutrients to montane wetlands, although defecation by large herbivores such as moose, elk, mule deer, bighorn sheep, cattle, and domestic sheep may also be important.
Waterfowl Resources
Waterfowl populations in montane habitats have not been well studied. Most research has been conducted at mid-latitude habitats between 7,000 and 10,000 feet (2,100−3,000 m) elevation. Despite the relatively harsh climate and infertility of montane wetlands, waterfowl are surprisingly abundant in these areas. Generally, peak waterfowl populations occur during spring and fall migration periods, particularly in intermountain basins. As prairie-nesting species migrate northward in spring, resident birds establish territories in preparation for breeding. In beaver pond and glacial wetland habitats, numbers of waterfowl decline as females proceed with incubation and males seek larger wetlands during the time of molting. Often, a molt migration occurs from higher elevation forested habitats to large lakes and reservoirs in intermountain basins. During fall, postfledging young birds also move toward lower-elevation staging areas in mountain parks. Most mid-latitude montane wetlands freeze during October, greatly reducing the amount of available wetland habitat. Some wetland areas, however, such as the San Luis Valley of south-central Colorado, retain open water reaches as a result of warmer flows from springs and artesian wells. Major river systems also afford winter habitat, particularly if cereal grain crops or other foods are located nearby.
Species composition of the waterfowl community varies seasonally and in relation to habitat type (Table 1). Mallards and green-winged teal are usually the most common nesting species in both intermountain parks and higher-elevation
Fish and Wildlife Leaflet 13.3.6. •• 1992 4

Table 1. Relative species abundance in different montane wetlands during spring and fall migration (M or m), breeding (B or b), and wintering (W or w) periods. Uppercase letters denote greater relative abundance than lowercase letters.
Montane wetland type Species Intermountain basin Beaver pond Glacial wetland
American wigeon M,B b b Barrow’s goldeneye m m,b m,b Blue-winged teal m,b — — Bufflehead m,b m,b m,b Canada goose M,B,w b — Cinnamon teal m,B — — Common merganser m m,b m,b Gadwall M,B b b Green-winged teal M,B,w m,B m,b Lesser scaup M,B — — Mallard M,B,w m,B m,B Northern pintail M,B,w — — Northern shoveler M,B — — Redhead M,B — — Ring-necked duck m,b M,B M,B Ruddy duck m,b — — Trumpeter swan ba — — aPrimarily riverine habitats.
Montane and Subalpine zones. Gadwalls, northern pintails, American wigeon, cinnamon teal, northern shovelers, redheads, lesser scaup, and Canada geese are other common breeders in intermountain basins. Trumpeter swans are important year-round residents in the northern Rockies. In beaver and glacial ponds of the Upper Montane and Subalpine zones, ring-necked ducks, Barrow’s goldeneyes, buffleheads, and gadwalls are common. The peak of nest initiation for early-nesting ducks (mallards and green-winged teal) varies from early May to early June, depending on snow conditions and wetland availability. Late-nesting species such as ring-necked ducks begin nesting nearly a month later than early-nesting species.
Breeding densities vary greatly among montane habitats (Table 2), largely as a function of wetland density and availability of open water to attract and hold spring migrants. Wetlands larger than 1 acre (0.405 ha) receive most of the use by breeding ducks, although much smaller wetlands are also frequented. Considerably larger wetlands are needed to attract molting birds and fall migrants. Some intensively managed habitats achieve remarkably high breeding densities. For example, the 22-square-mile (57-km2) Monte Vista National Wildlife Refuge in the San Luis Valley of Colorado averaged 277 duck nests per square mile (107 duck nests per square kilometer) during a 27-year period, and some individual wetland units exceeded 3,000 nests per square mile (1,158 nests
Table 2. Waterfowl breeding pair densities in montane habitats. Habitat type denotes either forested montane (FM) or intermountain basin (IB) study sites.
Density Area sampled Elevation pairs/mi2 pairs/km2 mi2 km2 feet m Location (habitat type)
1.6 0.62 36 93.2 7,500− 10,000 2,285− 3,047 Uinta Mountains, Utah (FM) 1.6 0.62 18 46.6 9,000− 10,000 2,742− 3,047 White River Plateau, Colo. (FM) 4.1 1.58 685 1,774.0 8,000− 10,000 2,437− 3,047 San Juan Mountains, Colo. (FM) 21.8 8.42 7 18.1 8,500− 9,500 2,590− 2,894 Park Range, Colo. (FM) 0.5 0.19 900 2,331.0 8,400− 9,900 2,559− 3,016 South Park, Colo. (IB) 5.2 2.01 5,000 12,950.0 7,400− 8,000 2,255− 2,437 San Luis Valley, Colo. (IB) 27.2 10.50 598 1,549.0 8,000− 9,000 2,437− 3,047 North Park, Colo. (IB)
Fish and Wildlife Leaflet 13.3.6. •• 1992 5

per square kilometer) in some years. This compares favorably to nesting densities in the best prairie habitat, where, except in island nesting situations, 400−700 duck nests per square mile (150−270 duck nests per square kilometer) are typical. Moreover, nest success averaged 50%, a rate about four times as high as that in much of the northern Great Plains. The unfragmented habitat and balanced predator communities typical of many montane areas undoubtedly contribute to these high nest success rates. The combination of high nest success and potentially high breeding densities underscores the pronounced management potential of some montane habitats.
Waterfowl Habitat Management
Most waterfowl habitat management is directed at correcting problems caused by humans. Montane wetlands management is no exception, although the causes of habitat deficiencies are often different than those found in prairie habitats. In Upper Montane and Subalpine zones, logging activities may cause disturbance, reduce the amount of available nesting cover surrounding wetlands, and cause erosion and sediment deposition in ponds. Reseeding and stabilizing uplands may be necessary to promote the timely regrowth of grasses and forbs. Disturbance from recreationists can also become a problem in popular areas, and seasonal restrictions on activities in buffer zones surrounding wetlands may be necessary. Grazing by domestic livestock and native ungulates can have locally severe effects on riparian vegetation and surrounding uplands. Eliminating grazing, reducing stocking rates, and fencing portions of wetlands can reverse the habitat degradation. Mining activities often physically alter or destroy wetlands, and can create acid runoff that drastically alters water chemistry and devastates invertebrate communities. Reclamation of wetlands despoiled by mining activities, although technically possible, is often difficult and costly. Beaver, which create beneficial wetland habitat, can also become a nuisance if populations grow beyond carrying capacity and begin to degrade streamside vegetation. Control by trapping or transplanting may be warranted in
such instances. Agricultural practices have affected plant communities and wetland abundance in several intermountain basins, as they have in the prairie states. In these instances, the conventional waterfowl management practices developed in the prairies can be successfully employed to improve waterfowl habitat.
Some human activities have caused irreversible damage to waterfowl habitat. Among these are residential developments along riparian corridors, and dams and water diversions that have either flooded former shallow wetland habitat or dewatered once productive wetlands. Fortunately, however, many montane habitats, particularly those in the Upper Montane and Subalpine zones, have been insulated sufficiently from human activities that no management activities are warranted. In these pristine habitats, actions are best directed toward habitat preservation rather than improvement. By conducting a biological reconnaissance of waterfowl populations and identifying limiting factors before initiating management actions, managers can avoid trying to fix something that isn’t broken.
Selected Reading
Frary, L. G. 1954. Waterfowl production on the White River Plateau, Colorado. M.S. thesis, Colorado State University, Fort Collins. 93 pp.
Hopper, R. M. 1968. Wetlands of Colorado. Colorado Department of Game, Fish and Parks Technical Publication 22. 88 pp.
Peterson, S. R., and J. B. Low. 1977. Waterfowl use of Uinta Mountain wetlands in Utah. Journal of Wildlife Management 41:112−117.
Rutherford, W. H., and C. R. Hayes. 1976. Stratification as a means for improving waterfowl surveys. Wildlife Society Bulletin 4:74−78.
Szymczak, M. R. 1986. Characteristics of duck populations in the intermountain parks of Colorado. Colorado Division of Wildlife Technical Publication 35. 88 pp.
Windell, J. T., B. E. Willard, D. J. Cooper, S. Q. Foster, C. F. Knud-Hansen, L. P. Rink, and G. N. Kiladis. 1986. An ecological characterization of Rocky Mountain montane and subalpine wetlands. U.S. Fish and Wildlife Service Biological Report 86(11). 298 pp.
6 Fish and Wildlife Leaflet 13.3.6. •• 1992
Appendix. Common and Scientific Names of Plants and Animals Named in Text.
Birds Northern pintail . . . . . . . . . . . . . . . . . . . . . . . . . . . . . . . . . . . . . . . . . . . Anas acuta American wigeon . . . . . . . . . . . . . . . . . . . . . . . . . . . . . . . . . . . . . . . Anas americana Northern shoveler . . . . . . . . . . . . . . . . . . . . . . . . . . . . . . . . . . . . . . . . . Anas clypeata Green-winged teal . . . . . . . . . . . . . . . . . . . . . . . . . . . . . . . . . . . . . . . . . . Anas crecca Cinnamon teal . . . . . . . . . . . . . . . . . . . . . . . . . . . . . . . . . . . . . . . . . Anas cyanoptera Blue-winged teal . . . . . . . . . . . . . . . . . . . . . . . . . . . . . . . . . . . . . . . . . Anas discors Mallard . . . . . . . . . . . . . . . . . . . . . . . . . . . . . . . . . . . . . . . . . . Anas platyrhynchos Gadwall . . . . . . . . . . . . . . . . . . . . . . . . . . . . . . . . . . . . . . . . . . . . . . Anas strepera Lesser scaup . . . . . . . . . . . . . . . . . . . . . . . . . . . . . . . . . . . . . . . . . . . . Aythya affinis Redhead . . . . . . . . . . . . . . . . . . . . . . . . . . . . . . . . . . . . . . . . . . . Aythya americana Ring-necked duck . . . . . . . . . . . . . . . . . . . . . . . . . . . . . . . . . . . . . . . . Aythya collaris Canada goose . . . . . . . . . . . . . . . . . . . . . . . . . . . . . . . . . . . . . . . . Branta canadensis Bufflehead . . . . . . . . . . . . . . . . . . . . . . . . . . . . . . . . . . . . . . . . . . Bucephala albeola Barrow’s goldeneye . . . . . . . . . . . . . . . . . . . . . . . . . . . . . . . . . . . . Bucephala islandica Trumpeter swan . . . . . . . . . . . . . . . . . . . . . . . . . . . . . . . . . . . . . . . Cygnus buccinator Ruddy duck . . . . . . . . . . . . . . . . . . . . . . . . . . . . . . . . . . . . . . . . Oxyura jamaicensis
Mammals Moose . . . . . . . . . . . . . . . . . . . . . . . . . . . . . . . . . . . . . . . . . . . . . . . . Alces alces Beaver . . . . . . . . . . . . . . . . . . . . . . . . . . . . . . . . . . . . . . . . . . . . Castor canadensis Elk . . . . . . . . . . . . . . . . . . . . . . . . . . . . . . . . . . . . . . . . . . . . . . . . Cervus elaphus Mule deer . . . . . . . . . . . . . . . . . . . . . . . . . . . . . . . . . . . . . . . . . Odocoileus hemionus Bighorn sheep . . . . . . . . . . . . . . . . . . . . . . . . . . . . . . . . . . . . . . . . . Ovis canadensis
Invertebrates (orders) Freshwater shrimp . . . . . . . . . . . . . . . . . . . . . . . . . . . . . . . . . . . . . . . . . . Decapoda Beetles . . . . . . . . . . . . . . . . . . . . . . . . . . . . . . . . . . . . . . . . . . . . . . . . Coleoptera Flies . . . . . . . . . . . . . . . . . . . . . . . . . . . . . . . . . . . . . . . . . . . . . . . . . . . Diptera Midges . . . . . . . . . . . . . . . . . . . . . . . . . . . . . . . . . . . . . . . . . . . . . . . . . . Diptera Mosquitos . . . . . . . . . . . . . . . . . . . . . . . . . . . . . . . . . . . . . . . . . . . . . . . . Diptera Dragonflies . . . . . . . . . . . . . . . . . . . . . . . . . . . . . . . . . . . . . . . . . . . . . . Odonata Caddisflies . . . . . . . . . . . . . . . . . . . . . . . . . . . . . . . . . . . . . . . . . . . . . . Trichoptera
Plants Wheatgrass . . . . . . . . . . . . . . . . . . . . . . . . . . . . . . . . . . . . . . . . . . . Agropyron spp. Alder . . . . . . . . . . . . . . . . . . . . . . . . . . . . . . . . . . . . . . . . . . . . . . . . . Alnus spp. Sagebrush . . . . . . . . . . . . . . . . . . . . . . . . . . . . . . . . . . . . . . . . . . . . Artemisia spp. Sedge . . . . . . . . . . . . . . . . . . . . . . . . . . . . . . . . . . . . . . . . . . . . . . . . Carex spp. Rabbitbrush . . . . . . . . . . . . . . . . . . . . . . . . . . . . . . . . . . . . . . . . Chrysothamnus spp. Saltgrass . . . . . . . . . . . . . . . . . . . . . . . . . . . . . . . . . . . . . . . . . . . . . Distichlis spp. Northern mannagrass . . . . . . . . . . . . . . . . . . . . . . . . . . . . . . . . . . . . Glyceria borealis Rush . . . . . . . . . . . . . . . . . . . . . . . . . . . . . . . . . . . . . . . . . . . . . . . . Juncus spp. Watermilfoil . . . . . . . . . . . . . . . . . . . . . . . . . . . . . . . . . . . . . . . . Myriophyllum spp. Cowlily . . . . . . . . . . . . . . . . . . . . . . . . . . . . . . . . . . . . . . . . . . . . . . . Nuphar spp. Pondweed . . . . . . . . . . . . . . . . . . . . . . . . . . . . . . . . . . . . . . . . . . Potamogeton spp. Bluegrass . . . . . . . . . . . . . . . . . . . . . . . . . . . . . . . . . . . . . . . . . . . . . . . Poa spp. Willow . . . . . . . . . . . . . . . . . . . . . . . . . . . . . . . . . . . . . . . . . . . . . . . . Salix spp. Greasewood . . . . . . . . . . . . . . . . . . . . . . . . . . . . . . . . . . . . . . Sarcobatus vermiculatus Burreed . . . . . . . . . . . . . . . . . . . . . . . . . . . . . . . . . . . . . . . . . . . Sparganium spp.
Fish and Wildlife Leaflet 13.3.6. •• 1992 7

Note: Use of trade names does not imply U.S. Government endorsement of commercial products.
UNITED STATES DEPARTMENT OF THE INTERIOR FISH AND WILDLIFE SERVICE
Fish and Wildlife Leaflet 13 Washington, D.C. •• 1992
8

W A T E R F O W L M A N A G E M E N T H A N D B O O K
13.3.7. Ecology of Playa Lakes
David A. Haukos1
U.S. Fish and Wildlife Service Buffalo Lake National Wildlife Refuge P.O. Box 179 Umbarger, Texas 79091
and
Loren M. Smith Department of Range and Wildlife Management Texas Tech University Lubbock, Texas 79409
Between 25,000 and 30,000 playa lakes are in the playa lakes region of the southern high plains (Fig. 1). Most playas are in west Texas (about 20,000), and fewer, in New Mexico, Oklahoma, Kansas, and Colorado. The playa lakes region is one of the most intensively cultivated areas of North America. Dominant crops range from cotton in southern areas to cereal grains in the north. Therefore, most of the native short-grass prairie is gone, replaced by crops and, recently, grasses of the Conservation Reserve Program. Playas are the predominant wetlands and major wildlife habitat of the region.
More than 115 bird species, including 20 species of waterfowl, and 10 mammal species have
1 Present address: Department of Range and Wildlife Management, Texas Tech University, Lubbock, Texas 79409.
Fish and Wildlife Leaflet 13.3.7. •• 1992
been documented in playas. Waterfowl nest in the area, producing up to 250,000 ducklings in wetter years. Dominant breeding and nesting species are mallards and blue-winged teals. During the very protracted breeding season, birds hatch from April through August. Several million shorebirds and waterfowl migrate through the area each spring and fall. More than 400,000 sandhill cranes migrate through and winter in the region, concentrating primarily on the larger saline lakes in the southern portion of the playa lakes region.
The primary importance of the playa lakes region to waterfowl is as a wintering area. Wintering waterfowl populations in the playa lakes region range from 1 to 3 million birds, depending on fall precipitation patterns that determine the number of flooded playas. The most common wintering ducks are mallards, northern pintails, green-winged teals, and American wigeons. About 500,000 Canada geese and 100,000 lesser snow geese winter in the playa lakes region, and numbers of geese have increased annually since the early 1980’s. This chapter describes the physiography and ecology of playa lakes and their attributes that benefit waterfowl.
Origin, Physiography, and Climate
Playas are shallow (generally less than 1 m deep), circular basins averaging 6.3 ha in surface
1

Fig. 1. The playa lakes region of the southern great plains (hatched area); most playas are on the southern high plains (outlined area).
area; 87% are smaller than 12 ha. Watershed size averages 55.5 ha and ranges from 0.8 to 267 ha. Where it is high (central Texas panhandle), the density of playas is 0.4/km2. Playas provide more than 160,000 ha of wetland habitat.
Several theories have been proposed for the formation of playas. The most recent theory proposes that playa basins form and expand as a result of hydrologic and geomorphic processes when water collects in depressions on the prairie. As the ponded water percolates into the subsoil, carbonic acid forms from the oxidation of organic material. The acid dissolves the underlying carbonate material (caliche). Loss of caliche leads to enhanced permeability of surface water that increases downward transport of solutes, particulate rock, and organic matter and expands the basin in a circular fashion from a central point. Land subsides from loss of caliche and the basin deepens.
Theoretically, a playa can form whenever a depression develops on the prairie. A few lakes are documented as having formed from depressions created during highway construction in the 1940’s. Potentially, existing playas can continually expand. Decaying vegetation provides a constant source of organic matter. However, the maximum size of a playa is limited by the size of its watershed, which determines the amount of runoff into the basin.
Playas are the primary recharge areas for the Ogallala aquifer of the southern high plains. Groundwater recharge is primarily along edges of playas. Infiltration in the center of the playa is limited because of pore filling when clays and organic matter percolate downward during basin formation. Historically, people assumed that water in playas was lost only by evaporation and transpiration. Although evaporation and transpiration are still considered a major loss of water in playas, the lack of increasing salt content in the water and soil of playas during declining water levels indicates some water loss from percolation.
Unlike most wetlands, floors of playas are not rounded, but plate-like (Fig. 2). As a result, water depth is relatively constant throughout much of the basin. Soils of the playa floor are predominantly clays, differing from the loams and sandy loams of the surrounding uplands. Therefore, locations of playas are easily recognized from soil maps.
The climate of the playa lakes region is semi-arid in the west to warm temperate in the east. In the Texas panhandle, mean temperature ranges from 1 to 3° C during winter and from 25 to 28° C in summer. Precipitation is mainly from localized thunderstorms during May and June and again during September and October. Precipitation averages 33 to 45 cm and is lowest in the southwest and highest in the northeast of the region. However, the entire region is rarely subject to average precipitation. Usually, rainfall is well above or below average and dependent on location. Average annual evaporation is 200−250 cm.
Because very few are directly associated with groundwater, playas can fill from only precipitation
Fig. 2. A typical plate-like floor of a playa lake.
Fish and Wildlife Leaflet 13.3.7. •• 1992 2

and irrigation runoff. Most playas are dry during one or more periods of each year, usually late winter, early spring, and late summer. Several wet-dry cycles during one year are not uncommon for a playa and depend on precipitation and irrigation patterns.
Importance of Playa Lakes to Crop Irrigation
Most playas (>70%) greater than 4 ha were modified for inclusion in crop irrigation systems. A pit or ditch was dug in these playas to concentrate and recirculate onto surrounding cropland any water collected in playas from precipitation and irrigation runoff. Using water from playas to irrigate crops is less expensive than pumping aquifer water. Furthermore, water from playas for irrigation reduces demand on the Ogallala aquifer. Therefore, many landowners depend on the water in their playas to maintain profitable farming.
Extensive irrigation of crops in the playa lakes region since the mid-1940’s has resulted in a net loss of water from the aquifer. Consequently, dominance of dryland agriculture is predicted in the area by the early 21st century. High water-use plants, such as corn, may be grown less frequently in the playa lakes region. Because corn is an important food for wintering waterfowl, increases in another crop (e.g., grain sorghum) or native food plants will have to compensate for its loss.
Playa Lake Vegetation
Establishment of vegetation depends on the existing moisture regime of the playa when other environmental conditions are suitable (i.e., temperature, photoperiod). Vegetation in dry playas resembles upland vegetation and includes species such as summer cypress, ragweed, and various prairie grasses. Moist and flooded conditions in playas favor vegetation representative of other North American wetlands; barnyard grass, smartweeds, bulrush, cattail, spikerush, arrowhead, toothcup, and dock.
Specifically, 14 physiognomic types of vegetation by moisture regime (frequency and longevity of flooding) and crop irrigation or other physical disturbance (grazing, cultivation, irrigation modifications) were identified in playas. The two most common types are broad-leaved emergent and wet meadow, which are dominated in
Fish and Wildlife Leaflet 13.3.7. •• 1992
varying proportions by willow and pink smartweed and barnyard grass.
Unlike most other North American wetlands, playa lakes are dominated by annuals. This is a response to the unpredictable, rapidly changing moisture regime in a playa during the growing season. Water loss from percolation, evaporation, transpiration, and irrigation and runoff from rainfall and irrigation can alter the moisture regime of a playa daily. Annual species are capable of responding to changing moisture regimes by rapidly germinating, maturing, and setting seed. Furthermore, the lack of a depth gradient throughout playas, combined with the dominance by annuals, limits the development of concentric bands of monotypic vegetation characteristic of northern glacial wetlands.
Native vegetation in playas is important to wintering waterfowl. The cover of native vegetation reduces stress during harsh winter conditions, and seeds of native species provide forage. Recent studies revealed ducks prefer seeds from native vegetation over agricultural grains. Seeds preferred by waterfowl wintering in the playa lakes region are from plants such as barnyard grass, smartweeds, and dock that germinate in moist-soil conditions (mudflats; saturated, exposed soil).
Recent research revealed that survival of wintering ducks in playas is higher and body condition is better during wet years (above-average rainfall) than during dry years (below-average rainfall). This is so because during wet years the abundance of preferred native food and cover (e.g., smartweeds and barnyard grass) is greater and readily available without energy expenditure for flights to agricultural fields. Therefore, management of playas should emulate conditions that favor development of vegetation communities (broad-leaved emergent and wet meadow) in playas during wet years.
Invertebrates in Playas
The influence of invertebrates on waterfowl use of playas is poorly understood. However, invertebrates are always in the diet of ducks in playas. Although playas have a wide variety of invertebrates (Table 1), life histories of most species are unknown. Invertebrate diversity is influenced by time and space. The composition of invertebrate communities changes profoundly, as yet unpredictably, as a function of the length of
3

Table 1. Orders and families of insects in playa lakes.
Ephemeroptera Baetidae Caenidae
Odonata Gomphidae Aeshnidae Libellulidae Coenagrionidae Lestidae
Orthoptera Tetrigidae Tridactylidae
Hemiptera Belostomatidae Corixidae Gelastocoridaeridae Notonectidae Mesoveliidae Hebridae Veliidae Gerridae Saldidae
Trichoptera Leptoceridae
Coleoptera Dytiscidae Gyrinidae Hydrophilidae Heteroceridae Curculionidae Carabidae Haliplidae
Diptera Tipulidae Culicidae Ceratopogonidae Chironomidae Tabanidae Stratiomyidae Ephydridae
time a playa is flooded. Additionally, invertebrate community structure seems to be playa-specific (R. W. Sites, University of Missouri, Columbia, personal communication). Such changes in invertebrate structure may influence future management of playas because certain communities of invertebrates may be more desirable than others for waterfowl.
Diseases of Waterfowl in Playas
Disease is a major source of nonhunting mortality of waterfowl wintering in the playa lakes region. During any year, avian cholera and botulism can kill thousands of waterfowl in playas. Avian cholera was first documented in North America in the playa lakes region. With high densities of waterfowl concentrations on small quantities of water, such as during drought, the potential exists for major dieoffs of waterfowl. However, currently, location and timing of disease outbreaks in the playa lakes region cannot be predicted.
4 Fish and Wildlife Leaflet 13.3.7. •• 1992
Management of Playas for Waterfowl
Almost all playas are in private ownership (>99%) and, therefore, the key to long-term management of these wetlands rests on incentives for private landowners. Because playas are not interconnected by courses of surface water, each playa lake and its watershed are an independent system and should be managed as such. We tested and confirmed the usefulness of management of playas that focuses on producing forage (seeds) and on increasing cover for wintering ducks.
Vegetation in playas has adapted to unpredictable wet−dry cycles. Indeed, a playa is most productive when its moisture regime fluctuates from dry to wet a few times during the growing season. Therefore, managing playas by stabilizing water levels results in less than maximum production of vegetation.
Because of the unpredictability of rainfall in the playa lakes region, all management plans for wintering waterfowl include options for flooding playas during winter. This aspect cannot be overemphasized; the cost of management must incorporate the expense of maintaining a flooded playa to satisfy management objectives (e.g., hunting season, migratory periods, wintering populations). Whether a playa will receive enough runoff from fall rains to be flooded when necessary cannot be predicted and managers must be prepared to pump water from other sources (e.g., aquifer, irrigation pit) to maintain water in a playa during desired periods of the year.
During construction of irrigation pits, landowners can terrace one or more sides of the excavation in a stair-step manner, which allows a littoral zone to be present at all times during fluctuations of water levels. These artificial littoral zones produce more vegetation, seeds, and invertebrates than standard steep-sided irrigation pits. Although it is a successful approach to using previously unproductive pit areas, such management has several drawbacks.
Usually, landowners already constructed all the pits that they want and very few playas remain in which pits can be built. Managing pits only affects a small amount of habitat, generally less than 1 ha. Longevity of the terraces and the cost of long-term maintenance are unknown. Furthermore, given the current permit requirements on modification of wetlands, such construction may not be approved.

Moist-soil management, common in other areas, has proved successful in playas. Moist-soil management involves drawdown or irrigation of wetlands for creation of saturated, exposed soil to promote germination and growth of mudflat species. In playas, prominent mudflat species are smartweeds and barnyard grass. Specific drawdown and irrigation schedules promote mudflat vegetation communities that are typical of playas during wet years (Table 2).
The cost of moist-soil management is less than 10% of the cost of winter flooding alone. However, playas that are managed for production of native foods can carry 10−20 times more ducks than playas managed for winter flooding. Therefore, landowners who flood their playas for wintering ducks should manage their lake for moist-soil vegetation during the growing season to receive a better return on their investment.
Moist-soil management favors establishment of smartweeds and barnyard grass, which are preferred for their greater total seed production and better nutritional characteristics than other species in playas (Tables 3 and 4). Because these species are in most playas, about 15,000 playas are available for moist-soil management. The increase in native food and cover from moist-soil management should increase the number of wintering ducks leaving the playa lakes region.
Moist-soil management allows landowners to continue using water collected in playas for irrigation of crops because recommended periods of creating moist-soil conditions correspond with irrigation schedules. Therefore, landowners can create moist-soil conditions in their playas by drawing down a flooded playa and irrigating crops or directing irrigation runoff into specific areas of a dry playa. By allowing the farmer to continue the use of water collected in playas for irrigation during the growing season, moist-soil management
is made simple and more cooperation from landowners can be expected.
When vegetation is established from moist-soil management, managers have several options to achieve a variety of management goals. Migratory ducks could be supported by flooding managed playas during fall and late winter. A wintering population of ducks can be maintained by managing a complex of playas and implementing a flooding schedule to ensure a constant supply of native food. Depth and timing of flooding will influence shorebird use of managed playas. Maintaining a few centimeters of water in managed playas during shorebird migration allows use by shorebirds. However, the effects of moist-soil management on the invertebrate food source for shorebirds in playas are unknown.
Current moist-soil management in playas was tested for seed-producing annuals and the presence of ducks but not geese. Therefore, current management of geese in playas revolves around providing roosting and foraging areas. Protecting large, open-water playas, which geese use for roosting, is important. Encouraging farmers to leave crop stubble and waste grain in the field provides foraging areas throughout winter for geese.
Few data are available for the management of breeding ducks in the playa lakes region. Maintenance of upland cover near a permanent water source, such as a large irrigation pit, meets most requirements of breeding and nesting ducks. Methods to encourage nesting in uplands rather than in playas, which often results in flooded nests, must be included in the management of breeding birds. Large-scale use of nesting structures is not recommended until the effectiveness of such structures can be determined for playas.
Table 2. Recommended schedule for moist-soil management of playa lakes.
Date Activity Purpose
Early April Draw down or flood playa to create moist-soil conditions
Create conditions for desired plants to germinate and grow
Mid-late June Draw down or flood playa to create moist-soil conditions
Reestablish plants lost to spring flooding
August Draw down or flood playa to create moist-soil conditions
Maximize seed production for duck food
November−January Flood and maintain 1 foot (30.5 cm) of water in playa
Create site for ducks to rest and feed
Fish and Wildlife Leaflet 13.3.7. •• 1992 5

Table 3. Frequency (%) and seed production (kg/ha) of common plant species from moist-soil managed and unmanaged playa lakes (Haukos, unpublished data).
Species Frequency
Managed Unmanaged Production
Managed Unmanaged
Barnyard grass Willow smartweed
20 38
4 3
346 730
45 55
Pink smartweed 22 2 532 105 Dock Spikerush
3 15
3 35
1,233 66
703 28
Table 4. Chemical constituents (%) of common plant species from playa lakes (Haukos, unpublished data).
Constituent Nonstructural Crude Crude Cutin/
Species Ash carbohydrates protein fat Hemicellulose Lignin Cellulose suberin
Barnyard grass 6.1 12.6 9.4 7.7 32.5 10.3 27.7 5.1 Willow smartweed 4.7 12.2 9.9 7.1 20.4 14.3 11.9 20.9 Pink smartweed 5.8 14.3 11.5 8.1 16.8 16.2 10.4 17.4 Dock 6.8 12.2 9.1 7.1 16.3 23.4 20.9 14.7 Spikerush 13.2 9.5 6.4 8.4 22.9 7.5 15.9 28.9
Future Research Needs Most studies involving playas have focused on
wildlife or the use of playas for irrigation. Few basic ecological studies have been initiated on playas. Studies relating to the basic functions and structure of playas, as have been conducted of the prairie potholes, would yield immediate benefits by providing a foundation for future studies and management. Future studies of wildlife should focus on using natural forces (i.e., water-level fluctuations, fire) to improve wildlife habitat. These studies should be designed for land in private ownership to elicit the interest and cooperation of owners.
Suggested Reading Bolen, E. G., G. A. Baldassarre, and F. S. Guthery. 1989.
Playa lakes. Pages 341−366 in L. M. Smith, R. L.
Pederson, and R. M. Kaminski, editors. Habitat management for migrating and wintering waterfowl in North America. Texas Tech University Press, Lubbock.
Bolen, E. G., L. M. Smith, and H. L. Schramm, Jr. 1989. Playa lakes: prairie wetlands of the southern high plains. BioScience 39:615−623.
Fischer, D. H., M. D. Schibler, R. J. Whyte, and E. G. Bolen. 1982. Checklist of birds from the playa lakes of the southern Texas panhandle. Bulletin of the Texas Ornithological Society 15:2−7.
Haukos, D. A., and L. M. Smith. 1991. Vegetation management in playa lakes for wintering waterfowl. Management Note 14. Department of Range and Wildlife Management, Texas Tech University, Lubbock. 4 pp.
Osterkamp, W. R., and W. W. Wood. 1987. Playa-lake basins on the southern high plains of Texas and New Mexico: I. hydrologic, geomorphic, and geologic evidence for their development. Geological Society of America Bulletin 99:215−223.
6 Fish and Wildlife Leaflet 13.3.7. •• 1992

Appendix. Common and Scientific Names of the Plants and Birds Named in the Text.
Plants Ragweed . . . . . . . . . . . . . . . . . . . . . . . . . . . . . . . . . . . . . . . . . . . . Ambrosia sp. Toothcup . . . . . . . . . . . . . . . . . . . . . . . . . . . . . . . . . . . . . . . . . . . Ammannia sp. Barnyard grass . . . . . . . . . . . . . . . . . . . . . . . . . . . . . . . . . . . . Echinochloa crusgalli Spikerush . . . . . . . . . . . . . . . . . . . . . . . . . . . . . . . . . . . . . . . . . . . Eleocharis sp. Summer cypress . . . . . . . . . . . . . . . . . . . . . . . . . . . . . . . . . . . . . . Kochia scoparia Willow smartweed . . . . . . . . . . . . . . . . . . . . . . . . . . Persicaria (Polygonum) lapathifolia Pink smartweed . . . . . . . . . . . . . . . . . . . . . . . . . . Persicaria (Polygonum) pensylvanica Dock . . . . . . . . . . . . . . . . . . . . . . . . . . . . . . . . . . . . . . . . . . . . . . Rumex crispus Arrowhead . . . . . . . . . . . . . . . . . . . . . . . . . . . . . . . . . . . . . . . Sagittaria longiloba Bulrush . . . . . . . . . . . . . . . . . . . . . . . . . . . . . . . . . . . . . . . . . . . . . . Scirpus sp. Cattail . . . . . . . . . . . . . . . . . . . . . . . . . . . . . . . . . . . . . . . . . . . . . . . Typha sp.
Birds Northern pintail . . . . . . . . . . . . . . . . . . . . . . . . . . . . . . . . . . . . . . . . Anas acuta American wigeon . . . . . . . . . . . . . . . . . . . . . . . . . . . . . . . . . . . . . . Anas americana Green-winged teal . . . . . . . . . . . . . . . . . . . . . . . . . . . . . . . . . . . . . . . Anas crecca Blue-winged teal . . . . . . . . . . . . . . . . . . . . . . . . . . . . . . . . . . . . . . . . Anas discors Mallard . . . . . . . . . . . . . . . . . . . . . . . . . . . . . . . . . . . . . . . . . Anas platyrhynchos Canada goose . . . . . . . . . . . . . . . . . . . . . . . . . . . . . . . . . . . . . . . Branta canadensis Lesser snow goose . . . . . . . . . . . . . . . . . . . . . . . . . . . . . . . . . . . . Chen caerulescens Sandhill crane . . . . . . . . . . . . . . . . . . . . . . . . . . . . . . . . . . . . . . . Grus canadensis
Note: Use of trade names does not imply U.S. Government endorsement of commercial products.
UNITED STATES DEPARTMENT OF THE INTERIOR FISH AND WILDLIFE SERVICE
Fish and Wildlife Leaflet 13 Washington, D.C. •• 1992
7

W A T E R F O W L M A N A G E M E N T H A N D B O O K
13.3.14. Detrital Accumulation and Processing in Wetlands
Patrick A. Magee Gaylord Memorial Laboratory University of Missouri Puxico, MO 63960
Wetlands are among the most productive ecosystems on earth (Fig. 1) and are often characterized by lush growths of hydrophytes. However, direct consumption of wetland plants by animals is relatively low, and, therefore, much of the biomass and energy assimilated by hydrophytes becomes detritus or senesced plant litter. Nutrients released by detritus into the water and soil are assimilated by microorganisms, algae, plants, and small aquatic animals. Through this process, energy is transferred from detritus to other biotic components of a wetland. Plant litter ultimately decomposes.
Litter processing is regulated by environmental factors, microbial activity, the presence and abundance of aquatic invertebrates, and in some wetlands by vertebrate herbivores, such as muskrats, nutria, fishes, and snow geese. Microbes usually contribute most significantly to litter decay through oxidation of organic matter. Large numbers of invertebrates may feed and live on plant litter after microbial conditioning. Detritus is one of several important substrates and energy sources for wetland invertebrates that in turn provide forage for vertebrates, such as fishes, waterfowl, shorebirds, and wading birds. When their dietary needs for animal proteins are high (e.g., during molt and reproduction), waterbirds
Fish and Wildlife Leaflet 13.3.14. •• 1993
forage heavily on invertebrates. Therefore, the role of invertebrates in detrital processing is of particular interest to wetland managers and waterbird biologists.
Understanding the dynamics of litter processing promotes a broader perspective of wetland functions and more specifically enhances an understanding of detrital-based invertebrate ecology. Here I discuss the production of litter, some details of decomposition and nutrient cycling, and the role of invertebrates in detrital processing.
Production of Detritus Along with algae, detritus fuels secondary
production in temperate regions during the dormant season. In many temperate and arctic wetlands, residual litter provides an initial energy source for secondary consumers at the beginning of the growing season. In contrast, in tropical systems, productivity is high, litter decays rapidly, and, therefore, organic substrate for invertebrate colonization is scarce. Productivity is reduced in some arctic wetlands and slow decomposition favors deep, acidic peat accumulations that support few invertebrates. An optimal quantity of litter from balanced primary production and decomposition favors invertebrate communities on wetland substrates. The amount of produced litter varies tremendously among wetlands (Fig. 1) and depends on a myriad of biotic and abiotic factors.
1

In temperate regions, deciduous trees and herbaceous plants enter dormancy or die during autumn. Before senescence, large trees and perennial herbs with well-developed root or rhizome systems resorb the nutrients from their leaves and stems for future use. Therefore, plant litter is composed largely of nonnutritive, structural compounds, such as lignin and cellulose. In prairie glacial marshes, litter may enter the system throughout the year. Nearly three fourths of bulrush shoots die before the first killing frost, whereas 80% of cattail shoots are killed by the frost. During the dormant season, wind, waves, and ice formation topple standing litter. Decomposition is most dynamic in fallen litter.
Table. Some factors of litter decomposition rate.
Fig. 1. Litter production varies greatly among wetlands depending on factors, such as plant species, climate, and hydrology. Dynamic hydrology in contrast to prolonged flooding promotes net biomass production in cypress−tupelo forested wetlands. Data presented for Virginia (Great Dismal Swamp) also includes red maple litter production. The worldwide average for warm-temperate forests is shown for comparison.
Decomposition
Decomposition is a complex process that is regulated by characteristics of the litter and by external environmental factors (Table). The process can be described as a series of linked phenomena in which one step does not occur until preceding steps make it possible (Fig. 2, also see Fig. 2 in Leaflet 13.3.1.).
The rate of decomposition is important because it affects the release rate of nutrients, the accumulation rate of litter, and the state or quality of the litter substrate. Litter from many submergent and floating plants, such as watershield, decays rapidly (Fig. 3). On the other
Properties
Intrinsic
Environmental
Rate of decomposition Fast Slow
Low lignin High lignin High phosphorus Low phosphorus High nitrogen Low nitroge Low carbon to nitrogen High carbon to nitrogen Low carbon to phosphorus High carbon to phosphorus Low tannic acid High tannic acid Few polyphenols Many polyphenols Leaf tissue Woody tissue
Microbes present Low microbial biomass Shredders present Low shredder biomass Water present Water absent Flowing water Stagnant water (less O2) High water temperature Low water temperature Water with high pH Water with low pH Low latitudes High latitudes Low elevations High elevations
2 Fish and Wildlife Leaflet 13.3.14. •• 1993

Fig. 2. Litter decomposition is a complex, dynamic process in which detritus is slowly fragmented to fine organic matter and eventually to minerals. Detritus provides energy and nutrients that support microorganisms and macro-invertebrates. Oi, Oe, and Oa refer to organic litter horizons. FPOM = fine particulate organic matter, CPOM = coarse particulate organic matter.
Per
cent
orig
inal
mas
s
American lotus k = 1.81
Watershield k = 6.17
hand, robust emergent plant litter and leaves from certain trees decay slowly. The leaves of pin oaks, for example, require 4−7 years to completely mineralize (Fig. 3). In forested wetlands with slowly decaying leaves, accumulated layers of litter reflect each year’s growth and state of decay. The result is a substrate with a diverse vertical profile. Plant parts decay at different rates; leaves decompose more rapidly than stems or woody tissues. Furthermore, plants with high quantities of lignin, such as common reed and burreed, have the slowest decay rates. Decomposition is usually slow in northern wetlands (i.e., >50% of plant litter
Pin oak k = 0.50 Fig. 3. Decay rates of the leaves of four
common wetland plants over a 12-month interval starting from senescence. The annual decay coefficients (k) are determined from
Black willow a negative exponential decay model k = 0.55 and represent a single value that
can be used to compare decay rates among species.
remains after 3 years of decay) partly because of cold temperatures. In contrast, in a warm, tidal wetland, more than three fourths of the litter decayed within 3 months. Because of the interactions between the environment and a plant’s characteristics, the composition of litter substrate varies.
Decomposition of litter by a complex interaction of physical, chemical, and biological processes has at least two phases. In the first phase of decomposition (leaching), loosely bound nutrients, such as calcium, potassium, and magnesium, are rapidly released from newly
Fish and Wildlife Leaflet 13.3.14. •• 1993 3

senesced plant litter. Cattail, for example, lost 76% of sodium, 93% of potassium, 70% of calcium, and 65% of magnesium after 1 month of decay. Black willow leaf litter lost 85% of its potassium within the first 2 weeks of decay. Sometimes the leaching phase is so rapid that labile nutrients are flushed from the litter within 48 h of flooding.
Not all nutrients immediately escape from the litter. Nitrogen (Fig. 4) and calcium, for example, may accumulate in the litter as a result of immobilization and colonization by microbes. Litter can act as an important sink for these nutrients, which are slowly released during the second phase of decomposition.
The second phase of decay consists of mechanical fragmentation of litter by ice, wind and wave action, and biological fragmentation by invertebrates called detritivores (Fig. 2). Most importantly, however, biologically mediated chemical transformations of litter by microbes promote gradual loss of recalcitrant litter tissues, such as lignin and cellulose. All of these processes convert litter from large, structurally complex forms to smaller, simpler materials. Largely intact litter with a >1-mm diameter is called coarse particulate organic matter (CPOM), whereas highly fragmented litter is fine particulate organic matter (FPOM). Eventually, plant litter is converted to its simplest forms and becomes incorporated into the soil or dissolved in the water column.
The Role of Microbes and Invertebrates
Before most invertebrates begin processing litter, microbes colonize litter surfaces at densities of 410,000−410,000,000 individuals /cm2. These microbes are the fungi (e.g., phycomycetes) and bacteria (e.g., actinomycetales, eubacteriales, myxobacterales, pseudomonaiales) that digest cellulose.They are the key organisms that erode the structural framework of the litter. Their abundance and activity reflect environmental conditions; bacteria are more numerous on submerged than on standing dead litter, although water temperature and oxygen availability affect bacterial response. In many wetlands, microbes regulate decay and account for as much as 90% of litter weight loss. Many fungi produce external enzymes that break down cellulolytic tissues in detritus. In this process, sucrose is broken down into glucose and fructose, but only a portion of these sugars are assimilated by microbes. The remainder are available to protists, zooplankton, and macroinvertebrates.
Macroinvertebrates are a diverse group and fill many niches in wetland communities. As litter decomposes, these niches become available sequentially by size of litter fragments and by the activities of other invertebrates and microorganisms (Fig. 2). Litter is food and habitat for many aquatic invertebrates. Followmg leaching, litter is primarily composed of nonnutritive,
Fig. 4. Nitrogen cycling in wetlands involves a labyrinth of chemical transformations of nitrogen into forms that may or may not be available to plants. Microorganisms play a key role in mediating nitrogen availability in the benthos and soil.
4 Fish and Wildlife Leaflet 13.3.14. •• 1993

complex carbohydrates that are difficult or impossible for detritivores to digest. Therefore, the key link between macroinvertebrates and litter processing is the presence of microbes. Not only do these bacteria and fungi break down litter directly, they also condition litter by making it palatable to invertebrates.
Detritivores, called shredders, are the first to fragment CPOM because they are voracious feeders with low assimilation rates; much of the litter they consume is excreted in a highly fragmented state. The surface area increases after the litter passes through the digestive tract of invertebrates and thereby enhances microbial growth. Crustaceans, such as aquatic sowbugs, freshwater scuds, and crayfish, are prominent shredders in many forested wetlands. Crayfish and many insects are common shredders in moist-soil wetlands in Missouri.
Grazers, another group of detritivores, scrape algae and microbes off surfaces of CPOM, allowing recolonization by new microbes. Grazing tends to increase microbial growth and activity. Snails, such as the pond and orb snail, are the most conspicuous grazers in wetland systems.
Collectors feed on fine particulate organic matter (FPOM) that is produced mainly by shredders. One group of collectors is mobile and gathers FPOM from sediments. For example, some
midge larvae and mayflies, called collector−gatherers, obtain nutrients and energy by foraging on small litter fragments. Another group of collectors, including fingernail clams, filters FPOM from the water column.
A dynamic invertebrate community develops in detrital-based systems as water temperatures increase and litter processing is most active. Shredders reach peak density and biomass and create more foraging opportunities for collectors. Given these conditions, highly mobile, predaceous invertebrates, such as dragonflies, respond to available prey (i.e., shredders and collectors).
Considerations in Management Wetlands are productive because the base of
the biotic pyramid is large and diverse and nutrient cycling is dynamic. Because energy flows from the lowest levels of the pyramid, detritus sustains much of the biomass and structure of the community (Fig. 5). Furthermore, detrital processing releases and transforms nutrients tied up in plant tissues and makes them available for uptake by wetland flora and fauna. Management, particularly hydrological manipulations, may enhance energy and nutrient flow in wetlands.
Fig. 5. Detritus is a fundamental component of food−energy pyramids in wetland ecosystems. During the dormant season in temperate wetlands, only detritus and algae supply energy and nutrients to sustain higher trophic levels.
Fish and Wildlife Leaflet 13.3.14. •• 1993 5

Detritus becomes an important energy source when wetlands are flooded. Inundation triggers the dynamic process of litter decomposition. Decay rates are often much higher in wetlands than in adjacent uplands, indicating in part the level of activity and the biomass of aquatic biological decomposers. Maintenance of long-term hydrological regimes is the key to maintaining the balance between litter decay and accumulation and to sustaining the biotic components of detrital processing and wetland productivity. For example, aquatic invertebrates have evolved diverse adaptations for living in seasonally flooded environments, and, without dynamic flooding regimes, many of these organisms are incapable of completing their life cycles. In the short term, the annual timing, rate, depth, and duration of flooding affect the diversity and abundance of invertebrates at a particular site.
Hydrology also influences nutrient cycling in wetlands. Because of leaching and subsequent decomposition, the water column is rich in nutrients for several months after flooding. Therefore, rapid drawdowns when nutrient content is high can flush nutrients from the system. Slow and delayed drawdowns retain nutrients and enhance long-term wetland productivity.
Stabilized flooding regimes may harm detrital nutrient dynamics. Anaerobic conditions can develop in detritus, especially when water is stagnant. Subsequently, denitrification, which is the loss of nitrogen from the litter, may result in a net export of nitrogen from the system. Denitrification is less common in aerated litter layers than in wetland soils and is minimal under dynamic flooding strategies.
Secondary production in wetlands may be hindered by runoff of sediments and chemicals from agricultural lands or storm flow. When sedmients envelop litter, the substrate is less hospitable to the epifauna because oxygen is deficient. Furthermore, as more sediments are suspended in the water column, penetration of light is reduced and chemical imbalances may occur. Although hydrophytes are excellent purifiers of polluted waters, excessive amounts of fertilizers and pesticides may have a direct detrimental effect on wetland biota. Maintaining upland borders that filter sediments and chemicals before they settle in wetland basins is important for sustained detrital processing.
Litter quality and quantity also affect secondary production. Mechanical fragmention of
litter increases the surface area for microbial and invertebrate colonization. Hydrophytes, such as American lotus, with its large, round leaves, have relatively small surface areas and low invertebrate densities. Mowing or shallowly disking lotus increases the surface area of this simple substrate by artificially hastening litter fragmentation. Such control of nuisance vegetataon enhances short-term production of invertebrates.
The balance between litter removal and accumulation affects wetland productivity. Small litter accumulations may not provide adequate substrate for invertebrates; however, large accumulations may alter surface hydrology through peat formation or nutrient binding. Litter removal may be accomplished by flooding if surface flow is sufficiently great to simulate this natural function. Prescribed burns not only remove excess organic matter but release minerals bound in the litter.
Habitats with diverse litter layers in various stages of decay are optimal for the management of invertebrates. Where litter accumulation is scant or heavy, however, invertebrate production may be impeded because of unfavorable conditions associated with hydrology, substrate, and nutrient availability.
Suggested Readings Cummins, K. W, M. A. Wilzbach, D. M. Gates, J. B.
Perry, and W. B. Taliaferro. 1989. Shredders and riparian vegetation. BioScience 39:24−30.
Kadlec, J. A. 1987. Nutrient dynamics in wetlands. Pages 393−419 in K. R. Roddy and W. H. Smith, editors. Aquatic plants for water treatment and recovery. Proceedings of the Conference on Applications of Aquatic Plants for Water Treatment and Resource Recovery, Orlando, Fla.
Mason, C. F. 1976. Decomposition. The Institute of Biology’s Studies in Biology 74. 58 pp.
Merritt, R. W., and K. W. Cummins. 1984. An introduction to the aquatic insects of North America. Kendall/Hunt Publishing Company, Dubuque, Iowa. 441 pp.
Murkin, H. R. 1989. The basis for food chains in prairie wetlands. Pages 316−338 in A. G. van der Valk, editor. Northern prairie wetlands. Iowa State University Press, Ames.
Polunin, N. V. C. 1984. The decomposition of emergent macrophytes in freshwater. Advances in Ecological Research 14:115−166.
Webster, J. R., and E. F. Benfield. 1986. Vascular plant breakdown in freshwater ecosystems. Annual Review of Ecology and Systematics 17:567−594.
Fish and Wildlife Leaflet 13.3.14. •• 1993 6

Appendix.Common and Scientific Names of the Plants and Animals Named in the Text.
Plants Red maple . . . . . . . . . . . . . . . . . . . . . . . . . . . . . . . . . . Acer rubrum Watershield . . . . . . . . . . . . . . . . . . . . . . . . . . . . . . . . . Brasenia schreberi American lotus . . . . . . . . . . . . . . . . . . . . . . . . . . . . . . . . Nelumbo lutea Water tupelo . . . . . . . . . . . . . . . . . . . . . . . . . . . . . . . . . Nyssa aquatica Common reed . . . . . . . . . . . . . . . . . . . . . . . . . . . . . . . . Phragmites australis Pin oak . . . . . . . . . . . . . . . . . . . . . . . . . . . . . . . . . . . . Quercus palustris Black willow . . . . . . . . . . . . . . . . . . . . . . . . . . . . . . . . . Salix nigra Bulrushes . . . . . . . . . . . . . . . . . . . . . . . . . . . . . . . . . . Scirpus spp. Burreeds . . . . . . . . . . . . . . . . . . . . . . . . . . . . . . . . . . . Sparganium spp. Baldcypress . . . . . . . . . . . . . . . . . . . . . . . . . . . . . . . . . Taxodium distichum Cattails . . . . . . . . . . . . . . . . . . . . . . . . . . . . . . . . . . . . Typha spp.
Invertebrates (by function) Shredders
Aquatic sowbug . . . . . . . . . . . . . . . . . . . . . . . . . . . . . . Asellidae Crayfish (omnivore) . . . . . . . . . . . . . . . . . . . . . . . . . . . . Cambariidae Freshwater scud . . . . . . . . . . . . . . . . . . . . . . . . . . . . . . Gammaridae
Collectors Mayfly (gatherer) . . . . . . . . . . . . . . . . . . . . . . . . . . . . . Baetidae Midge (gatherer) . . . . . . . . . . . . . . . . . . . . . . . . . . . . . . Chironoraidae Water flea (filterer) . . . . . . . . . . . . . . . . . . . . . . . . . . . . Daphnidae Fingernail clam (filterer) . . . . . . . . . . . . . . . . . . . . . . . . . Sphaeriidae
Grazers Pond snail . . . . . . . . . . . . . . . . . . . . . . . . . . . . . . . . . Physidae Orb snail . . . . . . . . . . . . . . . . . . . . . . . . . . . . . . . . . . Planorbidae
Predator Dragonfly . . . . . . . . . . . . . . . . . . . . . . . . . . . . . . . . . . Aeshnidae
Vertebrates Northern shoveler . . . . . . . . . . . . . . . . . . . . . . . . . . . . . . Anas clypeata Least sandpiper . . . . . . . . . . . . . . . . . . . . . . . . . . . . . . . Calidris minutilla Great egret . . . . . . . . . . . . . . . . . . . . . . . . . . . . . . . . . . Casmerodius albus Snapping turtle . . . . . . . . . . . . . . . . . . . . . . . . . . . . . . . Chelydra serpentina Snow goose . . . . . . . . . . . . . . . . . . . . . . . . . . . . . . . . . . Chen caerulescens Common carp . . . . . . . . . . . . . . . . . . . . . . . . . . . . . . . . Cyprinus carpio Hooded merganser . . . . . . . . . . . . . . . . . . . . . . . . . . . . . . Lophodytes cucullatus River otter . . . . . . . . . . . . . . . . . . . . . . . . . . . . . . . . . . Lutra canadensis Nutria . . . . . . . . . . . . . . . . . . . . . . . . . . . . . . . . . . . . Myocastor coypus Muskrat . . . . . . . . . . . . . . . . . . . . . . . . . . . . . . . . . . . Ondatra zibethicus
Note: Use of trade names does not imply U.S. Government endorsement of commercial products.
UNITED STATES DEPARTMENT OF THE INTERIOR FISH AND WILDLIFE SERVICE
Fish and Wildlife Leaflet 13 Washington, D.C. •• 1993
7

W A T E R F O W L M A N A G E M E N T H A N D B O O K
13.4.1. Considerations of Community Characteristics for Sampling Vegetation
Leigh H. Fredrickson and Frederic A. Reid Gaylord Memorial Laboratory School of Forestry, Fisheries and Wildlife University of Missouri−Columbia Puxico, MO 63960
Wetland managers often monitor marsh vegetation to determine if management goals have been met and expenditures justified. Vegetation can be monitored using indices that identify plant composition, trends in vegetative changes, or rough estimates of food production. Development of vegetation sampling protocol requires careful assessment of management goals in relation to benefits received from sampling efforts. Assessing the results of manipulations has direct management implications, whereas detailed studies that emphasize plant life histories or basic ecological investigations have less direct value. Information on plant community characteristics that will enable managers to match sampling techniques with refuge needs and the constraints imposed by time, expertise, number of personnel, and program funds is provided.
Identification of Goals
The initial consideration in any collection of management data is: "How will this information assist in meeting refuge objectives?" Information on variables other than plants are important. Records on the hydrological regime, timing and type of manipulations, and the wildlife response to management must be maintained. Only then can the results of management be assessed.
The next step is to identify the type of vegetative information required (Table 1). Detailed changes in composition or densities and exact measurements of biomass usually have limited value for refuge needs, whereas more general changes in composition or densities and gross measurements of foods produced are essential in monitoring the effectiveness of management investments. Qualitative approaches or general quantitative approaches often are adequate. Thorough comparisons of techniques on different sites, as well as seasonal or long-term variation in vegetation, require refined quantitative methodologies and time-consuming collection methods. Little is gained from long-term sampling if data are not summarized regularly and subjected to analysis.
Costs of data collection, analysis, time, and personnel are generally greater for quantitative approaches. When time, personnel, and funds are limited, costly sampling systems that provide information with little value in meeting refuge objectives should not be implemented.
Expertise
Effective sampling requires some knowledge of plant taxonomy. Recognition of plants during all life phases (e.g., germination, flowering, seeding) is essential. Use of scientific names is required because common names are not used consistently across the country. In addition, differences between life histories of plants within a genus or between plants with the same common name may have important implications for management.
Fish and Wildlife Leaflet 13.4.1. •• 1988 1
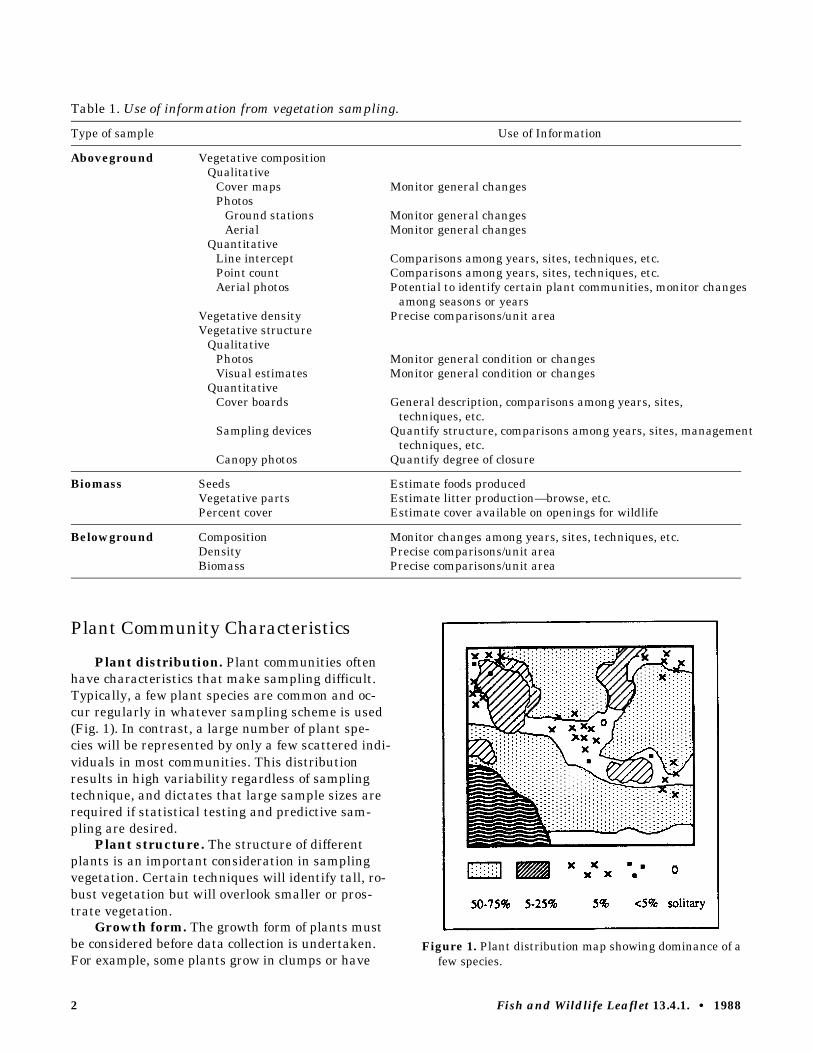
Table 1. Use of information from vegetation sampling.
Type of sample Use of Information
Aboveground Vegetative composition Qualitative
Cover maps Photos Ground stations
Aerial Quantitative
Line intercept Point count Aerial photos
Vegetative density Vegetative structure Qualitative
Photos Visual estimates
Quantitative Cover boards
Sampling devices
Canopy photos
Monitor general changes
Monitor general changesMonitor general changes
Comparisons among years, sites, techniques, etc. Comparisons among years, sites, techniques, etc. Potential to identify certain plant communities, monitor changes among seasons or years Precise comparisons/unit area
Monitor general condition or changes Monitor general condition or changes
General description, comparisons among years, sites, techniques, etc. Quantify structure, comparisons among years, sites, management techniques, etc. Quantify degree of closure
Biomass Seeds Vegetative parts Percent cover
Estimate foods produced Estimate litter production—browse, etc. Estimate cover available on openings for wildlife
Belowground Composition Density Biomass
Monitor changes among years, sites, techniques, etc. Precise comparisons/unit area Precise comparisons/unit area
Plant Community Characteristics
Plant distribution. Plant communities often have characteristics that make sampling difficult. Typically, a few plant species are common and occur regularly in whatever sampling scheme is used (Fig. 1). In contrast, a large number of plant species will be represented by only a few scattered individuals in most communities. This distribution results in high variability regardless of sampling technique, and dictates that large sample sizes are required if statistical testing and predictive sampling are desired.
Plant structure. The structure of different plants is an important consideration in sampling vegetation. Certain techniques will identify tall, robust vegetation but will overlook smaller or prostrate vegetation.
Growth form. The growth form of plants must be considered before data collection is undertaken. For example, some plants grow in clumps or have
Figure 1. Plant distribution map showing dominance of a few species.
Fish and Wildlife Leaflet 13.4.1. •• 1988 2

multiple leaves that are all attached to a single rhizome or root system. The distinction between a leaf and a stem becomes critical when data are compared between sites or among years. The chronology of plant growth requires that sampling be properly timed. Otherwise, some species will be overlooked or sampling will not be representative. Animal response to vegetation structure also affects the timing of data collection. Rapid growth of some plants dictates that sampling for structure cannot be delayed for the convenience of the investigator. For example, vegetative structure at the time of nest initiation cannot be identified after nesting is completed. Finally, the maturation pattern of seeds or
production of underground parts is a critical consideration in scheduling collection of samples.
Sampling Techniques The effectiveness of sampling techniques must
be considered in relation to their costs in time and personnel (Table 2). Detailed approaches to sampling will be provided in specific techniques chapters in this handbook.
Plant composition. For general long-term trends, aerial or ground photos provide good records. When different vegetation can be distin-
Table 2. Techniques commonly used to monitor vegetation.
Information needed/ Technique used Disadvantages Advantages
Plant composition Line intercept Time-consuming, requires large sample Minimal equipment, can monitor
size of openings in vegetation Point count Time-consuming, requires large sample Minimal equipment, can monitor
size of openings in vegetation Quadrats Time-consuming, require large sample Minimal equipment Cover maps Only identify general plant communities Quick, especially if aerial photos or
other base maps are available Aerial photos Only identify general plant communities Accurate potential for establishing
(LANDSAT) Expensive unless photos can be borrowed a continuous record of changes May require special equipment
Photo stations Only identify gross changes Permanent record of major changes, economical
Plant density−herbaceous Quadrat Time-consuming, needs large sample Minimal equipment Ocular Visual estimates vary among individuals Quick, minimal equipment
Plant density−woody Prism Only an estimate, not effective for seed- Quick, minimal equipment
ings or saplings
Seeds Catch pans Time-consuming, animals eat samples, Can monitor gradual seed
costly to make pans, estimate only of production fallen seeds because gradually maturing species drop seeds over an extended
period Quadrat Time-consuming
Vertical cover Cover board Burdensome device in some habitats Quick estimate of vertical cover
Horizontal cover Sampling device Burdensome device in some habitats Accurate estimate
Belowground biomass Quadrat Time-consuming, difficult to obtain in Accurate estimate
deep habitats
Fish and Wildlife Leaflet 13.4.1. •• 1988 3

guished from photographs, the potential to document changes exists. Cover maps developed from field inspections (e.g., pacing on ice) and aerial photos are often adequate and more economical than sampling with intercepts or quadrats. Color 35-mm slides are often available from Agricultural Stabilization and Conservation Service (ASCS) offices. Many of these low-level photographs clearly delineate wetland vegetation, and digitized planimeter analysis can yield estimates of the area of different vegetation zones. Comparisons among years must be made with photographs of the same similar season. Since slides can normally be borrowed from ASCS offices, the construction of composite photographs of a wetland from 35-mm slides is economical. Thus, the cost of color reproductions and time to construct maps can be far less than the expenses of aerial photography and large-format photographs. ASCS offices generally do not retain slides of a particular year for more than 2−3 years; therefore, data must be obtained within 2−3 years after the photograph was taken. Long-term photographs may be available within certain periods, but not specific years.
Plant densities. Visual estimates of the percent cover of important species on management units usually provide an adequate index to changes among years. Stem counts within quadrats are very time consuming. Monitoring all plants species within quadrats often has little importance in management and is both costly and time consuming.
Seeds, tubers, etc. No quick method has been developed to monitor seed or tuber production. General estimates of production usually meet management needs and require only information on plant composition and the relative estimates of production for each species. Estimates of belowground biomass are particularly expensive because plant samples must be separated from a large volume of soil. Such activities are generally beyond the capabilities of refuge staff or budgets. Sampling techniques that have low resolution, yet clearly document changes related to management, changes among years, and differences related to habitat use by wildlife, often meet the needs of refuge managers. Consistent record keeping among years using data sheets, photography stations, or ASCS photography provides long-term perspectives as refuge staffs change, modifications in hydrology occur, or as land-use practices influence plant composition on refuges.
Suggested Reading Fredrickson, L.H., and T.S. Taylor. 1982. Management of
seasonally flooded impoundments for wildlife. U.S. Fish and Wildl. Serv., Resour. Publ. 148. 29 pp.
Harper, J.L. 1977. Population biology of plants. Academic Press, N.Y. 892 pp.
Mueller-Dombois, D., and H. Ellenberg. 1974. Aims and methods of vegetation ecology. John Wiley & Sons, N.Y. 547 pp.
����������������������������������������
������������������������� ���������������������������� ����������������� •• � ����

W A T E R F O W L M A N A G E M E N T H A N D B O O K
13.4.2. Economic and Legal Incentives for Waterfowl Management on Private Lands
Richard D. Schultz U.S. Fish and Wildlife Service Federal Building, Fort Snelling Twin Cities, MN 55111
Introduction
Waterfowl management on public lands in the United States began about 1870 with the establishment of Lake Merritt, a State-owned refuge near Oakland, California. In 1924 the United States established the Upper Mississippi River Wild Life and Fish Refuge, a complex of waterfowl habitats extending from Wabasha, Minnesota, to Rock Island, Illinois. Over the next 50 years, more than 80 million acres of county, State, and Federal lands were acquired across the United States to provide waterfowl production, migration, and wintering habitats. Because of these early (and continuing) efforts, a significant portion of North America’s remaining valuable wetland complexes exists on public lands.
Despite the success of governments in acquiring, restoring, and managing public lands for waterfowl and other species, many wildlife populations have declined to the lowest levels ever recorded. This is due, in part, to the historic and ongoing conversion of important wetlands and grasslands to croplands. Between 1950 and 1985 it is estimated that more than 450,000 acres of wetlands were converted each year; at least 87% of those conversions were for agricultural purposes. Today, 74% of the remaining wetlands are on private lands and are vulnerable to destruction.
In recent years, public and private conservation organizations have initiated programs designed to provide economic incentives for wildlife management on private lands. Other programs, whose primary objectives are other than waterfowl management, also improve and preserve waterfowl habitat on private lands. These programs range from tax incentives and wetland easements to direct financial assistance to landowners. In this chapter, legal and economic incentives for waterfowl management on private lands are summarized under the following categories: Federal programs, State and local programs, and private conservation organization programs.
In most instances, government programs and those of private conservation organizations complement one another and often provide the private landowner many alternatives from which to choose. Likewise, governmental and private organizations have recently expressed a strong desire to form partnerships to better manage waterfowl. This is one of the most important concepts in the North American Waterfowl Management Plan. No single entity has the capability to address the waterfowl needs of the future through unrelated and independent actions. Through combined efforts, however, we have a much better chance to achieve waterfowl management objectives.
The major purpose of this chapter is to discuss an array of economic and legal incentives for waterfowl management, although it is not a complete list. I am hopeful that the information contained here will stimulate the reader to investigate specific programs that are available for waterfowl management on private lands at the local level.
Fish and Wildlife Leaflet 13.4.2. •• 1990 1

Federal Programs
One of the most significant pieces of legislation affecting natural resource management on private lands was the Food Security Act (Farm Bill) of 1985. This legislation was unique in that it began to integrate natural resource management with U.S. agricultural policy. Throughout the United States, waterfowl production, migration, and wintering habitats are affected by the programs designed to implement this legislation. The following is a discussion of these programs and other Federal programs that encourage waterfowl management on private lands.
Conservation Reserve Program (CRP)
One of the primary purposes of the CRP is to reduce soil erosion by retiring highly erodible croplands from production. These retired croplands provide excellent cover for upland-nesting waterfowl and other wildlife. Beginning in January 1989, CRP rules were modified to allow enrollment of certain wetlands into the program. With this change, private landowners were able to restore or enhance wetlands on their property, improving waterfowl production and migration habitats. Wintering waterfowl habitat on private lands was also improved through the restoration of bottomland hardwoods on qualifying CRP lands in the lower Mississippi valley.
Under the CRP, the Agricultural Stabilization and Conservation Service (ASCS) had the authority to share up to 50% of the cost of establishing conservation practices, including permanent vegetative cover, tree planting, wetland restoration and enhancement, and other erosion control practices. In many areas, private conservation organizations and State and Federal agencies will assume all or part of the landowner’s cost for the restoration of wetlands on CRP lands.
Agricultural Conservation Program (ACP)
Through the ACP, cost-sharing up to 75% is available for private landowners willing to undertake conservation practices such as restoring drained wetlands or creating new ones. Unlike CRP, however, annual land rental payments are not paid to landowners under this program. The ACP is administered by the ASCS. Technical assistance for the ACP is provided by the Soil Conservation Service.
Water Bank Program
Wetlands and adjacent uplands in some States, including some states in the prairie pothole region and the lower Mississippi valley, are eligible for enrollment in the Water Bank Program. This U.S. Department of Agriculture program allows enrollment of wetlands and associated uplands into 10-year contracts where the landowner receives annual payments. Land parcels are reviewed for their wildlife values; no more than 4 acres of upland for every acre of wetland can be enrolled in the program. Since its inception, the program has not been fully funded; hence, only limited funding is available for enrollment of new lands. The Water Bank Program is administered by ASCS with technical assistance from the Soil Conservation Service.
Acres Conservation Reserve (ACR) Programs
Farmers participating in price support programs (commonly known as set-aside programs) of the U.S. Department of Agriculture have been required to set aside a certain percentage of their base acreage in most years. Conservation measures are required to provide soil erosion protection, water quality enhancement, wildlife production, and natural beauty. Millions of acres of cropland are retired each year as a result of this program.
Multiyear set-aside contracts have been available for program participants for program years 1986−90. Under these multiyear contracts, landowners may seed retired lands to permanent vegetative cover. Where this option has been used, high-quality upland nesting cover for waterfowl and other species has been established. However, multi-year set-aside is rarely used and relatively few acres are established in permanent cover.
The next logical step in this program is to promote the enrollment of restorable wetlands into annual and multiyear set-aside contracts throughout the United States. If this occurs, additional financial incentives for the landowner would likely become available from other government agencies and private conservation organizations.
Stewardship 2000: Partners for Wildlife on Private Lands
Recently, the U.S. Fish and Wildlife Service initiated Stewardship 2000, a program that will improve wildlife habitat on private lands. This program is designed to complement, and not com-
Fish and Wildlife Leaflet 13.4.2. •• 1990 2

pete with, similar programs administered by other agencies and organizations. Stewardship 2000 will concentrate on wetlands and their associated fish and wildlife values. The restoration of wetlands on CRP lands has been expanded through this new program to include wetland restoration on other private lands as well. Other improvements to waterfowl habitats have been completed through deferred haying and grazing, creation of waterfowl nesting structures, and in some instances, construction of waterfowl nesting islands.
In the lower Mississippi valley, Stewardship 2000 has increased and improved waterfowl wintering habitat. Under this program, the U.S. Fish and Wildlife Service enters into annual lease agreements with landowners for flooding of harvested rice paddies and for the establishment of bottomland hardwoods. Additional information about these private lands management programs can be obtained from the nearest U.S. Fish and Wildlife Service field office.
Small Wetlands Acquisition Program
Under this program, administered by the U.S. Fish and Wildlife Service, high-quality waterfowl production habitat in the prairie pothole region is purchased outright or by perpetual easements. Existing and restorable wetlands are eligible for these programs. Under the easement program, the landowner retains all property rights except the right to burn, drain, fill, or level-ditch the wetlands in question. Basically, the easement is designed to protect the wetland in perpetuity. Landowners in the prairie pothole region who are interested in selling their property in fee simple or in selling a waterfowl production easement should contact the nearest U.S. Fish and Wildlife Service office.
Federal Income Tax Incentives
Expenses for many conservation practices undertaken by private landowners are tax-deductible. Conservation practices designed to reduce soil erosion and improve water quality qualify, and expenses related to the restoration of wetlands for water quality and wildlife purposes are typically tax-deductible. Landowners who lease their property to others for hunting or similar purposes may qualify for investment-credit tax treatment for those conservation practices that benefit both recreational activities and wildlife.
Gifts of conservation easements made to charitable organizations may qualify for tax deductions.
Fish and Wildlife Leaflet 13.4.2. •• 1990
The conservation easements must be enforceable and perpetual, and they must be donated exclusively for conservation purposes to units of government or tax-exempt private entities. Additional information concerning tax incentives for waterfowl management on private lands can be obtained from a qualified tax preparer.
State and Local Programs Many programs that improve waterfowl man
agement on private lands are administered by State and local governments. These programs include short-term and perpetual land-retirement programs, property tax incentives, and direct financial assistance to private landowners. Examples of these programs are discussed below.
Reinvest in Minnesota (RIM) In 1986 the Minnesota State legislature passed
innovative legislation known as the Reinvest in Minnesota Resources Act of 1986. The purpose of this act is to retire marginal cropland from production through the use of conservation easements. In most instances, the program consists of perpetual easements, in which a lump-sum payment equal to 70% of the average market value of the agricultural land is made to the landowner. Both restorable wetlands and highly erodible croplands are eligible for the program. Perennial vegetative cover must be established on the uplands to reduce soil erosion, improve water quality, and improve fish and wildlife habitat. The program is administered by the Minnesota Board of Water and Soil Resources and the Minnesota Department of Natural Resources.
Critical Habitat Matching Program As part of the RIM program, private land
owners and individuals may contribute cash, land, easements, or pledges for acquisition or development of wildlife habitat. All contributions are tax-deductible and are matched, dollar for dollar, by State-appropriated funds.
Donated land is appraised at market value. If lands qualify, they are managed as a wildlife management area, scientific and natural area, fisheries area, or other appropriate State unit. Donated lands that do not qualify as critical habitat are sold, and the proceeds are deposited into the Critical Habitat Matching Account. Private landowners and others interested in participating in this pro
3

gram should contact the Minnesota Department of Natural Resources.
State Private Lands Management Programs
Many State natural resource departments have developed wildlife management programs for private lands. State biologists are often available to provide landowners with technical assistance in the development of their lands for waterfowl and other wildlife species. These biologists frequently serve as "brokers" and are also familiar with programs of other agencies that may meet the objectives of the individual landowner. In some instances, these State-administered programs provide cost-sharing assistance to help finance wildlife management projects.
State Tax Credit and Exemption Programs Several States have statutes that provide prop
erty tax relief for those landowners who are interested in preserving habitat that can benefit waterfowl and other wildlife resources. In the Midwest, for example, Iowa, North Dakota, and Minnesota exempt certain wetlands from taxation. Additional information about these programs can be obtained from county tax assessors.
Indiana Classified Wildlife Habitat Act The purpose of this legislation, passed in 1979,
is to reduce habitat loss by encouraging landowners to develop or save existing wildlife habitat. The incentives for landowner participation are a reduction of the assessed value of classified lands to $1 per acre for tax purposes, and free technical advice and assistance from the Indiana Division of Fish and Wildlife. Lands eligible for this program include grasslands, shrublands, and wetlands. The owner of the classified wildlife habitat does not relinquish ownership or control of the property.
Minnesota State Cost-share Program The Minnesota Board of Water and Soil Re
sources offers cost-share assistance to local Soil and Water Conservation Districts for construction costs of water quality projects. Frequently, these projects identify the need to restore wetlands and retire highly erodible croplands on private lands. Likewise, Watershed Management Districts, particularly in western Minnesota, have contributed cost-share grants for flood control purposes. Resto
ration of drained wetlands and enhancement of existing wetlands are projects eligible for this program, depending on flood control benefits. Private landowners located in watersheds for which a need exists to improve water quality or control flood waters should contact their local Soil and Water Conservation District for additional information.
Private Conservation Organization Programs
In recent years, private conservation organizations have been instrumental in promoting wildlife habitat improvement projects on private lands. Several of these organizations are national or international in scope, while others are regional or local. Collectively, these conservation organizations are a great source of financial and technical assistance for the private landowner who wishes to improve lands for waterfowl.
Ducks Unlimited—U.S. Habitat Program Since 1983 Ducks Unlimited has financed the
improvement of waterfowl habitat in several States of the upper Midwest. Most of these projects were on public lands. Recently, however, Ducks Unlimited has expanded its program and assists in wetland restoration projects on private lands, including those lands enrolled in the Conservation Reserve Program. In cooperation with the U.S. Fish and Wildlife Service, Ducks Unlimited has assisted in restoring several hundred wetlands in North Dakota and western Minnesota.
Ducks Unlimited Canada—Prairie Care Program
Beginning in June 1989, farmers in selected areas of Canada’s prairie Provinces were offered incentives and technical assistance to adopt conservation land-management practices or to convert marginal croplands to pastures or hayland. Annual rental payments are also used to maintain grass cover for several years. Additional information about this program can be obtained from Ducks Unlimited Canada, 1190 Waverly Street, Winnipeg, Manitoba R3T 2E2.
Pheasants Forever Activities undertaken by Pheasants Forever in
clude the restoration of upland nesting and wintering cover for pheasants. Many Pheasants Forever
Fish and Wildlife Leaflet 13.4.2. •• 1990 4

projects also improve habitat for waterfowl; particularly where the organization finances the restoration of wetlands that provide excellent winter cover for pheasants in the upper Midwest. Local chapters also purchase or lease lands containing valuable habitats. Members of Pheasants Forever also work with private landowners, other private organizations, and government agencies to improve wildlife habitat.
The Nature Conservancy
The Nature Conservancy is an international organization, organized in the United States by State chapters; its purpose is to preserve rare and endangered plant and animal communities through land purchases and the acquisition of conservation easements. The Nature Conservancy also assists governments and other conservation organizations with land acquisitions, manages a worldwide system of nature preserves, and promotes legislation for the protection of ecological diversity.
Wetlands for Iowa
The Iowa Natural Heritage Foundation is a nonprofit organization whose purpose is to restore and preserve important resources within the State of Iowa. One such program is Wetlands for Iowa, which is designed to preserve existing wetlands and restore others. These wetlands may exist on private lands, and conservation easements can be acquired for their continued protection.
State Waterfowl Associations
These organizations assist in the restoration of wetlands located on CRP or public lands. Waterfowl associations and private duck-hunting clubs also purchase high-quality waterfowl habitat in fee title or protect important habitat through acquisition of perpetual conservation easements.
Local Hunting, Fishing, and Conservation Clubs
Local hunting, fishing, and conservation organizations are willing to assist private landowners with waterfowl habitat improvement projects. Many of these organizations have substantial financial resources that are often dedicated to wildlife habitat improvement projects on both public and private lands.
Summary As indicated by the previous examples, a num
ber of incentives exist for private landowners within certain areas to improve waterfowl management on their lands. Additional programs exist in Canada. Land managers and landowners interested in using these programs are encouraged to familiarize themselves with programs in their area. If no incentives exist for wildlife habitat protection of private lands, those interested are urged to promote the implementation of such programs through their local, State, and Federal governments. This participation is critical as we approach the next century, where the future of waterfowl in North America will depend on innovative programs to encourage resource conservation on private lands.
Suggested Reading Henderson, F. R. 1984. Guidelines for increasing wildlife
on farms and ranches. Kansas State University Cooperative Extension Service, Manhattan. 572 pp.
Messmer, T. 1989. North Dakota wildlife conservation programs. North Dakota State University Extension Service, Fargo. Pub. WL-942 revised. 16 pp.
Steward, D., D. DeFrates, and K. Peper. 1988. Nonregulatory wetland protection options. Minnesota Board of Water and Soil Resources, St. Paul. 17 pp.
Ward, J. R., F. K. Benfield, and A. E. Kinsinger. 1989. Reaping the revenue code. Natural Resources Defense Council, New York. 142 pp.
����������������������������������������
������������������������� ���������������������������� ����������������� •• � ����
Fish and Wildlife Leaflet 13.4.2. •• 1990 5

W A T E R F O W L M A N A G E M E N T H A N D B O O K
13.4.3. Managing Agricultural Foods for Waterfowl
James K. Ringelman Colorado Division of Wildlife 317 West Prospect Road Fort Collins, CO 80526
Agriculture, more than any other human activity, has had a profound influence on North American waterfowl. Most agricultural effects have been detrimental, such as the conversion of grassland nesting cover to cropland, the widespread drainage of wetlands, and the use of pesticides that may poison waterfowl or their food. However, some by-products of agriculture have been beneficial, particularly grain or other foods left as residue after harvest. Many waterfowl are opportunistic feeders, and some species such as Canada geese (Branta canadensis), snow geese (Chen caerulescens), mallard (Anas platyrhynchos), northern pintails (A. acuta), and green-winged teal (A. crecca) have learned to capitalize on the abundant foods produced by agriculture. During the last century, migration routes and wintering areas have changed in response to these foods. Some species have developed such strong traditions to northern wintering areas that many populations are now dependent on agricultural foods for their winter survival.
Their relatively large body size enables waterfowl to store fat, protein, and minerals for later use. These reserves can then be mobilized for egg formation, migration, molt, or in times of food shortage. Although strategies for depositing and using nutrient reserves differ among species, and are necessarily dependent upon seasonal availability of foods, waste grains are among the most extensively
exploited food resources. Arctic-nesting snow geese, for example, feed extensively in agricultural fields during their northward migration. Their ability to exploit croplands has been largely responsible for dramatic population increases in this species. Clutch size and perhaps nesting dates of mallards and other early-nesting ducks are thought to be directly related to the amount of reserves obtained on their wintering grounds.
During breeding and molting periods, waterfowl require a balanced diet with a high protein content. Agricultural foods, most of which are neither nutritionally balanced nor high in protein, are seldom used during these periods. However, during fall, winter, and early spring, when vegetative foods make up a large part of the diet, agricultural foods are preferred forage except in arctic and subarctic environments. Waterfowl management during these periods is often directed at small grain and row crops. Corn, wheat, rice, barley, oats, peas, sorghum, rye, millet, soybeans, and buckwheat are commonly planted as waterfowl foods. The species and varieties suitable for a particular area, as well as the seeding and cultivation techniques necessary for a good yield, are dependent on soil conditions, growing season, moisture regimes, irrigation, the availability of farm implements, and other considerations. My purpose is therefore not to recommend crops or describe planting techniques, because these are site-specific considerations. Instead, I present guidelines that discuss the quality and quantity of agricultural foods needed by waterfowl, and techniques to enhance the availability of these foods.
Fish and Wildlife Leaflet 13.4.3. •• 1990 1

Food Quality of Grains
Waste grain is a locally abundant, high-energy food that can be quickly consumed by waterfowl. The best indication of the nutritional quality of foods is given by an analysis of their chemical composition. The amount of gross energy, crude protein, fat, ash, fiber, and digestible carbohydrates (NFE) are indices to food value. However, since waterfowl use grains primarily as a high-energy food and supplement their diet with natural foods to compensate for nutritional deficiencies, the energy content of grains is the most commonly used basis for comparison. Unfortunately, energy content varies among varieties of the same grain, as well as by soil and environmental conditions. Moreover, waterfowl cannot digest different grains with similar efficiencies. In recognition of this digestive efficiency, metabolizable energy, which is indicative of the energy actually derived from a food, is a better comparative measure than gross energy content.
Agricultural foods (with the exception of soybeans) provide high levels of metabolizable energy (Table 1). Energy values, while indicative of fresh seeds, are not representative of grains underwater or exposed outdoors for an extended period. Under these conditions, energy value may decline rapidly. For example, rice will lose only 19% of its energy value after 90 days of flooding, but milo and corn will lose 42 and 50%, respectively, and soybeans will lose 86% of their energy content. Such losses underscore the need for well-timed harvests and manipulations to maintain food quality. Harvesting fields at intervals will help ensure a constant supply of fresh feed. When fields are flooded, water should be applied gradually so that a “flooding front” is created that progressively inundates new grain. Soybeans should be avoided as a waterfowl
food crop. They not only decompose rapidly in water, but may also cause food impaction in the esophagus, which can be fatal. Additionally, legumes such as soybeans are undesirable because they often contain digestive inhibitors that reduce the availability of protein and other nutrients.
How Much to Plant? Even though modern implements harvest about
95% of a ripened grain crop, most harvested fields still contain 50−310 pounds/acre of residual grain (Table 2). Waterfowl are efficient feeders, and will continue to use agricultural foods long after residual food density has been reduced. Waste corn, at typical postharvest densities of 100−500 pounds/acre, has to be reduced to a density of 90 pounds/acre before mallard feeding rates begin to decrease. Generally, waterfowl feeding on land will reduce densities to 13 pounds/acre before switching to alternate food sites, whereas waterfowl using foods underwater may abandon fields after densities decline to 45 pounds/acre. Daily food consumption varies among species, individuals within species, and with energetic demands related to behavior and thermoregulation. As a rule of thumb, average-sized geese will consume about 150− 200 g/day, whereas large ducks need about half this amount. Although waterfowl will fly 20 miles or more to obtain grain, it is best to provide food no farther than a 10-mile radius from waterfowl concentrations.
Cost is always a consideration when planting food crops. Species that can be grown without irrigation will always be less expensive than water-demanding grains. Some crops, such as millets, are closely related to wild plants used by waterfowl. Millets are advantageous because they can be either
Table 1. Energy content and chemical composition of common agriculture foods planted for waterfowl.
Crop Metabolizable energya
Mallard Canada goose Protein Fiber Percent (dry weight)
NFEc Fat Ash
Barley Milo Rice Rye Soybeans Wheat Yellow corn
2.98b
— 3.34 3.14 2.65 3.32b
3.60
3.32 3.85 — 2.74 3.20 3.35 4.01
14 12 9
14 42 26 10
5 3 1 4 6
19 5
— 80 — 68 28 34 80
2 3 2 2
19 4 5
2 2 1 2 5
17 2
a Apparent metabolizable energy in kcal/g.b Estimated as 6% less than the true metabolizable energy value. c Nitrogen-free extract.
2 Fish and Wildlife Leaflet 13.4.3. •• 1990

Table 2. Average preharvest and postharvest densities of common agricultural crops planted for waterfowl.
Density (pounds/acre) Crop Preharvest Postharvest Location
Barley 2,613 105 Colorado Corn (for grain) 5,580 320 Iowa, Illinois, Nebraska, Texas Grain sorghum 3,678 258 Texas Japanese millet 2,227 89 Colorado Rice 5,205 160 Mississippi Valley Soybeans 1,093 53 Mississippi Valley Wheat 1,768 106 Colorado
drilled or broadcast, are inexpensive, grow quickly, and are less susceptible to wildlife depredations than other crops. Japanese millet tolerates shallow flooding and saturated soils, and produces high yields of seed. Other species, such as white proso millet, achieve a low growth form with no loss in seed production if grown under low moisture conditions. Carefully planned crop rotations may eliminate the need for inorganic nitrogen or insecticide applications, thereby reducing costs. One common rotation used in midwestern States is a mixture of sweet clover and oats the first year, followed by corn in the second year and soybeans in the third year. Winter wheat is planted in the fall of the third year, with clover and oats repeated in the summer of the fourth year.
Enhancing Food Availability Before grain crops are selected, managers
should consider not only the energy value of grains but also the physical characteristics of the seed head. Large seeds, such as corn kernels, are more quickly located and consumed by waterfowl than smaller seeds. Seed head structure is also impor
tant. For example, even though barley has a lower metabolizable energy, it is preferred over hard spring wheat because ducks are able to remove seeds more quickly from the heads.
Abundant grain crops are worthless if they are not presented in a manner that makes them available to birds. The amount of residual food remaining after harvest is affected by harvester efficiency and operation, slope of the field, insects, disease, cultivar, and moisture content of the grain. Reductions in surface grain density result from all postharvest, cultivation treatments (Table 3). In some instances, postharvest treatments may be beneficial, even if aboveground residues are decreased, because reduced ground litter increases the foraging efficiency of waterfowl. However, such benefits are often difficult to quantify; therefore, the best strategy is to present unharvested or freshly harvested crops in ways that have proven attractive to waterfowl (Table 4). Such practices regulate secondary availability, or the accessibility of grain residues after harvest.
In mild winter climates, precipitation or flooding from runoff usually enhances grain availability by making food more available to waterfowl. In cold
Table 3. Estimated waste corn residues resulting from different tillage systems. See text for other variables affecting harvest residues.
Grain density (pounds/acre) Tillage system Middle range Lower range
Untilled 320 76 Disk (tandem) 233 56 Chisel (straight shank) 148 35 Chisel (twisted shank) 27 5 Chisel (straight shank—disk (tandem) 22 4 Chisel (straight shank)—disk (offset) 8 1 Chisel (twisted shank)—disk (tandem) 5 <1 Chisel (twisted shank)—disk (offset) 3 0 Moldboard plow 2 0
Fish and Wildlife Leaflet 13.4.3. •• 1990 3

Table 4. Recommended treatments to enhance food availability for waterfowl.
Crop Treatment
Barley, wheat Leave low-growing varieties standing, since their seed heads are easily fed upon by ducks and geese. Corn, milo Harvest when grain moisture is <21%. Burn corn stubble, then leave field dry—do not flood. Graze
cattle if snow cover is persistent. Soybeans Do not flood fields. Beware of potential impaction problems if dry beans are consumed by birds. Millets Best if unharvested. Flood gradually to a depth of 8 inches. Rice Disk harvested fields to loosen and mix soil with grain and straw, or roll with a water-filled drum
to create openings in stubble. Flood to a depth of 8 inches.
climates, however, food usually becomes less available after precipitation. In these regions, snowfall and cattle grazing are the most important components of secondary availability. After heavy snowfall, mallard and other ducks often use standing grain crops, since these are the only foods above snow. Cattle, turned loose to graze in harvested cornfields, create openings in the snow and break up corn ears, thereby increasing kernel availability.
The physical layout of fields may also affect food availability. In severe winter climates, wide swaths of harvested crops should be separated by several rows of unharvested plants, thereby providing a “snow fence” to enhance the availability of grain on the ground as well as provide a reserve of food that will remain above even the deepest snow. It may be advantageous to plant crops in blocks of rows running perpendicular to one another. This helps ensure that the tops of some rows will be exposed by the prevailing winds during heavy snow.
Suggested Reading Alisauskas, R. T., C. D. Ankney, and E. E. Klaas. 1988.
Winter diets and nutrition of midcontinental lesser snow geese. J. Wildl. Manage. 52:403−414.
Baldassarre, G. A., R. J. Whyte, E. E. Quinlin, and E. G. Bolen. 1983. Dynamics and quality of waste corn available to postbreeding waterfowl in Texas. Wildl. Soc. Bull. 11:25−31.
Clark, R. G., H. Greenwood, and L. G. Sugden. 1986. Influence of grain characteristics on optimal diet of field−feeding mallards. J. Appl. Ecol. 23:763−771.
McFarland, L. Z., and H. George. 1966. Preference of selected grains by geese. J. Wildl. Manage. 30:9−13.
Reinecke, K. J., R. M. Kaminski, D. J. Moorhead, J. D. Hodges, and J. R. Nassar. 1989. Mississippi alluvial valley. Pages 203−247 in L. M. Smith, R. L. Pederson, and R. M. Kaminski, eds. Habitat management for migrating and wintering waterfowl in North America. Texas Tech University Press, Lubbock.
Ringelman, J. K., W. R. Eddleman, and H. W. Miller. 1989. High plains reservoirs and sloughs. Pages 311−340 in L. M. Smith, R. L. Pederson, and R. M. Kaminski, eds. Habitat management for migrating and wintering waterfowl in North America. Texas Tech University Press, Lubbock.
Sugden, L. G. 1971. Metabolizable energy of small grains for mallards. J. Wildl. Manage. 35:781−785.
Warner, R. E., and S. P. Havera. 1985. Effects of autumn tillage systems on corn and soybean harvest residues in Illinois. J. Wildl. Manage. 49:185−190.
����������������������������������������
������������������������� ���������������������������� ����������������� •• � ����
4 Fish and Wildlife Leaflet 13.4.3. •• 1990

W A T E R F O W L M A N A G E M E N T H A N D B O O K
13.4.4. Habitat Management for Molting Waterfowl
James K. Ringelman Colorado Division of Wildlife 317 West Prospect Street Fort Collins, CO 80526
The ecology, behavior, and life history strategies of waterfowl are inseparably linked to that unique avian attribute, feathers. Waterfowl rely on flight capabilities to migrate, to fully exploit the resources of wetland and upland communities, and to escape life-threatening events. The insulation provided by contour and down feathers allows waterfowl to use a wide range of habitats and protects them from temperature extremes. Plumage is important not only for species recognition during courtship, but also for cryptic coloration of females during incubation. However, feathers become worn and must be periodically replaced. The process of feather renewal, or molt, is a critical event in the lives of birds. Despite the obvious importance of the molt, relatively little attention has been devoted to managing waterfowl during this period.
Unlike most birds, ducks, geese, and swans share the unusual trait of a complete, simultaneous wing molt that renders them flightless for 3 to 5 weeks during the postbreeding period. Concurrently, these waterfowl also renew their tail and body feathers. In addition to this postbreeding molt, ducks undergo a second yearly molt to renew all but their flight feathers. Here, I describe the nutrition, energetics, and management of molting adult ducks and geese, with emphasis on the period of molt when birds are flightless.
Fish and Wildlife Leaflet 13.4.4. •• 1990
Nutrition and Energetics
Dry waterfowl feathers are about 86% protein. Large amounts of sulfur amino acids, mainly cystine, are required for the production of keratin, the protein constituent of feathers. In addition, the net energetic efficiency of feather synthesis is only 6.4%. This combination of low conversion efficiency, overall high protein demand, and specific amino acid requirements causes molt to be nutritionally and energetically costly.
The source of protein used in feather synthesis has important implications for habitat management. Most waterfowl lose weight during the flightless period and also experience changes in digestive organ and muscle masses. Such changes are attributable to diet and conversion of muscle protein to amino acids used in feather synthesis. It is now believed that waterfowl use a mixed strategy of muscle protein reserves and high protein foods for feather synthesis. Although there is a primary dependence on foods, internal reserves provide a buffer against periods of high protein demand or food shortage. Proper habitat management for molting waterfowl must therefore focus on providing sufficient high-protein, green forage for geese and herbivorous ducks, as well as providing aquatic invertebrates for most dabbling and diving ducks.
Molting Habitat: When and Where?
Molt chronology varies among species (Fig. 1) and is ultimately regulated by the number of daylight hours and hormonal changes. Geese and
1

Fig. 1. Annual molt chronology of representative North American waterfowl (after Weller 1976). Molt patterns are for adult male waterfowl unless otherwise noted.
swans undergo a single, complete molt during the postbreeding period. Yearling birds and unsuccessful nesters make up the initial molting groups, followed shortly thereafter by adults with broods. Adults regain flight capabilities about the time goslings fledge. Duck plumages and molts are more complex than those of geese. Males acquire bright breeding (“alternate”) plumage in fall and retain this plumage until after the breeding season. Thereafter, males molt into “basic” or “eclipse” plumage that is retained from midsummer into early fall. Most females begin postbreeding molt on northern breeding grounds and may complete this molt during migration or on wintering grounds. This plumage is worn until late winter or early spring, when they molt into basic plumage that is retained throughout the nesting period. The total duration of each molt is 6 to 7 weeks.
The timing of the flightless period for ducks depends on when a species nests and, for males, the length of time they remain with their hen before joining molting groups (Fig. 2). As with geese and swans, nonbreeding individuals or females that nested unsuccessfully molt early. Hens that nest successfully, or that unsuccessfully attempt to renest molt later. Unlike most males, late-molting females often do not join large molting groups but
instead prefer to molt singly or in small groups. They also tend to use smaller wetlands near their breeding habitat. Thus, molt chronology and habitat use are partially regulated by phenological considerations such as an early spring versus a late spring, wetland abundance and permanency, and other conditions that influence nest success. Similarly, nutrient reserves and perhaps pairing status can affect the timing of prebasic molt on wintering grounds.
Individual ducks and geese often undergo post-breeding molt on wetlands used in previous years. Some of this traditional use may result from homing to nesting areas and subsequent use of nearby wetlands for molting. However, many waterfowl migrate hundreds of miles to traditional molting sites, suggesting that such wetlands possess unique attributes that make them ideal for molting birds. Although these attributes are largely unknown, some unique features are apparent, and generalized food and habitat requirements of some species have been described (Table). The common needs of all molting waterfowl are wetlands, adequate food resources, and security from predators and disturbance.
Geese and most ducks tend to concentrate on large, semipermanent or permanent wetlands during molt. These wetlands often provide large ex
2 Fish and Wildlife Leaflet 13.4.4. •• 1990

Fig. 2. Timing and duration of the flightless period for some North American ducks. Chronology is representative of individuals breeding at 45° north latitude and may vary according to location, phenology, and local nesting conditions. Asterisks denote the approximate time at which most birds are flightless.
Fish and Wildlife Leaflet 13.4.4. •• 1990 3

Table. Generalized habitat use, behavior, and food habits of selected duck species during the flightless period.
Species General habitat use and behavior Food habits
American black duck Flooded shrubs and emergents in inland habitats; tidal marshes Omnivorous and estuaries in coastal habitats. Rarely observed when flightless on inland areas
American wigeon Open water of large or medium-sized wetlands. Feeds in open Herbivorous water on submergent plants; loafs on shorelines
Blue-winged teal Extensive beds of cattail, bulrush, and other emergents Omnivorous Canvasback Open-water portions of large lakes. Attracted to Sago pondweed. Omnivorous
Seeks resting sites and security in open water Common goldeneye Open water of large lakes Mostly carnivorous Gadwall Same as American wigeon Herbivorous Lesser scaup Same as canvasback Mostly carnivorous Mallard Marshes with concealing cover, such as cattail, bulrush, or Omnivorous
shrubs. Rarely observed during flightless period Northern pintail Same as mallard. Often occurs in association with mallards Omnivorous Northern shoveler Similar to teal and other dabbling ducks Carnivorous—zooplankton Redhead Open-water portions of large lakes. Seeks resting sites and Herbivorous—submergent
security in open water vegetation Wood duck Swamps, wooded ponds, and marshes with abundant, dense cover Omnivorous
panses of open water as well as emergent vegetation such as cattail and bulrush. Although open water and vegetative cover would seem to address different habitat needs, both may provide molting waterfowl with a sense of security. When rendered flightless, diving ducks seek escape from predators in open water. Geese, which traditionally prefer open nesting sites that enable them to quickly detect predators, may select open-water molting areas for the same reason. Mallards and most other carnivorous or omnivorous dabbling ducks seem to prefer thick, emergent vegetation for hiding. Wetlands used for molting also commonly possess islands or shorelines devoid of vegetation. Such areas enable waterfowl to rest out of water, yet provide open visibility to detect approaching predators.
Vegetation Management
Aquatic vegetation provides shelter, habitat for aquatic invertebrates, and green forage for molting waterfowl. Flooded, robust emergent species such as cattail, bulrush, or tall sedges are most desirable; however, any patch of flooded emergent vegetation may be used by molting birds. Most permanent wetlands contain bands of emergents around their periphery or in patches in shallow areas. Because seed banks usually contain an abundance of emergent plant seeds, spring and summer
drawdowns may be used to encourage germination of robust emergents and moist-soil plants. If drawdowns are not possible and water depth exceeds 3 feet, fill may be added to create shallow areas necessary to establish and propagate emergent plants. In some instances, fish may compete with molting waterfowl for aquatic invertebrate foods, or rough fish such as carp may increase water turbidity, thereby reducing the abundance of submerged vegetation. Control of fish populations may be needed to correct such conditions.
Large wetlands often contain flooded emergents that occupy too much of the wetland basin. In such cases, control measures should be initiated to increase the open water to vegetation ratio to between 50:50 and 70:30, which are proportions attractive to many molting waterfowl. Canada geese are attracted to wetlands that have an open water to vegetation ratio of 90:10 or higher. Vegetation control is often achieved by drawdowns, followed by cutting or other mechanical or chemical control of vegetation, then subsequent reflooding during the growing season.
Many aquatic invertebrates are dependent on the microscopic organisms (periphyton) that attach to underwater substrates. To thrive, periphyton must have a rich nutrient base. Periodic drawdowns, every 3−5 years in most wetland systems, delay natural wetland succession, release nutrients through aerobic decay, allow seed
4 Fish and Wildlife Leaflet 13.4.4. •• 1990

germination, and promote the establishment of emergent vegetation by compacting the bottom substrate. Periphyton and allied invertebrate populations often increase markedly after drawdowns, thereby increasing the availability of high protein foods needed by many molting ducks.
Sedges, rushes, grasses, and other herbaceous plants all provide natural green forage for molting geese. Increasingly, geese also rely on Kentucky bluegrass, alfalfa, and other cultivated plants as a source of protein. Because geese extract only the readily soluble compounds from green forage, and often feed selectively on new shoots or other highly nutritious parts of plants, large quantities of forage are needed to provide the nutrients necessary for feather synthesis. Moreover, molting adults and goslings often compete for the same food resources, further increasing the demand for forage. Insufficient forage may result in gosling mortality, because young birds are at a disadvantage when competing with adults. Food plots of alfalfa, wheat, rye, or other forage should be established in instances where wetlands used for molting do not have sufficient forage within 200 yards.
Controlling Disturbance
Postbreeding Molt Tolerance to human disturbance varies by spe
cies and exposure to human activities. Although no species of waterfowl is oblivious to disturbance, molting Canada geese can coexist with people provided that close approaches and direct harassment are avoided. Molting ducks, however, are less tolerant. Boaters and anglers may be particularly disruptive, causing birds to become more alert and evasive, thereby reducing foraging time and efficiency while increasing energy devoted to swimming and escape. Disturbance may also relegate flocks to suboptimal habitats where they are less secure from predators. Fortunately, many waterfowl seem to confine their activities to portions of large wetlands during the flightless period. Once such areas are delineated through field observations, human effects can be minimized through area closures that are delineated by buoy markers or landmarks. The behavior of molting birds and annual trends in molting populations are good measures of the success of such closures. Excessive alert or avoidance behavior, or annual declines in the population of molting birds are indications of adverse reactions to disturbance.
Fish and Wildlife Leaflet 13.4.4. •• 1990
The timing of protection from disturbance depends partly on the time needed to grow new flight feathers. The growth rate of flight feathers increases with body size, generally at a rate of 0.08 inches per day per pound of body weight. However, because wing length increases with body mass, the duration of the flightless period ranges from 25 to 32 days for all waterfowl. Most waterfowl are able to fly when their primary feathers are 75 to 85% of their final length. However, because species and sexes molt asynchronously, protection from disturbance should extend from the time that the earliest species begins incubation (assuming that breeding birds molt locally) until 3 weeks after the young of the latest-nesting species begin flying (Fig. 2). When geese and ducks are present in a mixed population, this period of protection would extend over 3.5 months.
Prebasic Molt Unlike northern wintering populations, in
which species such as mallards undergo prebasic molt during January−March, ducks in southern populations begin molt in early winter, with paired birds appearing to molt earlier than unpaired individuals. When habitat conditions are favorable and food resources plentiful, prebasic molt occurs in early winter. Disturbance to ducks during prebasic molt has caused some southern States to consider restructuring hunting seasons to reduce the effects on paired and molting birds. The concern, which has not been substantiated, is that hunting disturbance may disrupt the formation of pairs, retard molt, and reduce foraging efficiency. In turn, these effects may delay the acquisition of nutrient reserves needed for migration and reproduction, and generally retard the biological timetable of affected individuals. In addition to manipulating hunting seasons and area closures, the strategies for minimizing disturbance during prebasic molt are similar to those described for the postbreeding molt.
The Need for Habitat Preservation
Knowledge of the habitat requirements and nutritional demands of molting waterfowl is far from complete. We do recognize that during the flightless period, waterfowl are completely dependent on the resources of a single wetland for about 1 month. The fact that some waterfowl undertake molt migrations of hundreds of miles, while bypassing myriad other seemingly “suitable” wetlands along the way,
5

suggests that wetlands used by molting waterfowl possess unique qualities that we do not yet recognize. Until we better understand the features that make such areas suitable for molting birds, such habitats should be protected or managed with care.
Suggested Reading
Bailey, R. O., and R. D. Titman. 1984. Habitat use and feeding ecology of postbreeding redheads. J. Wildl. Manage. 48:1144−1155.
Dubowy, P. J. 1985. Feeding ecology and behavior of postbreeding male blue-winged teal and northern shovelers. Can. J. Zool. 63:1292−1297.
Gilmer, D. S., R. E. Kirby, I. J. Ball, and J. H. Reichmann. 1977. Post-breeding activities of
mallards and wood ducks in north-central Minnesota. J. Wildl. Manage. 41:345−359.
Heitmeyer, M. E. 1988. Body composition of female mallards in winter in relation to annual cycle events. Condor 90:669−680.
Heitmeyer, M. E. 1988. Protein costs of the prebasic molt of female mallards. Condor 90:263−266.
Oring, L. W. 1964. Behavior and ecology of certain ducks during the postbreeding period. J. Wildl. Manage. 28:223−233.
Salomonsen, F. 1968. The moult migration. Wildfowl 19:5−24.
Weller, M. W. 1976. Molts and plumages of waterfowl. Pages 34−38 in F. C. Bellrose, ed. Ducks, geese, and swans of North America. Stackpole Books, Harrisburg, Pa.
Zicus, M. C. 1981. Molt migration of Canada geese from Crex Meadows, Wisconsin. J. Wildl. Manage. 45:54−63
Appendix. List of Common and Scientific Names of Plants and Animals Named in Text.
Plants Sedges . . . . . . . . . . . . . . . . . . . . . . . . . . . . . . . . . . . . . . . . Carex spp. Rushes . . . . . . . . . . . . . . . . . . . . . . . . . . . . . . . . . . . . . . . Juncus spp. Alfalfa . . . . . . . . . . . . . . . . . . . . . . . . . . . . . . . . . . . . . . . . Medicago sativa Kentucky bluegrass . . . . . . . . . . . . . . . . . . . . . . . . . . . . . . . . . Poa pratensis Sago pondweed . . . . . . . . . . . . . . . . . . . . . . . . . . . . . . . . . . . Potamogeton pectinatus Bulrush . . . . . . . . . . . . . . . . . . . . . . . . . . . . . . . . . . . . . . . Scirpus spp. Rye . . . . . . . . . . . . . . . . . . . . . . . . . . . . . . . . . . . . . . . . . Secale cereale Wheat . . . . . . . . . . . . . . . . . . . . . . . . . . . . . . . . . . . . . . . . Triticum spp. Cattail . . . . . . . . . . . . . . . . . . . . . . . . . . . . . . . . . . . . . . . . Typha spp.
Animals Wood duck . . . . . . . . . . . . . . . . . . . . . . . . . . . . . . . . . . . . . Aix sponsa Northern pintail . . . . . . . . . . . . . . . . . . . . . . . . . . . . . . . . . . Anas acuta American wigeon . . . . . . . . . . . . . . . . . . . . . . . . . . . . . . . . . . Anas americana Northern shoveler . . . . . . . . . . . . . . . . . . . . . . . . . . . . . . . . . Anas clypeata Blue-winged teal . . . . . . . . . . . . . . . . . . . . . . . . . . . . . . . . . . Anas discors Mallard . . . . . . . . . . . . . . . . . . . . . . . . . . . . . . . . . . . . . . . Anas platyrhynchos American black duck . . . . . . . . . . . . . . . . . . . . . . . . . . . . . . . . Anas rubripes Gadwall . . . . . . . . . . . . . . . . . . . . . . . . . . . . . . . . . . . . . . . Anas strepera Lesser scaup . . . . . . . . . . . . . . . . . . . . . . . . . . . . . . . . . . . . Aythya affinis Redhead . . . . . . . . . . . . . . . . . . . . . . . . . . . . . . . . . . . . . . . Aythya americana Canvasback . . . . . . . . . . . . . . . . . . . . . . . . . . . . . . . . . . . . . Aythya valisineria Canada goose . . . . . . . . . . . . . . . . . . . . . . . . . . . . . . . . . . . . Branta canadensis Common goldeneye . . . . . . . . . . . . . . . . . . . . . . . . . . . . . . . . . Bucephala clangula Ruddy duck . . . . . . . . . . . . . . . . . . . . . . . . . . . . . . . . . . . . . Oxyura jamaicensis
����������������������������������������
������������������������� ���������������������������� ����������������� •• � ����
6 Fish and Wildlife Leaflet 13.4.4. •• 1990

W A T E R F O W L M A N A G E M E N T H A N D B O O K
13.4.5. A Technique for Estimating Seed Production of Common Moist-soil Plants
Murray Laubhan Gaylord Memorial Laboratory The School of Natural Resources University of Missouri—Columbia Puxico, MO 63960
Seeds of native herbaceous vegetation adapted to germination in hydric soils (i.e., moist-soil plants) provide waterfowl with nutritional resources including essential amino acids, vitamins, and minerals that occur only in small amounts or are absent in other foods. These elements are essential for waterfowl to successfully complete aspects of the annual cycle such as molt and reproduction. Moist-soil vegetation also has the advantages of consistent production of foods across years with varying water availability, low management costs, high tolerance to diverse environmental conditions, and low deterioration rates of seeds after flooding.
The amount of seed produced differs among plant species and varies annually depending on environmental conditions and management practices. Further, many moist-soil impoundments contain diverse vegetation, and seed production by a particular plant species usually is not uniform across an entire unit. Consequently, estimating total seed production within an impoundment is extremely difficult.
The chemical composition of seeds also varies among plant species. For example, beggartick seeds contain high amounts of protein but only an intermediate amount of minerals. In contrast,
Fish and Wildlife Leaflet 13.4.5. •• 1992
barnyardgrass is a good source of minerals but is low in protein. Because of these differences, it is necessary to know the amount of seed produced by each plant species if the nutritional resources provided in an impoundment are to be estimated.
The following technique for estimating seed production takes into account the variation resulting from different environmental conditions and management practices as well as differences in the amount of seed produced by various plant species. The technique was developed to provide resource managers with the ability to make quick and reliable estimates of seed production. Although on-site information must be collected, the amount of field time required is small (i.e., about 1 min per sample); sampling normally is accomplished on an area within a few days. Estimates of seed production derived with this technique are used, in combination with other available information, to determine the potential number of waterfowl use-days available and to evaluate the effects of various management strategies on a particular site.
Technique for Estimating Seed Production
To estimate seed production reliably, the method must account for variation in the average amount of seed produced by different moist-soil species. For example, the amount of seed produced by a single barnyardgrass plant outweighs the seed produced by an average panic grass plant. Such
1

differences prevent the use of a generic method to determine seed production because many species normally occur in a sampling unit.
My technique consists of a series of regression equations designed specifically for single plant species or groups of two plant species closely related with regard to seed head structure and plant height (Table 1). Each equation was developed from data collected on wetland areas in the Upper Mississippi alluvial and Rio Grande valleys. The regression equations should be applicable throughout the range of each species because the physical growth form of each species (i.e., seed head geometry) remains constant. As a result, differences in seed production occur because of changes in plant density, seed head size, and plant height, but not because of the general shape of the seed head. This argument is supported by the fact that the weight of seed samples collected in the Rio Grande and Upper Mississippi valleys could be estimated with the same equation.
Estimating seed production requires collecting the appropriate information for each plant species and applying the correct equations. The equations provide estimates in units of grams per 0.0625 m2; however, estimates can readily be converted to
pounds per acre by using a conversion factor of 142.74 (i.e., grams per 0.0625-m2 × 142.74 = pounds per acre). Computer software developed for this technique also converts grams per square meter to pounds per acre.
Collection of Field Data
Measurements Required Plant species Seed heads (number) Average seed head height (cm) Average seed head diameter (cm) Average plant height (m)
Equipment Required Meter stick Square sampling frame (Fig. 1) Clipboard with paper and pencil (or field computer)
Method of Sampling 1. Place sampling frame in position. Include only
those plants that are rooted within the sampling frame.
Table 1. Regression equations for estimating seed production of eleven common moist-soil plants.
Measurementa
group Plant
species Regression equationbc
(weight in grams per 0.0625 m2) Coefficient of
determination (R2)
Grass Barnyardgrassd (HT × 3.67855) + (0.000696 × VOL)e 0.89
Crabgrass (0.02798 × HEADS) 0.88
Foxtailf (0.03289 × VOL)g 0.93 Fall panicum (0.36369 × HT) + (0.01107 × HEADS) 0.93 Rice cutgrass (0.2814 × HEADS) 0.92
Sprangletop (1.4432 × HT) + (0.00027 × VOL)e 0.92 Sedge
Annual sedge (2.00187 × HT) + (0.01456 × HEADS) 0.79 Chufa (0.00208 × VOL)h 0.86
Redroot flatsedge (3.08247 × HEADS) + (2.38866 × HD) − (3.40976 × HL) 0.89
Smartweed Ladysthumb/water smartweed (0.10673 × HEADS) 0.96
Water pepper (0.484328 × HT) + (0.0033 × VOL)g 0.96
a Refer to Fig. 3 for directions on measuring seed heads.b HT = plant height (m); HEADS = number of seed heads in sample frame; HL = height of representative seed head (cm); HD = diameter of
representative seed head (cm); VOL = volume (cm3).c Conversion factor to pounds per acre is: grams per 0.0625 m2 × 142.74. d Echinochloa crusgalli and E. muricata. e VOL (based on geometry of cone) calculated as: (HEADS) × (πr2h/3); π = 3.1416, r = HD/2, h = HL. f Setaria spp.g VOL (based on geometry of cylinder) calculated as: (HEADS) × (πr2h); π = 3.1416, r = HD/2, h = HL.hVOL (based on geometry of half sphere) calculated as: (HEADS) × (1.33πr3/2); π = 3.1416, r = HD/2.
2 Fish and Wildlife Leaflet 13.4.5. •• 1992

Fig. 1. Sampling frame design.
2. Record plant species present within sample frame on data form (Fig. 2).
3. For each plant species, record the number of seed heads within the sample frame. All seed heads occurring within an imaginary column formed by the sample frame should be counted.
4. For each plant species, select a single representative plant and measure a.the straightened height of the entire plant
(from the ground to the top of the tallest plant structure) in meters,
b.the number of seed heads within the sample frame,
c.the height of the seed head in centimeters (measure along the rachis [i.e., main stem of flower] from the lowest rachilla [i.e., secondary stem of flower] to the top of the straightened seed head [Fig. 3].), and
d.the diameter (a horizontal plane) of the seed head in centimeters (measure along the lowest seed-producing rachilla [Fig 3].).
Although average values calculated by measuring every plant within the sample frame would be more accurate, the time required to collect a sample would increase greatly. In
Fish and Wildlife Leaflet 13.4.5. •• 1992
contrast, obtaining measurements from a single representative plant allows a larger number of samples to be collected per unit time. This method also permits sampling across a greater portion of the unit, which provides results that are more representative of seed production in an entire unit.
Suggested Sampling Schemes
There are two basic approaches to estimating seed production within an impoundment. Both methods should supply similar results in most instances. The choice of method will depend largely on physical attributes of the impoundment and management strategies that determine the diversity and distribution of vegetation.
First approach: Sample across entire unit. The most direct procedure of estimating seed production is to collect samples across an entire unit using the centric systematic area sample design (Fig. 4). This method is recommended when vegetation types are distributed randomly across the entire impoundment (e.g., rice cutgrass and smartweed occur together across the entire
Plot Plant Height Seed heads Seed head Seed head Number species (m) (no.) height (cm) diameter (cm)
1
2
3
4
5
6
Fig. 2. Sample data form for collecting information necessary to estimate seed production.
3
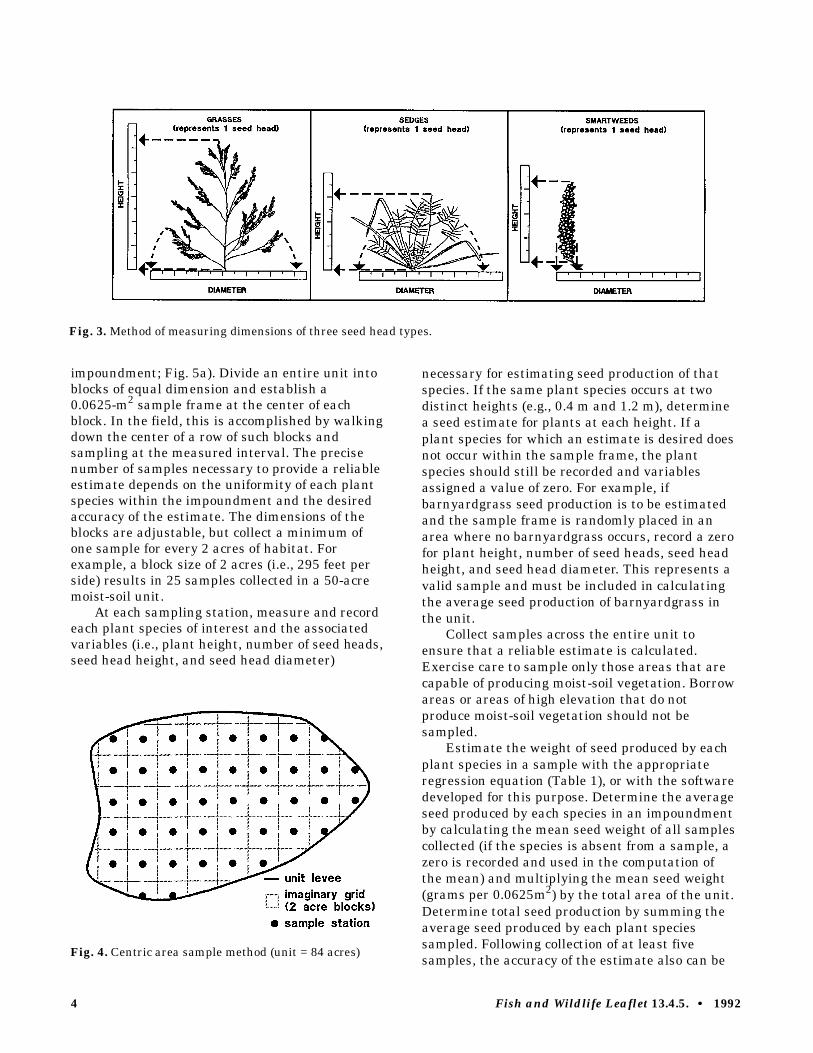
Fig. 3. Method of measuring dimensions of three seed head types.
impoundment; Fig. 5a). Divide an entire unit into blocks of equal dimension and establish a 0.0625-m2 sample frame at the center of each block. In the field, this is accomplished by walking down the center of a row of such blocks and sampling at the measured interval. The precise number of samples necessary to provide a reliable estimate depends on the uniformity of each plant species within the impoundment and the desired accuracy of the estimate. The dimensions of the blocks are adjustable, but collect a minimum of one sample for every 2 acres of habitat. For example, a block size of 2 acres (i.e., 295 feet per side) results in 25 samples collected in a 50-acre moist-soil unit.
At each sampling station, measure and record each plant species of interest and the associated variables (i.e., plant height, number of seed heads, seed head height, and seed head diameter)
Fig. 4. Centric area sample method (unit = 84 acres)
necessary for estimating seed production of that species. If the same plant species occurs at two distinct heights (e.g., 0.4 m and 1.2 m), determine a seed estimate for plants at each height. If a plant species for which an estimate is desired does not occur within the sample frame, the plant species should still be recorded and variables assigned a value of zero. For example, if barnyardgrass seed production is to be estimated and the sample frame is randomly placed in an area where no barnyardgrass occurs, record a zero for plant height, number of seed heads, seed head height, and seed head diameter. This represents a valid sample and must be included in calculating the average seed production of barnyardgrass in the unit.
Collect samples across the entire unit to ensure that a reliable estimate is calculated. Exercise care to sample only those areas that are capable of producing moist-soil vegetation. Borrow areas or areas of high elevation that do not produce moist-soil vegetation should not be sampled.
Estimate the weight of seed produced by each plant species in a sample with the appropriate regression equation (Table 1), or with the software developed for this purpose. Determine the average seed produced by each species in an impoundment by calculating the mean seed weight of all samples collected (if the species is absent from a sample, a zero is recorded and used in the computation of the mean) and multiplying the mean seed weight (grams per 0.0625m2) by the total area of the unit. Determine total seed production by summing the average seed produced by each plant species sampled. Following collection of at least five samples, the accuracy of the estimate also can be
Fish and Wildlife Leaflet 13.4.5. •• 1992 4

Fig. 5. Two general types of vegetation distribution.
determined. If higher accuracy is desired, collect additional samples by reducing the block size the appropriate amount or by randomly collecting additional samples.
Second approach: Sample within vegetation zones of a unit. This method is recommended for use in impoundments when species or groups of plants occur in distinct and nonoverlapping zones within a unit (e.g., smartweeds only occur at low elevations and barnyardgrass only occurs at higher elevations within the same unit; Fig. 5b). The same general methodology previously outlined for sampling an entire unit applies to this sampling scheme, except that
1. the centric area sampling method is applied separately to each vegetation zone within an impoundment,
2. seed production of an individual plant species over the entire unit is determined by multiplying the average seed production (based only on the samples collected within that zone) by the acreage of the zone sampled,
3. total seed production within a zone is calculated by summing the seed production estimates of each plant species occurring within that zone, and
4. total seed production across the entire impoundment is calculated by summing the seed production estimates of all zones composing the unit. If this sampling scheme is used, a cover map delineating vegetation zones is useful for calculating the acreage of zones sampled.
Fish and Wildlife Leaflet 13.4.5. •• 1992
When to Collect Field Data
Samples must be collected when vegetation has matured and seed heads are fully formed because the regression equation for each plant species is based on seed head dimensions and plant height. Timing of sampling varies across latitudes because of differences in growing season length and maturation times of plant species. Information can be collected before the after-ripening of seeds (i.e., seed heads completely formed but seeds not mature) because seed head dimensions will not change appreciably. Information also can be collected following seed drop because seed head dimensions can be determined based on the geometry of the remaining flower parts (i.e., rachis and rachilla). This allows a greater time span for collecting information. If timed correctly, estimates for most moist-soil plants can be determined during the same sampling period.
Under certain conditions, two crops of moist-soil seeds can be produced within the same unit in a single year. Often, the second crop will be composed of plant species different from those composing the first crop. If this occurs, estimating total seed production requires sampling both first-and second-crop vegetation, even if the species composition of the second seed crop is similar to the first crop. Estimates based on the first crop cannot be applied to the second crop because seed head dimensions will be different.
Determining Required Sample Size
The number of samples necessary to estimate seed production will depend on the level of accuracy desired. Although as few as three samples will provide a mean value of seed production and an estimate of the variability within the unit, this type of estimate normally is unreliable. The most important factors influencing accuracy include the degree of uniformity in plant distribution and the species of plant sampled.
Plant distribution affects accuracy if the density of a plant species varies widely within the area sampled. Potential factors influencing changes in plant density include differential hydrology, use of spot mechanical treatments, and changes in soil type. Often, these factors can be controlled by selecting the appropriate sampling scheme. In addition, seed
5

production by perennials that propagate by tubers tends to be more variable and, therefore, a larger number of samples may be required.
Following collection of at least five samples in a unit, the standard deviation (SD) can be calculated with the equation SD = (s2)1/2. The sample variance (s2) is estimated with the formula
n _s2=(∑ xi − x)2/n−1, where xi = seed estimate of
i = 1 _ sample i, x = average seed weight of all samples, and n = number of samples collected. The standard deviation indicates the degree of variation in seed weight and is, therefore, a measure of precision (see example)—the larger the SD, the lower the precision of the estimate.
The number of samples necessary to achieve a specified level of precision (95% confidence interval) can be calculated with the formula n = 4s2/L2, where s2 = sample variance and L = allowable error (± pounds per acre). The sample variance (s2) can be estimated from previous experience or calculated based on preliminary sampling. Because seed production varies among plant species and units, sample variance should be determined independently for individual plant species and units. Numerous environmental factors influence seed production on a particular site. Therefore, sample variance should be calculated annually for each site. A subjective decision must be made concerning how large an error (L) can be tolerated. This decision should be based on how the seed production estimate is to be used. For example, an L of ± 100 pounds per acre would be acceptable for determining the number of waterfowl use-days available. In other cases, a larger error might be acceptable. As the allowable error increases, the number of samples required decreases.
Estimating Seed Production
Although the technique is simple to use, several important factors must be considered to obtain accurate estimates of seed weight. The following example illustrates the process of making these decisions. In addition, the process of computing estimates using the regression equations demonstrates the correct manner of using field data to arrive at valid estimates.
1. Unit considerations—unit size is 10 acres. Vegetation consists of barnyardgrass distributed uniformly across the entire unit.
2. Sampling strategy—use a centric area sampling method with a maximum recommended block size of 2 acres to establish the location of five sample areas uniformly across the unit.
3. Data collection—at each plot, select a representative barnyardgrass plant within the sample frame and record the necessary information (Table 2).
4. Estimate seed production—for each sample, use the appropriate equation to determine the estimated seed weight. In this example, only the barnyardgrass equation is required (Table 3).
5. Maximum allowable error—in this example, an L of ± 100 pounds per acre is used for barnyardgrass. The standard deviation is then calculated to determine the precision of the estimate. If the standard deviation is less than the allowable error, no additional samples must be collected. However, if the standard deviation is greater than the allowable error, the estimated number of additional samples that must be collected is calculated.
•• Allowable error = L = ± 100 pounds per acre
•• Number of samples collected = n = 5
•• Weight of individual samples (pounds per acre) = xi = 982; 1,119; 871; 1,124; 1,237
_ •• Average weight of samples (pounds per acre) = x
= 982 + 1,119 + 871 + 1,124 + 1,237 / 5 = 5,333 / 5 = 1,066.6 or 1,067
_2•• Variance = s = Σ(xi − x)2/n−1
= (982 − 1,067)2 + (1,119 − 1,067)2 + (871 − 1,067)2
+ (1,124 − 1,067)2 + (1,237 − 1,067)2 / 5 − 1 = (−85)2 + (52)2 + (−196)2 + (57)2 + (170)2 / 4 = 7,225 + 2,704 + 38,416 + 3,249 + 28,900 / 4 = 80,494 / 4 = 20,123.5 or 20,124 pounds per acre
2)1/2•• Standard deviation = s = (s
= 20,1241/2
= 141.8 or 142 pounds per acre Based on these computations, an estimated
average weight of 1,067 ± 142 pounds per acre (i.e., 925−1,209 pounds per acre) of barnyardgrass seed was produced. However, the standard deviation (142 pounds per acre) is greater than the allowable error (100 pounds per acre), indicating that additional samples must be collected to obtain an average seed weight value that is within the acceptable limits of error.
6 Fish and Wildlife Leaflet 13.4.5. •• 1992

Table 2. Sample data sheet for estimating seed production.
Plot Plant Height Seed heads Seed head Seed head species (m) (number) height (cm) diameter (cm)
Initial samples 1 Barnyardgrass 1.1 12 16 9 2 Barnyardgrass 1.1 13 16 10 3 Barnyardgrass 1.1 11 16 8 4 Barnyardgrass 1.1 14 15 10 5 Barnyardgrass 1.2 9 18 12
Additional samples 6 Barnyardgrass 1.1 12 16 10 7 Barnyardgrass 0.9 15 17 9 8 Barnyardgrass 0.9 14 17 10
Table 3. Estimating seed weight of individual samples.
Regression Estimated weight Plant species equationa Plot (grams per 0.0625-m2) (pounds per acre)
Initial samples Barnyardgrass (HT × 3.67855) 1 6.88b 982 c
+ (0.000696 × VOL) 2 7.84 1,119 3 6.10 871 4 7.88 1,124 5 8.67 1,237
Additional samples 6 7.55 1,077 7 7.08 1,010 8 7.65 1,092
a HT = plant height (m); HEADS = number of seed heads in sample frame; HL = height of representative seed head (cm); HD = diameter of representative seed head (cm); VOL = volume (based on geometry of cone) calculated as: (HEADS) × (πr2h/3); π = 3.1416, r = HD/2, h = HL.
b Weight (grams per 0.0625-m2) = (HT × 3.67855) + (0.000696 × VOL) = (1.1 × 3.67855) + (0.000696 × 4081.6) = 4.0464 + 2.8408 = 6.88 VOL = (HEADS) × (πr2h/3); π = 3.1416, r = 9/2 = 4.5, r2 = 20.3, h = 16 = (12) × (3.1416 × 20.3 × 16/3) = (12) × (340.131) = 4081.6
c Conversion from grams per 0.0625-m2 to pounds per acre: 6.88 × 142.74 = 982.
_ Total number of samples required = 4s2/L2 seed weight (x) is 1,064 pounds per acre, and = (4 × 20,124) / (100)2 the standard deviation (s) is 110 pounds per = 80,496 / 10,000 acre. = 8 7. Estimating total seed production—after Additional samples required = total samples collecting a sufficient number of samples of
required − samples collected each species to obtain an average seed = 8 − 5 estimate with a standard deviation less than = 3 the maximum allowable error, estimate total
Based on these calculations, three additional seed production. An estimate of seed produced samples must be collected. by each species is determined by computing 6. Additional samples—collect additional samples the average seed weight of that species in
at random locations (Tables 3 and 4). Following all samples collected and multiplying this collection of data, the average seed weight and value by the area sampled. Total seed standard deviation of samples must be production is estimated by summing seed recalculated using the equations in Step 5. If produced by each species. In this example the accompanying software is used, these only barnyardgrass was sampled. Therefore, calculations are performed automatically. In total seed produced is equivalent to this example, the revised estimate of average barnyardgrass seed produced.
Fish and Wildlife Leaflet 13.4.5. •• 1992 7

Barnyardgrass seed produced = average seed weight × area sampled
= 1,064 (± 110) pounds per acre × 10 acres = 10,640 ± 1,100 pounds in unit.
Computer Software
Computer software is available for performing the mathematical computations necessary to estimate seed weight. The program is written in Turbo Pascal and can be operated on computers with a minimum of 256K memory. The program computes the estimated seed weight of individual plant species collected at each sample location and displays this information following entry of each sample. In addition, a summary screen displays estimates of average and total seed produced in an impoundment as well as the standard deviation of
the estimate. This information is automatically stored in a file that can be printed or saved on a disk. A copy of the program is available upon request. Instructions pertaining to the use of the program are obtained by accessing the README file on the program diskette.
Suggested Reading Fredrickson, L. H., and T. S. Taylor. 1982. Management
of seasonally flooded impoundments for wildlife. U.S. Fish and Wildlife Service Resource Publication 148, Washington, D.C. 29 pp.
Reinecke, K. J., R. M. Kaminski, D. J. Moorehead, J. D. Hodges, and J. R. Nassar. 1989. Mississippi alluvial valley. Pages 203–247 in L. M. Smith, R. L. Pederson, and R. M. Kaminski, editors. Habitat management for migrating and wintering waterfowl in North America. Texas Tech University Press, Lubbock.
Appendix. Common and Scientific Names of Plants Named in Text.
Annual sedge . . . . . . . . . . . . . . . . . . . . . . . . . . . . . . . . . . . . . . . . . . . Cyperus iria Barnyardgrass . . . . . . . . . . . . . . . . . . . . . . . . . . . . . . . . . . . . . Echinochloa crusgalli Barnyardgrass . . . . . . . . . . . . . . . . . . . . . . . . . . . . . . . . . . . . . Echinochloa muricata Beggarticks . . . . . . . . . . . . . . . . . . . . . . . . . . . . . . . . . . . . . . . . . . . . . Bidens spp. Chufa . . . . . . . . . . . . . . . . . . . . . . . . . . . . . . . . . . . . . . . . . . . . Cyperus esculentus Crabgrass . . . . . . . . . . . . . . . . . . . . . . . . . . . . . . . . . . . . . . . . . . . . Digitaria spp. Fall panicum . . . . . . . . . . . . . . . . . . . . . . . . . . . . . . . . . . . . Panicum dichotomiflorum Foxtail . . . . . . . . . . . . . . . . . . . . . . . . . . . . . . . . . . . . . . . . . . . . . . . Setaria spp. Ladysthumb smartweed . . . . . . . . . . . . . . . . . . . . . . . . . . . . . . Polygonum lapathifolium Redroot flatsedge . . . . . . . . . . . . . . . . . . . . . . . . . . . . . . . . . . . . Cyperus erythrorhizos Rice cutgrass . . . . . . . . . . . . . . . . . . . . . . . . . . . . . . . . . . . . . . . . Leersia oryzoides Sprangletop . . . . . . . . . . . . . . . . . . . . . . . . . . . . . . . . . . . . . . . Leptochloa filiformis Water pepper . . . . . . . . . . . . . . . . . . . . . . . . . . . . . . . . . . . . . . Polygonum hydropiper Water smartweed . . . . . . . . . . . . . . . . . . . . . . . . . . . . . . . . . . . . Polygonum coccineum
Note: Use of trade names does not imply U.S. Government endorsement of commercial products.
UNITED STATES DEPARTMENT OF THE INTERIOR FISH AND WILDLIFE SERVICE
Fish and Wildlife Leaflet 13 Washington, D.C. •• 1992
8

W A T E R F O W L M A N A G E M E N T H A N D B O O K
13.4.6. Strategies for Water Level Manipulations in Moist-soil Systems
Leigh H. Fredrickson Gaylord Memorial Laboratory The School of Natural Resources University of Missouri–Columbia Puxico, MO 63960
Water level manipulations are one of the most effective tools in wetland management, provided fluctuations are well-timed and controlled. Manipulations are most effective on sites with (1) a dependable water supply, (2) an elevation gradient that permits complete water coverage at desired depths over a majority of the site, and (3) the proper type of water control structures that enable water to be supplied, distributed, and discharged effectively at desired rates. The size and location of structures are important, but timing, speed, and duration of drawdowns and flooding also have important effects on plant composition, plant production, and avian use. When optimum conditions are not present, effective moist-soil management is still possible, but limitations must be recognized. Such situations present special problems and require particularly astute and timely water level manipulations. For example, sometimes complete drainage is not possible, yet water is usually available for fall flooding. In such situations, management can capitalize on evapotranspiration during most growing seasons to promote the germination of valuable moist-soil plants.
Fish and Wildlife Leaflet 13.4.6. •• 1991
Timing of Drawdowns Drawdowns often are described in general
terms such as early, midseason, or late. Obviously, calendar dates for a drawdown classed as early differ with both latitude and altitude. Thus the terms early, midseason, and late should be considered within the context of the length of the local growing season. Information on frost-free days or the average length of the growing season usually is available from agricultural extension specialists. Horticulturists often use maps depicting different zones of growing conditions (Fig. 1). Although not specifically developed for wetland management, these maps provide general guidelines for estimating an average growing season at a particular site.
In portions of the United States that have a growing season longer than 160 days, drawdowns normally are described as early, midseason, or late. In contrast, when the growing season is shorter than 140 days, drawdown dates are better described as either early or late. Early drawdowns are those that occur during the first 45 days of the growing season, whereas late drawdowns occur in the latter 90 days of the growing season. For example, the growing season extends from mid-April to late October (200 days) in southeastern Missouri. In this area, early drawdowns occur until 15 May, midseason drawdowns occur between 15 May and 1 July, and late drawdowns occur after 1 July (Table 1). The
1

Fewer than 160 days
160–200 days
200–280 days
220–240 days
240–280 days
More than 280 days
Fig. 1. Zones depicting general differences in the length of the growing season.
correct terminology for drawdown date can be determined for each area using these rules of thumb.
Moist-soil Vegetation
The timing of a drawdown has an important influence on the composition and production of moist-soil plants. Although the importance of specific factors resulting in these differences has not been well studied for moist-soil vegetation, factors such as seed banks, soil types, soil temperatures, soil moisture levels, soil–water salinities, day length, and residual herbicides undoubtedly influence the composition of developing vegetation.
Water manipulations will be effective and economical only if the site has been properly designed and developed (Table 2). Levees, type and dependability of water source (e.g., ground water,
river, reservoir), type and placement of water control structures, water supply and drainage systems, and landform are among the most important elements that must be considered. Independent control and timing of water supply, distribution, depth, and discharge within and among units are essential (Table 2).
An independent water supply for each unit is required to optimize food production, maintain the potential to control problem vegetation, and make food resources available for wildlife (Table 2). Optimum management also requires that each unit have the capability of independent discharge. Stoplog water control structures that permit water level manipulations as small as 2 inches provide a level of fine tuning that facilitates control of problem vegetation or enhancement of desirable vegetation.
Table 1. Environmental conditions associated with time of drawdown in southeastern Missouri.
Date Temperature Rainfall Evapotranspiration
Early 1 April–15 May Moderate High Low Mid 15 May–1 July Moderate–High Moderate Moderate Late 1 July or later High Low High
2 Fish and Wildlife Leaflet 13.4.6. •• 1991

Table 2. Important considerations in evaluating wetland management potential.
Factors Optimum condition
Water supply Independent supply into each unit Water supply enters at highest
elevation
Water discharge Independent discharge from each unit Discharge at lowest elevation for complete drainage Floor of control structure set at cor
rect elevation for complete drainage
Water control Stoplog structure allowing 2-inch changes in water levels Adequate capacity to handle storm events
Optimum unit 5 to 100 acres size
Optimum num- At least 5 within a 10-mile radius of ber of units units
Wetland systems with high salinities can easily accumulate soil salts that affect plant vigor and species composition. Wetland unit configurations that allow flushing of salts by flowing sheet water across the gradient of a unit are essential in such areas. A fully functional discharge system is a necessity in arid environments to move water with high levels of dissolved salts away from intensively managed basins. Thus, successful management in arid environments requires units with an independent water supply and independent discharge as well as precise water-level control.
Scheduling Drawdowns
During most years, early and midseason drawdowns result in the greatest quantity of seeds produced (Table 3). However, there are exceptions, and in some cases, late drawdowns are very successful in stimulating seed production.
Table 3. Response of common moist-soil plants to drawdown date.
Family Common name Species
Scientific name Drawdown date
Earlya Midseasonb Latec
Grass Swamp timothy Rice cutgrass Sprangletop Crabgrass Panic grass Wild millet Wild millet Wild millet
Heleochloa schoenoides Leersia oryzoides Leptochloa sp. Digitaria sp. Panicum sp. Echinochloa crusgalli var. frumentacea Echinochloa walteri Echinochloa muricata
+d
+++
+++ + +
+++ + +
+++ +++
+ +++ +++
+
+++ +++
++ +
++ +
Sedge Red-rooted sedge Chufa Spikerush
Cyperus erythrorhizos Cyperus esculentus Eleocharis spp.
+++ +++
++ + + +
Buckwheat Pennsylvania smartweed Curltop ladysthumb Dock
Polygonum pensylvanicum Polygonum lapathifolium Rumex spp.
+++ +++
+++ +
Pea Sweetclover Sesbania
Melilotus sp. Sesbania exalta
+++ + ++
Composite Cocklebur Beggarticks Aster
Xanthium strumarium Bidens spp. Aster spp.
++ +
+++
+++ +++
++
++ +++
+
Loosestrife Purple loosestrife Toothcup
Lythrum salicaria Ammania coccinea
++ +
++ ++
+ ++
Morning glory Morning glory Ipomoea spp. ++ ++
Goosefoot Fat hen Atriplex spp. a Drawdown completed within the first 45 days of the growing season.b Drawdown after first 45 days of growing season and before 1 July. c Drawdown after 1 July.d + = fair response; ++ = moderate response; +++ = excellent response.
+++ ++
Fish and Wildlife Leaflet 13.4.6. •• 1991 3

In areas characterized by summer droughts, early drawdowns often result in good germination and newly established plants have time to establish adequate root systems before dry summer weather predominates. As a result, early drawdowns minimize plant mortality during the dry period. Growth is often slowed or halted during summer, but when typical late growing-season rains occur, plants often respond with renewed growth and good seed production. In contrast, midseason drawdowns conducted under similar environmental conditions often result in good germination, but poor root establishment. The ultimate result is high plant mortality or permanent stunting. If the capability for irrigation exists, the potential for good seed production following midseason or late drawdowns is enhanced.
Germination of each species or group of species is dependent on certain environmental conditions including soil temperature and moisture. These conditions change constantly and determine the timing and density of germination (Table 3). Smartweeds tend to respond best to early drawdowns, whereas sprangletop response is best following late drawdowns. Some species are capable of germination under a rather wide range of environmental conditions; thus, control of their establishment can be difficult. Classification of an entire genera into a certain germination response category often is misleading and inappropriate. For
example, variation exists among members of the millet group (Echinochloa spp.). Echinochloa frumentacea germinates early, whereas E. muricata germinates late because of differences in soil temperature requirements. Such variation among members of the same genus indicates the need to identify plants to the species level.
Natural systems have flooding regimes that differ among seasons and years. Repetitive manipulations scheduled for specific calendar dates year after year often are associated with declining productivity. Management assuring good production over many years requires variability in drawdown and flooding dates among years. See Fish and Wildlife Leaflet 13.2.1 for an example of how drawdown dates might be varied among years.
Wildlife Use
Drawdowns serve as an important tool to attract a diversity of foraging birds to sites with abundant food resources. Drawdowns increase food availability by concentrating foods in smaller areas and at water depths within the foraging range of target wildlife. A general pattern commonly associated with drawdowns is an initial use by species adapted to exploiting resources in deeper water. As dewatering continues, these “deep water” species are gradually replaced by those that are adapted to exploit foods in
Wat
er D
epth
(cm
)
35
30
25
20
15
10
5
0
Water D
epth
(inch
es)
14
12
10
8
6
4
2
0
Am
eric
an c
oo
t
No
rth
ern
sh
ove
ler
No
rth
ern
pin
tail
B
lue-
win
ged
tea
l
Gre
en-w
ing
ed t
eal
Gre
at b
lue
her
on
Wils
on
’s p
hal
aro
pe
Mal
lard
Lit
tle
blu
e h
ero
n
Yel
low
-cro
wn
ed n
igh
t-h
ero
n
L
on
g-b
illed
do
wit
cher
Can
ada
go
ose
Gre
ater
yel
low
leg
s
Les
ser
yello
wle
gs
Am
eric
an b
itte
rn
Vir
gin
ia r
ail
Pec
tora
l san
dp
iper
Co
mm
on
sn
ipe
Fig. 2. Preferred water depths for wetland birds commonly associated with moist-soil habitats.
4 Fish and Wildlife Leaflet 13.4.6. •• 1991

shallower water (Fig. 2). The most effective use of invertebrate foods by wetland birds occurs when drawdowns to promote plant growth are scheduled to match key periods of migratory movement in spring. By varying drawdown dates among units, the productivity of each unit can be maintained and resources can be provided for longer periods. Slow drawdowns also prolong use by a greater number and diversity of wetland wildlife.
Effects of Drawdown Rate
Moist-soil Plant Production
Fast Drawdowns
Sometimes fast drawdowns (1–3 days) are warranted, especially in systems with brackish or saline waters where the slow removal of water may increase the level of soil salts. However, in most locations fast drawdowns should only be scheduled early in the season or when flood irrigation is possible. Rapid drawdowns that coincide with conditions of high temperature and little rainfall during the growing season create soil moisture conditions that often result in poor moist-soil responses (Table 4). Some germination may occur, but generally development of root systems is inadequate to assure that these newly established plants survive during summer drought. Thus, at latitudes south of St. Louis, fast drawdowns are never recommended after 15 June if irrigation is not possible.
Slow Drawdowns
Slow drawdowns (2–3 weeks) usually are more desirable for plant establishment and wildlife use. The prolonged period of soil saturation associated with slow drawdowns creates conditions favorable for moist-soil plant germination and establishment (Table 4). For example, slow drawdowns late in the growing season can result in seed yields of 700 pounds per acre. Rapid drawdowns on adjacent units subject to identical weather conditions have resulted in 50 pounds per acre. Furthermore, slow drawdowns provide shallow water over a longer period, ensuring optimum foraging conditions for wildlife. If salinities tend to be high, slow drawdowns should only be scheduled during winter or early in the season when ambient temperatures and evapotranspiration are low.
Table 4. Comparison of plant, invertebrate, bird, and abiotic responses to rate and date of drawdown among wet and dry years.
Drawdown rate Fasta Slowb
Plants Germination
Period of ideal conditions short long
Root development Wet year good excellent Dry year poor excellent
Seed production Early season good excellent Mid–late season not excellent
recommended Wet year good good Drought year poor good
Cocklebur production great reduced potential potential
Invertebrates Availability
Early season good excellent Mid–late season poor good
Period of availability short long
Bird use Early season good excellent Mid–late season poor good
Nutrient export high low
Reducing soil good poor salinities
a Less than 4 days.b Greater than 2 weeks.
Invertebrate Availability in Relation to Drawdowns
When water is discharged slowly from a unit, invertebrates are trapped and become readily available to foraging birds along the soil–water interface or in shallow water zones (Table 4). These invertebrates provide the critical protein-rich food resources required by pre-breeding and breeding female ducks, newly hatched waterfowl, molting ducks, and shorebirds. Shallow water for foraging is required by the vast majority of species; e.g., only 5 of 54 species that commonly use moist-soil impoundments in Missouri can forage effectively in water greater than 10 inches. Slow drawdowns lengthen the period for optimum foraging and put a large portion of the invertebrates within the foraging ranges of many species. See Fish and Wildlife Leaflet 13.3.3 for a description of common invertebrates in wetlands.
Fish and Wildlife Leaflet 13.4.6. •• 1991 5

Spring Habitat Use by Birds
Slow drawdowns are always recommended to enhance the duration and diversity of bird use (Table 4). Creating a situation in which the optimum foraging depths are available for the longest period provides for the efficient use of food resources, particularly invertebrate resources supplying proteinaceous foods. Partial drawdowns well in advance of the growing season (late winter) tend to benefit early migrating waterfowl, especially mallards and pintails. Early-spring to mid-spring drawdowns provide resources for late
migrants such as shovelers, teals, rails, and bitterns. Mid- and late-season drawdowns provide food for breeding waders and waterfowl broods. These later drawdowns should be timed to coincide with the peak hatch of water birds and should continue during the early growth of nestlings or early brood development.
Fall Flooding Strategies Scheduling fall flooding should coincide with
the arrival times and population size of fall migrants (Table 5). Sites with a severe disease history should not be flooded until temperatures
Table 5. Water level scenario for target species on three moist-soil impoundments and associated waterbird response.
Unit A Unit B Unit C Water level Water level Water level
Period Scenario Response Scenario Response Scenario Response
Early fall
Mid fall
Late fall
Winter
Late winter
Earlyspring
Dry
Dry
Flood in weekly 2–4inch increments over a 4–6-week period
Maintain flooding belowfull functional capacity
Schedule slow drawdown to match northward movement of migrantwaterfowl
Continued slow drawdown to be completedby 1 May
None
None
Excellent use immediately by mallards and Canada geese
Good use bymallards and Canada geese whenwater is ice free
Excellent use by mallards,pintails,wigeons,and Canada geese
Excellent use by teals,shovelers, shorebirds, and herons
Dry
Flood in weekly 1–2inch increments over a 4-week period
Continued flooding,but not to full functional capacity
Maintain flooding belowfull functional capacity
Schedule slow drawdown to match northward movement of early migrating waterfowl
Drawdown completedby 15 April
None Gradual flooding starting15 daysbefore the peak ofearly fallmigrants;water depthnever over 4 inches
Good use immediately;high use byteal, pintails, and rails within 2 weeks
Excellent use by pintails,gadwalls,and wigeons
Continued floodingthroughSeptember
Excellent use by rails andwaterfowl
Excellent use by mallardsand Canada geese
Continued flooding tofull functional capacity
Good use bymallards and Canada geese
Good use bymallards and Canada geese whenwater is ice free
Continued flooding tofull pool
Good use bymallards and Canada geese whenwater is ice free
Excellent use by mallards,pintails,wigeons,and Canada geese
Schedule slow drawdown to match northward movement of waterfowl
Good use bymallards and Canada geese whenwater is ice free
Excellent shorebird use
Drawdown completedby 15 April
Excellent shorebird use
6 Fish and Wildlife Leaflet 13.4.6. •• 1991
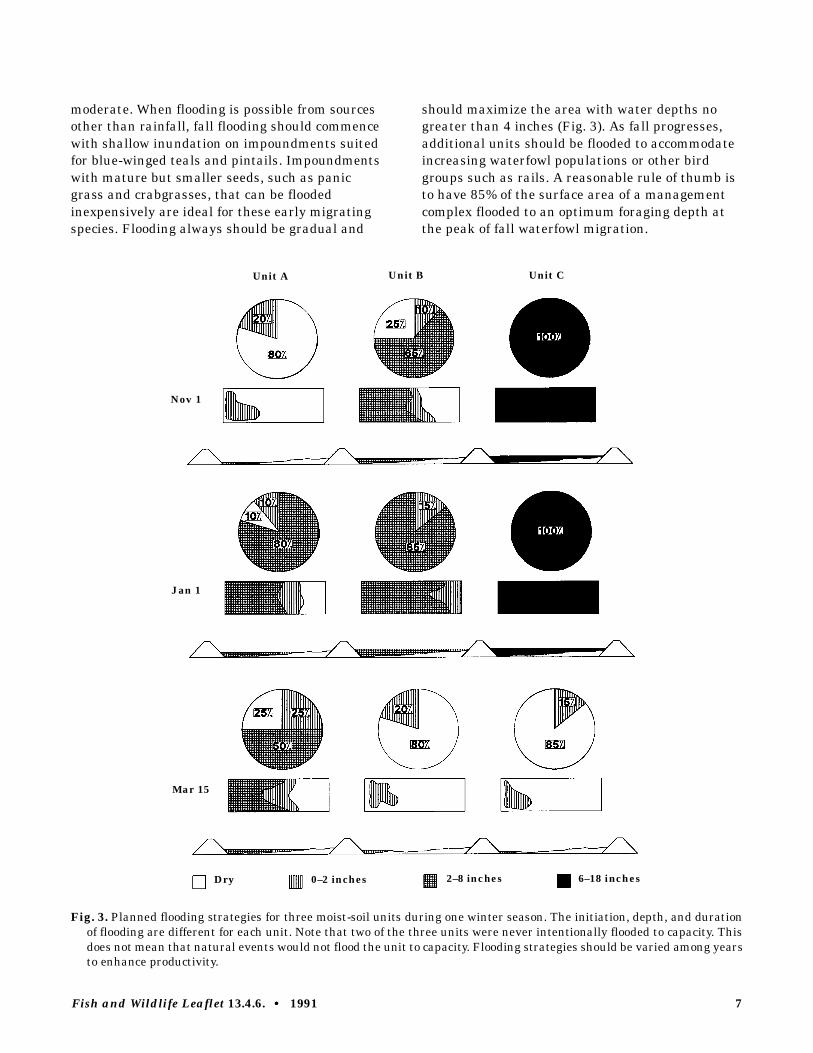
moderate. When flooding is possible from sources other than rainfall, fall flooding should commence with shallow inundation on impoundments suited for blue-winged teals and pintails. Impoundments with mature but smaller seeds, such as panic grass and crabgrasses, that can be flooded inexpensively are ideal for these early migrating species. Flooding always should be gradual and
should maximize the area with water depths no greater than 4 inches (Fig. 3). As fall progresses, additional units should be flooded to accommodate increasing waterfowl populations or other bird groups such as rails. A reasonable rule of thumb is to have 85% of the surface area of a management complex flooded to an optimum foraging depth at the peak of fall waterfowl migration.
Unit A Unit B Unit C
Nov 1
Jan 1
Mar 15
Dry 0–2 inches 2–8 inches 6–18 inches
Fig. 3. Planned flooding strategies for three moist-soil units during one winter season. The initiation, depth, and duration of flooding are different for each unit. Note that two of the three units were never intentionally flooded to capacity. This does not mean that natural events would not flood the unit to capacity. Flooding strategies should be varied among years to enhance productivity.
Fish and Wildlife Leaflet 13.4.6. •• 1991 7

Suggested Reading
Eldridge, J. 1990. Aquatic invertebrates important for waterfowl production. U.S. Fish Wildl. Leafl. 13.3.3. 7 pp.
Fredrickson, L. H., and T. S. Taylor. 1982. Management of seasonally flooded impoundments for wildlife. U.S. Fish Wildl. Serv., Resour. Publ. 148. 29 pp.
Fredrickson, L. H., and F. A. Reid. 1986. Wetland and riparian habitats: a nongame management overview. Pages 59–96 in J. B. Hale, L. B. Best, and R. L. Clawson, eds. Management of nongame wildlife in
the Midwest: a developing art. Northcentral Section, The Wildlife Society, Madison, Wis.
Fredrickson, L. H. and F. A. Reid 1988. Waterfowl use of wetland complexes. U.S. Fish Wildl. Leafl. 13.2.1. 6 pp.
Reid, F. R., J. R. Kelley, Jr., T. S. Taylor, and L. H. Fredrickson. 1989. Upper Mississippi Valley wetlands—refuges and moist-soil impoundments. Pages 181–202 in L. Smith, R. Pederson, and R. Kaminski, eds. Habitat management for migrating and wintering waterfowl in North America. Texas Tech University Press, Lubbock.
Appendix. Common and Scientific Names of Birds Named in Text. Pied-billed grebe . . . . . . . . . . . . . . . . . . . . . . . . . . . . . . Podilymbus podiceps American bittern . . . . . . . . . . . . . . . . . . . . . . . . . . . . . . Botaurus lentiginosus Great blue heron . . . . . . . . . . . . . . . . . . . . . . . . . . . . . . Ardea herodias Little blue heron . . . . . . . . . . . . . . . . . . . . . . . . . . . . . . Egretta caerulea Yellow-crowned night-heron . . . . . . . . . . . . . . . . . . . . . . . . Nycticorax violaceus Tundra swan . . . . . . . . . . . . . . . . . . . . . . . . . . . . . . . . Cygnus columbianus Snow goose . . . . . . . . . . . . . . . . . . . . . . . . . . . . . . . . . Chen caerulescens Canada goose . . . . . . . . . . . . . . . . . . . . . . . . . . . . . . . Branta canadensis Mallard . . . . . . . . . . . . . . . . . . . . . . . . . . . . . . . . . . . Anas platyrhynchos Northern pintail . . . . . . . . . . . . . . . . . . . . . . . . . . . . . . Anas acuta Northern shoveler . . . . . . . . . . . . . . . . . . . . . . . . . . . . . Anas clypeata Blue-winged teal . . . . . . . . . . . . . . . . . . . . . . . . . . . . . . Anas discors Canvasback . . . . . . . . . . . . . . . . . . . . . . . . . . . . . . . . Aythya valisineria Virginia rail . . . . . . . . . . . . . . . . . . . . . . . . . . . . . . . . Rallus limicola American coot . . . . . . . . . . . . . . . . . . . . . . . . . . . . . . . Fulica americana Greater yellowlegs . . . . . . . . . . . . . . . . . . . . . . . . . . . . . Tringa melanoleuca Lesser yellowlegs . . . . . . . . . . . . . . . . . . . . . . . . . . . . . Tringa flavipes Pectoral sandpiper . . . . . . . . . . . . . . . . . . . . . . . . . . . . . Calidris melanotos Long-billed dowitcher . . . . . . . . . . . . . . . . . . . . . . . . . . . Limnodromus scolopaceus Wilson’s phalarope . . . . . . . . . . . . . . . . . . . . . . . . . . . . . Phalaropus tricolor Common snipe . . . . . . . . . . . . . . . . . . . . . . . . . . . . . . . Capella gallinago
UNITED STATES DEPARTMENT OF THE INTERIOR FISH AND WILDLIFE SERVICE
Fish and Wildlife Leaflet 13 Washington, D.C. •• 1991
8

W A T E R F O W L M A N A G E M E N T H A N D B O O K
13.4.7. Managing Beaver to Benefit Waterfowl
James K. Ringelman Colorado Division of Wildlife 317 West Prospect Road Fort Collins, CO 80526
Aside from humans, no other organism has the capacity to modify its environment as much as the beaver. In doing so, beaver create wetlands that provide valuable waterfowl habitats. Because beavers are widely distributed in North America (Fig. 1), beaver ponds can benefit waterfowl during breeding, migrating, and wintering periods. Mismanaged beaver populations, however, can severely degrade riparian habitats and become a costly problem. The key to successfully managing beaver for waterfowl benefits is understanding the values of beaver ponds in meeting the seasonal needs of waterfowl. Beaver populations must then be managed to provide these benefits in a self-sustaining manner compatible with the carrying capacity of the habitat.
Before the arrival of Europeans, 60–400 million beavers occupied 5.8 million square miles of North America. But by 1900, beavers had been so severely over-exploited by trappers and hunters that they were almost extinct. Today, beaver populations are on the upswing: 6 million to 12 million animals occupy diverse habitats ranging from the boreal forests of Canada south to the Texas gulf coast, and from California’s Central Valley east to the Atlantic seaboard. This recent population increase is a testament to the resiliency
Fish and Wildlife Leaflet 13.4.7. •• 1991
of beaver populations and their responsiveness to management techniques. I review some techniques useful for managing beaver populations and enhancing beaver habitats to benefit waterfowl, and explain the ecological relations and characteristics that make beaver ponds attractive waterfowl habitats.
Beaver Ponds as Breeding Habitats for Waterfowl
Ecological Relations Most of the important habitats created by
beaver and used by breeding waterfowl are north of 40° latitude in the mixed hardwoods–coniferous forests of the Northeast, in the montane habitats of the West, in parklands and the Precambrian Shield regions of southern Canada, and in the boreal and subarctic forests of northern Canada. Beaver ponds in these regions are attractive to most dabbling duck species, particularly American black ducks, mallards, and green-winged teal. Hooded mergansers, ring-necked ducks, common goldeneyes, and buffleheads are common diving duck species found on beaver ponds. Beaver ponds also provide important breeding habitat for wood ducks throughout their breeding range.
A beaver colony is defined as a group of beavers occupying a pond or stretch of stream, using a common food supply, and maintaining a common dam or dams. An average of one or two beaver colonies per mile occur along suitable streams and
1

Fig. 1. Range of the beaver in North America. Modified from Novak 1987.
rivers. Each colony usually contains four to eight beavers. Their activities, most notably the creation of ponds by flooding of riparian habitats and removal of woody vegetation, may influence 20 to 40% of the total length of second- to fourth-order streams and may remain as part of the landscape for centuries. Unexploited beaver populations can create as many as 26 ponds per mile of stream length in suitable habitats, but typically the number of ponds ranges from three to six per mile. Most stream sections used by beaver have valley slopes of 1 to 6%, and of the remaining use, one-quarter occurs along sections with 7 to 12% slope. Beavers generally do not occupy streams where valley slopes exceed 15%. Suitability of a site also increases with valley width. First-order
streams usually are narrow with high gradients and an undependable water supply, and therefore receive little use. Conversely, many streams greater than fourth-order often flood in spring, destroying on-channel beaver dams. On these streams and rivers, beaver activities are mostly confined to banks, backwater wetlands, and floodplains. Beavers commonly occupy natural lakes and glacial depressions, such as kettle ponds, throughout their range.
Availability of food is the most important biotic constraint to beaver distribution. In northern regions, beavers annually cut at least a ton of forage. Usually, they take food resources closest to their lodge or bank dens first. Most food is gathered within 100 yards of their pond. Although they will
2 Fish and Wildlife Leaflet 13.4.7. •• 1991

consume a wide range of woody and herbaceous plants, beaver prefer quaking aspen, cottonwood, willow, alder, maple, birch, and cherry, supplemented by herbaceous emergents such as sedges and floating-leaved vegetation, including pondweeds and waterlilies. In agricultural areas, they consume a wide variety of crops such as corn and soybeans. Riparian zones dominated by deciduous tree species preferred by beaver may be virtually clear-cut. An important effect of removing this tree canopy is an increase in the density and height of the grass–forb–shrub layer, which enhances waterfowl nesting cover adjacent to ponds. Additionally, the deep channels created by beaver to help transport food within the pond provide travel lanes for breeding pairs and broods of waterfowl.
Beaver pond complexes create a wetland community with characteristics similar to waterfowl breeding habitats on the northern Great Plains. Most important among these characteristics is a wetland complex that is usually composed of several wetlands of varying sizes, shapes, depths, and successional stages. These diverse wetlands provide space for territorial birds to isolate themselves from individuals of the same species. Also, as in prairie habitats, such complexes enable breeding waterfowl to optimize their use of aquatic resources. For example, beaver colonies in highly desirable locations may persist for several decades, and wetlands may advance to late successional stages with vegetation and aquatic invertebrate communities functionally similar to semipermanent and permanent wetlands in the prairies. Other beaver ponds located on less suitable sites, or new ponds created by beavers dispersing from an established colony, may possess vegetative structure and invertebrate communities more similar to temporary or seasonal prairie wetlands. Wetland fertility, water permanency, and water temperature regimes also vary within a beaver pond complex.
In addition to increasing the quantity of wetlands available to waterfowl, beaver enhance wetland quality. Wetland fertility is increased because much of the sediment and organic matter that is normally carried downstream is retained behind beaver dams. Beavers also add new sources of organic matter in the form of fecal matter and the plant material they haul or fell into the pond and later use as food or building material. The net effect is an increase in the nutrient base for aquatic plants and invertebrates. Total invertebrate biomass and density in beaver ponds may be two to
Fish and Wildlife Leaflet 13.4.7. •• 1991
five times greater than in stream riffle sites, ranging from 1,000 to 6,800 organisms per square foot and from 0.1 to 1 gram per square foot, depending on the season. Moreover, the structure of invertebrate communities is changed as running-water taxa are replaced by pond taxa, which are more readily exploited by waterfowl. These aquatic invertebrates make up the protein food base so important to laying females and to growing ducklings.
The structural characteristics of beaver ponds also are attractive to breeding waterfowl. Habitat diversity increases as beaver flood lands and open forest canopies. The flooded area under the tree canopy and underlying shrub layer provides lateral and overhead cover sought by many dabbling duck pairs and broods. Later, northern flickers and other primary excavators may create waterfowl nesting cavities in the dead trees that remain standing in ponds. The “feathered edge,” typical of many beaver ponds, creates shallow-water foraging areas that warm quickly in early spring, and often provides sites where seeds and invertebrates can be obtained. Beaver lodges and dams afford loafing areas and nesting sites for geese, ducks, and sandhill cranes, depending on the degree of vegetative concealment on the structure.
Management Strategies
Beaver ponds provide a mosaic of environmental conditions, dependent on pond size and age, successional status, substrate, and hydrologic characteristics. Hydrologic characteristics are especially important to waterfowl managers. Controlling water levels in beaver ponds is an important but sometimes difficult proposition. As in any nesting habitat, water in early spring must be sufficient to attract and hold breeding pairs, and stable enough to sustain water through the brood-rearing period. Beaver ponds located in relatively small watersheds, off the main channel, or with dams in disrepair, may have inadequate water in early spring. Such wetlands do not provide optimal habitat for waterfowl. Conversely, beaver ponds located in montane habitats far below snowline may fill with water from snowmelt about the time early-nesting waterfowl species complete their clutches, flooding nests located around the pond margin.
Consider transplanting beaver to a site if water and food are adequate, but dams are in disrepair because beavers have abandoned the area. If water
3

Welded wire
5X10 cmWooden braces
06-cm Exterior plywood
flow is inadequate, examine the feasibility of channeling water from a reliable source into the pond complex. One objective of managing beaver ponds as waterfowl breeding habitat should be to manage ponds for seasonally stable water levels.
Despite the benefits of stable water within the breeding season, this type of water regime reduces the productivity of beaver ponds when maintained over several years. The decline is primarily caused by anaerobic conditions, which bind nutrients to soil and organic matter, thereby making them unavailable to plants and animals. These anaerobic processes are exacerbated by the tranquil flow regimes and high organic loads typical of beaver ponds. Artificially increasing flow rates may help increase aerobic decay, but the best approach is to periodically drain or reduce the water levels in ponds to promote aerobic decay of organic matter and to reverse wetland succession. The interval between drawdowns is difficult to prescribe because the need for such action depends on the length of the warm season, water temperature, pond size and organic load, and water flow rates. In low latitudes, beaver pond productivity may decline in a few years, whereas ponds at high latitudes may take much longer to reach detrimental anaerobic conditions.
Drawing down a beaver pond is often easier said than done, because of the natural tendency of beavers to quickly plug any breach in their dam. Explosives or backhoes can be used to remove dams, but this often becomes an ongoing process because dams are quickly reconstructed. Better results are often achieved with beaver-resistant water control structures (Fig. 2), which are installed in the dam and are resistant to blockage by beaver. Only a fraction of the wetlands in a beaver pond complex should be dewatered during a given year to ensure adequate habitat for waterfowl and beaver in the remaining ponds. Ponds should not be drawn down during the brood-rearing period because young birds may become stranded or have to move, and become more exposed to predators.
Managing distribution of beaver can be a challenge equal to that of controlling water levels. Beaver that occupy sites adjacent to private lands, roads, or other human structures may impound water that causes timber or crop damage or creates a nuisance. Often, the only solution is to trap the offending beaver. If live-trapped, such individuals can often be successfully transplanted to suitable but unoccupied habitats. Supplemental feeding has
Dam
Plan View
15 to 23 cm dia. green or water-loggged poles: 3 to 4 m long
Ground Forked stake
Flow Dam Axe holes
15 to 23 cm logs
Green sticks Tin
Cross Section
Swamped Area
Existing Channel
Fig. 2. Three designs for beaver-proof water control structures: three-log drain (top), box drain (lower left), and perforated plastic drainpipe (lower right). From Arner and Hepp 1989.
been used to “hold” transplanted beavers in new areas until they become established, but supporting a beaver population by artificial feeding is an intensive and costly approach that is not recommended. A woven-wire fence, stretched across a stream channel between steel posts may be installed (where legal) to encourage beavers to build dams at selected sites.
Unexploited beaver populations can create numerous wetlands. With the extirpation of the gray wolf, which was a primary predator of beaver,
Fish and Wildlife Leaflet 13.4.7. •• 1991 4

other factors such as trapping, food depletion, space, and disease have become the agents of population control. Before these agents intercede, however, beavers may severely degrade riparian and upland habitats. If unchecked, beaver populations and associated wetlands may oscillate from locally abundant to scarce. Populations exploited by trapping often remain at more constant levels commensurate with their food supply, their principal limitation. Field surveys are the most reliable means to determine the adequacy of remaining food resources. In good stands, 4 acres of quaking aspen, 12 acres of willow, or intermediate acreages of the two in combination are adequate to support an average colony of six animals. Such indices of adequate food supply are available for most regions of the United States. If managers control beaver by trapping, a general rule for maintaining stable populations at mid-latitudes (40–50°) is to remove about 25% of the fall population in willow habitat, 40% in quaking aspen habitat, and 70% in cottonwood habitat. This prescription reflects the progressive increase in reproductive rates of beaver with decreasing altitude and climatic severity, and increasing food quality and quantity.
In forested habitats, managing upland nesting cover around beaver ponds is usually impractical. Fortunately, the grass–forb–shrub cover that is common near beaver ponds often provides high quality, albeit limited, waterfowl nesting habitat. Nest success is often relatively high because many forested habitats have high habitat diversity, an abundance of buffer prey species, and predator populations that are more in balance with the habitat than are those on the northern Great Plains. Nevertheless, nests located along travel lanes such as dams and shorelines are more exposed to predators. Nests located on beaver lodges are often successful because such sites are secure from most mammalian predators. Trampling by livestock and flooding also cause nest failure, but flooding can be controlled by water-level management techniques, and fences often minimize damage by livestock.
Beaver Ponds as Migratory and Wintering Habitats
Ecological Relations During spring and fall, beaver ponds are used
by migrating waterfowl throughout North America.
Fish and Wildlife Leaflet 13.4.7. •• 1991
Open (ice-free) water, in which migrants can obtain aquatic invertebrates and plant seeds, tubers, winter buds and rhizomes, is the most important characteristic of these habitats. Beaver ponds, however, usually are not managed for migratory waterfowl except in the southeastern United States, where intensive management is sometimes used to attract fall migrants and wintering waterfowl for hunting. These areas are often associated with hardwood bottomlands or floodplain forests, where mallards and wood ducks are especially common.
Ecological relations described for beaver pond breeding habitats in northern regions are similar or identical to those in beaver ponds at southern latitudes. Successional patterns in beaver ponds in the South are similar to those in northern habitats, but occur more quickly. After beaver have created permanently flooded wetlands, trees die and the canopy opens, making conditions more suitable for growth of herbaceous plants or semi-aquatic vegetation. Sediments and organic matter are retained over time, thereby decreasing pond depth. Aquatic invertebrate communities develop and invertebrate biomass increases as the pond vegetation becomes established. Physical features of habitat created by beaver, such as dead, standing timber with a well-developed shrub layer, provide excellent habitats for wood ducks and other waterfowl to roost at night. Seed-producing annual plants associated with beaver ponds provide vegetative foods important to many dabbling ducks, particularly in years when mast crops such as acorns are unavailable. The wetland complex created by beaver provides diverse habitats that are readily exploited by waterfowl.
Management Strategies
Management strategies for migrating and wintering waterfowl must first consider important characteristics of beaver ponds: (1) those with few emergent plant species and shallow water areas, but with the potential for manipulating water level; (2) those with emergents and shallow water, where water levels can be manipulated; and (3) those with no possibilities for drainage. Ponds of the first type, which are common in the Southeast, are best managed by lowering the water level to allow germination of seed-producing, annual plants that are beneficial to waterfowl (Table). This technique, known as moist-soil management, relies on the timing and duration of drawdown to promote the germination and growth of seeds
5

Table. List of desirable plants that occur in beaver ponds of the southeastern United States.
Common name Scientific name
Redroot flatsedge Cyperus erythrorhizos Millets Echinochloa spp. Pennywort Hydrocotyle ranunculoides Duckweed Lemna spp. Frogbit Limnobium spongia Water primrose Ludwigia leptocarpa Parrotfeather Myriophyllum brasilense Stout smartweed Polygonum densiflorum Nodding smartweed Polygonum lapathifolium Pondweeds Potamogeton spp. Beakrush Rhynchospora corniculata Burreed Sparganium chlorocarpum Watermeal Wolffia spp.
already in the soil. In rare instances, when desirable aquatic vegetation is absent and the seed bank is inadequate, commercially available seed can be used. In Alabama, beaver ponds which were dewatered as described earlier, and then planted with Japanese millet, have yielded 1,400–2,400 pounds of seed per acre. Although moist-soil plants typically do not attain such high seed production, they do support high densities of aquatic invertebrates and provide seeds of a better nutritional balance than many commercially available plants.
Beaver ponds with an abundance of desirable emergent plants are best left undisturbed. If undesirable emergents are present, however, managers can alter the vegetative composition by water-level manipulations, mechanical disturbance, burning, or herbicide application. Water-level control is most easily achieved with beaver-proof control structures (Fig. 2). Mechanical disturbances and burning share the common objective of retarding vegetation succession and opening dense stands of vegetation. These management activities are usually conducted in late winter or early spring after water is drawn down. To effectively change plant composition, burning or mechanical treatments must damage roots of plants. Usually, this requires dry soil conditions, so that heavy mechanical equipment can be operated in the pond. If fire is used, heat must be sufficient to penetrate to root level. Herbicides such as Dalapon, Banvel, and Rodeo
also can be used to control plants where such use is permitted. Managers should make certain that their herbicide of choice is approved for aquatic use and is applied at proper rates by a licensed applicator.
Impounded areas without drainage most commonly occur in cypress–tupelo wetlands where there is insufficient elevation change to use hidden drains. In these situations, managers may attempt to enhance the vegetative composition by introducing beneficial aquatic plants to the pond (Table). Floating-leaved plants such as duckweed and watermeal are beneficial species that are easy to introduce. If the overstory of trees provides too much shade to allow aquatic plants to establish, it may be beneficial to clear-cut small openings to help vegetation become established. By manipulating vegetative composition and interspersion, beaver ponds can provide attractive winter habitats for waterfowl.
Suggested Reading
Arner, D. H., and G. R. Hepp. 1989. Beaver pond wetlands: a southern perspective. Pages 117–128 in L. M. Smith, R. L. Pederson, and R. M. Kaminski, eds. Habitat management for migrating and wintering waterfowl in North America. Texas Tech University Press, Lubbock.
Beard, E. B. 1953. The importance of beaver in waterfowl management at the Seney National Wildlife Refuge. J. Wildl. Manage. 17:398–436.
Johnson, R. C., J. W. Preacher, J. R. Gwaltney, and J. E. Kennamer. 1975. Evaluation of habitat manipulation for ducks in an Alabama beaver pond complex. Proc. Annu. Conf. Southeast. Assoc. Game Fish Comm. 29:512–518.
Longley, W. H., and J. B. Moyle. 1963. The beaver in Minnesota. Minn. Dep. Conserv., Tech. Bull. 6. 87 pp.
Naiman, R. J., C. A. Johnston, and J. C. Kelley. 1988. Alteration of North American streams by beaver. Bioscience 38:753–762.
Novak, M. 1987. Beaver. Pages 282–313 in M. Novak, J. A. Baker, M. E. Obbard, and B. Malloch, eds. Wild furbearer management and conservation in North America. Ministry of Natural Resources, Ontario, Canada.
Renouf, R. N. 1972. Waterfowl utilization of beaver ponds in New Brunswick. J. Wildl. Manage. 36:740–744.
Yeager, L. E., and W. H. Rutherford. 1957. An ecological basis for beaver management in the Rocky Mountain region. Trans. North Am. Wildl. Conf. 22:269–300.
6 Fish and Wildlife Leaflet 13.4.7. •• 1991

Appendix. List of Common and Scientific Names of Plants and Animals Named in Text.
Animals Wood duck . . . . . . . . . . . . . . . . . . . . . . . . . . . . . . . . . . . Aix sponsa Green-winged teal . . . . . . . . . . . . . . . . . . . . . . . . . . . . . . Anas crecca Mallard . . . . . . . . . . . . . . . . . . . . . . . . . . . . . . . . . . . . Anas platyrhynchos American black duck . . . . . . . . . . . . . . . . . . . . . . . . . . . . . Anas rubripes Ring-necked duck . . . . . . . . . . . . . . . . . . . . . . . . . . . . . . . Aythya collaris Common goldeneye . . . . . . . . . . . . . . . . . . . . . . . . . . . . . . Bucephala clangula Bufflehead . . . . . . . . . . . . . . . . . . . . . . . . . . . . . . . . . . Bucephala albeola Gray wolf . . . . . . . . . . . . . . . . . . . . . . . . . . . . . . . . . . . Canis lupus Beaver . . . . . . . . . . . . . . . . . . . . . . . . . . . . . . . . . . . . . Castor canadensis Northern flicker . . . . . . . . . . . . . . . . . . . . . . . . . . . . . . . Colaptes auratus Sandhill crane . . . . . . . . . . . . . . . . . . . . . . . . . . . . . . . . Grus canadensis Hooded merganser . . . . . . . . . . . . . . . . . . . . . . . . . . . . . . Lophodytes cucullatus
Plants Maple . . . . . . . . . . . . . . . . . . . . . . . . . . . . . . . . . . . . . Acer spp. Alder . . . . . . . . . . . . . . . . . . . . . . . . . . . . . . . . . . . . . Alnus spp. Birch . . . . . . . . . . . . . . . . . . . . . . . . . . . . . . . . . . . . . Betula spp. Sedges . . . . . . . . . . . . . . . . . . . . . . . . . . . . . . . . . . . . . Carex spp. Japanese millet . . . . . . . . . . . . . . . . . . . . . . . . . . . . . . . . Echinochloa crusgalli Rushes . . . . . . . . . . . . . . . . . . . . . . . . . . . . . . . . . . . . Juncus spp. Duckweed . . . . . . . . . . . . . . . . . . . . . . . . . . . . . . . . . . . Lemna spp. Waterlily . . . . . . . . . . . . . . . . . . . . . . . . . . . . . . . . . . . Nymphaea spp. Tupelo . . . . . . . . . . . . . . . . . . . . . . . . . . . . . . . . . . . . . Nyssa aquatica Cottonwood . . . . . . . . . . . . . . . . . . . . . . . . . . . . . . . . . . Populus spp. Quaking aspen . . . . . . . . . . . . . . . . . . . . . . . . . . . . . . . . Populus tremuloides Pondweeds . . . . . . . . . . . . . . . . . . . . . . . . . . . . . . . . . . Potamogeton spp. Cherry . . . . . . . . . . . . . . . . . . . . . . . . . . . . . . . . . . . . . Prunus spp. Willow . . . . . . . . . . . . . . . . . . . . . . . . . . . . . . . . . . . . . Salix spp. Baldcypress . . . . . . . . . . . . . . . . . . . . . . . . . . . . . . . . . . Taxodium distichum Watermeal . . . . . . . . . . . . . . . . . . . . . . . . . . . . . . . . . . Wolffia spp.
Note: Use of trade names does not imply U.S. Government endorsement of commercial products.
UNITED STATES DEPARTMENT OF THE INTERIOR FISH AND WILDLIFE SERVICE
Fish and Wildlife Leaflet 13 Washington, D.C. •• 1991
7

W A T E R F O W L M A N A G E M E N T H A N D B O O K
13.4.8. Options for Water-level Control in Developed Wetlands
J. R. Kelley, Jr.1, M. K. Laubhan2, F. A. Reid3, J. S. Wortham, and L. H. Fredrickson Gaylord Memorial Laboratory The School of Natural Resources University of Missouri Puxico, Missouri 63960
Wetland habitats in the United States currently are lost at a rate of 260,000 acres /year (105,218 ha/year). Consequently, water birds concentrate in fewer and smaller areas. Such concentrations may deplete food supplies and influence behavior, physiology, and survival. Continued losses increase the importance of sound management of the remaining wetlands because water birds depend on them.
Human activities modified the natural hydrology of most remaining wetlands in the conterminous United States, and such hydrologic alterations frequently reduce wetland productivity. The restoration of original wetland functions and productivity often requires the development of water distribution and discharge systems to emulate natural hydrologic regimes.
1 Present address: National Biological Survey, Office of Migratory Bird Management, Laurel, Maryland 20708.
2 Present address: National Biological Survey, National Ecology Research Center, 4512 McMurry Avenue, Fort Collins, Colorado 80525.
3 Present address: Ducks Unlimited, Inc., Western Regional Office, 9823 Old Winery Place, #16, Sacramento, California 95827.
Fish and Wildlife Leaflet 13.4.8. •• 1993
Construction of levees and correct placement of control structures and water-delivery and water-discharge systems are necessary to (1) create soil and water conditions for the germination of desirable plants, (2) control nuisance vegetation, (3) promote the production of invertebrates, and (4) make foods available for wildlife that depends on wetlands (Leaflets 13.2.1 and 13.4.6). This paper provides basic guidelines for the design of wetlands that benefit wildlife. If biological considerations are not incorporated into such designs, the capability of managing wetlands for water birds is reduced and costs often are greater.
Although we address the development of palustrine wetlands in migration and wintering areas, many of the discussed principles are applicable to the development of other wetland types and in other locations.
Levees
Placement A primary goal of the development and
management of wetlands is the maximization of the amount of flooded habitat. Consequently, levees often are constructed to impound water across large areas with little regard for significant changes in elevation. Because the size and placement of levees were neglected, large portions may be flooded to depths that preclude foraging by some water birds.
1

Levee placement should be compatible with the natural topography. Contour levees facilitate an efficient and precise control of water in an entire impoundment. As a result, the composition of the vegetation can be controlled more reliably and foods can be made more readily available. Contour intervals on which to construct levees should be established by balancing construction costs, detrimental effects on existing habitats, and the extent and desirable depth of the flooded area. For example, levees on 8-inch (20.3 cm) contours may be appropriate for managing herbaceous vegetation. In contrast, levees for impounding water in forested habitats with similar topographic variation may have to be on a greater contour interval to reduce the number of trees that must be removed. Furthermore, development should not proceed where numerous contour levees in a small area are required.
Permanent Levees
Because they permit control of water levels and dictate the maximum water depth in an impoundment, permanent levees are an integral component of developed wetlands.1 In addition, permanent levees often are used to form header ditches for the movement of water from sources to the impoundment. Although the dimensions of permanent levees vary by wetland type (permanent, semipermanent, seasonally flooded) and proposed function, the design must be based on engineering criteria.
Appropriate soils must be used for levees to ensure long-term integrity. Because soils have different physical and chemical properties (such as organic-matter content and texture) that affect their suitability as construction material, not all soils can be used to build levees. For example, because of their high susceptibility to water seepage and low erosion potential, coarse sandy soils are poorly suited for levee material. Similarly, soils of mostly organic materials often are unsuitable because of their high potential to shrink and swell. In general, clays or silty clay loams are best suited as levee material because they are highly compactible and have a low shrink-swell potential. Local Soil Conservation Service offices can provide assistance with
1 Federal, state and local permits may have to be obtained for the placement of dredge or fill material into wetlands.
obtaining recommended engineering specifications for levees with specific soil types.
Levees should be seeded with non-woody vegetation to help bind the soil and reduce wind and wave erosion. Mixtures of cool-season grasses, warm-season grasses, or both have been used successfully. Because the most appropriate species vary by location and management objectives, a list of desirable species should be obtained from a local extension specialist.
After engineering criteria are satisfied, management goals also should be considered before construction. Levees should be capable of supporting equipment (e.g., tractor, mower, disk) for their maintenance and the control of vegetation in the impoundment. The side slopes of levees should be gradual to allow easy, safe maintenance and deter potential damage by burrowing mammals such as nutria, muskrat, or beaver. Levees with 12-foot (3.7 m) crowns and minimum side slopes of 4:1 or 5:1 usually are satisfactory (Fig. 1). Levees with more gradual side slopes require a greater volume of material, increase construction costs, and destroy more wetland habitat but may be needed to satisfy engineering requirements for some soil types.
The width and height of levees also depend on the size of the impoundment and desirable depth of flooding. Large impoundments (>80 acres [>32 ha]) and impoundments that function as permanently flooded wetlands are subject to severe wave action that increases the risk of erosion. Consequently, large or deeply flooded impoundments require more substantial levees than smaller or seasonally flooded impoundments. As a general rule, the levee height should be at least 1.0 to 1.5 feet (0.3−0.5 m) above the maximum planned flooding depth. Based on these guidelines, levees of permanently and semipermanently flooded impoundments (4−5 foot [1.2−1.5 m] water depths) should have a minimum height of 6 feet (1.8 m), whereas the levee height of seasonally flooded impoundments (4−18 inch [10−46 cm] water depth) should be a minimum of 3 feet (0.9 m). Where unplanned severe flooding occurs regularly, as along rivers, a low levee that is submerged quickly and uniformly often is damaged less by flooding than a large protective levee that is partially overtopped. Where unplanned flood events are less severe or only infrequent, protected (e.g., rip-rapped) emergency spillways can be incorporated into the levee design to maintain the structural integrity.
Fish and Wildlife Leaflet 13.4.8. •• 1993 2

Levees that form header ditches should be constructed according to many of the same criteria as impoundment levees (Fig. 1c). However, the height of header-ditch levees should be based on the quantity and rate of water that must be transferred from the water source to the impoundment. The levee height should be a minimum of 1.5 feet (0.5 m) above the maximum planned water capacity of the ditch.
Temporary Levees
Formerly, many impoundments were constructed without regard to natural topography, and elevation changes in excess of 3 feet (0.9 m) were common. Although small elevation changes promote plant diversity and provide a diversity of depths for foraging, the management of impoundments with large topographic variations can be impaired because water levels are difficult to manipulate. One method of improving the manipulation of water levels in such impoundments
Fig. 1. Dimensions of levee for a permanent or semipermanent impoundment (a), levee for a seasonally flooded impoundment (b), header-ditch levee (c), and rice-dike levee (d).
is the construction of temporary levees, often called rice dikes. The dimensions of completed rice dikes vary by soil type and equipment, but those constructed with a rice-dike plow typically have steep side slopes, a base width of about 8 feet (2.4 m), and a height of about 2 feet (0.6 m; Fig. 1d). Small levees also can be constructed with terrace plows, fire plows, bulldozers, and motor graders. These implements can be used to develop levees with more gradual side slopes and greater heights, but construction is more costly and the amount of manageable habitat in an impoundment is reduced. Regardless of the construction method, small levees should be built only on well-drained soils to assure a dry, impervious core. Because rice dikes gradually taper toward the top, they are very susceptible to erosion from wave action. Consequently, most rice dikes are effective only if constructed on contours which prevent water from overtopping and eroding the levee. Rice dikes usually have a life-span of less than 2 years.
Fish and Wildlife Leaflet 13.4.8. •• 1993 3

Water-control Structures
Correct placement and type of water-control structures for precise manipulation of water levels are essential for the simulation of natural hydrologic regimes. Structures to regulate the water discharge should be placed at the lowest elevation in the impoundment and be large enough to permit complete, rapid dewatering. Stoplog structures have proven to be the most effective design because desired changes in water depth can be achieved with appropriately sized stoplogs and because water depths can be maintained with a minimum of monitoring (Fig. 2a). In contrast, screw gates are poorly suited as outlet structures
Fig. 2. Stoplog (a) and screw gate (b) water-control structures for manipulating water levels.
because they require constant monitoring during drawdowns and do not enable precise manipulations (Fig. 2b). However, screw gates may be used to regulate the water flow into an impoundment. The number and size of water-control structures should be determined by topography and size of the impoundment. Structures should be placed where management activities cause little disturbance of wildlife.
Flooding Systems
A proper design of flooding systems is imperative to successful wetland management. If possible, each location for levees should be
4 Fish and Wildlife Leaflet 13.4.8. •• 1993

Fig. 3. Configuration of stair-step (a and b) and header-ditch (c) flooding systems.
developed to permit the independent control of the depth, duration, and time of flooding. Furthermore, a proper location of the pumping units is important for efficient water manipulation. Any of three methods generally are used to flood a complex of impoundments. The first is a stair-step overflow system (Fig. 3a and 3b). Ideally, the water enters at the highest elevation. When flooding commences, the area at the highest elevation is flooded first. Subsequent additions of water can be used to flood additional areas at lower elevations. Having the water enter at the highest elevation also ensures that it can flow through impoundments, making it possible to remove salts and to irrigate vegetation effectively. The second system requires the construction of a water transfer system adjacent to several areas with levees (Fig. 3c). Such a transfer system may consist of a header ditch or polyvinylchloride (PVC) pipe with water-control structures that independently regulate water flow into each impoundment. The use of a PVC pipe allows more
Fish and Wildlife Leaflet 13.4.8. •• 1993
efficient use of water than a header ditch and never requires control of vegetation. However, the PVC pipe should be buried to prevent deterioration. A hydrologist or engineer should be consulted prior to the installation of a permanent pipe system because the distance that water can be transferred through a pipe varies with pump type, pipe size, and elevation gradient. The third flooding system consists of a portable pump with sufficient hose or pipe to transport water from the source (e.g., pond, ditch) to each impoundment.
Dewatering Systems
The dewatering system is as important to successful wetland management as the flooding system. The discharge system should ensure the quick and complete removal of water from all impoundments. Thus, discharge ditches should be at least 2 feet (0.6 m) below the base elevation of an impoundment. Although the quantity of water that must be removed from impoundments determines the dimensions (i.e., base width, side slope) and the number of required discharge ditches, requirements for maintenance also should be considered. The ability to completely remove water from the discharge ditches prevents undesirable vegetation, such as American lotus or willows, from becoming established and reducing drainage capacity. If such problems develop, ditches with minimum side slopes of 4:1 permit equipment access to control vegetation and still promote efficient water removal.
Benefits of Proper Development
The value of a properly constructed wetland can best be evaluated by comparing the costs of construction and maintenance with the benefits for wildlife. To illustrate the long-term costs and benefits of contour levees, compare a 1,000 acre moist-soil impoundment with contour levees and one with a single straight levee bisecting the unit (Fig. 4). The initial cost of construction is 320% greater with contour levees (Table), but water levels over the entire area can be managed to establish vegetation and food resources for water birds. In contrast, optimum water levels can be achieved on only 45% of the area if a levee were constructed across the elevation gradient. The remaining 55% will either be too deep for water birds or will remain dry.
5

Fig. 4. Cost-benefit comparison of an impoundment with and without contour levees.
Table. Construction costs for hypothetical 1,000-acre impoundments with levees on contours and with levees not on contours.a
Levees on Item contour
Amount of fill material (yd3) 51,371 Cost of interior levees 45,206
($0.88/yd3) Initial levee cost ($/acre) 45.21 Effectively managed area (%) 100 20 year cost ($/effective acre) 2.26 Effectively managed area in 20,000
20 years (acres) Seed production in 20 years 30.0b
(million lbs) Waterfowl use-days in 20 150.0
years (in millions; 0.2 lbs /day / bird)
a Conversions of measurements to metric units not given.b Based on a seed-production rate of 1,500 lbs / acre / yr. c Based on a seed-production rate of 500 lbs / acre / yr.
Levees off contour
16,054 14,127
14.13 45
1.57 9,000
4.5c
22.5
Difference
35,317 31,079
31.08 55
0.69 11,000
25.5
127.5
6 Fish and Wildlife Leaflet 13.4.8. •• 1993

After 20 years, the impoundment with contour levees provides 11,000 more acres of managed habitat than the impoundment without contour levees. With the precise water-level control from proper levee placement, the annual moist-soil seed production may average 1,500 lbs/acre (275 kg / ha). In the impoundment without contour levees, the water-level control would be less precise and the annual seed production may average only 500 lbs / acre (92 kg / ha), of which a portion would be unavailable to birds because of deep water. The difference in the annual seed production would result in an additional 25.5 million pounds (about 11.6 million kg) of seed in the impoundment with contour levees during 20 years. This amount of food could support as many as 6.4 million additional waterfowl use-days / year.
Proper construction and placement of levees and water-control structures provide benefits not only for waterfowl. For example, of 80 water birds that commonly use wetlands in Missouri, more than 55 species use only shallowly flooded habitats (<10 inches [25.4 cm]). Many of these species are dependent on invertebrates, which also respond best to shallowly flooded environments. Other foods, including tubers and browse, also are more available to water birds if shallowly flooded. Thus, contour levees that permit shallow flooding over the entire impoundment are of great importance in meeting the needs of many wetland species. Including these factors in a cost-benefit analysis would make contour levees an even more attractive alternative.
Recommendations
In summary, recommended specifications for the development of managed wetlands are:
1. The simulation of natural hydrologic cycles. 2. Independent water delivery and water discharge
for each impoundment. 3. Water delivery at the highest elevation. 4. Water discharge at the lowest elevation. 5. Stoplog structures as the most appropriate
outlet structures. 6. Levees on contours. 7. Maximized flooded area to shallow depths (<10
inches [<25 cm]). 8. Water-control structures, pumps, and other
structures placed where they and their maintenance cause the least disturbance to wildlife.
Suggested Reading
Fredrickson, L. H., and T. S. Taylor. 1982. Management of seasonally flooded impoundments for wildlife. U.S. Fish and Wildlife Service Resource Publication 148. 29 pp.
Payne, N. F. 1992. Techniques for wildlife habitat management of wetlands. McGraw-Hill Inc., New York, N.Y. 549 pp.
Smith, L. M., R. L. Pederson, and R. M. Kaminski, editors. 1989. Habitat management for migrating and wintering waterfowl in North America. Texas Tech University Press, Lubbock. 560 pp.
Fish and Wildlife Leaflet 13.4.8. •• 1993 7

Appendix. Common and Scientific Names of the Plants and Animals Named in the Text.
Animals Beaver . . . . . . . . . . . . . . . . . . . . . . . . . . . . . . . . . . . . . . . . Castor canadensis Nutria . . . . . . . . . . . . . . . . . . . . . . . . . . . . . . . . . . . . . . . . . Myocaster coypus Muskrat . . . . . . . . . . . . . . . . . . . . . . . . . . . . . . . . . . . . . . . Ondatra zibethicus
Plants American lotus . . . . . . . . . . . . . . . . . . . . . . . . . . . . . . . . . . . . . Nelumbo lutea Willows . . . . . . . . . . . . . . . . . . . . . . . . . . . . . . . . . . . . . . . . . . . . Salix spp.
Note: Use of trade names does not imply U.S. Government endorsement of commercial products.
UNITED STATES DEPARTMENT OF THE INTERIOR NATIONAL BIOLOGICAL SURVEY
Fish and Wildlife Leaflet 13 Washington, D.C. •• 1993
8 Fish and Wildlife Leaflet 13.4.8. •• 1993

W A T E R F O W L M A N A G E M E N T H A N D B O O K
13.4.9. Preliminary Considerations for Manipulating Vegetation
Leigh H. Fredrickson and Frederic A. Reid Gaylord Memorial Laboratory School of Forestry, Fisheries and Wildlife University of Missouri—Columbia Puxico, MO 63960
A wide diversity of plants has adapted to the dynamic nature of wetlands. The continually changing floral landscape is shaped by physical or abiotic components that include climate, fire, soil, and water. Water quantity, quality, and chemistry have a dominating influence on wetlands as do factors such as hydroperiod (period when soils are saturated) and hydrological regime. Other factors that may affect the abundance, structure, and species composition of macrophytes or robust emergents are natural grazing, disease, and interspecific plant competition.
Vegetation is important to waterfowl for producing seeds, tubers, and browse; providing nest sites; and serving as substrates for animal foods. For example, the emergent marsh stage with the greatest number and diversity of birds has been called the “hemimarsh.” A maximum diversity and number of birds occur when vegetation cover and water interspersion in Type IV (semipermanent marsh) wetlands is at a 50:50 ratio. This wetland condition provides ideal nesting cover for waterbirds, as well as substrates and litter for invertebrate populations.
Emergent wetlands other than glacial marshes also require good interspersion of cover and water to attract waterfowl. Likewise, a diversity of wetland vegetation is much more desirable than a monoculture. As man expanded his activities in North America, the natural events producing mosaics of wetland vegetation were eliminated or altered. As an example, drainage or water diversion
Fish and Wildlife Leaflet 13.4.9. •• 1988
to enhance row crop production not only affects the immediate site, but often affects soil moisture conditions on adjacent areas as well.
This change in water availability influences plant species composition. Intensive cultivation for grains and forage, together with other human-related activities (water diversion projects, livestock grazing, and the elimination of natural fires) have modified the physical processes that influence the productivity of wetland systems. Managed areas throughout North America now must provide predictably good wetland habitat, despite modifications to water supplies, flooding regimes, and other physical factors.
Manipulation of wetland vegetation is a commonly employed tool. Although water-level manipulation is the traditional technique for modifing plant communities under intensively managed systems, other options include fire, grazing, and other physical and chemical disturbances. Values of vegetation structure and composition along with general concepts relating to manipulations are discussed.
Desirable or Undesirable?
Traditionally, plants in waterfowl wintering or migration corridors were considered desirable if they produced large amounts of seed for food, whereas on waterfowl breeding grounds cover for nesting, broods, and molting birds was the desired characteristic. The value of plants as food (in the form of tubers and browse) and cover has long been acknowledged. However, recent information indicates plants are vitally important to invertebrates as nutrient sources and substrates. Likewise, structural characteristics of vegetation may provide
1

important habitat components when waterfowl court, molt, or require escape cover. Robust marsh vegetation serves as a nutrient pump within wetlands and can influence water chemistry and primary productivity. All of these functions are integral values of wetlands that are important considerations beyond the provision of seeds for waterfowl.
“Undesirable” plants are not simply “a group of plants whose seeds rarely occur in waterfowl gizzard samples.” Rather, plants that quickly shift diverse floral systems toward monocultures, are difficult to reduce in abundance, have minimal values for wetland wildlife, or outcompete plants with greater value should be considered less desirable. When manipulation of undesirable plants is required, it should be timed so that the resultant decomposing vegetation can be used effectively by wetland invertebrates. If reflooding is shallow, these organisms with high protein content are readily available for consumption by waterfowl or shorebirds.
The Need For Disturbance
Vegetation within semipermanent and permanent wetlands can shift rapidly to a monoculture of robust plants. If water regimes remain constant or if muskrat populations are low, these monocultures may rapidly reduce associated waterfowl use. Manipulation of these monocultures by flooding or drying, fire, or chemical means can modify the structure and potentially increase plant and animal diversity. Disturbance tends to destroy monocultures and sets back succession. For instance, moist-soil wetlands that once were dominated by seed-producing annuals (Fig. 1), but have
shifted to less desirable perennials after several years, may require mechanical mowing or discing.
“Undesired,” especially exotic, plants may also plague managers. Problem plants often differ among regions. For example, purple loosestrife is a hardy perennial that causes management problems in the Northeast and Midwest, whereas American lotus with its elaborate tuber systems is a serious problem for managers in the Southeast and Midwest, where static water regimes occur. Invasions of young woody trees must be controlled in intensively managed marsh sites, because these same small sprouts can only be removed by very expensive bulldozer operations once sapling stages are reached. Problem woody and herbaceous growth forms are compared by region in Table 1.
Vegetation structure can also be modified with machinery to provide good interspersion. Mowing and rototilling have successfully produced the “hemimarsh” conditions under controlled experiments in Canadian prairies. Tracked vehicles are used to open dense stands of plants in Hawaii to improve habitat for endangered waterbirds, and duck-hunting clubs in California mow to create good interspersion for hunting. In summary, manipulation of vegetation may be desired to set back succession and reduce monocultures of robust plants, to diversify monotypic plant communities with undesirable characteristics, to reduce woody invasion in moist-soil areas, and to modify vegetation structure.
Initial Considerations in Development of Managed Wetlands
Careful considerations of potential vegetation problems and identification of anticipated, re-
Figure 1. Successional shift of moist-soil plants.
2 Fish and Wildlife Leaflet 13.4.9. •• 1988

Table 1. Comparison of problem woody and herbaceous vegetation by region.
Vegetation West Midwest/Southeast Northeast
Woody Salt cedar Eastern cottonwood Mountain alder
Willow Willow
Fremont cottonwood Silver maple
Herbaceous Alkali bulrush American lotus Purple loosestrife
Cattail Cattail
Sesbania
Common cocklebur
Alligatorweed chafflower
quired manipulations before construction can reduce management costs on intensively managed sites. Input by knowledgeable managers is essential as engineering plans are developed. Disturbance of unmodified or critical sites by development can negate any benefits of construction. Undoubtedly, any obstruction (such as a levee) will modify the previous hydrological regime. Typically, lands within levee systems become wetter because water is retained longer. Severe damage may be avoided by simply knowing where parking lots, drainage ditches, and roads can be placed. Initial considerations should include climatic, edaphic, and hydrologic information, as well as life history information for dominant flora (Table 2). An understanding of natural flooding regimes on a local scale should be developed in order to emulate natural conditions. Drainage patterns within a watershed indicate proper locations of levees and water-control structures. Improperly placed drainage structures preclude complete dewatering and reduce management options. Soil characteristics and potential to hold water affect seed germination and effectiveness of subsequent flooding. Placement of borrow ditches requires considerations such as costs of pumping water into or away from ditches and whether access to the site with equipment is required regularly. On areas where hunting is allowed, access across deep ditches is essential.
Costs associated with flooding, as well as providing as much area as possible with optimum water depths, make contour levees highly desirable. Optimum water control to enhance manipulation of plants and to promote proper flooding depths for most waterfowl requires levees on con-
Table 2. A checklist of variables important in the development of management scenarios for wetland habitats critical to vegetation management.
Management considerations
Climate Precipitation cycle Temperature ranges Length of growing season
Soils Structure/texture Fertility Topography Residual herbicides
Water control potential Water supply/source Levees Control structures Pumps
Impoundments in complex Number Size Juxtaposition
Plants Species composition Species life history Structure and maturity Seedbank Exotic and problem species
Equipment for manipulations Access Repair capabilities
Other land uses Grazing Mineral development
Fish and Wildlife Leaflet 13.4.9. •• 1988 3

tours at intervals of no more than 18 inches. Larger, more permanent levees that can withstand the weight of machinery and have a slope of 4:1 are desirable. On undeveloped areas, smaller levees built with road graders or specially designed equipment such as rice-levee plows offer management potential. These smaller levees, however, are less permanent and are difficult to repair if damage occurs during flooding.
Improvements in previously developed areas should stress fine tuning of water control or relocation of water-control structures. Major renovations may include establishment of contour levees, decreased intervals between levees, or reconfiguration of the area. Individual water control on each management parcel enhances management potential. For example, the addition of a header ditch with appropriate control structures may provide independent control on each management unit. Although initial development costs may be great, the area of high-quality habitat may increase dramatically. Installation of stoplogs that give finer control of water levels may be a minor but important improvement. Because plants readily respond to water level changes of as little as 1 in., the full potential of manipulations can only be met when the structure allows control at this level of precision. A mix of stoplogs of different dimensions, rather than only 4 in. or more in thickness, assures this potential. In dry regions, design of levees, ditches, and other control structures should be developed to make maximum use of available waters and reduce evapotranspiration.
Requirements of Vegetation Management
Manipulation of managed wetland areas often is better described as a learned craft or art, rather than strictly as applied science. Many differences exist among wetlands in different regions, areas, and sites. By recognizing the unique characteristics of their particular management area and of sites within each area, managers may enhance the ecological processes to emulate a more natural dynamic system. Preliminary assessments should include the following considerations:
Location—The site is of prime importance. Saline or alkaline areas have different problems from freshwater systems. Latitude is also important because of length of growing season and types of re
sources normally required by migrants or residents at that location. Topography—An understanding of the subtle elevational differences within specific wetland sites is essential for predicting vegetation response. Further, the topography may influence management options such as rate of drawdown or appropriateness of management options (e.g., wet and dry sites for common snipe). Water levels—A systematic record of water level changes is critical when assessing vegetation response to dewatering and when determining availability of optimum foraging depths (less than 10 inches)for dabbling ducks. A monitoring program should be designed with respect to the flooding source (i.e., rainfall or pumping), or important fluctuations may be overlooked. Water quality—In some locations water sources should be monitored for the presence of toxic substances to alert managers to potential problems. Site inspections and monitoring—Vegetation and wildlife responses should be monitored to evaluate site use and to identify manipulations needed to enhance or prevent certain vegetative conditions. Time of day, weather conditions, visibility, disturbance, and time in season are important considerations when observing wildlife use in a specific vegetation zone. Some species (e.g., migrants) may use specific wetland sites for only short periods of time, but these sites may be critical at those times. Monitoring schedules may vary depending on management objectives, but weekly or biweekly inspections or surveys during periods of peak use are more desirable than surveys at longer intervals. Records should be maintained for each unit rather than pooling all information for the area. Plant identification—Plants must be identified at all stages, including the young seedling stage, to ensure proper timing and type of manipulation. For undesirable plants, effective control requires action at the young seedling stage and before seed maturation. Unfortunately, most taxonomic texts do not include adequate information for identification of seeds or seedlings. Burrowing animals—Furbearers (such as muskrat and beaver) and other mammals (such as groundhogs) are important components of a dense wetland system, but control of these mammals is essential to maintain levee integrity in some situations. Rough fish—Carp and some other fish create high turbidity that influences the establishment
Fish and Wildlife Leaflet 13.4.9. •• 1988 4

and growth of submergents. Tilapia cause problems by competing with waterbirds for food and by forming nest bowls that are difficult to drain. Control of such fish is an integral part of effective vegetation management. Equipment—Equipment availability is essential for well-timed manipulations. Expensive dewatering activities may be wasted if equipment is unavailable or unreliable. Quick repair of equipment is often necessary when suitable conditions for manipulations may be restricted to a few weeks annually. Likewise, ineffective manipulations may occur with the most knowledgeable managers if inexperienced or overly enthusiastic equipment operators manipulate more than is necessary or modify the wrong vegetation. Timing—Manipulations are most effective if implemented at critical times. Management strategies that are designed for convenience or are conducted routinely may be ineffective because they do not match floral phenology or chronology of wildlife activities. Proper timing of manipulations enhances the potential for maximum production of foods and may increase the use of foods produced. Manipulations to modify vegetation require careful considerations because of costs, structural changes, diverse wildlife requirements, and long-term implications.
Suggested Reading
Fredrickson, L.H., and T.S. Taylor. 1982. Management of seasonally flooded impoundments for wildlife. U.S. Fish Wildl. Serv., Resour. Publ. 148. 29 pp.
Kaminski, R.M., H.R. Murkin, and C.E. Smith. 1985. Control of cattail and bulrush by cutting and flooding. Pages 253−262 in Coastal Wetlands. Lewis Publishers, Inc., Chelsea, Mich. 286 pp.
Kantrud, H.A. 1986. Effects of vegetation manipulation on breeding waterfowl in prairie wetlands—A literature review. U.S. Fish Wildl. Serv., Spec. Sci. Rep. -Wildl. 3, 15 pp.
Linde, A.F. 1985. Vegetation management in water impoundments: Alternatives and supplements to water-level control. Pages 51−60 in M.D. Kighton, ed. Water Impoundments for Wildlife: A Habitat Management Workshop. U.S. Dep. Agri. For Serv. St. Paul, Minn. 136 pp.
Murkin, H.R., R.M. Kaminski and R.D. Titman. 1982. Responses by dabbling ducks and aquatic invertebrates to an experimentally manipulated cattail marsh. Can. J. Zool. 60: 2324−2332.
Rundle, W.D. 1981. Habitat selection by fall migrant snipe in southeastern Missouri. Proc. Annu. Conf. Southeast Assoc. Fish Wildl. Agencies 35:20−26.
Smith, L.M., and J.A. Kadlec. 1985. Fire and herbivory in a Great Salt Lake marsh. Ecology 66:259−265.
Weller, M.W., and L.H. Fredrickson. 1973. Avian ecology of a managed glacial marsh. Living Bird 12:269−691.
Fish and Wildlife Leaflet 13.4.9. •• 1988 5

Appendix. Common and Scientific Names of Plants and Animals Named in Text.
Plants Silver maple . . . . . . . . . . . . . . . . . . . . . . . . . . . . . . . . . . . . . Acer saccharinum Mountain alder or speckled alder . . . . . . . . . . . . . . . . . . . . . . . . . . . . Alnus incana Alligatorweed chafflower . . . . . . . . . . . . . . . . . . . . . . . . . . Alternathera philoxeroides Straw-colored flatsedge . . . . . . . . . . . . . . . . . . . . . . . . . . . . . . . Cyperus strigosus Common barnyardgrass . . . . . . . . . . . . . . . . . . . . . . . . . . . . . Echinochloa crusgalli Sprangletop . . . . . . . . . . . . . . . . . . . . . . . . . . . . . . . . . . . . . . . Leptochloa spp. Purple loosestrife . . . . . . . . . . . . . . . . . . . . . . . . . . . . . . . . . . Lythrum salicaria American lotus . . . . . . . . . . . . . . . . . . . . . . . . . . . . . . . . . . . . . Nelumbo lutea Common reed . . . . . . . . . . . . . . . . . . . . . . . . . . . . . . . . . . . Phragmites australis Marsh knotwood or water smartweed . . . . . . . . . . . . . . . . . . . . . Polygonum coccineum Swamp smartweed . . . . . . . . . . . . . . . . . . . . . . . . . . . . Polygonum hydropiperoides Eastern cottonwood . . . . . . . . . . . . . . . . . . . . . . . . . . . . . . . . . . Populus deltoides Fremont cottonwood . . . . . . . . . . . . . . . . . . . . . . . . . . . . . . . . . Populus fremontii Willow . . . . . . . . . . . . . . . . . . . . . . . . . . . . . . . . . . . . . . . . . . . . . Salix spp. Black willow . . . . . . . . . . . . . . . . . . . . . . . . . . . . . . . . . . . . . . . . Salix nigra Saltmarsh bulrush or alkali bulrush . . . . . . . . . . . . . . . . . . . . . . . . Scirpus robustus Sesbania . . . . . . . . . . . . . . . . . . . . . . . . . . . . . . . . . . . . . . . . . . Sesbania spp. Saltcedar tamarisk or salt cedar . . . . . . . . . . . . . . . . . . . . . . . . . . Tamarix pentandra Cattail . . . . . . . . . . . . . . . . . . . . . . . . . . . . . . . . . . . . . . . . . . . . Typha spp. Common cocklebur . . . . . . . . . . . . . . . . . . . . . . . . . . . . . . . Xanthium strumarium
Birds, mammals, and fish Common snipe . . . . . . . . . . . . . . . . . . . . . . . . . . . . . . . . . . . Gallinago gallinago Beaver . . . . . . . . . . . . . . . . . . . . . . . . . . . . . . . . . . . . . . . . Castor canadensis Groundhog or woodchuck . . . . . . . . . . . . . . . . . . . . . . . . . . . . . . Marmota monax Nutria . . . . . . . . . . . . . . . . . . . . . . . . . . . . . . . . . . . . . . . . . Myocastor coypus Muskrat . . . . . . . . . . . . . . . . . . . . . . . . . . . . . . . . . . . . . . . Ondatra zibethicus Common carp . . . . . . . . . . . . . . . . . . . . . . . . . . . . . . . . . . . . . . Cyprinus carpio Tilapia . . . . . . . . . . . . . . . . . . . . . . . . . . . . . . . . . . . . . . . . . . . . Tilapia spp.
����������������������������������������
������������������������� ���������������������������� ����������������� •• � ����
6 Fish and Wildlife Leaflet 13.4.9. •• 1988

W A T E R F O W L M A N A G E M E N T H A N D B O O K
13.4.10. Control of Willow and Cottonwood Seedlings in Herbaceous Wetlands
Leigh H. Fredrickson and Frederic A. Reid Gaylord Memorial Laboratory School of Forestry, Fisheries and Wildlife University of Missouri-Columbia Puxico, MO 68960
Willow and cottonwood are common species in forested wetlands and occur throughout most riparian and floodplain habitats of North America. These woody species are especially common in early successional stands where seasonal flooding occurs regularly. Cottonwood and willow are often considered problem plants, because they rapidly invade wetlands dominated by herbaceous flora and can form dense, extensive stands. The shade created by these species eliminates herbaceous undergrowth, and once the sapling stage is reached, cottonwoods and willows are difficult to eradicate. Control of these species can be costly and varies considerably with latitude.
Willow and cottonwood growth may be undesirable where intensive management of seasonally flooded impoundments is encouraging herbaceous growth or where levee structures could be compromised because of root intrusion. If woody plant control is a priority, life history responses within specific regions must be identified before attempting specific management manipulations. For instance, at more northern sites, seedlings and saplings that have been mowed can be controlled by shallow flooding. However, summer flooding at more southern sites is difficult because of evapotranspiration and can, in fact, accelerate growth. Control in these southern areas may best be achieved by taking advantage of summer droughts.
A complete drawdown of an impoundment during the hottest days of summer prevents development of extensive root systems in newly established seedlings. Shallow discing at this time ensures destruction of newly established seedlings and disrupts the root systems of older plants. Drawdowns that expose expanses of mudflats before seed dispersal may enhance germination of woody species adapted to wet sites at southern latitudes, whereas drawdowns after seed dispersal reduce establishment of woody growth and confine it to narrower mudflat zones. Deep flooding that covers all aboveground growth can eliminate young seedlings.
Techniques for physical disturbance include several options. Shallow discing is a traditional technique that destroys both above- and below-ground growth, yet is economical. A double cross-disc is most effective in dense stands. Discing twice, or even three times, in a growing season may be most effective for controlling young woody growth. Drought conditions may allow more opportunities for discing. When sapling size reaches approximately a 3-in. stem diameter, discing becomes ineffective. Mowing with a bushhog is an option even after discing is infeasible, but root systems are not modified. Additionally, multiple shoots will develop from most severed trunks. Fall mowing, followed by flooding throughout the next growing season, may effectively control willow saplings. When stem diameters reach 4 in. or greater, bulldozers may be the only realistic option for control. Large earthmoving equipment is not always an option because it • is expensive • requires experienced operators
Fish and Wildlife Leaflet 13.4.10. • 1988 1

• requires dry impoundments • removes some of the topsoil • destroys natural swales • deepens ditches and swales, thus increasing
volume of water retained and • compacts the soil.
Chain saws may be used on large trees, especially if only a few trees present problems. This technique is time consuming and leaves stumps that may rapidly sprout unless treated with herbicides.
Herbicides are a chemical option, but chemicals and application are usually costly. Furthermore, chemical use is often restricted in aquatic systems and on public lands. Although chemicals are expensive, their use may be more economical than control with heavy equipment in some situations. Some chemicals may have residual effects on desired vegetation and future plant growth. Use of chemical control must be carefully balanced with other options before implementation. Chemicals may play a particularly important role on some sites that are inaccessible or cannot be disced because of vegetative structure or flood debris.
Control of woody species requires major management costs in labor, fuel, and machinery. Costs for control by discing willow seedlings or early sapling growth at the Ted Shanks Wildlife Management Area, Missouri, are $3,000/year or more on the 2,470-acre (1,000-ha) tract managed for moist-soil and agricultural crops. Control of older woody stands with bulldozers may require expenditures
in excess of $10,000. On sites suitable for agricultural crops, alternating years of cultivation offers good short-term control.
Managers should be cautious when modifying natural sites that are dominated by willow and cottonwood. This habitat should be viewed as an integral component of a wetland complex that provides somewhat different sources of food and cover than other wetland types. Although extensive stands of these woody species may seldom be used, creating openings or increasing the amount of edge may be less costly and may provide needed resources for some species. Recent evidence suggests that leaf litter may be especially important in maintaining crustacean populations, which are critical food sources for hooded mergansers, mallards, wood ducks, yellow-crowned night-herons, and others. The structure of older trees may also provide important cover and nest sites for colonial waterbirds and passerines such as willow flycatchers and yellow warblers. Beaver impoundments throughout the continent are often dominated by willow and cottonwood. Such natural areas can only be degraded by the control of woody plants. Cottonwood and willow are usually least desirable when they occur as extensive monocultures. A mixture of these species with others usually provides desired food and cover in wetlands. Thus, management planning should consider woody species in long-term habitat objectives.
2 Fish and Wildlife Leaflet 13.4.10. • 1988

Appendix. Common and Scientific Names of Plants and Animals Named in Text.
Plants Eastern cottonwood . . . . . . . . . . . . . . . . . . . . . . . . . . . . . . . . . . Populus deltoides Fremont cottonwood . . . . . . . . . . . . . . . . . . . . . . . . . . . . . . . . . Populus fremontii Willow . . . . . . . . . . . . . . . . . . . . . . . . . . . . . . . . . . . . . . . . . . . . . Salix spp.
Birds and mammals Wood duck . . . . . . . . . . . . . . . . . . . . . . . . . . . . . . . . . . . . . . . . . . Aix sponsa Mallard . . . . . . . . . . . . . . . . . . . . . . . . . . . . . . . . . . . . . . . Anas platyrhynchos Willow flycatcher . . . . . . . . . . . . . . . . . . . . . . . . . . . . . . . . . . Empidonax traillii Yellow warbler . . . . . . . . . . . . . . . . . . . . . . . . . . . . . . . . . . . Dendroica petechia Hooded merganser . . . . . . . . . . . . . . . . . . . . . . . . . . . . . . . Lophodytes cucullatus Yellow-crowned night-heron . . . . . . . . . . . . . . . . . . . . . . . . . . . Nycticorax violaceus Beaver . . . . . . . . . . . . . . . . . . . . . . . . . . . . . . . . . . . . . . . . Castor canadensis
����������������������������������������
������������������������� ���������������������������� ����������������� •• � ����
Fish and Wildlife Leaflet 13.4.10. •• 1988 3

W A T E R F O W L M A N A G E M E N T H A N D B O O K
13.4.11. Control of Purple Loosestrife
Daniel Q. Thompson 623 Del Norte Place Fort Collins, CO 80521
Purple loosestrife is an herbaceous perennial weed that is native to Eurasia and probably arrived in eastern North America with early maritime traffic. The spread of this alien by 1900 (Fig. 1) was closely associated with canal and waterway traffic. By 1985 (Fig. 2), this aggressive weed had spread into all of the contiguous States north of the 35th parallel except Montana; similarly, all of the southern provinces of Canada had been invaded. In the last 20 years, loosestrife has become well established in reclamation projects and riparian wetlands in the West and Northwest. It has also invaded estuarine marshes in British Columbia.
The impact of this weed on North American wetland habitats has been disastrous. In many areas, purple loosestrife makes up more than 50% of the biomass of emergent vegetation. Moreover, these displacements are seemingly permanent, as seen in the Northeast, where many purple loosestrife stands have maintained themselves for more than 20 years. The effects of these changes have not been well studied but biologists believe that serious reductions in productivity of waterbirds and aquatic furbearers have resulted. Platformnesting species cannot use the stiff loosestrife stems for nest construction, nor are stems or rootstocks palatable to muskrats. In addition, dense, closely-spaced clumps do not provide brood cover or foraging areas. Although white-tailed deer and livestock will readily graze on young, succulent plants, palatability declines by late June and the forage value of wetland
Fish and Wildlife Leaflet 13.4.11. •• 1989
pastures that have been invaded by purple loosestrife is seriously reduced.
Field Identification
Purple loosestrife is most readily identified by its tall, showy spikes of pink-red flowers that bloom from late June to early September. Mature plants can have 30 or more stems arising 6 feet above a perennial rootstock (Fig. 3). With the onset of fall frost, leaves turn red for about 2 weeks; shortly thereafter, they fade and gradually fall. The sturdy, rigid stems remain standing through winter and spring—well into the following growing season. Each stem supports dense, spiralling rows of dark-brown seed capsules that will remain attached to the floral stalks through the winter, creating a distinctive silhouette that is useful in field recognition. From overhead, the brownish tone of each clump of dead stems could make a useful signature in aerial photography.
Adaptations
Most serious weeds are of foreign origin and have evolved competitive mechanisms in their native habitats that preadapt them to be successful on new continents that they may invade. Purple loosestrife is no exception; its affinity for freshwater marshes, open stream margins, and alluvial floodplains in Europe is closely paralled by its invasion of similar sites in North America. Moreover, its most common plant associates in American habitats
1

Fig. 1. Spread of purple loosestrife as of 1900.
(cattails, reed canarygrass, sedges, and rushes) are highly similar to its associates in Europe.
The outstanding success of loosestrife in invading American wetlands is supported by a remarkable list of weedy attributes. Purple loosestrife has demonstrated a high degree of resistance to chemi
cal control, indicating that the genetic makeup of our American population is robust. Vigorous and varied modes of reproduction also characterize a successful weed. These traits are demonstrated in prolific seed production that issues from the dense whorls of capsules that are borne on each floral stalk; 3-year-old plants can produce in excess of 1 million seeds. Vegetative reproduction is another competitive advantage; loosestrife can withstand clipping, crushing, or shallow burial by sending up new shoots from adventitious buds arising from stems or rootcrowns (Fig. 4). Purple loosestrife also has a wide scope of seed dispersal mechanisms. The flat, thin-walled seeds are small enough to be carried in the plumage of migrant waterbirds or the fur of aquatic mammals; they have also been recovered from mud caked on the feet of shorebirds. Similarly, seeds trapped in mud on footgear, vehicle treads, or in the cooling systems of outboard motors could account for local and long-distance jumps in the distribution of this weed. Drift in flowing water or by wind on the surface of open water are the most likely means of local spread.
Purple loosestrife has an added advantage over most weeds in that it is cultivated and sold as horticultural stock across the northern United States
Fig. 2. Distribution of purple loosestrife as of 1985.
2 Fish and Wildlife Leaflet 13.4.11. •• 1989

Fig. 3. Structure, growth forms, and field identification of purple loosestrife.
and southern Canada. Most of these stocks are infertile hybrids; however, some local sources include fertile plants that could escape into downstream wetlands. Beekeepers have also been responsible for the spread of purple loosestrife into uninfested wetlands. They value the plant as a source for nectar and pollen and have scattered seed in several midwestern waterways. With growing awareness of the impact of loosestrife on wildlife habitats, this practice is declining.
Another source of escapes arose from a growing interest in the restoration of native vegetation on country acreage. More than 150 private seed companies offer seed mixes of "wildflowers" and native prairie vegetation. A recent survey indicated that about 25% of the lists of seed mixes from these suppliers contained alien species; 10% of the lists containing aliens included purple loosestrife. Anyone attempting to restore a marsh or wet prairie with the faulty mixes would be inviting disaster. Within the past 10 years, Idaho, Illinois, Ohio, Minnesota, and Wisconsin have enacted legislation to check
Fig. 4. Adventitious shoots of purple loosestrife arising from stems that have lodged onto a mat of duckweed (Lemna spp.) in a deepwater marsh near Rome, Wisconsin.
the spread of purple loosestrife through seed supplies or horticultural stocks.
Habitat Vulnerability
To protect their resource, wetland managers need to develop a sensitivity to the vulnerability of habitats to purple loosestrife invasion. Since loosestrife spreads primarily by floating seeds or propagules, a marsh basin or pothole that is isolated from surrounding drainage channels is relatively secure from infestation. The configuration and continuity of a river or waterway determines its vulnerability. Mountain or high plateau streams with steep gradients and narrow canyons are relatively invulnerable to loosestrife colonization and spread. In contrast, streams with low gradients and broad floodplains have shallow cross-sections and slow, winding channels that offer many opportunities for colonization by drifting seeds or propagules. Streambank cover is also an important determinant of vulnerability to invasion by an emergent perennial weed. The presence of cattails, grasses, sedges, or rushes (purple loosestrife’s most frequent associates in North America) identifies a habitat that is susceptible to invasion. In contrast, streams that are bordered by woody vegetation (riverbottom hardwoods in the East; spruce, willow, and alder in the West) have well-shaded banks where the high light requirement of purple loose-strife precludes seedling development.
Fish and Wildlife Leaflet 13.4.11. •• 1989 3

Recent Control Efforts
Chemical—Although early efforts to control purple loosestrife with chemicals were discouraging, the advent of glyphosate (Roundup:N-[phosphonomethyl] glycine) brought new promise of success. Designed as a postemergence spray for the control of agricultural weeds, this broad-spectrum herbicide was authorized for field tests on purple loosestrife in upstate New York in 1979. These experiments showed no significant differences among three rates (1.7, 3.4, and 6.7 kg/ha) of application but revealed sharp differences in responses to timing of application; treatments in the 2nd week of August at late flowering stage obtained nearly 100% shoot reduction. This work also showed that seedling survival was affected by the timing of application; the plots sprayed in June became reinfested with seedlings whereas the plots sprayed in July and August were free of seedlings.
In 1982, a new formulation of glyphosate (Ro-deo-EPA Reg. No. 524-343) was approved for use over water, thereby clearing glyphosate for field use against purple loosestrife. Rodeo has subsequently been used for loosestrife control in the Northeast and Midwest with some success. Nevertheless, several problems confront the use of glyphosate in natural habitats. First, single applications seldom result in complete control; each summer, a small percentage of purple loosestrife crowns fail to send up shoots and thus avoid mortality. Second, the movement of ATV spray rigs in wetland habitats can cause more damage to the community than control of weed clumps will relieve. Last, although aerial spraying will avoid physical damage to the habitat, the widespread use of a broad-spectrum herbicide on complex wetland communities will have unknown effects on nontarget native species. Field studies in a wide range of habitats have shown that herbicides can affect breeding birds by altering the structure, foliage diversity, and species composition of vegetation treated. The wise use of chemical control in natural habitats hinges on the care with which the treatment is delivered. The delivery system should be as gentle and as target-specific as possible.
Water manipulation—Awareness of the effects of soil and water levels on purple loosestrife is one of the wetland manager’s most useful means of coping with the weed. Experimental work in Ohio on the effects of flooding on loosestrife seedlings showed that duration of flooding was more important than depth; mortality in 8-inch seedlings covered by 12 or more inches of water increased sharply after 2
weeks, reached 95% mortality by 4 weeks, and 100% by 5 weeks. Seedlings with terminal growths extending above the water surface grew vigorously and survived flooding.
Mowing and tillage—Along irrigation canal banks or other rights-of-way where tractors can operate, repeated mowing or clipping will greatly reduce the vigor of purple loosestrife. A combination of spraying with a broad-leaf herbicide and subsequent repeated mowing will encourage monocot competitors; with grasses reestablished, the cover can be more easily maintained. These efforts will also suppress a potential source of loosestrife seeds from migrating down the canal. Loosestrife’s woody rootstock is the key to its vulnerability to tillage. As an herbaceous perennial, it stores energy in its root crown which lies in the upper 6 inches of the soil. Tillage with disc or harrow is an effective means of grubbing loosestrife rootstalks from fallow fields or open borders where disturbance to the soil or plant community is acceptable. To suppress adventitious shoots arising from broken rootstocks, spot spraying with an herbicide will probably be needed—followed by seeding with native grasses or reed canarygrass.
Other measures—Another way to suppress loosestrife seedlings is to sow Japanese millet on muck beds exposed by an early drawdown. In addition to suppressing loosestrife seedlings, mature emergent millet stands can provide high-quality waterfowl food. This technique would be particularly useful on small areas that are accessible for hand seeding, e.g., waterbird display pools; it would be less useful during drawdowns on large impoundments with scattered emergent stands and many remote muck flats that would be difficult to reach. Plant competition can be used by the wetland manager to slow or even stop the spread of local infestations. Loosestrife seedlings cannot establish or survive in the shade of willow or alder thickets, nor under the canopies of wetland hardwoods. Wetland managers threatened with the invasion of purple loosestrife should be careful not to stress or disturb shrub or tree communities under their care.
Biological Control
Field studies in North America and Europe have identified purple loosestrife as an excellent candidate for biological control. Since 1987, interagency (USDA and USFWS) efforts have been underway for the biological control of purple loosestrife. Thus far, several promising candidate in-
Fish and Wildlife Leaflet 13.4.11. •• 1989 4

sect control agents have been identified; search and screening for additional agents continue in Europe. Meanwhile, rigorous host specificity tests on a list of cultivated and native plants from North America have begun in Europe on three insect species. Additional screening tests will be performed in quarantine in North America.
Containment
At present, containing the spread of existing infestations is our best strategy. The rate of spread of purple loosestrife between 1940 and 1980 has been estimated to be 1,160 km2/year (381 mi2/year). This relatively slow rate of expansion can be further reduced with several countermeasures.
Early detection—Purple loosestrife has several characteristics that can be exploited to slow its spread and impact. First, its tall floral stalks immediately identify an established plant. Second, it is difficult for loosestrife propagules to gain foothold in undisturbed wetland habitat; they need a patch of moist soil that is open to sunlight to establish themselves as seedlings. Last, if an isolated plant somehow becomes established in an otherwise healthy wetland, its seeds will remain dormant and suppressed by surrounding native vegetation—thus giving an alert wetland manager time to eradicate the invader. Managers whose units are within the limits of loosestrife distribution should include an annual search for purple loosestrife in their work schedules. The search need not be highly organized or exclusively pursued, but it is important that it remain among each summer’s plans. Annual lowlevel aerial photography can be helpful in maintaining surveillance of loosestrife infestations; scientists in Ohio have constructed infestation maps from 35mm color transparencies obtained from county Agricultural Stabilization and Conservation Service files.
Local eradication—Wetland managers who are alert to the first appearance of purple loosestrife can successfully follow a program of local eradication. If the infestation occurs as scattered, young plants in soft, organic soil, hand pulling or digging is often feasible; however, since fragments of stem or root crown can regenerate new plants, all pulled material must be carried out of the wetland basin. Wisconsin wetland managers have found that small areas (less than 50 plants), isolated colonies can be eradicated with herbicides delivered from hand-carried sprayers. The herbicide should be applied directly on the weed’s foliage. When using glyphosate,
great care should be taken to avoid drift onto the weed’s nearest neighbors; these plants are needed to close in the space occupied by the dying loosestrife clump. Spraying with glyphosate can be done any time after loosestrife foliage is well developed; however, best results will be obtained with late summer applications. Broadleaf herbicides (2,4-D) are also effective on purple loosestrife; moreover, they offer the advantage of not harming monocots which are loosestrife’s most frequent neighbors. Although best results with 2,4-D come from applications in early growth stages (late May to early June), the absence of flower spikes increases the chances that spray crews will overlook some plants. Whatever herbicide is used, the infestation sites should be revisited later in the season, and in subsequent years, to be sure that all loosestrife survivors are eradicated.
Minimum impact management—Until a biological control program can be implemented, the key to coping with established purple loosestrife is to avoid any manipulations or actions that might stress the native vegetation and allow loosestrife seedlings to spring up from dormant seed stocks. The standard waterfowl management practice of early drawdown to encourage smartweed and millet seedlings on shallow impoundment margins is an open invitation to purple loosestrife dominance. Shallow reflooding to provide dabbling duck foraging will often not be sufficiently deep to suppress young loosestrife seedlings. If a drawdown cannot be avoided (for example, a water control structure needs repair), the work should be delayed until mid-July. By this time, the peak of the growing season will have passed and loosestrife seedlings will not have sufficient time to grow to a size that would survive re-flooding and overwinter dormancy.
Suggested Reading
Balogh, G. R., and T. A. Bookhout. 1989. Remote detection and measurement of purple loosestrife stands. Wildl. Soc. Bull. 17:66−67.
Henderson, R. 1987. Status and control of purple loosestrife in Wisconsin. Wis. Dep. Nat. Resour., Res. Manage. Findings 4 (July). 4 pp.
Malecki, R. A., and T. J. Rawinski. 1985. New methods for controlling purple loosestrife. N.Y. Fish Game J. 32:9−19.
Rawinski, T. J., and R. A. Malecki. 1984. Ecological relationships among purple loosestrife, cattail and wildlife at the Montezuma National Wildlife Refuge. N.Y. Fish Game J. 31:81−87.
Fish and Wildlife Leaflet 13.4.11. •• 1989 5

Thompson, D. Q., R. L. Stuckey, and E. B. Thompson. Wilcox, D. A. 1989. Migration and control of purple 1987. Spread, impact, and control of purple loosestrife (Lythrum salicaria L.) along highway loosestrife (Lythrum salicaria) in North American corridors. Environ. Manage. 13:(in press). wetlands. U.S. Fish Wildl. Serv., Fish Wildl. Res. 2. 65 pp.
Appendix. Common and Scientific Names of Plants and Animals Named in Text.
Plants Alder . . . . . . . . . . . . . . . . . . . . . . . . . . . . . . . . . . . . . . . . . . . . . Alnus sp. Sedge . . . . . . . . . . . . . . . . . . . . . . . . . . . . . . . . . . . . . . . . . . . . . Carex sp. Japanese millet . . . . . . . . . . . . . . . . . . . . . . . . . . . . . . . . . . Echinochloa crusgalli Rush . . . . . . . . . . . . . . . . . . . . . . . . . . . . . . . . . . . . . . . . . . . . . . Juncus sp. Duckweed . . . . . . . . . . . . . . . . . . . . . . . . . . . . . . . . . . . . . . . . . . . Lemna sp. Purple loosestrife . . . . . . . . . . . . . . . . . . . . . . . . . . . . . . . . . . Lythrum salicaria Reed canarygrass . . . . . . . . . . . . . . . . . . . . . . . . . . . . . . . . Phalaris arundinacea Spruce . . . . . . . . . . . . . . . . . . . . . . . . . . . . . . . . . . . . . . . . . . . . . . Picea sp. Smartweed . . . . . . . . . . . . . . . . . . . . . . . . . . . . . . . . . . . . . . . Polygonum sp. Willow . . . . . . . . . . . . . . . . . . . . . . . . . . . . . . . . . . . . . . . . . . . . . . Salix sp. Cattail . . . . . . . . . . . . . . . . . . . . . . . . . . . . . . . . . . . . . . . . . . . . . Typha sp.
Animals White-tailed deer . . . . . . . . . . . . . . . . . . . . . . . . . . . . . . . . Odocoileus virginianus Muskrat . . . . . . . . . . . . . . . . . . . . . . . . . . . . . . . . . . . . . . . Ondatra zibethicus
����������������������������������������
������������������������� ���������������������������� ����������������� •• � ����
6 Fish and Wildlife Leaflet 13.4.11. •• 1989

W A T E R F O W L M A N A G E M E N T H A N D B O O K
13.4.12. Control of Phragmites or Common Reed
Diana H. Cross and Karen L. Fleming Office of Information Transfer U.S. Fish and Wildlife Service 1025 Pennock Place, Suite 212 Ft. Collins, CO 80524
Phragmites, or common reed, is a perennial grass often associated with wetlands. When phragmites is interspersed with open water or with other vegetation, waterbirds and small mammals find cover among the stems. Its dense root systems strengthen dikes and roads. On many sites, however, this robust emergent forms monotypic, impenetrable stands having little value for waterfowl. Ducks occasionally nest on the edges of large stands, but avoid the dense interior.
Phragmites is native to North America and is found worldwide, primarily in lowland temperate regions. Phragmites can occupy upland sites with seeps, or grow in brackish or fresh water several feet deep. Large monocultures are usually associated with impounded areas and resultant stabilized water regimes. Such sites, having levees or water-control structures that keep large areas moist for long periods, create ideal situations for phragmites to become a problem. The plants are less competitive when there is variation in water levels among wet and dry seasons and years. Growth is often stunted where soil fertility is extremely high or low or where salinity is high. Phragmites usually establishes itself on dry borders of marshes, but frequently invades shallow water foraging sites by outcompeting and subsequently replacing more desirable emergent plants.
Fish and Wildlife Leaflet 13.4.12. •• 1989
Because waterfowl benefit from interspersion of phragmites with other plant species and water, we do not recommend eradication of this plant from wetlands. Instead, phragmites should be controlled only to the degree necessary to achieve management objectives. By understanding the ecology and life history of phragmites, such control is more easily achieved.
Ecology and Life History Phragmites has a thick stalk that can reach
13 ft (4 m) under optimal conditions. This height is usually not seen until 5−8 years after establishment. The long, flat leaves spread out widely from the stem and are relatively broad, gradually narrowing to a fine tip (Figure). The very high transpiration rate of phragmites is achieved primarily through these leaves. The terminal flower cluster consists of numerous perfect flowers. These flowers, purplish at first, gain long, white silky hairs around them by maturity, creating the large, plumelike flower cluster that persists through winter.
Phragmites most often spreads vegetatively by stout, creeping rhizomes. Fragments of these rhizomes are viable if they have at least two or three nodes and are 8 in. (20 cm) long. All stands have horizontal and vertical rhizomes, and young stands also have long surface runners that aid rapid expansion of the colony. Mature clones normally have a balance of vertical and horizontal rhizomes, while colonizing clones have predominantly horizontal rhizomes. Although these rhizomes are usually 8−39 in. (20−100 cm) below the substrate surface, they can penetrate to twice that distance. Thick
1
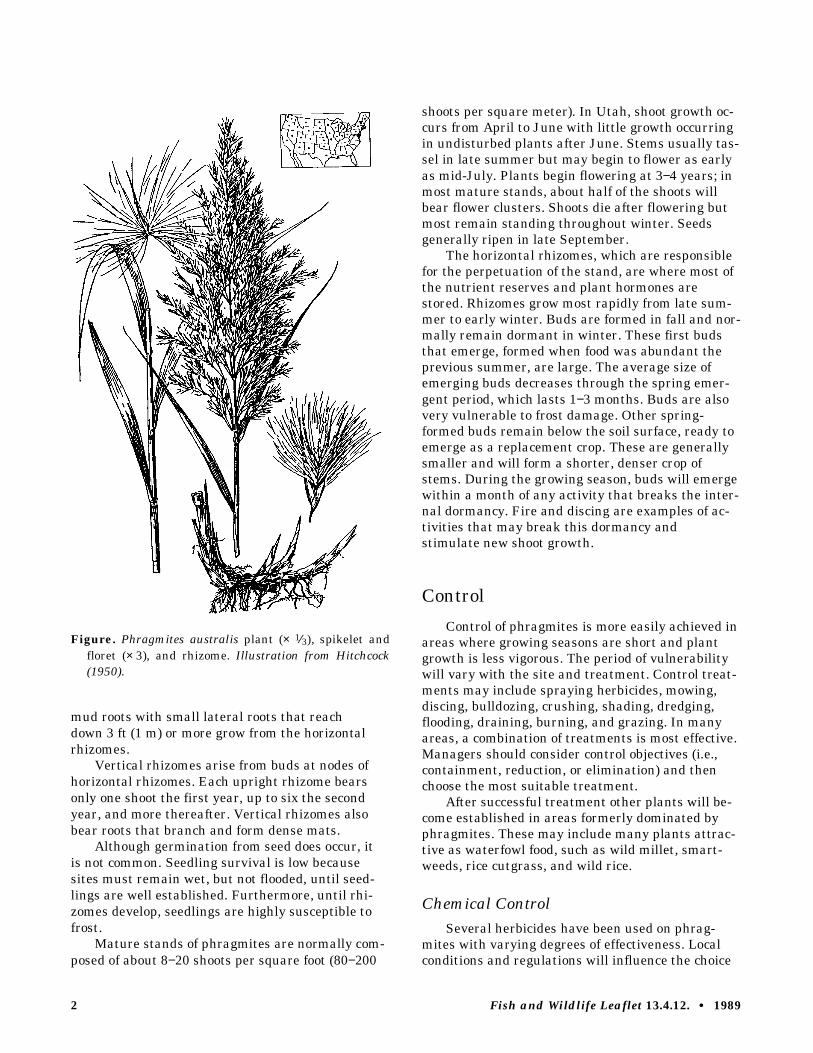
Figure. Phragmites australis plant (× 1⁄3), spikelet and floret (× 3), and rhizome. Illustration from Hitchcock (1950).
mud roots with small lateral roots that reach down 3 ft (1 m) or more grow from the horizontal rhizomes.
Vertical rhizomes arise from buds at nodes of horizontal rhizomes. Each upright rhizome bears only one shoot the first year, up to six the second year, and more thereafter. Vertical rhizomes also bear roots that branch and form dense mats.
Although germination from seed does occur, it is not common. Seedling survival is low because sites must remain wet, but not flooded, until seedlings are well established. Furthermore, until rhizomes develop, seedlings are highly susceptible to frost.
Mature stands of phragmites are normally composed of about 8−20 shoots per square foot (80−200
shoots per square meter). In Utah, shoot growth occurs from April to June with little growth occurring in undisturbed plants after June. Stems usually tassel in late summer but may begin to flower as early as mid-July. Plants begin flowering at 3−4 years; in most mature stands, about half of the shoots will bear flower clusters. Shoots die after flowering but most remain standing throughout winter. Seeds generally ripen in late September.
The horizontal rhizomes, which are responsible for the perpetuation of the stand, are where most of the nutrient reserves and plant hormones are stored. Rhizomes grow most rapidly from late summer to early winter. Buds are formed in fall and normally remain dormant in winter. These first buds that emerge, formed when food was abundant the previous summer, are large. The average size of emerging buds decreases through the spring emergent period, which lasts 1−3 months. Buds are also very vulnerable to frost damage. Other spring-formed buds remain below the soil surface, ready to emerge as a replacement crop. These are generally smaller and will form a shorter, denser crop of stems. During the growing season, buds will emerge within a month of any activity that breaks the internal dormancy. Fire and discing are examples of activities that may break this dormancy and stimulate new shoot growth.
Control
Control of phragmites is more easily achieved in areas where growing seasons are short and plant growth is less vigorous. The period of vulnerability will vary with the site and treatment. Control treatments may include spraying herbicides, mowing, discing, bulldozing, crushing, shading, dredging, flooding, draining, burning, and grazing. In many areas, a combination of treatments is most effective. Managers should consider control objectives (i.e., containment, reduction, or elimination) and then choose the most suitable treatment.
After successful treatment other plants will become established in areas formerly dominated by phragmites. These may include many plants attractive as waterfowl food, such as wild millet, smartweeds, rice cutgrass, and wild rice.
Chemical Control Several herbicides have been used on phrag
mites with varying degrees of effectiveness. Local conditions and regulations will influence the choice
Fish and Wildlife Leaflet 13.4.12. •• 1989 2

Table. Reduction of phragmites effected by three herbicides (data obtained from the literature; citations available upon request).a
Time of Herbicideb Dosage application Comments
Amitrole 12 lb/a summer increase dosage on wet sites Amitrole and dalapon 2 lb and 10 lb/a summer increase dosage on wet sites Dalapon 15-30 lb/a throughout growing season burned 7−−19 weeks before treatment,
longer interval more effective Dalapon 20 lb/a throughout growing season most effective in August and
September Dalapon 22.3 lb/a and 10.7 lb/a September and following May Dalapon 12 lb/a and 12 lb/a May and June effective through two growing seasons Dalapon 15 lb/a and 15 lb/a May and June effective to third growing season Glyphosate 4-6 lb/a June equally effective applied at 2 lb/a
2 successive years Glyphosate (Rodeo) 4-6 lb/a September lower dosage equally effective Glyphosate (Rodeo) 4 lb/a September applied by helicopter Glyphosate 10.7 lb/a late fall a All treatments considered successful by investigators. Percent reductions are not provided because post-treatment evaluations were not
performed at comparable intervals.b Mention of trade names does not imply U.S. Government endorsement.
of herbicides. Systemic herbicides are most effective if applied to actively growing plants, when sugars are being translocated from the leaves to the rhizomes. On moderately wet sites, the period of optimal control occurs from full growth to early fruiting. Aerial application of chemicals should never be undertaken until after waterfowl have completed nesting activities because of possible overdrift. In areas with long, hot summers, spraying may be done as late as mid-September.
Chemical control of phragmites has been achieved most frequently with amitrole, dalapon, and glyphosate (Table). These herbicides are absorbed by the foliage and are translocated to the rhizomes. If the dosage is too concentrated, top kill may occur before the herbicide can be translocated to the rhizome and treatment will not be effective. Care should be taken not to break stems during treatment, as this would also prevent the herbicide from reaching the rhizomes.
Amitrole may be used to effectively control phragmites on flooded and dry sites. Neither dalapon nor glyphosate (as Rodeo, the formulation approved in most States for use in wetlands) are as effective on flooded sites, but they will produce results on moist or dry sites. Rodeo can also be effective when sprayed on senescing shoots during late fall. Several researchers have found that split applications (at 1/2 the dosage) work better than a single, full-strength application. This treatment method is likely to be less stressful to the environ
ment, as well. The second dose should be applied 15−30 days after the first.
Size, accessibility, and proximity of phragmites stands to other vegetation or wetlands dictates the most appropriate application technique. Regardless of method, herbicides must be applied at the dosage prescribed on the label for maximum effectiveness. On smaller beds, backpack spray equipment is sufficient. If areas are very large or are inaccessible from the ground, aerial spraying by an experienced helicopter pilot is suggested. A marker system should be in place before flying transects to maintain a reference point when the tank is refilled. For best results, the same area should be sprayed in 2 successive years, then spot-treated as necessary thereafter. Infrared photographs of treated areas are helpful in locating any missed spots. Equipment used for aerial spraying must be free of leaks and have complete cut-off capabilities to prevent treatment of nontarget areas. The cost of aerial spraying in the late 1980’s varied from $30 to $50 per acre; some refuges have taken advantage of State cost-sharing programs or made agreements with the highway department to reduce costs.
Mechanical Control
Mechanical control is difficult, but possible on sites that are flooded or consistently moist. A "cookie cutter" or rotary ditch digger can be used in flooded areas to chop through rhizome-packed substrates, creating openings in dense stands. On
Fish and Wildlife Leaflet 13.4.12. •• 1989 3

drier sites, bulldozers, brushcutters, discs, rototillers, mowers, crushers, and plows can be practical and effective. On unflooded areas, discing is often the most practical method, but crushing repeatedly with rollers also may contribute significantly to phragmites control. Dredging is effective in some situations, but potential effects on wetlands and aesthetic considerations limit its use.
On areas that are dry in late summer, phragmites may be mowed with sicklebar mowers or rotary brush cutters. After 3 consecutive years of summer mowing in Canada, phragmites was replaced by short grass-sedge-sowthistle meadow. Phragmites stands mowed in spring will recover with shorter but more dense growth than the original crop, and will almost always develop fully within the same season. Thus, mowing is most effective in August and September. When beds are too large for annual mowing, wide strips cut through the stands create more edge and make stands more attractive to waterfowl.
Discing in summer or fall reduces stem density, but discing from late winter to midsummer stimulates bud production and results in stands with greater stem density. Discing is more effective than plowing because the chopped rhizome pieces that result are too small to be viable. The most effective time for cutting rhizomes is late in the growing season. Furthermore, in dry areas, rhizome fragments remaining above ground may dry out or freeze, while fragments buried deeply will deplete energy sources before buds reach the surface. Like discing, bulldozing is destructive to phragmites under certain conditions. A latesummer treatment may expose rhizomes to killing winter frosts, provided the area remains unflooded. Dredging removes phragmites from flooded areas, but unless the horizontal rhizomes are removed or the area remains deeply flooded (more than 5 ft or 1.5 m) following dredging, regrowth will almost certainly occur.
Water-level manipulation, where it can be used, is a useful tool for controlling phragmites. Flooding will not alter established stands, but if water levels greater than 12 in. (30 cm) are maintained, colonies will not expand. At these depths, runners are unable to anchor and will float to the surface. Seedlings are easily killed by raising water levels, but timing of water-level manipulations must be carefully determined to be effective and to avoid conflicts with other management objectives.
Draining water from established stands often reduces plant vigor and allows more desirable species to compete, but drying may require several
years to degrade a stand. The potential benefits of severe frosts are more likely to be achieved on drained areas. On many wetland areas, however, drainage is neither practical nor desirable.
Abrupt alteration of salinity (e.g., by allowing salt-water intrusion into a coastal impoundment) can be effective if used before stands are well established. However, because phragmites is more salt-tolerant than many other emergents, the saltwater challenge is more likely to hurt competing plants and the freshwater biota than it will phragmites.
Fire used alone as a control measure has variable results depending on intensity of the burn, but is generally most effective in late summer. Generally, winter burning affords no control and often increases densities of spring crops unless a latespring freeze kills new buds. Spring burning without other control treatments is ineffective because the original stand is simply replaced with a more vigorous growth. In fact, burning in spring removes all dead stems and litter and scorches buds, stimulating multiple buds to develop and emerge. Early to midsummer burns are also ineffective because regrowth still replaces the original stand. Burning phragmites late in the growing season reduces stand vigor temporarily because few replacement buds are available. Furthermore, reserve energy is in the rhizomes by then and cannot be used for winter bud production. In dry, peaty areas, late-summer burns kill phragmites roots and rhizomes, creating depressions that may subsequently fill with spring run-off water and be useful to waterfowl.
Biological Control
Biological control is rarely a practical option for controlling phragmites because those organisms known to feed on this plant (moth larvae, aphids, leaf miners, gall midges, rodents, and birds) cause only incidental damage, with a few rare exceptions. American coots consume young shoots in the immediate area of their nests. Considerable damage to phragmites shoots occurs locally by such species as muskrats and nutria, but like coot grazing, this is not an activity under the manager’s control.
Controlled grazing has little effect on shoot density, but rhizomes that are repeatedly trampled will bear few shoots and recover slowly when grazing has ceased. If phragmites stands are grazed for 2 years or more, vigor is reduced considerably. Because the amount of grazing required to reduce these stands would be detrimental to desirable plant species as well, grazing is not a recommended control measure on wildlife management areas.
Fish and Wildlife Leaflet 13.4.12. •• 1989 4

Combining Treatments
On many areas, control of phragmites is achieved most effectively if control treatments are combined. For example, after an area is drained, chemical or mechanical treatments are more easily applied. If an area is drained and then plowed, the resultant short growth is easily treated with chemical sprays. Stands that are drained and then either cut or treated with chemicals may again be flooded to prevent survival of the replacement buds.
Some of the more labor-intensive treatment combinations are even more effective for control. Stands that are mowed, burned, and then disced at least twice will be almost completely removed. The green material from the new growth can be turned under with a heavy disc (32-in. blade) using a 400hp tractor. This treatment method would likely cost about $35 per acre. The spread of phragmites can be contained by burning in mid- to late summer and then treating the second growth with chemicals. Herbicides must be translocated to the rhizomes to achieve more than a partial kill; therefore, the longer the interval between burning and spraying, the more effective the application.
Phragmites can be controlled, but expansion of stands and vigor returning to treated sites must be
monitored closely. Repeated treatments over several years will be necessary. In some situations, it may be more reasonable to prevent stand expansion rather than expect to achieve complete control. Effective control requires an understanding of the plant’s growth cycle and the local growing season in order to schedule effective treatments.
Suggested Reading Haslam, S. M. 1970. The performance of Phragmites
communis Trin. in relation to water supply. Ann. Bot. 34:867−877.
Haslam, S. M. 1971. Community regulation in Phragmites communis Trin. I. Monodominant stands. J. Ecol. 59:65−73.
Hitchcock, A. S. 1950. Manual of the grasses of the United States. 2nd rev. ed. U.S. Dep. Agric. Misc. Publ. 200. Pages 190−191.
Shay, J. M., and C. T. Shay. 1986. Prairie marshes in western Canada, with specific reference to the ecology of five emergent macrophytes. Can. J. Bot. 64:443−454.
van der Toorn, J., and J. H. Mook. 1982. The influence of environmental factors and management on stands of Phragmites australis. I. Effects of burning, frost, and insect damage on shoot density and shoot size. J. Appl. Ecol. 19:477−499.
Appendix. Common and Scientific Names of Plants and Animals Named in Text.
Plants Sedge . . . . . . . . . . . . . . . . . . . . . . . . . . . . . . . . . . . . . . . . . . . . . Carex sp. Coast barnyard grasss or wild millet . . . . . . . . . . . . . . . . . . . . . . Echinochloa walteri Rice cutgrass . . . . . . . . . . . . . . . . . . . . . . . . . . . . . . . . . . . . . Leersia oryzoides Phragmites or common reed . . . . . . . . . . . . . . . . Phragmites australis (syn P. communis) Smartweed . . . . . . . . . . . . . . . . . . . . . . . . . . . . . . . . . . . . . . . Polygonum sp. Sowthistle . . . . . . . . . . . . . . . . . . . . . . . . . . . . . . . . . . . . . . . . . . Sonchus sp. Wild rice . . . . . . . . . . . . . . . . . . . . . . . . . . . . . . . . . . . . . . . . Zizania aquatica
Birds and Mammals American coot . . . . . . . . . . . . . . . . . . . . . . . . . . . . . . . . . . . . . Fulica americana Nutria . . . . . . . . . . . . . . . . . . . . . . . . . . . . . . . . . . . . . . . . . Myocaster coypus Muskrat . . . . . . . . . . . . . . . . . . . . . . . . . . . . . . . . . . . . . . . Ondatra zibethicus
����������������������������������������
������������������������� ���������������������������� ����������������� •• � ����
Fish and Wildlife Leaflet 13.4.12. •• 1989 5
W A T E R F O W L M A N A G E M E N T H A N D B O O K
13.4.13. Management and Control of Cattails
Richard S. Sojda U.S. Fish and Wildlife Service Office of Information Transfer 1201 Oak Ridge Drive, Suite 200 Fort Collins, Colorado 80525−5589
and
Kent L. Solberg Minnesota Department of Natural Resources 306 Power Avenue North Hinckley, Minnesota 55037
The response of wetland vegetation to management can only be interpreted by considering an intricate mix of physiological, ecological, and temporal factors. Because cattail management is important for many freshwater marshes, the purpose of this leaflet is to present autecological principles for such management.
A 50:50 ratio of open water and vegetation is a frequent objective when managing cattail marshes in North America. When a particular marsh has been extensively flooded for some time and few cattails remain, managers may wish to foster more cattails to develop such hemi-marsh conditions. The reverse is followed when a marsh is dominated by cattails. Hemi-marsh conditions are optimal for breeding migratory birds, including most waterfowl, black and Forster’s terns, American coots, and yellow-headed blackbirds. During the nonbreeding season, the life history requirements of migratory birds are not as
closely tied to the hemi-marsh conditions. However, such wetlands still provide excellent habitat.
Cattails are prolific and can quickly dominate a wetland plant community. Monotypic stands of cattails have reduced overall habitat value but do benefit some species of wildlife. They provide excellent habitat for wintering white-tailed deer and ring-necked pheasants and habitat for breeding marsh wrens, least bitterns, and various species of blackbirds. However, hemi-marshes also are habitat for these species, too.
Cattails also provide excellent roosting habitat for blackbirds that can severely damage adjacent crops, especially sunflowers in the prairie states. Elimination of the cattail stand removes roosting habitat and can reduce local damage, but the damage is often simply shifted to other areas where the displaced birds create new roosts.
Although the vegetation cycle in prairie marshes is based on the cycle of wet and dry years on the prairies, its basic principles apply to cattail management elsewhere. The cycle of a semipermanent marsh has four stages: dry, regenerating, degenerating, or lake marsh. Identifying the existing stage of a wetland is the first step toward determining the appropriate direction of subsequent management. Generally, all wetlands with cattails in their flora mimic aspects of this prairie marsh cycle. However, certain hydrologic conditions can lengthen the duration of any stage to such an extreme that no cycle is apparent.
Fish and Wildlife Leaflet 13.4.13. •• 1993 1

There are four species of cattails in North America: the broad-leaved cattail (Typha latifolia), common cattail (T. glauca), narrow-leaved cattail (T. angustifolia), and southern or Dominican cattail (T. domingensis). The common cattail is widespread and is thought to be a hybrid between the broad-leaved and the narrow-leaved species. Whether the narrow-leaved cattail is a native, an exotic from Europe, or a hybrid is unclear. The autecological principles for the management of cattails are identical for all species, and minor differences among species are not addressed here. However, in deeper water and in periods of longer inundation, the common cattail has slightly greater vigor than the other species. The acreage of cattail-dominated wetlands in the north-central United States has increased drastically since the early twentieth century. Among the reasons are the increased prevalence of common cattail, sedimentation of wetland basins, and changes in hydrology and land use.
Cattail Autecology and Management Principles
Plant Structures
The cattail rhizome (Fig. 1) supports the plant, stores carbohydrates, and allows the plant to reproduce asexually. The rhizomes begin to elongate in early summer, and annual growth can be 2 feet
(0.6 m) or longer under ideal conditions. The next year’s stems begin as shoots (Fig. 1) that form on the rhizomes during midsummer. Subsequent shoot growth begins in late winter or early spring and can start even while ice cover remains on the marsh.
The aerenchyma (Fig. 2) provides air passage from the leaves to the rhizomes in cattails and other emergent plants. The structure is functional not only in living leaves but also in standing dead leaves as long as the leaves penetrate the water column and reach air. It is thought that a single leaf can provide oxygen to underground rhizomes for a radius of a few feet from that leaf. Interrupting the function of the aerenchyma is the key to the most effective nonchemical means of controlling cattails.
Germination Cattails can produce seeds and contribute to the
seed bank at all marsh stages, but recruitment occurs only during the dry stage. A single cattail head can contain as many as 250,000 seeds, and almost 1,000 seeds / m2 may exist in the upper few inches of soil. Viability can approach 100% in the year after production, and seeds in the seed bank can remain viable for as long as 100 years. Cattail seeds, like those of almost all other emergent plants, do not germinate under more than 0.5 inch (1.3 cm) deep water. Light in combination with other environmental factors is critical to germination, and deeper water or shading in dense stands filters out enough light to prevent germination. One of the primary reasons cattails
Fig. 1. The structure of a cattail plant: 1. spadix; 2. leaf; 3. new rhizome; 4. shoot or sprout; 5. roots; 6. staminate spike; 7. pistillate spike.
2 Fish and Wildlife Leaflet 13.4.13. •• 1993

are so prolific is that seeds germinate under a wide range of temperatures if the soil is nearly saturated. The optimum soil−surface temperatures are 77−86o F (25−30o C) and usually occur in the northern United States from early summer to midsummer.
Depending on the successional stage of the marsh, a manager may either foster or obstruct germination of seeds from the seed bank. Because keeping areas flooded with 1 inch (2.5 cm) of water essentially prevents germination, a greater depth is not necessary. Shallow flooding is quick and usually inexpensive. However, shallow flooding of a portion of a wetland can leave a significant expanse of unflooded, saturated soils nearby where cattail germination may flourish. Shallowly flooded areas can become mud flats quickly when rates of evapotranspiration are high. This transition can easily happen in just a few days during warm weather. Knowledge of the bottom contours of a wetland basin allows the judicious use of water to prevent germination.
Carbohydrate Conversion
The control of cattails has to be timed to the annual cycle of carbohydrate storage (Fig. 3). During early spring, the shoots receive their energy
Fig. 2. Aerenchyma provides air passage from leaves to rhizomes. 1. Cross-section of a stem; 2. Longitudinal section of a leaf.
for growth primarily from starches stored in the rhizomes. When the conversion of the starches is aerobic, the energy for initiating shoot growth is greatest. Aerobic conditions exist either when the marsh is dry or when standing dead leaves can supply rhizomes with oxygen via the aerenchyma. The depth of water that the shoot can penetrate is not limited in typical semipermanent wetlands when starch conversion is aerobic. If energy reserves are insufficient for the shoot to penetrate the water column, however, the plant dies.
When the conversion of starches is anaerobic, available energy may be limited and the shoot is not able to penetrate the water column. Conditions become anaerobic for the cattail when soils are flooded and the aerenchyma link between leaves and rhizomes is broken. This happens, for example, when a marsh is burned during winter and the remaining stalks are then flooded. The depth of water through which the shoot must grow in spring before it reaches air determines whether the plant has sufficient starch reserves in the rhizomes to survive.
Carbohydrate Storage
In summer when the pistillate spike is lime green and the staminate spike is dark green,
Fish and Wildlife Leaflet 13.4.13. •• 1993 3

Fig. 3. The annual cycle of growth and carbohydrate storage in cattails.
starch reserves in the rhizomes are at their minimum (Fig. 2). Until this time, the plant has been committing its energy to leaf growth and flower development. Starting in midsummer, the energy is redirected toward building carbohydrate reserves for shoot growth in the following spring. Carbohydrate storage continues until the leaves are senescent. (Linde et al. [1976] provide the most comprehensive documentation of the annual cycle of growth and carbohydrate storage in cattails.)
Control techniques such as grazing and mowing are most effective when the starch reserves of the plant are lowest. Shortening the time during which carbohydrates are stored in the rhizomes does not immediately kill the plant but increases its vulnerability to stress during the subsequent spring.
The vigor of the plant depends principally on its efficient storage of carbohydrates in the rhizomes. Because cattails are adapted to semipermanent water regimes, either deep water or drying of the marsh stresses starch storage. However, cattails are also adapted to a wide range
of environmental conditions, and the effects of the stress are subtle.
Effect of Herbivores Direct mortality of mature cattail plants from
muskrats, cattle, and other herbivores is rare. The season of grazing and the water levels in subsequent seasons determine to what degree the removal of the growing plant parts affects plant vigor. Grazing on the mature plant parts impedes carbohydrate storage or conversion. In contrast, grazing can kill seedlings, particularly grazing by Canada geese and greater snow geese that eat nearly the entire seedling. The removal of only aboveground parts can stunt the plant so much it does not survive to reproduce and contribute to the seed bank. When germination of seedlings has created a dense stand, geese may not remove all plants and the combined effects on stand development can be variable.
Hydrologic Changes Long-term changes in water regimes in a
marsh can have either subtle or drastic effects on
4 Fish and Wildlife Leaflet 13.4.13. •• 1993

plant species composition. Because they are best adapted to semipermanent water regimes, cattails can be eliminated by deeper and more permanent water levels. Likewise, a conversion to a drier water regime (e.g., a seasonal marsh) can shift the competitive ecological edge to other species. If drier conditions coincide with soil disturbance, wetlands in many areas of North America can change to being temporarily dominated by annual plants such as smartweeds and wild millets. Concurrent germination of more cattails should be prevented. Long-term plant communities of a drier regime may include Carex spp., Scirpus spp., perennial smartweeds, and some of the aquatic grasses.
Control Techniques: Why and When They Work
Water Level Control
Water levels should mimic long-term (10- to 20-year) drought cycles of the local area, particularly if the objective is the hemi-marsh stage. The resultant cycle of the marsh will follow the previously mentioned four-stage model.
Drawdowns in summer enhance cattail stem densities by stimulating germination. When cattails are absent, drawdowns in early spring stimulate germination of aquatic annuals such as smartweeds and millet. Then, shallow flooding during summer stimulates the growth of annuals while eliminating germination of cattails.
If indeed the aerenchyma link between rhizome and leaf is broken, high water levels that are above the tops of cattail shoots in spring extend the period during which the plant must anaerobically convert the stored starches to sugars for shoot growth. The depth of water necessary to kill the plant depends on temperatures, the quantity of starch the plant stored the previous year, and the general vigor of the plant. Therefore, no minimum water depth can be prescribed, but a rule of thumb would be to maintain 3−4 feet (0.9−1.2 m) of water over the tops of existing shoots in spring. It is critical to remember that, even if standing dead leaves from last year were completely removed, aerobic conditions are restored to the rhizome as soon as the new growing shoot penetrates the water surface. Cattails are well adapted to growing in anaerobic soil conditions.
If the leaves from the previous years were removed (e.g., by cutting or burning) and water
Fish and Wildlife Leaflet 13.4.13. •• 1993
control is effective, cattails can be controlled even if the actual quantity of available water is limited. If water remains only a few inches above the top of the growing shoots and standing dead leaves, oxygen is prevented from reaching the rhizomes. The use of water is efficient if the water level is raised progressively, so that all plant parts remain submerged by no more than a few inches.
Extremely high water levels—in excess of 4 feet (1.2 m)—in late spring and summer, even after the cattails reach their full height, sufficiently stress the plants by reducing the quantities of the stored carbohydrates for subsequent spring growth. However, the physiological mechanism that causes this reduction is poorly understood.
High water levels favor the survival of muskrats in winter. The ideal water depths are probably 4−5 feet (1.2−1.5 m) in most areas. The current marsh stage relative to the desired stage determines the manager’s decision to foster or retard muskrat survival with water levels in winter. Population levels of 10 muskrats / acre (10/0.4 ha) can nearly eliminate cattails in 2 years if combined with high water levels in spring to stress starch conversion in the rhizome. The effect of muskrats on cattail-dominated wetlands can be explained with the described autecological principles. In isolated marshes of the arid West, muskrats can be eliminated by drought, and recolonization can take many years irrespective of subsequent water conditions.
Salinity Alteration
Seawater is used locally to kill cattails in coastal areas in the southeastern United States where historic salt marshes have been impounded and managed as freshwater wetlands. Flooding a marsh during most of the growing season with water of 10 ppt salinity kills cattails. Flooding with sea-strength water for 2 months also kills plants. Water depth is not critical because the salinity directly affects plant physiology. In North America drought or purposeful drawdown can sufficiently increase water or soil salinities, mature plants can be killed, plant growth can be retarded, and germination can be prevented.
Cutting, Crushing, Shearing, and Disking
Cattails can be controlled by cutting, crushing, shearing, or disking. Details about effective water levels relative to shoot height, timing of shoot growth, and timing of control in relation to starch
5

reserves are rarely provided in the literature. Almost no experimental work has been reported.
Cutting, crushing, shearing, and disking during the growing season can be used to impede starch storage. These treatments are effective if done during a 3-week window from 1 week before to 1 week after the pistillate spike is lime green and the staminate spike is dark green. However, the treatments are most effective during the 3−4 days when the spikes are so colored.
Deep disking can retard shoot formation and can damage the rhizomes, but the effect on plant survival is variable. The overall effect on the entire stand is minimal if water conditions are favorable for cattail survival. Control of water levels and of recruitment from the seed bank are necessary to prevent reestablishment of the cattails. Deep disking combined with continued drying and freezing in fall decreases plant survival. If the wetland can be kept sufficiently dry to repetitively disk in any two to three successive seasons, cattails can be eliminated or their stem densities severely reduced. For example, plant survival is significantly reduced if the marsh is disked in fall and again in the following spring and summer. In contrast, little effect is realized from disking alone in three successive falls. The cost of the equipment and personnel for these operations can be extreme. Airborne seeds released during these operations clog the equipment and irritate the operator.
When the plants are dormant, cutting, crushing, shearing, or disking is extremely effective for severing the aerenchyma link between the rhizomes and the leaves. To reduce plant survival, however, these techniques must be combined with high water levels in spring to induce stress from anaerobic starch conversion. Cattails can be cut with a rotary mower or sheared with a front-end loader on a tractor when equipment can be driven on ice, but airborne seeds are a nuisance. Subsequent water levels in spring must still inundate the cut stalks.
Bulldozer and Cookie Cutter
Bulldozers and cookie cutters remove plants from the local area of the marsh and can— sometimes inadvertently—alter wetland basin morphology. The desirability of the potential effect depends on the management objectives, permits, and other legal requirements. The control of cattails with a bulldozer or cookie cutter is the most expensive option. However, floating cattail mats cannot be removed with any other equipment.
The seed bank and the conditions for germination determine the floristic composition of the marsh after the next drawdown, whether dewatering is natural or controlled. If the seed bank is dominated by cattails, the effect of a bulldozer or cookie cutter may be short-lived. Alternatively, a depauperate seed bank may also result in an undesirable plant community. The domino effect of this may be a reduction of the diversity and abundance of invertebrates and a consequent lack of food for shorebirds, ducks, and other species. Creating deeper and possibly permanent water areas also creates better habitat for muskrats and minks.
Grazing
Grazing by cows, geese, muskrats, and other animals on seedling and young cattails without extensive rhizomes can remove entire plants, reducing stem densities or eliminating stands. Grazing on mature plants in association with proper water-level management reduces the survival of cattails through the combined effects of severing the aerenchyma link between the rhizomes and leaves and stressing the storage and conversion of starches. To minimize starch storage, cattails should be heavily grazed by cattle during the 3-week period centered on the time when the pistillate spike is lime green and the staminate spike is dark green.
Prescribed Burning
Burning cattails is difficult during the growing season, except during extreme low-water conditions. Dry residual cattail litter provides enough fuel to carry a fire through growing plants. The fire usually does not kill the plants but can stress starch storage. Fires in cattail marshes rarely are hot enough at ground level for heat penetration to impede rhizome function or shoot viability.
Most cattail marshes must be burned in winter or before significant growth has occurred in spring when fuels are dry enough to carry a fire. However, frozen or saturated soils can hamper the progress of the fire through cattail duff. When combined with high water levels in spring to smother the residual stalks, fire can be used to control cattails.
Prescribed burning can be used for cattail control even in wetlands where control of water levels is not always possible and the manager must rely on precipitation in spring for flooding. Cattails can be burned when water levels are naturally low in fall and winter. If water levels are high during
Fish and Wildlife Leaflet 13.4.13. •• 1993 6

the next spring, they force anaerobic conversion of starches in the rhizomes. Spring weather obviously is not known during the preceding fall, but dry falls followed by ample rain and high water levels in spring are not unusual in many parts of North America.
In wetlands with well developed peat soils, fires during drought conditions can destroy the entire cattail plant including the rhizomes. Such fires actually burn the peat, and the ability to smother the fire by reflooding the marsh must exist before prescribing such fires. Peat fires can also eliminate the existing seed bank and, if sufficiently severe, lower the relative bottom of a marsh. Local concern with the effects of peat fires on air quality can be substantial. In some locations (e.g., Minnesota), regulations prohibit the purposeful ignition of peat.
Fire prescriptions for cattail marshes should not solely address fire control but the ecological effects of fires at different intensities, at different seasons, and under different environmental conditions. Moreover, planned fires must be combined with water management that ultimately controls the cattails.
Herbicides Herbicides, especially glyphosate, interrupt
metabolic pathways and have been used successfully to kill cattails. Herbicides that are translocated to the rhizomes are most effective for cattail control. Application in mid- to late summer when carbohydrates are stored enhances the effectiveness of translocated herbicides. Therefore, herbicides have little effect on seed production during the year of application. If not all cattails are killed, a hemi-marsh is created, but surviving cattails can spread quickly and eliminate this effect if water levels cannot be manipulated. As with other techniques, the duration of the effect of herbicides depends on subsequent water-level control and recruitment from the seed bank.
The public and natural resource agencies are concerned about the use of herbicides in aquatic systems. Herbicides for the control of cattails
should readily degrade in water, soil, or substrate. Glyphosate applied at label rates seems relatively safe for waterfowl and aquatic invertebrates. Habitat alteration from herbicide application, as from other cattail removal techniques, may reduce the distribution and abundance of invertebrates.
Herbicides can be expensive, although the cost of the application is a minor portion of the total cost. Aerial application can be the most efficient technique for managing cattails over a large area or over several smaller, inaccessible locations. Boom or wick applications are useful for small areas accessible by ground or airboat and when pesticide drift is a concern.
Permits
Many of the described control techniques require permits from local, state, or federal authorities.
Suggested Reading Ball, J. P. 1990. Influence of subsequent flooding depth
on cattail control by burning and mowing. Journal of Aquatic Plant Management 28:32−36.
Kadlec, J. A. 1992. Habitat management for breeding areas. Pages 590−610 in B. D. J. Batt, A. D. Afton, M. G. Anderson, C. D. Ankeny, D. H. Johnson, J. A. Kadlec, and G. L. Krapu, editors. Ecology and management of breeding waterfowl. University of Minnesota Press, Minneapolis.
Kantrud, H. A., J. B. Millar, and A. G. van der Valk. 1989. Vegetation of wetlands of the prairie pothole region. Pages 132−187 in A. G. van der Valk. Northern prairie wetlands. Iowa State University Press, Ames.
Linde, A. F., T. Janisch, and D. Smith. 1976. Cattail—the significance of its growth, phenology and carbohydrate storage to its control and management. Wisconsin Department of Natural Resources Technical Bulletin 94. 27 pp.
van der Valk, A. G. 1981. Succession in wetlands: a Gleasonian approach. Ecology 62:688−696.
Weller, M. W., and L. H. Fredrickson. 1974. Avian ecology of a managed glacial marsh. Living Bird 12:269−291.
Fish and Wildlife Leaflet 13.4.13. •• 1993 7
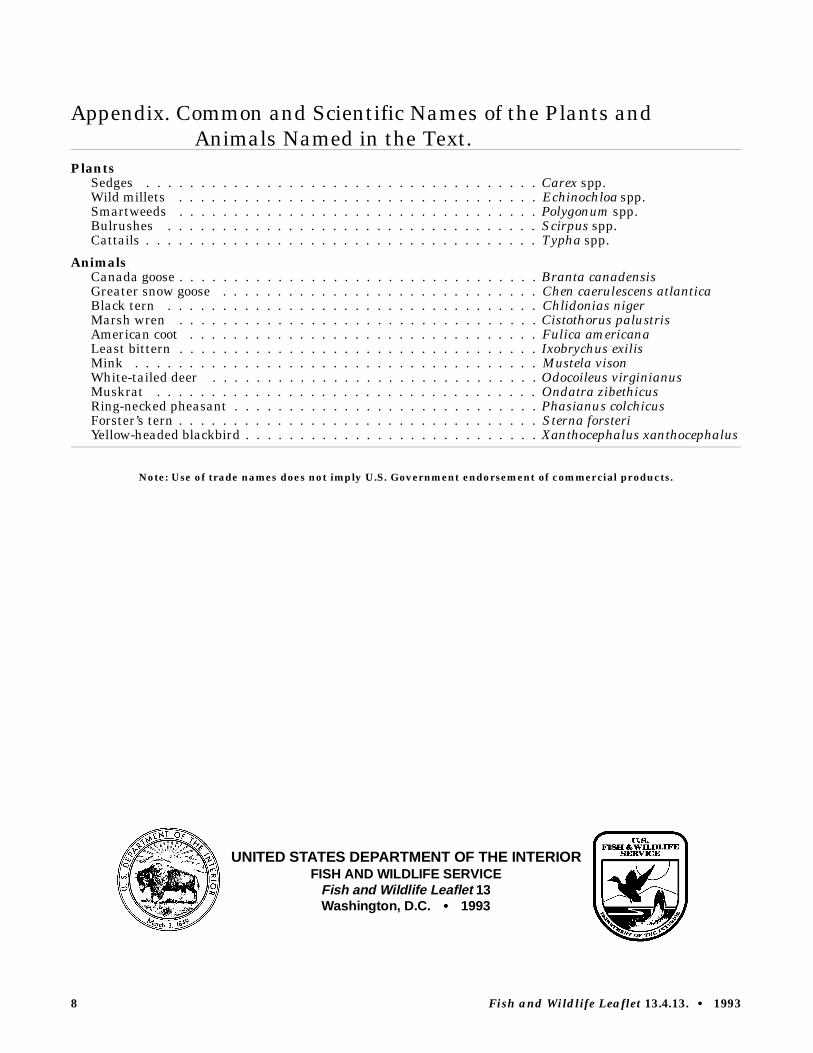
Appendix. Common and Scientific Names of the Plants and Animals Named in the Text.
Plants Sedges . . . . . . . . . . . . . . . . . . . . . . . . . . . . . . . . . . . . Carex spp. Wild millets . . . . . . . . . . . . . . . . . . . . . . . . . . . . . . . . . Echinochloa spp. Smartweeds . . . . . . . . . . . . . . . . . . . . . . . . . . . . . . . . . Polygonum spp. Bulrushes . . . . . . . . . . . . . . . . . . . . . . . . . . . . . . . . . . Scirpus spp. Cattails . . . . . . . . . . . . . . . . . . . . . . . . . . . . . . . . . . . . Typha spp.
Animals Canada goose . . . . . . . . . . . . . . . . . . . . . . . . . . . . . . . . . Branta canadensis Greater snow goose . . . . . . . . . . . . . . . . . . . . . . . . . . . . . Chen caerulescens atlantica Black tern . . . . . . . . . . . . . . . . . . . . . . . . . . . . . . . . . . Chlidonias niger Marsh wren . . . . . . . . . . . . . . . . . . . . . . . . . . . . . . . . . Cistothorus palustris American coot . . . . . . . . . . . . . . . . . . . . . . . . . . . . . . . . Fulica americana Least bittern . . . . . . . . . . . . . . . . . . . . . . . . . . . . . . . . . Ixobrychus exilis Mink . . . . . . . . . . . . . . . . . . . . . . . . . . . . . . . . . . . . . Mustela vison White-tailed deer . . . . . . . . . . . . . . . . . . . . . . . . . . . . . . Odocoileus virginianus Muskrat . . . . . . . . . . . . . . . . . . . . . . . . . . . . . . . . . . . Ondatra zibethicus Ring-necked pheasant . . . . . . . . . . . . . . . . . . . . . . . . . . . . Phasianus colchicus Forster’s tern . . . . . . . . . . . . . . . . . . . . . . . . . . . . . . . . . Sterna forsteri Yellow-headed blackbird . . . . . . . . . . . . . . . . . . . . . . . . . . . Xanthocephalus xanthocephalus
Note: Use of trade names does not imply U.S. Government endorsement of commercial products.
UNITED STATES DEPARTMENT OF THE INTERIOR FISH AND WILDLIFE SERVICE
Fish and Wildlife Leaflet 13 Washington, D.C. •• 1993
8 Fish and Wildlife Leaflet 13.4.13. •• 1993

W A T E R F O W L M A N A G E M E N T H A N D B O O K
13.4.18. Chufa Biology and Management
James R. Kelley, Jr., and Leigh H. Fredrickson Gaylord Memorial Laboratory The School of Natural Resources University of Missouri–Columbia Puxico, MO 63960
Introduction
Chufa (Cyperus esculentus) is an emergent perennial sedge that is common in seasonally flooded wetlands. Although chufa is common in many States, it is most abundant in the Southeast, including the Mississippi alluvial valley (Fig. 1). Belowground biomass of chufa, especially the tubers, serves as a valuable food source for waterfowl and cranes. Chufa tubers rank tenth among the most important waterfowl foods in the United States.
Identification
Other common names for chufa are yellow nutsedge, nutgrass, and ground almond. Plants are 8 inches to 3 feet tall and have 3-sided stems (Fig. 2). Leaves are bright green on emergence but become pale green as plants mature. Leaves are 0.2–0.4 inches wide and ribbonlike. The main stem terminates in an inflorescence that has 3–9 leaflike bracts, 2–10 inches long, at its base. The inflorescence comprises 5–10 stalks with strongly flattened spikes that are up to 1.25 inches long and yellow or golden-brown. The seeds are 3-sided,
Fish and Wildlife Leaflet 13.4.18. •• 1991
elliptical, rounded at the end, and 0.04–0.06 inches (1.2–1.5 mm) in length. Mature tubers are tan or black, sphere-shaped, and 0.2–0.4 inches long. Newly formed tubers are white.
Nutritional Value
Chufa tubers are an important, high-energy food for birds. The caloric density of tubers averages 4.26 kcal/g. Approximately 45% of the fresh weight of tubers is water. The major components of the dry weight of tubers are carbohydrate (58%), lipid (10%), protein (7%), and ash (3%). The major fatty acid in tubers is oleic (61% of total fatty acids), while other fatty acids include linoleic (24%), palmitic (12%), and stearic (2%).
Life History
Reproduction and Growth
Reproduction from seed is relatively unimportant. Seed production is variable and on some sites only a few or no seeds are produced, whereas heavy seed production occurs on other sites. Seeds often are inviable and seedlings produced from seed are usually weak. Sprouting from tubers is the primary mode of reproduction by chufa, and potential production from tubers is high. For example, in 1 year a single tuber in Minnesota produced 1,900 plants and 6,900 tubers.
1

Fig. 1. Distribution of chufa in North America, showing principal range (light shaded areas) and areas of greatest abundance (dark shading).
a d
c
b
Fig. 2. Identifying characteristics of chufa: a) entire plant, b) spikelet, c) seed, and d) tuber.
2 Fish and Wildlife Leaflet 13.4.18. •• 1991

Mature tubers have 5–7 buds, located in the axils of scale leaves. In spring, two buds usually sprout and form rhizomes. Removal of sprouts from tubers induces additional buds to sprout. Elongating rhizomes are indeterminate, underground stems that terminate in a bud that either forms a new tuber or a basal bulb. Basal bulbs produce leaves that elongate to form aerial shoots.
In wetland areas, the timing of shoot emergence is dependent on drawdown date. Removal of surface water stimulates sprouting of tubers, and shoots begin to emerge within a few days after surface water removal. Stem densities increase rapidly following drawdown, and peaks in aboveground biomass occur as soon as 40 days after drawdown (Fig. 3).
Production of new tubers occurs as soon as 18 days after drawdown. Tubers are formed throughout the growing season; however, most tuber development occurs within the first month after shoot emergence. Belowground biomass production peaks approximately 1 month after
aboveground biomass has reached its peak (Fig. 3). At the end of the growing season, 85% of belowground biomass is composed of tubers. Tubers regularly survive winter conditions whereas aerial shoots, basal bulbs, and rhizomes rarely survive from one growing season to the next. Tubers can remain dormant for up to 3.5 years. Dormancy is broken by leaching of a growth inhibitor (abscisic acid) from tubers or by physical damage to tubers.
Soil Requirements
Chufa grows well in a variety of soil conditions: clay, clay loam, silty clay, loam, sandy gravel, and sand. Production is often greatest on silty clay soils and lowest in sand. Soils with pH values between 5.0 and 7.5 give the best production.
Temperature
The minimum temperature required for sprouting of tubers in the laboratory is 12° C
Ste
ms/
Yd2
Lbs/
Acr
eLb
s/A
cre
Stems
Aboveground Live Dead
Belowground
Jun Jul Aug
Date
Sep Oct
50
25
0
135
90
45
0
350
250
150
0
Fig. 3. Stem density (stems per square yard), live and dead aboveground biomass (pounds per acre), and total belowground biomass (pounds per acre) of chufa following a 27 May drawdown in southeast Missouri.
Fish and Wildlife Leaflet 13.4.18. •• 1991 3

(54° F). Little is known about optimum temperature for sprouting in the field. Tubers can withstand winter soil temperatures of –7 to –10° C (14 to 19° F), but survival is greatest at temperatures above –4° C (25° F).
Moisture
Chufa is adapted to seasonally flooded environments. Emergence begins as soil temperatures increase following exposure of soil surfaces during drawdown. Maximum tuber production occurs in soils that remain moist or when stands are irrigated. Chufa can withstand temporary flooding if the plants are not completely covered with water. Prolonged flooding during the growing season is not recommended. Drought conditions severely reduce tuber production and cause mortality.
Light
Chufa competes poorly with other plants because of its light requirements. As little as 30% shade can reduce dry-matter production by 32%. The quick emergence and rapid growth of chufa allows plants to mature and produce tubers before being subjected to shading by other plant species. The early senescence of chufa often makes it difficult to detect at the time of fall flooding because most of the aboveground parts have decomposed.
Management Techniques
Soil Manipulations
Because most wetland management schemes are directed toward seed production, little information is published concerning manipulations that enhance tuber production. If chufa is present in the seed or bud bank of a seasonally flooded site, some tuber production likely will occur in the absence of active manipulations, depending on the growing conditions and other factors, such as soil disturbance by feeding waterfowl. However, chufa production may be enhanced by proper soil disturbance (e.g., disking or plowing), which is often used to eliminate woody growth and undesirable perennials in managed wetlands. Shallow (2–4 inches) disking detaches many chufa tubers from parent plants, which causes tubers to sprout and develop as additional plants (Fig. 4). Following disking, many parent plants remain on the surface, reestablish themselves, and continue tuber production. Disking scarifies some of the dormant tubers and induces sprouting. Sites should be irrigated after disking to prevent desiccation of tubers and parent plants. If irrigation is not possible after disking and dry conditions prevail, tuber production will be low because of poor growing conditions. However, the soil disturbance for chufa production is not wasted because the effects of disking carry over to the
IrrigateDisk
Fig. 4. Use of shallow disking and irrigation to stimulate additional sprouting of active and dormant chufa tubers to increase waterfowl food production.
4 Fish and Wildlife Leaflet 13.4.18. •• 1991

following year. Thus, chufa production may be enhanced in the next growing season. Shallow disking may not be feasible over entire management units if eradication of severe vegetation problems requires deep disking. In situations where there is a history of good chufa production, deep disking might be restricted to patches of undesirable vegetation. Sites lacking vegetation problems, or where undesirable vegetation is less dense, might be shallowly disked. Because deep disking buries many parent chufa plants and results in low tuber production, whereas shallow disking stimulates tuber production, each management scenario can be expected to result in major differences in chufa production (Fig. 5.; Table 1).
Plantings
Most planting of chufa occurs on upland areas in the Southeast for wild turkey (Meleagris gallopavo) food production. If chufa is desired on wetland sites that contain no natural growth, propagation can be initiated by broadcasting tubers. Chufa tubers are available from wholesale seed companies, which generally sell them in 100-pound bags. A slow, early- to midseason (1 March–15 June) drawdown should be part of site
preparation for planting. While sheet water is still present, tubers should be broadcast at the rate of 50 pounds per acre over sites lacking standing vegetation. Tubers will sprout when surface water recedes. Once established, additional plantings generally are not necessary. Grazing should be restricted when tubers are planted because cattle and hogs consume chufa tubers.
Availability to Birds
Waterfowl have unusual abilities to locate belowground tubers. By the time management units are flooded in fall, there is little evidence of aboveground parts. Nevertheless, waterfowl and cranes consistently locate and consume tubers. The availability of tubers for waterbirds is influenced by water depth. The majority of tubers are near the soil surface at a depth of 0–4 inches (Table 2). Thus, optimal water depth for dabbler utilization of tubers is 2–8 inches. Disking tends to loosen soil sediments and makes foraging for tubers easier for birds. When birds forage intensively on sites with good tuber production, they cause soil disturbance that is as effective as shallow disking. During the subsequent growing season such sites have the potential for good tuber production.
Good seed production on deep disk sites Year 4
Good tuber + seed Good tuber and seed
Irrigate
No irrigation
production shallow disk sitesYear 2 Year 3 productionDeep disk problem No problem vegetation No problem vegetationChufa tubers active 80% problem vegetationNo soil
vegetation50% problem Shallow disk chufamanipulation vegetation Fair tuber production
Leaching of growth inhibitors
Poor seed + tuber production
Soil disturbance by waterfowl
Year 1
Chufa dormant in bud bank
40% problem vegetation
No soil manipulation Year 8
Dormant tubers No soil
Vegetation problem solved
Year 5
Good seed production
Fair tuber production
No problem vegetation
Shallow disk and irrigate
Year 6Year 7
Fair seed productionPoor tuber production No soil Poor tuber productionPoor seed production Poor seed production manipulation manipulation
5% problem vegetation30% problem vegetation 20% problem vegetation
Fig. 5. Long-term conditions and manipulations to enhance chufa tuber production in a seasonally flooded impoundment. The flow chart illustrates the effects of no soil disturbance and how disking influences chufa tuber production and the control of undesirable vegetation. Problem vegetation refers to undesirable woody species and robust non-seed-producing perennials.
Fish and Wildlife Leaflet 13.4.18. •• 1991 5

Table 1. Chufa (Cyperus esculentus) belowground produc- Suggested Readingtion (pounds per acre) following implementation of six different management scenarios involving combinations Fredrickson, L. H., and T. S. Taylor. 1982. Management of disking depth and irrigation. of seasonally flooded impoundments for wildlife.
U.S. Fish Wildl. Serv., Resour. Publ. 148. 29 pp.Disking treatment Kelley, J. R., Jr. 1990. Biomass production of chufa
Shallow Deep (Cyperus esculentus) in a seasonally floodedNo disk (2 inches) (6 inches) wetland. Wetlands 10:61–67.
Irrigation after Mitchell, W. A., and C. O. Martin. 1986. Chufa (Cyperusdisking 159 327 13 esculentus): Section 7.4.1, U. S. Army Corps of
No irrigation 144 62 26 Engineers Wildlife Resources Management Manual, Technical Report EL-86-22. U.S. Army Corps Eng. Waterways Exp. Stn., Vicksburg, Miss.
Mulligan, G. A., and B. E. Junkins. 1976. The biology of Canadian weeds. 17. Cyperus esculentus L. Can. J.Table 2. Depth distribution of chufa (Cyperus esculentus) Plant Sci. 56:339–350.tubers in the soil profile.
Stoller, E. W., D. P. Nema, and V. M. Bhan. 1972. Yellow Depth (inches) nutsedge tuber germination and seedling
0–2 2–4 4+ development. Weed Sci. 20:93–97. Percent of tubers 48 43 9 Wills, D. 1971. Chufa tuber production and its Percent of dry relationship to waterfowl management on Catahoula
weight 25 62 13 Lake, Louisiana. Proc. Annu. Conf. Southeast. Assoc. Game Fish Comm. 24:146–153.
Note: Use of trade names does not imply U.S. Government endorsement of commercial products.
UNITED STATES DEPARTMENT OF THE INTERIOR FISH AND WILDLIFE SERVICE
Fish and Wildlife Leaflet 13 Washington, D.C. •• 1991
6