Embed Size (px)
Citation preview

Water Supply Challenges in Bulawayo, Zimbabwe
Justin Baker
GIS in Water Resources
7 December 2012

1. Introduction
1.1 Why Bulawayo?
In September 2012, the
Bulawayo City Council (BCC)
implemented a new policy: all
households in the city
connected to the municipal
sewage system would be
required to flush their toilets
simultaneously twice each week
(BBC, 2012). This was done to
keep pipes from becoming
blocked and damaged, currently
a threat due to severe water
restrictions in place by the city
(often for three days at a time).
Yet to residents of Bulawayo, this mandate was not surprising. The city of Bulawayo has struggled
to secure sustainable and long-term water resources for its citizens for over one hundred years.
The water stress currently faced by the city, like that before it, can be attributed to several factors,
including economic decline, geographic location, and climate effects.
Bulawayo, therefore, is a good case study of the challenges of water supply in urban Africa for at
least three reasons: it is growing rapidly (in line with other cities), it has a great need for water at
present, and it already has a relatively developed infrastructure system in place.
1.2 Water Supply in Africa
Worries over water supply in Bulawayo is only part of a larger trend across urban Africa
(Economist, 2010). Water is vital to any development, and its availability or dearth is a major
driving force behind migration, population growth, and economic development, among other
factors. As a whole, Africa has relatively ample water supply potential (MacDonald and Calow,
2009, p. 2). The per capita availability of water in Africa is on par with Europe and above Asia, yet
the African struggle is much greater than that of most other parts of the world.
Still, there are two Africas – the rural Africa, mostly dependent on subsistence agriculture; and
urban Africa – a fast-growing population in cities. Both of these populations require water for
development, and solutions must be tailored to their needs. One of the most ambitious goals laid
out by the United Nations in their Millennium Development Goals is “halving, by 2015, the number
of people without access to safe water and sanitation” (United Nations). The Economic
Figure 1

Commission of Africa set its own goal, to create “an Africa where ther eis an equitable and
sustainable use and management of water resources for poverty alleviation, socio-economic
development, regional cooperation, and the environment” (UN Economic Commission for Africa)
This report concentrates on urban water supply, in a specific context, with the hope of drawing
out broader conclusions applicable to other urban contexts across the continent.
1.3 Scope of Study
This paper is divided into three sections, roughly corresponding to an examination of the demand,
current and future supply options available to the city, and some comments on the applicability of
GIS techniques in this specific setting. The first will briefly outline the struggle for a reliable water
supply that has faced Bulawayo for decades, presenting pressure factors such as population
growth, economic decline, political favor, and climatic and environmental factors. Some
comments are also made concerning future demand projections.
The second section will detail the current supply of the city, with a focus on the surface water
sources that the city possesses, and move on to evaluate a potential future option, the
Matabeleland Zambezi Water Project. GIS techniques will be employed to compare the old and
new watersheds using remotely sensed and climatic data, in an attempt to understand the
shortcomings in the city water supplies and glean lessons from past plans. Some comments are
then made on the feasibility of the project.
The paper concludes with a short discussion on the potential uses and limitations of GIS
techniques in Zimbabwe, and in data-poor Africa more generally. This section highlights the
usefulness of remotely sensed data, especially useful in research, planning, and design.
2. Demand in Bulawayo
2.1 A Thirsty City
Beginning in 1980, Bulawayo saw an unabated increase in water demand over the past three
decades, with increasing urbanization, economic activity (until 2000), and population growth
generally contributing to the rise.
The city was founded in the 1840s, and today is the second largest city in Zimbabwe. Its economy
has developed around its position as an important regional transportation hub and center of
industry. The city has, until very recently, undergone a sustained period of decline under a
hastily-implemented land reform program leading to the loss of international credibility. Still, the
city has a relatively well-developed infrastructure system, relative to other African nations.

As the capital of Matabeleland, home to most of Zimbabwe’s minority ethnic group – the Ndebeles
- Bulawayo is also the stronghold of the Zimbabwean opposition political party (MDC).
Accordingly, some have claimed that it has been marginalized in the past, specifically due to its
tribal and political affiliations (Karimakwenda, 2012). Yet throughout its history, whether under a
colonial administration or the current government, Bulawayo has struggled to supply its citizens
with adequate water.
Much of this has shortage has to do with climatic factors. Bulawayo has an average annual rainfall
of just 590mm, and is in one of the hottest and driest parts of the region. The city is located very
near the confluence of four distinct hydrobasins (Zambezi and Limpopo being the closest, as
shown in Figure 1).
2.2 A Growing Population
The population of Bulawayo has
steadily increased over time, to
around 700 000 (2009), in line with
urban areas across Zimbabwe.
The charts below (Figures 3,4) show
the trend of water demand and
supply from 1980 to 2010. The
shortage has reached at least 15
million cubic meters, and is only
expected to grow (Mkandla, Van der
Zaag, & Sibanda, 2005). It should be
noted that these figures are under
the demand management conditions
(including rationing and
restrictions) that the city already has
in place.
Figure 2

0
5
10
15
20
25
30
35
40
45
50
1975 1980 1985 1990 1995 2000 2005 2010 2015
Mil
lio
n M
ete
rs C
ub
ed
Demand
Demand 2 per. Mov. Avg. (Demand)
0
5
10
15
20
25
30
35
40
45
50
1975 1980 1985 1990 1995 2000 2005
Mil
lio
n M
ete
rs C
ub
ed
Supplied (Billed)
Supplied (billed) 6 per. Mov. Avg. (Supplied (billed))
Figure 3
Figure 4

2.3 Future Demand
Future demand is expected to continue to grow, in step with general population growth and
urbanization. Even the most intense demand management program will not be able to keep
demand from growing by at least 15 percent, shown below in Figure 5 (Mkandla, Van der Zaag, &
Sibanda, 2005). A new supply source is required, and this need will only grow in the future if it is
not addressed.
40
45
50
55
60
65
2008 2010 2012 2014 2016 2018 2020 2022 2024
Projected Demand under different Demand Management Scenarios
Intensive Regular Slack
Figure 5

3. Current Water Supply
3.1 Dams in Zimbabwe
Zimbabwe is a nation of
dams. It has over 10 000
dams currently, and more
per capita than its regional
neighbors. Dams have been
relied upon to provide water
for Zimbabwe’s historically
strong agricultural sector.
Though this sector has been
badly affected by recent
government policies and
lack of investment, the
infrastructure of the country
is largely intact. All major
urban areas are supplied
almost exclusively from dam
water. As seen in Figure 6,
the dams are largely spread
through the drier parts othe country, where they are used to store water for agriculture. These
dams can have a great impact on the watershed in which they are built.
3.2 Bulawayo’s Supply Dams
Bulawayo has traditionally been
supplied by five dams, built between
1958 and 1992. However, currently
the city relies on only two of the five
dams, the Inyakuni and the Insiza
dams; the other three have been
decomissioned (Figure 7 shows
Umzingwane, decomissioned in
2012) (Makiwa, 2007). All of these
dams are within 50 km of the city.
Supply from the dams has generally
declined, due to drought and
Figure 6
Figure 7

decreased runoff. For example, Figure 8 shows the number of days without flow at Insiza dam
over time. The general trend is not encouraging (Onema, et al.):
3.3 Future Supply
All parties to the discussion on water in Bulawayo agree on the fact that Bulawayo needs another
substantial water supply option within the next five years, if not sooner (Mkandla, Van der Zaag, &
Sibanda, 2005). Three options have been proposed:
1. Boreholes – This is a viable short-term solution, but boreholes are difficult to regulate,
require maintenance, and the amount of water they can pump is uncertain.
2. Bringing water in from the Zambezi by train – This is not a feasible option.
3. Build a new supply dam – Under the Matabeleland Zambezi Water Project. This option is
the most likely at present, and is the focus of the rest of this paper.
0
50
100
150
200
250
300
350
400
1965 1970 1975 1980 1985 1990 1995 2000
Days
wit
ho
ut
Flo
w
Year
Insiza Dam: Number of Days without Flow
Figure 8

3.4 The Matabeleland Zambezi Water Project
The National Matabeleland Zambezi Water Project (NMZWP) proposes diversion of water from
the Zambezi River 400km north of Bulawayo. It has been planned for over 100 years, and the
current proposal involves three stages, involving a dam and pipeline construction (approximately
150km from city). Funding for the dam (approximately US$800 million) has recently been
secured from the Chinese government, finally making the NMZWP a realistic possibility (New
Zimbabwe, 2012).
The first and most urgent phase of the project is to construct a dam just downstream of the
confluence of the Gwayi and Shangani rivers. This dam site is shown in Figure 9 above. The dam
would then supply the city by pipeline, in much the same way as its five supply dams have done in
the past over a shorter distance.
Figure 9

4. Methodology and Analysis
This section attempts to use standard GIS techniques to describe relevant characteristics of both
the watershed that the city currently relies upon (Current WS) as well as the proposed Gwayi-
Shangani dam watershed (Proposed WS). Comparing characteristics of the watersheds allows a
measure of the effectiveness of the plan to build the new dam. Learning from past experiences
with water resource planning is key, particularly in this unpredictable environment.
Most of the techniques relied upon work with a 90 meter Digital Elevation Model (DEM), obtained
from ASTER (http://asterweb.jpl.nasa.gov/). The following sections describe the GIS analysis
performed and results obtained for each parameter examined. This analysis used GIS data from
the following sources.
4.1 Data Sources
FAO African Water Resource Database (AWRD)
- Most of the climatic data used came from this database, the best source of information
on African water resources for GIS.
Advanced Spaceborne Thermal Emission and Reflection Radiometer (ASTER)
- Digital Elevation Model: four squares were used to create a composite mosaic of
Zimbabwe.

I. Precipitation
Using 30 year average annual rainfall values and a polygon reference shapefile obtained from the
AWRD, average rainfall for each watershed was obtained using the Zonal Statistics Tool in ArcGIS.
Precipitation Current Watershed Proposed Watershed Total 635mm/yr 633mm/yr
Figure 10

II. Evapotranspiration
As for precipitation, an Evapo-
transpiration raster was used
to calculate zonal statistics and
assign them to each watershed.
The results are summarized
below:
Evapotranspiration Current Watershed Proposed Watershed Total 1577mm/yr 1631mm/yr
III. Area
Area was calculated using the built in ArcGIS geometry tool. This was checked against the flow
accumulation raster calculated for each watershed, and the numbers were nearly identical (when
multiplied by the area of each grid cell, approximately 8100m2). The Proposed WS is much larger
(more than ten times) than the one currently in use.
Area Current Watershed (km2) Proposed Watershed (km2) Upper Ncema 612 L Ncema 64 Umzingwane 465 Inyakuni 343 Insiza 1810 Total 3294 36810
Figure 11

Multiplying these areas by the average annual rainfall gives the annual available water (before
evapotranspiration, runoff, etc). Again, there is a multiple of ten difference between the two
watersheds:
Available Water Current Watershed Proposed Watershed Total 2.09 km3/year 23.30 km3/year
IV. Runoff
Runoff is perhaps the most difficult
parameter to obtain or calculate in
this data-poor region. Below is a
map of the relevant watersheds as
well as the locations of GRDC
stations around them (Figure 12).
However, the GRDC data for these
stations, where available, is only
current up to 1990 at best. Much of
the data available ends at 1980
records. This means that useful
historical analyses can be
performed, but current trends are
more difficult to analyze.
V. Elevation
As mentioned previously, Bulawayo
sits on some relief, meaning that
water generally tends to flow away
from the city (to the south towards
the Limpopo, or to the north
towards the Zambezi). The average
elevation values for each relevant
watershed are shown below (Figure
13):
Figure 12
Figure 13

Elevation (meters above SL) Current WS Proposed WS Mean 1278 1176 Max 1530 1527 Min 1079 880 Range 451 647
These values are expected, as the Proposed WS covers a much greater area as it moves water
down towards the Zambezi.
VI. Slope
Though the Proposed WS has a
greater range of elevation, the
Current WS actually shows the
greatest slope, shown below (Figure
14):
VII. Soil
The soil types between the two
watersheds are fairly consistent. In
fact, they share large contributions of
Lc49-3a and Lf 82-1a (FAO
classification, shown in Figure 15).
Slope (degrees)
Current WS
Proposed WS
Mean 2.64 1.20 Max 35.8 29.2 Min 0 0
Figure 14
Figure 15

VIII. Dam Density
Particularly intersting in the case of Zimbabwe, is the density of surface water bodies (SWB, both
dams and natural formations) that occur. Assuming that dams have some effect on the flow
characteristics of given watershed, it may be reasonable to assert that a higher proportion of dams
might lead to lower flow within the watershed altogether (Figures 16, 17, 18).
A shapefile of SWBs for Southern Africa was clipped to Zimbabwe. Spatial Joins were used to
aggregate each type of SWB to distinct watersheds, according to the following classification:
Small <100 Acre-feet Capacity Medium >100, <10 000 Acre-feet Capacity Large >10 000 Acre-feet Capacity
Below is a table detailing the relationship between the number and surface areas of small,
medium, and large SWBs in each of the city’s current watersheds, as well as the Proposed WS.
Number of SWBs
Current Watershed
Small Medium Large Proposed Watershed
Small Medium Large
U Ncema 21 58 0
L Ncema 2 8 0
Umzingwane 59 19 0
Inyakuni 1 10 0
Insiza 125 16 0
Total 208 111 0 Total 1180 67 1
Figure 16 Figure 17
Capactiy of SWBs
Current Watershed
(Acre-feet)
U Ncema 354 8066 0
L Ncema 19 1063 0
Umzingwane 857 3064 0
Inyakuni 19 1179 0
Insiza 805 11708 0
Total 2054 25080 0 Total 13903 37510 11698
Taken together, therefore, the Current WS shows a total SWB density (number of SWBs divided by
total area) of 319/3294 = 0.0968km-2. The Proposed WS has a total SWB density of 1247/36810
= 0.0339km-2. This is three times lower than the current watershed, a striking difference.
In terms of capacity of these water bodies, which might have an even more direct effect on the
ability of a watershed to supply water, the Current WS has a total capacity density (capacity of
SWBs summed over area, divided by area) of 27134acre-feet/3294km2 = 8.237 acre-feet/km2.
In contrast, the Proposed WS has a capacity density of just 50598/36810 = 1.375 acre-feet/km2.
This is much less than the Current WS, and could give some justification for planning a dam on the
Gwayi-Shangani river.
Figure 18

Qualitatively, we also see that the western side of the Proposed WS has many fewer SWBs than the
Current WS (Figures 16 and 17).
IX. Drainage Density
Finally, using the map algebra function and hydrology toolbox in ArcGIS, the delineated
watersheds were processed to give the following statistics (Figures 19, 20):
Drainage Density
Current Watershed Proposed Watershed
Name Length (km)
Area (km2)
Drainage Density
Length (km)
Area (km2)
Drainage Density
U Ncema 64 612 0.105
L Ncema 8 64 0.125
Umzingwane 64 465 0.138
Inyakuni 42 343 0.122
Insiza 252 1810 0.139
Total 430 3294 0.131 4412 36810 0.120
Figure 19
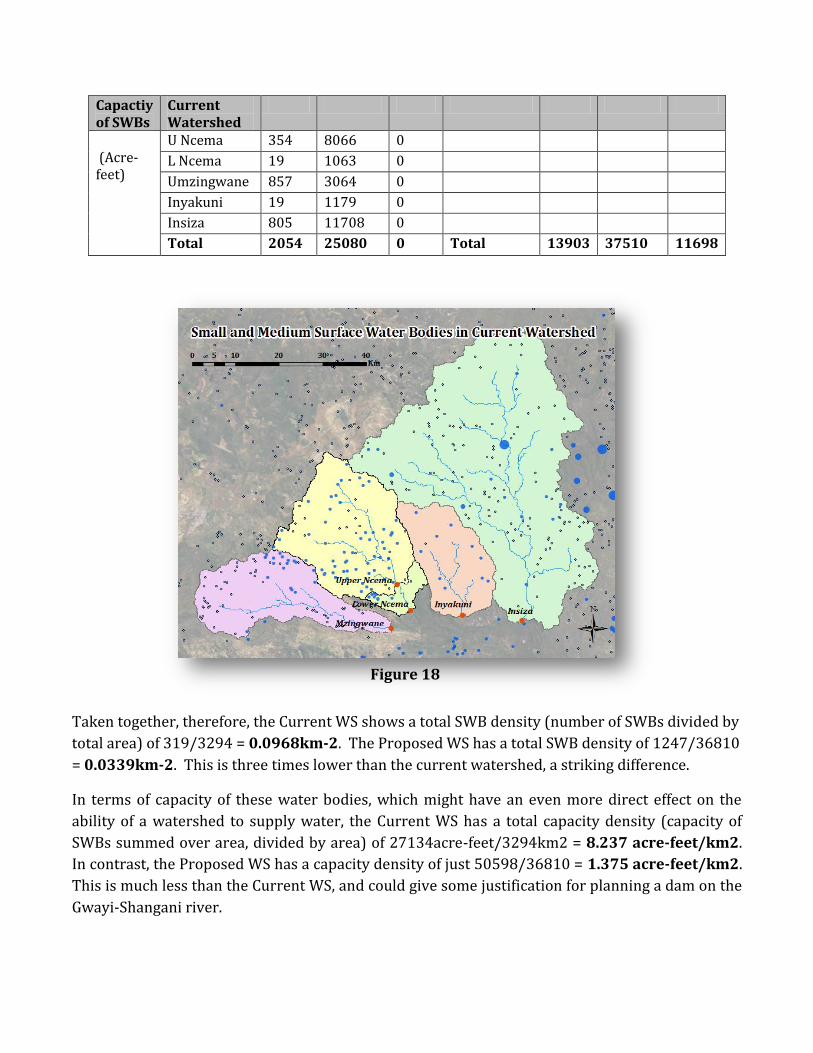
From this table we can see that the two different watersheds do not have a substantially different
drainage density. However, the Proposed WS has the lowest drainage density of any, and care
should be taken in planning for runoff.
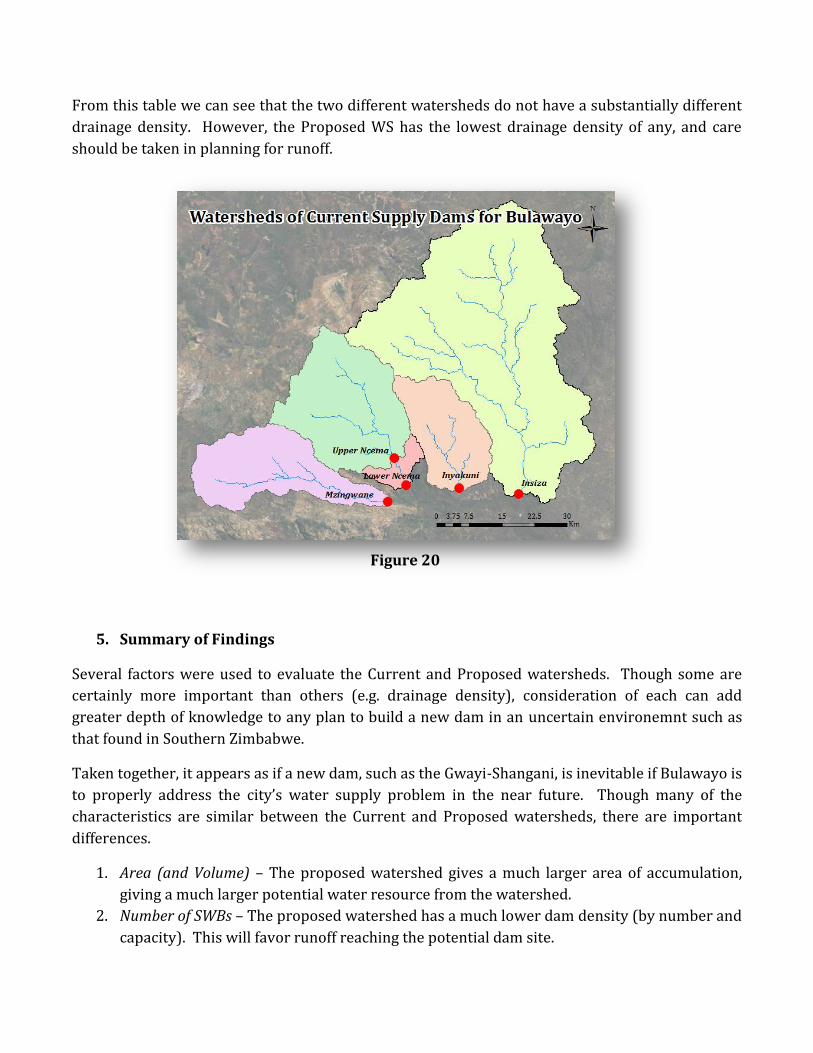
5. Summary of Findings
Several factors were used to evaluate the Current and Proposed watersheds. Though some are
certainly more important than others (e.g. drainage density), consideration of each can add
greater depth of knowledge to any plan to build a new dam in an uncertain environemnt such as
that found in Southern Zimbabwe.
Taken together, it appears as if a new dam, such as the Gwayi-Shangani, is inevitable if Bulawayo is
to properly address the city’s water supply problem in the near future. Though many of the
characteristics are similar between the Current and Proposed watersheds, there are important
differences.
1. Area (and Volume) – The proposed watershed gives a much larger area of accumulation,
giving a much larger potential water resource from the watershed.
2. Number of SWBs – The proposed watershed has a much lower dam density (by number and
capacity). This will favor runoff reaching the potential dam site.
Figure 20

Given the factors above, the Gwayi-Shangani dam will potentially be able to supply the city of
Bulawayo for many years to come. It should be noted, however, that economic considerations
were not taken into account in this analysis, including the cost of the dam and associated pipeline
construction and maintenance.
Bulawayo is suffering from a perfect storm of conditions: climatic, economic, geographic, etc. Yet
if it hopes to improve its situation, it must learn from the past. Comparing the currently used
watersheds for the city’s dams to a proposed watershed for a new dam is one way of evaluating
the potential viability of the new watershed. Like much of Africa, Bulawayo is urbanizing quickly,
and therfore engineers and policymakers will need to continue to adapt. Supplying water to Africa
in the future could mean fewer boreholes and more large-scale, modern urban systems.
6. Conclusion: The Role of GIS
This study has shown some of the
uses of GIS in even the poorest
regions of Africa (data and
otherwise). Though Zimbabwe used
to have a well-constructed
hydrological monitoring system,
current economic and political
conditions have left it with limited
resources. However, remotely-
sensed data, freely available from
different organizations, still allows
for quite detailed analyses of even
small watersheds.
Future work using GIS could
incorporate GRDC data (even though
dated), local data obtained from the
City Council (if available), or one of
several models applicable in this
region
Figure 21

7. References
BBC News. (2012, September 24). Synchronised toilet flush held in Zimbabwe's Bulawayo. Retrieved
from BBC News Online: http://www.bbc.co.uk/news/world-africa-19704766
Callow, R., & MacDonald, A. (2009). What will climate change mean for groundwater supply in
Africa. London: Overseas Development Institute.
Karimakwenda, T. (2012, April 4). Zimbabwe: Loan Scheme for Marginalized Areas Ignores
Bulawayo. Retrieved from allAfrica: http://allafrica.com/stories/201204051396.html
Makiwa, H. (2007, September 20). Government withholds water to Bulawayo. Retrieved from
http://www.swradioafrica.com/news200907/byowater200907.htm
Mkandla, N., Van der Zaag, P., & Sibanda, P. (2005). Bulawayo water supplies: Sustainable
alternatives for the next decade. Physics and Chemistry of the Earth, p. 938.
New Zimbabwe. (2012, July 12). China funds $1,2bn Zambezi Water Project. Retrieved from New
Zimbabwe: http://www.newzimbabwe.com/news-8476-
China+funds+$1,2bn+Zambezi+Water+Project/news.aspx
Nyabeze, W. R. (2005). Calibrating a distributed model to estimate runoff for ungauged
catchments in Zimbabwe. Physics and Chemistry of the Earth, 625-633.
Onema, J.-M. K., Rockstrom, J., Mazvimavi, D., Love, D., Mul, M., van Rooyen, A., et al. (n.d.). Influence
of Human Activities on the Hydrology of the Insiza River, Limpopo Basin, Zimbabwe -
Implications for Catchment Planning. Lubumbashi.
The Economist. (2010, December 13). Growth areas: The urbanization of Africa. Retrieved from
The Economist:
http://www.economist.com/blogs/dailychart/2010/12/urbanisation_africa
The United Nations. (n.d.). Millennium Development Goals. Retrieved from United Nations:
http://www.un.org/millenniumgoals/environ.shtml
UN Economic Commission for Africa. (n.d.). Africa Water Vision 2025. UNECA.