Embed Size (px)
Citation preview

WATER SENSITIVE URBAN DESIGN
TECHNICAL DESIGN GUIDELINES
FINAL
Prepared for the Northern Territory Department of Planning and Infrastructure
GPO Box 2520 Darwin NT 0801
May 2009
This document has been prepared as part of the Darwin Harbour WSUD
Strategy, supported by funding from the Australian Government

This document has been prepared solely for the benefit of the Northern Territory Department of Planning and Infrastructure and is issued in confidence for the purposes only for which it is supplied. Unauthorised use of this document in any form whatsoever is prohibited. No liability is accepted for this document with respect to its use by any other person.
This disclaimer shall apply notwithstanding that the document may be made available to other persons for an application for permission or approval to fulfil a legal obligation.
Document Control Sheet
Report title: Technical Design Guidelines
Version: Final
Author(s): Alexa McAuley
Approved by: David Knights
Signed:
Date: May 2009
File Location: W:\Projects\8005 Darwin Region WSUD Strategy
Distribution: Northern Territory Department of Planning and Infrastructure

Page i
Table of Contents
1111 INTRODUCTIONINTRODUCTIONINTRODUCTIONINTRODUCTION........................................................................................................................................................................................................................................................................................................................................................................................................................................................................ 1111
1.1 Purpose of these guidelines............................................................................................1
1.2 Scope of these guidelines...............................................................................................2
2222 THE DESIGN PROCESSTHE DESIGN PROCESSTHE DESIGN PROCESSTHE DESIGN PROCESS .................................................................................................................................................................................................................................................................................................................................................................................................................... 4444
3333 DESIGN PARAMETERSDESIGN PARAMETERSDESIGN PARAMETERSDESIGN PARAMETERS ........................................................................................................................................................................................................................................................................................................................................................................................................................ 5555
3.1 Rainfall and other climatic data.......................................................................................5
3.2 IFD data...........................................................................................................................5
3.3 Rational Method parameters...........................................................................................5
4444 INITIALINITIALINITIALINITIAL CONSIDERATIONS CONSIDERATIONS CONSIDERATIONS CONSIDERATIONS ................................................................................................................................................................................................................................................................................................................................................................................................ 6666
4.1 WSUD strategy ...............................................................................................................6
4.2 Treatment train................................................................................................................6
5555 DESIGN CALCULATIONSDESIGN CALCULATIONSDESIGN CALCULATIONSDESIGN CALCULATIONS................................................................................................................................................................................................................................................................................................................................................................................................................ 9999
5.1 Swales and buffer strips................................................................................................10
5.1.1 Introduction and design considerations ..........................................................10
5.1.2 Design process ...............................................................................................10
5.1.3 Worked example .............................................................................................14
5.2 Bioretention systems.....................................................................................................23
5.2.1 Introduction and design considerations ..........................................................23
5.2.2 Design process ...............................................................................................25
5.2.3 Worked example .............................................................................................29
5.3 Sedimentation basins....................................................................................................40
5.3.1 Introduction and design considerations ..........................................................40
5.3.2 Design process ...............................................................................................40
5.3.3 Worked example .............................................................................................44
5.4 Constructed wetlands....................................................................................................54
5.4.1 Introduction and design considerations ..........................................................54
5.4.2 Design process ...............................................................................................56
5.4.3 Worked example .............................................................................................62
5.5 Sand filters ....................................................................................................................74
5.5.1 Introduction and design considerations ..........................................................74
5.5.2 Design process ...............................................................................................74
5.5.3 Worked example .............................................................................................75
5.6 Infiltration measures......................................................................................................76
5.6.1 Introduction and design considerations ..........................................................76
5.6.2 Design process ...............................................................................................78
5.6.3 Worked example .............................................................................................80
5.7 Aquifer storage and recovery ........................................................................................81
6666 DETAILED DESIGNDETAILED DESIGNDETAILED DESIGNDETAILED DESIGN ............................................................................................................................................................................................................................................................................................................................................................................................................................................ 83838383
6.1 Safety ............................................................................................................................83

Page ii
6.2 Mosquito management..................................................................................................83
6.3 Vegetation .....................................................................................................................84
6.4 Landscape design .........................................................................................................85
6.5 Standard drawings ........................................................................................................85
6.6 Planning for construction, establishment and ongoing maintenance............................85
7777 CHECKING TOOLSCHECKING TOOLSCHECKING TOOLSCHECKING TOOLS ............................................................................................................................................................................................................................................................................................................................................................................................................................................ 87878787
8888 REFERENCESREFERENCESREFERENCESREFERENCES............................................................................................................................................................................................................................................................................................................................................................................................................................................................................ 92929292
Page 1
1 INTRODUCTION
Urban development in the Darwin Region is occurring without appropriate consideration of its impact on the health of the region’s waterways. In order to manage the impacts of new development and redevelopment on Darwin Harbour, the Territory Government is seeking to implement Water Sensitive Urban Design (WSUD) within all new development
To facilitate the adoption of WSUD, the DPI (Department of Planning and Infrastructure) in conjunction with NRETA (Department of Natural Resources, Environment and the Arts) have secured a grant from the Australian Government Coastal Catchments Initiative (CCI) program to develop a WSUD Strategy for Darwin Harbour. The WSUD Strategy will create an enabling environment to ensure commitment to urban water cycle and stormwater management through a WSUD framework for Darwin. The WSUD framework will link policy to locally relevant technical design guidelines, manuals and industry tools.
These Technical Design Guidelines have been prepared for design practitioners seeking to implement WSUD in new subdivision development. They include design procedures and checking tools for the design process. Prior to consulting these Technical Design Guidelines, a WSUD Strategy should first be prepared for the sub-division site. The method for preparation of a WSUD Strategy is outlined in the WSUD Planning Guide for Darwin.
1.1 Purpose of these guidelines
These Technical Design Guidelines have been developed as part of the Darwin Harbour WSUD Strategy, funded by the CCI program. They have been prepared as part of Task 16 (Stage 6) of the Workplan, along with several other guideline documents. The framework of guideline documents is shown in Figure 1.
These guidelines are intended for design practitioners who are designing WSUD solutions, particularly stormwater treatment systems. This document is accompanied by a vegetation selection guide and a set of Standard Drawings, to form a complete design resource for the detailed design stage.
These Technical Design Guidelines follow on from the WSUD Planning Guide, which described how to develop a site-specific WSUD strategy for a new development. These Technical Design Guidelines describe how to undertake design calculations and prepare detailed designs for WSUD elements within a new development. These Technical Design Guidelines focus on stormwater quality improvement measures (unlike the WSUD Planning Guide, which encompassed both potable water conservation and stormwater quality improvement), as it is in this area that most detailed design input is required.
Following on from these Technical Design Guidelines, the Construction, Establishment, Asset Handover and Maintenance Guide provides guidance on these stages in the WSUD implementation process.
These Technical Design Guidelines describe appropriate methods for the detailed design of some common structural WSUD measures which are appropriate in the Darwin Region. It is not the intention of the guidelines either to advocate or to discourage particular approaches. Hence, exclusion of a particular type of device from the guidelines does not imply that it can not be used in Darwin.
WSUD is a new practice in the Darwin Region and in the wet-dry tropics in general. Knowledge of best practices for design and construction of WSUD measures in this climatic zone is constantly increasing. These guidelines therefore encourage innovation and the pursuit of alternative approaches to those presented within it. The design procedures and recommendations given in these guidelines are based on current best practice in southern Australia, incorporating findings from local research. Alternative designs may provide potential improvements in performance, constructability or ease of maintenance.

Page 2
Figure Figure Figure Figure 1111: Relationship of the : Relationship of the : Relationship of the : Relationship of the ““““””””Technical Design GuidelinesTechnical Design GuidelinesTechnical Design GuidelinesTechnical Design Guidelines” to other guidelines and tools” to other guidelines and tools” to other guidelines and tools” to other guidelines and tools
1.2 Scope of these guidelines
The Technical Design Guidelines include the following components:
SectionSectionSectionSection ContentsContentsContentsContents
Section 1: INTRODUCTION
The introduction outlines the purpose and scope of the Technical Design Guidelines, showing how they relate to other WSUD documents and tools available as part of the Darwin Harbour WSUD Strategy.
Section 2: THE DESIGN PROCESS
Section 2 gives an outline of the detailed design process, showing the steps involved and indicating how to use these guidelines at each stage in the process.
Section 3: DESIGN PARAMETERS
Section 3 provides some key design parameters for the Darwin Region, and outlines where to obtain information on others.
Section 4: INITIAL CONSIDERATIONS
Section 4 provides an outline of key design considerations which should be investigated before commencing detailed design calculations. A key step here is to review the WSUD Strategy prepared for the site during the planning phase.
Section 5: DESIGN CALCULATIONS
Section 5 describes how to undertake design calculations for WSUD systems including stormwater treatment systems (swales, bioretention systems, sedimentation basins, wetlands, sand filters), infiltration systems and aquifer storage and recovery systems. This section refers to the SEQ Guidelines (see below) for detailed calculation procedures, but includes information on how to apply the SEQ procedures in the Darwin context, and includes worked examples specific to the Darwin Region.

Page 3
SectionSectionSectionSection ContentsContentsContentsContents
Section 6: DETAILED DESIGN
Section 6 includes information to complete detailed design, including advice on safety, mosquito management, vegetation selection, landscape design, completion of design drawings, and planning for construction, establishment and maintenance.
Section 7: CHECKING TOOLS
Section 7 presents a series of design assessment checklists for WSUD systems.
Section 8: REFERENCES Section 8 lists the references referred to in this document, which the user may refer to for further information.
A key design resource which should be used in conjunction with this document is the WSUD Technical Design Guidelines for South East Queensland (Moreton Bay Waterways and Catchments Partnership, 2006). This document is available online:
http://www.healthywaterways.org/wsud_technical_design_guidelines.html
The main reasons for relying on the South-East Queensland Technical Design Guidelines (“SEQ Guidelines”) as a design reference in Darwin are as follows:
• The SEQ Guidelines are a comprehensive design resource. They step through the procedures to design swales, bioretention swales, sediment basins, bioretention basins, constructed stormwater wetlands, infiltration systems, sand filters and aquifer storage and recovery systems, providing in-depth design information.
• Most of the information in the SEQ guidelines is relevant across Australia and elsewhere.
• The SEQ Guidelines are supported by the Healthy Waterways Partnership’s “Water by Design” program, and are regularly reviewed (they are due for review in 2009).
Therefore rather than producing a stand-alone design manual for the Darwin Region, it is recommended that the SEQ Guidelines be used here, in conjunction with specific local information where required. These Technical Design Guidelines are intended to accompany the South East Queensland Guidelines, facilitating their interpretation for the local conditions in Darwin.
Note that the SEQ Guidelines often refer to QUDM and other local guidelines and policy documents, but the Darwin and Palmerston subdivision guidelines can be used in their place.

Page 4
2 THE DESIGN PROCESS
The overall detailed design process for stormwater treatment systems is outlined below. These guidelines step through this process, providing information to guide each stage.
1. Establish key design parameters
- Rainfall, IFD data
2. Review WSUD Strategy
- Major site features and key constraints
- Landscape and urban design imperatives
- Stormwater treatment train
3. Undertake design calculations
4. Complete detailed design, including drawings
- Ensure safety requirements are met
- Ensure the design minimises the risk of mosquito breeding
- Select vegetation for stormwater treatment systems
- Seek landscape design input
- Produce design drawings
- Plan for construction, establishment and ongoing maintenance
5. Check design calculations

Page 5
3 DESIGN PARAMETERS
Before commencing detailed design calculations, basic design parameters can be compiled for the site.
Local guidelines on flood management, stormwater drainage design, road design and landscape design should be consulted for information on design requirements which may impact on WSUD system designs. The following local guidelines are available:
• Darwin City Council 2005 Subdivision and Development Guidelines September 2005.
• City of Palmerston 2007 Palmerston Subdivisional Guidelines Revision 1, August 2007.
3.1 Rainfall and other climatic data
Across the Darwin Region, rainfall characteristics are relatively uniform (see the analysis in Section 5.2 of the Stormwater Quality Modelling Guide. Therefore a single set of rainfall data is recommended for use in designing WSUD elements throughout the region.
As per the recommendation in the Stormwater Quality Modelling Guide, the appropriate rainfall data for the Darwin Region is that from Darwin Airport (Station No. 014015). When a 6-minute timestep is required (e.g. for stormwater quality modelling), the period 1 Jan 1987 – 31 Dec 1996 should be used. When a daily timestep is required (e.g. for modelling a stormwater harvesting scheme), the period 1941-2006 should be used.
When potential evapo-transpiration (PET) data is required, the default monthly values in the MUSIC model should be used. These are also included in the Stormwater Quality Modelling Guide.
Evaporation data may be required for some calculations. Monthly evaporation data is available for the Darwin Airport weather station from the Bureau of Meteorology’s website: http://www.bom.gov.au/climate/averages/.
3.2 IFD data
Rainfall Intensity-Frequency-Duration (IFD) data for the location of interest should be obtained from Australian Rainfall and Runoff (AR&R). AR&R Volume 2 contains design rainfall isopleths for all of Australia, as well as skewness and geographical factors required to produce IFD curves.
IFD curves can also be produced for a site using the Bureau of Meteorology’s online tool. Given the site latitude and longitude, the tool calculates the relevant parameters and produces the IFD data in a table and chart. The tool is available at: http://www.bom.gov.au/hydro/has/cdirswebx/index.shtml.
3.3 Rational Method parameters
Using the Rational Method for undeveloped catchments in the Northern Territory is described in AR&R, pp.112-114. The use of the Rational Method for developed catchments is described on pp.306-307.
Page 6
4 INITIAL CONSIDERATIONS
4.1 WSUD strategy
Before commencing detailed design, ideally a WSUD Strategy should have been prepared for the development area in which the proposed stormwater treatment measure/s are located. A WSUD Strategy should outline:
• Background information on the site, including information on groundwater, geology and soils, drainage and flooding, ecology, regional infrastructure and regional planning
• Information on the proposed development
• Identification of site constraints and opportunities, including information on the site context and physical setting
• WSUD objectives for the proposed development
• Information on how water conservation and stormwater quality targets will be met, including the location, size and configuration of stormwater treatment elements, a summary of stormwater quality model results, and details of key assumptions and parameters used in the stormwater quality model
• Information on how stormwater treatment elements will be integrated with the urban design
• An outline maintenance plan
• A ballpark cost estimate for WSUD systems
When commencing detailed design, the WSUD Strategy is therefore a valuable resource and a starting point for the design.
4.2 Treatment train
In designing an individual stormwater treatment measure, it is important to consider its location within a treatment train. This will influence its design, including the flows and pollutants which it needs to target, the water quality outcomes which it needs to meet, and its sizing and overall configuration.
The following tables have been adapted from the SEQ Guidelines, with some modifications where considered appropriate for the Darwin Region. They show:
• The scale at which various WSUD measures are typically suitable (Table 1.2). Within a subdivision development, it is likely that WSUD measures will involve a combination of elements at allotment, street and regional scale, in order to meet both water conservation and stormwater quality objectives.
• The effectiveness of these treatment measures in meeting different objectives (Table 1.3). The Darwin Harbour WSUD Strategy sets objectives for water conservation and stormwater quality treatment. However there are other important issues associated with the impact of urban development on the water cycle. By introducing substantial paved surfaces into catchments, urban development increases peak stormwater flows and total stormwater runoff volumes. This has negative impacts on downstream waterways, including scour and erosion. Some WSUD measures, even those designed principally as water conservation or stormwater treatment measures, can provide peak flow attenuation (particularly for frequent events, which are the most damaging for downstream waterways) and reduce post-development runoff volumes. While the Darwin Harbour WSUD Strategy does not include specific objectives relating to peak flows or runoff volumes, these issues are still important and worth considering in selecting WSUD measures.

Page 7
• Site conditions that may affect the suitability of different treatment measures (Table 1.4). This is a complex set of considerations which are difficult to summarise in a single table, so Table 1.4 should be considered only as a general guide. Certain site conditions will favour some WSUD measures over others (e.g. flatter sites favour wetlands for stormwater treatment, while steeper sites favour bioretention systems), however wetlands are not necessarily the best solution on all flat sites. Some WSUD measures are less affected by site constraints than others, but there are other aspects to be considered, such as construction and maintenance costs (e.g. sand filters have a small footprint and can generally be designed to accommodate any environmental conditions, but they have significant maintenance requirements).
Table Table Table Table 1111: : : : Scale at which WSUD measures can be appliedScale at which WSUD measures can be appliedScale at which WSUD measures can be appliedScale at which WSUD measures can be applied
WSUD MeasureWSUD MeasureWSUD MeasureWSUD Measure Allotment ScaleAllotment ScaleAllotment ScaleAllotment Scale Street ScaleStreet ScaleStreet ScaleStreet Scale Precinct or Regional Precinct or Regional Precinct or Regional Precinct or Regional
ScaleScaleScaleScale
Swales and buffer strips �
Bioretention swales �
Sedimentation basins �
Bioretention basins � � �
Constructed wetlands � �
Sand filters �
Infiltration measures � �
Aquifer storage and recovery
�
Table Table Table Table 2222: Effectiveness of WSUD measures: Effectiveness of WSUD measures: Effectiveness of WSUD measures: Effectiveness of WSUD measures
WSUD MeasureWSUD MeasureWSUD MeasureWSUD Measure Water Water Water Water conservationconservationconservationconservation
Stormwater Stormwater Stormwater Stormwater quality quality quality quality
treatmenttreatmenttreatmenttreatment
Peak flow Peak flow Peak flow Peak flow attenuationattenuationattenuationattenuation
Reduction in Reduction in Reduction in Reduction in runoff volumerunoff volumerunoff volumerunoff volume
Swales and buffer strips - M L L
Bioretention swales - H M L
Sedimentation basins - M M L
Bioretention basins - H M L
Constructed wetlands - H H L
Sand filters - M L L
Infiltration measures - L M H
Aquifer storage and recovery
H L M H
Key: H = high (main purpose of the WSUD measure) M = medium (the WSUD measure provides some measurable benefit in this role) L = low (the WSUD measure provides limited benefits in this role)

Page 8
Table Table Table Table 3333: Site constraints affecting the suitability of WSUD measures: Site constraints affecting the suitability of WSUD measures: Site constraints affecting the suitability of WSUD measures: Site constraints affecting the suitability of WSUD measures
WSUD MeasureWSUD MeasureWSUD MeasureWSUD Measure
Ste
ep
site
Ste
ep
site
Ste
ep
site
Ste
ep
site
Sh
allo
w b
Sh
allo
w b
Sh
allo
w b
Sh
allo
w b
ed
rock
ed
rock
ed
rock
ed
rock
Acid
su
lph
ate
A
cid
su
lph
ate
A
cid
su
lph
ate
A
cid
su
lph
ate
so
ilsso
ilsso
ilsso
ils
Lo
w p
erm
ea
bili
ty
Lo
w p
erm
ea
bili
ty
Lo
w p
erm
ea
bili
ty
Lo
w p
erm
ea
bili
ty
so
ils (
e.g
. cla
y)
so
ils (
e.g
. cla
y)
so
ils (
e.g
. cla
y)
so
ils (
e.g
. cla
y)
Hig
h p
erm
ea
bili
ty
Hig
h p
erm
ea
bili
ty
Hig
h p
erm
ea
bili
ty
Hig
h p
erm
ea
bili
ty
so
ils (
e.g
. sa
nd
)so
ils (
e.g
. sa
nd
)so
ils (
e.g
. sa
nd
)so
ils (
e.g
. sa
nd
)
Hig
h w
ate
r H
igh
wa
ter
Hig
h w
ate
r H
igh
wa
ter
tab
le/w
ate
rlo
gg
ed
ta
ble
/wa
terl
og
ge
d
tab
le/w
ate
rlo
gg
ed
ta
ble
/wa
terl
og
ge
d
so
ilsso
ilsso
ilsso
ils
Hig
h s
ed
ime
nt
Hig
h s
ed
ime
nt
Hig
h s
ed
ime
nt
Hig
h s
ed
ime
nt
inp
ut
inp
ut
inp
ut
inp
ut
La
nd
ava
ilab
ility
La
nd
ava
ilab
ility
La
nd
ava
ilab
ility
La
nd
ava
ilab
ility
Swales and buffer strips C D D � � D D C
Bioretention swales C C C � � C D C
Sedimentation basins C D C � D D � C
Bioretention basins D C C � � C D C
Constructed wetlands C D C � D D D C
Sand filters D D C � � D D �
Infiltration measures C C C C � C D C
Aquifer storage and recovery
C C C C � C D C
Key: C – Constraint may preclude use, or require selection of an alternative site D – Constraint may be overcome through appropriate design � - Generally not a constraint

Page 9
5 DESIGN CALCULATIONS
The following nine sections of these guidelines each detail the design methodology for a different type of WSUD measure. Each section corresponds to a chapter in the SEQ guidelines. Table 4 provides an overview of each section.
Table Table Table Table 4444: Outline of design calculations contents: Outline of design calculations contents: Outline of design calculations contents: Outline of design calculations contents
SectionSectionSectionSection SEQ SEQ SEQ SEQ
ChapterChapterChapterChapter TreTreTreTreatment atment atment atment MeasureMeasureMeasureMeasure
DescriptionDescriptionDescriptionDescription
5.1 2 Swales and buffer strips
A swale is a shallow trapezoidal channel lined with vegetation. A buffer strip is a vegetated slope. Stormwater flows along a swale, but across a buffer strip. Treatment is provided by filtration of shallow flow through the vegetation, and by some infiltration to the soil below.
5.2 5 Bioretention systems
A bioretention system is a vegetated bed of filter material, such as sandy loam. A bioretention system is designed to capture stormwater runoff which then drains through the filter media. Pollutants are removed by filtration and by biological uptake.
5.3 4 Sedimentation basins
A sedimentation basin is a small pond, about 1 m deep, designed to capture coarse to medium sediment from urban catchments. Treatment is provided primarily through settling of suspended particles.
5.4 6 Constructed wetlands
Constructed wetland systems are shallow, vegetated water bodies that use enhanced sedimentation, fine filtration and biological uptake processes to remove pollutants from stormwater.
5.5 8 Sand filters A sand filter is a sand layer designed to filter fine particulates from stormwater before discharging to a downstream drainage system or prior to storage and reuse.
5.6 7 Infiltration measures
Infiltration measures typically consist of a holding pond or tank designed to promote infiltration of appropriately treated stormwater to surrounding soils. The primary function of these devices is runoff volume control rather than pollutant removal.
5.7 9 Aquifer storage and recovery
Aquifer storage and recovery involves enhancing water recharge to underground aquifers through pumping or gravity feed of treated stormwater. This helps ensure that water remains available in the aquifer for sustainable extraction.
Within the SEQ guidelines, each chapter includes the following sections which are relevant to Darwin:
• Introduction
• Design considerations
• Design Process
Within the following sections, user notes are provided for the Darwin Region, enabling the SEQ Guidelines to be adapted to local requirements.
Note that each chapter of the SEQ Guidelines also includes information on landscape design, construction and establishment and maintenance requirements. These Subdivision Development Guidelines include a separate section landscape design (Section 6.4), and construction, establishment and maintenance are discussed in the separate Construction, Establishment, Asset Handover and Maintenance Guide.

Page 10
Each chapter of the SEQ guidelines also includes checking tools and references to example engineering drawings, however these are not relevant here, as local checking tools and standard drawings have been produced specifically for the Darwin Region. The checking tools are included in Section 7 of this document, and the standard drawings are provided separately.
Finally, each chapter of the SEQ Guidelines includes a worked example. There should be no need for Darwin practitioners to refer to these, as local worked examples have been presented in the following sections.
5.1 Swales and buffer strips
5.1.1 Introduction and design considerations
In general the design of swales in the Darwin Region should follow similar principles and methodology to their design elsewhere. The SEQ Guidelines cover swales and buffer strips in Chapter 2. In that document, the Introduction and Design Considerations are all relevant in the Darwin Region, with the following exceptions:
• The relevant scour velocity recommended in the Darwin Region is 1.5 m/s (rather than 2.0 m/s recommended in the SEQ Guidelines).
• Depth and velocity criteria based on QUDM should be substituted with relevant criteria from the Darwin and Palmerston subdivision development guidelines. These both require that: “maximum depth in roadway is not to exceed 400 mm nor should D x V exceed 0.45 where D = depth (m) and V = velocity (m/s)”.
• For information on appropriate vegetation for swales in the Darwin Region, please refer to the Vegetation Selection Guide, rather than Appendix A of the SEQ Guidelines.
• Irrigation is a design consideration for the Darwin Region, not relevant to SEQ. Vegetated swales rely on healthy vegetation cover to filter stormwater pollutants and prevent scour and erosion. However if vegetation senesces significantly during the dry season, water quality treatment will be compromised at the start of the wet season, and scour and erosion may occur. Irrigation could overcome these potential problems. Some issues to consider when proposing an irrigated swale are as follows:
o Irrigation can impose a significant additional maintenance burden, which may not be appropriate for small swales located in local roads.
o Irrigation needs will depend on the vegetation selected for the swale. Appropriate plant selection may avoid the need for irrigation.
o Some plants may not require irrigation during the entire dry season, but may benefit from a period of irrigation at the end of the dry season, to establish vigorous growth prior to the start of the wet season, ensuring that the swale is ready for the first storms of the wet season.
o Low flows from residential irrigation runoff during the dry season may help to maintain swales without irrigation, particularly where there is a large contributing catchment upstream.
5.1.2 Design process
The same design steps should be followed in Darwin as in SEQ, however local performance curves, design parameters and verification checks are provided here for the Darwin Region.
Performance CurvesPerformance CurvesPerformance CurvesPerformance Curves
The performance curves for swales in the Darwin Region are shown in Figure 2. Note that the SEQ Guidelines included three separate figures for total suspended solids, total phosphorus and total

Page 11
nitrogen, however in Figure 2 these are all presented on the same chart. The assumptions used to produce these performance curves were:
• Top width: 5 m
• Base width: 1 m
• Side slopes: 1 in 4
• Longitudinal slope: 3%
• Vegetation height: 0.25 m
• The upstream catchment is a typical residential area, with an overall impervious fraction of approximately 50%
If the swale being designed differs substantially from these assumptions, or if it is part of a treatment train with upstream pre-treatment measures, then it is recommended that MUSIC be used to check the performance.
Swale Treatment Sizing Curve
0%
10%
20%
30%
40%
50%
60%
70%
80%
0 200 400 600 800 1000 1200
Swale length (m) per hectare of catchment area
% R
emoval
TSS
TP
TN
Figure Figure Figure Figure 2222: Performance curves for swales in the Darwin Region: Performance curves for swales in the Darwin Region: Performance curves for swales in the Darwin Region: Performance curves for swales in the Darwin Region
Design flowsDesign flowsDesign flowsDesign flows
As per SEQ, design flows for swales in small catchments should be calculated using the Rational Method. However the relevant minor and major design events are as follows:
• The “minor” event is termed the “initial” storm in the Darwin and Palmerston subdivision development guidelines. The design Average Recurrence Interval (ARI) ranges from 1-10 years, depending on the local government area and zoning.
• The design event for major storms in the Darwin Region is the 100 year ARI, for both local government areas and all zonings.

Page 12
Design of inflow systemsDesign of inflow systemsDesign of inflow systemsDesign of inflow systems
The SEQ Guidelines discuss the use of surcharge pits to deliver piped flows from allotments to swales, where free drainage is not possible (i.e. where the swale is too shallow or the drainage pipe too deep to discharge directly onto the swale surface). Surcharge pits are not recommended in Darwin, as during prolonged wet weather, water would pond in the drainage pipes and encourage mosquito breeding.
Pervious bases on surcharge pits and underdrainage are suggested as possible solutions in the SEQ Guidelines, however in Darwin’s wet season, soils become saturated and surcharge pits would be unlikely to drain.
Overflow pitsOverflow pitsOverflow pitsOverflow pits
Note that grated inlet pits are generally not recommended in Darwin and Palmerston’s subdivision development guidelines; however side entry pits would be impractical as field inlet pits for swales, and in this case grated pits are considered an appropriate option.
Verification checksVerification checksVerification checksVerification checks
To verify the swale design, the following checks are relevant in the Darwin Region:
• Vegetation scour velocity check: for minor floods, 0.5 m/s is appropriate. For major floods, the velocity should be less than 1.5 m/s (and typically less than 1.0 m/s is preferable).
• Velocity and depth check: the depth x velocity product should be less than 0.45 for all flows up to the major storm design flow. The maximum depth of flow for “at-grade” crossings is 400 mm.
Plant speciesPlant speciesPlant speciesPlant species
For information on appropriate vegetation for swales in the Darwin Region, please refer to the Vegetation Selection Guide.
Maintenance requirementsMaintenance requirementsMaintenance requirementsMaintenance requirements
It is worthwhile considering maintenance requirements at the design stage, particularly access requirements. Further information is provided in Section 6 and in the Construction, Establishment, Asset Handover and Maintenance Guide.
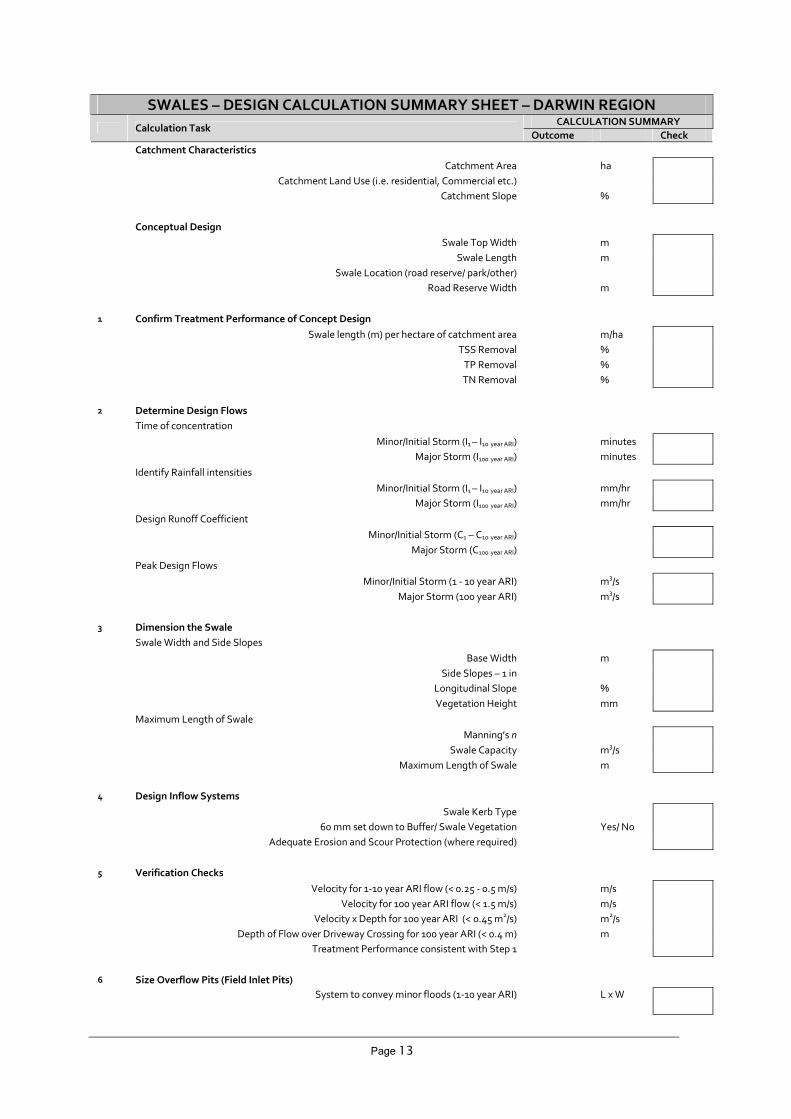
Design summaryDesign summaryDesign summaryDesign summary
A Design Calculation Summary Sheet specific to the Darwin Region has been provided below.
Page 13
SWALES – DESIGN CALCULATION SUMMARY SHEET – DARWIN REGION CALCULATION SUMMARY
Calculation Task Outcome Check
Catchment Characteristics
Catchment Area ha
Catchment Land Use (i.e. residential, Commercial etc.)
Catchment Slope %
Conceptual Design
Swale Top Width m
Swale Length m
Swale Location (road reserve/ park/other)
Road Reserve Width m
1 Confirm Treatment Performance of Concept Design
Swale length (m) per hectare of catchment area m/ha
TSS Removal %
TP Removal %
TN Removal %
2 Determine Design Flows
Time of concentration
Minor/Initial Storm (I1 – I10 year ARI) minutes
Major Storm (I100 year ARI) minutes
Identify Rainfall intensities
Minor/Initial Storm (I1 – I10 year ARI) mm/hr
Major Storm (I100 year ARI) mm/hr
Design Runoff Coefficient
Minor/Initial Storm (C1 – C10 year ARI)
Major Storm (C100 year ARI)
Peak Design Flows
Minor/Initial Storm (1 - 10 year ARI) m3/s
Major Storm (100 year ARI) m3/s
3 Dimension the Swale
Swale Width and Side Slopes
Base Width m
Side Slopes – 1 in
Longitudinal Slope %
Vegetation Height mm
Maximum Length of Swale
Manning’s n
Swale Capacity m3/s
Maximum Length of Swale m
4 Design Inflow Systems
Swale Kerb Type
60 mm set down to Buffer/ Swale Vegetation Yes/ No
Adequate Erosion and Scour Protection (where required)
5 Verification Checks
Velocity for 1-10 year ARI flow (< 0.25 - 0.5 m/s) m/s
Velocity for 100 year ARI flow (< 1.5 m/s) m/s
Velocity x Depth for 100 year ARI (< 0.45 m2/s) m
2/s
Depth of Flow over Driveway Crossing for 100 year ARI (< 0.4 m) m
Treatment Performance consistent with Step 1
6 Size Overflow Pits (Field Inlet Pits)
System to convey minor floods (1-10 year ARI) L x W

Page 14
5.1.3 Worked example
As part of a hypothetical residential development in the Darwin Region, runoff from allotments and street surfaces is to be treated in vegetated swale systems where practical. This worked example describes the detailed design of a swale system located in the road reserve of a local road network within the residential development. The layout of the swale and its catchment is shown in Figure 3. The conceptual configuration of the swale is presented in Figure 4. The catchment area draining to the swale is approximately 0.6 ha and the length of the swale is approximately 125 m. The slope of the swale is approximately 1%.
0 50
metres
403020100 50
metres
40302010
Figure Figure Figure Figure 3333: Plan of the example swale and its catchment: Plan of the example swale and its catchment: Plan of the example swale and its catchment: Plan of the example swale and its catchment
Allotment
Allotment
boundary
Maximum width of swale, 5 m Total width of road, 6 mAllotment
Allotment
boundary
Maximum width of swale, 5 m Total width of road, 6 m
Figure Figure Figure Figure 4444: Cross section showing layout of the example swale in the road reserve: Cross section showing layout of the example swale in the road reserve: Cross section showing layout of the example swale in the road reserve: Cross section showing layout of the example swale in the road reserve
The road is 6 m wide with a 5% crossfall either side of the centre, therefore a 3 m width of road will drain into the swale. The road reserve is approximately 16 m wide, with a 5 m nature strip on either side. Therefore the maximum width of the swale can be 5 m. No footpath is proposed in this small local street.
The road will be designed with a flush kerb, so that road runoff will be distributed along the swale. Runoff from the allotments will also drain into the swale, via underground pipes (and some surface runoff). A buffer strip will be used along the edge of the swale. Within the swale, it is assumed that the vegetation will be turf.
Access to the allotments is preferred via at-grade crossovers. These will require a maximum batter slope for the swale of 1 in 9 (11 %).
Minor and major flood events are to be conveyed within the swale/ road corridor in accordance with local Council development guidelines (i.e. some inundation of the road is allowable). The top width of the swale is fixed (at 5.0 m) and there will be a maximum catchment area the swale can accommodate,
Page 15
beyond which an underground pipe may be required to augment the conveyance capacity of the swale and road system.
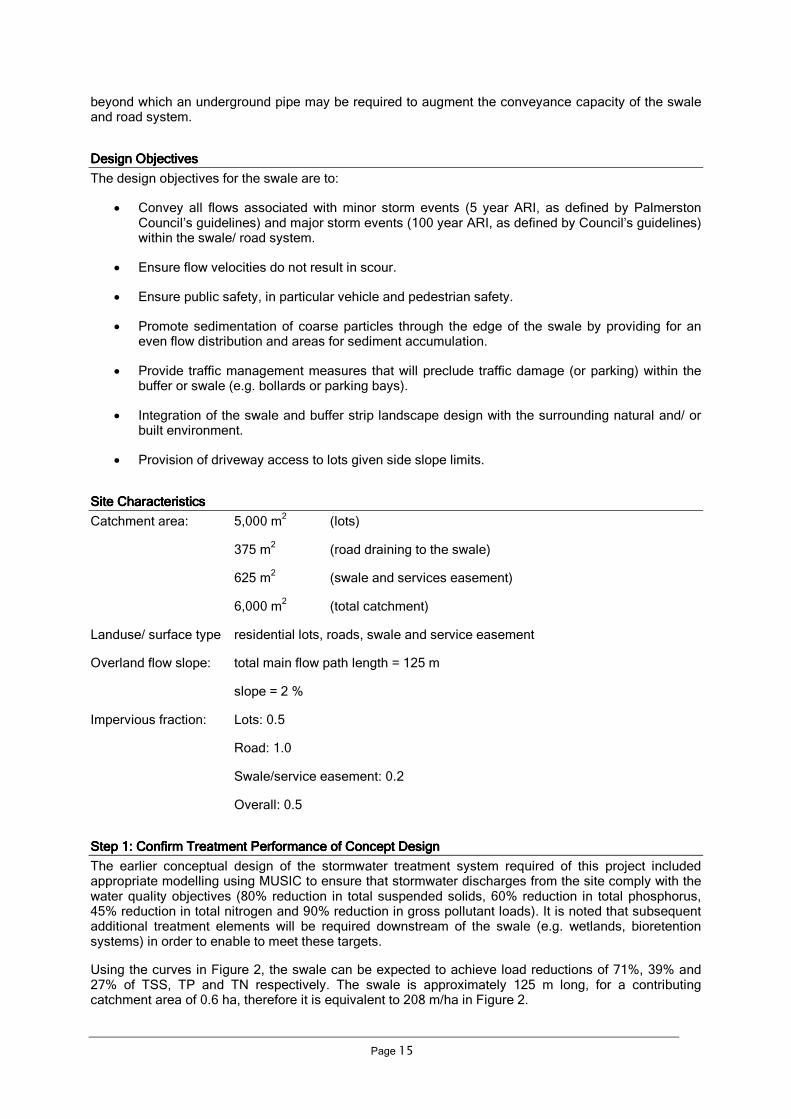
Design ObjectivesDesign ObjectivesDesign ObjectivesDesign Objectives
The design objectives for the swale are to:
• Convey all flows associated with minor storm events (5 year ARI, as defined by Palmerston Council’s guidelines) and major storm events (100 year ARI, as defined by Council’s guidelines) within the swale/ road system.
• Ensure flow velocities do not result in scour.
• Ensure public safety, in particular vehicle and pedestrian safety.
• Promote sedimentation of coarse particles through the edge of the swale by providing for an even flow distribution and areas for sediment accumulation.
• Provide traffic management measures that will preclude traffic damage (or parking) within the buffer or swale (e.g. bollards or parking bays).
• Integration of the swale and buffer strip landscape design with the surrounding natural and/ or built environment.
• Provision of driveway access to lots given side slope limits.
SSSSite Characteristicsite Characteristicsite Characteristicsite Characteristics
Catchment area: 5,000 m2 (lots)
375 m2 (road draining to the swale)
625 m2 (swale and services easement)
6,000 m2 (total catchment)
Landuse/ surface type residential lots, roads, swale and service easement
Overland flow slope: total main flow path length = 125 m
slope = 2 %
Impervious fraction: Lots: 0.5
Road: 1.0
Swale/service easement: 0.2
Overall: 0.5
Step 1: Confirm Treatment Performance of Concept DesignStep 1: Confirm Treatment Performance of Concept DesignStep 1: Confirm Treatment Performance of Concept DesignStep 1: Confirm Treatment Performance of Concept Design
The earlier conceptual design of the stormwater treatment system required of this project included appropriate modelling using MUSIC to ensure that stormwater discharges from the site comply with the water quality objectives (80% reduction in total suspended solids, 60% reduction in total phosphorus, 45% reduction in total nitrogen and 90% reduction in gross pollutant loads). It is noted that subsequent additional treatment elements will be required downstream of the swale (e.g. wetlands, bioretention systems) in order to enable to meet these targets.
Using the curves in Figure 2, the swale can be expected to achieve load reductions of 71%, 39% and 27% of TSS, TP and TN respectively. The swale is approximately 125 m long, for a contributing catchment area of 0.6 ha, therefore it is equivalent to 208 m/ha in Figure 2.
Page 16
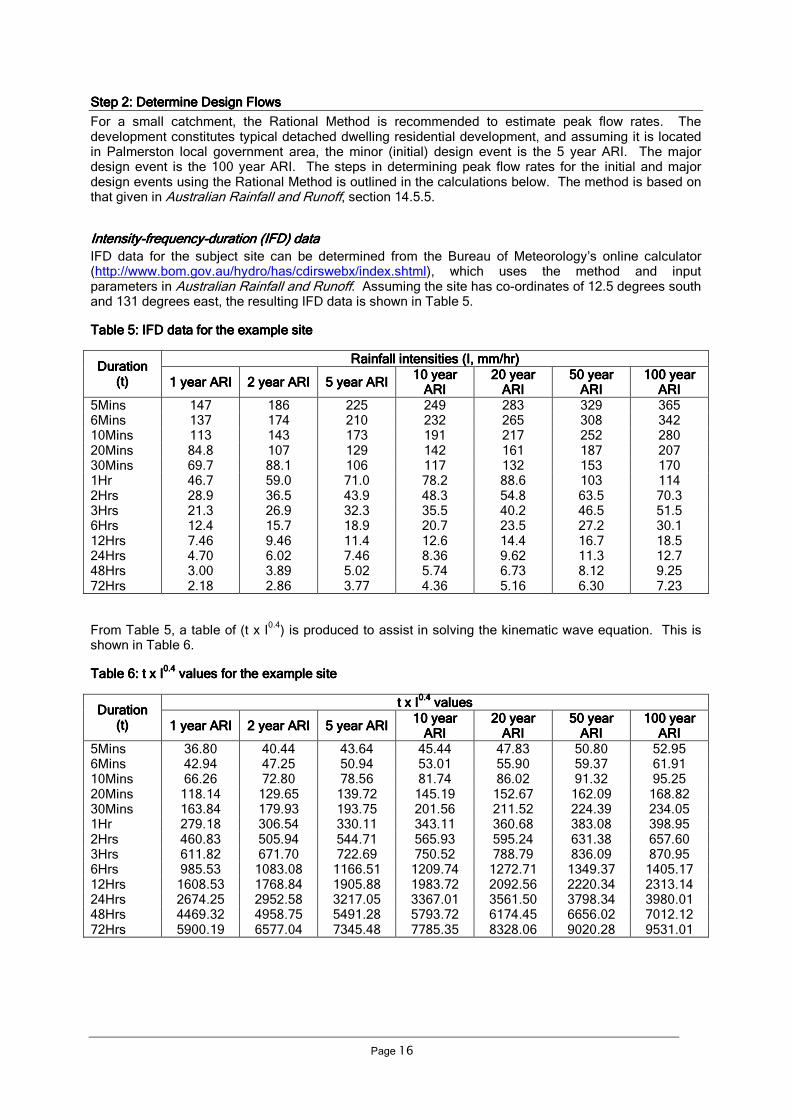
Step 2: Determine Design FlowsStep 2: Determine Design FlowsStep 2: Determine Design FlowsStep 2: Determine Design Flows
For a small catchment, the Rational Method is recommended to estimate peak flow rates. The development constitutes typical detached dwelling residential development, and assuming it is located in Palmerston local government area, the minor (initial) design event is the 5 year ARI. The major design event is the 100 year ARI. The steps in determining peak flow rates for the initial and major design events using the Rational Method is outlined in the calculations below. The method is based on that given in Australian Rainfall and Runoff, section 14.5.5.
IntensityIntensityIntensityIntensity----frequencyfrequencyfrequencyfrequency----duration (IFD) dataduration (IFD) dataduration (IFD) dataduration (IFD) data
IFD data for the subject site can be determined from the Bureau of Meteorology’s online calculator (http://www.bom.gov.au/hydro/has/cdirswebx/index.shtml), which uses the method and input parameters in Australian Rainfall and Runoff. Assuming the site has co-ordinates of 12.5 degrees south and 131 degrees east, the resulting IFD data is shown in Table 5.
Table Table Table Table 5555: IFD data for the example site: IFD data for the example site: IFD data for the example site: IFD data for the example site
Rainfall intensities (I, mm/hr)Rainfall intensities (I, mm/hr)Rainfall intensities (I, mm/hr)Rainfall intensities (I, mm/hr) Duration Duration Duration Duration
(t)(t)(t)(t) 1 year ARI1 year ARI1 year ARI1 year ARI 2 year ARI2 year ARI2 year ARI2 year ARI 5 year ARI5 year ARI5 year ARI5 year ARI 10 year 10 year 10 year 10 year
ARIARIARIARI 20 year 20 year 20 year 20 year
ARIARIARIARI 50 year 50 year 50 year 50 year
ARIARIARIARI 100 year 100 year 100 year 100 year
ARIARIARIARI 5Mins 147 186 225 249 283 329 365 6Mins 137 174 210 232 265 308 342 10Mins 113 143 173 191 217 252 280 20Mins 84.8 107 129 142 161 187 207 30Mins 69.7 88.1 106 117 132 153 170 1Hr 46.7 59.0 71.0 78.2 88.6 103 114 2Hrs 28.9 36.5 43.9 48.3 54.8 63.5 70.3 3Hrs 21.3 26.9 32.3 35.5 40.2 46.5 51.5 6Hrs 12.4 15.7 18.9 20.7 23.5 27.2 30.1 12Hrs 7.46 9.46 11.4 12.6 14.4 16.7 18.5 24Hrs 4.70 6.02 7.46 8.36 9.62 11.3 12.7 48Hrs 3.00 3.89 5.02 5.74 6.73 8.12 9.25 72Hrs 2.18 2.86 3.77 4.36 5.16 6.30 7.23
From Table 5, a table of (t x I0.4
) is produced to assist in solving the kinematic wave equation. This is shown in Table 6.
Table Table Table Table 6666: t x I: t x I: t x I: t x I0.40.40.40.4
values for the example site values for the example site values for the example site values for the example site
t x It x It x It x I0.40.40.40.4
values values values values Duration Duration Duration Duration
(t)(t)(t)(t) 1 year ARI1 year ARI1 year ARI1 year ARI 2 year ARI2 year ARI2 year ARI2 year ARI 5 year ARI5 year ARI5 year ARI5 year ARI 10 year 10 year 10 year 10 year
ARIARIARIARI 20 year 20 year 20 year 20 year
ARIARIARIARI 50 year 50 year 50 year 50 year
ARIARIARIARI 100 year 100 year 100 year 100 year
ARIARIARIARI 5Mins 36.80 40.44 43.64 45.44 47.83 50.80 52.95 6Mins 42.94 47.25 50.94 53.01 55.90 59.37 61.91 10Mins 66.26 72.80 78.56 81.74 86.02 91.32 95.25 20Mins 118.14 129.65 139.72 145.19 152.67 162.09 168.82 30Mins 163.84 179.93 193.75 201.56 211.52 224.39 234.05 1Hr 279.18 306.54 330.11 343.11 360.68 383.08 398.95 2Hrs 460.83 505.94 544.71 565.93 595.24 631.38 657.60 3Hrs 611.82 671.70 722.69 750.52 788.79 836.09 870.95 6Hrs 985.53 1083.08 1166.51 1209.74 1272.71 1349.37 1405.17 12Hrs 1608.53 1768.84 1905.88 1983.72 2092.56 2220.34 2313.14 24Hrs 2674.25 2952.58 3217.05 3367.01 3561.50 3798.34 3980.01 48Hrs 4469.32 4958.75 5491.28 5793.72 6174.45 6656.02 7012.12 72Hrs 5900.19 6577.04 7345.48 7785.35 8328.06 9020.28 9531.01
Page 17
Runoff coefficientRunoff coefficientRunoff coefficientRunoff coefficient (C) (C) (C) (C)
The 10-year ARI runoff coefficient is based on Figure 14.13 in Australian Rainfall and Runoff:
10I1 = 78.2 (Table 5), therefore C10 is based on the upper line in Figure 14.13
C10 = 0.222f +0.7 (where f = impervious fraction)
C10 = 0.81
For the 5 year and 100 year ARI runoff coefficients, frequency factors are applied as per Table 14.6 in Australian Rainfall and Runoff:
F5 = 0.95; therefore C5 = 0.77
F100 = 1.2; therefore C100 = 0.97
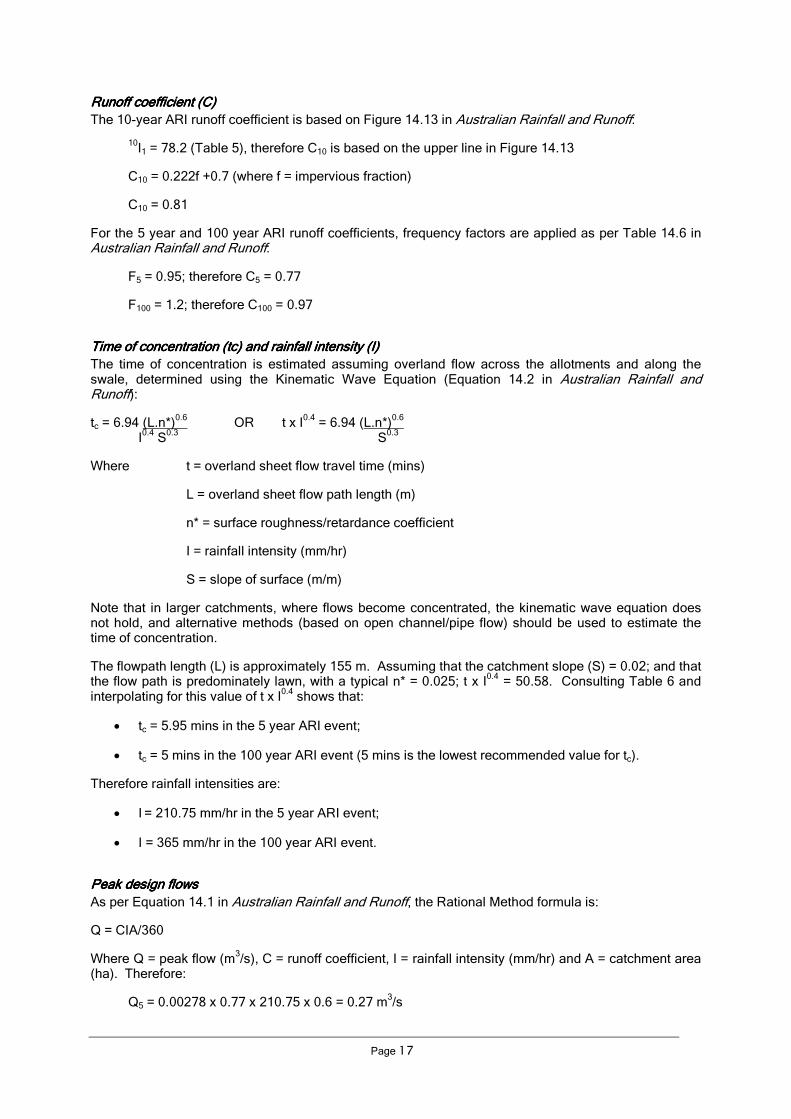
Time of concentration (tc)Time of concentration (tc)Time of concentration (tc)Time of concentration (tc) and rainfall intensity (I) and rainfall intensity (I) and rainfall intensity (I) and rainfall intensity (I)
The time of concentration is estimated assuming overland flow across the allotments and along the swale, determined using the Kinematic Wave Equation (Equation 14.2 in Australian Rainfall and Runoff):
tc = 6.94 (L.n*)0.6
OR t x I0.4
= 6.94 (L.n*)0.6
I0.4
S0.3
S0.3
Where t = overland sheet flow travel time (mins)
L = overland sheet flow path length (m)
n* = surface roughness/retardance coefficient
I = rainfall intensity (mm/hr)
S = slope of surface (m/m)
Note that in larger catchments, where flows become concentrated, the kinematic wave equation does not hold, and alternative methods (based on open channel/pipe flow) should be used to estimate the time of concentration.
The flowpath length (L) is approximately 155 m. Assuming that the catchment slope (S) = 0.02; and that the flow path is predominately lawn, with a typical n* = 0.025; t x I
0.4 = 50.58. Consulting Table 6 and
interpolating for this value of t x I0.4
shows that:
• tc = 5.95 mins in the 5 year ARI event;
• tc = 5 mins in the 100 year ARI event (5 mins is the lowest recommended value for tc).
Therefore rainfall intensities are:
• I = 210.75 mm/hr in the 5 year ARI event;
• I = 365 mm/hr in the 100 year ARI event.
Peak design flowsPeak design flowsPeak design flowsPeak design flows
As per Equation 14.1 in Australian Rainfall and Runoff, the Rational Method formula is:
Q = CIA/360
Where Q = peak flow (m3/s), C = runoff coefficient, I = rainfall intensity (mm/hr) and A = catchment area
(ha). Therefore:
Q5 = 0.00278 x 0.77 x 210.75 x 0.6 = 0.27 m3/s
Page 18
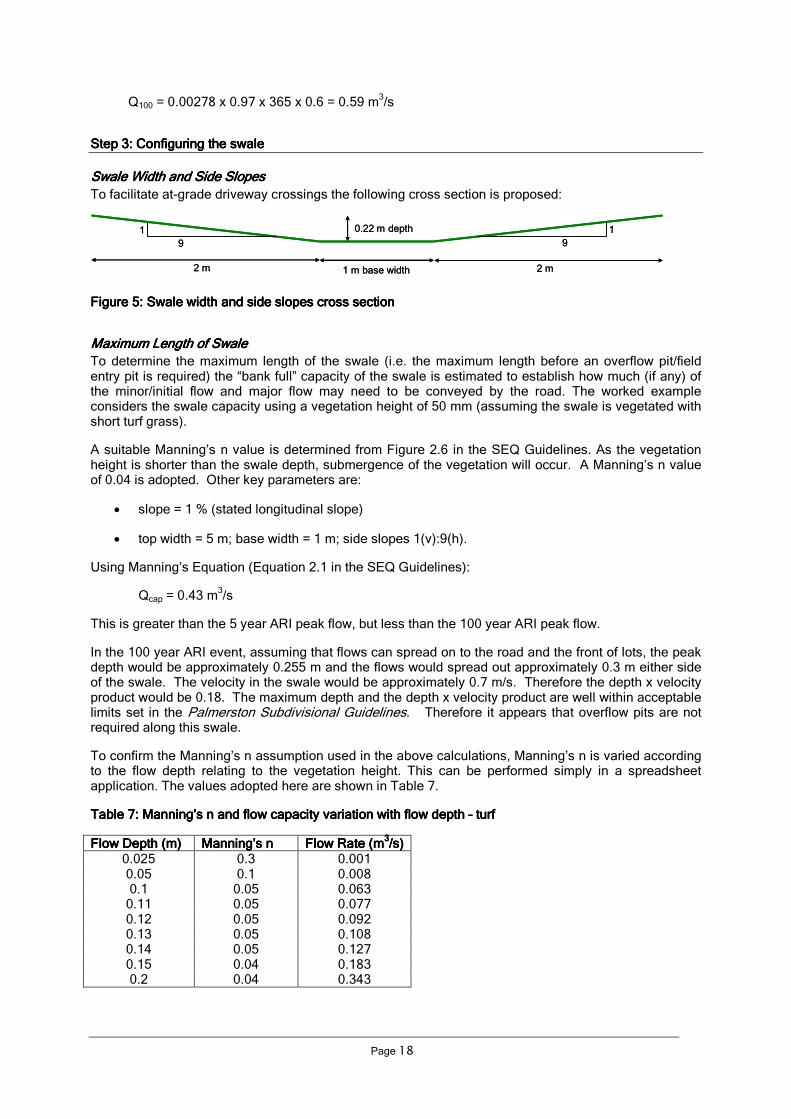
Q100 = 0.00278 x 0.97 x 365 x 0.6 = 0.59 m3/s
Step 3: Configuring the swaleStep 3: Configuring the swaleStep 3: Configuring the swaleStep 3: Configuring the swale
Swale Width and Side SlopesSwale Width and Side SlopesSwale Width and Side SlopesSwale Width and Side Slopes
To facilitate at-grade driveway crossings the following cross section is proposed:
1 m base width 2 m2 m
1
9
1
9
0.22 m depth
1 m base width 2 m2 m
1
9
1
9
0.22 m depth
Figure Figure Figure Figure 5555: Swale : Swale : Swale : Swale width width width width and and and and side slopes side slopes side slopes side slopes cross sectioncross sectioncross sectioncross section
Maximum Length of SwaleMaximum Length of SwaleMaximum Length of SwaleMaximum Length of Swale
To determine the maximum length of the swale (i.e. the maximum length before an overflow pit/field entry pit is required) the “bank full” capacity of the swale is estimated to establish how much (if any) of the minor/initial flow and major flow may need to be conveyed by the road. The worked example considers the swale capacity using a vegetation height of 50 mm (assuming the swale is vegetated with short turf grass).
A suitable Manning’s n value is determined from Figure 2.6 in the SEQ Guidelines. As the vegetation height is shorter than the swale depth, submergence of the vegetation will occur. A Manning’s n value of 0.04 is adopted. Other key parameters are:
• slope = 1 % (stated longitudinal slope)
• top width = 5 m; base width = 1 m; side slopes 1(v):9(h).
Using Manning’s Equation (Equation 2.1 in the SEQ Guidelines):
Qcap = 0.43 m3/s
This is greater than the 5 year ARI peak flow, but less than the 100 year ARI peak flow.
In the 100 year ARI event, assuming that flows can spread on to the road and the front of lots, the peak depth would be approximately 0.255 m and the flows would spread out approximately 0.3 m either side of the swale. The velocity in the swale would be approximately 0.7 m/s. Therefore the depth x velocity product would be 0.18. The maximum depth and the depth x velocity product are well within acceptable limits set in the Palmerston Subdivisional Guidelines. Therefore it appears that overflow pits are not required along this swale.
To confirm the Manning’s n assumption used in the above calculations, Manning’s n is varied according to the flow depth relating to the vegetation height. This can be performed simply in a spreadsheet application. The values adopted here are shown in Table 7.
Table Table Table Table 7777: Manning’s n and : Manning’s n and : Manning’s n and : Manning’s n and flow capacity variation flow capacity variation flow capacity variation flow capacity variation with with with with flow depth flow depth flow depth flow depth –––– turf turf turf turf
Flow Depth (m)Flow Depth (m)Flow Depth (m)Flow Depth (m) Manning’s nManning’s nManning’s nManning’s n Flow Rate (mFlow Rate (mFlow Rate (mFlow Rate (m3333/s)/s)/s)/s)
0.025 0.3 0.001 0.05 0.1 0.008 0.1 0.05 0.063
0.11 0.05 0.077 0.12 0.05 0.092 0.13 0.05 0.108 0.14 0.05 0.127 0.15 0.04 0.183 0.2 0.04 0.343
Page 19
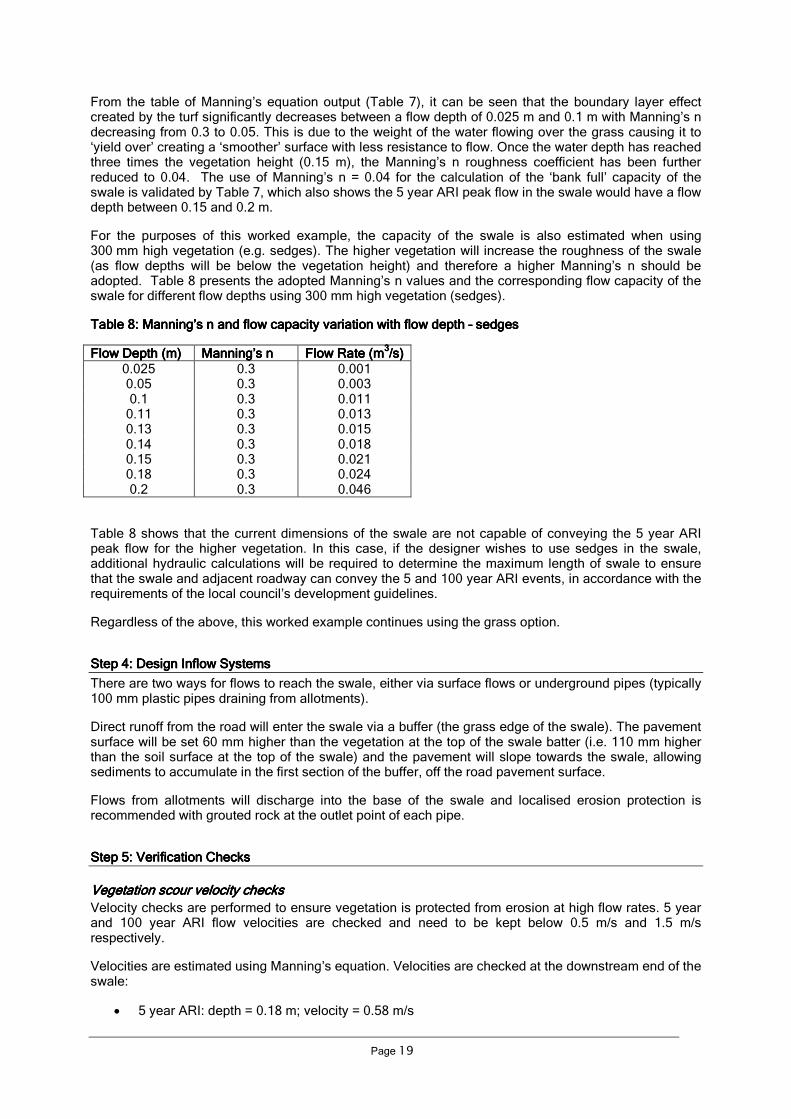
From the table of Manning’s equation output (Table 7), it can be seen that the boundary layer effect created by the turf significantly decreases between a flow depth of 0.025 m and 0.1 m with Manning’s n decreasing from 0.3 to 0.05. This is due to the weight of the water flowing over the grass causing it to ‘yield over’ creating a ‘smoother’ surface with less resistance to flow. Once the water depth has reached three times the vegetation height (0.15 m), the Manning’s n roughness coefficient has been further reduced to 0.04. The use of Manning’s n = 0.04 for the calculation of the ‘bank full’ capacity of the swale is validated by Table 7, which also shows the 5 year ARI peak flow in the swale would have a flow depth between 0.15 and 0.2 m.
For the purposes of this worked example, the capacity of the swale is also estimated when using 300 mm high vegetation (e.g. sedges). The higher vegetation will increase the roughness of the swale (as flow depths will be below the vegetation height) and therefore a higher Manning’s n should be adopted. Table 8 presents the adopted Manning’s n values and the corresponding flow capacity of the swale for different flow depths using 300 mm high vegetation (sedges).
Table Table Table Table 8888: Ma: Ma: Ma: Manning’s n and flow capacity variation with flow depth nning’s n and flow capacity variation with flow depth nning’s n and flow capacity variation with flow depth nning’s n and flow capacity variation with flow depth –––– sedges sedges sedges sedges
Flow Depth (m)Flow Depth (m)Flow Depth (m)Flow Depth (m) Manning’s nManning’s nManning’s nManning’s n Flow Rate (mFlow Rate (mFlow Rate (mFlow Rate (m3333/s)/s)/s)/s)
0.025 0.3 0.001 0.05 0.3 0.003 0.1 0.3 0.011
0.11 0.3 0.013 0.13 0.3 0.015 0.14 0.3 0.018 0.15 0.3 0.021 0.18 0.3 0.024 0.2 0.3 0.046
Table 8 shows that the current dimensions of the swale are not capable of conveying the 5 year ARI peak flow for the higher vegetation. In this case, if the designer wishes to use sedges in the swale, additional hydraulic calculations will be required to determine the maximum length of swale to ensure that the swale and adjacent roadway can convey the 5 and 100 year ARI events, in accordance with the requirements of the local council’s development guidelines.
Regardless of the above, this worked example continues using the grass option.
Step 4Step 4Step 4Step 4:::: Design Inflow Systems Design Inflow Systems Design Inflow Systems Design Inflow Systems
There are two ways for flows to reach the swale, either via surface flows or underground pipes (typically 100 mm plastic pipes draining from allotments).
Direct runoff from the road will enter the swale via a buffer (the grass edge of the swale). The pavement surface will be set 60 mm higher than the vegetation at the top of the swale batter (i.e. 110 mm higher than the soil surface at the top of the swale) and the pavement will slope towards the swale, allowing sediments to accumulate in the first section of the buffer, off the road pavement surface.
Flows from allotments will discharge into the base of the swale and localised erosion protection is recommended with grouted rock at the outlet point of each pipe.
Step 5: Verification ChecksStep 5: Verification ChecksStep 5: Verification ChecksStep 5: Verification Checks
Vegetation scour velocity checksVegetation scour velocity checksVegetation scour velocity checksVegetation scour velocity checks
Velocity checks are performed to ensure vegetation is protected from erosion at high flow rates. 5 year and 100 year ARI flow velocities are checked and need to be kept below 0.5 m/s and 1.5 m/s respectively.
Velocities are estimated using Manning’s equation. Velocities are checked at the downstream end of the swale:
• 5 year ARI: depth = 0.18 m; velocity = 0.58 m/s

Page 20
• 100 year ARI: depth = 0.255 m; velocity = 0.70 m/s
The velocity is too high in the 5 year ARI event, therefore it is recommended that the flow in the swale should be limited by introducing an overflow pit. The location of the overflow pit is estimated as follows:
• Maximum velocity in the 5 year ARI event: 0.5 m/s
• Maximum flow to maintain velocities below this level: 0.15 m3/s (calculated using Manning’s
equation)
• Maximum catchment area to contribute flows up to 0.15 m3/s in the 5 year ARI event: 3,120 m
2
(estimated using the Rational method)
• Therefore an overflow pit should be located wherever the contributing catchment reaches 3,120 m
2. This will be approximately each 65 m along this swale.
Velocity and Depth Checks Velocity and Depth Checks Velocity and Depth Checks Velocity and Depth Checks ---- Safety Safety Safety Safety
In the 100 year ARI event, calculations above without the overflow pit showed that the maximum velocity in the swale would be approximately 0.7 m/s, and the depth x velocity product would be 0.18. This is within acceptable limits. The use of an overflow pit at 65 m will reduce the maximum velocity and depth x velocity product in the 100 year ARI event as follows:
• Peak 100 year ARI flow (for 3,120 m2 catchment): 0.31 m
3/s (estimated using the Rational
Method)
• Peak depth: 0.19 m (estimated using Manning’s equation)
• Velocity: 0.60 m/s; depth x velocity = 0.11
The conditions in the 100 year ARI event are well within safe limits.
Confirm Treatment PerformanceConfirm Treatment PerformanceConfirm Treatment PerformanceConfirm Treatment Performance
The treatment performance curves for swales assume side slopes of 1 in 4, however this worked example has included side slopes of 1 in 9 in order to accommodate at-grade driveway crossings. The treatment performance curves for swales also assume a vegetation height of 0.25 m, however as shown in Step 3, the swale dimensions are not suitable for this type of vegetation, and a turf grass swale has been designed for this site. This is a significant change to the swale configuration, therefore the treatment performance should be verified in MUSIC.
MUSIC shows that the turf swale which has been designed for this site would achieve 60.5% removal of TSS, 23.8% removal of TP and 21.4% removal of TN.
Step 6: Size Overflow PitsStep 6: Size Overflow PitsStep 6: Size Overflow PitsStep 6: Size Overflow Pits
As determined in Step 3, the swale has sufficient capacity to convey the 5 year ARI event, and can also safely accommodate the 100 year ARI event, allowing some flows in the roadway and in the front of allotments. However Step 5 showed that velocities would exceed 0.5 m/s in the 5 year ARI event. Therefore overflow pits are proposed each 65 m.
The minor drainage system is a 5 year ARI system and therefore each overflow pit needs to be sized to discharge the peak 5 year ARI flow from the swale. The calculations to size the overflow pits are as follows:
• Q5 = 0.15 m3/s (maximum flow before overflow pit required)
• For free overflow conditions, use the broad-crested weir equation (Q = B * Cw * L * h3/2
), assuming a blockage factor of 0.5 and weir coefficient of 1.66. Setting h to 0.144 (the depth in the swale in the 5 year ARI event), L = 3.31 m
• A square pit with 0.9 m sides will provide a perimeter of 3.6 m, more than required
Page 21
• Check for drowned outlet conditions using the orifice equation (Qorifice = B * Cd * A * √ 2gh), assuming a blockage factor of 0.5, orifice coefficient of 0.6, and area of 0.81 m
2. As above, set
h to 0.144, and Q = 0.4 m3/s.
• The free overflow conditions are controlling and pit dimensions of 0.9 x 0.9 m are recommended.
Step 7: Traffic ControlStep 7: Traffic ControlStep 7: Traffic ControlStep 7: Traffic Control
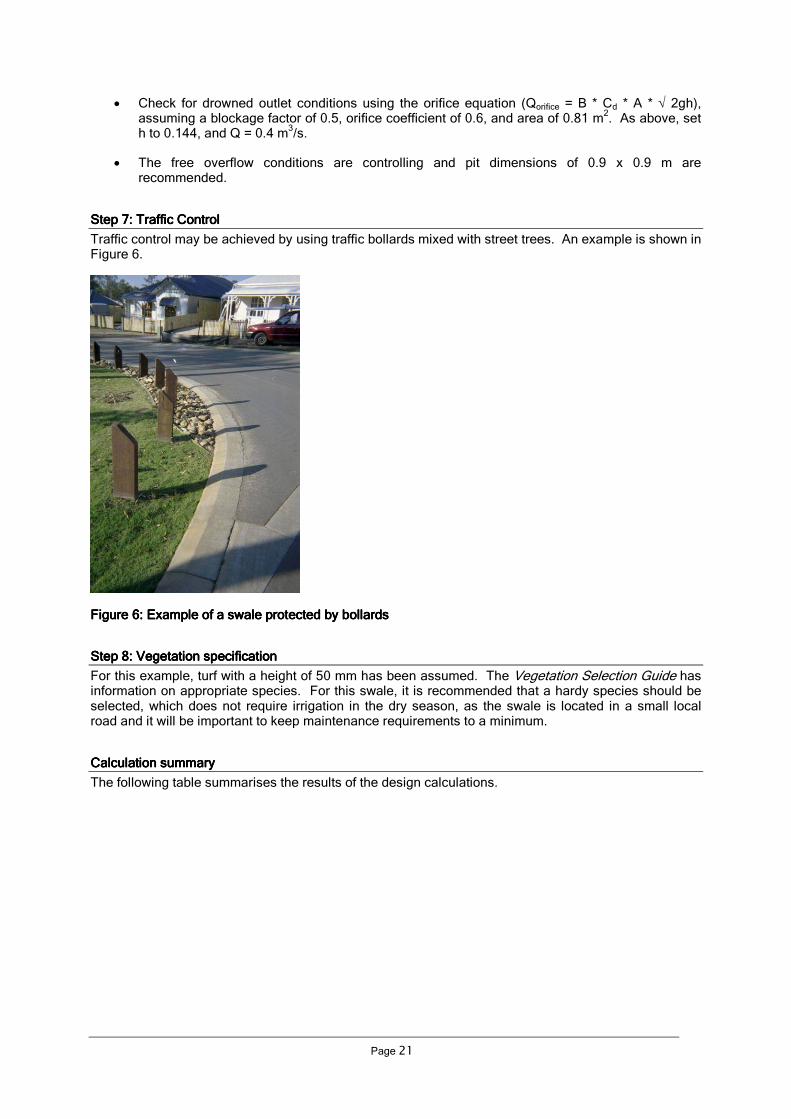
Traffic control may be achieved by using traffic bollards mixed with street trees. An example is shown in Figure 6.
Figure Figure Figure Figure 6666: Example of a swale prote: Example of a swale prote: Example of a swale prote: Example of a swale protected by bollardscted by bollardscted by bollardscted by bollards
Step 8: Vegetation specificationStep 8: Vegetation specificationStep 8: Vegetation specificationStep 8: Vegetation specification
For this example, turf with a height of 50 mm has been assumed. The Vegetation Selection Guide has information on appropriate species. For this swale, it is recommended that a hardy species should be selected, which does not require irrigation in the dry season, as the swale is located in a small local road and it will be important to keep maintenance requirements to a minimum.
Calculation summaryCalculation summaryCalculation summaryCalculation summary
The following table summarises the results of the design calculations.

Page 22
SWALES – DESIGN CALCULATION SUMMARY SHEET – DARWIN REGION CALCULATION SUMMARY
Calculation Task Outcome Check
Catchment Characteristics
Catchment Area 0.6 ha
Catchment Land Use (i.e. residential, Commercial etc.) Residential
Catchment Slope 2 %
Conceptual Design
Swale Top Width 5 m
Swale Length 125 m
Swale Location (road reserve/ park/other) Road reserve
Road Reserve Width 16 m
1 Confirm Treatment Performance of Concept Design
Swale length (m) per hectare of catchment area 208 m/ha
TSS Removal 71 %
TP Removal 39 %
TN Removal 27 %
2 Determine Design Flows
Time of concentration – refer to local Council’s Development Guidelines
Minor/Initial Storm (I1 – I10 year ARI) 5.95 minutes
Major Storm (I100 year ARI) 5 minutes
Identify Rainfall intensities
Minor/Initial Storm (I1 – I10 year ARI) 210.7 mm/hr
Major Storm (I100 year ARI) 365 mm/hr
Design Runoff Coefficient
Minor/Initial Storm (C1 – C10 year ARI) 0.77
Major Storm (C100 year ARI) 0.97
Peak Design Flows
Minor/Initial Storm (1 - 10 year ARI) 0.27 m3/s
Major Storm (100 year ARI) 0.59 m3/s
3 Dimension the Swale
Swale Width and Side Slopes
Base Width 1 m
Side Slopes – 1 in 9
Longitudinal Slope 1 %
Vegetation Height 50 mm
Maximum Length of Swale
Manning’s n 0.04
Swale Capacity 0.43 m3/s
Maximum Length of Swale 65 m
(max length determined by 5 yr velocity)
4 Design Inflow Systems
Swale Kerb Type Flush
60 mm set down to Buffer/ Swale Vegetation Yes Yes/ No
Adequate Erosion and Scour Protection (where required) At downpipe inlets
5 Verification Checks
Velocity for 1-10 year ARI flow (< 0.25 - 0.5 m/s) 0.5 m/s
Velocity for 100 year ARI flow (< 1.5 m/s) 0.6 m/s
Velocity x Depth for 100 year ARI (< 0.45 m2/s) 0.12 m
2/s
Depth of Flow over Driveway Crossing for 100 year ARI (< 0.4 m) 0.195 m
Treatment Performance consistent with Step 1 No – modelled in MUSIC
6 Size Overflow Pits (Field Inlet Pits)
System to convey minor floods (1-10 year ARI) 0.9 x 0.9 L x W

Page 23
5.2 Bioretention systems
The SEQ Guidelines cover bioretention swales in Chapter 3 and bioretention basins in Chapter 5. However in this guideline, both types of bioretention systems are discussed together in this section. The focus is on bioretention basins. The design of a bioretention swale is based on the same principles as the design of a swale and a bioretention basin, therefore a practitioner wishing to design a bioretention swale should refer to both sections 5.1 and 5.2 of this document.
5.2.1 Introduction and design considerations
In general the design of bioretention systems in the Darwin Region should follow similar principles and methodology to their design elsewhere. The SEQ Guidelines cover bioretention swales in Chapter 3 and bioretention basins in Chapter 5. In that document, the Introduction and Design Considerations are all relevant in the Darwin Region, with the following exceptions:
• The relevant scour velocity recommended in the Darwin Region is 1.5 m/s (rather than 2.0 m/s recommended in the SEQ Guidelines).
• For information on appropriate vegetation for bioretention systems in the Darwin Region, please refer to the Vegetation Selection Guide, rather than Appendix A of the SEQ Guidelines.
• Since the current version of the SEQ Guidelines was published, a detailed specification for bioretention media, including the filter media, transition layer and drainage layer, has been published by the Facility for Advancing Water Biofiltration (FAWB) at Monash University in Melbourne. The FAWB soil media specification can be downloaded from the following website: http://www.monash.edu.au/fawb. The FAWB specification should be the benchmark for bioretention media. Note that the SEQ guidelines suggest that coarse sand may sometimes be used as the drainage layer; however the FAWB specification recommends 2-5 mm gravel.
• The SEQ Guidelines note that higher rainfall intensities in SEQ relative to the southern capital cities mean that bioretention areas need to be larger to achieve the same level of stormwater treatment. Rainfall intensities are even higher in Darwin, and selection of an appropriate filter media hydraulic conductivity and extended detention depth becomes more important. As per FAWB’s filter media specifications (Rev March 2008), it is recommended that the maximum saturated hydraulic conductivity should not exceed 600 mm/hr (and preferably be between 100 - 300 mm/hr) in order to sustain vegetation growth.
• It is common practice to design bioretention systems for a lower hydraulic conductivity (e.g. k = 100 mm/hr), then specify a filter media for a higher hydraulic conductivity (e.g. k = 200 mm/hr), as hydraulic conductivity tends to reduce to some extent after the installation of a bioretention system.
• Several additional design considerations emerge in the Darwin Region, which are not relevant to SEQ. These are discussed below and include:
o Sustaining bioretention systems through the prolonged dry season
o Maintaining the performance of bioretention systems under continuous loading, in periods of prolonged wet season rainfall
o Managing high volumes of coarse sediment
o Managing interactions with groundwater, where groundwater levels can fluctuate widely between the wet and dry seasons
Dry season considerationsDry season considerationsDry season considerationsDry season considerations
During the dry season, bioretention systems could go several months without receiving runoff. Bioretention system performance is compromised by prolonged drying; research at FAWB (Zinger et al 2007) has shown that after prolonged drying, treatment performance takes several weeks to recover. Because bioretention systems use relatively sandy soils with high hydraulic conductivity, they have low

Page 24
water-holding capacity and dry out quickly. Where bioretention systems are lined, the vegetation within them may also be unable to reach deeper groundwater.
The Stormwater Treatment Options for Darwin Discussion Paper suggested several potential options to overcome this issue:
1. Allowing vegetation to senesce during the dry season. Species could be selected which naturally senesce during the dry season and recover during the wet season. Potential issues are aesthetics during the dry season, and treatment performance at the start of the wet season, before vegetation has fully recovered.
2. Irrigation of bioretention systems during the dry season. This would maintain the vegetation through the dry season, improving the aesthetics of the system and limiting the potential for erosion. The system would also be fully functional for the first storms of the wet season. Irrigation would preferably use a non-potable source of water so as to conserve mains supplies, however a potential issue is high nutrient levels in recycled wastewater. Another issue is the additional maintenance workload imposed by an irrigation system.
3. Using unlined bioretention systems, and planting trees and other deep-rooted vegetation. Such vegetation may be able to access groundwater during the dry season. Unlined systems may not be appropriate at all sites (e.g. exfiltration can be problematic adjacent to structures).
4. Using a saturated zone at the base of the bioretention system. Bioretention systems with a saturated zone are deeper than conventional bioretention systems and are designed to retain water in the lower part of the filter media, as well as the transition and drainage layers. A riser outlet controls the water level. Water in the saturated zone would support plants for longer between rainfall/irrigation events (the saturated zone is unlikely to be able to retain enough water to sustain plant growth throughout the entire dry season, and infrequent irrigation may still be required). Controlled experiments have shown that bioretention systems with a saturated zone can recover their performance much faster after prolonged dry periods (Zinger et al, 2007). If the saturated zone includes a carbon source, it is termed a “saturated anoxic zone” (SAZ) which can promote enhanced nitrogen removal via denitrification. SAZ bioretention systems are currently at an experimental stage, however the first full-scale examples are under construction.
Wet season considerationsWet season considerationsWet season considerationsWet season considerations
The performance of bioretention systems under continuous loading (as would occur during the wet season when rainfall is daily) is another potential issue. It may cause issues with the clogging of the filter media, especially due to growth of biofilms or algal mats, and a reduction in hydraulic conductivity over the season. The physical and chemical processes within bioretention systems may also be affected by continuous loading.
Rainfall analysis undertaken for the Stormwater Treatment Options for Darwin Discussion Paper showed that rainfall also predominantly occurs in sharp intense bursts, with 50% of raindays having rain falling on 5 hours or less of the 24 hours during the day. In contrast only 25% of raindays are likely to have rain for 15 to 24 hours of the day.
This pattern of rainfall will allow bioretention systems to drain in between rainfall events, and ensure that ponding only occurs temporarily after a rainfall event, at least where the upstream catchment is relatively small (large catchments may generate constant wet season baseflow). If there are concerns about continuous ponding at a particular site, a filter media with a higher hydraulic conductivity could be selected.
Coarse sediment managementCoarse sediment managementCoarse sediment managementCoarse sediment management
Bioretention design for Darwin will need to consider coarse sediment management. There is a possibility that the basins could be compromised by the first storm events when there is little vegetation cover. If the sediment load is large, there is a risk that vegetation may be smothered and depositional fans may form reducing the infiltration rate of the bioretention basin.

Page 25
Where bioretention swales are used, the swale should facilitate coarse sediment removal upstream of the bioretention system. In bioretention basins, pipe inlets can be designed to discharge into coarse sediment collection forebays. These forebays are designed:
• To remove particles that are 1 mm or greater in diameter from the 3 month ARI storm event.
• With large rocks for energy dissipation and be underlain by filter material to promote drainage following a storm event.
• With trash collection grilles.
Groundwater interactionGroundwater interactionGroundwater interactionGroundwater interaction
Groundwater levels in the Darwin Region can fluctuate widely between the wet and dry seasons. Generally bioretention systems are designed to sit above groundwater levels, however this may be hard to ensure in an environment where the groundwater table rises several metres each wet season.
Bioretention systems are often lined with an impermeable barrier to ensure water is captured in the subsurface drainage system and directed to the stormwater system or receiving environment. Where there is no risk of causing nuisance flooding downstream or damage to structures due to infiltration, the bioretention system need not be lined. A bioretention system that is not lined can promote infiltration into groundwater aquifers and may also effectively control the rise of a high unconfined shallow aquifer during the wet season. By providing a free draining sub soil drain, groundwater will be controlled by the bioretention system.
5.2.2 Design process
The same design steps should be followed in Darwin as in SEQ, however local design parameters and verification checks are provided here for the Darwin Region. In addition, some guidance is provided on designing bioretention systems with a saturated zone.
Performance curvesPerformance curvesPerformance curvesPerformance curves
The performance curves for bioretention systems in the Darwin Region are shown in Figure 7. Note that the SEQ Guidelines included three separate figures for total suspended solids, total phosphorus and total nitrogen, however in Figure 7 these are all presented on the same chart. The assumptions used to produce these performance curves were:
• 0.2 m extended detention
• 0.6 m filter depth
• 0.5 mm median particle diameter
• 100 mm/hr saturated hydraulic conductivity
• The upstream catchment is a typical residential area, with an overall impervious fraction of approximately 50%
If the bioretention system being designed differs substantially from these assumptions, or if it is part of a treatment train with upstream pre-treatment measures, then it is recommended that MUSIC be used to check the performance.

Page 26
Bioretention System Sizing Curve
0%
10%
20%
30%
40%
50%
60%
70%
80%
90%
100%
0.0% 0.5% 1.0% 1.5% 2.0% 2.5% 3.0% 3.5%
% of Catchment Area
% Removal
TSS
TP
TN
Figure Figure Figure Figure 7777: Performance curves for : Performance curves for : Performance curves for : Performance curves for bioretention systems bioretention systems bioretention systems bioretention systems in the Darwin Regionin the Darwin Regionin the Darwin Regionin the Darwin Region
Local performance curves have not been produced for bioretention swales in the Darwin Region. In order to verify treatment performance, the bioretention system curves can be used to provide a conservative estimate of system performance. These curves preclude the sediment and nutrient removal performance of the overlying swale component, however the performance of the swale component for nitrogen removal is typically only minor and thus the sizing of the bioretention component will typically be driven by achieving compliance with the load reduction target for Total Nitrogen. Therefore, by using the performance curves below the detailed designer can be confident that the combined performance of the swale and bioretention components of a bioretention swale will be similar to that shown in the curves for total Nitrogen and will exceed that shown for Total Suspended Sediment and total Phosphorus.
For a more detailed check on treatment performance, it is recommended that a MUSIC model be set up for the specific configuration being considered (or if a MUSIC model is available from the concept design stage, this could be re-run and the parameters double-checked). The recommended procedure for modelling bioretention swales is described in the Stormwater Quality Modelling Guide.
In Darwin, bioretention systems should generally be around 2.5% of their catchment area in order to meet the load reduction target for nitrogen. Pre-treatment (e.g. in a swale) may reduce this size.
Design flowsDesign flowsDesign flowsDesign flows
As per SEQ, design flows for small catchments should be calculated using the Rational Method. However the relevant minor and major design events are as follows:
• The “minor” event is termed the “initial” storm in the Darwin and Palmerston subdivision development guidelines. The design Average Recurrence Interval (ARI) ranges from 1-10 years, depending on the local government area and zoning.
• The design event for major storms in the Darwin Region is the 100 year ARI, for both local government areas and all zonings.

Page 27
Some bioretention systems may be located downstream of larger catchments (several hectares), where the Rational Method is no longer ideal for estimating design flows. If possible, runoff-routing methods (e.g. RORB, RAFTS or DRAINS modelling) should be used to estimate design flows in these situations.
Design of inflow systemsDesign of inflow systemsDesign of inflow systemsDesign of inflow systems
The SEQ Guidelines refer to QUDM in relation to street hydraulics requirements. Practitioners in Darwin should refer to the Darwin/Palmerston subdivision development guidelines for equivalent requirements. The guidelines include requirements for maximum depths and minimum road widths to be kept free of inundation in the initial storm event.
The design of the sediment forebay depends on the catchment loading rate for sediments. In the SEQ guidelines a loading rate (Lo) of 1.6 m
3/ha/year is suggested. Monitoring undertaken in the Darwin
Region (as reported by NRETAS, 2008) shows that suspended sediment loads for urban areas are approximately 930 kg/ha/wet season. Assuming a density of 1,800 kg/m
3, this is equivalent to
0.52 m3/ha/wet season. The suggested loading rate for use in the sediment forebay design is
0.6 m3/ha/year. Note that this is suitable for a developed urban catchment; bioretention systems should
be protected from higher sediment loads while development is underway within a catchment. Further information is available in the Construction, Establishment, Asset Handover and Maintenance Guide.
Filter mediaFilter mediaFilter mediaFilter media
As noted above, updated bioretention media specifications are now available. Since the current version of the SEQ Guidelines was published, a detailed specification for bioretention media, including the filter media, transition layer and drainage layer, has been published by the Facility for Advancing Water Biofiltration (FAWB) at Monash University in Melbourne. The FAWB soil media specification can be downloaded from the following website: http://www.monash.edu.au/fawb. The FAWB specification should be the benchmark for bioretention media. Note that the SEQ guidelines suggest that coarse sand may sometimes be used as the drainage layer; however the FAWB specification recommends 2-5 mm gravel.
The SEQ Guidelines suggest a minimum depth for the drainage layer of 200 mm. However 150 mm is commonly used elsewhere and is considered appropriate for the Darwin Region.
Note that fire ants are a pest which has been restricted to South East Queensland. However it is good practice to ensure clean soil, free of pests and weed seeds, is used in bioretention systems.
Design underdrain and undertake capacity checksDesign underdrain and undertake capacity checksDesign underdrain and undertake capacity checksDesign underdrain and undertake capacity checks
The procedures recommended in the SEQ Guidelines should be used to determine the total area of perforations required (and hence the total length of perforated drainage pipes), and ensure that the underdrainage system has the capacity to convey the peak flow through the filter media. These procedures typically result in a perforated pipe spacing greater than 1.5-3.0 m; 5 m spacing is recommended as a suitable maximum spacing for most situations.
Overflow pitsOverflow pitsOverflow pitsOverflow pits
Note that grated inlet pits are generally not recommended in Darwin and Palmerston’s subdivision development guidelines; however side entry pits would be impractical as overflow pits for bioretention systems, and in this case grated pits are considered an appropriate option.
Verification checksVerification checksVerification checksVerification checks
To verify a bioretention system design, the following checks are relevant in the Darwin Region:
• Vegetation scour velocity check: for minor floods, 0.5 m/s is appropriate. For major floods, the velocity should be less than 1.5 m/s (and typically less than 1.0 m/s is preferable).
Design summaryDesign summaryDesign summaryDesign summary
A Design Calculation Summary Sheet specific to the Darwin Region has been provided below.

Page 28
BIORETENTION SYSTEM DESIGN CALCULATION SUMMARY – DARWIN REGION CALCULATION SUMMARY
Calculation Task Outcome Check Catchment Characteristics Catchment area ha Catchment land use (i.e residential, commercial etc.) Storm event entering inlet yr ARI
Conceptual Design Bioretention area m
2
Filter media saturated hydraulic conductivity mm/hr Extended detention depth mm
1 Verify size for treatment Bioretention area to achieve water quality objectives Total suspended solids (Figure 7) % of catchment Total phosphorus (Figure 7) % of catchment Total nitrogen (Figure 7) % of catchment Bioretention area m
2
Extended detention depth m
2 Determine design flows Refer to relevant Darwin/Palmerston subdivision guidelines Time of concentration minutes
Identify rainfall intensities Minor/Initial Storm (I1-10 year ARI) mm/hr Major Storm (I100 year ARI) mm/hr
Design runoff coefficient Minor/Initial Storm (C1-10 year ARI) Major Storm(C100 year ARI)
Peak design flows Minor/Initial Storm (1-10 year ARI) m
3/s
Major Storm (100 year ARI) m3/s
3 Design inflow systems Adequate erosion and scour protection? Coarse Sediment Forebay Required? Volume (Vs) m
3
Area (As) m2
Depth (D) m * Check flow widths in upstream channel Minor/initial storm flow width m CHECK ADEQUATE ROAD WIIDTH IS TRAFFICABLE * Kerb opening width Kerb opening length m
4 Specify bioretention media characteristics Filter media hydraulic conductivity mm/hr Filter media depth mm Drainage and transition layers media Drainage layer (2-5 mm gravel) depth mm Transition layer (sand) depth mm 5 Under-drain design and capacity checks Flow capacity of filter media m
3/s
Perforations inflow check Pipe diameter mm Number of pipes Capacity of perforations m
3/s
CHECK PERFORATION CAPACITY > FILTER MEDIA CAPACITY Perforated pipe capacity Pipe capacity m
3/s
CHECK PIPE CAPACITY > FILTER MEDIA CAPACITY
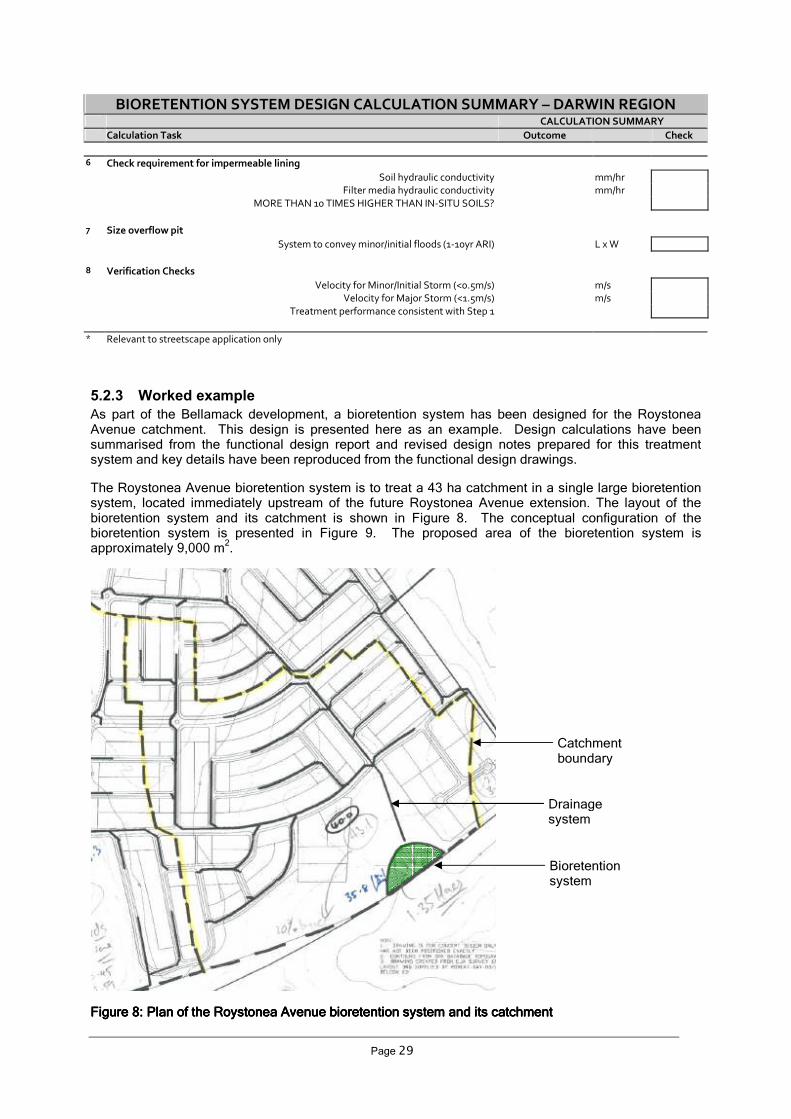
Page 29
BIORETENTION SYSTEM DESIGN CALCULATION SUMMARY – DARWIN REGION CALCULATION SUMMARY
Calculation Task Outcome Check 6 Check requirement for impermeable lining Soil hydraulic conductivity mm/hr Filter media hydraulic conductivity mm/hr MORE THAN 10 TIMES HIGHER THAN IN-SITU SOILS? 7 Size overflow pit System to convey minor/initial floods (1-10yr ARI) L x W 8 Verification Checks Velocity for Minor/Initial Storm (<0.5m/s) m/s Velocity for Major Storm (<1.5m/s) m/s Treatment performance consistent with Step 1 * Relevant to streetscape application only
5.2.3 Worked example
As part of the Bellamack development, a bioretention system has been designed for the Roystonea Avenue catchment. This design is presented here as an example. Design calculations have been summarised from the functional design report and revised design notes prepared for this treatment system and key details have been reproduced from the functional design drawings.
The Roystonea Avenue bioretention system is to treat a 43 ha catchment in a single large bioretention system, located immediately upstream of the future Roystonea Avenue extension. The layout of the bioretention system and its catchment is shown in Figure 8. The conceptual configuration of the bioretention system is presented in Figure 9. The proposed area of the bioretention system is approximately 9,000 m
2.
Figure Figure Figure Figure 8888: Plan of t: Plan of t: Plan of t: Plan of the Roystonea Avenue bioretention system and its catchmenthe Roystonea Avenue bioretention system and its catchmenthe Roystonea Avenue bioretention system and its catchmenthe Roystonea Avenue bioretention system and its catchment
Bioretention system
Catchment boundary
Drainage system
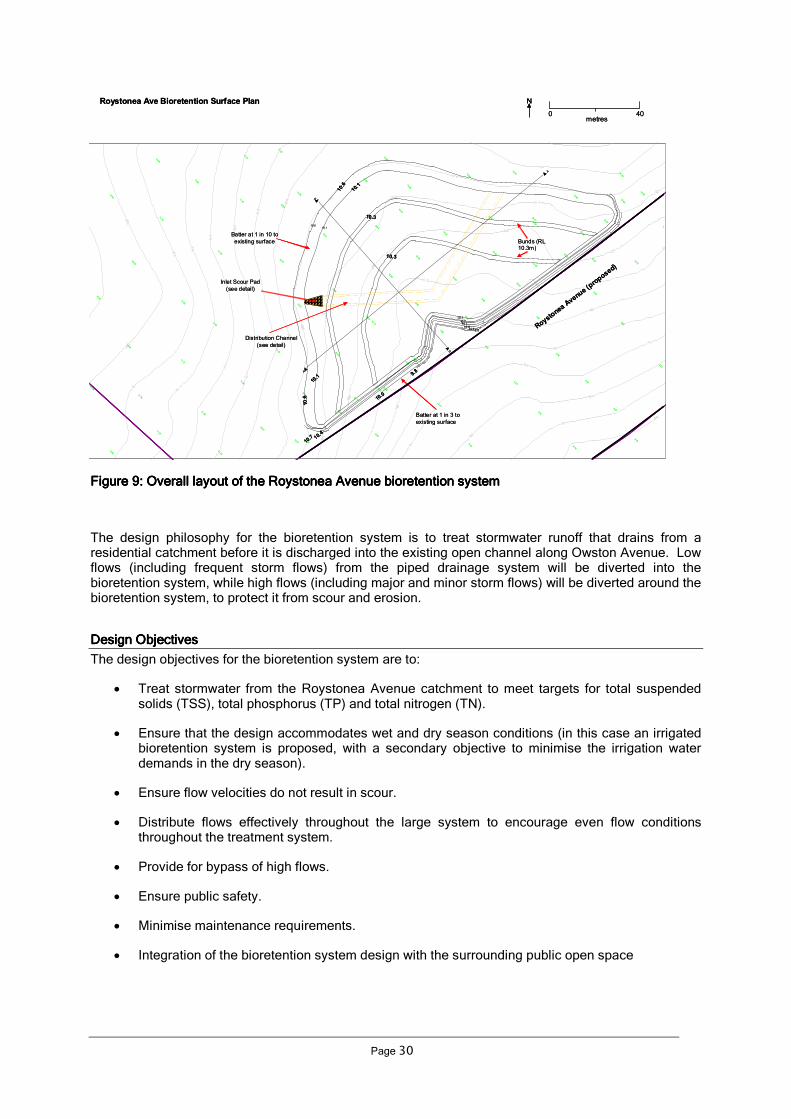
Page 30
10.15
10.22
10.48
10.37
10.30
9.22
8.79
9.07
9.95
10.13
9.63
9.91
10.05
9.85
9.62
9.58
9.389.23
9.15
8.79
9.41
9.19
9.93
9.99
10.17
9.98
10.66
10.93
10.83
10.66
10.60
10.36
10.10
10.23
10.58
10.02
10.37
10.78
10.22
11.06
10.20
10.64
10.15
10.10
9.66
9.96
9.90
10.05
9.86
10.06
10.13
10.64
10.09
10.33
10.56
10.44
10.49
11.02
10.38
10.51
10.76
10.84
10.75
10.57
10.29
10.77
10.97
10.56
10.33
11.03
11.18
11.22
11.35
11.95
11.63
11.23
11.75
11.26
11.38
12.02
11.76
11.77
11.23
11.56
11.69
12.09
11.79
11.85
12.06
12.04
12.23
12.00
10.7
10.1
10.010.7
10.4
10.1
9.8
10.6
A
A
B
B
Batter at 1 in 10 to
existing surface
Inlet Scour Pad
(see detail)
Distribution Channel
(see detail)
Roystonea Ave Bioretention Surface Plan
Bunds (RL 10.3m)
0 40metres
N
Batter at 1 in 3 to
existing surface
10.3
10.3
10.1
10.6
9.8
10.0
10.4
10.6
10.1
RoystoneaAvenue (proposed)
10.7
10.15
10.22
10.48
10.37
10.30
9.22
8.79
9.07
9.95
10.13
9.63
9.91
10.05
9.85
9.62
9.58
9.389.23
9.15
8.79
9.41
9.19
9.93
9.99
10.17
9.98
10.66
10.93
10.83
10.66
10.60
10.36
10.10
10.23
10.58
10.02
10.37
10.78
10.22
11.06
10.20
10.64
10.15
10.10
9.66
9.96
9.90
10.05
9.86
10.06
10.13
10.64
10.09
10.33
10.56
10.44
10.49
11.02
10.38
10.51
10.76
10.84
10.75
10.57
10.29
10.77
10.97
10.56
10.33
11.03
11.18
11.22
11.35
11.95
11.63
11.23
11.75
11.26
11.38
12.02
11.76
11.77
11.23
11.56
11.69
12.09
11.79
11.85
12.06
12.04
12.23
12.00
10.7
10.1
10.010.7
10.4
10.1
9.8
10.6
A
A
B
B
Batter at 1 in 10 to
existing surface
Inlet Scour Pad
(see detail)
Distribution Channel
(see detail)
Roystonea Ave Bioretention Surface Plan
Bunds (RL 10.3m)
0 40metres
NN
Batter at 1 in 3 to
existing surface
10.3
10.3
10.1
10.6
9.8
10.0
10.4
10.6
10.1
RoystoneaAvenue (proposed)
10.7
Figure Figure Figure Figure 9999: : : : Overall layout of the Roystonea Avenue bioretention systemOverall layout of the Roystonea Avenue bioretention systemOverall layout of the Roystonea Avenue bioretention systemOverall layout of the Roystonea Avenue bioretention system
The design philosophy for the bioretention system is to treat stormwater runoff that drains from a residential catchment before it is discharged into the existing open channel along Owston Avenue. Low flows (including frequent storm flows) from the piped drainage system will be diverted into the bioretention system, while high flows (including major and minor storm flows) will be diverted around the bioretention system, to protect it from scour and erosion.
Design ObjectivesDesign ObjectivesDesign ObjectivesDesign Objectives
The design objectives for the bioretention system are to:
• Treat stormwater from the Roystonea Avenue catchment to meet targets for total suspended solids (TSS), total phosphorus (TP) and total nitrogen (TN).
• Ensure that the design accommodates wet and dry season conditions (in this case an irrigated bioretention system is proposed, with a secondary objective to minimise the irrigation water demands in the dry season).
• Ensure flow velocities do not result in scour.
• Distribute flows effectively throughout the large system to encourage even flow conditions throughout the treatment system.
• Provide for bypass of high flows.
• Ensure public safety.
• Minimise maintenance requirements.
• Integration of the bioretention system design with the surrounding public open space
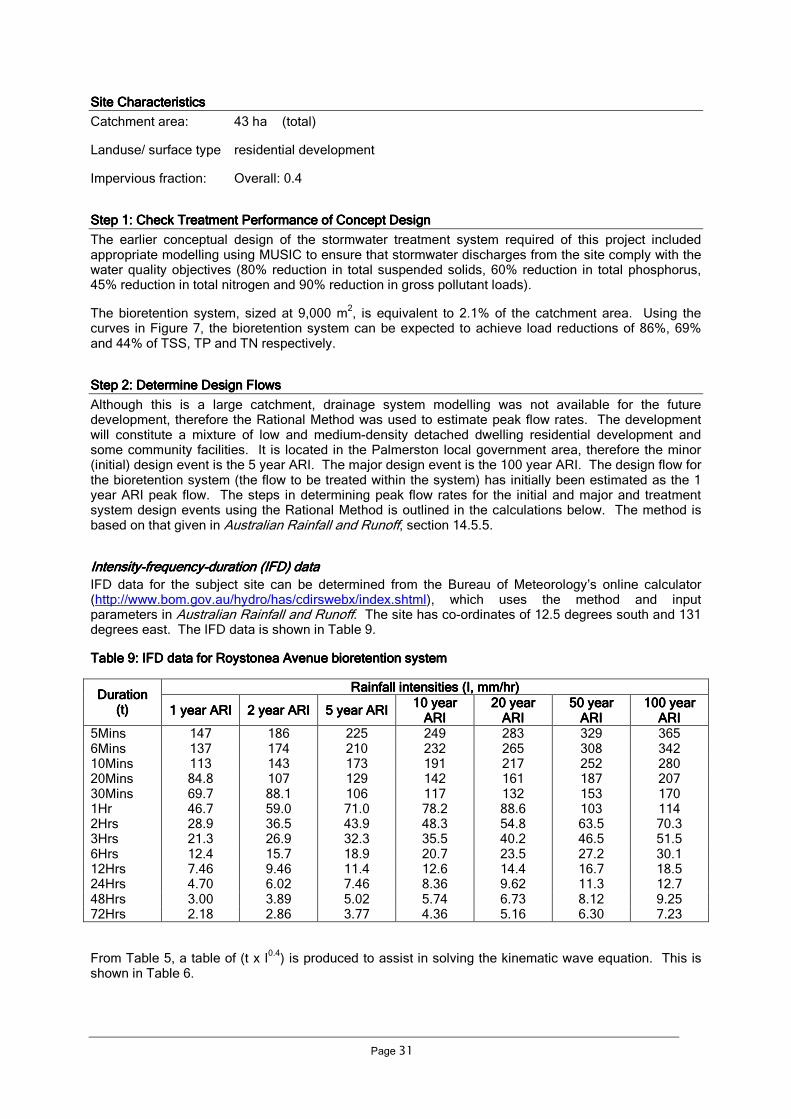
Page 31
Site CharacteristicsSite CharacteristicsSite CharacteristicsSite Characteristics
Catchment area: 43 ha (total)
Landuse/ surface type residential development
Impervious fraction: Overall: 0.4
Step 1: Step 1: Step 1: Step 1: CheckCheckCheckCheck Treatment Performance of Concept Design Treatment Performance of Concept Design Treatment Performance of Concept Design Treatment Performance of Concept Design
The earlier conceptual design of the stormwater treatment system required of this project included appropriate modelling using MUSIC to ensure that stormwater discharges from the site comply with the water quality objectives (80% reduction in total suspended solids, 60% reduction in total phosphorus, 45% reduction in total nitrogen and 90% reduction in gross pollutant loads).
The bioretention system, sized at 9,000 m2, is equivalent to 2.1% of the catchment area. Using the
curves in Figure 7, the bioretention system can be expected to achieve load reductions of 86%, 69% and 44% of TSS, TP and TN respectively.
Step 2: Determine Design FlowsStep 2: Determine Design FlowsStep 2: Determine Design FlowsStep 2: Determine Design Flows
Although this is a large catchment, drainage system modelling was not available for the future development, therefore the Rational Method was used to estimate peak flow rates. The development will constitute a mixture of low and medium-density detached dwelling residential development and some community facilities. It is located in the Palmerston local government area, therefore the minor (initial) design event is the 5 year ARI. The major design event is the 100 year ARI. The design flow for the bioretention system (the flow to be treated within the system) has initially been estimated as the 1 year ARI peak flow. The steps in determining peak flow rates for the initial and major and treatment system design events using the Rational Method is outlined in the calculations below. The method is based on that given in Australian Rainfall and Runoff, section 14.5.5.
IntensityIntensityIntensityIntensity----frequencyfrequencyfrequencyfrequency----duration (IFD) dataduration (IFD) dataduration (IFD) dataduration (IFD) data
IFD data for the subject site can be determined from the Bureau of Meteorology’s online calculator (http://www.bom.gov.au/hydro/has/cdirswebx/index.shtml), which uses the method and input parameters in Australian Rainfall and Runoff. The site has co-ordinates of 12.5 degrees south and 131 degrees east. The IFD data is shown in Table 9.
Table Table Table Table 9999: IFD data for : IFD data for : IFD data for : IFD data for Roystonea Avenue bioretention systemRoystonea Avenue bioretention systemRoystonea Avenue bioretention systemRoystonea Avenue bioretention system
Rainfall intensities (I, mm/hr)Rainfall intensities (I, mm/hr)Rainfall intensities (I, mm/hr)Rainfall intensities (I, mm/hr) Duration Duration Duration Duration
(t)(t)(t)(t) 1 year ARI1 year ARI1 year ARI1 year ARI 2 year ARI2 year ARI2 year ARI2 year ARI 5 year ARI5 year ARI5 year ARI5 year ARI 10 year 10 year 10 year 10 year
ARIARIARIARI 20 year 20 year 20 year 20 year
ARIARIARIARI 50 year 50 year 50 year 50 year
ARIARIARIARI 100 year 100 year 100 year 100 year
ARIARIARIARI 5Mins 147 186 225 249 283 329 365 6Mins 137 174 210 232 265 308 342 10Mins 113 143 173 191 217 252 280 20Mins 84.8 107 129 142 161 187 207 30Mins 69.7 88.1 106 117 132 153 170 1Hr 46.7 59.0 71.0 78.2 88.6 103 114 2Hrs 28.9 36.5 43.9 48.3 54.8 63.5 70.3 3Hrs 21.3 26.9 32.3 35.5 40.2 46.5 51.5 6Hrs 12.4 15.7 18.9 20.7 23.5 27.2 30.1 12Hrs 7.46 9.46 11.4 12.6 14.4 16.7 18.5 24Hrs 4.70 6.02 7.46 8.36 9.62 11.3 12.7 48Hrs 3.00 3.89 5.02 5.74 6.73 8.12 9.25 72Hrs 2.18 2.86 3.77 4.36 5.16 6.30 7.23
From Table 5, a table of (t x I0.4
) is produced to assist in solving the kinematic wave equation. This is shown in Table 6.

Page 32
Table Table Table Table 10101010: t x I: t x I: t x I: t x I0.40.40.40.4
values for values for values for values for Roystonea Avenue bioretentRoystonea Avenue bioretentRoystonea Avenue bioretentRoystonea Avenue bioretention systemion systemion systemion system
t x It x It x It x I0.40.40.40.4
values values values values Duration Duration Duration Duration
(t)(t)(t)(t) 1 year ARI1 year ARI1 year ARI1 year ARI 2 year ARI2 year ARI2 year ARI2 year ARI 5 year ARI5 year ARI5 year ARI5 year ARI 10 year 10 year 10 year 10 year
ARIARIARIARI 20 year 20 year 20 year 20 year
ARIARIARIARI 50 year 50 year 50 year 50 year
ARIARIARIARI 100 year 100 year 100 year 100 year
ARIARIARIARI 5Mins 36.80 40.44 43.64 45.44 47.83 50.80 52.95 6Mins 42.94 47.25 50.94 53.01 55.90 59.37 61.91 10Mins 66.26 72.80 78.56 81.74 86.02 91.32 95.25 20Mins 118.14 129.65 139.72 145.19 152.67 162.09 168.82 30Mins 163.84 179.93 193.75 201.56 211.52 224.39 234.05 1Hr 279.18 306.54 330.11 343.11 360.68 383.08 398.95 2Hrs 460.83 505.94 544.71 565.93 595.24 631.38 657.60 3Hrs 611.82 671.70 722.69 750.52 788.79 836.09 870.95 6Hrs 985.53 1083.08 1166.51 1209.74 1272.71 1349.37 1405.17 12Hrs 1608.53 1768.84 1905.88 1983.72 2092.56 2220.34 2313.14 24Hrs 2674.25 2952.58 3217.05 3367.01 3561.50 3798.34 3980.01 48Hrs 4469.32 4958.75 5491.28 5793.72 6174.45 6656.02 7012.12 72Hrs 5900.19 6577.04 7345.48 7785.35 8328.06 9020.28 9531.01
Runoff coefficient (C)Runoff coefficient (C)Runoff coefficient (C)Runoff coefficient (C)
The 10-year ARI runoff coefficient is based on Figure 14.13 in Australian Rainfall and Runoff:
10I1 = 78.2 (Table 5), therefore C10 is based on the upper line in Figure 14.13
C10 = 0.222f +0.7 (where f = impervious fraction)
C10 = 0.79
For the 1 year, 5 year and 100 year ARI runoff coefficients, frequency factors are applied as per Table 14.6 in Australian Rainfall and Runoff:
F1 = 0.8; therefore C1 = 0.63
F5 = 0.95; therefore C5 = 0.75
F100 = 1.2; therefore C100 = 0.95
Time of concentration (tc) and rainfall intensity (I)Time of concentration (tc) and rainfall intensity (I)Time of concentration (tc) and rainfall intensity (I)Time of concentration (tc) and rainfall intensity (I)
The time of concentration was estimated assuming overland flow across the allotments to the street, followed by gutter/pipe flow from the street to the treatment system.
The overland flow component is determined using the Kinematic Wave Equation (Equation 14.2 in Australian Rainfall and Runoff):
tc = 6.94 (L.n*)0.6
OR t x I0.4
= 6.94 (L.n*)0.6
I0.4
S0.3
S0.3
Where t = overland sheet flow travel time (mins)
L = overland sheet flow path length (m)
n* = surface roughness/retardance coefficient
I = rainfall intensity (mm/hr)
S = slope of surface (m/m)
The overland flowpath length (L) is approximately 30 m. The catchment slope (S) has been estimated at 0.01; and the flow path is predominately lawn, with a typical n* = 0.025. Therefore t x I
0.4 = 23.25.
Consulting Table 6 and interpolating for this value of t x I0.4
shows that the time of concentration will be
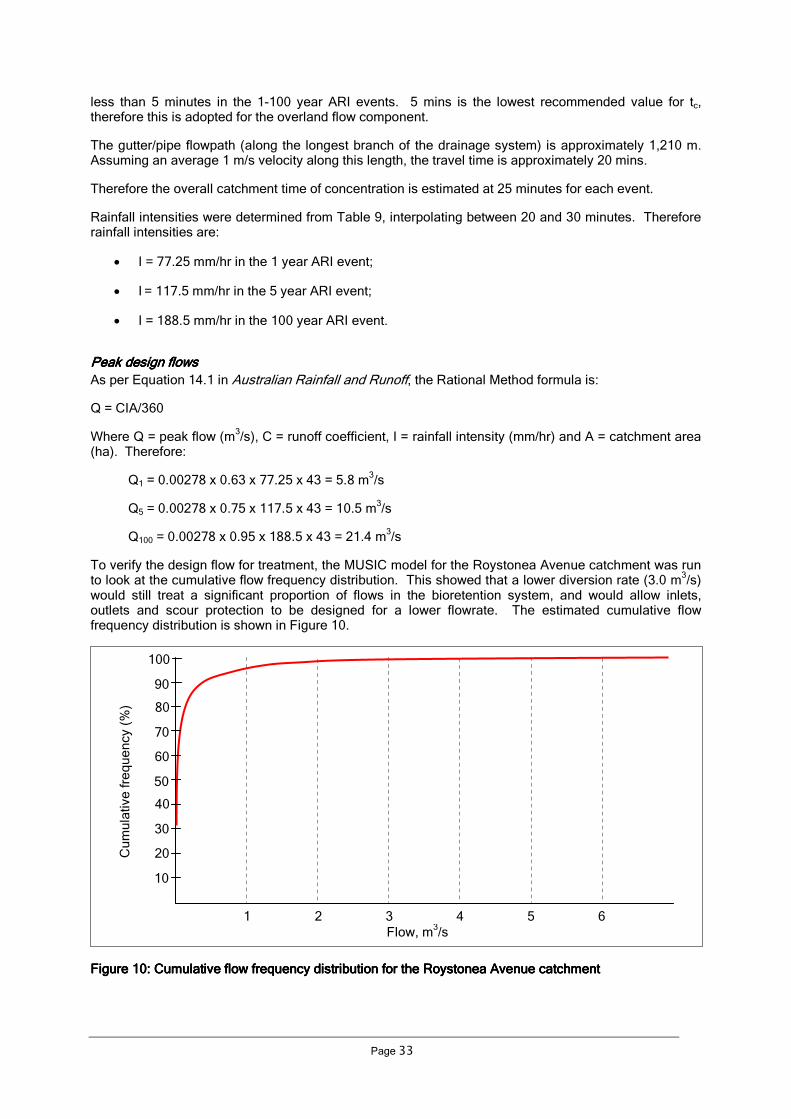
Page 33
less than 5 minutes in the 1-100 year ARI events. 5 mins is the lowest recommended value for tc, therefore this is adopted for the overland flow component.
The gutter/pipe flowpath (along the longest branch of the drainage system) is approximately 1,210 m. Assuming an average 1 m/s velocity along this length, the travel time is approximately 20 mins.
Therefore the overall catchment time of concentration is estimated at 25 minutes for each event.
Rainfall intensities were determined from Table 9, interpolating between 20 and 30 minutes. Therefore rainfall intensities are:
• I = 77.25 mm/hr in the 1 year ARI event;
• I = 117.5 mm/hr in the 5 year ARI event;
• I = 188.5 mm/hr in the 100 year ARI event.
Peak design flowsPeak design flowsPeak design flowsPeak design flows
As per Equation 14.1 in Australian Rainfall and Runoff, the Rational Method formula is:
Q = CIA/360
Where Q = peak flow (m3/s), C = runoff coefficient, I = rainfall intensity (mm/hr) and A = catchment area
(ha). Therefore:
Q1 = 0.00278 x 0.63 x 77.25 x 43 = 5.8 m3/s
Q5 = 0.00278 x 0.75 x 117.5 x 43 = 10.5 m3/s
Q100 = 0.00278 x 0.95 x 188.5 x 43 = 21.4 m3/s
To verify the design flow for treatment, the MUSIC model for the Roystonea Avenue catchment was run to look at the cumulative flow frequency distribution. This showed that a lower diversion rate (3.0 m
3/s)
would still treat a significant proportion of flows in the bioretention system, and would allow inlets, outlets and scour protection to be designed for a lower flowrate. The estimated cumulative flow frequency distribution is shown in Figure 10.
Figure Figure Figure Figure 10101010: Cumulative flow frequency distribution for the Roystonea Avenue catchment: Cumulative flow frequency distribution for the Roystonea Avenue catchment: Cumulative flow frequency distribution for the Roystonea Avenue catchment: Cumulative flow frequency distribution for the Roystonea Avenue catchment
Flow, m3/s
1 2 3 4 5 6
10
20
30
40
50
60
70
80
90
100
Cu
mu
lative
fre
qu
en
cy (
%)

Page 34
Step 3:Step 3:Step 3:Step 3: Design Inflow SystemsDesign Inflow SystemsDesign Inflow SystemsDesign Inflow Systems
Flows will enter the bioretention system via a low flow diversion pipe upstream of the system. The inlet system needs to be designed to allow flows up to 3.0 m
3/s into the system, while higher flows bypass.
A gross pollutant trap (GPT) has been proposed upstream of the bioretention system, to act as both the flow diversion mechanism and to capture gross pollutants and coarse sediments before they enter the system. Flows through the GPT will be limited to the treatable flowrate of the GPT.
Inlet Scour ProtectionInlet Scour ProtectionInlet Scour ProtectionInlet Scour Protection
A standard culvert software program has been used to determine the maximum velocity discharging from the stormwater pipe. The maximum outlet velocity has been determined to be approximately 3.65 m/s. A scour pad is required at the outlet due to the reasonably high outlet velocities. A hydraulic design guide was consulted for the scour pad design. It was estimated that the scour pad will require carefully placed rocks with a d50 greater than 300 mm and a length of 8 m spanning from 2 m wide at the inlet of the pipe to 6 m wide at the outlet of the scour pad into the main distribution channel running through the centre of the bioretention system.
Distribution channelDistribution channelDistribution channelDistribution channel
A distribution channel has been designed to spread flows from the inlet throughout the bioretention system, to encourage even treatment of stormwater throughout the system. The channel is not required to convey the full 3 m
3/s; its main purpose is to distribute the majority of flows along the length of the
bioretention system. Stormwater will need to pond in the distribution channel before it can exit the channel into the bioretention system. The distribution channel was sized using Manning’s equation, to convey at least 1 m
3/s. Its proposed dimensions are:
• Trapezoidal in shape with a 4 m base and 1 in 3 batter slopes
• Laid at a 0.25% slope from the edge (IL 9.8m) into the centre of the bioretention system (IL 9.65 m) and -0.25% slope from the centre to the opposite side of the bioretention system (IL 9.8 m).
• 0.3 m deep at the inlet of the scour pad and 0.45 m deep at the centre of the bioretention system
• 6 m wide at the edge and 6.2m wide at the centre of the bioretention system.
Based on the characteristics above, and a Manning’s n of 0.025, Manning’s equation predicts for a flow depth 0.3 m, a minimum discharge of 1.2 m
3/s at a velocity of 0.82 m/s. The distribution channel should
be gravel lined (d50 > 20mm) and vegetated to protect it from scour and erosion and so that it blends into the landscape. It should be underlain with filter media so that after a rainfall event, water in the channel drains away through the filter.
Coarse Sediment ForebayCoarse Sediment ForebayCoarse Sediment ForebayCoarse Sediment Forebay
A coarse sediment forebay has not been designed for this bioretention system, as a GPT is proposed upstream to capture gross pollutants and coarse sediment. Not all GPTs are effective in capturing coarse sediment; however an appropriate unit has been selected for this site.
Step 4: Step 4: Step 4: Step 4: Specify the Bioretention Filter Media CharacteristicsSpecify the Bioretention Filter Media CharacteristicsSpecify the Bioretention Filter Media CharacteristicsSpecify the Bioretention Filter Media Characteristics
FAWB’s bioretention media specification will be followed for the filter media, transition layer and drainage layer. The filter media will be a sandy loam with a hydraulic conductivity of approximately 100 mm/hr and an effective particle diameter of 0.3 to 0.5 mm.
A typical cross section of the bioretention system will be:
• 600 mm of a specially selected filter media (RL 10.1 m) underlain by
• 100mm of a coarsely graded sand (RL 9.4 m) of 0.5 mm to 1.0 mm underlain by
• 150mm of a drainage layer consisting of coarsely graded gravel (2mm to 5mm) (RL 9.25 m) which is laid with a series of 150 mm slotted drainage pipes
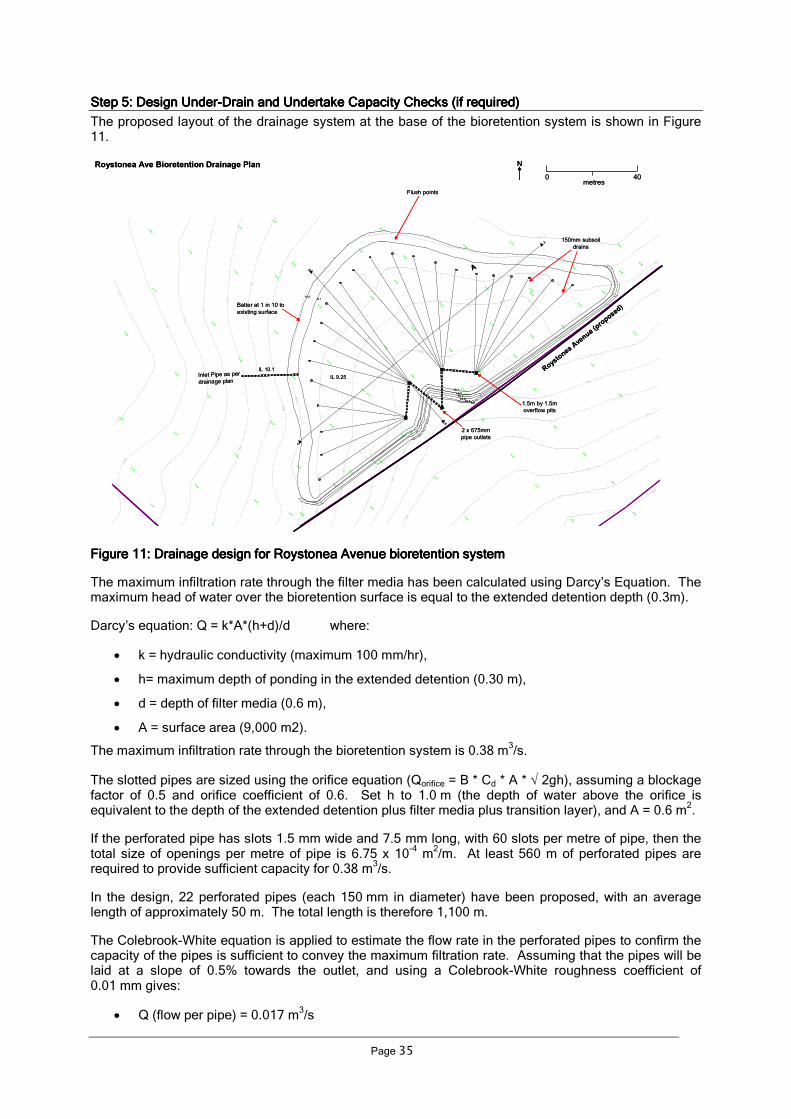
Page 35
Step 5: Step 5: Step 5: Step 5: Design UnderDesign UnderDesign UnderDesign Under----Drain and Undertake Capacity Checks (if required)Drain and Undertake Capacity Checks (if required)Drain and Undertake Capacity Checks (if required)Drain and Undertake Capacity Checks (if required)
The proposed layout of the drainage system at the base of the bioretention system is shown in Figure 11.
10.22
10.48
10.37
10.30
9.22
8.79
9.07
9.95
10.13
9.63
9.91
10.05
9.85
9.62
9.58
9.389.23
9.15
8.79
9.41
9.19
9.93
9.99
10.17
9.98
10.66
10.83
10.60
10.36
10.10
10.23
10.58
10.02
10.37
10.78
10.22
10.20
10.64
10.15
10.10
9.66
9.96
9.90
10.05
9.86
10.06
10.13
10.64
10.09
10.33
10.56
10.44
10.49
11.02
10.38
10.51
10.76
10.84
10.75
10.57
10.29
10.77
10.97
10.56
10.33
11.03
11.18
11.22
11.35
11.95
11.63
11.23
11.75
11.26
11.38
12.02
11.76
11.77
11.23
11.56
11.69
12.09
11.79
10.7
10.1
10.010.7
10.4
10.1
9.8
10.6
A
A
B
B
Batter at 1 in 10 to
existing surface
A
2 x 675mm
pipe outlets
150mm subsoil
drains
Roystonea Ave Bioretention Drainage Plan
1.5m by 1.5m
overflow pits
Flush points
N
IL 10.1Inlet Pipe as per
drainage planIL 9.25
RoystoneaAvenue (proposed)
0 40metres
10.22
10.48
10.37
10.30
9.22
8.79
9.07
9.95
10.13
9.63
9.91
10.05
9.85
9.62
9.58
9.389.23
9.15
8.79
9.41
9.19
9.93
9.99
10.17
9.98
10.66
10.83
10.60
10.36
10.10
10.23
10.58
10.02
10.37
10.78
10.22
10.20
10.64
10.15
10.10
9.66
9.96
9.90
10.05
9.86
10.06
10.13
10.64
10.09
10.33
10.56
10.44
10.49
11.02
10.38
10.51
10.76
10.84
10.75
10.57
10.29
10.77
10.97
10.56
10.33
11.03
11.18
11.22
11.35
11.95
11.63
11.23
11.75
11.26
11.38
12.02
11.76
11.77
11.23
11.56
11.69
12.09
11.79
10.7
10.1
10.010.7
10.4
10.1
9.8
10.6
A
A
B
B
Batter at 1 in 10 to
existing surface
A
2 x 675mm
pipe outlets
150mm subsoil
drains
Roystonea Ave Bioretention Drainage Plan
1.5m by 1.5m
overflow pits
Flush points
NN
IL 10.1Inlet Pipe as per
drainage planIL 9.25
RoystoneaAvenue (proposed)
0 40metres
Figure Figure Figure Figure 11111111: Drainage design for Roystonea Avenue bioretention system: Drainage design for Roystonea Avenue bioretention system: Drainage design for Roystonea Avenue bioretention system: Drainage design for Roystonea Avenue bioretention system
The maximum infiltration rate through the filter media has been calculated using Darcy’s Equation. The maximum head of water over the bioretention surface is equal to the extended detention depth (0.3m).
Darcy’s equation: Q = k*A*(h+d)/d where:
• k = hydraulic conductivity (maximum 100 mm/hr),
• h= maximum depth of ponding in the extended detention (0.30 m),
• d = depth of filter media (0.6 m),
• A = surface area (9,000 m2).
The maximum infiltration rate through the bioretention system is 0.38 m3/s.
The slotted pipes are sized using the orifice equation (Qorifice = B * Cd * A * √ 2gh), assuming a blockage factor of 0.5 and orifice coefficient of 0.6. Set h to 1.0 m (the depth of water above the orifice is equivalent to the depth of the extended detention plus filter media plus transition layer), and A = 0.6 m
2.
If the perforated pipe has slots 1.5 mm wide and 7.5 mm long, with 60 slots per metre of pipe, then the total size of openings per metre of pipe is 6.75 x 10
-4 m
2/m. At least 560 m of perforated pipes are
required to provide sufficient capacity for 0.38 m3/s.
In the design, 22 perforated pipes (each 150 mm in diameter) have been proposed, with an average length of approximately 50 m. The total length is therefore 1,100 m.
The Colebrook-White equation is applied to estimate the flow rate in the perforated pipes to confirm the capacity of the pipes is sufficient to convey the maximum filtration rate. Assuming that the pipes will be laid at a slope of 0.5% towards the outlet, and using a Colebrook-White roughness coefficient of 0.01 mm gives:
• Q (flow per pipe) = 0.017 m3/s

Page 36
• Then Q (total) = 0.38 m3/s (for 22 pipes), which is the same as the maximum infiltration rate
through the bioretention system.
Step Step Step Step 6666: : : : Check Requirement for Impermeable LiningCheck Requirement for Impermeable LiningCheck Requirement for Impermeable LiningCheck Requirement for Impermeable Lining
Although the permeability of the surrounding soils is not known, it is not proposed to line the bioretention system. The treated stormwater will contribute to recharging the local groundwater during the early wet. The drainage within the bioretention system will be free draining ensuring that the majority of the treated stormwater will be collected in the drainage pipes.
Groundwater levels are not known in the vicinity of the bioretention system. Due to its proximity to the existing drainage path it is likely that groundwater levels are close to the current drainage invert of approximately 9m AHD. There is some chance that the bioretention system will intercept the local groundwater levels. However the consequences of this are considered low risk as the bioretention drainage levels are not significantly different from the invert of the free drainage path that currently exists.
Step 7: Size OveStep 7: Size OveStep 7: Size OveStep 7: Size Overflow Pitrflow Pitrflow Pitrflow Pit
To allow flows from the Roystonea Ave bioretention system to discharge back into the existing stormwater system when the bioretention system is full (i.e. extended detention is fully engaged) a series of overflow pits will be constructed with the crest at the same level as the top of extended detention (RL 10.4 m).
The overflow system must be able to pass the peak design flow entering the system (i.e. 3 m3/s). The
outlet has been sized such that the maximum height of water over the riser crest is 300 mm. Two scenarios are checked:
• For drowned outlet conditions, use the orifice equation (Qorifice = B * Cd * A * √ 2gh), assuming a blockage factor of 0.5 and orifice coefficient of 0.6. Set h to 0.3 (the maximum depth of ponding in the extended detention), and A = 4.1 m
2.
• For free overflow conditions, use the broad-crested weir equation (Q = B * Cw * L * h3/2
), assuming a blockage factor (B) of 0.5 and weir coefficient (Cw) of 1.66. Setting h to 0.3 (the maximum depth of ponding in the extended detention), L = 22.0 m
A series of four 1.5 m square overflow pits are recommended. These pits will provide an area of 9 m2
and an overflow weir length of 24 m.
Blockage of the overflow pit is one of risk factors in any overflow design. Blockage can occur from leaf litter or rubbish depositing on the grated inlet. The risk of blockage is managed by providing:
• Design of the overflow pit so that if the top of the overflow pit blocks the pit can still function as an overflow weir. A combined overflow weir pit and orifice is less prone to blockage
• A conservative blockage factor of 50%
• Separate pits
• Placement of the overflow pits at a significant distance from the inlet point
Step 8: Specify Vegetation Step 8: Specify Vegetation Step 8: Specify Vegetation Step 8: Specify Vegetation and Irrigation Systemand Irrigation Systemand Irrigation Systemand Irrigation System
The Vegetation Selection Guide has information on appropriate species for bioretention systems.
The vegetation will require irrigation during the dry season to ensure that it is sufficiently robust at the end of the dry season that the surface of the media is not compromised by the first few events at the beginning of the wet season. If the vegetation is not robust enough to maintain the surface of the system then it is possible that erosion and scour of the surface could occur as well as clogging of the surface due to deposition of sediment on the surface of the bioretention system and subsequent loss of permeability.
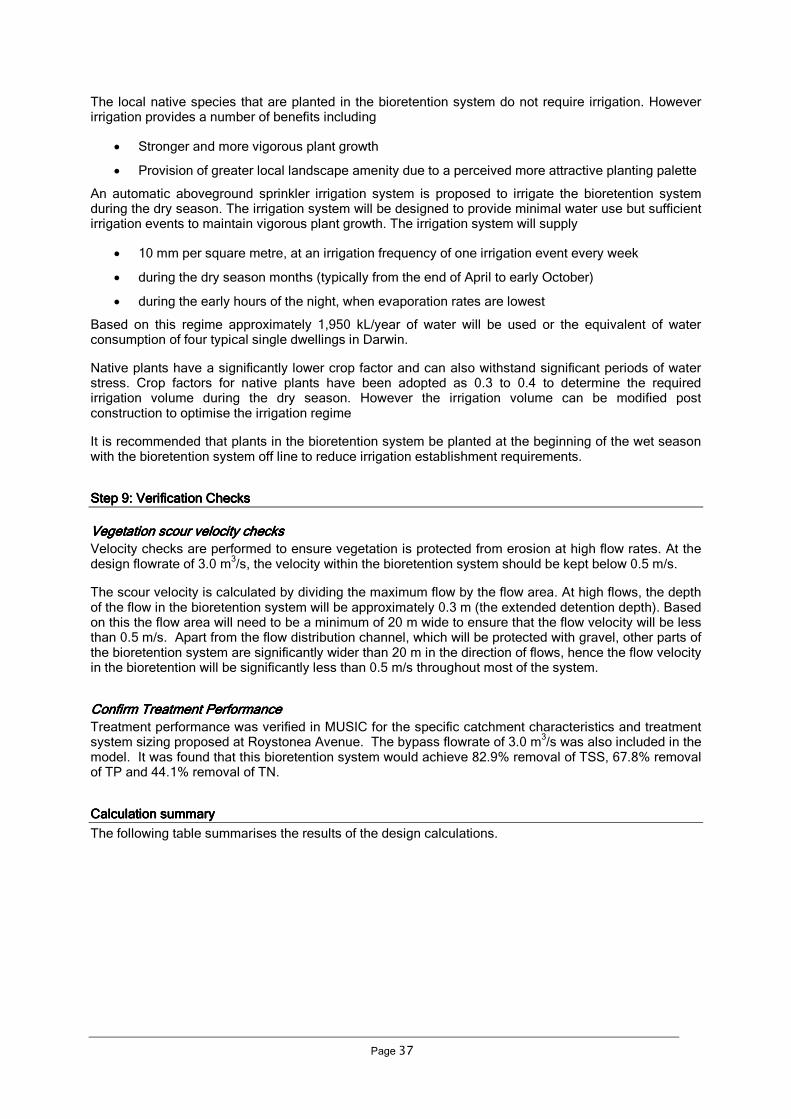
Page 37
The local native species that are planted in the bioretention system do not require irrigation. However irrigation provides a number of benefits including
• Stronger and more vigorous plant growth
• Provision of greater local landscape amenity due to a perceived more attractive planting palette
An automatic aboveground sprinkler irrigation system is proposed to irrigate the bioretention system during the dry season. The irrigation system will be designed to provide minimal water use but sufficient irrigation events to maintain vigorous plant growth. The irrigation system will supply
• 10 mm per square metre, at an irrigation frequency of one irrigation event every week
• during the dry season months (typically from the end of April to early October)
• during the early hours of the night, when evaporation rates are lowest
Based on this regime approximately 1,950 kL/year of water will be used or the equivalent of water consumption of four typical single dwellings in Darwin.
Native plants have a significantly lower crop factor and can also withstand significant periods of water stress. Crop factors for native plants have been adopted as 0.3 to 0.4 to determine the required irrigation volume during the dry season. However the irrigation volume can be modified post construction to optimise the irrigation regime
It is recommended that plants in the bioretention system be planted at the beginning of the wet season with the bioretention system off line to reduce irrigation establishment requirements.
Step 9: Step 9: Step 9: Step 9: Verification ChecksVerification ChecksVerification ChecksVerification Checks
Vegetation scour velocity checksVegetation scour velocity checksVegetation scour velocity checksVegetation scour velocity checks
Velocity checks are performed to ensure vegetation is protected from erosion at high flow rates. At the design flowrate of 3.0 m
3/s, the velocity within the bioretention system should be kept below 0.5 m/s.
The scour velocity is calculated by dividing the maximum flow by the flow area. At high flows, the depth of the flow in the bioretention system will be approximately 0.3 m (the extended detention depth). Based on this the flow area will need to be a minimum of 20 m wide to ensure that the flow velocity will be less than 0.5 m/s. Apart from the flow distribution channel, which will be protected with gravel, other parts of the bioretention system are significantly wider than 20 m in the direction of flows, hence the flow velocity in the bioretention will be significantly less than 0.5 m/s throughout most of the system.
Confirm Treatment PerformanceConfirm Treatment PerformanceConfirm Treatment PerformanceConfirm Treatment Performance
Treatment performance was verified in MUSIC for the specific catchment characteristics and treatment system sizing proposed at Roystonea Avenue. The bypass flowrate of 3.0 m
3/s was also included in the
model. It was found that this bioretention system would achieve 82.9% removal of TSS, 67.8% removal of TP and 44.1% removal of TN.
Calculation summaryCalculation summaryCalculation summaryCalculation summary
The following table summarises the results of the design calculations.

Page 38
BIORETENTION SYSTEM DESIGN CALCULATION SUMMARY – DARWIN REGION CALCULATION SUMMARY
Calculation Task Outcome Check Catchment Characteristics Catchment area 43 ha Catchment land use (i.e residential, commercial etc.) Residential Storm event entering inlet 5 yr ARI
(minor storm will enter GPT) Conceptual Design Bioretention area 9,000 m
2
Filter media saturated hydraulic conductivity 100 mm/hr Extended detention depth 300 mm
1 Verify size for treatment Bioretention area to achieve water quality objectives Total suspended solids (Figure 7) 1.5 % of catchment Total phosphorus (Figure 7) 1.25 % of catchment Total nitrogen (Figure 7) 2.25 % of catchment Bioretention area 9,000 m
2
Extended detention depth 0.3 m
2 Determine design flows Refer to relevant Darwin/Palmerston subdivision guidelines Time of concentration 25 minutes
Identify rainfall intensities Minor/Initial Storm (I1-10 year ARI) 117.5 (5 year ARI) mm/hr Major Storm (I100 year ARI) 188.5 mm/hr
Design runoff coefficient Minor/Initial Storm (C1-10 year ARI) 0.75 (5 year ARI) Major Storm(C100 year ARI) 0.95
Peak design flows Minor/Initial Storm (1-10 year ARI) 10.5 (5 year ARI) m
3/s
Major Storm (100 year ARI) 21.4 m3/s
(3.0 m3/s selected as design flow
3 Design inflow systems Adequate erosion and scour protection? Scour pad included Coarse Sediment Forebay Required? GPT instead Volume (Vs) N/A m
3
Area (As) N/A m2
Depth (D) N/A m * Check flow widths in upstream channel Minor/initial storm flow width N/A m CHECK ADEQUATE ROAD WIIDTH IS TRAFFICABLE N/A * Kerb opening width Kerb opening length N/A m
4 Specify bioretention media characteristics Filter media hydraulic conductivity 100 mm/hr Filter media depth 600 mm Drainage and transition layers media Drainage layer (2-5 mm gravel) depth 150 mm Transition layer (sand) depth 100 mm 5 Under-drain design and capacity checks Flow capacity of filter media 0.38 m
3/s
Perforations inflow check Pipe diameter 150 mm Number of pipes 22 Capacity of perforations 0.74 m
3/s
CHECK PERFORATION CAPACITY > FILTER MEDIA CAPACITY OK Perforated pipe capacity Pipe capacity 0.38 m
3/s
CHECK PIPE CAPACITY > FILTER MEDIA CAPACITY OK

Page 39
BIORETENTION SYSTEM DESIGN CALCULATION SUMMARY – DARWIN REGION CALCULATION SUMMARY
Calculation Task Outcome Check 6 Check requirement for impermeable lining Soil hydraulic conductivity Unknown mm/hr Filter media hydraulic conductivity 100 mm/hr MORE THAN 10 TIMES HIGHER THAN IN-SITU SOILS? N/A (no liner proposed to encourage infiltration) 7 Size overflow pit System to convey minor/initial floods (1-10yr ARI) Four x 1.5 x 1.5 L x W (for design flow of 3.0 m
3/s)
8 Verification Checks Velocity for Minor/Initial Storm (<0.5m/s) <0.5 m/s Velocity for Major Storm (<1.5m/s) <0.5 m/s Treatment performance consistent with Step 1 Yes * Relevant to streetscape application only

Page 40
5.3 Sedimentation basins
5.3.1 Introduction and design considerations
In general the design of sedimentation basins in the Darwin Region should follow similar principles and methodology to their design elsewhere. The SEQ Guidelines cover sedimentation basins in Chapter 4. In that document, the Introduction and Design Considerations are all relevant in the Darwin Region, with the following exceptions:
• In the SEQ Guidelines, the suggested cleanout frequency for a sedimentation basin is 5 years. In Darwin, it is recommended that sedimentation basins should be emptied of water and the sediment cleaned out each year at the end of the wet season, so that they then remain dry throughout the dry season. If water is retained in a sediment basin at the end of the wet season, there is a risk that it will encourage mosquito breeding. It could also lead to algal blooms or unpleasant odours.
• For information on appropriate vegetation for sedimentation basins in the Darwin Region, please refer to the Vegetation Selection Guide, rather than Appendix A of the SEQ Guidelines. The Vegetation Selection Guide does not include a specific section on vegetation for sedimentation basins, but appropriate species would be the same as those proposed for the upper and lower batter slopes of wetlands.
In addition, some of the terminology in the SEQ Guidelines has been modified in the Darwin Region context:
• In Darwin the “permanent pool water level” is referred to as the “normal wet season water level”, as this water level will only be “permanent” through the wet season.
• A “typical minimum dry season water level” may be relevant in some designs.
5.3.2 Design process
The same design steps should be followed in Darwin as in SEQ, however local performance curves, design parameters and verification checks are provided here for the Darwin Region.
Design flowsDesign flowsDesign flowsDesign flows
In Darwin wet season storm events generate high peak flows and designing sedimentation basins to deliver the 1 year ARI peak flow to downstream treatment systems may result in very large inlet and outlet structures, and potentially high velocities within the downstream systems. It is suggested that a flow frequency analysis be undertaken for the upstream catchment (e.g. this can be undertaken in MUSIC) to choose an appropriate design flowrate. A design flow should be chosen to maximise the hydrologic effectiveness of treatment systems (i.e. maximise the proportion of flows treated), but avoid excessively sized inlet and outlet structures.
A typical flow frequency curve is shown in Figure 19. Typically the design flow should be selected where 95-99% of all flows will be treated.
Page 41
Figure Figure Figure Figure 12121212: Example flow frequency distribution curve: Example flow frequency distribution curve: Example flow frequency distribution curve: Example flow frequency distribution curve
As per SEQ, “above design” flows for sedimentation basins in small catchments should be calculated using the Rational Method. However the relevant minor and major design events are as follows:
• The “minor” event is termed the “initial” storm in the Darwin and Palmerston subdivision development guidelines. The design Average Recurrence Interval (ARI) ranges from 1-10 years, depending on the local government area and zoning.
• The design event for major storms in the Darwin Region is the 100 year ARI, for both local government areas and all zonings.
Treatment PerformanceTreatment PerformanceTreatment PerformanceTreatment Performance
Note that the sediment basin performance curves (Figure 4-3 in the SEQ Guidelines) are suitable across all locations.
Size and Dimensions of Sediment BasinSize and Dimensions of Sediment BasinSize and Dimensions of Sediment BasinSize and Dimensions of Sediment Basin
Generally the advice on sizing and dimensioning a sediment basin is all relevant in the Darwin Region. However as noted above, in Darwin it is recommended that sedimentation basins should be emptied of water and the sediment cleaned out each year at the end of the wet season, so that they then remain dry throughout the dry season. If water is retained in a sediment basin at the end of the wet season, there is a risk that it will encourage mosquito breeding. It could also lead to algal blooms or unpleasant odours.
The check for volume of accumulated sediments depends on the catchment loading rate for sediments. In the SEQ guidelines a loading rate (Lo) of 1.6 m
3/ha/year is suggested. Monitoring undertaken in the
Darwin Region (as reported by NRETAS, 2008) shows that suspended sediment loads for urban areas are approximately 930 kg/ha/wet season. Assuming a density of 1,800 kg/m
3, this is equivalent to
0.52 m3/ha/wet season. The suggested loading rate for use in estimating the volume of accumulated
sediments is 0.6 m3/ha/year. Note that this is suitable for a developed urban catchment; much higher
sediment loads can be expected from the construction stage. Construction-stage sediment basins are subject to different design parameters.
Safety is an important consideration for sediment basin edge treatment, however in the Darwin Region there is no equivalent of the Brisbane City Council “Sediment Basin Design, Construction and Maintenance Guidelines”. Important safety considerations and typical responses are outlined in Section 6.1 of this document.
Pro
po
rtio
n o
f ru
no
ff (
%)
95
90
85
80
75
70
65
60
55
50
100
Peak flows
Suitable design flow

Page 42
Overflow pitsOverflow pitsOverflow pitsOverflow pits
Note that grated inlet pits are generally not recommended in Darwin and Palmerston’s subdivision development guidelines; however side entry pits would be impractical as overflow pits for sedimentation basins, and in this case grated pits are considered an appropriate option.
Plant speciesPlant speciesPlant speciesPlant species
For information on appropriate vegetation for sedimentation basins in the Darwin Region, please refer to the Vegetation Selection Guide. This does not include a separate section for sedimentation basins, however the plant species listed for wetland batter slopes are also suitable for sedimentation basins.
Design summaryDesign summaryDesign summaryDesign summary
A Design Calculation Summary Sheet specific to the Darwin Region has been provided below.

Page 43
SEDIMENTATION BASIN DESIGN CALCULATION SUMMARY – DARWIN REGION CALCULATION SUMMARY
Calculation Task Outcome Check
Catchment Characteristics
Area Ha
Catchment land use (i.e residential, commercial etc.)
Storm event entering inlet pond (initial or major) yr ARI
Conceptual Design
Notional permanent pool depth m
Wet season water level of sedimentation basin m AHD
1 Determine design flows
Peak design flows
'Design operation flow' m3/s
'Above design flow' m3/s
2 Confirm Treatment Performance of Concept Design
Capture efficiency (of 125 µm sediment) %
Minimum area of sedimentation basin m2
3 Confirm size and dimension of sedimentation basin
Aspect ratio L:W
Hydraulic efficiency (λ)
Turbulence parameter (n)
Depth of permanent pool m
Area of sedimentation basin m2
Storage volume for sediments
Sedimentation basin storage Volume Vs m3
Desired sediment cleanout frequency years
Volume of accumulated sediment between cleanouts m3
Sufficient capacity for stored sediment ?
Internal batters
Edge batter slope V:H
4 Design inflow systems
Provision of scour protection or energy dissipation
5 Design outlet structures
Design of 'control' outlet - overflow pit and pipe outlet configuration
Overflow pit crest level m AHD
Overflow pit dimension L x W
Provision of debris trap
Connection pipe dimension mm diam
Connection pipe invert level m AHD
Design of 'control' outlet - weir configuration
Weir crest level m AHD
Weir length m
Design of 'spillway' outlet - weir configuration
Weir crest level m AHD
Weir length m
Depth above spillway m
Freeboard to top of embankment m
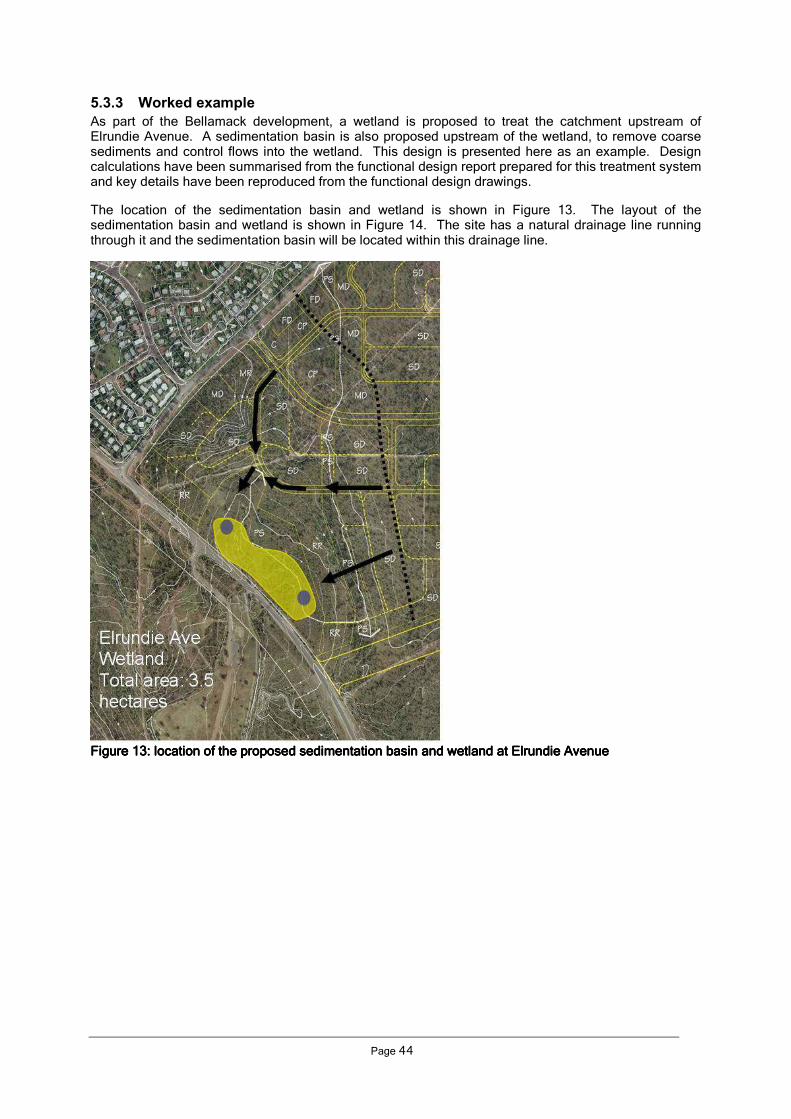
Page 44
5.3.3 Worked example
As part of the Bellamack development, a wetland is proposed to treat the catchment upstream of Elrundie Avenue. A sedimentation basin is also proposed upstream of the wetland, to remove coarse sediments and control flows into the wetland. This design is presented here as an example. Design calculations have been summarised from the functional design report prepared for this treatment system and key details have been reproduced from the functional design drawings.
The location of the sedimentation basin and wetland is shown in Figure 13. The layout of the sedimentation basin and wetland is shown in Figure 14. The site has a natural drainage line running through it and the sedimentation basin will be located within this drainage line.
Figure Figure Figure Figure 13131313: location of the proposed sedimentation basin and wetland at Elrundie Avenue: location of the proposed sedimentation basin and wetland at Elrundie Avenue: location of the proposed sedimentation basin and wetland at Elrundie Avenue: location of the proposed sedimentation basin and wetland at Elrundie Avenue
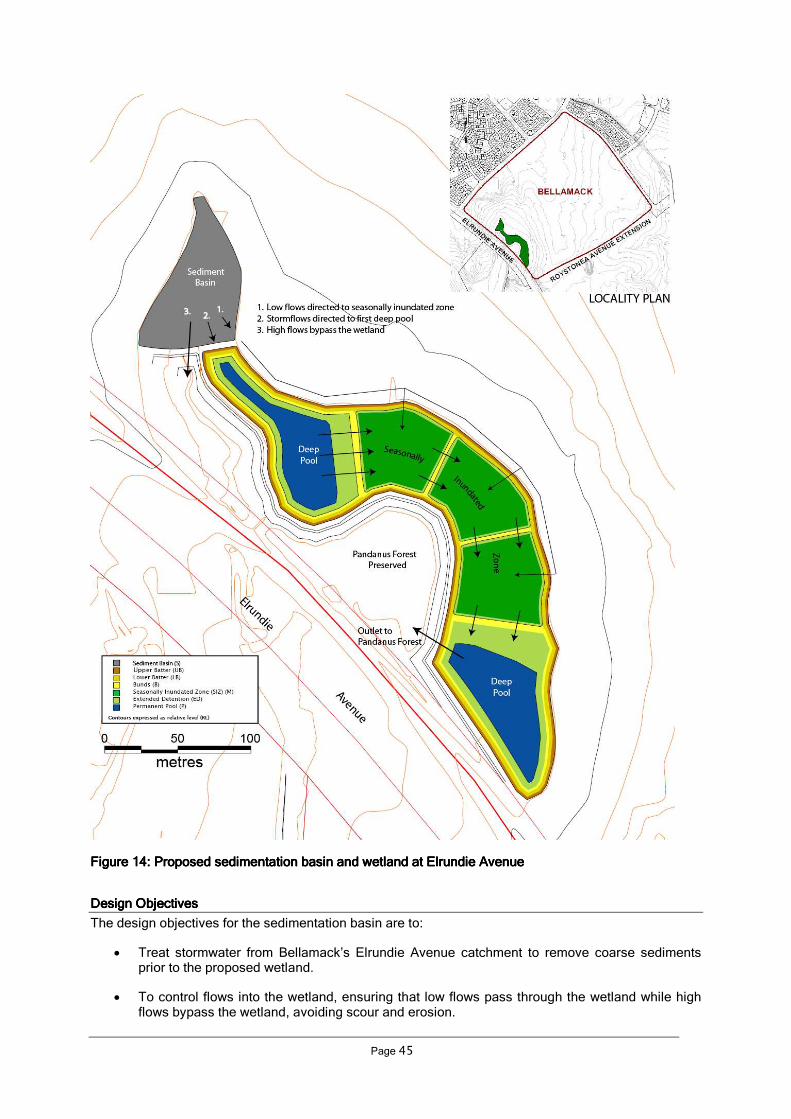
Page 45
Figure Figure Figure Figure 14141414: Proposed sedimentation basin and wetland at Elrundie Avenue: Proposed sedimentation basin and wetland at Elrundie Avenue: Proposed sedimentation basin and wetland at Elrundie Avenue: Proposed sedimentation basin and wetland at Elrundie Avenue
Design ObjectivesDesign ObjectivesDesign ObjectivesDesign Objectives
The design objectives for the sedimentation basin are to:
• Treat stormwater from Bellamack’s Elrundie Avenue catchment to remove coarse sediments prior to the proposed wetland.
• To control flows into the wetland, ensuring that low flows pass through the wetland while high flows bypass the wetland, avoiding scour and erosion.

Page 46
• To direct the initial low flows to the seasonally inundated zone of the wetland; this will be the first area of the wetland to dry out and therefore should also be the first to receive inflows, to help maintain the vegetation in healthy condition.
• To direct storm flows (up to the wetland’s design flow) to the first deep pool.
• Ensure that the design can accommodate wet and dry season conditions.
• Ensure flow velocities do not result in scour.
• Ensure public safety.
• Minimise maintenance requirements.
• Integration of the sedimentation basin design with the surrounding public open space
Site CharacteristicsSite CharacteristicsSite CharacteristicsSite Characteristics
Catchment areas: 9.85 ha (roads and footpath)
18.29 ha (open space)
2.21 ha (multi-purpose)
0.72 ha (commercial)
1.44 ha (multi-dwelling residential)
1.21 ha (medium density residential)
16.26 ha (single dwelling residential)
2.26 ha (low density residential)
55.2 ha (total)
Impervious fraction: Overall: 0.4
Most of this catchment drains to the sedimentation basin, however a small portion will actually bypass the sedimentation basin and drains directly to the wetland. For the purposes of sizing, it was assumed that the whole catchment drains into the sedimentation basin.
Step Step Step Step 1111: D: D: D: Determine Design Flowsetermine Design Flowsetermine Design Flowsetermine Design Flows
Peak flows for the Elrundie Avenue catchment were determined using a RORB model. Peak flows for the catchment were estimated as:
Q 1-year = 7.9 m3/s
Q 10-year = 15.1 m3/s
Q 100-year =24.0 m3/s
RORB model results were compared to Rational Method estimates (to see a worked example which utilises the Rational Method, please consult the swale example in Section 5.1 or the bioretention system example in Section 5.2) and to existing information on the capacity of culverts under Elrundie Avenue. The main culverts under Elrundie Avenue have a capacity of 10.5 m
3/s, and a second set have a
capacity of 6.8 m3/s. This is between the estimated peak flows for the 1 and 10 year ARI events.
The sedimentation basin will need to be designed for the safe passage of major storm flows, as it is to be located on the main drainage line through the site. For sizing the overflow spillway, the same design flowrate as the Elrundie Avenue culverts was used (10.5 m
3/s in the main drainage line). In flows above

Page 47
this, water will back up from the road and inundate the whole area surrounding the wetland and sedimentation basin.
A flow frequency analysis (see the worked example for the wetland in Section 5.4) showed that the design flow for the wetland should be limited to 4.0 m
3/s. The sedimentation basin will control this flow
into the wetland. It is also proposed to use a structure in the sedimentation basin to direct low flows (up to 10 L/s) directly into the seasonally inundated zone of the wetland.
Step Step Step Step 2222: Check Treatment Performance of Concept Design: Check Treatment Performance of Concept Design: Check Treatment Performance of Concept Design: Check Treatment Performance of Concept Design
The conceptual design process established the following key design parameters for the sedimentation basin:
• Maximum permanent pool depth of sedimentation basin of 2 m
• Wetland macrophyte zone extended detention depth of 0.5 m (normal wet season water level of 8.0 m AHD)
• Sedimentation basin normal wet season water level (‘control’ outlet pit level) 1.5 m above the normal wet season water level of the wetland (9.5 m AHD)
• ‘Spillway’ outlet weir set 0.5 m above the sedimentation basin normal wet season water level (10.0 m AHD).
An initial estimate of the sedimentation basin area can be established using the curves provided in Figure 4-3 of the SEQ Guidelines. Assuming a notional permanent pool depth of 2 m, a sedimentation basin area of approximately 900 m
2 is required to capture 90% of the 125 µm particles for flows up to
the design operation flow (4.0 m3/s).
Step 3: Confirm SizeStep 3: Confirm SizeStep 3: Confirm SizeStep 3: Confirm Size and Dimensions of the Sedimentation Basin and Dimensions of the Sedimentation Basin and Dimensions of the Sedimentation Basin and Dimensions of the Sedimentation Basin
Sedimentation basin areaSedimentation basin areaSedimentation basin areaSedimentation basin area
To size the inlet pond, a settling velocity of 0.011 m/s is adopted for a 125 µm particle (Engineers Australia, 2003). A required area (assuming ideal settling conditions) for the design flow rate was calculated using the following equation:
A = Q design/Vsettling
Thus, the area required is 365 m2. Turbulence within the inlet zone is likely to impact on the settling
characteristics of particles in the flow.
To estimate the effect of turbulence on the removal efficiency of 125 micron particles, a modified version of the Fair and Geyer (1954) equation is applied:
n
dd
dd
AQ
v
nR
e
pes
−
+
++−=
*)(
)(.
/
111
where R is the fraction of solids removed (target = 90%)
vs is the settling velocity of particles (0.011 m/s – see above)
Q/A is the hydraulic loading rate
n is the turbulence parameter (estimated as 1.33 for this sedimentation basin)
de is the depth of extended detention (0.5 m for the sedimentation basin)
dp is the depth of the permanent pool (1.5 m was adopted as the average depth in the sediment basin, assuming some edge effects and some depth taken up with stored sediment)
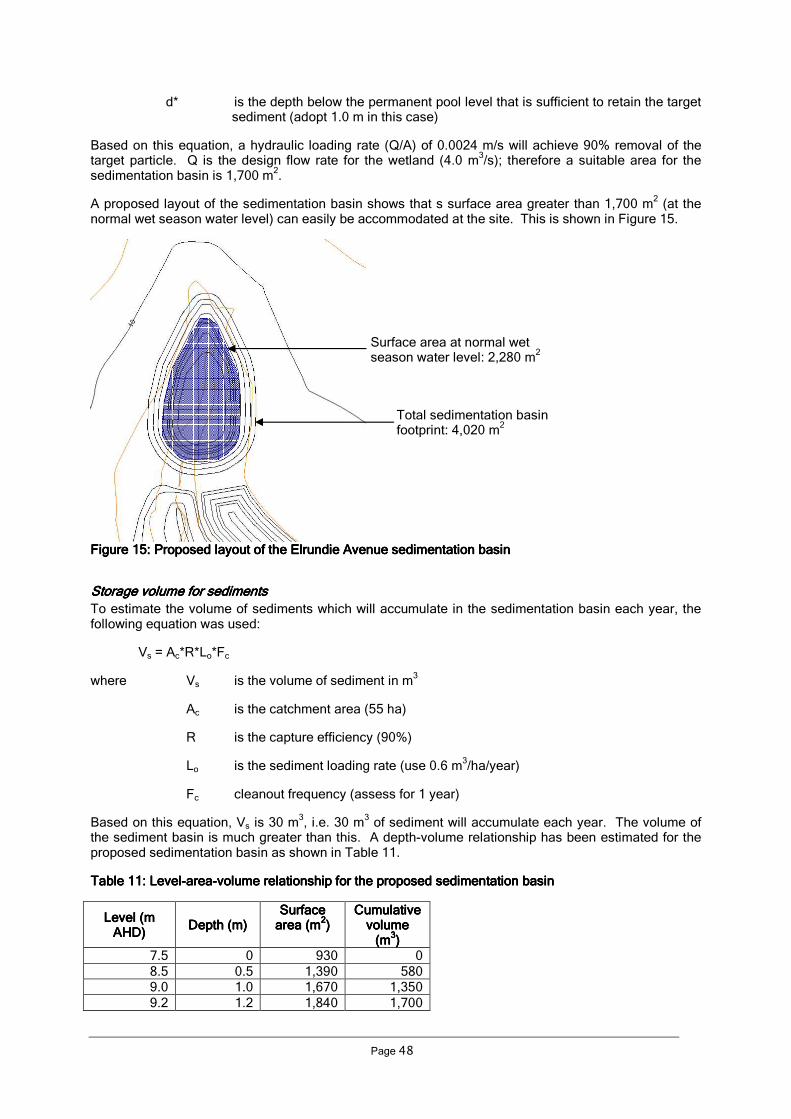
Page 48
d* is the depth below the permanent pool level that is sufficient to retain the target sediment (adopt 1.0 m in this case)
Based on this equation, a hydraulic loading rate (Q/A) of 0.0024 m/s will achieve 90% removal of the target particle. Q is the design flow rate for the wetland (4.0 m
3/s); therefore a suitable area for the
sedimentation basin is 1,700 m2.
A proposed layout of the sedimentation basin shows that s surface area greater than 1,700 m2 (at the
normal wet season water level) can easily be accommodated at the site. This is shown in Figure 15.
Figure Figure Figure Figure 15151515: Proposed layout of the Elrundie Avenue sedimentation basin: Proposed layout of the Elrundie Avenue sedimentation basin: Proposed layout of the Elrundie Avenue sedimentation basin: Proposed layout of the Elrundie Avenue sedimentation basin
Storage volume for sedimentsStorage volume for sedimentsStorage volume for sedimentsStorage volume for sediments
To estimate the volume of sediments which will accumulate in the sedimentation basin each year, the following equation was used:
Vs = Ac*R*Lo*Fc
where Vs is the volume of sediment in m3
Ac is the catchment area (55 ha)
R is the capture efficiency (90%)
Lo is the sediment loading rate (use 0.6 m3/ha/year)
Fc cleanout frequency (assess for 1 year)
Based on this equation, Vs is 30 m3, i.e. 30 m
3 of sediment will accumulate each year. The volume of
the sediment basin is much greater than this. A depth-volume relationship has been estimated for the proposed sedimentation basin as shown in Table 11.
Table Table Table Table 11111111: Level: Level: Level: Level----areaareaareaarea----volume relationship for the proposed sedimentation basinvolume relationship for the proposed sedimentation basinvolume relationship for the proposed sedimentation basinvolume relationship for the proposed sedimentation basin
Level (m Level (m Level (m Level (m AHD)AHD)AHD)AHD)
Depth (m)Depth (m)Depth (m)Depth (m) Surface Surface Surface Surface
area (marea (marea (marea (m2222))))
Cumulative Cumulative Cumulative Cumulative volume volume volume volume
(m(m(m(m3333))))
7.5 0 930 0 8.5 0.5 1,390 580 9.0 1.0 1,670 1,350 9.2 1.2 1,840 1,700
Surface area at normal wet season water level: 2,280 m
2
Total sedimentation basin footprint: 4,020 m
2
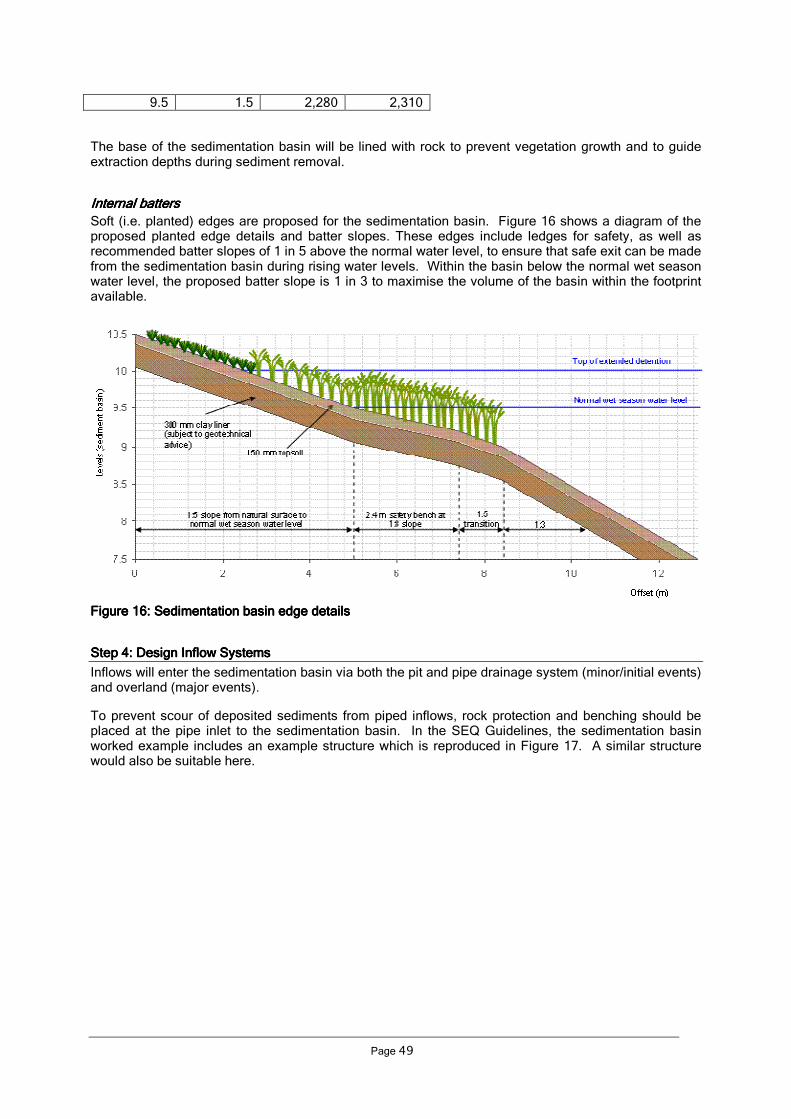
Page 49
9.5 1.5 2,280 2,310
The base of the sedimentation basin will be lined with rock to prevent vegetation growth and to guide extraction depths during sediment removal.
Internal battersInternal battersInternal battersInternal batters
Soft (i.e. planted) edges are proposed for the sedimentation basin. Figure 16 shows a diagram of the proposed planted edge details and batter slopes. These edges include ledges for safety, as well as recommended batter slopes of 1 in 5 above the normal water level, to ensure that safe exit can be made from the sedimentation basin during rising water levels. Within the basin below the normal wet season water level, the proposed batter slope is 1 in 3 to maximise the volume of the basin within the footprint available.
Figure Figure Figure Figure 16161616: Sedimentation basin edge details: Sedimentation basin edge details: Sedimentation basin edge details: Sedimentation basin edge details
Step Step Step Step 4444: : : : Design Inflow SystemsDesign Inflow SystemsDesign Inflow SystemsDesign Inflow Systems
Inflows will enter the sedimentation basin via both the pit and pipe drainage system (minor/initial events) and overland (major events).
To prevent scour of deposited sediments from piped inflows, rock protection and benching should be placed at the pipe inlet to the sedimentation basin. In the SEQ Guidelines, the sedimentation basin worked example includes an example structure which is reproduced in Figure 17. A similar structure would also be suitable here.

Page 50
S torm water
pipe
25 m m dia.
weephole
C oncrete
outlet apron
Place nom . 100 m m dia
rock to bottom of batter
W ing W all
Plan Inlet Structure Section Inlet Structure
S torm water
pipe
25 m m dia.
weephole
C oncrete
outlet apron
Place nom . 100 m m dia
rock to bottom of batter
W ing W all
Plan Inlet Structure Section Inlet Structure
Figure Figure Figure Figure 17171717: Conceptual inlet structure for energy dissipation: Conceptual inlet structure for energy dissipation: Conceptual inlet structure for energy dissipation: Conceptual inlet structure for energy dissipation
Step 5: Design Outlet StructuresStep 5: Design Outlet StructuresStep 5: Design Outlet StructuresStep 5: Design Outlet Structures
The sedimentation basin will have three outlets:
• The main pipe connection to the wetland downstream
• A low flow pipe to direct low flows into the seasonally inundated zone, ensuring it receives water early in the wet season
• A spillway into the high flow bypass
Pit and pPit and pPit and pPit and pipe outletipe outletipe outletipe outlet to macrophyte zone (first permanent pool) to macrophyte zone (first permanent pool) to macrophyte zone (first permanent pool) to macrophyte zone (first permanent pool)
Most outflows from the sedimentation basin will be directed into the first permanent pool of the wetland downstream.
The hydraulic connection between the sedimentation basin and wetland is via a grated pit and culvert. The crest of the grated pit sets the normal wet season water level in the sedimentation basin at RL 9.5 m and is designed to have the capacity to discharge the design flow (4 m
3/s) when the
sedimentation basin is at the top of its extended detention (RL 10 m). As the water level in the sedimentation basin rises above the top of extended detention (RL 10 m) the grated pit will eventually be submerged and ultimately bypass of the sedimentation basin occurs.
To size a pit such that the design flows can be delivered with 0.5 m head two scenarios are checked: free overfall conditions (weir equation) and drowned conditions (orifice equation).
For free overfall conditions (weir equation):
Q = B.C.L.H3/2
(with B = blockage factor, C = 1.7, H = available head above weir crest, and L = length of weir)
4.0 = 0.5 x 1.7 x L x (0.5)3/2
Therefore L = 13.3 m (adopt a 3.4 m by 3.4 m pit or similar)
Now check for drowned outlet conditions (orifice equation):
Q = B.C.A.√2gh (with B = blockage factor, C = 0.6, g = acceleration due to gravity, h = available head above weir crest and A = area of orifice opening)
4.0 = 0.5 x 0.6 x A x √(2 x 9.81 x 0.5)
Therefore A = 4.3 m2 (e.g. pit 2.1 m by 2.1 m square)
From these calculations, free overfall conditions are limiting and a pit size of 3.4m by 3.4 is adopted.

Page 51
The pipe system conveying flows from the sedimentation basin to the wetland is sized for the design flow of 4.0 m
3/s when the water level in the wetland zone is at the top of extended detention (RL 8.5 m)
while the water in the sedimentation basin is also at the top of extended detention (RL 10m).
For a submerged pipe outlet, the pipe can be sized using the following equation:
g
vh
2.2
2
=
Where h is the headloss through the submerged pipe, v is the velocity, estimated as the design flow (4.0 m
3/s) divided by the pipe’s cross-sectional area, and g is acceleration due to gravity. Using this
equation it is estimated that a 1250 mm pipe would result in a reasonable headloss of 1.08 m. The available head when the system is full is 1.5 m.
Low flow outlet to seLow flow outlet to seLow flow outlet to seLow flow outlet to seasonally inundated zoneasonally inundated zoneasonally inundated zoneasonally inundated zone
In order to transfer low flows (up to 10 L/s) to the seasonally inundated zone, a second outlet is to be provided from the sedimentation basin. Low flows will be preferentially diverted to the seasonally inundated zone (SIZ) to ensure that the macrophyte vegetation in the SIZ survives the long dry season and to ensure that it has preferential wetting over the permanent pool.
Vegetation in the SIZ is capable of withstanding an initial 200 mm rise in water level and is capable of withstanding subsequent water level rises of 2 to 7 cm a day. This results in:
• The initial volume of water that can be diverted to the SIZ is approximately 2,000 m3 and
• A subsequent flow rate of 10 L/s into the SIZ
Thus the sedimentation basin has been configured to contain a low flow volume of approximately 2,000 m
3 below the normal wet season water level (RL 9.5 m) and above the low flow outlet (RL 8.5 m).
It is proposed to place the low flow outlet at 8.5 m AHD (mid-depth in the sedimentation basin) to ensure that it begins to flow before the sedimentation basin is full, but is also protected from blockage due to sediment build-up at the base of the basin. The low flow outlet is sized to deliver a maximum flowrate of 10 L/s, based on a submerged orifice equation:
Q = C.A √2gh with C = 0.6 and H = available head above weir crest
0.01 = 0.6 x A x √(2 x g x 1)
Therefore A = 0.0038 m2
Therefore adopt a 70 mm diameter orifice (area 0.0038 m2) to connect the sedimentation basin to the
SIZ. This orifice is very small and is thus prone to blocking. To ensure that the orifice does not become blocked it is proposed to place the orifice inside a separate 600 mm by 600 mm outlet pit with a lid level at 9.5m – the top of the normal wet season water level - to provide access. Within the pit will be contained a 150 mm diameter upstanding riser with a 35mm diameter orifice drilled into the side of the riser at RL 8.5m. The pit will have 4 openings cut out of the side, 300 mm by 300 mm which will be screened with a fine mesh of 50 mm. This will provide a total surface area of 0.36 m
2 or approximately
100 times the required area of opening for the orifice. Thus this screened inlet can be 99% blocked before the capacity of the orifice is affected and will provide a sufficient screening function for the orifice.
Flows will be distributed into the SIZ via a 150 mm pipe. The design of the flow distribution system is described in the wetland worked example in Section 5.4.
Spillway outlet to high flSpillway outlet to high flSpillway outlet to high flSpillway outlet to high flow bypassow bypassow bypassow bypass
A spillway will convey flows above the wetland’s design flow into the bypass channel. The spillway has been sized for a maximum flow of 10.5 m
3/s, which is the nominated capacity of the main culverts under
Elrundie Avenue.

Page 52
The spillway crest will be located at 10.0 m AHD (at the top of the extended detention). It is proposed to build the sedimentation embankments up to 10.5 m AHD, so the maximum head driving flow across the spillway will be 0.5 m. The spillway is sized using the broad-crested weir equation:
Q = C.L.H3/2
with C = 1.7 and H = available head above weir crest
10.5 = 1.7.L.(0.5)3/2
L = 17.47 m, which is the required length of spillway.
Adopt a spillway length of 18 m with a crest level of RL 10.0 m and set the bank around the rest of the sedimentation basin to 10.5 m AHD.
The spillway will be constructed as a concrete weir with appropriate rock reinforcement on the downstream side.
Step 6: Specify VegetationStep 6: Specify VegetationStep 6: Specify VegetationStep 6: Specify Vegetation
The Vegetation Selection Guide has information on appropriate species for wetlands. This includes species for the batter slopes, which are also suitable for the edges of sedimentation basins. Within the central part of the sedimentation basin, the water is deep and the base is to be rock-lined to prevent vegetation growth and maximise the volume available for sedimentation and sediment storage. A lack of vegetation should also facilitate cleanout activities.
Step 7: Consider Maintenance RequirementsStep 7: Consider Maintenance RequirementsStep 7: Consider Maintenance RequirementsStep 7: Consider Maintenance Requirements
Maintenance is an important consideration for the sedimentation basin, as annual cleanouts are suggested. To facilitate sedimentation basin cleanout, an access ramp with a 1 in 10 slope will be provided into the base of the basin. A 3 m wide access track will also be provided around the top of the embankment around the edge of the basin, to assist with access to the inlets and outlets.
Calculation summaryCalculation summaryCalculation summaryCalculation summary
The following table summarises the results of the design calculations.

Page 53
SEDIMENTATION BASIN DESIGN CALCULATION SUMMARY – DARWIN REGION CALCULATION SUMMARY
Calculation Task Outcome Check
Catchment Characteristics
Area 55 Ha
Catchment land use (i.e residential, commercial etc.) Residential
Storm event entering inlet pond (initial or major) 5 yr ARI
Conceptual Design
Notional permanent pool depth 2 m
Wet season water level of sedimentation basin 9.5 m AHD
1 Determine design flows
Peak design flows
'Design operation flow' 4.0 m3/s
'Above design flow' 10.5 m3/s
2 Confirm Treatment Performance of Concept Design
Capture efficiency (of 125 µm sediment) 90 %
Required area of sedimentation basin 900 m2
3 Confirm size and dimension of sedimentation basin
Aspect ratio 2:1 L:W
Hydraulic efficiency (λ) 0.25
Turbulence parameter (n) 1.33
Depth of permanent pool 1.5 m
Area of sedimentation basin 1,700 m2
Storage volume for sediments
Sedimentation basin storage Volume Vs >500 m3
Desired sediment cleanout frequency 1 years
Volume of accumulated sediment between cleanouts 30 m3
Sufficient capacity for stored sediment ? yes
Internal batters
Edge batter slope 1:3 V:H
(1:5 to 1:8 just below and above water level
– for safety)
4 Design inflow systems
Provision of scour protection or energy dissipation yes
5 Design outlet structures
Design of 'control' outlet - overflow pit and pipe outlet configuration
Overflow pit crest level 9.5 m AHD
Overflow pit dimension 3.4 x 3.4 L x W
Provision of debris trap no
Connection pipe dimension 1250 mm diam
Connection pipe invert level 7.5 m AHD
Design of 'control' outlet - weir configuration
Weir crest level N/A m AHD
Weir length N/A m
Design of 'spillway' outlet - weir configuration
Weir crest level 10.0 m AHD
Weir length 18 m
Depth above spillway 0.5 m
Freeboard to top of embankment 0 m

Page 54
5.4 Constructed wetlands
Unlike the other treatment measures described in this technical design guideline, wetland design in the Darwin Region will need to be significantly modified compared to temperate climates. A typical stormwater wetland in temperate climates is designed to retain water year-round and water level fluctuations (associated with intermittent runoff) are normally kept below approximately 0.75 m. In the Darwin Region, permanent water will not be an option, and wetlands need to be designed to tolerate significant seasonal water level variations.
Notwithstanding the above, much of the advice regarding wetland design in the SEQ Guidelines is relevant to Darwin, providing that the SEQ Guidelines are read in conjunction with this document.
These guidelines recommend a design template for a stormwater treatment wetland in the Darwin Region, which is a response to the local conditions. This design has not yet been tested in the field, and it is likely that elements of the design will be refined once there has been an opportunity to trial it in operation. There also may be alternative potential design responses. This guideline gives one potential solution, but also provides relevant information for practitioners to develop other design options.
5.4.1 Introduction and design considerations
The SEQ Guidelines cover constructed wetlands in Chapter 6. In that document, the Introduction and Design Considerations are all relevant in the Darwin Region, with the following exceptions:
• Normally in southern Australia, wetlands are designed for a nominal 72-hour detention time (48 hours is not usually recommended beyond SEQ), which is regulated via a riser outlet. The extended detention fills after a storm event, and then is gradually drawn down over 72 hours. The same principle should essentially be applied in the wet-dry tropics, however storm events are more frequent through the wet season, so draw-down may not be observed between events. Wetlands in the Darwin Region may operate with a relatively constant water level through the wet season and a suitable detention time could still be achieved by ensuring plug flow occurs, and sizing the wetland to contain a nominal three days’ rainfall volume.
• The macrophyte zone for a wetland in the Darwin Region needs to be able to tolerate significant seasonal water level variations. The recommended design involves a bathymetry somewhat different to a typical temperate region stormwater wetland, including the following components:
o Two deep pools, designed to retain water permanently. Permanent water will be a refuge for mosquito predators during the dry season. These will probably need to be at least 2.0 m deep, and may require top-up in some dry seasons
o A “seasonally inundated zone” (SIZ) which will include large sections of deep marsh (at least 0.5 m deep) divided by short sections of shallow or ephemeral marsh, which will form “bunds” around the deep marsh cells and retain water in the deep marsh for a period of time after the end of the wet season
Otherwise, most of the macrophyte zone design considerations in the SEQ Guidelines are relevant, including the extended detention depth, water retention, hydraulic efficiency and water level management. The ability to drain the macrophyte zone may also assist in the management of pests and weeds, which are key concerns in the Darwin Region.
• For information on appropriate vegetation for wetlands in the Darwin Region, please refer to the Vegetation Selection Guide, rather than Appendix A of the SEQ Guidelines.
• As in SEQ, designing to avoid mosquito breeding is equally important in the Darwin Region, and in addition to the advice in the SEQ Guidelines, readers should consult Section 6.2 for locally tailored information.
• Several additional design considerations emerge in the Darwin Region, which are not relevant (or less relevant) to SEQ. These are discussed below and include:
o Vegetation die-off during the dry season

Page 55
o Several vigorously growing and ecological in highly competitive weeds occur in wetland areas of the Northern Territory
o During the dry season, algal growth is a risk wherever water is retained
o Waterlogged soils are a problem in the Darwin Region during the wet season
In addition, some of the terminology in the SEQ Guidelines has been modified in the Darwin Region context:
• In Darwin the “permanent pool water level” is referred to as the “normal wet season water level”, as this water level will only be “permanent” through the wet season.
• A “typical minimum dry season water level” may be relevant in some designs.
Vegetation Vegetation Vegetation Vegetation
Vegetation die-off during the dry season is common for many species of aquatic vegetation in the Darwin region. Wetland design needs to manage the transition from wet season to dry season and vice versa to ensure that this does not compromise treatment performance or aesthetics of the wetland.
Wetland design and plant selection for wetlands in the Darwin Region should evolve with reference to natural wetlands in the area. Wetland plants that occur naturally in the freshwater lagoons, floodplains and wetlands of the Darwin Region are likely to be appropriate for stormwater treatment wetlands. These local plants are able to tolerate the high water level fluctuations and long periods of wetting and drying.
One technique that has been suggested to minimise the effects of drying is to distribute low flows throughout the wetland, particularly in the early wet season, so that the whole wetland benefits from these flows, rather than the downstream end only receiving flows after the upstream end is full.
Irrigation of seasonally ephemeral zones or artificial top-up of permanent pools may also be a suitable option for some wetlands.
WeedsWeedsWeedsWeeds
Several vigorously growing and ecological in highly competitive weeds occur in wetland areas of the Northern Territory. Stormwater treatment systems should be designed to prevent or discourage the establishment of these species (Cowie, 2003):
• Mimosa pigra
• Salvinia molesta
• Brachiaria mutica (Paragrass)
• Hymenachne amplexicaulis
• Cabomba caroliniana
• Echinochloa polystachya
Mission Grass and Gamba Grass should also be discouraged.
There are potential mechanisms to reduce weed establishment and control or exclude the growth of weeds. The growth of weeds can be controlled by:
a) Reducing resources available to the plant; i.e. reducing light, water, or nutrients. Densely vegetating stormwater treatment devices shades weed propagules, and provides competition for resources such as space and nutrients which are required by weed species for successful growth.

Page 56
b) Destroying weeds where they occur. Certain species may be killed by chemical sprays, mechanical removal, flooding or draining of the wetland, and fire. However, unless the area previously occupied by the weeds is populated by other species, the disturbed area is likely to be re-colonised by weeds.
c) Minimising the extent of permanent water (i.e. creating only small permanent water zones surrounded by ephemeral zones which dry between events).
Long-term weed management should consider dense planting of design species to exclude weeds. This will also have the effect of reducing nutrients available to weed propagules and will shade young weed plants, making it more difficult for weeds to establish. Floating species such as Salvinia may require physical controls such as chemical sprays, mechanical removal, and the introduction of biological controls such as the Salvinia weevil.
Algal growthAlgal growthAlgal growthAlgal growth
Key risk factors leading to blooms are:
• The supply of nutrients, phosphorous and nitrogen in particular
• The depth of the surface mixed layer
• Turbidity and the availability of sunlight
• The rate of discharge of waterbodies
Wetlands provide a high risk environment, especially at the end of the wet season, as nutrient levels increase, discharge through the wetland is minimal, and sunlight and temperatures are high. However by removing nutrients from stormwater, wetlands also reduce the risk of algal blooms in downstream environments. If an algal bloom occurs within a constructed wetland, it can at least be contained so that it does not spread into downstream waterways.
To manage the risks of algal blooms, and facilitate management responses when they occur, potential techniques include:
• Dry season top-up of permanent pools
• Recirculation of flows within the wetland during the dry season
• Draining/pumping out ephemeral areas and permanent pools when required
Waterlogged soilsWaterlogged soilsWaterlogged soilsWaterlogged soils
Waterlogged soils are a problem in the Darwin Region during the wet season. This will be an important consideration when designing wetlands for low-lying areas in the region. Most wetland designs involve lining the wetland with an impervious barrier. This could potentially impede wet season groundwater flows, creating local groundwater mounding and lead to detrimental impacts on the wetland itself or surrounding structures. Ideally, wetlands should be located higher than wet season water levels.
5.4.2 Design process
As discussed above, this section outlines a design template for a Darwin Region wetland, which is just one of several potential suitable solutions. The principles of wetland design are transferrable to different wetland types and therefore most of the design process set out for wetlands in the SEQ Guidelines is also relevant in the Darwin Region. Some additional steps are recommended for Darwin wetlands, to design a low flow distribution system and check that the wetland can tolerate high wet season overland flows.
Performance curvesPerformance curvesPerformance curvesPerformance curves
The performance curves for wetlands in the Darwin Region are shown in Figure 18. Note that the SEQ Guidelines included three separate figures for total suspended solids, total phosphorus and total

Page 57
nitrogen, however in Figure 18 these are all presented on the same chart. The assumptions used to produce these performance curves were:
• 0.5 m extended detention
• 0.3 m average depth of permanent pool
• 72 hour notional detention time
• Pre-treatment in a sedimentation basin with a surface area approximately 10% of the wetland area
• The upstream catchment is a typical residential area, with an overall impervious fraction of approximately 50%
If the wetland being designed differs substantially from these assumptions, or if it is part of a treatment train with upstream pre-treatment measures, then it is recommended that MUSIC be used to check the performance.
Wetland Treatment Sizing Curve
0%
10%
20%
30%
40%
50%
60%
70%
80%
90%
0.0% 2.0% 4.0% 6.0% 8.0% 10.0%
% of Catchment Area
% R
emoval
TSS
TP
TN
Figure Figure Figure Figure 18181818: Performance curves for wetlands in the Darwin Region: Performance curves for wetlands in the Darwin Region: Performance curves for wetlands in the Darwin Region: Performance curves for wetlands in the Darwin Region
Design flowsDesign flowsDesign flowsDesign flows
In Darwin wet season storm events generate high peak flows and designing wetlands for the 1 year ARI flow may result in very large inlet and outlet structures, and potentially high velocities within the system. It is suggested that a flow frequency analysis be undertaken for the upstream catchment (e.g. this can be undertaken in MUSIC) to choose an appropriate design flowrate. A design flow should be chosen to maximise the hydrologic effectiveness of the wetland (i.e. maximise the proportion of flows treated in the wetland), but avoid excessively sized inlet and outlet structures.
A typical flow frequency curve is shown in Figure 19. Typically the design flow should be selected where 95-99% of all flows will be treated.

Page 58
FiFiFiFigure gure gure gure 19191919: Example flow frequency distribution curve: Example flow frequency distribution curve: Example flow frequency distribution curve: Example flow frequency distribution curve
As per SEQ, “above design” flows for wetlands in small catchments should be calculated using the Rational Method. However the relevant minor and major design events are as follows:
• The “minor” event is termed the “initial” storm in the Darwin and Palmerston subdivision development guidelines. The design Average Recurrence Interval (ARI) ranges from 1-10 years, depending on the local government area and zoning.
• The design event for major storms in the Darwin Region is the 100 year ARI, for both local government areas and all zonings.
BathymetryBathymetryBathymetryBathymetry
Wetland bathymetry proposed for the Darwin Region is significantly different to the bathymetry recommended in the SEQ Guidelines. Instead of a gradual transition though deep, shallow and ephemeral marsh zones, some more distinct zones are proposed:
• Deep pools, designed to retain water permanently. Permanent water will be a refuge for mosquito predators during the dry season. These will probably need to be at least 2.0 m deep, and may require top-up in some dry seasons
• A “seasonally inundated zone” (SIZ) which will include large sections of deep marsh (at least 0.5 m deep) divided by short sections of shallow or ephemeral marsh, which will form “bunds” around the deep marsh cells and retain water in the deep marsh for a period of time after the end of the wet season
These zones are illustrated in Figure 20.
Pro
po
rtio
n o
f ru
no
ff (
%)
95
90
85
80
75
70
65
60
55
50
100
Peak flows
Suitable design flow
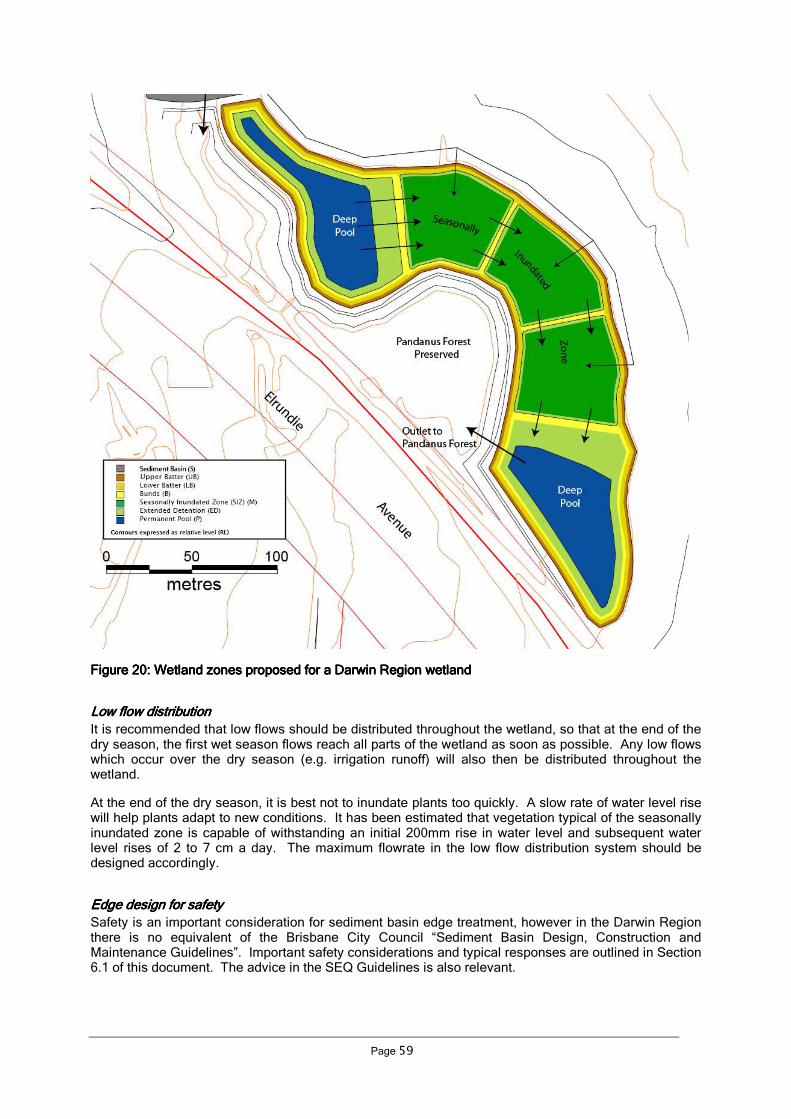
Page 59
Figure Figure Figure Figure 20202020: Wetland zones proposed for a Darwin Region wetland: Wetland zones proposed for a Darwin Region wetland: Wetland zones proposed for a Darwin Region wetland: Wetland zones proposed for a Darwin Region wetland
Low flow distributionLow flow distributionLow flow distributionLow flow distribution
It is recommended that low flows should be distributed throughout the wetland, so that at the end of the dry season, the first wet season flows reach all parts of the wetland as soon as possible. Any low flows which occur over the dry season (e.g. irrigation runoff) will also then be distributed throughout the wetland.
At the end of the dry season, it is best not to inundate plants too quickly. A slow rate of water level rise will help plants adapt to new conditions. It has been estimated that vegetation typical of the seasonally inundated zone is capable of withstanding an initial 200mm rise in water level and subsequent water level rises of 2 to 7 cm a day. The maximum flowrate in the low flow distribution system should be designed accordingly.
Edge design for safetyEdge design for safetyEdge design for safetyEdge design for safety
Safety is an important consideration for sediment basin edge treatment, however in the Darwin Region there is no equivalent of the Brisbane City Council “Sediment Basin Design, Construction and Maintenance Guidelines”. Important safety considerations and typical responses are outlined in Section 6.1 of this document. The advice in the SEQ Guidelines is also relevant.

Page 60
PPPPlant specieslant specieslant specieslant species
For information on appropriate vegetation for wetlands in the Darwin Region, please refer to the Vegetation Selection Guide.
Maintenance requirementsMaintenance requirementsMaintenance requirementsMaintenance requirements
It is worthwhile considering maintenance requirements at the design stage, particularly access requirements. Further information is provided in Section 6 and in the Construction, Establishment, Asset Handover and Maintenance Guide.
Verification checksVerification checksVerification checksVerification checks
In addition to the velocity verification check in the SEQ Guidelines, it is recommended that consideration be given to peak overland flows. Wetlands will often be located within or adjacent to drainage channels and in major storm events, they may become overwhelmed by overland flows or floodwaters. Inundation is not a problem, provided that the wetland is designed to safely pass peak overland flows.
Design summaryDesign summaryDesign summaryDesign summary
A Design Calculation Summary Sheet specific to the Darwin Region has been provided below.

Page 61
CONSTRUCTED WETLANDS DESIGN CALCULATION SUMMARY – DRAWIN REGION CALCULATION SUMMARY
Calculation Task Outcome Check
Catchment Characteristics
Catchment area ha
Catchment land use (i.e residential, commercial etc.)
Storm event entering inlet pond (minor or major)
Conceptual Design
Macrophyte zone area m2
Normal wet season water level in macrophyte zone m AHD
Extended detention depth (0.25-0.75m) m
Notional detention time hrs
1 Confirm Treatment Performance of Concept Design
Total suspended solids (Figure 17) % removal
Total phosphorus (Figure 17) % removal
Total nitrogen (Figure 17) % removal
2 Determine design flows
'Design operation flow' m3/s
'Above design flow' m3/s
3 Design inlet zone
Refer to sedimentation basin (Section 5.3) for detailed check sheet
Is a GPT required?
Suitable GPT selected and maintenance considered?
Inlet zone size
Target Sediment Size for Inlet Zone µm
Capture efficiency %
Inlet zone area (Figure 4.2 in Chapter 4) m2
Suitable volume for sediment storage?
Inlet zone connection to macrophyte zone
Overflow pit crest level m AHD
Overflow pit dimension L x W
Provision of debris trap
Connection pipe dimension mm diam
Connection pipe invert level m AHD
High flow by-pass weir
Weir Length m
High flow by-pass weir crest level (top of extended detention) m AHD
4 Designing the macrophyte zone
Area of Macrophyte Zone m2
Aspect Ratio L:W
Hydraulic Efficiency
Flowrate for low-flow distribution system L/s
5 Design macrophyte zone outlet
Riser outlet
Target maximum discharge (Qmax) m3/s
Uniform Detention Time Relationship for Riser
Maintenance Drain
Maintenance drainage rate (drain over 12hrs) m3/s
Diameter of maintenance drain pipe mm
Diameter of maintenance drain valve mm
Discharge Pipe
Diameter of discharge pipe mm

Page 62
CONSTRUCTED WETLANDS DESIGN CALCULATION SUMMARY – DRAWIN REGION CALCULATION SUMMARY
Calculation Task Outcome Check
6 Design high flow by-pass 'channel'
Longitudinal slope %
Base width m
Batter slopes H:V
7 Verification checks
Macrophyte zone re-suspension protection
Peak overland flows through macrophyte zone
Confirm treatment performance
5.4.3 Worked example
As part of the Bellamack development, a wetland is proposed to treat the catchment upstream of Elrundie Avenue. This design is presented here as an example. Design calculations have been summarised from the functional design report prepared for this treatment system and key details have been reproduced from the functional design drawings.
The location of the proposed wetland is shown in Figure 21. The conceptual design included an area of 3.5 ha for the total sedimentation basin + wetland footprint. The wetland area itself was proposed as 2.8 ha. The layout of the proposed sedimentation basin and wetland is shown in Figure 22. The design of the sedimentation basin was presented as a worked example in Section 5.3.
Figure Figure Figure Figure 21212121: location of the proposed sedimentation basin and wetland at Elrundie Avenue: location of the proposed sedimentation basin and wetland at Elrundie Avenue: location of the proposed sedimentation basin and wetland at Elrundie Avenue: location of the proposed sedimentation basin and wetland at Elrundie Avenue
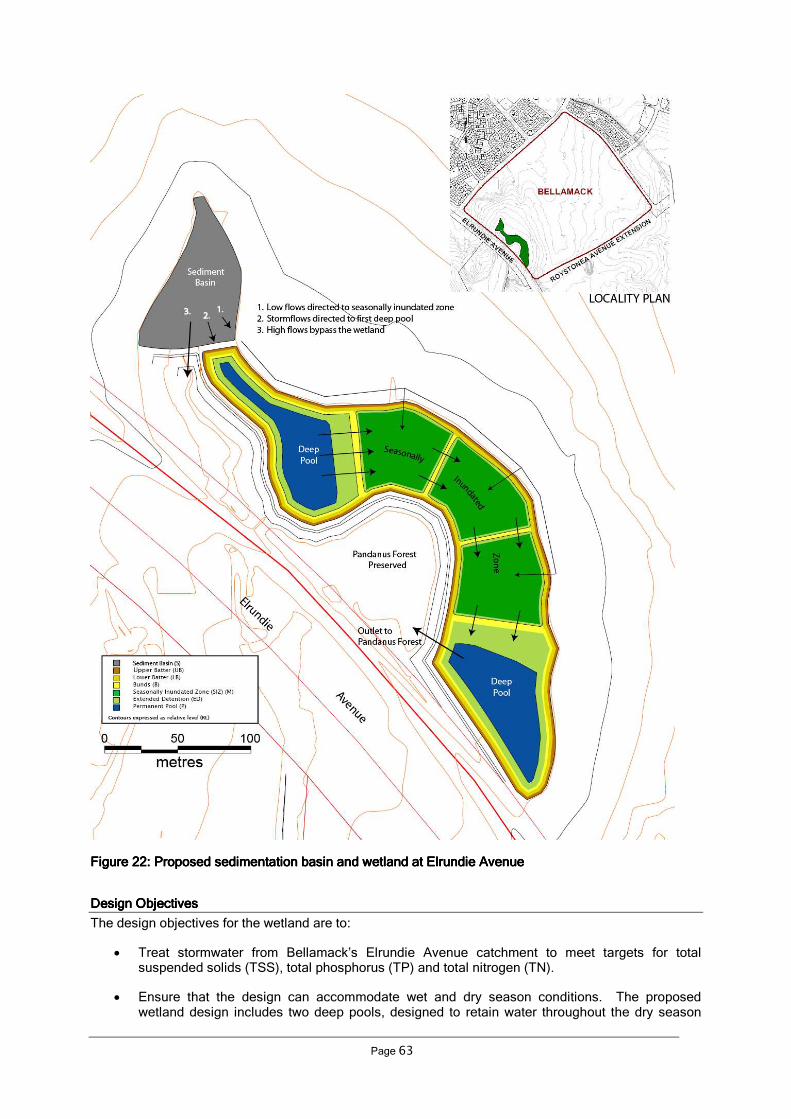
Page 63
Figure Figure Figure Figure 22222222: Proposed sedimentation basin and wetland at Elrundie Avenue: Proposed sedimentation basin and wetland at Elrundie Avenue: Proposed sedimentation basin and wetland at Elrundie Avenue: Proposed sedimentation basin and wetland at Elrundie Avenue
Design ObjectivesDesign ObjectivesDesign ObjectivesDesign Objectives
The design objectives for the wetland are to:
• Treat stormwater from Bellamack’s Elrundie Avenue catchment to meet targets for total suspended solids (TSS), total phosphorus (TP) and total nitrogen (TN).
• Ensure that the design can accommodate wet and dry season conditions. The proposed wetland design includes two deep pools, designed to retain water throughout the dry season

Page 64
and be a refuge for aquatic fauna, as well as a seasonally inundated zone (SIZ), where the majority of the pollutant removal is expected to take place
• Distribute flows effectively throughout the large system to encourage even flow conditions throughout the treatment system
• Ensure flow velocities do not result in scour.
• Ensure public safety.
• Minimise maintenance requirements.
• Integration of the wetland design with the surrounding public open space
Site CharacteristicsSite CharacteristicsSite CharacteristicsSite Characteristics
Catchment areas: 9.85 ha (roads and footpath)
18.29 ha (open space)
2.21 ha (multi-purpose)
0.72 ha (commercial)
1.44 ha (multi-dwelling residential)
1.21 ha (medium density residential)
16.26 ha (single dwelling residential)
2.26 ha (low density residential)
55.2 ha (total)
Impervious fraction: Overall: 0.4
Step 1: Verify Size for TreatmentStep 1: Verify Size for TreatmentStep 1: Verify Size for TreatmentStep 1: Verify Size for Treatment
The wetland area proposed in the concept design was 2.8 ha. This is equivalent to approximately 5% of the total catchment area. Using the wetland performance curves in Figure 18, the estimated pollutant removal rates for this wetland would be 72% of total suspended solids, 58% of total phosphorus and 42% of total nitrogen. These pollutant removal rates are slightly lower than the targets (80%, 60% and 45% respectively), however the catchment has a large amount of open space, some of which will be retained as native bushland. The overall impervious fraction has been estimated at 40%.
Step Step Step Step 2222: Determine Design Flows: Determine Design Flows: Determine Design Flows: Determine Design Flows
As described in the sedimentation basin worked example, peak flows for the Elrundie Avenue catchment were determined using a RORB model. The capacity of existing culverts underneath Elrundie Avenue was taken as the “above design” flow for design of the sedimentation basin, as in larger flows the area will be flooded by backwater behind the road embankment.
A flow frequency analysis was used to determine the design flow for the wetland. This was undertaken in MUSIC, using a long time series of 6-minute rainfall data. The results are shown in Figure 23. This was used to select a design flow of 4.0 m
3/s. Using this as the design flowrate, approximately 95% of
flows will be treated by the wetland. The 1 year ARI peak flow (7.9 m3/s, see Section 5.3.3) was
considered too high for this wetland, as it would require larger inlet and outlet structures and would increase the likelihood of erosive flow conditions developing. Figure 23 shows that increasing the design flowrate above 4 m
3/s results in a diminishing improvement in the hydrologic effectiveness (total
amount of runoff treated).
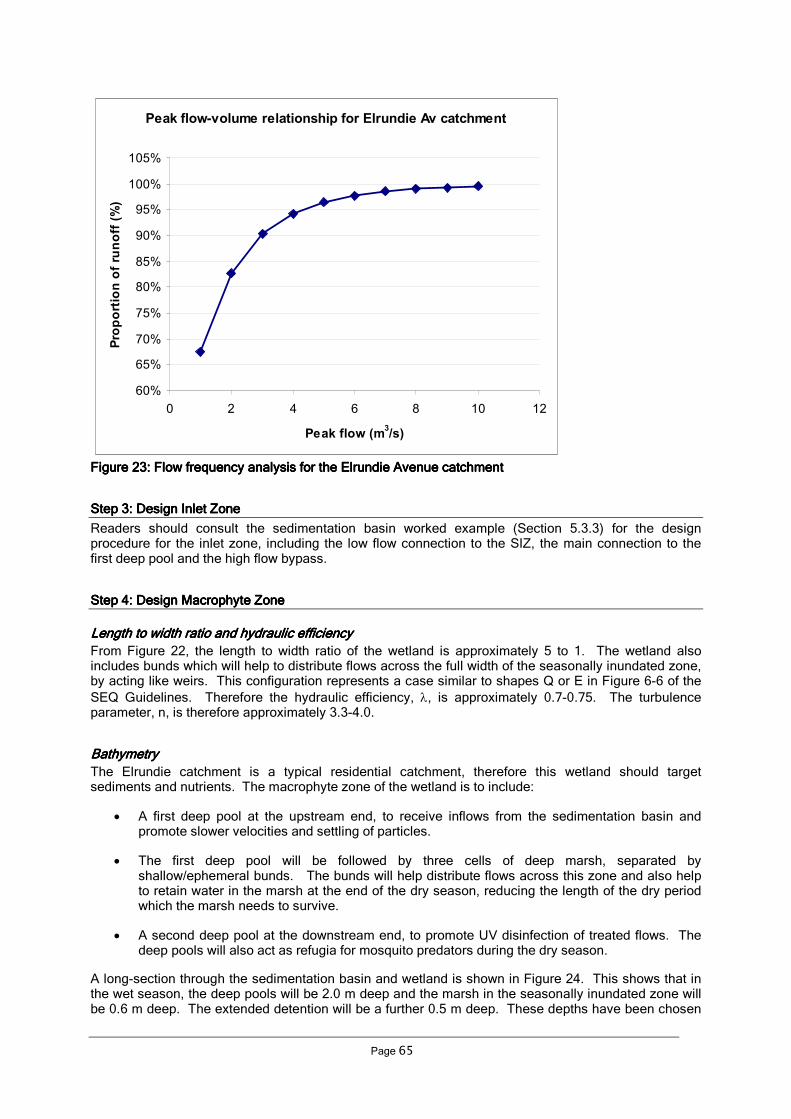
Page 65
Figure Figure Figure Figure 23232323: Flow frequency analysis for the Elrundie Avenue catchment: Flow frequency analysis for the Elrundie Avenue catchment: Flow frequency analysis for the Elrundie Avenue catchment: Flow frequency analysis for the Elrundie Avenue catchment
StStStStep 3: Design Inlet Zoneep 3: Design Inlet Zoneep 3: Design Inlet Zoneep 3: Design Inlet Zone
Readers should consult the sedimentation basin worked example (Section 5.3.3) for the design procedure for the inlet zone, including the low flow connection to the SIZ, the main connection to the first deep pool and the high flow bypass.
Step 4: Design Macrophyte ZoneStep 4: Design Macrophyte ZoneStep 4: Design Macrophyte ZoneStep 4: Design Macrophyte Zone
Length to width ratio and hydraulic efficiencyLength to width ratio and hydraulic efficiencyLength to width ratio and hydraulic efficiencyLength to width ratio and hydraulic efficiency
From Figure 22, the length to width ratio of the wetland is approximately 5 to 1. The wetland also includes bunds which will help to distribute flows across the full width of the seasonally inundated zone, by acting like weirs. This configuration represents a case similar to shapes Q or E in Figure 6-6 of the
SEQ Guidelines. Therefore the hydraulic efficiency, λ, is approximately 0.7-0.75. The turbulence parameter, n, is therefore approximately 3.3-4.0.
BathymetryBathymetryBathymetryBathymetry
The Elrundie catchment is a typical residential catchment, therefore this wetland should target sediments and nutrients. The macrophyte zone of the wetland is to include:
• A first deep pool at the upstream end, to receive inflows from the sedimentation basin and promote slower velocities and settling of particles.
• The first deep pool will be followed by three cells of deep marsh, separated by shallow/ephemeral bunds. The bunds will help distribute flows across this zone and also help to retain water in the marsh at the end of the dry season, reducing the length of the dry period which the marsh needs to survive.
• A second deep pool at the downstream end, to promote UV disinfection of treated flows. The deep pools will also act as refugia for mosquito predators during the dry season.
A long-section through the sedimentation basin and wetland is shown in Figure 24. This shows that in the wet season, the deep pools will be 2.0 m deep and the marsh in the seasonally inundated zone will be 0.6 m deep. The extended detention will be a further 0.5 m deep. These depths have been chosen
Peak flow-volume relationship for Elrundie Av catchment
60%
65%
70%
75%
80%
85%
90%
95%
100%
105%
0 2 4 6 8 10 12
Peak flow (m3/s)
Proportion of runoff (%)

Page 66
so that the deep pools will retain water in most dry seasons (typically at the end of the dry season the water level in the deep pools will still be approximately 0.5-1.0 m deep), and the seasonally inundated zone will retain water for approximately 3 months into each dry season. Daily water balance modelling was undertaken to simulate wetting and drying over a 50-year period and verify these results.
6
6.5
7
7.5
8
8.5
9
9.5
10
10.5
11
0 50 100 150 200 250 300 350 400 450
Sediment basin Wetland
Normal wet season water level
Submerged marsh zoneSeasonally inundated zone
Submerged
marsh zone
Bunds to 7.9 m AHD
(3 m wide)Bund to 8.0 m AHD
(3 m wide)
Bund to 8.0 m AHD
(3 m wide)
Normal wet season water level
Top of extended detention
Top of extended detention
Typical minimum water level
(end of dry season)
Typical minimum water level
(end of dry season)
Figure Figure Figure Figure 24242424: Long section through the Elrundie Avenue sedimentation basin and wetland: Long section through the Elrundie Avenue sedimentation basin and wetland: Long section through the Elrundie Avenue sedimentation basin and wetland: Long section through the Elrundie Avenue sedimentation basin and wetland
Low flow distributionLow flow distributionLow flow distributionLow flow distribution
The area of the seasonally inundated zone (at the base level of 7.4 m AHD) has been estimated at 6,620 m
2. Its total volume has been estimated at 4,600 m
3. A suitable flowrate was estimated which
would fill the SIZ cells in no less than 5 days. This timeframe is expected to allow the vegetation to adapt to the new inundation condition. The low flow rate into the SIZ can therefore be up to 920 m
3/day.
This is equivalent to approximately 10.6 L/s. 10 L/s was adopted for the design.
The DRAINS program was used to design the low flow distribution system. Simple hydraulic grade line calculations would also be sufficient. It was estimated that a 150 mm diameter plastic pipe at 0.3% grade will be sufficient to convey 10 L/s to the three SIZ cells. The flows will then be split evenly through a series of flow splitting pits. The flow splitting pits need to direct a third of the flow, 3.3 L/s, into the each SIZ cell.
The flow splitting pits will use an orifice to direct 3.3 L/s into each SIZ cell, and a weir to direct the remaining flows on to the next SIZ cell. The use of a weir will ensure that water builds up some head above the orifice to drive flows through this opening. A conceptual configuration is shown in Figure 25. The orifices have been sized using the orifice equation:
Ao = Qdes / (B*Cd*(√2gh))
Assume B = 1 (no blockage); Cd = 0.6 (orifice coefficient); g = 9.81 (acceleration due to gravity); h = 0.1 m (depth of water above the centroid of the orifice)
Ao = 0.0033 / (1.0 x 0.6 x √(2 x 9,81 x 0.1))
Ao = 0.004 m2
A circular orifice with a 71 mm diameter will provide the desired flowrate.
The weirs have been sized using the weir equation. At the first pit, 6.67 L/s needs to pass over the weir:
L = Qdes / (B*Cw*h3/2
)
Assume B = 1 (no blockage); Cw = 1.66 (weir coefficient); h = 0.05 m (depth of water above the crest of the weir)
L = 6.67 / (1.0 x 1.66 x 0.051.5
)
L = 0.36 m

Page 67
Figure Figure Figure Figure 25252525: Conceptual diagram of a flow splitting pit: Conceptual diagram of a flow splitting pit: Conceptual diagram of a flow splitting pit: Conceptual diagram of a flow splitting pit
Each flow splitting pit needs to be approximately 450 mm x 450 mm to accommodate the arrangement shown in Figure 25.
Macrophyte zone edge design for safetyMacrophyte zone edge design for safetyMacrophyte zone edge design for safetyMacrophyte zone edge design for safety
The proposed edge design will involve a gradual slope into the edge of the wetland, to avoid the need for fencing. The proposed edge design is shown in Figure 26. it includes a 1 in 5 slope down to 7.4 m AHD (0.6 m below the normal wet season water level), with a 2.4 m wide safety bench at a slope of 1 in 8, just below the normal wet season water level. The edges will also be heavily vegetated to discourage access.
Figure Figure Figure Figure 26262626: Macrophyte zone edge design for safety: Macrophyte zone edge design for safety: Macrophyte zone edge design for safety: Macrophyte zone edge design for safety
Step 5: Design Macrophyte Zone OutletStep 5: Design Macrophyte Zone OutletStep 5: Design Macrophyte Zone OutletStep 5: Design Macrophyte Zone Outlet
Riser oRiser oRiser oRiser outletutletutletutlet
A notional detention time of 72 hours is adopted for the extended detention. This will be achieved with the use of a riser style outlet that has multiple orifices, set at different levels. The intention is to provide for as consistent a detention time as possible regardless of the water depth in the macrophyte zone.
Weir crest
90 mm outlet pipe with 71 mm circular orifice at inlet
Peak water level
To SIZ
150ø pipe behind weir
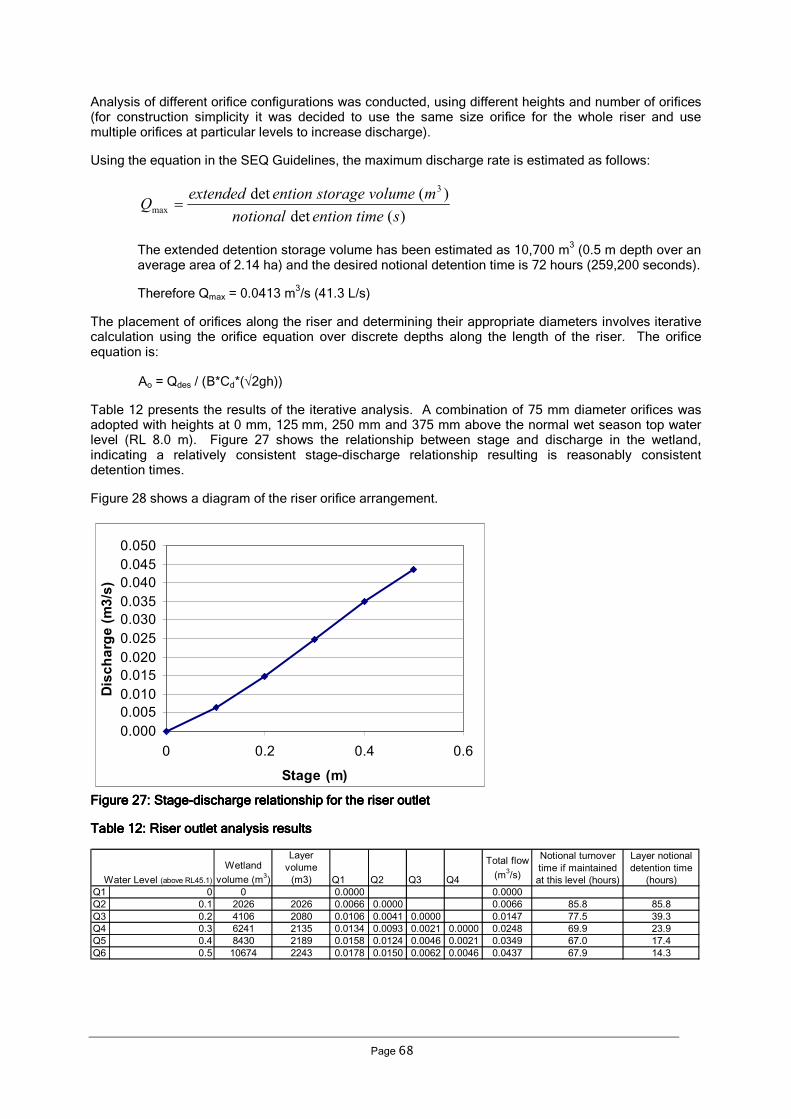
Page 68
Analysis of different orifice configurations was conducted, using different heights and number of orifices (for construction simplicity it was decided to use the same size orifice for the whole riser and use multiple orifices at particular levels to increase discharge).
Using the equation in the SEQ Guidelines, the maximum discharge rate is estimated as follows:
)(det
)(det 3
maxstimeentionnotional
mvolumestorageentionextendedQ =
The extended detention storage volume has been estimated as 10,700 m3 (0.5 m depth over an
average area of 2.14 ha) and the desired notional detention time is 72 hours (259,200 seconds).
Therefore Qmax = 0.0413 m3/s (41.3 L/s)
The placement of orifices along the riser and determining their appropriate diameters involves iterative calculation using the orifice equation over discrete depths along the length of the riser. The orifice equation is:
Ao = Qdes / (B*Cd*(√2gh))
Table 12 presents the results of the iterative analysis. A combination of 75 mm diameter orifices was adopted with heights at 0 mm, 125 mm, 250 mm and 375 mm above the normal wet season top water level (RL 8.0 m). Figure 27 shows the relationship between stage and discharge in the wetland, indicating a relatively consistent stage-discharge relationship resulting is reasonably consistent detention times.
Figure 28 shows a diagram of the riser orifice arrangement.
0.000
0.005
0.010
0.015
0.020
0.025
0.030
0.035
0.040
0.045
0.050
0 0.2 0.4 0.6
Stage (m)
Discharg
e (m3/s)
FiguFiguFiguFigure re re re 27272727: : : : StageStageStageStage----discharge relationship for the riser outletdischarge relationship for the riser outletdischarge relationship for the riser outletdischarge relationship for the riser outlet
Table Table Table Table 12121212: Riser outlet : Riser outlet : Riser outlet : Riser outlet analysis resultsanalysis resultsanalysis resultsanalysis results
Wetland
volume (m3)
Layer
volume
(m3) Q1 Q2 Q3 Q4
Total flow
(m3/s)
Notional turnover
time if maintained
at this level (hours)
Layer notional
detention time
(hours)
Q1 0 0 0.0000 0.0000
Q2 0.1 2026 2026 0.0066 0.0000 0.0066 85.8 85.8
Q3 0.2 4106 2080 0.0106 0.0041 0.0000 0.0147 77.5 39.3
Q4 0.3 6241 2135 0.0134 0.0093 0.0021 0.0000 0.0248 69.9 23.9
Q5 0.4 8430 2189 0.0158 0.0124 0.0046 0.0021 0.0349 67.0 17.4
Q6 0.5 10674 2243 0.0178 0.0150 0.0062 0.0046 0.0437 67.9 14.3
Water Level (above RL45.1)

Page 69
RL 8.0
RL 8.5
RL 8.375
RL 8.25
RL 8.125
Figure Figure Figure Figure 28282828: : : : Macrophyte zone outlet riser orifice arrangement Macrophyte zone outlet riser orifice arrangement Macrophyte zone outlet riser orifice arrangement Macrophyte zone outlet riser orifice arrangement
The riser system has a maximum discharge rate of 43.7 L/s when water level is at RL 8.50 m to transfer flows out of the wetland.
Flow will be transferred to the riser pit via a 300 mm diameter pipe that takes water from below the normal water level in the second deep pool. The submerged intake reduces the likelihood of floating debris from blocking the riser holes. This configuration is shown in
Figure Figure Figure Figure 29292929: Outlet pit configuration : Outlet pit configuration : Outlet pit configuration : Outlet pit configuration
Maintenance drainsMaintenance drainsMaintenance drainsMaintenance drains
It is proposed that the riser outlet be designed with a removable weir plate, so that when the weir plate is removed, the water levels in the wetland can be drawn down to the normal wet season water level.
If the outlet pit is also configured with a penstock and low-level maintenance outlet, it can also be used to drain the wetland for maintenance. A connection would need to be made to each of the deep pools and each of the SIZ cells.
The mean flow rate to draw down the macrophyte zone over a notional 12 hour period is as follows:
Total volume (up to normal wet season water level = 18,860 m3 (estimated from design
contours)
Q = 18,860/(12 x 3.6) = 437 L/s
The size of the maintenance drain can be established using Manning’s equation, assuming the pipe is flowing full (but not under pressure) and at 0.5 % grade:
Q = (1/n).A.R2/3
.S1/2
6.0
8.8
8.5
pipe outlet
Riser – see detail for exact configuration
Grated lid for access
8.0
Sealed lid
300ø pipe inlet from SMZ 6.5
7.0
Page 70
Where n = Manning’s n, 0.012 for a concrete pipe; A = cross-sectional area of pipe (m2); R = hydraulic radius (m); S = slope
A 575 mm pipe will allow an estimated flowrate of 420 L/s and the wetland can be drained in approximately 12.5 hours.
The size of the valve can be established using the orifice equation, assuming the orifice operates under inlet control:
Ao = Qdes / (B*Cd*(√2gh))
Where B = 1 (no blockage); Q = 0.42 m3/s; Cd = 0.6 (orifice coefficient); g = 9.81 (acceleration
due to gravity); h = 0.67 m (one third of the depth in the deep pools)
Ao = 0.42 / (1.0 x 0.6 x √(2 x 9.81 x 0.67))
Ao = 0.193 m2
This corresponds to an orifice diameter of 496 mm.
Discharge pipeDischarge pipeDischarge pipeDischarge pipe
The discharge pipe of the wetland conveys needs to have sufficient capacity to convey the larger of the discharges from the riser (43.7 L/s) or the maintenance drain (420 L/s). Considering the maintenance drain flow is the larger of the two flows the discharge pipe size is set to the size of the maintenance drain (575 mm pipe at 0.5% as calculated above).
Step 6: Design High Flow Bypass ChannelStep 6: Design High Flow Bypass ChannelStep 6: Design High Flow Bypass ChannelStep 6: Design High Flow Bypass Channel
For the Elrundie Avenue wetland, the bypass channel is an existing drainage line. This drainage line was modelled in HEC-RAS to check its capacity to accept bypass flows without scour and erosion.
Step 7: Verification ChecksStep 7: Verification ChecksStep 7: Verification ChecksStep 7: Verification Checks
Macrophyte zone resuspension protectionMacrophyte zone resuspension protectionMacrophyte zone resuspension protectionMacrophyte zone resuspension protection
A velocity check is conducted for the situation when the water level is at the top of the extended detention and the riser is operating at design capacity. This check is to ensure velocities through the macrophyte zone are less than 0.05 m/s to avoid potential scour of biofilms from the wetland plants (macrophytes) and resuspension of the sediments. A simple average velocity is used:
V = Q/A
Where Q = maximum flow through the riser outlet (43.7 L/s) and A = minimum wetland cross-sectional area, as measured to the top of the extended detention).
The minimum cross-sectional area of the wetland will be across the bunds. Each bund was checked and the smallest cross-sectional area is across the first bund: 53 m width x 0.5 m depth = 26.5 m
2.
Therefore the maximum velocity is 0.0016 m/s, which is substantially less than 0.05.
Peak overland flowsPeak overland flowsPeak overland flowsPeak overland flows
An overland flowpath was identified that passes through the bushland upstream of the Elrundie wetland and would deliver overland flows directly into the wetland in major storm events (when the capacity of the development’s minor drainage system is exceeded).
Downstream of this flowpath, culverts under Elrundie Avenue have a nominated capacity of 6.8 m3/s.
Therefore it was identified that the wetland should be able to safely pass this design flow. The wetland has therefore been designed with its own spillway outlet with a capacity of 6.8 m
3/s. The spillway will be
located at a level of 8.5 m AHD (the top of the extended detention) and the embankments of the wetland

Page 71
will extend to 8.8 m AHD, so there will be a maximum head of 0.3 m at the spillway. The spillway was sized using the weir equation:
Q = C.L.H3/2
with C = 1.7 and H = available head above weir crest
6.8 = 1.7.L.(0.3)3/2
L = 24.3 m, which is the required length of spillway.
Above 6.8 m3/s, flows will back up behind Elrundie Avenue will inundate the area around the wetland,
slowing flow velocities.
Calculation summaryCalculation summaryCalculation summaryCalculation summary
The following table summarises the results of the design calculations. Note that the treatment performance for this wetland was not confirmed in MUSIC, as the wetland configuration is different to a typical temperate region constructed wetland. It is proposed to monitor pollutant loads in and out of this wetland after construction and establishment.

Page 72
CONSTRUCTED WETLANDS DESIGN CALCULATION SUMMARY – DRAWIN REGION CALCULATION SUMMARY
Calculation Task Outcome Check
Catchment Characteristics
Catchment area 55 ha
Catchment land use (i.e residential, commercial etc.) Residential
Storm event entering inlet pond (minor or major) 5 year ARI
Conceptual Design
Macrophyte zone area 28,000 m2
Normal wet season water level in macrophyte zone 8.0 m AHD
Extended detention depth (0.25-0.75m) 0.5 m
Notional detention time 72 hrs
1 Confirm Treatment Performance of Concept Design
Total suspended solids (Figure 17) 72 % removal
Total phosphorus (Figure 17) 58 % removal
Total nitrogen (Figure 17) 42 % removal
2 Determine design flows
'Design operation flow' 4.0 m3/s
'Above design flow' 10.5 m3/s
3 Design inlet zone
Refer to sedimentation basin (Section 5.3) for detailed check sheet
Is a GPT required? Yes
Suitable GPT selected and maintenance considered? Yes
Inlet zone size
Target Sediment Size for Inlet Zone 125 µm
Capture efficiency 90 %
Inlet zone area (Figure 4.2 in Chapter 4) 900 m2
Suitable volume for sediment storage? Yes
Inlet zone connection to macrophyte zone
Overflow pit crest level 9.5 m AHD
Overflow pit dimension 3.4 x 3.4 L x W
Provision of debris trap no
Connection pipe dimension 1250 mm diam
Connection pipe invert level 7.5 m AHD
High flow by-pass weir
Weir Length 18 m
High flow by-pass weir crest level (top of extended detention) 10.0 m AHD
4 Designing the macrophyte zone
Area of Macrophyte Zone 20,340 m2
Aspect Ratio 5:1 L:W
Hydraulic Efficiency 0.7-0.75
Flowrate for low-flow distribution system 10 L/s
5 Design macrophyte zone outlet
Riser outlet
Target maximum discharge (Qmax) 0.0413 m3/s
Uniform Detention Time Relationship for Riser Yes
Maintenance Drain
Maintenance drainage rate (drain over 12hrs) 0.437 m3/s
Diameter of maintenance drain pipe 575 mm
Diameter of maintenance drain valve 495 mm
Discharge Pipe
Diameter of discharge pipe 575 mm

Page 73
CONSTRUCTED WETLANDS DESIGN CALCULATION SUMMARY – DRAWIN REGION CALCULATION SUMMARY
Calculation Task Outcome Check
6 Design high flow by-pass 'channel'
Longitudinal slope %
Base width m
Batter slopes H:V
N/A – modeled in HEC-RAS
7 Verification checks
Macrophyte zone re-suspension protection Max. velocity = 0.0016 m/s
Peak overland flows through macrophyte zone 25 m weir proposed
Confirm treatment performance N/A

Page 74
5.5 Sand filters
While sand filters generally require higher maintenance than vegetated stormwater treatment measures, and do not achieve equivalent water quality outcomes, they are relatively insensitive to seasonal changes. Therefore they could play a useful role in stormwater treatment in the Darwin Region.
As sand filters do not rely on vegetation as part of the treatment process, sand filter design methodology is largely transferable from one region to another. Therefore this section provides some brief points particularly relevant to the Darwin Region, but in general the methodology in the SEQ Guidelines is directly applicable to the Darwin Region.
5.5.1 Introduction and design considerations
The design of sand filters in the Darwin Region should follow the same principles and methodology to their design elsewhere. The SEQ Guidelines cover sand filters in Chapter 8. In that document, the Introduction and Design Considerations are all relevant in the Darwin Region, with the following to be noted:
• A wet sedimentation chamber is only suitable if it can be drained/pumped out at the start of each dry season. If wet material is retained for a long period without additional inflow, it will become stagnant and anaerobic.
• Maintenance activities will be concentrated in the wet season.
5.5.2 Design process
The same design steps should be followed in Darwin as in SEQ, however local performance curves and other design parameters are provided here for the Darwin Region.
Performance curvesPerformance curvesPerformance curvesPerformance curves
Sand filter performance curves for the Darwin Region are shown in Figure 30 Note that the SEQ Guidelines included three separate figures for total suspended solids, total phosphorus and total nitrogen, however in Figure 18 these are all presented on the same chart. The assumptions used to produce these performance curves were:
• 0.2 m extended detention
• 0.6 m filter depth
• 3,600 mm/hr saturated hydraulic conductivity
• 1 mm median particle diameter
• The upstream catchment is a typical residential area, with an overall impervious fraction of approximately 50%
If the sand filter being designed differs substantially from these assumptions, then it is recommended that MUSIC be used to check the performance.
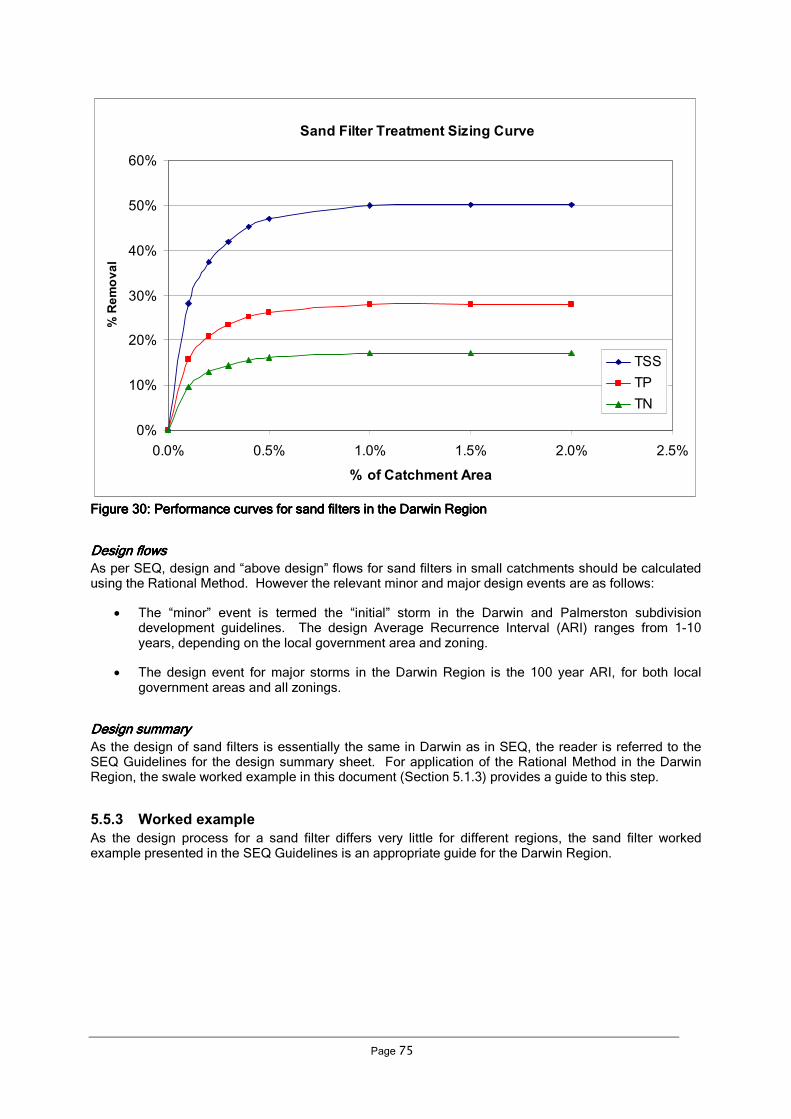
Page 75
Sand Filter Treatment Sizing Curve
0%
10%
20%
30%
40%
50%
60%
0.0% 0.5% 1.0% 1.5% 2.0% 2.5%
% of Catchment Area
% Removal
TSS
TP
TN
Figure Figure Figure Figure 30303030: : : : Performance curves for sand filPerformance curves for sand filPerformance curves for sand filPerformance curves for sand filters inters inters inters in the Darwin Region the Darwin Region the Darwin Region the Darwin Region
Design flowsDesign flowsDesign flowsDesign flows
As per SEQ, design and “above design” flows for sand filters in small catchments should be calculated using the Rational Method. However the relevant minor and major design events are as follows:
• The “minor” event is termed the “initial” storm in the Darwin and Palmerston subdivision development guidelines. The design Average Recurrence Interval (ARI) ranges from 1-10 years, depending on the local government area and zoning.
• The design event for major storms in the Darwin Region is the 100 year ARI, for both local government areas and all zonings.
Design Design Design Design summarysummarysummarysummary
As the design of sand filters is essentially the same in Darwin as in SEQ, the reader is referred to the SEQ Guidelines for the design summary sheet. For application of the Rational Method in the Darwin Region, the swale worked example in this document (Section 5.1.3) provides a guide to this step.
5.5.3 Worked example
As the design process for a sand filter differs very little for different regions, the sand filter worked example presented in the SEQ Guidelines is an appropriate guide for the Darwin Region.

Page 76
5.6 Infiltration measures
In the Darwin Region, infiltration is already practised in existing development. Many roofs don’t have gutters, and like the house pictured in Figure 31, gravel areas located where roof runoff hits the ground promote infiltration.
Figure Figure Figure Figure 31313131: Darwin house with a gravel infiltration area : Darwin house with a gravel infiltration area : Darwin house with a gravel infiltration area : Darwin house with a gravel infiltration area
Larger scale infiltration systems are also likely to be appropriate in the Darwin Region, particularly where there is an objective to reduce surface runoff and increase groundwater recharge.
5.6.1 Introduction and design considerations
The design of infiltration system in the Darwin Region should follow the same principles and methodology to their design elsewhere. The SEQ Guidelines cover infiltration systems in Chapter 7. In that document, the Introduction and Design Considerations are all relevant in the Darwin Region, with the following to be noted:
• Hydrologic effectiveness curves for the Darwin Region are included in Section 5.6.2 of this document, and should be used instead of the curves in Section 7.3.6.1 of the SEQ Guidelines.
• In the Northern Territory, the Water Act provides for the investigation, allocation, use, control, protection, management and administration of water resources, including groundwater. The Act requires that any installation for the purposes of increasing the water contained in an aquifer requires a licence. The principle outlined in the SEQ Guidelines, that there should be no deterioration in groundwater quality, is equally applicable to infiltration in Darwin.
• The Darwin Region experiences a high seasonal variation in groundwater levels, and it is important to consider the peak wet season groundwater level when considering the location of infiltration measures.

Page 77
Figure 32 shows geomorphic units of the Darwin Region. This provides an indication of areas where infiltration is likely to be suitable. Within the plateaux and dissected upland and foothill areas, infiltration may be suitable. In other areas, infiltration is not likely to be appropriate.
Figure Figure Figure Figure 32323232: Geomorphic uni: Geomorphic uni: Geomorphic uni: Geomorphic units of the Darwin Region (from Haig and Townsend 2003)ts of the Darwin Region (from Haig and Townsend 2003)ts of the Darwin Region (from Haig and Townsend 2003)ts of the Darwin Region (from Haig and Townsend 2003)
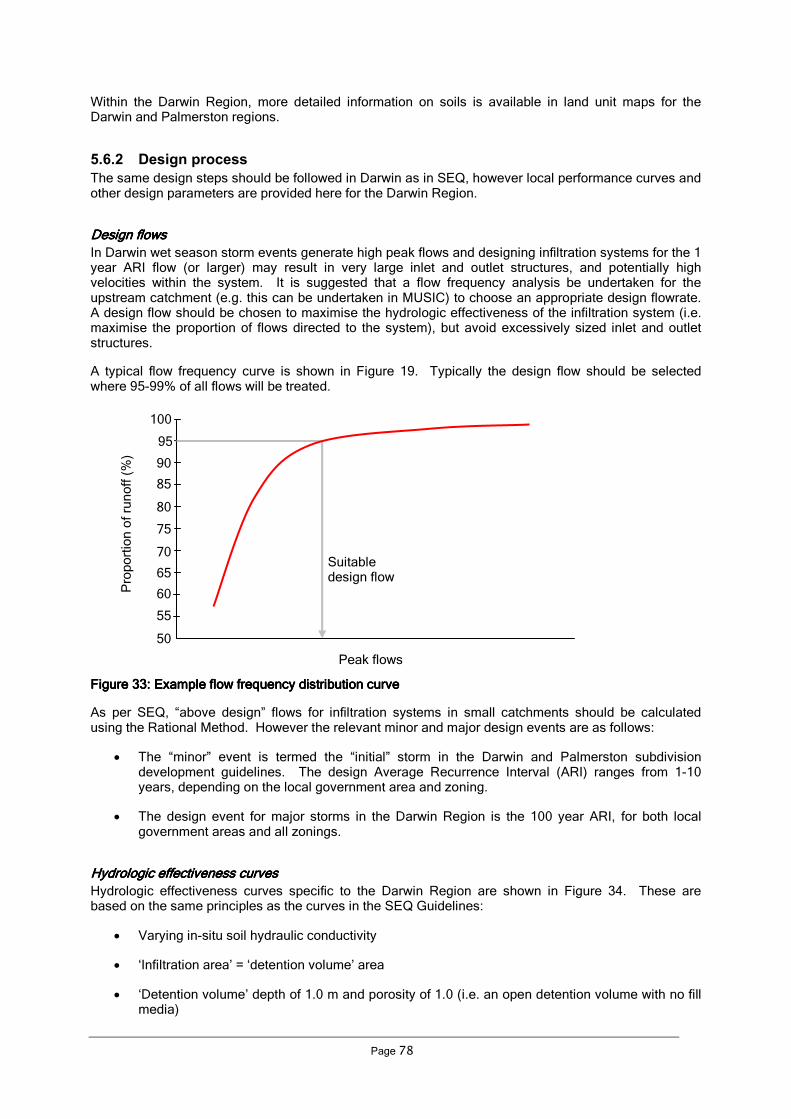
Page 78
Within the Darwin Region, more detailed information on soils is available in land unit maps for the Darwin and Palmerston regions.
5.6.2 Design process
The same design steps should be followed in Darwin as in SEQ, however local performance curves and other design parameters are provided here for the Darwin Region.
Design flowsDesign flowsDesign flowsDesign flows
In Darwin wet season storm events generate high peak flows and designing infiltration systems for the 1 year ARI flow (or larger) may result in very large inlet and outlet structures, and potentially high velocities within the system. It is suggested that a flow frequency analysis be undertaken for the upstream catchment (e.g. this can be undertaken in MUSIC) to choose an appropriate design flowrate. A design flow should be chosen to maximise the hydrologic effectiveness of the infiltration system (i.e. maximise the proportion of flows directed to the system), but avoid excessively sized inlet and outlet structures.
A typical flow frequency curve is shown in Figure 19. Typically the design flow should be selected where 95-99% of all flows will be treated.
Figure Figure Figure Figure 33333333: Example flow frequency distribution cu: Example flow frequency distribution cu: Example flow frequency distribution cu: Example flow frequency distribution curverververve
As per SEQ, “above design” flows for infiltration systems in small catchments should be calculated using the Rational Method. However the relevant minor and major design events are as follows:
• The “minor” event is termed the “initial” storm in the Darwin and Palmerston subdivision development guidelines. The design Average Recurrence Interval (ARI) ranges from 1-10 years, depending on the local government area and zoning.
• The design event for major storms in the Darwin Region is the 100 year ARI, for both local government areas and all zonings.
Hydrologic effectiveness curvesHydrologic effectiveness curvesHydrologic effectiveness curvesHydrologic effectiveness curves
Hydrologic effectiveness curves specific to the Darwin Region are shown in Figure 34. These are based on the same principles as the curves in the SEQ Guidelines:
• Varying in-situ soil hydraulic conductivity
• ‘Infiltration area’ = ‘detention volume’ area
• ‘Detention volume’ depth of 1.0 m and porosity of 1.0 (i.e. an open detention volume with no fill media)
Pro
po
rtio
n o
f ru
no
ff (
%)
95
90
85
80
75
70
65
60
55
50
100
Peak flows
Suitable design flow
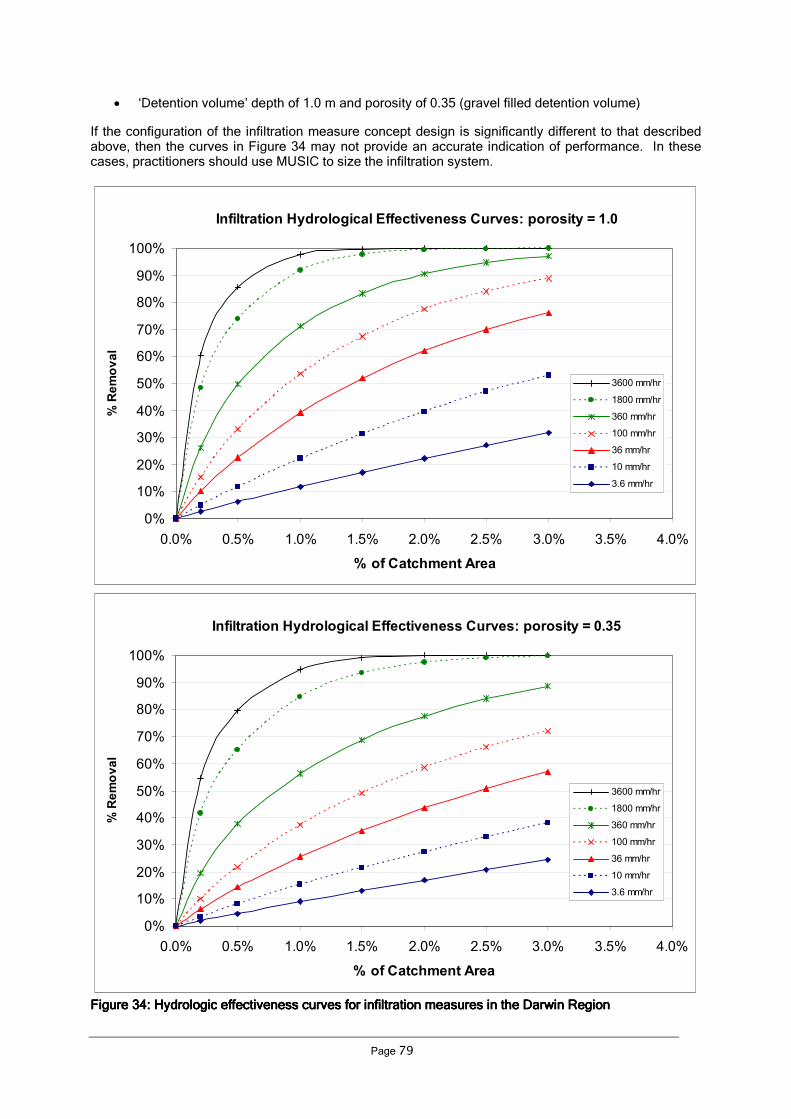
Page 79
• ‘Detention volume’ depth of 1.0 m and porosity of 0.35 (gravel filled detention volume)
If the configuration of the infiltration measure concept design is significantly different to that described above, then the curves in Figure 34 may not provide an accurate indication of performance. In these cases, practitioners should use MUSIC to size the infiltration system.
Infiltration Hydrological Effectiveness Curves: porosity = 1.0
0%
10%
20%
30%
40%
50%
60%
70%
80%
90%
100%
0.0% 0.5% 1.0% 1.5% 2.0% 2.5% 3.0% 3.5% 4.0%
% of Catchment Area
% R
emoval
3600 mm/hr
1800 mm/hr
360 mm/hr
100 mm/hr
36 mm/hr
10 mm/hr
3.6 mm/hr
Infiltration Hydrological Effectiveness Curves: porosity = 0.35
0%
10%
20%
30%
40%
50%
60%
70%
80%
90%
100%
0.0% 0.5% 1.0% 1.5% 2.0% 2.5% 3.0% 3.5% 4.0%
% of Catchment Area
% R
emoval
3600 mm/hr
1800 mm/hr
360 mm/hr
100 mm/hr
36 mm/hr
10 mm/hr
3.6 mm/hr
Figure Figure Figure Figure 34343434: Hydrologic effectiveness curves for infiltration measures in the Darwin Region: Hydrologic effectiveness curves for infiltration measures in the Darwin Region: Hydrologic effectiveness curves for infiltration measures in the Darwin Region: Hydrologic effectiveness curves for infiltration measures in the Darwin Region

Page 80
Maintenance requiMaintenance requiMaintenance requiMaintenance requirementsrementsrementsrements
It is worthwhile considering maintenance requirements at the design stage, particularly access requirements. Further information is provided in Section 6 and in the Construction, Establishment, Asset Handover and Maintenance Guide.
Design Design Design Design summarysummarysummarysummary
As the design of infiltration systems is essentially the same in Darwin as in SEQ, the reader is referred to the SEQ Guidelines for the design summary sheet.
5.6.3 Worked example
As the design process for infiltration systems differs very little for different regions, the infiltration system worked example presented in the SEQ Guidelines is an appropriate guide for the Darwin Region. For application of the Rational Method in the Darwin Region, the swale worked example in this document (Section 5.1.3) provides a guide to this step.

Page 81
5.7 Aquifer storage and recovery
In the Darwin Region, there is potential for Aquifer Storage and Recovery (ASR) wherever there are aquifers underlying urban development. Groundwater is already used in urban areas in the Darwin Region for irrigation of parks and sports fields. Where groundwater extraction takes place, ASR can help ensure that extraction is sustainable, by replacing equivalent volumes in the aquifer.
Principal groundwater resources in the Darwin Region are shown in Figure 35.
Figure Figure Figure Figure 35353535: Groundwater occurrence in the Darwin Region (from Haig and Townsend 2003): Groundwater occurrence in the Darwin Region (from Haig and Townsend 2003): Groundwater occurrence in the Darwin Region (from Haig and Townsend 2003): Groundwater occurrence in the Darwin Region (from Haig and Townsend 2003)

Page 82
Whereas infiltration only has the capacity to recharge shallow groundwater reserves, ASR has the capacity to recharge deep groundwater reserves such as those shown in Figure 35.
The SEQ Guidelines include a brief introduction into ASR and the considerations required to assess feasibility. Most of this information is relevant in the Darwin Region. Approvals in Darwin would come under the Water Act and Water Regulations, administered by NRETAS. Approvals are required drill a groundwater investigation bore, construct an extraction bore, extract groundwater and undertake aquifer recharge.
Since the publication of the SEQ Guidelines, the National Water Commission has published an introductory document titled “Managed aquifer recharge: An Introduction” (Commonwealth of Australia 2009), and is also due to release a risk management guideline document: “Water recycling via managed aquifer recharge guidelines” (a draft version was published in 2008).

Page 83
6 DETAILED DESIGN
After completing design calculations outlined in Section 5, several other steps are required to complete the design process.
• Ensure safety requirements are met
• Ensure the design minimises the risk of mosquito breeding
• Select vegetation for stormwater treatment systems
• Seek landscape design input
• Produce design drawings
• Plan for construction, establishment and ongoing maintenance
Advice on each of these steps is included in the following sections.
6.1 Safety
WSUD aims to protect the environmental assets of a site and its downstream environment, and enhance liveability through greater integration of built and natural features. This approach may introduce some risks to the urban environment that are greater than or different to those encountered in traditional land development practice. The more obvious of these risks relate to the presence of open water bodies and the introduction of streetscape elements that may alter lines of sight or other aspects of traffic safety.
Key safety considerations are:
• Crime Prevention Through Environmental Design (CPTED). Appendix A of the Palmerston Subdivision Guidelines outlines CPTED design principles. The next revision of the Darwin Subdivision and Development Guidelines is expected to include a similar section.
• Sightlines and other roads and traffic design requirements. These are outlined in the Darwin and Palmerston subdivision guidelines.
• Safe edges on open water bodies or areas of temporary ponding. The SEQ Guidelines refer to the Brisbane City Council “Sediment Basin Design, Construction and Maintenance Guidelines” (BCC 2001) for advice on safe edges for water bodies. In the absence of a local guideline, this information is useful in the Darwin Region.
• Flooding and drainage requirements, including safe depths and depth x velocity products in major storm events (as outlined in the Darwin and Palmerston subdivision guidelines).
The SEQ Guidelines include comments on various aspects of safety, however they are not intended to provide comprehensive advice on appropriate risk management strategies. Designers are responsible for providing an appropriate level of public safety in their designs and for ensuring that risk management procedures, in accordance with relevant standards and guidelines, are followed.
6.2 Mosquito management
The SEQ Guidelines (Section 6.2.8) set out the key principles associated with minimising mosquito breeding, which are applicable in all locations:
• Providing access for mosquito predators, such as fish and predatory insects, to all parts of the water body (avoid stagnant isolated areas of water).
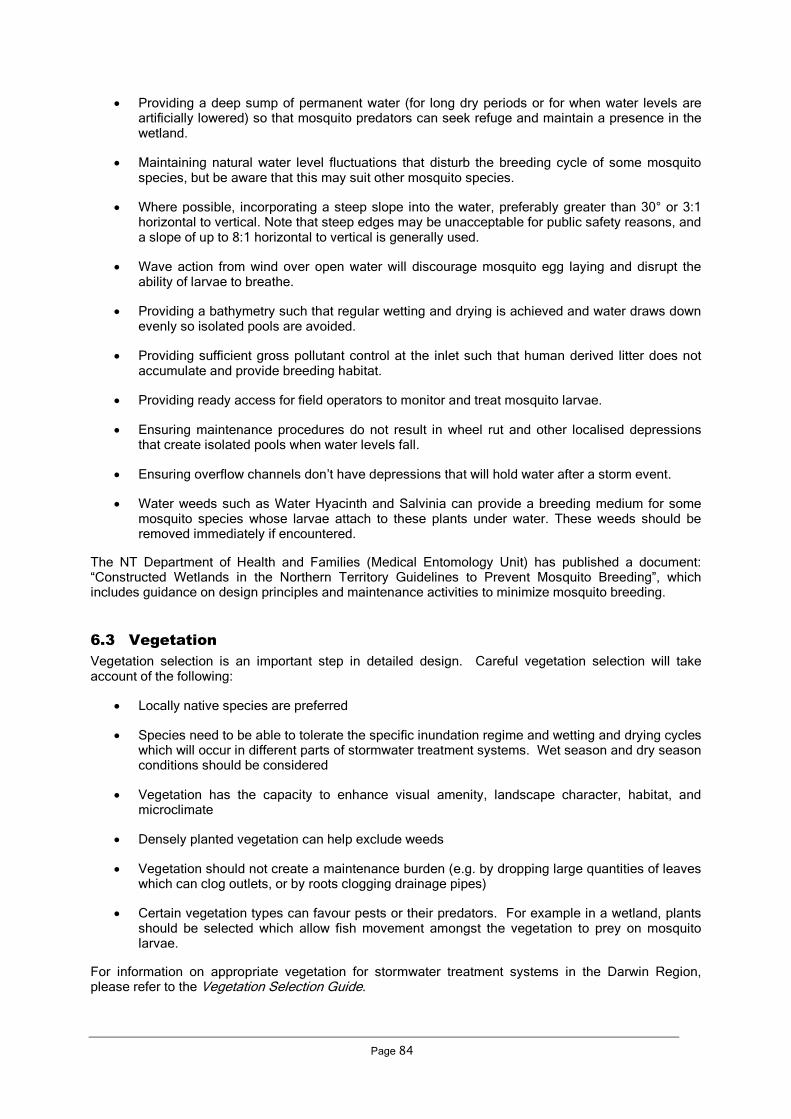
Page 84
• Providing a deep sump of permanent water (for long dry periods or for when water levels are artificially lowered) so that mosquito predators can seek refuge and maintain a presence in the wetland.
• Maintaining natural water level fluctuations that disturb the breeding cycle of some mosquito species, but be aware that this may suit other mosquito species.
• Where possible, incorporating a steep slope into the water, preferably greater than 30° or 3:1 horizontal to vertical. Note that steep edges may be unacceptable for public safety reasons, and a slope of up to 8:1 horizontal to vertical is generally used.
• Wave action from wind over open water will discourage mosquito egg laying and disrupt the ability of larvae to breathe.
• Providing a bathymetry such that regular wetting and drying is achieved and water draws down evenly so isolated pools are avoided.
• Providing sufficient gross pollutant control at the inlet such that human derived litter does not accumulate and provide breeding habitat.
• Providing ready access for field operators to monitor and treat mosquito larvae.
• Ensuring maintenance procedures do not result in wheel rut and other localised depressions that create isolated pools when water levels fall.
• Ensuring overflow channels don’t have depressions that will hold water after a storm event.
• Water weeds such as Water Hyacinth and Salvinia can provide a breeding medium for some mosquito species whose larvae attach to these plants under water. These weeds should be removed immediately if encountered.
The NT Department of Health and Families (Medical Entomology Unit) has published a document: “Constructed Wetlands in the Northern Territory Guidelines to Prevent Mosquito Breeding”, which includes guidance on design principles and maintenance activities to minimize mosquito breeding.
6.3 Vegetation
Vegetation selection is an important step in detailed design. Careful vegetation selection will take account of the following:
• Locally native species are preferred
• Species need to be able to tolerate the specific inundation regime and wetting and drying cycles which will occur in different parts of stormwater treatment systems. Wet season and dry season conditions should be considered
• Vegetation has the capacity to enhance visual amenity, landscape character, habitat, and microclimate
• Densely planted vegetation can help exclude weeds
• Vegetation should not create a maintenance burden (e.g. by dropping large quantities of leaves which can clog outlets, or by roots clogging drainage pipes)
• Certain vegetation types can favour pests or their predators. For example in a wetland, plants should be selected which allow fish movement amongst the vegetation to prey on mosquito larvae.
For information on appropriate vegetation for stormwater treatment systems in the Darwin Region, please refer to the Vegetation Selection Guide.

Page 85
6.4 Landscape design
Water sensitive urban design is as much a landscape based solution as it is an engineering solution. WSUD can be successfully integrated into a landscape such that both the functional stormwater objectives and landscape aesthetics and amenity are achieved. WSUD can also enhance environmental, habitat, community and safety outcomes. Stormwater treatment systems are a potential place for community education (through signage and other interpretative elements). Landscape design has a key role in overcoming negative perceptions surrounding traditional stormwater drainage systems.
Landscape design of stormwater treatment systems should be based on the following key objectives:
• Integrated planning and design of stormwater treatment systems within the built and landscaped environments
• Ensure surface treatments for stormwater treatment systems address the stormwater quality objectives whilst enhancing the overall natural landscape
• Ensuring that the overall landscape design of stormwater treatment systems integrates with its host natural and/or built environment and complements the landscape design of adjacent treatment measures (e.g. constructed wetlands or bioretention basins)
• Addressing public safety issues by ensuring the landscape design and edge treatments restrict public access to open water zones and allow egress where appropriate
• Allow for Crime Prevention through Environmental Design (CPTED) principles to be incorporated into stormwater treatment system design and siting.
• Create landscape amenity opportunities that enhance the community and environmental needs such as shade, amenity, habitat creation, screening, visual aesthetics, character and place making
Careful site analysis and integrated design with engineers, landscape architects and urban designers will ensure that stormwater treatment systems meet functional and aesthetic outcomes. Stormwater treatment systems may be integrated into streetscapes, urban centres, parks and open space. Existing features such as slope, vegetation, waterways and soils need to be considered in planning layouts and locations when designing within constrained sites. Other factors like road layout, buildings, driveways and services can also affect layouts.
The SEQ Guidelines include ideas for landscape design associated with each stormwater treatment measure.
6.5 Standard drawings
Standard drawings for common stormwater treatment systems have been prepared for the Darwin Region. These include a grassed swale, bioretention basin, streetscape bioretention system and wetland.
6.6 Planning for construction, establishment and ongoing maintenance
At the design stage it is useful to consider how construction, establishment and ongoing maintenance will be undertaken, and include provision in the design for:
• A staged construction process, whereby stormwater treatment measures are first installed as sediment and erosion control measures while construction takes place in the catchment upstream, then later converted to vegetated stormwater treatment systems once development in the catchment is complete. This process is outlined in further detail in the Construction, Establishment, Asset Handover and Maintenance Guide.
• Access, particularly to areas which will require frequent maintenance

Page 86
• Short-term erosion and weed control during establishment – e.g. with biodegradable erosion control matting
• Irrigation and/or top up water supply, at least during the establishment phase
• Ability to drain areas of permanent/seasonally permanent water, so that water levels can be artificially controlled
• Sampling and monitoring points
During the design stage, it is also useful to consider sourcing vegetation and soils for stormwater treatment systems. It may take several months for nurseries to propagate sufficient plants of the right species, and it is worthwhile considering whether in-situ soils may be suitable (as-is or amended) for use in proposed stormwater treatment systems).

Page 87
7 CHECKING TOOLS
Design checklists from the SEQ Guidelines have been modified for the Darwin Region for the following stormwater treatment elements:
• Swales
• Bioretention systems
• Sedimentation basins
• Constructed wetlands
For sand filters and infiltration measures, the design checklists in the SEQ Guidelines are appropriate for the Darwin Region.
The checklists are provided on the following pages. The checklists present the key design features that are to be reviewed when assessing the design of stormwater treatment systems. These considerations include configuration, safety, maintenance and operational issues that need to be addressed during the design phase. Where an item receives an ‘N’ from the review process, referral should be made back to the design procedure to determine the impact of the omission or error.
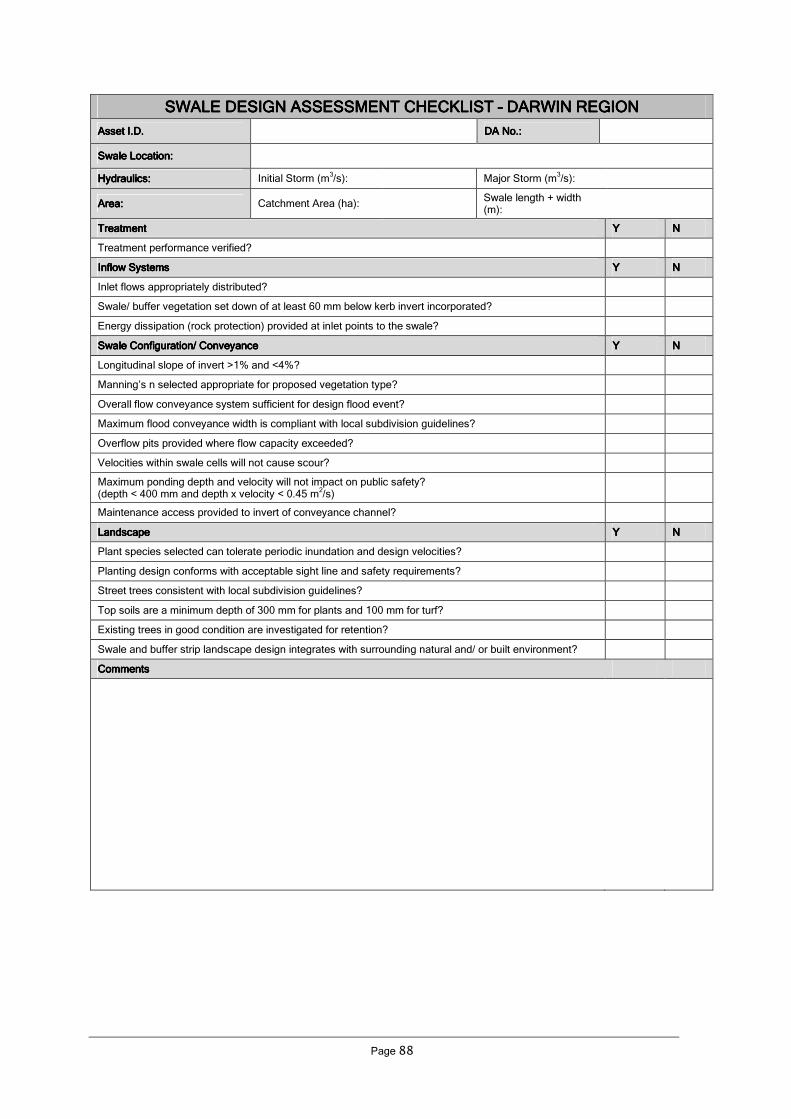
Page 88
SWALE DESIGN ASSESSMENTSWALE DESIGN ASSESSMENTSWALE DESIGN ASSESSMENTSWALE DESIGN ASSESSMENT CHECKLIST CHECKLIST CHECKLIST CHECKLIST –––– DARWIN REGION DARWIN REGION DARWIN REGION DARWIN REGION
Asset I.D.Asset I.D.Asset I.D.Asset I.D. DA No.:DA No.:DA No.:DA No.:
Swale Location:Swale Location:Swale Location:Swale Location:
Hydraulics:Hydraulics:Hydraulics:Hydraulics: Initial Storm (m3/s): Major Storm (m
3/s):
Area:Area:Area:Area: Catchment Area (ha): Swale length + width (m):
Treatment Treatment Treatment Treatment YYYY NNNN
Treatment performance verified?
Inflow Systems Inflow Systems Inflow Systems Inflow Systems YYYY NNNN
Inlet flows appropriately distributed?
Swale/ buffer vegetation set down of at least 60 mm below kerb invert incorporated?
Energy dissipation (rock protection) provided at inlet points to the swale?
Swale Configuration/ ConveyanceSwale Configuration/ ConveyanceSwale Configuration/ ConveyanceSwale Configuration/ Conveyance YYYY NNNN
Longitudinal slope of invert >1% and <4%?
Manning’s n selected appropriate for proposed vegetation type?
Overall flow conveyance system sufficient for design flood event?
Maximum flood conveyance width is compliant with local subdivision guidelines?
Overflow pits provided where flow capacity exceeded?
Velocities within swale cells will not cause scour?
Maximum ponding depth and velocity will not impact on public safety? (depth < 400 mm and depth x velocity < 0.45 m
2/s)
Maintenance access provided to invert of conveyance channel?
LandscapeLandscapeLandscapeLandscape YYYY NNNN
Plant species selected can tolerate periodic inundation and design velocities?
Planting design conforms with acceptable sight line and safety requirements?
Street trees consistent with local subdivision guidelines?
Top soils are a minimum depth of 300 mm for plants and 100 mm for turf?
Existing trees in good condition are investigated for retention?
Swale and buffer strip landscape design integrates with surrounding natural and/ or built environment?
CommentsCommentsCommentsComments

Page 89
BIORETENTION SYSTEM DESIGN ASSESSMENT CHECKLIST BIORETENTION SYSTEM DESIGN ASSESSMENT CHECKLIST BIORETENTION SYSTEM DESIGN ASSESSMENT CHECKLIST BIORETENTION SYSTEM DESIGN ASSESSMENT CHECKLIST –––– DARWIN REGION DARWIN REGION DARWIN REGION DARWIN REGION
Asset I.D.Asset I.D.Asset I.D.Asset I.D. DA No.DA No.DA No.DA No.
Basin Location:Basin Location:Basin Location:Basin Location:
Hydraulics:Hydraulics:Hydraulics:Hydraulics: Initial Storm (m3/s): Major Storm (m
3/s):
Area:Area:Area:Area: Catchment Area (ha): Bioretention Area (m2):
TreatmentTreatmentTreatmentTreatment YYYY NNNN
Treatment performance verified from curves?
Bioretention Media and Drainage SystemsBioretention Media and Drainage SystemsBioretention Media and Drainage SystemsBioretention Media and Drainage Systems YYYY NNNN
Design documents bioretention area and extended detention depth as defined by treatment performance requirements?
Overall flow conveyance system sufficient for design flood event(s)?
Where required, bypass sufficient for conveyance of design flood event?
Where required scour protection provided at inflow point to bioretention?
Specifications for filter, transition and drainage layers consistent with FAWB bioretention media specifications?
Perforated pipe capacity > infiltration capacity of filter media?
Liner provided to prevent infiltration (if required)?
Will wet season groundwater levels interact with bioretention system?
Collection pipes extended to surface to allow inspection and flushing?
*Overflow pit has set down of at least 50mm below kerb invert? (where conventional gully/lintel used downstream of bioretention then no overflow pit required)
Surface FinishesSurface FinishesSurface FinishesSurface Finishes YYYY NNNN
Bioretention area and extended detention depth documented to satisfy treatment requirements?
Overflow pit crest set at top of extended detention?
Maximum ponding depth will not impact on public safety?
Maintenance access provided to surface of bioretention system (for larger systems)?
Protection from coarse sediments provided (where required) with a sediment forebay?
Protection from gross pollutants provided (where required)?
LandscapeLandscapeLandscapeLandscape YYYY NNNN
Plant species selected can tolerate extended dry periods, periodic inundation and design velocities?
Provision for dry season irrigation or water storage in saturated zone?
Bioretention design and plant species selected integrate with surrounding landscape or built environment design?
Planting design conforms with acceptable sight line and safety requirements?
CommentsCommentsCommentsComments
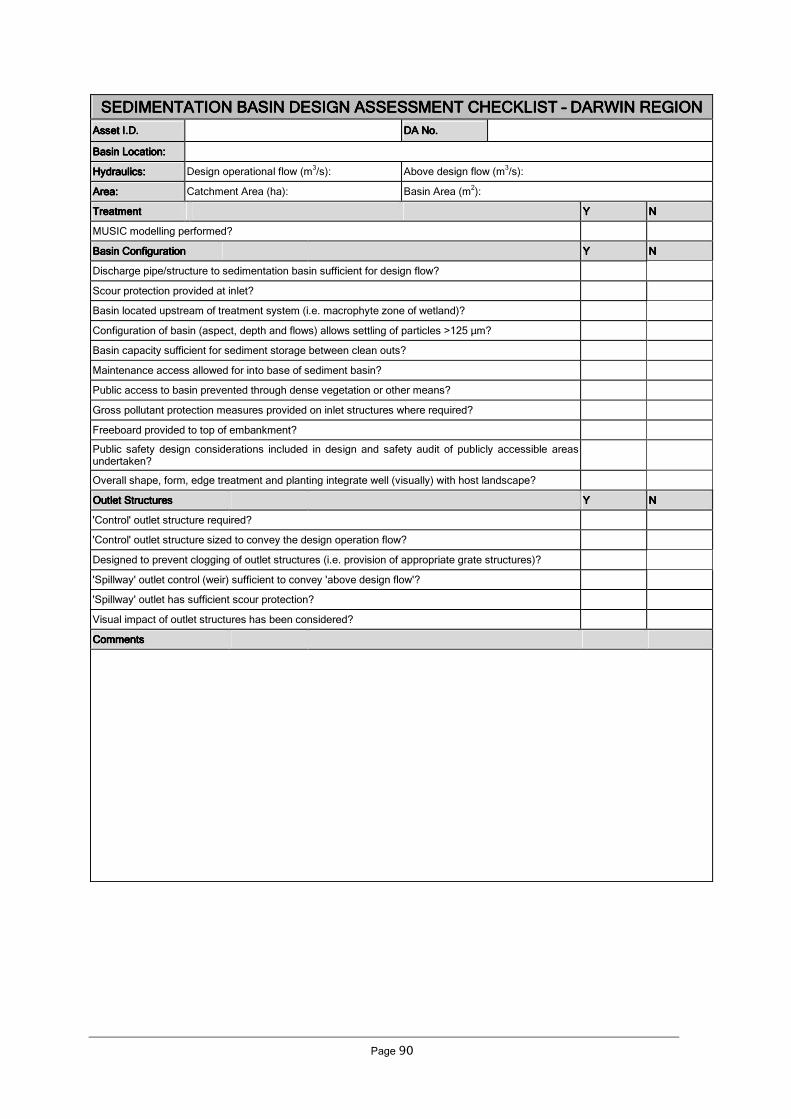
Page 90
SEDIMENTATION BASIN DESIGN ASSESSMENT CHECKLISTSEDIMENTATION BASIN DESIGN ASSESSMENT CHECKLISTSEDIMENTATION BASIN DESIGN ASSESSMENT CHECKLISTSEDIMENTATION BASIN DESIGN ASSESSMENT CHECKLIST –––– DARWIN REGION DARWIN REGION DARWIN REGION DARWIN REGION
Asset I.D.Asset I.D.Asset I.D.Asset I.D. DA No.DA No.DA No.DA No.
Basin Location:Basin Location:Basin Location:Basin Location:
Hydraulics:Hydraulics:Hydraulics:Hydraulics: Design operational flow (m3/s): Above design flow (m
3/s):
Area:Area:Area:Area: Catchment Area (ha): Basin Area (m2):
TreatmentTreatmentTreatmentTreatment YYYY NNNN
MUSIC modelling performed?
Basin ConfigurationBasin ConfigurationBasin ConfigurationBasin Configuration YYYY NNNN
Discharge pipe/structure to sedimentation basin sufficient for design flow?
Scour protection provided at inlet?
Basin located upstream of treatment system (i.e. macrophyte zone of wetland)?
Configuration of basin (aspect, depth and flows) allows settling of particles >125 µm?
Basin capacity sufficient for sediment storage between clean outs?
Maintenance access allowed for into base of sediment basin?
Public access to basin prevented through dense vegetation or other means?
Gross pollutant protection measures provided on inlet structures where required?
Freeboard provided to top of embankment?
Public safety design considerations included in design and safety audit of publicly accessible areas undertaken?
Overall shape, form, edge treatment and planting integrate well (visually) with host landscape?
Outlet StructuresOutlet StructuresOutlet StructuresOutlet Structures YYYY NNNN
'Control' outlet structure required?
'Control' outlet structure sized to convey the design operation flow?
Designed to prevent clogging of outlet structures (i.e. provision of appropriate grate structures)?
'Spillway' outlet control (weir) sufficient to convey 'above design flow'?
'Spillway' outlet has sufficient scour protection?
Visual impact of outlet structures has been considered?
CommentsCommentsCommentsComments

Page 91
WETLAND DESIGN ASSESSMENT CHECKLISTWETLAND DESIGN ASSESSMENT CHECKLISTWETLAND DESIGN ASSESSMENT CHECKLISTWETLAND DESIGN ASSESSMENT CHECKLIST –––– DARWIN REGION DARWIN REGION DARWIN REGION DARWIN REGION
Asset I.D.Asset I.D.Asset I.D.Asset I.D. DA No.DA No.DA No.DA No.
Wetland Location:Wetland Location:Wetland Location:Wetland Location:
Hydraulics:Hydraulics:Hydraulics:Hydraulics: Design operational flow (m3/s): Above design flow (m
3/s):
Area:Area:Area:Area: Catchment Area (ha): Wetland Area (ha):
TreatmentTreatmentTreatmentTreatment YYYY NNNN
MUSIC modelling performed?
Inlet ZoneInlet ZoneInlet ZoneInlet Zone YYYY NNNN
Discharge pipe/structure to inlet zone sufficient for maximum design flow?
Scour protection provided at inlet for inflow velocities?
Configuration of inlet zone (aspect, depth and flows) allows settling of particles >125µm?
Bypass weir incorporated into inlet zone?
Bypass weir length sufficient to convey 'above design flow'?
Bypass weir crest at macrophyte zone top of extended detention depth?
Bypass channel has sufficient capacity to convey 'above design flow'?
Bypass channel has sufficient scour protection for design velocities?
Inlet zone connection to macrophyte zone overflow pit and connection pipe sized to convey the design operation flow?
Inlet zone connection to macrophyte zone allows energy dissipation?
Structure from inlet zone to macrophyte zone enables isolation of the macrophyte zone for maintenance?
Inlet zone normal wet season water level above macrophyte normal wet season water level?
Maintenance access allowed for into base of inlet zone?
Public safety design considerations included in inlet zone design?
Where required, gross pollutant protection measures provided on inlet structures (both inflows and to macrophyte zone)
Macrophyte ZoneMacrophyte ZoneMacrophyte ZoneMacrophyte Zone YYYY NNNN
Extended detention depth >0.25m and <0.75m?
Vegetation bands perpendicular to flow path?
Appropriate depth and configuration of seasonally inundated zone to maximize water retention at the end of the dry season and minimise the length of dry period?
Will deep pools retain water year-round to support mosquito predators?
Vegetation appropriate to inundation regime in each section of the wetland?
Aspect ratio provides hydraulic efficiency =>0.5?
Velocities from inlet zone <0.05 m/s or scouring protection provided?
Public safety design considerations included in macrophyte zone (i.e. batter slopes less than 5(H):1(V)?
Maintenance access provided into areas of the macrophyte zone (especially open water zones)?
Provision for overland flows?
Safety audit of publicly accessible areas undertaken?
Freeboard provided above extended detention depth to define embankments?
Outlet StructuresOutlet StructuresOutlet StructuresOutlet Structures YYYY NNNN
Riser outlet provided in macrophyte zone?
Notional detention time of 72 hours?
Orifice configuration allows for a linear storage-discharge relationship for full range of the extended detention depth?
Maintenance drain provided?
Discharge pipe has sufficient capacity to convey maximum of either the maintenance drain flows or riser pipe flows with scour protection?
Protection against clogging of orifice provided on outlet structure?
CommentsCommentsCommentsComments

Page 92
8 REFERENCES
City of Palmerston 2007 Palmerston Subdivisional Guidelines Revision 1, August 2007.
Commonwealth of Australia 2009 “Managed aquifer recharge: An Introduction” Published by the National Water Commission, Canberra.
Darwin City Council 2005 Subdivision and Development Guidelines September 2005.
Engineers Australia 2006 Australian Runoff Quality: A Guide to Water Sensitive Urban Design.
Institution of Engineers Australia 1987 Australian Rainfall and Runoff.
Institution of Engineers Australia, 2003, Australian Runoff Quality Guidelines, Draft, June 2003.
FAWB filter media specifications (March 2008)
Haig, T and Townsend, S 2003 “An understanding of the groundwater and surface water hydrology of the Darwin Harbour Plan of Management area” Proceedings of the Darwin Harbour Public Presentations - February 2003.
Moreton Bay Waterways and Catchments Partnership, 2006 WSUD Technical Design Guidelines for South East Queensland.
NT Department of Natural Resources, Environment, the Arts and Sport (NRETAS) 2008 “The Impact of Urban Land-use on Total Pollutant Loads Entering Darwin Harbour” Lizzy Skinner, Simon Townsend & Julia Fortune, Aquatic Health Unit Report 06/2008D.
Zinger, Y, Deletic, A and Fletcher, T D 2007 “The effect of various intermittent dry-wet cycles on nitrogen removal capacity in biofilters systems” Rainwater and Urban Design 2007 Conference Proceedings, 21-23 August 2007, Sydney Australia.