Embed Size (px)
Citation preview
1
Water scarcity and droughts
Antonino Cancelliere
Department of Civil and Environmental Engineering
University of Catania, Italy
www.dica.unict.it/users/acance
HYDROLOGY
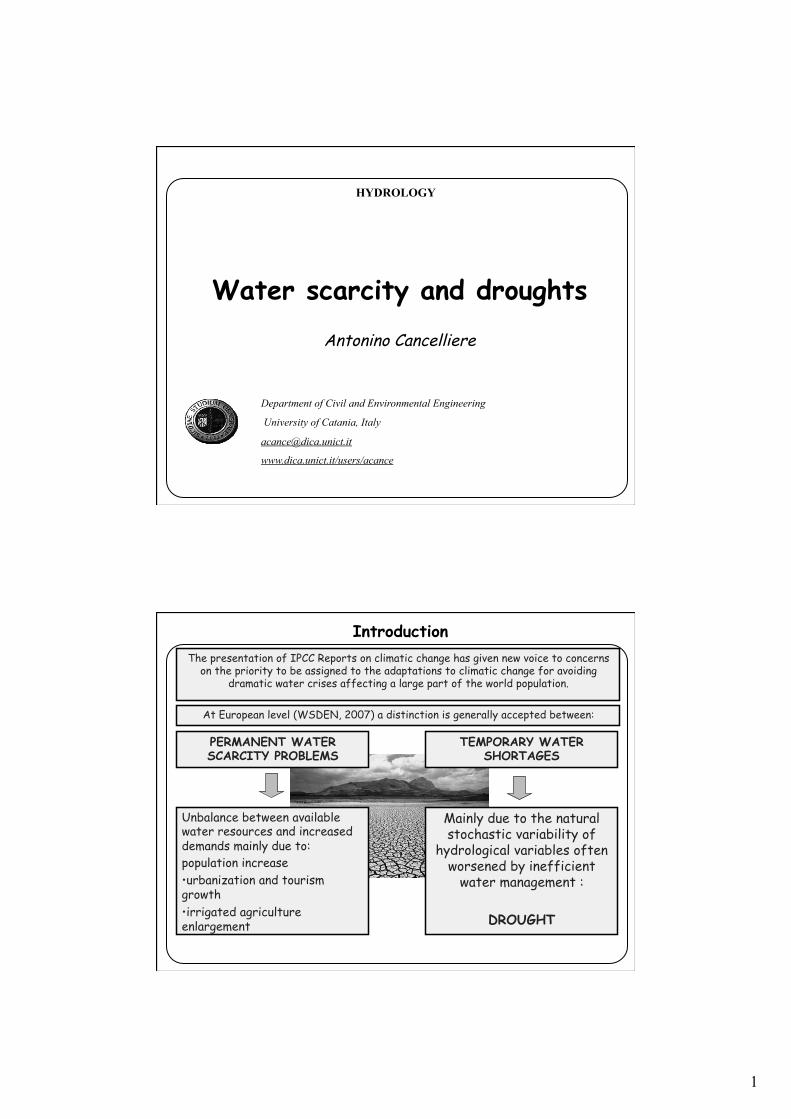
The presentation of IPCC Reports on climatic change has given new voice to concerns on the priority to be assigned to the adaptations to climatic change for avoiding
dramatic water crises affecting a large part of the world population.
At European level (WSDEN, 2007) a distinction is generally accepted between:
Mainly due to the natural stochastic variability of
hydrological variables often worsened by inefficient
water management :
DROUGHT
Unbalance between available water resources and increased demands mainly due to: population increase • urbanization and tourism growth • irrigated agriculture enlargement
PERMANENT WATER SCARCITY PROBLEMS
TEMPORARY WATER SHORTAGES
Introduction

2
WATER SHORTAGE
WATER STRESS DESERTIFICATION Anthropic
DROUGHT ARIDITY Natural
Temporary Permanent
Includes natural as well as man induced phenomena
Water scarcity
Water scarcity
• Average per capita available water is often used as a water scarcity indicator
• Commonly, 2000 m3/person/year is the threshold for water stress, 1000 for water scarcity
• Many countries experience less than 500 m3/person year of available water
• Such indicator can sometimes be misleading – Renewable vs. non conventional waters – Presence of irrigation – Large spatial variability
3
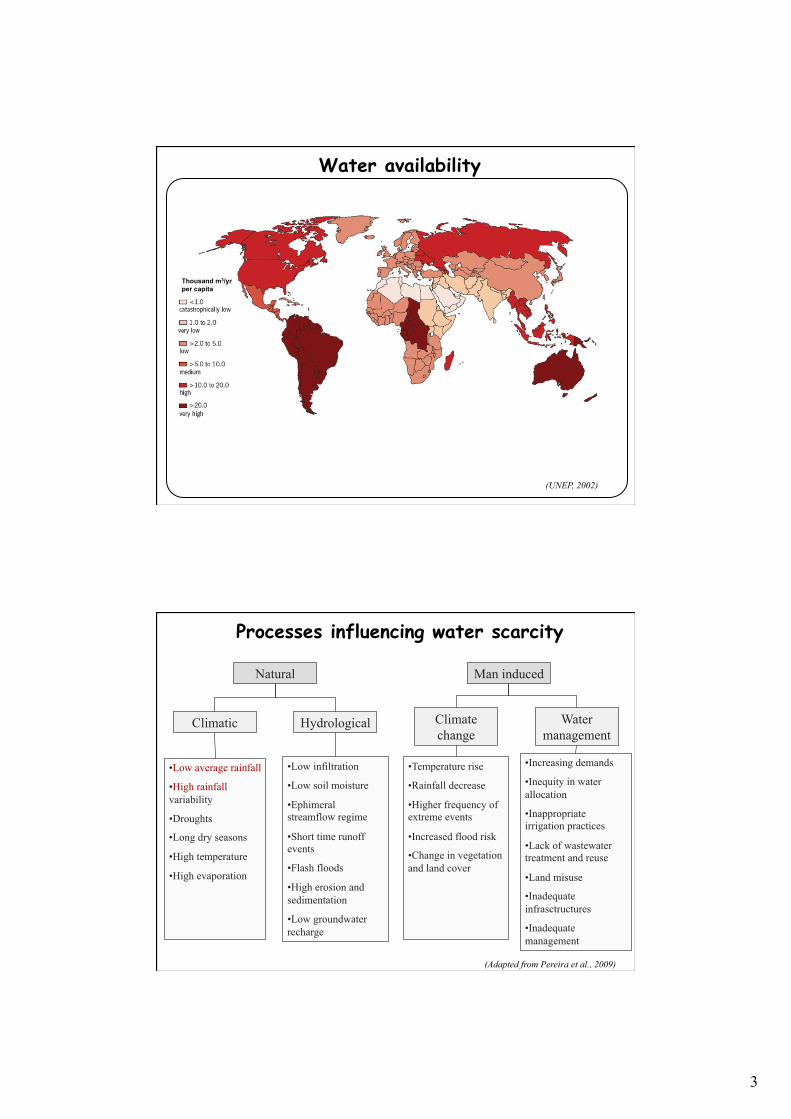
Water availability
(UNEP, 2002)
Thousand m3/yr per capita
Processes influencing water scarcity
Natural Man induced
Climatic Hydrological
• Low average rainfall
• High rainfall variability
• Droughts
• Long dry seasons
• High temperature
• High evaporation
• Low infiltration
• Low soil moisture
• Ephimeral streamflow regime
• Short time runoff events
• Flash floods
• High erosion and sedimentation
• Low groundwater recharge
Climate change
Water management
• Temperature rise
• Rainfall decrease
• Higher frequency of extreme events
• Increased flood risk
• Change in vegetation and land cover
• Increasing demands
• Inequity in water allocation
• Inappropriate irrigation practices
• Lack of wastewater treatment and reuse
• Land misuse
• Inadequate infrasctructures
• Inadequate management
(Adapted from Pereira et al., 2009)
4
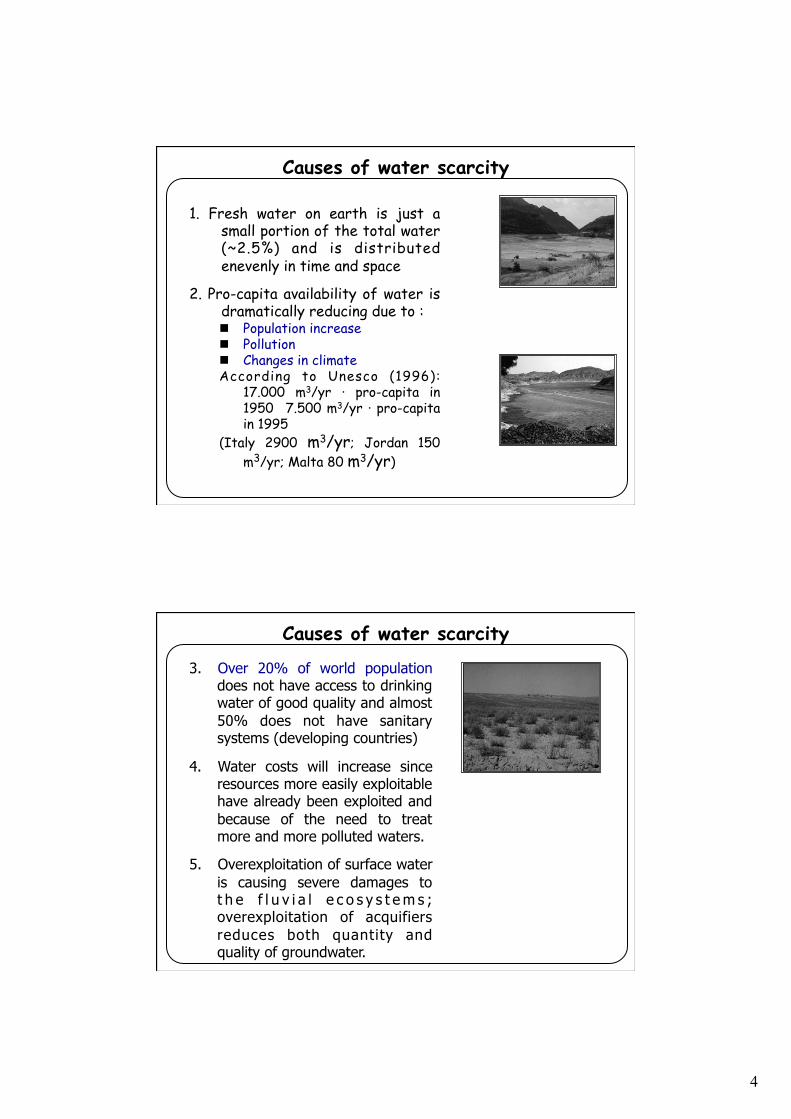
Causes of water scarcity
1. Fresh water on earth is just a small portion of the total water (~2.5%) and is distributed enevenly in time and space
2. Pro-capita availability of water is dramatically reducing due to : n Population increase n Pollution n Changes in climate According to Unesco (1996):
17.000 m3/yr · pro-capita in 1950 7.500 m3/yr · pro-capita in 1995
(Italy 2900 m3/yr; Jordan 150 m3/yr; Malta 80 m3/yr)
3. Over 20% of world population does not have access to drinking water of good quality and almost 50% does not have sanitary systems (developing countries)
4. Water costs will increase since resources more easily exploitable have already been exploited and because of the need to treat more and more polluted waters.
5. Overexploitation of surface water is causing severe damages to t h e f l u v i a l e c o s y s t e m s ; overexploitation of acquifiers reduces both quantity and quality of groundwater.
Causes of water scarcity

5
6. Many countries suffer from an inefficient and ineffective water resources management.
7. Access to water is not fully recognized as an universal right of men.
Causes of water scarcity

6
Trends in water resources management
Until a few decades ago: – To increase available resources to supply
increasing demands (hydraulics engineering)
Paradigm shift: – More emphasis on demand management and on a
more efficient and effective management of existing water supply systems
– Protection of ecosystems equilibrium also to pursue social equity and heritage from one generation to another (sustainable development)
Strategic proposals to fight water scarcity
Ø Desalination (municipal supply) Ø Increased costs Ø Difficult to apply for developing countries
Ø Wastewater reuse (irrigation supply) Ø Hygenic constraints and allocation of extra costs
Ø Increased efficiency in irrigation Ø Water saving Ø Water harvesting Ø Deficit irrigation Ø Virtual water trade
Ø Many virtual water importers among water rich countries Ø Many countries tend to guarantee food self sufficiency
Ø Use of green vs. blue water
High technology
Low technology

7
Virtual water content in beverages
(from Schreier, 2006)
Numbers are indicative and should be adjusted to local conditions
Drought definitions • Complex phenomenon, difficult to define • A comprehensive definition is difficult since it
depends on: – the component of hydrological cycle under investigation – the time scale – the way by which the deviation from the considered “normal
condition” is measured – the purpose of the analysis
• In general a distinction must be made between: – Meteorological drought – Agricultural drought – Hydrological drought – Water resources drought (operational) drought

8
Drought processes and definitions
Soil moisture deficit
Unsaturated soil storage
Unsaturated soil storage
Surface waterstorage
Surface waterstorage
Groundwaterstorage
Groundwaterstorage
Water supply systemsWater supply systems
Socio-economic systemsSocio-economic systems
Actions to increase water availability
Actions to increase water availability
Actions to reducewater demand
Actions to reducewater demand
Actions to mitigatedrought impacts
Actions to mitigatedrought impacts
Precipitation deficit
Precipitation deficit
Surface flow deficit
Groundwater deficit
Water supply shortage
Economic, social, environmental impacts
Economic, social, environmental impacts
Meteorological drought
Agriculturaldrought
Hydrologicaldrought
Water resourcedrought (operational)
Natural disasters
Floods31%
Storms33%
Droughts22%
Earthquakes10%
Others4%
Floods34%
Storms24%
Droughts35%
Earthquakes4%
Others3%
Damage
Affected people
Source: United Nations, 1994

9
Drought analysis
• Drought is caused by anomalies (deficits) of hydrological variables and/or water supply
• Anomalies: negative deviations (or departures) from “normal” conditions
• Drought indices attempts to measure and characterize in an objective and possibly standardized way such anomalies
Requisites of drought indices
• To be representative of the type of drought of interest (meteorological, agricultural, hydrological, etc.)
• To enable an assessment of the severity of an historical or ongoing drought
• Easyness of interpretation by non-specialists
• Standardization, to enable comparisons in time and space
• To be expressed in probabilistic terms

10
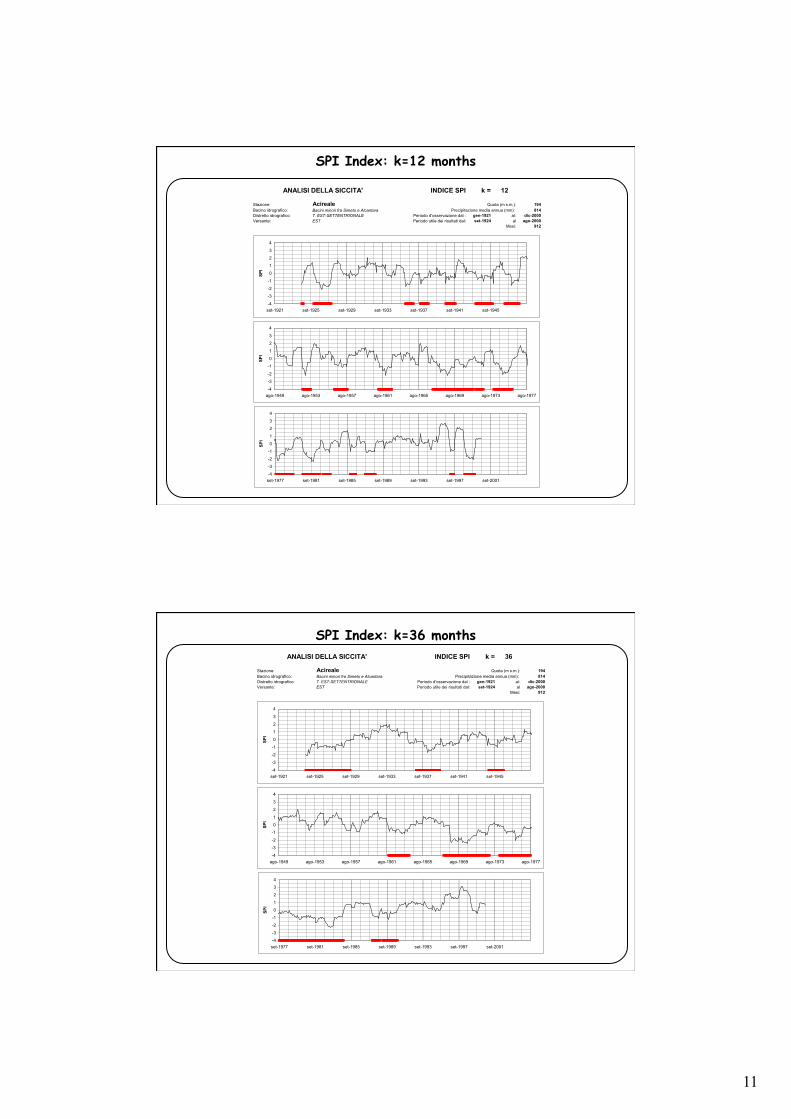
Standardized Precipitation Index • The index is based on the consideration that each component of water resources systems reacts to a deficit in precipitation over different time scales (McKee et al., 1993).
Ø e.g. soil moisture is affected by precipitation anomalies in very short time;
Ø while streamflow, stored volumes in reservoirs and groundwater are affected by deficit over a large time scale;
• The index is computed on cumulated values of precipitation over various time periods (k=3, 6, 9, 12, 24, 48 months). • First a probability distribution (generally a gamma function) is fitted to the frequency curve of cumulated precipitation over k months for each individual month (e.g. January, February, etc.) • Then the value of the standard normal variable corresponding to the computed probability for actual cumulated precipitation is adopted as SPI.
• SPI Standardized precipitation index (McKee et al, 1993) widely used for drought monitoring purposes
• Multiple time scales • Allows for comparison of
droughts conditions among different times, sites
Standardized Precipitation Index SPI Z Class ΔP (%)
Z ≥ 2.00 Extremely wet 2.2 1.50 ≤ Z < 2.00 Very wet 4.4
1.00 ≤ Z < 1.50 Moderately wet
9.1
-1.00 ≤ Z < 1.00 Near normal 68.6
-1.50 ≤ Z < -1.00 Moderately dry 9.1
-2.00 ≤ Z < -1.50 Z<-2.00
Severely dry Extremely dry
4.4
2.2
d)distributenormally is ionprecipitat aggregated ifexact (
roughly
,, k
kkk YZ
τ
ττντν σ
µ−=
11
SPI Index: k=12 months
ANALISI DELLA SICCITA' INDICE SPI k = 12
Stazione: Acireale Quota (m s.m.): 194Bacino idrografico: Precipitazione media annua (mm): 814Distretto idrografico: 7. EST-SETTENTRIONALE Periodo d'osservazione dal : gen-1921 al: dic-2000Versante: EST Periodo utile dei risultati dal: set-1924 al ago-2000
Mesi: 912
Bacini minori fra Simeto e Alcantara
-4
-3
-2
-1
0
1
2
3
4
set-1977 set-1981 set-1985 set-1989 set-1993 set-1997 set-2001
SPI
-4
-3
-2
-1
0
1
2
3
4
set-1921 set-1925 set-1929 set-1933 set-1937 set-1941 set-1945
SPI
-4
-3
-2
-1
0
1
2
3
4
ago-1949 ago-1953 ago-1957 ago-1961 ago-1965 ago-1969 ago-1973 ago-1977
SPI
SPI Index: k=36 months ANALISI DELLA SICCITA' INDICE SPI k = 36
Stazione: Acireale Quota (m s.m.): 194Bacino idrografico: Precipitazione media annua (mm): 814Distretto idrografico: 7. EST-SETTENTRIONALE Periodo d'osservazione dal : gen-1921 al: dic-2000Versante: EST Periodo utile dei risultati dal: set-1924 al ago-2000
Mesi: 912
Bacini minori fra Simeto e Alcantara
-4
-3
-2
-1
0
1
2
3
4
set-1977 set-1981 set-1985 set-1989 set-1993 set-1997 set-2001
SPI
-4
-3
-2
-1
0
1
2
3
4
set-1921 set-1925 set-1929 set-1933 set-1937 set-1941 set-1945
SPI
-4
-3
-2
-1
0
1
2
3
4
ago-1949 ago-1953 ago-1957 ago-1961 ago-1965 ago-1969 ago-1973 ago-1977
SPI

12
SPI index in Sicily: January 2002
SPI index in Sicily: January 2005

13
Historical series of SPI for different k (Acireale station)
SPI series in 43 precipitation stations in Sicily (k=12 months)

14
SPI series in 43 precipitation stations in Sicily (k=36 months)
SPI series in 43 precipitation stations in Sicily (k=36 months)
Piet Mondrian, Broadway Boogie Woogie, 1949

15
Role of drought monitoring for mitigation

16

17
Drought mitigation approach in ancient Greece
• Should a drought persist for a long time, and the seeds in the earth and the trees wither, then the priest of Lycaean Zeus, after praying towards the water and making the usual sacrifices, lowers an oak branch to the surface of the spring, not letting it sink deep. Pausanias, Description of Greece: book 8, chapter 38, section 4 [Arcadia]
• These asked for a cure for the drought, and were bidden by the Pythian priestess to go to Trophonius at Lebadeia and to discover the remedy from him. Pausanias, Description of Greece: book 9, chapter 40, section 1 [Boeotia]
Current reactive approach
Awareness
Panic (emergency)
Precipitation
Oblivion
Lack of precipitation
Drought

18
Proactive approach for drought mitigation
Long-term measures Short-term measures
S u p p l y increase
- New storage facilities - Water transfers and use exchange
- Non-conventional resources (wastewater, desalination)
- Use of marginal water sources
- Relaxing environmental constraints
- Improvement of efficiency
D e m a n d r e d u c t i o n , water saving
- Dual municipal distribution networks
- Water recycle in industries - Reduction of irrigation consumption (new crops and irrigation techniques)
- Restriction on municipal uses
- Restriction on annual crops
- Water saving campaigns - Mandatory rationing
I m p a c t minimisation
- Early warning system and drought contingency plan
- Quality-based reallocation of water resources
- Insurance and economic policies
- Temporary reallocation of resources
- Public aid and tax relief - Rehabilitation programs
Drought mitigation measures

19
Drought mitigation measures
Difficulties in planning a drought mitigation strategy (1/2)
• Inadequate understanding of natural drought phenomenon
• Low appreciation of a pro-active approach for
coping with natural hazards
• Difficulty in quantifying the impacts of drought on different sectors (economy, environment, society)
• Strong conflicts among different groups of
interest • Legal and institutional constraints on the
implementation of drought mitigation measures

20
Difficulties in planning a drought mitigation strategy (2/2)
• Inadequate development of tools aimed to assess the identified measures and to support the decision-making process;
• Lack of an early warning of water
deficiency based on monitoring of hydrometeorological variables and water availability
• Lack of a consolidated (horizontal)
coordination among water management agencies and of (vertical) communication among different decision levels.
Conclusions • Many countries in the world and in the Mediterranean basin
in particular suffer or will suffer in the future from water scarcity, due to increasing demands and reduced available water
• Measures to cope with permanent water scarcity should be tailored to the particular region/country/watershed, since they have a strong impact on the local economy, social life, culture.
• Droughts, despite being a natural feature of every climate, yet are one of the main causes of water scarcity
• An effective mitigation of droughts is possible, provided an accurate monitoring and forecasting is in effect, and appropriate measures are planned in advance according to a pro-active approach