Embed Size (px)
Citation preview

Water Sales Projections – Impact of Drought on
Revenues Board of Directors February 23, 2016

Overview
•Historical budget and actual water sales
•Current budget water sales
•Projected water sales reflecting impact of drought
•Review possible scenarios
2

Context
• District policy is to encourage water conservation with at least 70% of revenues coming from volume based rates
• FY16 conservation has been higher than assumed for Stage 4 drought
• Based on FY16/17 budget
– 1MGD of conservation ~ $2 million in revenue
3

151151154157160165171176182188
50
70
90
110
130
150
170
190
210
230
250
Mill
ion
Gal
lons
Per
Day
Fiscal Year
Prior Budgets
FY16 Budget Forward
Actual Consumption
Historical Budget and Actual Water Sales
8% 7% 5% 5% 5%
4

248.3 262.2 273.0 283.0 293.6
262.3 271.7 296.9 320.3 334.6 505.2
539.5 576.5
615.4 647.8
0
100
200
300
400
500
600
700
FY16 FY17 FY18 FY19 FY20
REVE
NU
ES/E
XPEN
SES
$M
FY16 5 YEAR FORECAST
O&M $M Debt Service Plus Coverage $M Total Revenues $M
8% 7% 5% 5% 5%
151 151 154 157 160
100
120
140
160
0
40
80
120
Wat
er S
ales
MG
D
RSF
BALA
NCE
$M
MGD Rate Stabilization Fund Balance $MRate Increase
$6.0M Shortfall

151151154157160165171176182188
133133137140143
50
70
90
110
130
150
170
190
210
230
250
Mill
ion G
allo
ns P
er D
ay
Fiscal Year
Prior Budgets
FY16 Budget Forward
Actual Consumption
FY16 UpdatedAssumption
Water Sales at 1978 Drought Levels with 1/3 Higher Population
8% 7% 5% 5% 5%
6

265.2 249.2 273.0 283.0 293.6
262.3 275.0 305.2
334.4 354.4 527.2 496.4
531.4 562.5
595.8
0.0
100.0
200.0
300.0
400.0
500.0
600.0
700.0
FY16 FY17 FY18 FY19 FY20
REVE
NU
ES/E
XPEN
SES
$M
FY16 5 YEAR FORECAST REVISED
O&M $M Debt Service Plus Coverage $M Total Revenues $M
$27.8M Shortfall
$52.2M Shortfall
$54.9M Shortfall $46.8M
Shortfall
RSF Balance $0M
8% 7% 5% 5% 5%
133 133 137 140 143
100
120
140
160
0
40
80
120
Wat
er S
ales
MG
D
RSF
BALA
NCE
$M
MGD Rate Stabilization Fund Balance $M
Debt Coverage Ratio Drops 1.44 1.36
Rate Increase
$0.2M Shortfall
+25% Surcharge

Possible Rate Forecast Scenarios
• FY17 – Control costs where possible
• FY18/19
– FY18/19 rate increase
– Reduce expenses
– Some combination of above
8

265.2 249.2 273.0 283.0 293.6
262.3 275.0 302.7 326.4 340.7
527.2 496.4
554.4
612.7 649.2
0.0
100.0
200.0
300.0
400.0
500.0
600.0
700.0
FY16 FY17 FY18 FY19 FY20
REVE
NU
ES/E
XPEN
SES
$M
REVALUATE FUTURE RATE INCREASES
O&M $M Debt Service Plus Coverage $M Total Revenues $M
$27.8M Shortfall
$21.3M Shortfall
8% 7% 10.5% 10.5% 5.0%
133 133 137 140 143
100
120
140
160
0
40
80
120
Wat
er S
ales
MG
D
RSF
BALA
NCE
$M
MGD Rate Stabilization Fund Balance $MRate Increase
$0.2M Shortfall
+25% Surcharge

265.19 249.2 258.0 268.0 278.6
262.3 275.0 297.6 317.2 327.5 527.2
496.4 546.0
594.1 629.5
0
100
200
300
400
500
600
700
FY16 FY17 FY18 FY19 FY20
REVE
NU
ES/E
XPEN
SES
$M
REDUCE EXPENDITURES
O&M $M Debt Service Plus Coverage $M Total Revenues $M
$27.8M Shortfall
$9.6M Shortfall $0.2M
Shortfall
8% 7% 8.5% 8.5% 5.0%
133 133 137 140 143
100
120
140
160
0
40
80
120
Wat
er S
ales
MG
D
RSF
BALA
NCE
$M
MGD Rate Stabilization Fund Balance $MRate Increase
+25% Surcharge

Staged System of Drought Surcharges Added to Normal Rates
11
Stage 0 1 2 3 4
Demand Reduction
Voluntary 0-15%
Voluntary 0-15%
Mandatory 15%
Mandatory 20%
Supplemental Supplies
Up to 35,000 acre feet
35,000-65,000 acre feet
> 65,000 acre feet
Rates and Charges
Normal rates
Normal rates
Normal rates
+ 8%
Normal rates
+ 20%
Supersaver
recognition*
Excessive use penalty*
Normal rates
+ 25%
Supersaver
recognition*
Excessive use penalty*
*Supersaver recognition and excessive use penalty not subject to Prop 218 requirements.

265.19 249.2 273.0 283.0 293.6
262.3 272.9 300.7 324.7 339.1
527.2 515.4 553.3
610.3 646.7
0
100
200
300
400
500
600
700
FY16 FY17 FY18 FY19 FY20
REVE
NU
ES/E
XPEN
SES
$M
OTHER: EXAMPLE FY17 STAGE 2 DROUGHT SURCHARGE WITH 8%
O&M $M Debt Service Plus Coverage $M Total Revenues $M
$6.7M Shortfall
$20.4M Shortfall
WITH FY17 STAGE 2
$0.2M Shortfall
8% 7% 10.25% 10.25% 5.0%
133 133 137 140 143
100
120
140
160
0
40
80
120
Wat
er S
ales
MG
D
RSF
BALA
NCE
$M
MGD Rate Stabilization Fund Balance $MRate Increase
+8% Surcharge
+25% Surcharge

What About Wastewater?
• Last year’s wastewater 5-year forecast showed 5% annual increases until FY20 where it dropped to 4%
• The updated forecast reflects:
– slight reductions in treatment revenue resulting from water conservation; and
– increases in food waste program capital costs
13

64.39 70.7 73.4 75.9 78.6
46.5 47.8 51.1 52.0 53.6
123.0 124.5 130.4 132.9 138.6
0
25
50
75
100
125
150
175
200
FY16 FY17 FY18 FY19 FY20
REVE
NU
ES/E
XPEN
SES
$M
WASTEWATER FY16 5 YEAR FORECAST REVISED ASSUMPTION
O&M $M Debt Service Plus Coverage $M Total Revenues $M
5% 5% 5% 5% 4% 0
40
80
120
CASH
BAL
ANCE
$M
Reserve BalanceRate Increase

Next Steps
15
•Decision on Drought Management Program - April
• Provide update in FY17 Budget and Rates Workshop - May
• FY18/19 Budget Workshop ~ January 2017

16
Board Discussion

Mokelumne Aqueducts Delta Tunnel Study
Mokelumne Aqueducts Delta Tunnel Study
Board Meeting
February 23, 2016

Agenda
• Background– Existing conditions– Subsidence, isolator issues– Flood hazards– Seismic hazards
• Strategy to Address Various Issues– Near-term– Long-term
• Phase I study proposed for award today
2

3
Existing Conditions
3
[Photo: 2004 Jones Tract levee failure, submerging aqueducts]Below Sea LevelBelow Sea Level-30-30 -20-20 -10-10 -5-5
- 20 ft.
- 5 ft.
- 15 ft.
-25 ft

4
Existing Conditions
4
CRESTEL +10.0
HIGH TIDEWSEL +6.0
EL -10.0
LEVEE FILL
DENSE SAND
LOOSE SAND
PEAT / ORGANICS EL -20.0
EL -50.0
TYPICAL LEVEE CROSS-SECTION

Temperature Anchor Subsidence
Ref Planning Committee August 10, 2010 5

Aqueduct No. 1 Temperature Anchor at Station 2580
Deflected blowoff pipe
Anchor structure settled 8.4”
Cracked concrete
6

Aqueduct No. 1 Temperature Anchor at Station 2480
Retaining wall installed in 1970s
Anchor structuresettled 10.8”
Concrete anchor
7

Temperature Anchor Settlement at Station 2480
Adjacent bent to anchor
Crushed timber saddle
Separation between aqueduct and anchor structure
8

Timber Pile Under Anchor at Station 2480
Cavity in pile Buckled pile top
Pile cap
9

Aqueduct No. 3 Isolator Issues
Isolators were installed in the early 2000’s
In 2009, two isolators, SN231 and SN247, were observed as having deformed and debonded from mounting plates
348 isolators total
10

Aqueduct No. 3
Separation between isolation bearing rubber and mounting plate
11

12
Levee Overtopping
12
100 Year Flood Map [FEMA]

13
Scour (from levee failures)
13
Jones Tract Levee Failure, 2004
Scour Hole 2004
• 2,000 feet long
• 80 feet deep
• 80 feet is below Aqueducts pile tip elevations
Not the first or last levee failure; same levee failed in 1992

14
Flooding (submerged Aqueducts)
• Wave action
• Floating debris
• Buoyancy
• Corrosion
14
[Photo: 2004 Jones Tract levee failure, submerged aqueducts]

1
Ground Shaking₋ Seismic sources
• Blind thrust faults in Delta
₋ Local site conditions• Depth to hard rock• Variations in surficial
geologic units
₋ Basin effects• Increase in amplitude and
duration of long-period motions
Ground Deformation₋ Southern Midland fault
Liquefaction₋ Depth and extent
Seismic Hazards

Overview Map
Debonded isolatorsSettled anchor at
Station 2580Settled anchor at
Station 2480
Supportconnection
failure
16

The Strategy
• Plan completed by EBMUD in 2007: Strategy for Protecting Aqueducts in the Delta (SPAD)
• SPAD was instrumental in garnering $45M in grant funding for near-term work:– Levee enhancements (completed)
– Interconnections (completed)
• Other near-term work completed in the interim:– Major study performed on Mok #3 isolators, 2011-13
– Fixes made to two temp anchors in 2011-12, surveillance established, additional anchor ID’d June 2012
• SPAD also laid out longer-term plan
17

Near-term Mitigation:Levee Enhancement
• EBMUD has assisted the Reclamation Districts to upgrade levees at a cost of approximately $35 million.
• The Reclamation Districts have constructed substantial levee enhancements meeting PL84-99 standards.
18
• Upgrading to PL84-99 standards reduces risk of overtopping failures and is important for qualifying for emergency funds following a levee failure.
• Despite improvements, the levees remain vulnerable to earthquake risk due to the underlying foundation materials.
19
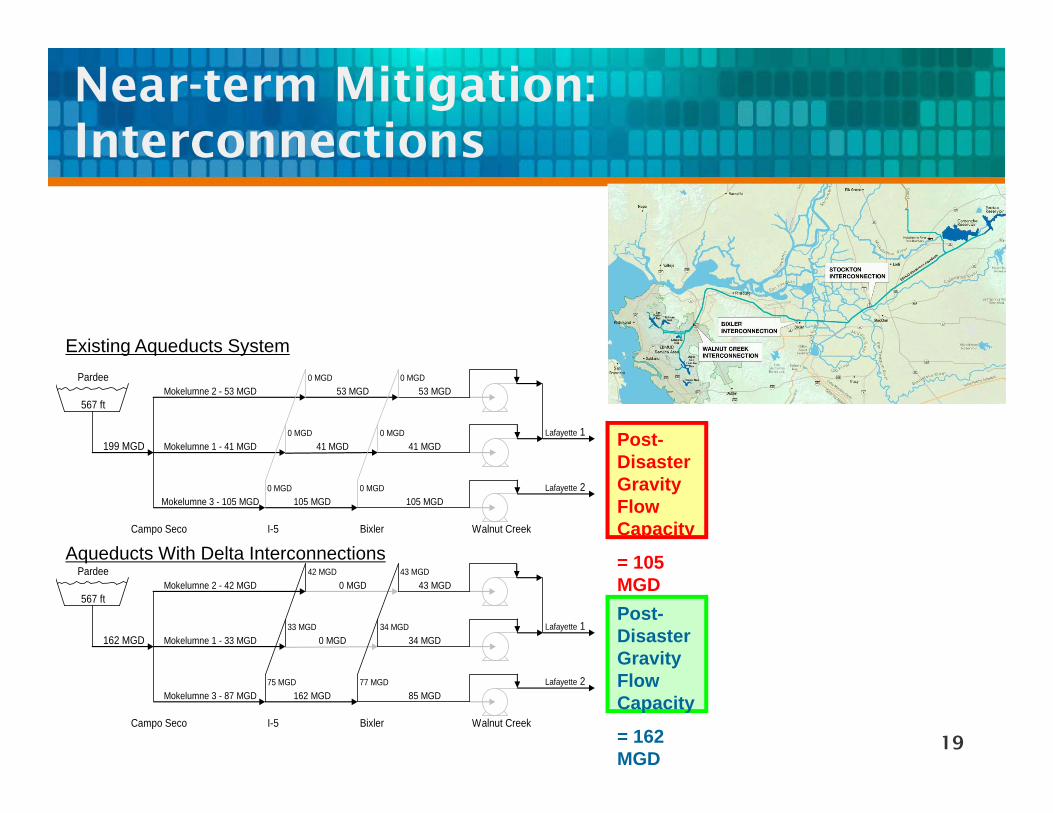
Near-term Mitigation:Interconnections
0 MGDMokelumne 2 - 53 MGD
Lafayette 1Mokelumne 1 - 41 MGD
Lafayette 2Mokelumne 3 - 105 MGD
Campo Seco
0 MGD
0 MGD 0 MGD
Walnut Creek
199 MGD
Bixler
41 MGD
105 MGD
Pardee
567 ft
I-5
41 MGD
105 MGD0 MGD 0 MGD
53 MGD53 MGD
42 MGDMokelumne 2 - 42 MGD
Lafayette 1Mokelumne 1 - 33 MGD
Lafayette 2Mokelumne 3 - 87 MGD
Campo Seco
43 MGD
33 MGD 34 MGD
Walnut Creek
162 MGD
Bixler
34 MGD
85 MGD
Pardee
567 ft
I-5
0 MGD
162 MGD75 MGD 77 MGD
43 MGD0 MGD
Post-Disaster Gravity Flow Capacity
= 105 MGDPost-Disaster Gravity Flow Capacity
= 162 MGD
Existing Aqueducts System
Aqueducts With Delta Interconnections

20
Near-term Mitigation:Temperature Anchor Replacements

Recommended Long-Term Strategy
Tunnel Below Delta
• Mitigates all hazards
• Maintains full supply after hazard events
• High benefit to cost ratio
Presentation SPAD Study Board Meeting October 23, 2007
21

22
EBMUD “Delta Tunnel” Concept (2007)
22
Mokelumne Aqueducts Delta Tunnel Concept• +/- 20 feet diameter bore• +/- 16 miles long• Greater than 80 feet deep

Basic Approach to Tunnel Recommended in SPAD
• Plan for the tunnel as the best long option
• Timing of construction not specified
• In the interim, complete engineering studies to:
– Refine and validate concepts
– Reduce risk to water supply disruption by shaving years off critical-path schedule
23

BDCP Tunnels
• Initial BDCP concepts favored open channel, tunnel alternatives added circa 2008
• 2013 BDCP EIR’s alternative 4A, twin tunnels crossing Mok Aqueduct right of way, was the preferred alternative
• In response, EBMUD analyzed BDCP tunnel impacts in early 2014 to provide comments by July 2014
• July 2015 “WaterFix” EIR refined twin tunnels somewhat
24

2525
WaterFixTwin Tunnels Preliminary Design:• 40 foot diameter gravity flow tunnels• 34.5 miles long across the Delta• Greater than 100 feet deep
BDCP Tunnels
BDCP Tunnels Crossing Location
Mokelumne Aqueducts & Delta Tunnel
BDCP Tunnel Conflict with Mokelumne Aqueducts

Conceptual Design of EBMUD Tunnel
26

Delta Tunnel Timeline
27
2004 Middle River levee fails and submerges the Mokelumne Aqueducts on Jones Tract in the Delta
2007 Staff completes Report “Strategy for Protecting the Mokelumne Aqueducts in the Delta”• Short-term recommendation: construct Interconnections on each side of the Delta,• Long-term recommendation: construct Delta Tunnel across the Delta to mitigate risk
2013 District implements the short-term mitigation measure and completes the MokelumneAqueduct Interconnections on both sides of the Delta.
2014 District completes Delta Tunnel Study which includes:• Detailed review of existing geotechnical data and limited investigations• Conceptual Design of the Delta Tunnel• Response to EIR/EIS for State’s BDCP Twin Tunnels• Scoping and cost estimates of the next steps.
2016 Phase 1 Geotechnical Exploration Program
2018 Analyze seismic vulnerability of existing Mokelumne Aqueducts in the Delta
Future Preliminary Design, CEQA, Final Design, and Construction

28
Phase 1 Geotechnical Exploration Program
Exploration Program (16.5-miles):• Review Existing Data• Deep Soil Borings• Cone Penetration Test
(CPT)• Soil Sampling• Laboratory Testing• Piezometers • In-situ Testing• Geophysical
survey
Deliverables:• Geotechnical Data Report• Geologic Interpretative
Memo• Seismicity Report

29
Existing Mokelumne Aqueducts & Proposed Delta Tunnel
BixlerProposed State BDCP
California WaterFIxTwin Tunnels
N
Proposed EBMUDDelta Tunnel
Zone
Tunnel Face Stability
CPT data Soil Boring logs

Drivers for Moving ForwardWith Geotechnical Work
• Rationale per 2007 SPAD
– Mitigates all of the natural hazards to Aqueducts (flood, scour, subsidence, EQ)
– Long-term less expensive than major levee strengthening & maintenance
• Additional Benefits Relative to Waterfix
– Refine vertical profile of our tunnel to inform discussion of mitigations for WaterFix
30

Water Supply Board Briefing
Water Operations Department
February 23, 2016

Water Supply Briefing
• California Water Supply
• Current Water Supply
• Water Supply Projections
• Water Supply Schedule
2

California Water Supply

4
California Water Supply Automated Survey - Snow Water Equivalents
4
Automated Snow Measurements – Snow Water Equivalents
Year % of Normal on February 22
2015 19%
2016 94%
• Snow station surveys conducted around February 1, 2016
• Manual readings confirm
preliminary automated measurements

California Water Supply Reservoir Storage – February 21
February 21, 2016 Storage Average Storage on February 21
5

Current Water Supply
6

Current Water Supply Mokelumne Precipitation
0.45 0.08
0.06
2.56
Rainfall Year 2016 Average
7
5.83
11.45 10.9
2.06

Current Water Supply East Bay Precipitation
0.04 0.03 0.03 0.01
1.94
Rainfall Year 2016 Average
8
5.02
7.51
0.92

Current Water Supply Precipitation & Snow
As of 2/21/2016 Cumulative Precipitation
% of Average
East Bay
East Bay Watershed 15.48” 83% Mokelumne Basin
4-Station Average 33.39” 105% Caples Lake Snow Depth 72” 99% Caples Lake Snow Water Content 27.84” 110%
9
Add current photos

10
Current Water Supply Caples Lake Snow Depth
0
10
20
30
40
50
60
70
80
90
O N D J F M A M J
Sn
ow
Dep
th (
in)
Date
2015-16
2014-15
Historical Average

Current Water Supply Gross Water Production
100
150
200
250
300
1-Jul 1-Aug 1-Sep 1-Oct 1-Nov 1-Dec 1-Jan 1-Feb 1-Mar 1-Apr 1-May 1-Jun
gros
s w
ater
pro
duct
ion
(mgd
)
3-Year Avg of FY 2005-2007FY 2016FY 2013 (184 MGD)FY 2016 Operational Estimate (149 MGD)

Current Water Supply Water Savings
12
12 Month Average
12 Month Running Average Savings Rate (2013 Baseline)
CY 2015 22%
Feb 22, 2015- Feb 21,2016
23%

Current Water Supply Reservoir Storage
As of 2/21/16
Current Storage
Percent of Average
Percent of Capacity
Pardee 178,250 AF 101% 90%
Camanche 98,580 AF 37% 24%
East Bay 121,840 AF 91% 80%
Total System 398,670 AF 69% 52% 13

Water Supply Projections

Water Supply Projections (Runoff Projections as of February 22, 2016)
Forecast Annual Runoff
Total System Storage (on Sept 30, 2016)
No Rain To-Come 380 TAF 385 TAF 95% Exceedance
(9.5 of 10 years are wetter) 540 TAF 455 TAF
90% Exceedance (9 of 10 years are wetter) 570 TAF 485 TAF
50% Exceedance (5 of 10 years are wetter) 710 TAF 625 TAF
10% Exceedance (1 of 10 years is wetter) 1,020 TAF 630 TAF
Average Year 745 TAF 630 TAF 15

16
Adoption of DMP Guidelines
DMP Guidelines • Include four stages of drought • Allow for rationing >15% in extreme situations

Water Supply Projections Mokelumne Precipitation Rainfall Year 2016
Wettest of Record 87.3” (RY83)
Driest of Record 23.0” (RY77)
RY 2016 To-Date 33.39”
Average 48.3”
10% Exceedance
90% Exceedance
Median
17

Current Water Supply Mokelumne Precipitation – February Fail
18
Accuweather.com at Pioneer, CA
February 2016 Mokelumne 4-Station Average
Precipitation (through February 21st)
2.06”
Year Mokelumne 4-Station Average
Precipitation
1953 0.48”
1964 0.53”
1988 0.54”
1967 0.83”
2013 0.85”
Top 5 Driest Februaries How Dry is February 2016?

Water Supply Projections 10-Day NOAA Precipitation Probability Estimate
19
33 to 40% Increased Chance of Below-Normal Precipitation In the Mokelumne Watershed

Water Supply Projections 14-Day NOAA Precipitation Probability Estimate
20
Likely Normal Precipitation In the Mokelumne Watershed

Water Supply Projections 3-Month NOAA Precipitation Probability Estimate
21
33 to 40% Increased Chance of Above-Normal Precipitation In the Mokelumne Watershed

22
Water Year 2016 As of February 22, 2016
• Mokelumne River basin runoff is 146 TAF
• Projected end of water year storage is 485– 630 TAF (90% - 10% exceedance)
• Mokelumne River watershed season to date precipitation is 105% of average
• East Bay watershed season to date precipitation is 83% of average
• Precipitation accumulation season – 67% complete (33% remaining)

Water Year 2016 Water Supply Schedule
Date Activity
Feb 2 • DWR February Snow Survey
Feb 23 • Drought Financial Impacts
Mar 1 • DWR March Snow Survey
Mar 20 • USBR Initial Allocation
February to April
• Water Supply Updates • Continue public outreach
April 1 • DWR April Snow Survey
April 26
• Water Supply Availability and Deficiency Report
• Consider approval of Freeport use 23

Looking Forward
24
January March??? February

Hoping for Normal Precipitation to Add to Our Normal Snowpack
25
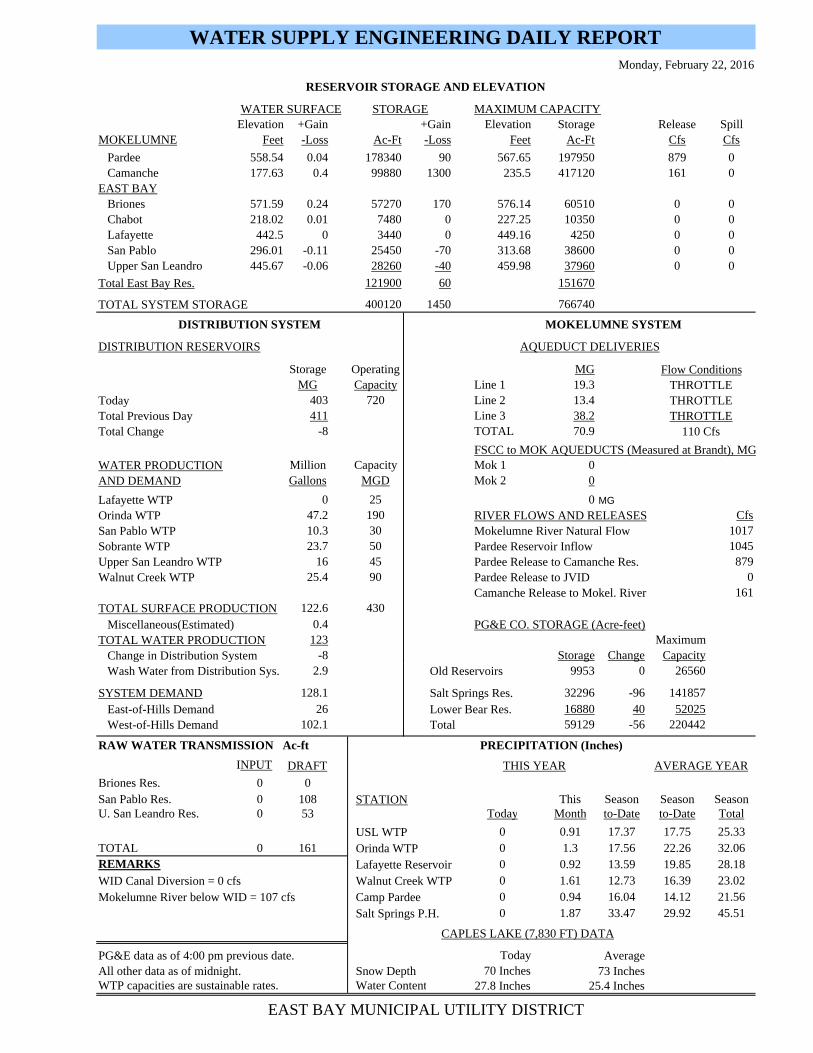
Elevation +Gain +Gain Elevation Storage Release SpillMOKELUMNE Feet -Loss Ac-Ft -Loss Feet Ac-Ft Cfs Cfs
Pardee 558.54 0.04 178340 90 567.65 197950 879 0 Camanche 177.63 0.4 99880 1300 235.5 417120 161 0EAST BAY Briones 571.59 0.24 57270 170 576.14 60510 0 0 Chabot 218.02 0.01 7480 0 227.25 10350 0 0 Lafayette 442.5 0 3440 0 449.16 4250 0 0 San Pablo 296.01 -0.11 25450 -70 313.68 38600 0 0 Upper San Leandro 445.67 -0.06 28260 -40 459.98 37960 0 0
121900 60 151670
400120 1450 766740
Storage Operating MGMG Capacity Line 1 19.3
403 720 Line 2 13.4411 Line 3 38.2
-8 TOTAL 70.9
FSCC to MOK AQUEDUCTS (Measured at Brandt), MGMillion Capacity Mok 1 0Gallons MGD Mok 2 0
0 25 0 MG47.2 190 Cfs10.3 30 101723.7 50 1045
16 45 87925.4 90 0
161122.6 430
0.4123 Maximum
-8 Storage Change Capacity2.9 9953 0 26560
128.1 32296 -96 14185726 16880 40 52025
102.1 59129 -56 220442
INPUT
Briones Res. 0 0San Pablo Res. 0 108 This Season Season SeasonU. San Leandro Res. 0 53 Today Month to-Date to-Date Total
0 0.91 17.37 17.75 25.33TOTAL 0 161 0 1.3 17.56 22.26 32.06REMARKS 0 0.92 13.59 19.85 28.18
0 1.61 12.73 16.39 23.020 0.94 16.04 14.12 21.560 1.87 33.47 29.92 45.51
Today70 Inches
27.8 Inches
STATION
Orinda WTP USL WTP
Lafayette Reservoir
WTP capacities are sustainable rates.
Walnut Creek WTP
EAST BAY MUNICIPAL UTILITY DISTRICT
All other data as of midnight. Snow Depth Water Content
CAPLES LAKE (7,830 FT) DATA
73 Inches25.4 Inches
DRAFT
Average
Camp Pardee Salt Springs P.H.
PG&E data as of 4:00 pm previous date.
WID Canal Diversion = 0 cfsMokelumne River below WID = 107 cfs
RAW WATER TRANSMISSION Ac-ft
PG&E CO. STORAGE (Acre-feet)TOTAL SURFACE PRODUCTION Miscellaneous(Estimated)
West-of-Hills Demand
SYSTEM DEMAND East-of-Hills Demand
TOTAL WATER PRODUCTION
Old Reservoirs Change in Distribution System
Lower Bear Res. Salt Springs Res.
Wash Water from Distribution Sys.
WATER SUPPLY ENGINEERING DAILY REPORTMonday, February 22, 2016
RESERVOIR STORAGE AND ELEVATION
STORAGE MAXIMUM CAPACITYWATER SURFACE
Total East Bay Res.
AND DEMAND
THROTTLE
110 Cfs
DISTRIBUTION RESERVOIRS AQUEDUCT DELIVERIES
Flow Conditions
TOTAL SYSTEM STORAGE
DISTRIBUTION SYSTEM
Total Previous Day THROTTLE
MOKELUMNE SYSTEM
Today
AVERAGE YEARTHIS YEAR
Orinda WTPSan Pablo WTP
Pardee Release to Camanche Res.Sobrante WTP
Pardee Release to JVIDUpper San Leandro WTP
Camanche Release to Mokel. River
Lafayette WTP
THROTTLE
Total Change
Walnut Creek WTP
Mokelumne River Natural FlowPardee Reservoir Inflow
RIVER FLOWS AND RELEASES
WATER PRODUCTION
PRECIPITATION (Inches)
Total