Embed Size (px)
Citation preview

U.S. Department of the InteriorU.S. Geological Survey
Water Resources DataMinnesotaWater Year 2002
By G.B. Mitton, K.G. Guttormson, G.W. Stratton, and E.S. Wakeman
Water-Data Report MN-02-1
Prepared in cooperation with the Minnesota Department of Natural Resources, Division of Waters; the Minnesota Department of Transportation; and with other State, municipal, and Federal agencies.

ii
U.S. Department of the Interior
Gale A. Norton, Secretary
U.S. Geological Survey
Charles G. Groat, Director
Mounds View, Minnesota, 2003
U.S. Geological Survey, WRD2280 Woodale DriveMounds View MN 55112763-783-3100
U.S. Geological SurveyBranch of Information ServicesBox 25286Federal CenterDenver CO 80225
Information on all U.S. Geological Survey reports and products (including maps, images, and computerized data) is available by calling 1-888-ASK-USGS.
Information regarding the U.S. Geological Survey, Minnesota District, is available on the Internet via the World Wide Web at http://mn.water.cr.usgs
Additional earth science information is available by accessing the U.S. Geological Survey Home Page at http://www.usgs.gov
Water-Data Report MN-02-1

iii
This volume of the annual hydrologic report of Minnesota is one of a series of annual reports that documents hydrologic datagathered from the U.S. Geological Survey’s surface- and ground-water data-collection networks in each state, Puerto Rico, andthe Trust Territories. These records of streamflow, ground-water levels, and water quality provide the hydrologic informationneeded by state, local, and Federal agencies, and the private sector for developing and managing our Nation’s land and waterresources. Hydrologic data for Minnesota, including four major basins; Great Lakes, Souris-Red Rainy River, Upper MississippiRiver, and Missouri River, are contained in this volume. This report is the culmination of a concerted effort by dedicated personnel of the U.S. Geological Survey who collected,compiled, analyzed, verified, and organized the data, and who typed, edited, and assembled the report. The authors had primaryresponsibility for assuring that the information contained herein is accurate, complete, and adheres to U.S. Geological Surveypolicy and established guidelines.
Grand Forks Field Headquarters
This report was prepared in cooperation with the State of Minnesota and with other agencies under the general supervision ofJeffery D. Stoner, District Chief, U.S. Geological Survey, Minnesota District, and, James D. Fallon, Hydrologic Networks andData Section Supervisor.
Mounds View District Office
Ginger L. Amos Michael A. Menheer
Robert Borgstede Charles J. Smith
Jeff J. Copa Josh D. Larson
Daniel W. Daly
Grand Rapids Field Headquarters
Wallace W. Larson
Russell J. Lewins
Gregory R. Melhus
Daniel L. Rosemore
Steven M. Robinson (chief)
Kelvin L. Boespflug
Lisa Powell Beaver
John B. Kelly
Jason M. Lambrecht
Rochelle A. Nustad
Preface

REPORT DOCUMENTATION PAGE Form ApprovedOMB No. 0704-0188
NSN 7540-01-280-5500
12a. DISTRIBUTION / AVAILABILITY STATEME
17. SECURITY CLASSIFICATION 18. S
1. AGENCY USE ONLY (Leave blank)
Public reporting burden for this collection of information is estimated to average 1 hour per response, including the time for reviewing instructions, searching existing data sources, gathering and maintaining the data needed, and completing and reviewing the collection of information. Send comments regarding this burden estimate or any other aspect of this collection of information, including suggestions for reducing this burden, to Washington Headquarters Services, Directorate for Information Operations and Reports, 1215 Jefferson Davis Highway, Suite 1204, Arlington, VA 22202-4302, and to the Office of Management and Budget, Paperwork Reduction Project (0704-0188), Washington, DC 20503.
2. REPORT DATE
April 15, 2002 A
NT
ECURITY CLASSIFICATION 19. SE
3. REPORT TYPE AND DATES COVERED
nnual, Oct. 1, 2001 through Sept. 30, 2002
4. TITLE AND SUBTITLE
Water Resources Data, Minnesota, Water Year 2002
CURITY CLASSIFICATION
5. FUNDING NUMBERS
6. AUTHOR(S)Gregory B. Mitton, K.G. Guttormson, G.W. Stratton, and E.S. Wakeman.
8. PERFORMING ORGANIZATIONREPORT NUMBER
7. PERFORMING ORGANIZATION NAME(S) AND ADDRESS(ES)
U.S. Geological Survey, Water Resources Division2280 Woodale DriveMounds View, MN 55112
USGS-WRD-MN-02-1
U.S. Geological Survey, WaterResources Division
10.AGENCY REPORT NUMBERSPONSORING / MONITORING
9. SPONSORING / MONITORING AGENCY NAME(S) AND ADDRESS(ES)11. SUPPLEMENTARY NOTES
2280 Woodale DriveMounds View, MN 55112
USGS-WRD-MN-02-1
Prepared in cooperation with theState of Minnesota and with otheragencies.
No restriction on distribution. This report may be purchased from:
12b. DISTRIBUTION CODE
National Technical Information Service Springfield, VA 22161
13. ABSTRACT (Maximum 200 words)
Water resources data for the 2002 water year for Minnesota consist of records of stage, discharge, and water quality of streams;stage of lakes and reservoirs; ground-water quality; and water quality in wells. This report contains discharge records for 101stream-gaging stations; stage for 11 lakes and reservoirs; water quality for 6 stream-gaging stations; peak flow data for 89 high-flow partial-record stations, and water levels for 3 groundwater observation wells. Additional water data were collected at var-ious sites that are not part of the systematic data collection program, and are published as miscellaneous measurements. Thesedata represent that part of the National Water Data System operated by the U.S. Geological Survey for cooperating State andFederal agencies in Minnesota.
5.
6.
14. SUBJECT TERMS 1
1
*Minnesota, *Hydrologic data, *Surface water, *Ground water, *Water quality, Flow rate, Gag-ing stations, Lakes, Reservoirs, Chemical analyses, Sediments, Water temperatures, Samplingsites, Water levels, Water analyses, Data collection
Stand
NUMBER OF PAGES349
a
PRICE CODE
OF REPORT
Unclassified
OF THIS PAGEUnclassified
OF ABSTRACT20. LIMITATION OF ABSTRACT
rd Form 298 (Rev. 2-89)

vCONTENTS
Page
Preface ................................................................................................................................................................................................................... iiiSurface-water stations, in downstream order, for which records are published.....................................................................................................viGround-water levels ...............................................................................................................................................................................................ixQuality of ground-water records ............................................................................................................................................................................ixDiscontinued surface-water discharge or stage-only stations. ................................................................................................................................xDiscontinued surface-water-quality stations ........................................................................................................................................................xivIntroduction. ............................................................................................................................................................................................................1Cooperation .............................................................................................................................................................................................................1Summary of hydrologic conditions .........................................................................................................................................................................1
Precipitation ...............................................................................................................................................................................................1Surface water .............................................................................................................................................................................................6Ground water .............................................................................................................................................................................................6
Special networks and programs...............................................................................................................................................................................6Explanation of the records.......................................................................................................................................................................................7Station identification numbers.................................................................................................................................................................................7Records of stage and water-discharge .....................................................................................................................................................................7Records of surface-water quality...........................................................................................................................................................................10Records of ground-water quality...........................................................................................................................................................................13Access to USGS data.............................................................................................................................................................................................13Definition of terms ................................................................................................................................................................................................13Publications on Techniques of Water-Resources Investigations ..........................................................................................................................22Surface water stations ...........................................................................................................................................................................................27Discharge at high-flow partial-record stations, low-flow sites, and miscellaneous sites....................................................................................273
Discharge at high-flow partial-record stations.......................................................................................................................................275Discharge at miscellaneous sites............................................................................................................................................................287
Water quality at miscellaneous sites ...................................................................................................................................................................293Amphibian research and monitoring......................................................................................................................................................294Trophic state indicator project ...............................................................................................................................................................301Rain gardens ..........................................................................................................................................................................................307
Ground water levels by county............................................................................................................................................................................309Ground-water levels..............................................................................................................................................................................309
Quality of ground water ........................................................................................................................................................................314
Index....................................................................................................................................................................................................................333
ILLUSTRATIONS
PageFigure 1. Map showing precipitation, in inches, for 2002 water year, in Minnesota....................................................................................2
2. Map showing precipitation, in inches, for 30-year period, 1971–2000, in Minnesota ..................................................................33. Graphs showing comparison of mean discharge for the 2002 water year with the median of mean discharges for
1971–2000 at seven long-term representative gaging stations ......................................................................................................44. Diagram showing example of system for numbering wells and miscellaneous sites....................................................................75. Map showing location of lake and stream-gaging stations..........................................................................................................286. Map showing location of surface-water-quality stations.............................................................................................................297. Map showing location of high-flow partial-record stations.......................................................................................................2748. Map showing location of ground-water wells ...........................................................................................................................310

vi SURFACE-WATER STATIONS, IN DOWNSTREAM ORDER, FOR WHICH RECORDS ARE PUBLISHED
Note.--Data for partial-record stations and miscellaneous sites for both surface-water quantity and quality are published in separate sections of the data report. See references at the end of this list for page numbers for these sections.
[Letters after station name designates type of data: (d) discharge; (e) gage height, elevation, or contents; (c) chemical, radio- chemical, or pesticides; (b) biological or micro-biological; (p) physical (water temperature, sediment, or specific conductance)]
ST. LAWRENCE RIVER BASINStation Number Page
STREAMS TRIBUTARY TO LAKE SUPERIORPigeon River at Middle Falls, near Grand Portage ...................................(d - - - -) .....................04010500 .....................................30Knife River near Two Harbors..................................................................(d - - - -) .....................04015330 .....................................32St. Louis River at Scanlon.........................................................................(d - - - -) .....................04024000 .....................................34Nemadji River:
Deer Creek near Holyoke .................................................................(d - - - -) .....................04024098 .....................................36
HUDSON BAY BASIN
STREAMS TRIBUTARY TO LAKE WINNIPEG (head of Nelson River):
RED RIVER OF THE NORTH BASINOtter Tail River (head of Red River of the North):Otter Tail River near Elizabeth .................................................................(d - - - -) .....................05030500 .....................................38Otter Tail River below Orwell Dam, near Fergus Falls ............................(d - - - -) .....................05046000 .....................................40
Bois de Sioux River:Mud Lake above White Rock Dam near White Rock, SD...............(- e - - -)......................05049995 .....................................42Bois de Sioux River near White Rock, SD ......................................(d - - - -) .....................05050000 .....................................44Bois de Sioux River near Doran.......................................................(d - - - -) .....................05051300 .....................................46
Red River of the North at Wahpeton, ND.................................................(d - - - -) .....................05051500 .....................................48Red River of the North at Hickson, ND....................................................(d - - - -) .....................05051522 .....................................50Red River of the North at Fargo, ND........................................................(d - - - -) .....................05054000 .....................................52
Buffalo River near Hawley...............................................................(d - - - -) .....................05061000 .....................................54South Branch Buffalo River at Sabin .......................................(d - - - -) .....................05061500 .....................................56
Buffalo River near Dilworth.............................................................(d - - - -) .....................05062000 .....................................58Wild Rice River at Twin Valley.......................................................(d - - - -) .....................05062500 .....................................60Wild Rice River at Hendrum............................................................(d - - - -) .....................05064000 .....................................62Marsh River near Shelly...................................................................(d - - - -) .....................05067500 .....................................64Sand Hill River at Climax ................................................................(d - - - -) .....................05069000 .....................................66Red Lake River:Upper Red Lake at Waskish .............................................................(- e - - -)......................05073500 .....................................68Lower Red Lake at Battle River mouth near Saum..........................(- e - - -)......................05073650 .....................................70Lower Red Lake near Red Lake.......................................................(- e - - -)......................05074000 .....................................72Red Lake River near Red Lake ........................................................(d - - - -) .....................05074500 .....................................74
Thief River near Thief River Falls ...........................................(d - - - -) .....................05076000 .....................................76Clearwater River at Plummer ...................................................(d - - - -) .....................05078000 .....................................78
Lost River at Oklee.........................................................(d - - - -) .....................05078230 .....................................80Clearwater River at Red Lake Falls..........................................(d - - - -) .....................05078500 .....................................82
Red Lake River at Crookston ...........................................................(d - - - -) .....................05079000 .....................................84Red Lake River at Fisher..................................................................(d - - - -) .....................05080000 .....................................86
Red River of the North at Grand Forks, ND.............................................(d - - - -) .....................05082500 .....................................88Snake River:
Middle River at Argyle.............................................................(d - - - -) .....................05087500 .....................................90Red River of the North at Drayton, ND....................................................(d - - - -) .....................05092000 .....................................92
Two Rivers:South Branch Two Rivers at Lake Bronson .............................(d - - - -) .....................05094000 .....................................94
Roseau River below South Fork near Malung .................................(d - - - -) .....................05104500 .....................................96Sprague Creek near Sprague, Manitoba ...................................(d - - - -) .....................05106000 .....................................98
Roseau River at Ross........................................................................(d - - - -) .....................05107500 ...................................100

viiSURFACE-WATER STATIONS, IN DOWNSTREAM ORDER, FOR WHICH RECORDS ARE PUBLISHED--Continued
Roseau River below State Ditch 51, near Caribou...........................(d - - - -) .....................05112000 ...................................102
RAINY RIVER BASINNamakan River (head of Rainy River):
Basswood River:Kawishiwi River near Ely ........................................................(d - - - -) .....................05124480 ...................................104Kawishiwi River near Winton ..................................................(d - - - -) .....................05127000 ...................................106
Basswood River near Winton...........................................................(d - - - -). ....................05127500 ...................................108Namakan River at outlet of Lac la Croix, Ontario....................................(d - - - -) .....................05128000 ...................................110
Vermilion River:Vermilion River near Crane Lake ....................................................(d - - - -) .....................05129115 ...................................112Gold Portage Outlet from Kabetogama Lake near Ray ...................(d - - - -) .....................05129290 ...................................114
Rainy Lake near Fort Frances, Ontario.....................................................(- e - - -)......................05129400 ...................................116Rainy River:
Little Fork River:Sturgeon River near Chisholm .................................................(d - - - -) .....................05130500 ...................................118Nett Lake River:
Wood Duck Creek near Nett Lake .................................(d - - - -) .....................05131448 ...................................120Nett Lake at Nett Lake .............................................................(- e - - -)......................05131450 ...................................122Nett Lake River near Nett Lake................................................(d - - - -) .....................05131455 ...................................124
Little Fork River at Littlefork...........................................................(d - - - -) .....................05131500 ...................................126Big Fork River at Big Falls ..............................................................(d - - - -) .....................05132000 ...................................128
Rainy River at Manitou Rapids.................................................................(d - - - -) .....................05133500 ...................................130Lake of the Woods (head of Winnipeg River):
Lake of the Woods at Warroad .................................................................(- e - - -)......................05140520 ...................................132Lake of the Woods at Springsteel Island near Warroad ...........................(- e - - -)......................05140521 ...................................134
UPPER MISSISSIPPI RIVER BASIN
UPPER MISSISSIPPI RIVER MAIN STEMMississippi River near Bemidji.................................................................(d - - - -) .....................05200510 ...................................136Mississippi River at Grand Rapids ...........................................................(d - - - -) .....................05211000 ...................................138
Prairie River near Taconite ..............................................................(d - - - -) .....................05212700 ...................................140Mississippi River at Aitkin .......................................................................(d - - - -) .....................05227500 ...................................142Mississippi River at Brainerd....................................................................(d - - - -) .....................05242300 ...................................144
Crow Wing River:Shell River:
Straight River near Park Rapids .....................................(d - - - -) .....................05243725 ...................................146Crow Wing River at Nimrod ............................................................(d - - - -) .....................05244000 ...................................148
Long Prairie River at Long Prairie ...........................................(d - - - -) .....................05245100 ...................................150Crow Wing River near Pillager ........................................................(d - - - -) .....................05247500 ...................................152
Mississippi River near Royalton...............................................................(d - - - -) .....................05267000 ...................................154Sauk River near St. Cloud ................................................................(d - c - p) ....................05270500 ...................................156
Mississippi River at St. Cloud ..................................................................(d - - - -) .....................05270700 ...................................158Elk River near Big Lake...................................................................(d - - - -) .....................05275000 ...................................160Crow River at Rockford ...................................................................(d - - - -) .....................05280000 ...................................162Rum River:Mille Lacs Lake (head of Rum River) at Cove Bay near Onamia ...(- e - - -)......................05284000 ...................................164Rum River near St. Francis ..............................................................(d - - - -) .....................05286000 ...................................166Elm Creek near Champlin ................................................................(d - c - p) ....................05287890 ...................................168
Mississippi River near Anoka...................................................................(d - - - -) .....................05288500 ...................................172Shingle Creek at Queen Ave in Minneapolis ...................................(d - c b p)....................05288705 ...................................174
MINNESOTA RIVER BASINLittle Minnesota River (head of Minnesota River) near Peever, SD........(d - - - -) .....................05290000 ...................................180
Whetstone River near Big Stone City, SD .......................................(d - - - -) .....................05291000 ...................................182Minnesota River at Ortonville ..................................................................(d - - - -) .....................05292000 ...................................184
Yellow Bank River:North Fork Yellow Bank River near Odessa............................(d - - - -) .....................05292704 ...................................186

viii SURFACE-WATER STATIONS, IN DOWNSTREAM ORDER, FOR WHICH RECORDS ARE PUBLISHED--Continued
Yellow Bank River near Odessa ......................................................(d - - - -) .....................05293000 ...................................188
MINNESOTA RIVER BASIN--ContinuedLac qui Parle River near Providence................................................(d - - - -) .....................05299650 ...................................190
West Branch Lac qui Parle River at Dawson ...........................(d - - - -) .....................05299800 ...................................192Lac qui Parle River near Lac qui Parle.............................................(d - - - -) .....................05300000 ...................................194
Minnesota River near Lac qui Parle..........................................................(d - - - -) .....................05301000 ...................................196Chippewa River near Milan .............................................................(d - - - -) .....................05304500 ...................................198
Minnesota River at Montevideo................................................................(d - - - -) .....................05311000 ...................................200Yellow Medicine River near Granite Falls.......................................(d - - - -) .....................05313500 ...................................202Redwood River near Marshall..........................................................(d - - - -) .....................05315000 ...................................204Redwood River near Redwood Falls................................................(d - - - -) .....................05316500 ...................................206
Minnesota River at Morton .......................................................................(d - - - -) .....................05316580 ...................................208Cottonwood River near New Ulm....................................................(d - c - p) ....................05317000 ...................................210Little Cottonwood River near Courtland..........................................(d - - - -) .....................05317200 ...................................214Blue Earth River:
Watonwan River near Garden City ..........................................(d - - - -) .....................05319500 ...................................216Blue Earth River near Rapidan.........................................................(d - - - -) .....................05320000 ...................................218
Le Sueur River:Little Cobb River near Beauford ....................................(d - c - p) ....................05320270 ...................................220
Le Sueur River near Rapidan ...................................................(d - - - -) .....................05320500 ...................................226Minnesota River at Mankato.....................................................................(d - - - p).....................05325000 ...................................228
High Island Creek near Henderson ..................................................(d - - - -) .....................05327000 ...................................232Minnesota River near Jordan ....................................................................(d - - - -) .....................05330000 ...................................234
UPPER MISSISSIPPI RIVER MAIN STEMMississippi River at St. Paul .....................................................................(d - - - -) .....................05331000 ...................................236Mississippi River below Lock and Dam 2, at Hastings ............................(d - c - p) ....................05331580 ...................................238
ST. CROIX RIVER BASINSt. Croix River:
Kettle River below Sandstone ..........................................................(d - - - -) .....................05336700 ...................................244Snake River:
Knife River near Mora..............................................................(d - - - -) .....................05337400 ...................................246Snake River near Pine City ..............................................................(d - - - -) .....................05338500 ...................................248
St. Croix River at St. Croix Falls, WI .......................................................(d - - - -) .....................05340500 ...................................250
UPPER MISSISSIPPI RIVER MAIN STEMMississippi River at Prescott, WI..............................................................(d - - - -) .....................05344500 ...................................252
Sturgeon Lake, West Side, at Prairie Island.....................................(- e - - -)......................05344850 ...................................254Vermillion River near Empire ..........................................................(d - - - -) .....................05345000 ...................................256Clear Lake, East Side, at Prairie Island ............................................(- e - - -)......................05346050 ...................................258Cannon River:
Straight River near Faribault ....................................................(d - - - -) .....................05353800 ...................................260Cannon River at Welch ....................................................................(d - - - -) .....................05355200 ...................................262Zumbro River:
South Fork Zumbro River at Rochester....................................(d - - - - ) .....................05372995 ...................................264Mississippi River at Winona .....................................................................(d - - - -) .....................05378500 ...................................266
Iowa River:Cedar River near Austin ...........................................................(d - - - -) .....................05457000 ...................................268
Des Moines River at Jackson ...........................................................(d - - - -) .....................05476000 ...................................270

ix
GROUND-WATER WELLS, BY COUNTY, FOR WHICHRECORDS ARE PUBLISHED IN THIS VOLUME
GROUND-WATER LEVELS
Page
BELTRAMIWell 473423095053301 Local number 147N35W02CDCBDD........................................................................................... 311MORRISONWell 460444094212501 Local number 130N29W08DCC01 ............................................................................................... 312WATONWANWell 440037094372601 Local number 106N32W01DDB01 ............................................................................................... 313
QUALITY OF GROUND-WATER RECORDS
ANOKA...............................................................................................................................................................................................................314BELTRAMI.........................................................................................................................................................................................................314CASS...................................................................................................................................................................................................................314HENNEPIN.........................................................................................................................................................................................................314SHERBURNE .....................................................................................................................................................................................................314

DISCONTINUED SURFACE-WATER DISCHARGE OR STAGE ONLY STATIONSx
The following continuous-record surface-water discharge or stage-only stations (gaging stations) in Minnesota have been discontinued.Daily streamflow or stage records were collected and published for the period of record, expressed in water years, shown for each station.Those stations with an asterisk (*) after the station number are currently operated as crest-stage partial-record stations. Discontinued projectstations with less than 3 years of record have not been included. Information regarding these stations may be obtained from the District Officeat the address given on the back side of the title page of this report.
[Letters after station name designate type of data collected: (d) discharge, (e) elevation (stage only)].
Station nameStation number
Drainage area(mi2)
Period of record
Pigeon River above mouth of Arrow River, MN (d) 04010000 256 1924-27Loon Lake, northeast side, near Grand Portage, MN (e) 475807089483501 - 1998-2002Cuffs Lake, east side, near Grand Portage, MN (e) 475647089443301 - 1998-2002Poplar River at Lutsen, MN (d) 04012500 114 1911 (e), 1912-17,
1928-47, 1952-61Cross River at Schroeder, MN (d) 04013000 91 1931-32Baptism River near Beaver Bay, MN (d) 04014500 140 1928-93Beaver Creek (Beaver Bay Run) at Beaver Bay, MN (d) 04015000 126 1911-14, 1928-31South Branch Partridge River near Babbitt, MN (d) 04015455 18.5 1977-80Partridge River above Colby Lake, at Hoyt Lakes, MN (d) 04015475 106 1979-88Second Creek near Aurora, MN (d) 04015500 29 1955-80Partridge River near Aurora, MN (d) 04016000 161 1942-82 St. Louis River near Aurora, MN (d) 04016500 290 1942-87 Embarrass River at Embarrass, MN (d) 04017000 93.8 1942-64 Embarrass River near McKinley, MN (d) 04018000 171 1953-62St. Louis River at Forbes, MN (d) 04018750 713 1965-90East Two Rivers near Iron Junction, MN (d) 04018900 40.0 1966-79West Two Rivers near Iron Junction, MN (d) 04019000 65.3 1953-62, 1965-79West Swan River near Silica, MN (d) 04019300 16.3 1963-79East Swan River near Toivola, MN (d) 04019500 112 1953-62, 1964-71Swan River near Toivola, MN (d) 04020000 254 1952-61Whiteface River below (at) Meadowlands, MN (d) 04021000 453 1909-17 Cloquet River at Independence, MN (d) 04023000 750 1909-17 Elim Creek near Holyoke, MN (d) 04024090 1.06 1976-78Skunk Creek below Elim Creek near Holyoke, MN (d) 04024093 8.83 1976-78Otter Tail River near Detroit Lakes, MN (d) 05030000 270 1937-71Pelican River at Detroit Lakes, MN (d) 05033900 - 1968-71Pelican River at Detroit Lk. out. nr. Detroit Lakes, MN (d) 05034100 - 1968-71, 1974-75Long Lake outlet near Detroit Lakes, MN (d) 05035100 - 1968-71West Branch Cty. Ditch No. 14 nr. Detroit Lakes, MN (d) 05035200 - 1968-71East Branch County Ditch No. 14 nr. Detroit Lakes, MN (d) 05035300 - 1968-71St. Clair Lake outlet near Detroit Lakes, MN (d) 05035500 - 1968-75Pelican River at Muskrat Lk outlt nr Detroit Lakes, MN (d) 05035600 - 1968-75Pelican River at Sallie Lk outlet nr Detroit Lakes, MN (d) 05037100 - 1968-75 Pelican River at Lake Melissa olt nr Detroit Lakes, MN (d) 05039100 - 1968-75Pelican River near Detroit Lakes, MN (d) 05040000 123 1942-53Pelican River near Fergus Falls, MN (d) 05040500 482 1909-12Otter Tail River near Breckenridge, MN (d) 05046500 2,040 1931-32, 1939-46Mustinka River (head of Bois de Sioux River) nr Norcross, MN (d) 05047000 - 1940-47Mustinka Ditch above West Branch Mustinka River (Twelve Mile Creek) near Charlesville, MN (d)
05047500 - 1943-55
Mustinka Ditch below West Branch Mustinka River (Twelve Mile Creek) near Charlesville, MN (d)
05048000 - 1943-55
W. Branch Mustinka River (Twelve Mile Creek) below Mustinka Ditch near Charlesville, MN (d)
05048500 - 1943-55
Mustinka River above Wheaton, MN (d) 05049000 834 1915-24, 1930-58Bois de Sioux River below Fairmont, ND (d) 05050500 1,540 1919-44Rabbit River at Campbell, MN (d) 05051000 266 1942-52
Red River of the North below Fargo, ND (d) 05054020 - 1969-78Whiskey Creek at Barnesville, MN (d) 05061200* 25.3 1964-66Wild Rice River near Ada, MN (d) 05063000 1,100 1948-54South Branch Wild Rice River near Borup, MN (d) 05063500 254 1944-49Marsh River below Ada, MN (d) 05067000 - 1948-52Sand Hill River at Beltrami, MN (d) 05068000 324 1943-58Sand Hill Ditch at Beltrami, MN (d) 05068500 - 1943-58Red Lake River at High Landing, near Goodridge (d) 05075000 2,300 1929-2000

DISCONTINUED SURFACE-WATER DISCHARGE OR STAGE-ONLY STATIONS--Continued xi
Thief River near Gatske, MN (d) 05075500 - 1953-56Red Lake River at Thief River Falls, MN (d) 05076500 3,450 1909-18, 1920-30Clearwater River near Pinewood, MN (d) 05077000 132 1940-45 Clearwater River near Leonard, MN (d) 05077500 153 1934-47Ruffy Brook near Gonvick, MN (d) 05077700* 45.2 1960-78Red River of the North at Oslo, MN (d) 05083500 31,200 1936-37, 1941-43,
1945-60, 1973-78Snake River at Warren, MN (d) 05085500 - 1945, 1953-56Snake River above Alvarado, MN (d) 05085900 218 1993-96Snake River at Alvarado, MN (d) 05086000 220 1945, 1953-56Middle River near Strandquist, MN (d) 05087000 - 1953-56Tamarac River near Strandquist, MN (d) 05090500 - 1953-56Tamarac River near Stephen, MN (d) 05091500 320 1945Two Rivers (Middle Fork Two Rivers) nr Hallock, MN (d) 05092500 131 1931-38South Branch (South Fork) Two Rivers near Pelan, MN (d) 05093000 281 1928-38, 1953-56South Branch Two Rivers (Two Rivers) at Hallock, MN (d) 05094500 - 1940-47Two Rivers (South Branch Two Rivers) at Hallock, MN (d) 05095000 - 1911-14, 1929-30,
1938-39, 1941-43Two Rivers below Hallock, MN (d) 05095500 644 1945-55 North Branch (North Fk) Two Rivers nr Lancaster, MN (d) 05096000 32 1929-38, 1941-55
1953-55 State Ditch 85 near Lancaster, MN (d) 05096500 95 1929-38, 1942-55North Branch Two Rivers at Lancaster, MN (d) 05096500 209 1941-42, 1953-56North Branch Two Rivers near Northcote, MN (d) 05097500 386 1941-42, 1945-51Two Rivers below North Branch near Hallock, MN (d) 05098000 1,060 1941-43Roseau River (at) near Malung, MN (d) 05103000 252 1928-46 South Fork (W. Branch) Roseau River nr Malung, MN (d) 05104000 312 1911-14, 1928-46Roseau River at Roseau, MN (d) 05105000 - 1940-47 Roseau River near Roseau, MN (d) 05105500 - 1930-60Pine Creek near Pine Creek, MN (d) 05107000 74.6 1928-53Roseau River at Roseau Lake, MN (e) 05106500 - 1939-91Roseau River near Badger, MN (d) 05108000 - 1928-69Roseau River near Duxby, MN (d) 05108500 - 1929-51, 1952-56Badger Creek near Badger, MN (d) 05109000 2.2 1929-30, 1931-38Roseau River near Haug, MN (d) 05109500 - 1932-66Roseau River at otlt of State Ditch 69 nr Oak Point, MN (d) 05110000 - 1939-42Roseau R. at head of State Ditch 51 nr Oak Point, MN (d) 05110500 - 1933-42 Roseau River at Oak Point, MN (d) 05111000 - 1933-39, 1941-60
Roseau River at international boundary, nr Caribou, MN (d) 05112500 1,590 1933-69Shagawa Lake tributary at Ely, MN (d) 05127219 1.84 1971-78Burgo Creek near Ely, MN (d) 05127220 3.04 1967-78Shagawa River near Ely, MN (d) 05127230 99 1967-78Vermilion Lake near Soudan, MN (e) 05128200 - 1913-15, 1941-42,
1946-87Pike River near Biwabik, MN (d) 05128340 - 1977-79Pike River near Embarrass, MN (d) 05128500 115 1953-64, 1976-79Rainy River at International Falls, MN (d) 05129500 14,900 1905-60Sturgeon River (Lake) at Side Lake, MN (d) 05130000 - 1938-47Dark River near Chisholm, MN (d) 05131000 50.6 1942-61, 1965-79Deer Lake outlet (Deer Lake) near Effie, MN (d) 05131800 - 1937-39, 1940-46
1982-93Rapid River near Baudette, MN (d) 05134200 543 1956-85Warroad River near Warroad, MN (d) 05139500 162 1946-80 Bulldog Run near Warroad, MN (d) 05140000 14.2 1946-51, 1966-77East Branch Warroad River nr Warroad, MN (d) 05140500 102 1946-54, 1966-77Williams lake near Akeley, MN (e) (data stored under station number 465724094402601)
05202000 0.88 1988-96.
Mississippi River near Deer River, MN (d) 05210000 3,190 1945-50 Prairie River near Grand Rapids, MN (d) 05213000 485 1909 (e), 1925-49O’Brien Creek near Pengilly, MN (d) 05216800 - 1963-68Initial tailings basin outflow near Keewatin, MN (d) 05216820 2.5 1982-85Swan River near Calumet, MN (d) 05216850 114 1964-90Swan River near Warba, MN (d) 05217000 254 1954-69
Station nameStation number
Drainage area(mi2)
Period of record

xii DISCONTINUED SURFACE-WATER DISCHARGE OR STAGE-ONLY STATIONS--Continued
Mississippi River above Sandy River near Libby, MN (d) 05218000 4,560 1895-1915,1925-29
Mississippi River below Sandy River near Libby, MN (d) 05220500 5,060 1930-90Pelican Brook (Long Lake) near Pequot Lakes, MN (d) 05232000 - 1938-42, 1943-47Rabbit River near Crosby, MN (d) 05241500 8.38 1945-63Little Sand Lake outlet (Sand Lake outlet) nr Dorset, MN (d 05242700 74 1930-41 Straight River at County Highway 125 near Osage, MN (d) 05243721 - 1986-91Straight River at Cty. Hwy. 115 near Park Rapids, MN (d) 05243723 - 1986-89Crow Wing River at Motley, MN (d) 05244500 2,140 1909 (e), 1913-17
1930-31Diversion from Long Prairie River near Osakis, MN (d) 05244980 - 1939-47Long Prairie River near Osakis, MN (d) 05245000 - 1949-54Long Prairie near Motley 05245500 973 1909-17, 1930-31Crow Wing River at Pillager, MN (d) 05246000 1909-13, 1925-50Mississippi River near Ft. Ripley, MN (d) 05261000 11,010 1987-2000Platte (Platt) River at Pillager, MN (d) 05268000* 338 1929-36Mississippi River near Sauk Rapids, MN (d) 05269000 12,400 1903-06Mississippi River at Sartell, MN (d) 05270000 12,450 1929, 1943-47(e)Clearwater River at Clearwater, MN (d) 05273500 - 1937, 1940-42St. Francis River at Santiago, MN (d) 05274700 - 1965-70, 1980-81St. Francis River above Zimmerman, MN (d) 05274750 - 1980-84St. Francis River near Big Lake, MN (d) 05274900 - 1965-70Mississippi River at Elk River, MN (d) 05275500 14,500 1915-56North Fork Crow River near Regal, MN (d) 05276000 215 1943-54North Fork Crow River above Paynesville, MN (d) 05276005 232 1996-98Middle Fork Crow River at New London, MN (e) 05277000 - 1939-42, 1943-47Middle Fork Crow River (Calhoun Lk Diversion) nr Spicer, MN (e) 05277500 - 1939, 1940-46Middle Fork Crow River near Spicer, MN (d) 05278000 179 1949-87South Fork Crow River at Cosmos, MN (d) 05278500 221 1945-64Buffalo Creek near Glencoe, MN (d) 05278930* 374 1972-80South Fork Crow River near Mayer, MN (d) 05279000 1,170 1934-79South Fork Crow River near Rockford, MN (d) 05279500 1,250 1909-12Mississippi River at Anoka, MN (d) 05283500 17,100 1897, 1905-13Rum River at Onamia, MN (d) 05284500 414 1910-12Rum River at Spencer Brook, MN (d) 05284750 - 1960-64Rum River at Cambridge, MN (d) 05285000 1,160 1909-14Rum River near Anoka, MN (d) 05286500 1,430 1905-06, 1909Minnetonka Lake (head of Minnehaha Creek) near Wayzata (at Excelsior), MN (d)
05289000 - 1938-64
Minnehaha Creek at Minnetonka Mills, MN (d) 05289500 130 1953-64Big Stone Lake near Big Stone City, SD (formerly Big Stone Lake at Ortonville, MN (e)
05291500 - 1937-93
Minnesota River near Odessa, MN (d) 05292500 1,340 1909-12, 1944-63Pomme de Terre River near Morris, MN (d) 05293500 - 1937-39, 1940-47Pomme de Terre River at Appleton, MN (d) 05294000 864 1931-99Canby Creek at Canby, MN (d) 05299500 - 1938-39,
1940-46Chippewa River at diversion dam near Hancock, MN (d) 05303000 - 1930-39, 1940-46Chippewa River at Benson, MN (d) 05303500 1,270 1949-51Shakopee Creek near Benson, MN (d) 05304000 352 1949-54Chippewa River near Watson, MN (d) 05305000 2,050 1910-17, 1931-36South Branch Yellow Medicine River at Minneota, MN (d) 05311400 111 1960-81, 1983-87Spring Creek near Hazel Run, MN (d) 05312500 101 1945-48Chetomba Creek near Maynard, MN (d) 05314000 200 1949-51Hawk Creek near Maynard, MN (d) 05314500* 474 1949-54Prairie Ravine near Marshall, MN (d) 05315200 5.63 1959-64Redwood River near Green Valley, MN (d) 05315500 436 1947-57Minnesota River at New Ulm, MN (d) 05316770 9,536 1968-76Dry Creek near Jeffers, MN (d) 05316900 3.13 1982-85Minnesota River at Judson, MN (d) 05317500 11,200 1938-50East Branch (East Fork) Blue Earth River near Bricelyn, MN (d) 05318000 132 1951-70South Fork Watonwan River at diversion dam near St. James, MN (d)
05319000 - 1939, 1940-46
Blue Earth River at Mankato, MN (d) 05321000 3,550 1938-39, 1940-42
Station nameStation number
Drainage area(mi2)
Period of record

DISCONTINUED SURFACE-WATER DISCHARGE OR STAGE-ONLY STATIONS--Continued xiii
Sand Creek at diversion dam near Jordan, MN (d) 05330400 - 1938-39, 1940-46Purgatory Creek at Eden Prairie, MN (d) 05330800 - 1975-80Nine Mile Creek at Bloomington, MN (d) 05330900 - 1963-73Glaisby Brook near Kettle River, MN (d) 05336200* 24.2 1959-70Kettle River near Sandstone, MN (d) 05336500 825 1908-16Grindstone River at Hinckley, MN (d) 05337000 - 1940-47Snake River at Mora, MN (d) 05337500 422 1909-13St. Croix River near Rush City, MN (d) 05339500 5,120 1923-61Sunrise River near Stacy, MN (d) 05340000 167 1949-65Sunrise River near Lindstrom, MN (d) 05340050 231 1965-85
Vermillion River at Hastings, MN (d) 05346000 195 1942-47, 90South Fork Zumbro River near Rochester, MN (d) 05373000 304 1952-81Zumbro River (South Branch) near Zumbro Falls, MN (d) 05373500 821 1911-17Zumbro River at Zumbro Falls, MN (d) 05374000* - 1909-17, 1929-80Zumbro River at Theilman, MN (d) 05374500 1,320 1938-56Zumbro River at Kellogg, MN (d) 05374900 1,400 1975-90North Fork Whitewater River near Elba, MN (d) 05376000 101 1939-41, 1967-93Middle Fork Whitewater River near St. Charles, MN (d) 05376100 - 1988-92South Fork Whitewater River near Altura, MN (d) 05376500 76.8 1939-71Whitewater River near Beaver, MN (d) 05376800 271 1975-85, 1991-99Whitewater River at Beaver, MN (d) 05377500 288 1936-38, 1939-56Stockton Valley Creek at Stockton, MN (d) 05378230 - 1982-85Garvin Brook near Minnesota City, MN (d) 05378235 - 1982-91Straight Valley Creek near Rollingstone, MN (d) 05378300 5.16 1970-85Gilmore Creek at Winona, MN (d) 05379000 8.95 1939-63Mississippi River at LaCrosse, WI (d) 05383500 - 1929-55North Branch Root River tributary near Stewartville, MN (d) 05383600 0.73 1959-64Root River near Lanesboro, MN (d) 05384000* 615 1910, 11-17, 1940-85,
87-90Rush Creek near Rushford, MN (d) 05384500* 129 1942-79Root River near Houston, MN (d) 05385000* 1,250 1909-17, 1929-83,
1991-2000South Fork Root River near Houston, MN (d) 05385500* 275 1953-83Root River below South Fork near Houston, MN (d) 05386000 1,560 1938-61Turtle Creek near Austin, MN (d) 05456500 144 1947-51Heron Lake outlet nr Heron Lake, MN (d) 05475000 - 1930-43Rock River at Luverne, MN (d) 06483000* 419 1911-14, 1996-97Little Sioux River near Lakefield, MN (d) 06603000 17.1 1948-63Jackson County Ditch No. 11 near Lakefield, MN (d) 06603500 7.69 1948-61
Station nameStation number
Drainage area(mi2)
Period of record

DISCONTINUED SURFACE-WATER-QUALITY STATIONSxiv
Station name Station number Drainage area (mi2) Type of record Period of record
Baptism River near Beaver Bay, MN 04014500 140 C., Bio., Sed., Temp., D.O., pH., S.C. 1968-93Partridge River abv Colby Lake at Hoyt Lakes, MN 04015475 106 Temp., S.C. 1976-85St. Louis River at Forbes, MN 04018750 713 Sed. 1968-70St. Louis River at Scanlon, MN 04024000 3430 C., Bio., Sed., Temp., D.O., pH, S.C. 1958-66, 68-94Elim Creek near Holyoke, MN 04024090 1.06 Sed. 1976-79Skunk Creek below Elim Creek near Holyoke, MN 04024093 8.83 C., Sed., Temp., D.O., pH, S.C. 1976-79Deer Creek near Holyoke, MN 04024098 7.77 C., Bio., Temp., D.O., pH, S.C. 1977-79
Sed. 1977-81Otter Tail River below Orwell Dam, near Fergus Falls, MN 05046000 1740 C., Sed., Temp., D.O., pH, S.C. 1961-63, 65-66, 85-86, 93-
95Bois de Sioux River near Doran, MN 05051300 1880 C., Sed., Temp., D.O., pH, S.C. 1993-95Buffalo River near Dilworth, MN 05062000 1040 Sed. 1971-81Wild Rice River at Twin Valley, MN 05062500 934 C., Temp., D.O., pH, S.C. 1966, 1973-79, 92-98,
2000-01Wild Rice River at Hendrum, MN 05064000 1,560 C., Temp., D.O., pH, S.C. 1962-63, 67-68, 80-85, 91,
97-2001Marsh River near Shelly, MN 05067500 220 C., Temp., D.O., pH, S.C. 1975, 79, 2000-01Sand Hill River at Climax, MN 05069000 420 C., Temp., D.O., pH, S.C. 1966, 75, 79, 2000-01Red Lake River near Red Lake, MN 05074500 1,950 C., Temp., D.O., pH, S.C. 1964-66, 2000-01Thief River near Thief River Falls, MN 05076000 985 C., Temp., D.O., pH, S.C. 1963-66, 75, 79, 2000-01Clearwater River at Plummer, MN 05078000 555 C., Temp., D.O., pH, S.C. 1963, 79, 2000-01Lost River at Oklee, MN 05078230 254 C., Temp., D.O., pH, S.C. 1966, 1979, 2000-01Clearwater River at Red Lake Falls, MN 05078500 1370 C., Sed., Temp., D.O., pH, S.C. 1964-66, 79, 92, 95Red Lake River at Crookston, MN 05079000 5,270 C., Sed., Temp., D.O., pH, S.C. 1962-68, 72-76, 78-95, 97,
2000-01Red Lake River at Fisher, MN 05080000 5,680 C., Sed., Temp., D.O., pH, S.C. 2000-01Snake River above Alvarado, MN (d) 05085900 218 C., Temp., D.O., pH, S.C. 1994-96Middle River at Argyle, MN 05087500 255 C., Sed., Temp., D.O., pH, S.C. 1968, 75, 79, 93, 2000-01South Branch Two Rivers at Lake Bronson, MN 05094000 422 C., Sed., Temp., D.O., pH, S.C. 2000-01Roseau River below Roseau, MN 05105300 C., Bio., Sed., Temp., D.O., pH, S.C. 1973-83Roseau River below State Ditch 51, near Caribou, MN 05112000 1560 C., Bio., Sed., Temp., D.O., pH, S.C 1972-95, 2001Kawishiwi River near Ely, MN 05124480 253 C., Bio., Sed., Temp., D.O., pH, S.C 1966-96Little Fork River at Littlefork, MN 05131500 1730 C., Bio., Sed., Temp., D.O., pH, S.C. 1967, 69, 71, 73-86Big Fork River at Big Falls, MN 05132000 1460 C., Bio., Sed., Temp., D.O., pH, S.C. 1968, 71-77Rainy River at Manitou Rapids, MN 05133500 19,400 C., Bio., Sed., Temp., D.O., pH, S.C. 1968-70, 78-94Mississippi River near Royalton, MN 05267000 11,600 C., Bio., Sed., Temp., D.O., pH, S.C. 1963-66, 1975-98Sauk River near St. Cloud, MN 05270500 1,030 C., Bio., Temp., D.O., pH, S.C. 2001Elk River near Big Lake, MN 05275000 615 Sed., Temp. 1976-81North Fork Crow River above Paynesville, MN 05276005 232 C., Bio., Sed., Temp., D.O., S.C. 1996-98Crow River at Rockford, MN 05280000 2520 Sed., Temp. 1975-81
C., Sed., Temp., D.O., pH, S.C. 1997Mississippi River near Anoka, MN 05288500 19,100 Sed. 1963-67, 75-98
C., Temp., D.O., pH, S.C. 1996-98Mississippi River at Fridley, MN 05288550 Temp., D.O., pH, S.C. 1975-86Mississippi River at Ford Plant at St. Paul, MN 05288950 19,700 Temp., D.O., pH, S.C. 1974-78, 81-82Whetstone River near Big Stone City, SD 05291000 389 Sed., Temp. 1974-88Yellow Bank River near Odessa, MN 05293000 398 Sed., Temp. 1974-88Chippewa River near Milan, MN 05304500 1870 Sed., Temp. 1972-81Yellow Medicine River near Granite Falls, MN 05313500 653 Sed., Temp. 1971-75, 77-81Redwood River near Marshall, MN 05315000 259 Sed., Temp. 1968-71Redwood River near Redwood Falls, MN 05316500 629 Sed., Temp. 1968-70
Sed., 1968-76Watonwan River near Garden City, MN 05319500 812 Sed. 1977-80Blue Earth River near Rapidan, MN 05320000 2,410 C., Bio., Temp., D.O., pH, S.C. 1960-67, 69, 2000-01Minnesota River near Jordan, MN 05330000 16,200 C., Bio., Temp., D.O., pH, S.C. 1952-63, 69, 72-98Minnesota River at Burnsville, MN 05330908 Temp., D.O., pH, S.C. 1980-83Minnesota River at Fort Snelling State Pk., St. Paul, MN 05330920 16,900 Temp., D.O., pH, S.C. 1973-83Mississippi River at Industrial Molasses, St. Paul, MN 05331005 Temp., D.O., pH, S.C. 1976-85Mississippi River at Fifth at Newport, MN 05331545 Temp., D.O., pH, S.C. 1979-90Mississippi River at Grey Cloud Island near Cottage Grove, MN
05331560 Temp., D.O., pH, S.C. 1977-90
Mississippi River at Ninninger 05331570 37,000 C., Bio., Sed., Temp., D.O., pH, S.C. 1977-95Mississippi River at Lock and Dam 2 at Hastings, MN 05331578 Temp., D.O., pH, S.C. 1975-90Snake River near Pine City, MN 05338500 958 C., Bio., Temp., D.O., pH, S.C. 1963, 65, 67-68, 75-83, 85,
92-94, 98St. Croix River at Afton, MN 05341770 Temp., D.O., pH, S.C. 1977-83Vermillion River near Empire, MN 05345000 110 Temp., D.O., pH, S.C. 1974-91
C., Bio. 1990-91, 97, 98Mississippi River at Lock and Dam 3 near Red Wing, MN 05344980 46,000 Temp., D.O., pH, S.C. 1976-83

DISCONTINUED SURFACE-WATER-QUALITY STATIONS--Continued xv
Mississippi River at Red Wing, MN 05355250 46,800 C., Bio., Sed., Temp., D.O., pH, S.C. 1996-98South Fork Zumbro River at Rochester, MN 05372995 303 C., Temp., D.O., pH, S.C. 2001
Sed., Temp. 1981-82Zumbro River at Kellogg, MN 05374900 1400 Sed., Temp. 1975-81North Fork Whitewater River near Elba, MN 05376000 101 C., Bio., Sed., Temp, D.O., pH, S.C. 1967-93Middle Fork Whitewater River near St. Charles, MN 05376100 Sed., Temp., S.C. 1988-92Whitewater River near Beaver, MN 05376800 271 Sed., Temp. 1975-81Mississippi River at Winona, MN 05378500 59,200 C., Bio., D.O., pH 1963-66, 76-88
Sed. 1976-2000Root River near Houston, MN 05385000 1270 Sed.,Temp. 1975-81South Fork Root River near Houston, MN 05385500 275 Sed., Temp. 1975-81Cedar River near Austin, MN 05457000 425 Sed., Temp., S.C. 1971, 73-75, 78-81Des Moines River at Jackson, MN 05476000 1220 C., Bio., D.O., pH, S.C. 1968-69, 73-76, 78, 83, 89-
90, 94-95, 98Sed., Temp 1968-81
Station name Station number Drainage area (mi2) Type of record Period of record

DISCONTINUED SURFACE-WATER-QUALITY STATIONS--Continuedxvi
Roseau, Minnesota - June 12, 2002 - flooding from the Roseau River.
Main Channel [photo courtesy of National Weather Service]ic
e]

1WATER RESOURCES DATA FOR MINNESOTA, 2002
INTRODUCTION
Water Resources Division of the U.S. Geological Survey (USGS), in cooperation with Federal, State, and local agencies, obtains a large amount of data pertaining to the water resources of Minnesota each water year. These data, accumulated during many years, constitute a valuable data base for developing an improved understanding of the water resources of the State. To make these data readily available to interested parties outside the USGS, the data are published annually in this report series entitled "Water-Resources Data Minnesota."
Water-resources data for the 2002 water year (hereinafter 2002) for Minnesota consist of records of stage, discharge, and water quality of streams; and stage of lakes and reservoirs; and water quality of ground water. This volume contains discharge records for 102 stream-gaging sta-tions; stage for 11 lakes and reservoirs; water quality for 6 stream-gaging stations; peak flow data for 89 high-flow partial-record stations; and ground-water levels for 3 ground-water observation wells. These data represent a part of the National Water Data System collected by the USGS and cooper-ating State and Federal agencies in Minnesota.
This series of annual reports for Minnesota began with the 1961 water year with a report that contained only data relating to the quantities of surface water. For the 1964 water year, a similar report was introduced that contained only data relating to water quality. Beginning with the 1975 water year, the report was changed to present, in one volume, data on quantities of surface water, quality of surface and ground water, and ground-water levels.
Prior to introduction of this series and for several water years concur-rent with it, water-resources data for Minnesota were published in U.S. Geological Survey Water-Supply Papers. Data on stream discharge and stage and on lake or reservoir contents and stage, through September 1960, were published annually under the title "Surface-Water Supply of the United States, Parts 4, 5 and 6A." For the 1961 through 1970 water years, the data were published in two 5-year reports. Data on chemical quality, temperature, and suspended sediment for the 1941 through 1970 water years were published annually under the title "Quality of Surface Waters of the United States," and water levels for the 1935 through 1974 water years were published under the title "Ground-Water Levels in the United States." The above mentioned Water-Supply papers can be consulted in the libraries of the principal cities of the United States and may be pur-chased from the U.S. Geological Survey Branch of Information Services, Denver Federal Center, Box 25286, Denver, Colorado 80225.
Publications similar to this report are published annually by the USGS for all States. These official Survey reports have an identification number consisting of the two-letter State abbreviation, the last two dig-its of the water year, and volume number. For example, this volume is identified as the "U.S. Geological Survey Water-Data Report MN-02-1." For archiving and general distribution, the reports for 1971-74 water years also are identified as water-data reports. These water-data reports are for sale in paper copy or in microfiche by the National Technical Information Service, U.S. Department of Commerce, Springfield, Virginia 22161.
Additional information, including current prices, for ordering specific reports may be obtained from the District Chief at the address given on the back of the title page or by telephone (763) 783-3100.
COOPERATION
The USGS and agencies of the State of Minnesota have had cooper-ative agreements for the systematic collection of streamflow records since 1909, for ground-water levels since 1948, and for water-quality records since 1952. Organizations that assisted in collecting data through cooper-ative agreement with the USGS are:
— Minnesota Department of Natural Resources
— Minnesota Department of Transportation — Minnesota Pollution Control Agency — Grand Portage Reservation Tribal Council — Elm Creek Watershed Management Commission — Red River Watershed Management Board — City of Rochester — City of Grand Forks — Bois Forte Reservation Tribal Council — Prairie Island Indian Community — City of Mankato — Prairie Country Resource Conservation District
Assistance in the form of funds or services was given by the U.S. Army Corps of Engineers, U.S. Department of State, and the Federal Energy Reg-ulatory Commission. Other organizations that supplied data are acknowl-edged in station descriptions.
SUMMARY OF HYDROLOGIC CONDITIONS
Precipitation
Most of Minnesota received normal to above normal precipitation ("normal" being the statistical median based on data from 1971-2000) during the 2002 water year (figs. 1 and 2). Central and east-central Minnesota were greater than 9 inches above normal, while northwestern Minnesota was approximately 6 inches above normal. Precipitation totals, unless otherwise stated, are aggregates for the state, or for the nine climatic divisions. These include the northwest, north-central, northeast, west-central, central, east-central, southwest, south-central, and southeast.
Precipitation totals for the first quarter, October 1 to December 31, 2001 ranged from 2.5 inches in the northwest to 6.5 inches in the northeast. The greatest departures from normal were in the north-central and northeast-ern parts of the state, which were 1.2 inches above normal, and northwestern Minnesota, which was 0.9 inches below normal. The remainder of the state was near normal.
Precipitation for the second quarter, January 1 to March 31, 2002, was generally below normal for the entire state. The largest deviations were in the northern one-third as well as the west-central and south-central parts of the state, which were all approximately 1 inch below normal.
For the third quarter, April 1 to June 30, 2002, precipitation totals were above normal for all but the west-central and southwest parts of the state. The largest deviations were in the northwest and west-central parts of the state which were between 3.8 and 4.1 inches above normal. Some of the largest individual precipitation events occurred in the month of June, in the north-western and central parts of the state. Rainfall amounts in excess of 10 inches were reported in parts of northwestern Minnesota. While in north-central Minnesota, amounts exceeded 12 and even 14 inches. Two events contrib-uted to most of these totals. The June 9-10 event alone produced over 12 inches in some areas of Lake of the Woods and Roseau counties. The June 20-23 event produced amounts over 4 inches in nine counties in northern Minnesota. June rainfall totals were in 99th percentile for much of northwest-ern Minnesota.
For the final quarter, July 1 to September 30, 2002, precipitation totals were near normal for most of the state. The exceptions being in the north-west, central, and east-central parts of the state, which were 4.0, 5.9, and 6.5 inches above normal respectively. From July 9 to 11, more than 3 inches fell in a broad area of central to west-central part of the state.
Precipitation data not derived from figures 1 and 2 were obtained through the World Wide Web from the Minnesota State Climatology Office at: http://climate.umn.edu/ or from the Midwestern Regional Climate Center at: http://mcc.sws.uiuc.edu/index.html.

WATER RESOURCES DATA FOR MINNESOTA, 20022
20
24
28
32
36
40
44
inches
inches
inches
inches
inches
inches
inches and above
0 25 50 75 MILES
0 25 50 75 KILOMETERS
48°
46°
44°
94°
92°
92°
90°
96°
Figure 1. Precipitation, in inches, during 2002 water year, in Minnesota.
Base and source Data from MinnesotaDepartment of Natural Resources,Division of Waters, State Climatology Office.
EXPLANATION

WATER RESOURCES DATA FOR MINNESOTA, 2002 3
Base and source Data from MinnesotaDepartment of Natural Resources,Division of Waters, State Climatology Office.
0 25 50 75 MILES
0 25 50 75 KILOMETERS
Figure 2. Average annual precipitation, in inches, for 30-year period, 1971-2000, in Minnesota.
48°
46°
44°
94°
92°
92°
90°
96°
EXPLANATION
19
23
36
27
35
inches
inches
inches
inches
inches
WATER RESOURCES DATA FOR MINNESOTA, 20024
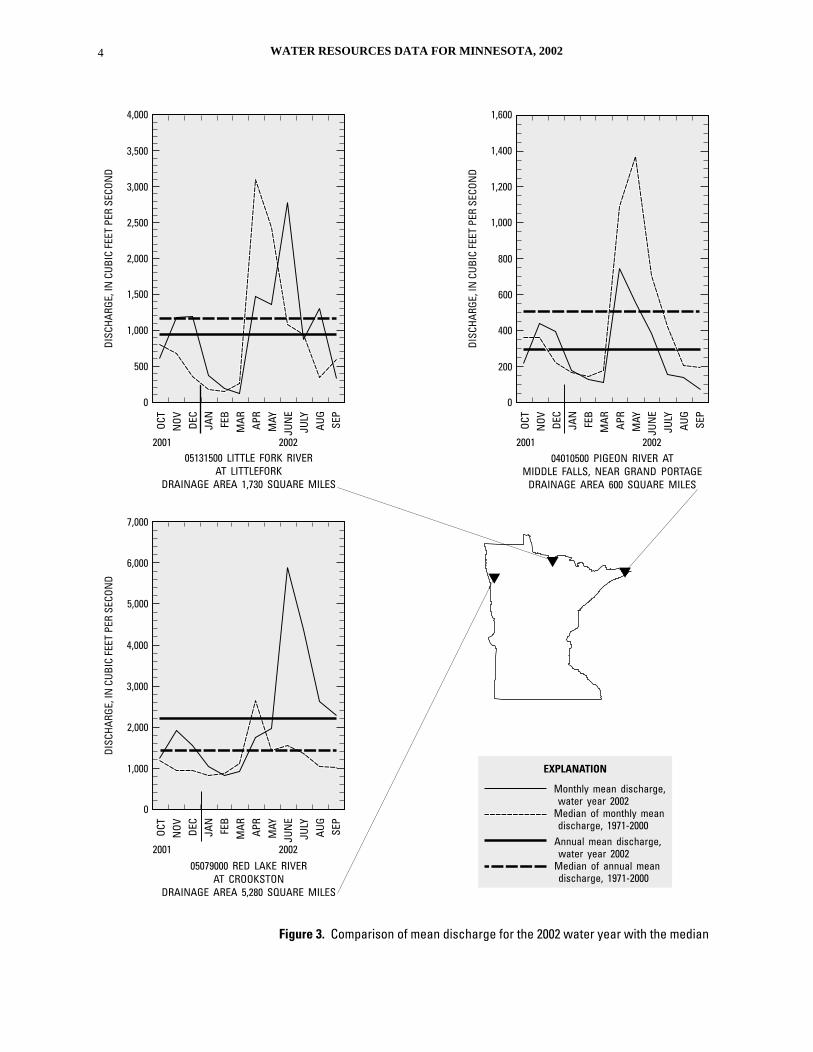
Figure 3. Comparison of mean discharge for the 2002 water year with the median
05131500 LITTLE FORK RIVERAT LITTLEFORK
DRAINAGE AREA 1,730 SQUARE MILES
0
500
1,000
1,500
2,000
2,500
3,000
3,500
4,000DI
SCHA
RGE,
IN C
UBIC
FEE
T PE
R SE
CON
D
05079000 RED LAKE RIVERAT CROOKSTON
DRAINAGE AREA 5,280 SQUARE MILES
0
1,000
2,000
4,000
3,000
5,000
6,000
7,000
DISC
HARG
E, IN
CUB
IC F
EET
PER
SECO
ND
04010500 PIGEON RIVER ATMIDDLE FALLS, NEAR GRAND PORTAGE
DRAINAGE AREA 600 SQUARE MILES
1,600
0
200
400
600
800
1,000
1,200
1,400
DISC
HARG
E, IN
CUB
IC F
EET
PER
SECO
ND
OCT
OCT
2001 20012002 2002
OCT
JAN
JAN
JAN
FEB
FEB
FEB
MAR
MAR
MAR
APR
APR
APR
MAY
MAY
MAY
JUN
E
JUN
EJU
NE
JULY
JULY
JULY
AUG
AUG
AUG
SEP
SEP
SEP
NOV
NOV
NOV
DEC
DEC
DEC
EXPLANATION
Monthly mean discharge,water year 2002
Median of monthly meandischarge, 1971-2000
Annual mean discharge,water year 2002
Median of annual meandischarge, 1971-2000
2001 2002

WATER RESOURCES DATA FOR MINNESOTA, 2002 5
of mean discharges for 1971-2000 at seven long-term representative gaging stations.
05304500 CHIPPEWA RIVERNEAR MILAN
DRAINAGE AREA 1,870 SQUARE MILES
800
900
1,000
0
300
200
100
500
400
700
600
DISC
HARG
E, IN
CUB
IC F
EET
PER
SECO
ND
05227500 MISSISSIPPI RIVERAT AITKIN
DRAINAGE AREA 6,140 SQUARE MILES
0
500
1,000
1,500
2,000
2,500
3,000
3,500
4,000
5,500
6,000
5,000
4,500
DISC
HARG
E, IN
CUB
IC F
EET
PER
SECO
ND
05476000 DES MOINES RIVERAT JACKSON
DRAINAGE AREA 1,220 SQUARE MILES
0
200
400
600
800
1,000
DISC
HARG
E, IN
CUB
IC F
EET
PER
SECO
ND
05280000 CROW RIVERAT ROCKFORD
DRAINAGE AREA 2,520 SQUARE MILES
0
2,000
1,000
3,000
4,000
5,000
6,000
DISC
HARG
E, IN
CUB
IC F
EET
PER
SECO
ND
OCT
OCT
OCT
OCT
JAN
JAN
JAN
JAN
FEB
FEB
FEB
FEB
MAR
MAR
MAR
MAR
APR
APR
APR
APR
MAY
MAY
MAY
MAY
JUN
EJU
NE
JUN
EJU
NE
JULY
JULY
JULY
JULY
AUG
AUG
AUG
AUG
SEP
SEP
SEP
SEP
NOV
NOV
NOV
NOV
DEC
DEC
DEC
DEC
2001 20012002 2002
2001 20012002 2002

WATER RESOURCES DATA FOR MINNESOTA, 20026
Surface Water
Figure 3 shows monthly-mean and annual-mean discharges for water year 2002 compared to normal (median of monthly-mean discharges for the period 1971-2000) for 7 streamflow gaging stations: Little Fork River near Littlefork, Pigeon River at Middle Falls, Red Lake River at Crookston, Chippewa River near Milan, Mississippi River at Aitkin, Des Moines River at Jackson, and Crow River at Rockford. These stations are located in the fol-lowing basins—Lake Superior, Red River of the North, Lake of the Woods, and the upper Mississippi River.
For the first six months of the water year monthly-mean streamflows were near normal at all gaging stations listed above. Pigeon River at Middle Falls and Des Moines River at Jackson, located in the extreme northeast and southwest parts of the state, had discharges in April and May that were from 50 to 100 percent below normal. Flows returned to near normal through the remainder of the water year.
Flows for Chippewa River near Milan were near normal for the entire water year with the exception of August, when flows were nearly 200 percent above normal. Many precipitation reporting stations, including some in and near the Chippewa River Basin, reported rainfall totals over 8 inches for the month of August.
For the remaining four sites, Red Lake River at Crookston, Little Fork River at Littlefork, Mississippi River at Aitkin, and Crow River at Rockford, streamflows in the months of April and May were from 50 to 100 percent below normal. Beginning in early June, heavy rains fell over much of central and northern Minnesota pushing montly-mean streamflows above normal. And over 500 percent of normal in some cases.
Flooding occurred in many areas of northwest and central Minnesota as a result of the heavy rains that fell in June and July. Six stream-gaging sta-tions and 5 high-flow partial record stations (with more than 10 years of record) recorded peak flows of record. The two watersheds with the most sig-nificant flooding were the Wild Rice River and the Roseau River. The USGS gaging station on the Wild Rice River at Twin Valley recorded a peak flow of 19,000 ft3/s with a 500-year recurrence interval. In the Roseau River Basin, the USGS gaging stations Roseau River below South Fork near Malung and Roseau River at Ross each recorded peak flows that were of more than a 500-year recurrence interval. The Roseau River flows through the town of Roseau, of which more that 90 percent was flooded [USGS OFR 02-278 2002, online at: http://nd.water.usgs.gov/pubs/ofr/ofr02278/].
In central Minnesota, the heavy rains caused overland flooding, and flooding due to rapidly rising lake levels. The nearest USGS stream gaging stations such as Crow River at Rockford had relatively minor peak flows in the 10-25 year recurrence interval, or less. No USGS gaging stations were located in areas where more significant peak flows would have been recorded.
Ground-Water Levels
This report includes levels from three ground water wells, all located in surficial-sand and gravel aquifers. The location of these wells is shown in fig-ure 8. All three wells are measured approximately monthly by observers. The well in Watonwan County in southern Minnesota showed declining water levels until July, when levels rose by about 3 feet, then fell over the next 2 months by over 3 feet. The central Minnesota well in Morrison County had water levels fall just over one foot from the beginning of the water year to March, then rose steadily by about 2 feet to the end of the year. The well in northern Minnesota in Beltrami County followed the same pattern as the other two although with more modest changes. It fluctuated less than one foot the entire water year.
SPECIAL NETWORKS AND PROGRAMS
Hydrologic Bench-Mark Network is a network of 50 sites in small drainage basins around the country whose purpose is to provide consistent
data on the streamflow representative of undeveloped watersheds nation-wide, and to provide analyses on a continuing bases to compare and contrast conditions observed in basins more obviously affected by human activities. At 10 of these sites, water-quality information is being gathered on major ions and nutrients, primarily to assess the affects of acid deposition on stream chemistry. Additional information on the Hydrologic Benchmark Program can be found at http://water.usgs.gov/hbn/.
National Stream-Quality Accounting Network (NASQAN) moni-tors the water quality of large rivers within four of the Nation’s largest river basins--the Mississippi, Columbia, Colorado, and Rio Grande. From the year 2000 to 2004 the network will be reduced from approximately 40 stations to just a few index stations on the Colorado and Columbia Rivers so that a net-work of 5 stations can be implemented on the Yukon River. Samples are col-lected with sufficient frequency that the flux of a wide range of constituents can be estimated. The objective of NASQAN is to characterize the water quality of these large rivers by measuring concentration and mass transport of a wide range of dissolved and suspended constituents, including nutrients, major ions, dissolved and sediment-bound heavy metals, common pesticides, and inorganic and organic forms of carbon. This information will be used to (1) describe the long-term trends and changes in concentration and transport of these constituents; (2) test findings of the NAWQA; (3) characterize pro-cesses unique to large-river systems such as storage and re-mobilization of sediments and associated contaminants; and (4) refine existing estimates of off-continent transport of water, sediment, and chemicals for assessing human effects on the world’s oceans and for determining global cycles of carbon, nutrients, and other chemicals. Additional information about the NASQAN Program can be found at http://water.usgs.gov/nasqan/.
The National Atmospheric Deposition Program/National Trends Network (NADP/NTN) provides continuous measurement and assessment of the chemical climate of precipitation throughout the United States. As the lead Federal agency, the USGS works together with over 100 organizations to accomplish the following objectives: (1) Provide a long-term, spatial and temporal record of atmospheric deposition generated from a network of 225 precipitation chemistry monitoring sites. (2) Provide the mechanism to eval-uate ongoing and future regulations intended to reduce atmospheric emis-sions and subsequent impacts to the Nation’s land and water resources. Data from the network, as well as information about individual sites, are available through the World Wide Web at: http://bqs.usgs.gov/acidrain/.
The National Water-Quality Assessment (NAWQA) Program of the USGS is a long-term program with goals to describe the status and trends of water-quality conditions for a large, representative part of the Nation’s ground- and surface-water resources; provide an improved understanding of the primary natural and human factors affecting these observed conditions and trends; and provide information that supports development and evalua-tion of management, regulatory, and monitoring decisions by other agencies.
Assessment activities are being conducted in 59 study units (major watersheds and aquifer systems) that represent a wide range of environmen-tal settings nationwide and that account for a large percentage of the Nation’s water use. A wide array of chemical constituents will be measured in ground water, surface water, streambed sediments, and fish tissues. The coordinated application of comparative hydrologic studies at a wide range of spatial and temporal scales will provide information for decision making by water-resources managers and a foundation for aggregation and comparison of findings to address water-quality issues of regional and national interest.
Communication and coordination between USGS personnel and other local, State, and Federal interests are critical components of the NAWQA. Each study unit has a local liaison committee consisting of representatives from key Federal, State, and local water resources agencies, Indian nations, and universities in the study unit. Liaison committees typically meet semian-nually to discuss their information needs, monitoring plans and progress, desired information products, and opportunities to collaborate efforts among

7WATER RESOURCES DATA FOR MINNESOTA, 2002
the agencies. Additional information about the NAWQA program can be found at http://water.usgs.gov/nawqa.
EXPLANATION OF THE RECORDS
The surface-water and ground-water records published in this report are for the 1999 water year that began October 1, 1998, and ended September 30, 1999. A calendar of the water year is provided on the inside of the front cover. The records contain streamflow data, stage and content data for lakes and reservoirs, water-quality data for the surface and ground water, and ground-water-level data. The following sections of the introductory text are presented to provide users with a more detailed explanation of how the hydrologic data published in this report were collected, analyzed, computed, and arranged for presentation.
STATION IDENTIFICATION NUMBERS
Each data station, whether stream site or well, in this report is assigned a unique identification number. This number is unique in that it applies specifically to a given station. The number usually is assigned when a sta-tion is first established and is retained for that station indefinitely. The sys-tem used by the USGS to assign identification numbers for surface-water stations and for ground-water well sites differ, but both are based on geo-graphic location. The "downstream order" system is used for regular surface-water stations and the "latitude-longitude" system is used for wells and, in Minnesota, for surface-water stations where only miscellaneous measurements are made.
Downstream Order System and Station Number
Since October 1, 1950, the order of listing hydrologic-station records in USGS reports is in a downstream direction along the main stream. All sta-tions on a tributary entering upstream from a main stream station are listed before that station. A station on a tributary that enters between two main-stream sections is listed between them. A similar order is followed by listing stations on first rank, second rank, and other order ranks of tributaries. The rank of any tributary on which a station is situated with respect to the stream to which it is immediately tributary is indicated by an indentation in a list of stations in front of the report. Each indentation represents one rank. This downstream order and system of indention show which stations are on tribu-taries between any two stations and the rank of the tributary on which each station is situated.
As an added means of identification, each hydrologic station and par-tial-record station has been assigned a station number. These are in the same downstream order in this report. In assigning station numbers, no distinction is made between partial-record stations and other stations; therefore, the station number for a partial-record station indicates downstream-order position in a list made up of both types of stations. Gaps are left in the series of numbers to allow for new stations that may be established; hence, the numbers are not consecutive. The complete eight-digit number for each station such as 05041000, which appears just to the left of the station name, includes the two-digit part number "05" plus the six-digit downstream order number "041000."
Numbering System for Wells and Miscellaneous Sites
The eight-digit downstream order station numbers are not assigned to wells and miscellaneous sites where only random water-quality samples or discharge measurements are taken.
The well and miscellaneous site numbering system of the USGS is based on the grid system of latitude and longitude. The system pro-vides the geographic location of the well or miscellaneous site and a unique number for each site. The number consists of 15 digits. The first six digits denote the degrees, minutes, and seconds of latitude, the next seven digits denote degrees, minutes, and seconds of longitude, and the last two digits (assigned sequentially) identify the wells or other sites
within a one-second grid. See figure 4. Each well site is also identified by a local well number, which consists of township, range, and section num-bers, three letters designating 1/4, 1/4, 1/4 section location, and a two-digit sequential number.
RECORDS OF STAGE AND WATER DISCHARGE
Records of stage and water discharge may be complete or partial. Complete records of discharge are those obtained using a continuous stage-recording device through which either instantaneous or mean- daily dis-charge may be computed for anytime, or any period of time, during the period of record. Complete records of lake or reservoir content, similarly, are those for which stage or content may be computed or estimated with reason-able accuracy for any time, or period of time. They may be obtained using a continuous stage-recording device, but need not be. Because daily-mean dis-charges and end-of-day contents commonly are published for such stations, they are referred to as "daily stations."
By contrast, partial records are obtained through discrete measure-ments without using a continuous stage-recording device and pertain only to a few flow characteristics, or perhaps only one. The nature of the partial record is indicated by table titles such as "High-flow partial records," or "Low-flow partial records." Records of miscellaneous discharge measure-ments or of measurements from special studies, such as low-flow seepage studies, may be considered as partial records, but they are presented sepa-rately in this report. Location of all continuous-record, surface-water-qual-ity, and high-flow partial-record stations for which data are given in this report are shown in figures 5, 6, and 7.
Data Collection and Computation
The data obtained at a complete-record gaging station on a stream or canal consist of a continuous record of stage, individual measurements of discharge throughout a range of stages, and notations regarding factors that may affect the relations between stage and discharge. These data, together with supplemental information, such as weather records, are used to compute daily discharges. The data obtained at a complete-record gaging station on a lake or reservoir consist of a record of stage and of notations regarding factors that may affect the relation between stage and lake content. These data are used with stage-area and stage-capacity curves or tables to compute water-surface areas and lake storage.
Records of stage are obtained with recorders that trace continuous graphs of stage or encode stage values at selected time intervals and store on a variety of media. Measurements of discharge are made with current meters using methods adapted by the USGS as a result of experience accumulated since 1880. These methods are described in standard text-books, in U.S. Geological Survey Water-Supply Paper 2175, and in
Coordinates for well B464613095524802
Coordinates for well A464613095524801
A B
46°46'14"
46°46'13"
46°46'12"
95°5
2'49
"
95°5
2'48
"
95°5
2'47
"
Figure 4. Example of system for numbering wellsand miscellaneous sites.

WATER RESOURCES DATA FOR MINNESOTA, 20028
U.S. Geological Survey Techniques of Water-Resources Investigations (TWRI), book 3, chapter A6.
In computing discharge records, results of individual mea-surements are plotted against the corresponding stages, and stage-dis-charge relation curves are then constructed. From these curves, rating tables indicating the approximate discharge for any stage within the range of the measurements are prepared. If it is necessary to define extremes of discharge outside the range of current-meter measurements, the curves are extended using: (1) logarithmic-plotting; (2) velocity-area studies; (3) results of indirect measurements of peak discharge, such as slope-area or contracted-opening measurements, and computations of flow-over-dams or weirs; or (4) step-backwater techniques.
Daily-mean discharges are computed by applying the daily-mean stages (gage heights) to the stage-discharge curves or tables. If the stage-discharge relation is subject to change because of frequent or continual change in the physical features that form the control, the daily-mean dis-charge is determined by the shifting-control method, in which correction factors based on the individual discharge measurements and notes of the personnel making the measurements are applied to the gage heights before the discharges are determined from the curves or tables. This shift-ing-control method also is used if the stage-discharge relation is changed temporarily because of aquatic growth or debris on the control. For some stations, formation of ice in the winter may so obscure the stage-discharge relations that daily-mean discharges must be estimated from other information such as temperature and precipitation records, notes of observations, and records for other stations in the same or nearby basins for comparable periods.
At some stream-gaging stations the stage-discharge relation is affected by the backwater from reservoirs, tributary streams, or other sources. This necessitates the use of the slope method in which the slope or fall in a reach of the stream is a factor in computing discharge. The slope or fall is obtained by means of an auxiliary gage set at some distance from the base gage. At some stations the stage-discharge relation is affected by changing stage. At these stations the rate of change in stage is used as a factor in computing discharge.
In computing records of lake or reservoir contents, it is necessary to have available from surveys, curves, or tables defining the relation of stage and content. The application of stage to the stage-content curves or tables gives the contents from which daily, monthly, or yearly changes then are determined. If the stage-content relation changes because of deposition of sediment in a lake or reservoir, periodic resurveys may be necessary to redefine the relation. Even when this is done, the contents computed may become increasingly in error as time since the last survey increases. Discharge over lake or reservoir spillways are computed from stage-dis-charge relations much as other stream discharges are computed.
For some gaging stations there are periods when no gage-height record is obtained, or the recorded gage height is so faulty that it cannot be used to compute daily discharge or contents. For such periods, the daily discharges are estimated from the recorded range in stage, previous or following record, discharge measurements, weather records, and compar-ison with other station records from the same or nearby basins. Likewise, daily contents may be estimated from operator’s logs, previous or follow-ing record, inflow-outflow studies, and other information. Information explaining how estimated daily-discharge values are identified in station records is included in the next two sections, "Data Presentation" (REMARKS paragraph) and "Identifying Estimated Daily Discharge."
Data Presentation
Streamflow data in this report are presented in a new format that is considerably different from the format in data reports prior to the 1991 water year. The major changes are that statistical characteristics of discharge now appear in tabular summaries following the water-year
data table and less information is provided in the text or station manuscript above the table. These changes represent the results of a pilot program to reformat the annual water-data report to meet current user needs and data preferences.
The records published for each continuous-record surface-water discharge station (gaging station) now consist of four parts: the manuscript or station description; the data table of daily-mean values of discharge for the current water year with summary data; a tabular statistical summary of monthly-mean-flow data for a designated period, by water year; and a summary statistics table that includes statistical data of annual, daily and instantaneous flows as well as data pertaining to annual runoff, 7-day low-flow minimums, and flow duration.
Station Manuscript
The manuscript provides, under various headings, descriptive infor-mation, such as station location, period of record, historical extremes out-side the period of record, record accuracy, and other remarks pertinent to station operation and regulation. The following information, as appropriate, is provided with each continuous record of discharge or lake content. Com-ments to follow clarify information presented under the various headings of the station description.
LOCATION--Information on locations is obtained from the most accurate maps available. The location of the gage with respect to the cultural and physical features in the vicinity and with respect to the reference place mentioned in the station name is given. River mileages, given for only a few stations, were determined by methods given in "River Mileage Mea-surement," Bulletin 14, Revision of October 1968, prepared by the Water Resources Council or were provided by the U.S. Army Corps of Engineers.
DRAINAGE AREA--Drainage areas are measured using the most accurate maps available. Because the type of maps available varies from one drainage basin to another, the accuracy of drainage areas likewise var-ies. Drainage areas are updated as better maps become available.
PERIOD OF RECORD--This indicates the period for which there are published records for the station or for an equivalent station. An equivalent station is one that was in operation at a time when the present station was not, and whose location was such that records from it can rea-sonably be considered equivalent with records from the present station.
REVISED RECORDS--Published records, because of new infor-mation, occasionally are found to be incorrect, and revisions are printed in later reports. Listed under this heading are all reports in which revisions have been published for the station and water years to which the revisions apply. If a revision did not include daily, monthly, or annual figures of discharge, that fact is noted after the year dates as follows: "(M)" means that only the instantaneous maximum discharge was revised; "(m)" means that only the instantaneous minimum was revised; and "(P)" means that only peak discharges were revised. If the drainage area has been revised, the report in which the most recently revised figure was first published is given.
GAGE--The type of gage in current use, the datum of the current gage referred to National Geodetic Vertical Datum of 1929 (see glossary), and a condensed history of the types, locations, and datum of previous gages are given under this heading.
REMARKS--All periods of estimated daily-discharge record will either be identified by date in this paragraph of the station description for water-discharge stations or flagged in the daily-discharge table. If a remarks statement is used to identify estimated record, the paragraph will begin with this information presented as the first entry. The paragraph is also used to present information relative to the accuracy of the records, to special methods of computation, to conditions that affect natural flow at the station and, possibly, to other pertinent items. For reservoir

9WATER RESOURCES DATA FOR MINNESOTA, 2002
stations, information is given on the dam forming the reservoir, the capac-ity, outlet works and spillway, and purpose and use of the reservoir.
COOPERATION--Records provided by a cooperating organization or obtained for the USGS by a cooperating organization are identified here.
EXTREMES OUTSIDE PERIOD OF RECORD--Included here is the information concerning major floods or unusually low flows that occurred outside the stated period of record. The information may or may not have been obtained by the USGS.
REVISIONS--If errors in published water-quality records are discov-ered after publication, appropriate updates are made in the U.S. Geological Survey’s distributed data system NWIS, and subsequently to its web-based National data system, NWISWeb [http://water.usgs.gov/nwis/nwis]. Because the usual volume of updates makes it impractical to document indi-vidual changes in the State data-report series or elsewhere, potential users of U.S. Geological Survey water-quality data are encouraged to obtain all required data from NWIS or NWISWeb to ensure the most recent updates. Updates to NWISWeb are currently made on an annual basis.
Manuscript information for lake or reservoir stations differs from that for stream stations in the nature of the "Remarks" and to the inclusion of a skeleton stage-capacity table when daily contents are given.
Headings for AVERAGE DISCHARGE, EXTREMES FOR PERIOD OF RECORD, AND EXTREMES FOR CURRENT YEAR have been deleted and the information contained in these paragraphs, except for the listing of secondary instantaneous peak discharges in the EXTREMES FOR CURRENT YEAR paragraph, is now presented in the tabular sum-maries following the discharge table or in the REMARKS paragraph, as appropriate. No changes have been made to the data presentations of lake contents.
Peak Discharges Greater Than Base Discharge
Tables of peak discharges above base discharge are included for some stations where secondary instantaneous peak discharges are used in flood-frequency studies of highway and bridge design, flood-control structures, and other flood-related projects. The base discharge value is selected so an average of three peaks a year will be reported. This base discharge value has a recurrence interval of approximately 1.1 years.
Data Table of Daily-Mean Values
The daily table of discharge records for stream-gaging stations gives mean discharge for each day of the water year. In the monthly summary for the table, the line headed TOTAL gives the sum of the daily figures for each month; the line headed MEAN gives the average flow in cubic feet per second for the month; and the lines headed MAX and MIN give the maximum and minimum daily-mean discharges, respectively, for each month. Discharge for the month also is usually expressed in cubic feet per second per square mile (line headed CFSM); or in inches (line headed IN); or in acre-feet (line headed AC-FT). Figures for cubic feet per second per square mile and runoff in inches or in acre-feet may be omitted if there is extensive regulation or diversion or if the drainage area includes large noncontributing areas. At some stations, monthly and (or) yearly observed discharges are adjusted for reservoir storage or diversion, or diversion data or reservoir contents are given. These figures are identified by a symbol and corresponding footnote.
Statistics of Monthly-Mean Data
A tabular summary of the mean (line headed MEAN), maximum (line headed MAX), and minimum (line headed MIN) of monthly-mean flows for each month for a designated period is provided below the mean values table. The water years of the first occurrence of the maximum and minimum monthly flows are provided immediately below those figures. The designated period will be expressed as FOR WATER YEARS
19__-19__, BY WATER YEAR (WY), and will list the first and last water years of the range of years selected from the PERIOD OF RECORD para-graph in the station manuscript. It will consist of all of the station record within the specified water years, inclusive, including complete months of record for partial water years, if any, and may coincide with the period of record for the station. The water years for which the statistics are computed will be consecutive, unless a break in the station record is indi-cated in the manuscript.
Summary Statistics
A table titled SUMMARY STATISTICS follows the statistics of monthly mean data tabulation. This table consists of four columns, with the first column containing the line headings of the statistics being reported. The table provides a statistical summary of yearly, daily, and instantaneous flows, not only for the current water year but also for the pre-vious calendar year and for a designated period, as appropriate. The des-ignated period selected, WATER YEARS 19__-19__, will consist of all of the station record within the specified water years, inclusive, including com-plete months of record for partial water years, if any, and may coincide with the period of record for the station. The water years for which the statistics are computed will be consecutive, unless a break in the station record is indicated in the manuscript. All of the calculations for the statis-tical characteristics designated ANNUAL (see line headings below), except for the ANNUAL 7-DAY MINIMUM statistic, are calculated for the designated period using complete water years. The other statis-tical characteristics may be calculated using partial water years.
The date or water year, as appropriate, of the first occurrence of each statistic reporting extreme values of discharge is provided adjacent to the statistic. Repeated occurrences may be noted in the REMARKS paragraph of the manuscript or in footnotes. Because the designated period may not be the same as the station period of record published in the manuscript, occasionally the dates of occurrence listed for the daily and instanta-neous extremes in the designated-period column may not be within the selected water years listed in the heading. When this occurs, it will be noted in the REMARKS paragraph or in footnotes. Selected streamflow duration curve statistics and runoff data are also given. Runoff data may be omitted if there is extensive regulation or diversion of flow in the drain-age basin.
The following summary statistics data, as appropriate, are provided with each continuous record of discharge. Comments to follow clarify information presented under the various line headings of the summary sta-tistics table.
ANNUAL TOTAL--The sum of the daily-mean values of discharge for the year. At some stations the yearly-mean discharge is adjusted for res-ervoir storage or diversion. The adjusted figures are identified by sym-bol and corresponding footnotes.
ANNUAL MEAN--The arithmetic mean of the individual daily-mean discharges for the year noted or for the designated period. At some stations the yearly-mean discharge is adjusted for reservoir storage or diversion. The adjusted figures are identified by a symbol and cor-responding footnotes.
HIGHEST ANNUAL MEAN--The maximum annual-mean dis-charge occurring for the designated period.
LOWEST ANNUAL MEAN--The minimum annual-mean discharge occurring for the designated period.
HIGHEST DAILY MEAN--The maximum daily-mean discharge for the year or for the designated period.
LOWEST DAILY MEAN--The minimum daily-mean discharge for the year or for the designated period.

WATER RESOURCES DATA FOR MINNESOTA, 200210
ANNUAL 7-DAY MINIMUM--The lowest mean discharge for 7 consecutive days for a calendar year or a water year. Note that most low-flow frequency analyses of annual 7- day minimum flows use a climatic year (April 1-March 31). The date shown in the summary statistics table is the initial date of the 7-day period. (This value should not be confused with the 7-day 10-year low-flow statistic.)
MAXIMUM PEAK FLOW--The maximum instantaneous peak dis-charge occurrin for the water year or designated period. Occaisionally the maximum flow for a year may occur at midnight at the beginning or end of the year. In this case, the maximum peak flow is given in the table and the maximum flow may be reported in a footmote or REMARKS paragraph in the manuscript.
MAXIMUM PEAK STAGE--The maximum instantaneous peak stage occurring for the water year or designated period. Occaisionally the maximum flow for a year may occur at midnight at the beginnning or end of the year, on a recession from or rise toward a higher peak in the adjoining year. In this case, the maximum peak stage is given in the table and the max-imum stage may be reported in the REMARKS paragraph in the manuscript or in a footnote. If the dates of occurrence of the maximum peak stage and maximum peak flow are different, the REMARKS paragraph in the manu-script or a footmote may be used to provide further information.
INSTANTANEOUS LOW FLOW--The minimum instantaneous discharge occurring for the water year or for the designated period.
ANNUAL RUNOFF--Indicates the total quantity of water in runoff for a drainage area for the year. Data reports may use any of the following units of measurement in presenting annual runoff data.
Acre-foot (AC-FT) is the quantity of water required to cover 1acre to a depth of 1 foot and is equivalent to 43,560 cubic feet or about326,000 gallons or 1,233 cubic meters.
Cubic feet per second per square mile (CFSM) is the averagenumber of cubic feet of water flowing per second from each squaremile of area drained, assuming the runoff is distributed uniformly intime and area.
Inches (INCHES) indicates the depth to which the drainage areawould be covered if all of the runoff for a given time period were uni-formly distributed on it.
10 PERCENT EXCEEDS--The discharge that is exceeded by 10 per-cent of the flow for the designated period.
50 PERCENT EXCEEDS--The discharge that is exceeded by 50 per-cent of the flow for the designated period.
90 PERCENT EXCEEDS--The discharge that is exceeded by 90 per-cent of the flow for the designated period.
Data collected at partial-record stations follow the information for continuous-record sites. Data for partial-record discharge stations are presented in two tables. The first is a table of discharge measurements at low-flow partial-record stations, and the second is a table of annual maxi-mum stage and discharge at crest-stage stations. The tables of partial-record stations are followed by a listing of discharge measurements made at sites other than continuous-record or partial-record stations. These mea-surements are generally made in times of drought or flood to give better areal coverage to those events. Those measurements and others collected for some special reason are called measurements at miscellaneous sites.
Identifying Estimated Daily Discharge
Estimated daily-discharge values published in the water-discharge tables of annual State data reports are identified either by flagging individual daily values with the letter symbol "e" and printing a table footnote, "e
Estimated," or by listing the dates of the estimated record in the REMARKS paragraph of the station description.
Accuracy of the Records
The accuracy of streamflow records depends primarily on: (1) The stability of the stage-discharge relation or, if the control is unstable, the frequency of discharge measurements; and (2) the accuracy of measure-ments of stage, measurements of discharge, and interpretation of records.
The accuracy attributed to the records is indicated under REMARKS. "Excellent" means that about 95 percent of the daily dis-charges are within 5 percent of the true; "good," within 10 percent; and "fair," within 15 percent. Records that do not meet the criteria mentioned are rated "poor." Different accuracies may be attributed to different parts of a given record.
Daily-mean discharges in this report are given to the nearest hun-dredth of a cubic foot per second for values less than 1 ft3/s; to the nearest tenth between 1.0 and 10 ft3/s; to whole numbers between 10 and 1,000 ft3/s; and to 3 significant figures for more than 1,000 ft3/s. The number of significant figures used is based solely on the magnitude of the discharge value. The same rounding rules apply to discharges listed for par-tial-record stations and miscellaneous sites.
Discharge at many stations, as indicated by the monthly mean, may not reflect natural runoff due to the effects of diversion, consumption, regulation by storage, increase or decrease in evaporation due to artificial causes, or to other factors. For such stations, figures of cubic feet per second per square mile and of runoff, in inches, are not published unless satisfactory adjustments can be made for diversions, for changes in contents of reservoirs, or for other changes incident to use and control. Evaporation from a reservoir is not included in the adjustments for changes in reservoir contents, unless it is so stated. Even at those stations where adjustments are made, large errors in computed runoff may occur if adjustments or losses are large in comparison with the observed discharge
Other Records Available
Information of a more detailed nature than that published for most of the gaging stations, such as observations of water temperatures, discharge measurements, gage-height records, and rating tables, is on file in the Minnesota District office. Also most gaging-station records are available in computer-usable form and many statistical analyses have been made.
Information on the availability of unpublished data or statistical analyses may be obtained from the district office.
The National Water Data Exchange, Water Resources Division, U.S. Geological Survey, National Center, Reston, VA 22092, maintains an index of all discharge-measurement sites in the State as well as an index of records of discharge collected by other agencies but not published by the USGS. Information on records available at specific sites can be obtained upon request.
RECORDS OF SURFACE-WATER QUALITY
Records of surface-water quality ordinarily are obtained at or near stream-gaging stations because interpretation of records of surface-water quality nearly always requires corresponding discharge data. Records of surface-water quality in this report may involve a variety of types of data and measurement frequencies.
Classification of Records
Water-quality data for surface-water sites are grouped into one of three classifications. A continuing record station is a site where data are col-lected on a regularly scheduled basis. Frequency may be one or more times daily, weekly, monthly, or quarterly. A partial-record station is a site

11WATER RESOURCES DATA FOR MINNESOTA, 2002
where limited water-quality data are collected systematically over a period of years. Frequency of sampling is usually less than quarterly. A miscellaneous sampling site is a location other than a continuing or partial-record station, where random samples are collected to give better areal coverage to define water-quality conditions in the river basin.
A distinction needs to be made between "continuing records," as used in this report, and "continuous recordings," which refers to a contin-uous graph or a series of discrete values punched at short intervals on a paper tape. Some records of water quality, such as temperature and specific conductance, may be obtained through continuous recordings; however, most data are obtained only monthly or less frequently. Locations of stream-gaging stations for which records on the quality of surface water appear in this report are shown in figure 6.
Arrangement of Records
Water-quality records collected at a surface-water daily record station are published immediately following that record, regardless of the frequency of sample collection. Station number and name are the same for both records. Where a surface-water daily-record station is not available or where the water quality differs significantly from that at the nearby surface-water station, the continuing water-quality record is published with its own station number and name in the regular downstream-order sequence. Water-quality data for partial-record stations and for miscellaneous sam-pling sites appear in separate tables following the table of discharge mea-surements at miscellaneous sites.
On-Site Measurement and Sample Collection
Water-quality data must be representative of the in situ quality of water. To assure this, certain measurements, such as water temper-ature, pH, and dissolved oxygen, need to be made onsite when the samples are taken. To assure that measurements made in the laboratory also rep-resent the in situ water, carefully prescribed procedures need to be fol-lowed in collecting the samples, in treating the samples to prevent changes in quality pending analysis, and in shipping the samples to the labora-tory. Procedures for on-site measurements and for collecting, treating, and shipping samples are given in publications on "Techniques of Water-Resource Investigations," book 1, chap. D2; book 3, chap. C2; book 5 chaps. A1, A3, and A4; book 9, chap. A1-A9. All of these references are listed on pages 22-24 of this report. Also, detailed information on col-lecting, treating, and shipping samples may be obtained from the USGS Minnesota District office.
One sample can define adequately the water quality at a given time if the mixture of solutes throughout the stream cross section is homogeneous. However, the concentration of solutes at different locations in the cross section may vary widely with different rates of water discharge, depend-ing on the source of material and the turbulence and mixing of the stream. Some streams must be sampled through several vertical sections to obtain a representative sample needed for an accurate mean concentration and for use in calculating load. All samples obtained for the National Stream Quality Accounting Network (see definitions) are obtained from at least several verticals. Whether samples are obtained from the centroid of flow or from several verticals depends on flow conditions and other factors which must be evaluated by the collector.
Chemical-quality data published in this report are considered to be the most representative values available for the stations listed. The values reported represent water-quality conditions at the time of sampling as much as possible, consistent with available sampling techniques and methods of analysis. In the rare case where an apparent inconsistency exists between a reported pH value and the relative abundance of carbon diox-ide species (carbonate and bicarbonate), the inconsistency is the result of a slight uptake of carbon dioxide from the air by the sample between measurement of pH in the field and determination of carbonate and bicar-bonate in the laboratory.
For chemical-quality stations equipped with digital monitors, the records consist of daily maximum, minimum, and mean values for each con-stituent measured and are based upon hourly punches beginning at 0100 hours and ending at 2400 hours for the day of record. More detailed records (hourly values) may be obtained from the USGS Minnesota District office.
Water Temperature
Water temperatures are measured at most of the water-quality stations. In addition, water temperatures are taken at time of discharge measure-ments for water-discharge stations. For stations where water temperatures are taken manually once or twice daily, the water temperatures are taken at about the same time each day. Large streams have a small diurnal temperature change; shallow streams may have a daily range of several degrees and may follow closely the changes in air temperature. Some streams may be affected by waste-heat discharges.
At stations where recording instruments are used, either mean temper-atures or maximum and minimum temperatures for each day are published. Water temperatures measured at the time of water-discharge measurements are on file in the Minnesota District office.
Sediment
Suspended-sediment concentrations are determined from samples collected by using depth-integrating samplers. Samples usually are obtained at several verticals in the cross section, or a single sample may be obtained at a fixed point and a coefficient applied to determine the mean concentration in the cross sections.
During periods of rapidly changing flow or rapidly changing con-centration, samples may have been collected more frequently (twice daily or, in some instances, hourly). The published sediment discharges for days of rapidly changing flow or concentration were computed by the sub-divided-day method (time-discharge weighted average). Therefore, for those days when the published sediment discharge value differs from the value computed as the product of discharge times mean concentration times 0.0027, the reader can assume that the sediment discharge for that day was computed by the subdivided-day method. For periods when no samples were collected, daily loads of suspended sediment were esti-mated on the basis of water discharge, sediment concentrations observed immediately before and after the periods, and suspended-sedi-ment loads for other periods of similar discharge.
At other stations, suspended-sediment samples were collected period-ically at many verticals in the stream cross section. Although data collected periodically may represent conditions only at the time of observations, such data are useful in establishing seasonal relations between quality and streamflow and in predicting long-term sediment-discharge characteris-tics of the stream.
In addition to the records of suspended-sediment discharge, records of the periodic measurements of the particle-size distribution of the sus-pended sediment and bed material are included for some stations.
Laboratory Measurements
Samples for indicator bacteria and specific conductance are ana-lyzed locally. All other samples are analyzed in the Geological Survey laboratories in Arvada, Colorado; Doraville, Georgia; or Iowa City, Iowa. Methods used in analyzing sediment samples and computing sediment records are given in U.S. Geological Survey Techniques of Water Resources Investigations, book 5, chap. C1. Methods used by the USGS laboratories are given in U.S. Geological Survey Techniques of Water Resources Inves-tigation, book 1, chap. D2; book 3, chap. C2; book 5, chaps. A1, A3, and A4.

WATER RESOURCES DATA FOR MINNESOTA, 200212
Data Presentation
For continuous-record stations, information pertinent to the history of station operation is provided in descriptive headings preceding the tabular data. These descriptive headings give details regarding location, drainage area, period of record, type of data available, instrumentation, general remarks, cooperation, and extremes for parameters currently measured daily. Tables of chemical, physical, biological, radiochemical data, and so forth, obtained at a frequency less than daily are presented first. Tables of daily values of specific conductance, pH, water tem-perature, dissolved, and suspended sediment then follow in sequence.
In the descriptive headings, if the location is identical to that of the discharge gaging station, neither the LOCATION nor the DRAINAGE AREA statements are repeated. The following information, when appropriate, is provided with each continuous-record station. Comments that follow clarify information presented under the various headings of the station description.
LOCATION--See "Data Presentation" under "Records of Stage and Water Discharge;" same comments apply.
DRAINAGE AREA--See "Data Presentation" under "Records of Stage and Water Discharge;" same comments apply.
PERIOD OF RECORD--This indicates the periods for which there are published water-quality records for the station. The periods are shown separately for records of parameters measured daily or continu-ously and those measured less than daily. For those measured daily or con-tinuously, periods of record are given for the parameters individually.
INSTRUMENTATION--Information on instrumentation is given only if a water-quality monitor, temperature recorder, sediment pumping sampler, or other sampling device is in operation at a station.
REMARKS--Remarks provide added information pertinent to the col-lection, analysis, or computation of the records.
COOPERATION--Records provided by a cooperating organi-zation or obtained for the USGS by a cooperating organization are identified here.
EXTREMES--Maximums and minimums are given only for param-eters measured daily or more frequently. None are given for parameters measured weekly or less frequently, because the true maximums or min-imums may not have been sampled. Extremes, when given, are provided for both the period of record and for the current water year.
REVISIONS--If errors in published water-quality records are discov-ered after publication, appropriate updates are made to the Water-Quality File in the U.S. Geological Survey’s computerized data system, WAT-STORE, and subsequently by monthly transfer of update transactions to the U.S. Environmental Protection Agency’s STORET system. Because the usual volume of updates makes it impractical to document individual changes in the State data-report series or elsewhere, potential users of USGS water-quality data are encouraged to obtain all required data from the appropriate computer file to ensure the most recent updates.
The surface-water-quality records for partial-record stations and miscellaneous sampling sites are published in separate tables following the table of discharge measurements at miscellaneous sites. No descriptive statements are given for these records. Each station is published with its own station number and name in the regular downstream-order sequence.
Remark Codes
The following remark codes may appear with the water-quality data in this report:
PRINTEDOUTPUT REMARK
e Estimated value
> Actual value is known to be greater than the value shown
< Actual value is known to be less than the value shown
K Results based on colony count outside the acceptance range (non-ideal colony count)
L Biological organisms count less than 0.5 percent (organisms may be observed rather than counted)
D Biological organism count equal to or greater than 15 percent (dominant)
M Presence of material verified, but not quantified.
V Analyte was detected in both the environmental sam-ple and the associated blanks
& Biological organism estimated as dominant.
Water Quality-Control Data
Data generated from quality-control (QC) samples are a requisite for evaluating the quality of the sampling and processing techniques as well as data from the actual samples themselves. Without QC data, environmental sample data cannot be adequately interpreted because the errors associated with the sample data are unknown. The various types of QC samples col-lected by this district are described in the following section. Procedures have been established for the storage of water-quality-control data within the USGS. These procedures allow for storage of all derived QC data and are identified so that they can be related to corresponding environmental sam-ples.
Blank Samples
Blank samples are collected and analyzed to ensure that environmental samples have not been contaminated by the overall data-collection process. The blank solution used to develop specific types of blank samples is a solu-tion that is free of the analytes of interest. Any measured value signal in a blank sample for an analyte (a specific component measured in a chemical analysis) that was absent in the blank solution is believed to be due to con-tamination. There are many types of blank samples possible, each designed to segregate a different part of the overall data-collection process. The types of blank samples collected in this district are:
FIELD BLANK--a blank solution that is subjected to all aspects of sample collection, field processing preservation, transportation, and labora-tory handling as an environmental sample.
TRIP BLANK--a blank solution that is put in the same type of bottle used for an environmental sample and kept with the set of sample bottles before and after sample collection.
EQUIPMENT BLANK--a blank solution that is processed through all equipment used for collecting and processing an environmental sample (sim-ilar to a field blank but normally done in the more controlled conditions of the office).
SAMPLER BLANK--a blank solution that is poured or pumped through the same field sampler used for collecting an environmental sample.
FILTER BLANK--a blank solution that is filtered in the same manner and through the same filter apparatus used for an environmental sample.
SPLITTER BLANK--a blank solution that is mixed and separated using a field splitter in the same manner and through the same apparatus used for an environmental sample.

13WATER RESOURCES DATA FOR MINNESOTA, 2002
PRESERVATION BLANK--a blank solution that is treated with the sampler preservatives used for an environmental sample.
Reference Samples
Reference material is a solution or material prepared by a laboratory whose composition is certified for one or more properties so that it can be used to assess a measurement method. Samples of reference material are sub-mitted for analysis to ensure that an analytical method is accurate for the known properties of the reference material. Generally, the selected reference material properties are similar to the environmental sample properties.
Replicate Samples
Replicate samples are a set of environmental samples collected in a manner such that the samples are thought to be essentially identical in com-position. Replicate is the general case for which a duplicate is the special case consisting of two samples. Replicate samples are collected and analyzed to establish the amount of variability in the data contributed by some part of the collection and analytical process. There are many types of replicate samples possible, each of which may yield slightly different results in a dynamic hydrologic setting, such as a flowing stream. The types of replicate samples collected in this district are:
SEQUENTIAL SAMPLE--a type of replicate sample in which the samples are collected one after the other, typically over a short time.
SPLIT SAMPLE--a type of replicate sample in which a sample is split into subsamples contemporaneous in time and space.
Spike Samples
Spike samples are samples to which known quantities of a solution with one or more well-established analyte concentrations have been added. These samples are analyzed to determine the extent of matrix interference or deg-radation on the analyte concentration during sample processing and analysis.
Dissolved Trace-Element Concentrations
Traditionally, dissolved trace-element concentrations have been reported at the microgram per liter (µg/L) level. Recent evidence, mostly from large rivers, indicates that actual dissolved-phase concentrations for a number of trace elements are within the range of 10’s to 100’s of nanograms per liter (ng/L). Data above the µg/L level should be viewed with caution. Such data may actually represent elevated environmental concentrations from natural or human causes; however, these data could reflect contamina-tion introduced during sampling, processing, or analysis. To confidently produce dissolved trace-element data with insignificant contamination, the USGS began using new trace-element protocols at some stations in water year 1994.
Change in National Trends Network Procedures
Sample handling procedures at all National Trends Network stations were changed substantially on January 11, 1994, in order to reduce contam-ination from the sample shipping container. The data for samples before and after that date are different and not directly comparable. A tabular summary of the differences based on a special intercomparison study is available from the NADP Program Office, Illinois State Water Survey, 2204 Griffith Drive, Champaign, IL 61820-7495 (217-333-7873).
RECORDS OF GROUND-WATER QUALITY
Records of ground-water quality in this report differ from other types of records in that for most sampling sites they consist of only one set of measurements for the water year. The quality of ground water ordi-narily changes only slowly; therefore, for most general purposes one annual sampling, or only a few samples taken at infrequent intervals dur-ing the year, is sufficient. Frequent measurement of the same constitu-ents is not necessary unless one is concerned with a particular problem, such
as monitoring for trends in nitrate concentration. In the special cases where the quality of ground water may change more rapidly, more frequent measurements are made to identify the nature of the changes.
Data Collection and Computation
The records of ground-water quality in this report were obtained mostly as a part of special studies in specific areas. Consequently, a number of chemical analyses are presented for some counties, but none are presented for others. As a result, the records for this year, by themselves, do not provide a balanced view of ground-water quality statewide. Such a view can be attained only by considering records for this year in context with similar records obtained for these and other counties in earlier years.
Most methods for collecting and analyzing water samples are described in the U.S. Geological Survey Techniques of Water-Resources Investigation manuals listed on pages 22-25. The values reported in this report represent water-quality conditions at the time of sampling as much as possible, consistent with available sampling tech-niques and methods of analysis. All samples were obtained by trained personnel. The wells sampled were pumped long enough to assure that the water collected came directly from the aquifer and had not stood for a long time in the well casing where it would have been exposed to the atmo-sphere and to the material, possibly metal, comprising the casings.
Data Presentation
The records of ground-water quality are published in the section enti-tled QUALITY OF GROUND WATER. Data for quality of ground water are listed alphabetically, by county, and are identified by well number. The prime identification number for wells sampled is the 15-digit number derived from the latitude-longitude locations. No descriptive statements are given for ground-water-quality records; however, the well number, depth of well, date of sampling, and other pertinent data are given in the table containing the chemical analyses of the ground water. The REMARK codes listed for surface-water-quality records also are applicable to ground-water-quality records.
ACCESS TO USGS WATER DATA
The USGS provides near real-time stage and discharge data for many of the gaging stations (equipped with the necessary telemetry) and historic daily-mean and peak-flow discharge data for most current and discontinued gaging stations through the World Wide Web. These data may be accessed at:
http://www.water.usgs.gov
Some water-quality and ground-water data also are available through the World Wide Web. In addition, data can be provided in various machine-readable formats on magnetic tape or 3-1/2 inch floppy disk. Information about the availability of specific types of data or products, and user charges, can be obtained locally from each of the Water Resources Division District offices.
DEFINITION OF TERMS
Terms related to streamflow, water-quality, and other hydrologic data, as used in this report, are defined below. See also table for converting English units to International System (SI) Units on the inside of the back cover.
Acid neutralizing capacity (ANC) is the equivalent sum of all bases or base-producing materials, solutes plus particulates, in an aqueous system that can be titrated with acid to an equivalence point. This term designates titration of an “unfiltered” sample (formerly reported as alkalinity).

WATER RESOURCES DATA FOR MINNESOTA, 200214
Acre-foot (AC-FT, acre-ft) is the quantity of water required to cover 1 acre to a depth of 1 foot and is equivalent to 43,560 cubic feet, 325,851 gal-lons, or 1,233 cubic meters.
Adenosine triphosphate (ATP) is an organic, phosphate-rich, com-pound important in the transfer of energy in organisms. Its central role in liv-ing cells makes it an excellent indicator of the presence of living material in water. A measurement of ATP therefore provides a sensitive and rapid esti-mate of biomass. ATP is reported in micrograms per liter.
Algae are mostly aquatic single-celled, colonial, or multicelled plants containing chlorophyll and lacking roots, stems, and leaves.
Algal growth potential (AGP) is the maximum algal dry weight bio-mass that can be produced in a natural water sample under standardized lab-oratory conditions. The growth potential is the algal biomass present at stationary phase and is expressed as milligrams dry weight of algae produced per liter of sample.
Alkalinity is the capacity of solutes in an aqueous system to neutralize acid. This term designates titration of a “filtered” sample.
Annual runoff is the total quantity of water in runoff for a drainage area for the year. Data reports may use any of the following units of measure-ment in presenting annual runoff data:
Acre-foot (AC-FT, acre-ft) is the quantity of water required to cover 1 acre to a depth of 1 foot and is equal to 43,560 cubic feet, 325,851 gallons, or 1,233 cubic meters.
Cubic foot per second per square mile [CFSM, (ft3/s)/mi2] is the average number of cubic feet of water flowing per second from each square mile of area drained, assuming the runoff is distributed uniformly in time and area.
Inch (IN., in.) as used in this report, refers to the depth to which the drainage area would be covered with water if all of the runoff for a given time period were uniformly distributed on it.
Aroclor is the registered trademark for a group of polychlorinated biphenyls that were manufactured by the Monsanto Company prior to 1976. Aroclors are assigned specific 4-digit reference numbers dependent upon molecular type and degree of substitution of the biphenyl ring hydrogen atoms by chlorine atoms. The first two digits of a numbered aroclor represent the molecular type and the last two digits represent the weight percent of the hydrogen substituted chlorine.
Bacteria are microscopic unicellular organisms, typically spherical, rod like, or spiral and threadlike in shape, often clumped into colonies. Some bacteria cause disease, while others perform an essential role in nature in the recycling of materials; for example, by decomposing organic matter into a form available for reuse by plants.
Total coliform bacteria are a particular group of bacteria that are used as indicators of possible sewage pollution. This group includes coliforms that inhabit the intestine of warm-blooded animals and those that inhabit soils. They are characterized as aerobic or facul-tative anaerobic, gram-negative, nonspore-forming, rod-shaped bacte-ria that ferment lactose with gas formation within 48 hours at 35 °C. In the laboratory, these bacteria are defined as all the organisms that pro-duce colonies with a golden-green metallic sheen within 24 hours when incubated at 35 °C plus or minus 1.0 °C on M-Endo medium (nutrient medium for bacterial growth). Their concentrations are expressed as number of colonies per 100 mL of sample.
Fecal coliform bacteria are bacteria that are present in the intes-tine or feces of warm-blooded animals. They are often used as indica-tors of the sanitary quality of the water. In the laboratory, they are defined as all organisms that produce blue colonies within 24 hours when incubated at 44.5 °C plus or minus 0.2 °C on M-FC medium
(nutrient medium for bacterial growth). Their concentrations are expressed as number of colonies per 100 mL of sample.
Fecal streptococcal bacteria are bacteria found in the intestine of warm-blooded animals. Their presence in water is considered to verify fecal pollution. They are characterized as gram-positive, cocci bacteria that are capable of growth in brain-heart infusion broth. In the laboratory, they are defined as all the organisms that produce red or pink colonies within 48 hours at 35 °C plus or minus 1.0 °C on KF-streptococcus medium (nutrient medium for bacterial growth). Their concentrations are expressed as number of colonies per 100 mL of sample.
Enterococcus bacteria are commonly found in the feces of humans and other warm-blooded animals. Although some strains are ubiquitous and not related to fecal pollution, the presence of entero-cocci in water is an indication of fecal pollution and the possible pres-ence of enteric pathogens. Enterococcus bacteria are those bacteria that produce pink to red colonies with black or reddish-brown precipi-tate after incubation at 41 °C on mE agar and subsequent transfer to EIA medium. Enterococci include Streptococcus feacalis, Streptococ-cus feacium, Streptococcus avium, and their variants.
Escherichia coli (E. coli) are bacteria present in the intestine and feces of warm-blooded animals. E. coli are a member species of the fecal coliform group of indicator bacteria. In the laboratory, they are defined as those bacteria that produce yellow or yellow-brown colo-nies on a filter pad saturated with urea substrate broth after primary culturing for 22 to 24 hours at 44.5 °C on mTEC medium. Their con-centrations are expressed as number of colonies per 100 mL of sam-ple.
Base flow is flow in a channel sustained by ground-water discharge in the absence of direct runoff.
Bed material is the sediment mixture of which a streambed, lake, pond, reservoir, or estuary bottom is composed.
Benthic organisms (invertebrates) are the group of animals inhabiting the bottom of an aquatic environment. They include a number of types of organisms, such as bacteria, fungi, insect larvae and nymphs, snails, clams, and crayfish. They are useful as indicators of water quality.
Biochemical oxygen demand (BOD) is a measure of the quantity of dissolved oxygen, in milligrams per liter, necessary for the decomposition of organic matter by microorganisms, such as bacteria.
Biomass is the amount of living matter present at any given time, expressed as mass per unit area or volume of habitat.
Ash mass is the mass or amount of residue present after the resi-due from the dry mass determination has been ashed in a muffle fur-nace at a temperature of 500 °C for 1 hour. Ash mass of zooplankton and phytoplankton is expressed in grams per cubic meter (g/m3), and periphyton and benthic organisms in grams per square meter (g/m2).
Dry mass refers to the mass of residue present after drying in an oven at 105 °C for zooplankton and periphyton, until the mass remains unchanged. This mass represents the total organic matter, ash, and sed-iment in the sample. Dry mass is expressed in the same units as ash mass.
Organic mass or volatile mass of the living substance is the dif-ference between the dry mass and ash mass and represents the actual mass of the living matter. Organic mass is expressed in the same units as for ash mass and dry mass.
Wet mass is the mass of living matter plus contained water.

15WATER RESOURCES DATA FOR MINNESOTA, 2002
Biomass pigment ratio is an indicator of the total proportion of per-iphyton which are autotrophic (plants). This is also called the Autotrophic Index.
Bottom material: See “Bed material.”
Cells/volume refers to the number of plankton cells or natural units counted using a microscope and grid or counting cell. Results are generally reported as cells or units per milliliter.
Cells volume (biovolume) determination is one of several common methods used to estimate biomass of algae in aquatic systems. Cell members of algae are frequently used in aquatic surveys as an indicator of algal pro-duction. However, cell numbers alone cannot represent true biomass because of considerable cell-size variation among the algal species. Cell volume (µm3) is determined by obtaining critical cell measurements on cell dimen-sions (for example, length, width, height, or radius) for 20 to 50 cells of each important species to obtain an average biovolume per cell. Cells are catego-rized according to the correspondence of their cellular shape to the nearest geometric solid or combinations of simple solids (for example, spheres, cones, or cylinders). Representative formulae used to compute biovolume are as follows:
sphere 4/3 π3 cone 1/3 π3h cylinder π3h.
From cell volume, total algal biomass expressed as biovolume (µm3/mL) is thus determined by multiplying the number of cells of a given species by its average cell volume and then summing these volumes over all species.
Chemical oxygen demand (COD) is a measure of the chemically oxi-dizable material in the water and furnishes an approximation of the amount of organic and reducing material present. The determined value may corre-late with BOD or with carbonaceous organic pollution from sewage or indus-trial wastes.
Chlorophyll refers to the green pigments of plants. Chlorophyll a and b are the two most common green pigments in plants.
Colloid is any substance with particles in such a fine state of subdivi-sion dispersed in a medium (for example, water) that they do not settle out; but not in so fine a state of subdivision that they can be said to be truly dis-solved.
Color unit is produced by 1 milligram per liter of platinum in the form of the chloroplatinate ion. Color is expressed in units of the platinum-cobalt scale.
Confined aquifer is a term used to describe an aquifer containing water between two relatively impermeable boundaries. The water level in a well tapping a confined aquifer stands above the top of the confined aquifer and can be higher or lower than the water table that may be present in the material above it. In some cases the water level can rise above the ground sur-face, yielding a flowing well.
Contents is the volume of water in a reservoir or lake. Unless other-wise indicated, volume is computed on the basis of a level pool and does not include bank storage.
Continuous-record station is a site that meets either of the following conditions:
Stage or streamflow are recorded at some interval on a continuous basis. The recording interval is usually 15 minutes, but may be less or more frequent.
Water-quality, sediment, or other hydrologic measurements are recorded at least daily.
Control designates a feature in the channel downstream from a gaging station that physically influences the water-surface elevation and thereby
determines the stage-discharge relation at the station. This feature may be a constriction of the channel, a bedrock outcrop, a gravel bar, an artificial structure, or a uniform cross section over a long reach of the channel.
Control structure as used in this report is a structure on a stream or canal that is used to regulate the flow or stage of the stream or to prevent the intrusion of saltwater.
Cubic foot per second (CFS, ft3/s) is the rate of discharge representing a volume of 1 cubic foot passing a given point in 1 second. It is equivalent to approximately 7.48 gallons per second, 448.8 gallons per minute, or 0.02832 cubic meters per second.
Cubic foot per second-day (CFS-DAY, Cfs-day, [(ft3/s)/d]) is the vol-ume of water represented by a flow of 1 cubic foot per second for 24 hours. It is equivalent to 86,400 cubic feet, 1.9835 acre-feet, 646,317 gallons, or 2,447 cubic meters.
Daily record is a summary of streamflow, sediment, or water-quality values computed from data collected with sufficient frequency to obtain reli-able estimates of daily mean values.
Daily record station is a site for which daily records of streamflow, sediment, or water-quality values are computed.
Datum, as used in this report, is an elevation above mean sea level to which all gage height readings are referenced.
Diel is of or pertaining to a 24-hour period of time; a regular daily cycle.
Discharge, or flow, is the volume of water (or more broadly, volume of fluid including solid- and dissolved-phase material), that passes a given point in a given period of time.
Annual 7-day minimum is the lowest mean discharge for 7 consecutive days in a year. Note that most low-flow frequency analy-ses of annual 7-day minimum flows use a climatic year (April 1-March 31). The date shown in the summary statistics table is the initial date of the 7-day period. (This value should not be confused with the 7-day 10-year low-flow statistic.)
Instantaneous discharge is the discharge at a particular instant of time.
Mean discharge (MEAN) is the arithmetic mean of individual daily mean discharges during a specific period.
Dissolved refers to that material in a representative water sample that passes through a 0.45-micrometer membrane filter. This is a convenient operational definition used by Federal agencies that collect water data. Determinations of “dissolved” constituents are made on subsamples of the filtrate.
Dissolved oxygen (DO) content of water in equilibrium with air is a function of atmospheric pressure, temperature, and dissolved-solids concen-tration of the water. The ability of water to retain oxygen decreases with increasing temperature or dissolved solids, with small temperature changes having the more significant offset. Photosynthesis and respiration may cause diurnal variations in dissolved-oxygen concentration in water from some streams.
Dissolved-solids concentration of water is determined either analyti-cally by the “residue-on-evaporation” method, or mathematically by totaling the concentrations of individual constituents reported in a comprehensive chemical analysis. During that analytical determination of dissolved solids, the bicarbonate (generally a major dissolved component of water) is con-verted to carbonate. Therefore, in the mathematical calculation of dissolved-solids concentration, the bicarbonate value, in milligrams per liter, is multi-plied by 0.4926 to reflect the change. Alternatively, alkalinity concentration

WATER RESOURCES DATA FOR MINNESOTA, 200216
(as mg/L CaCO3) can be converted to carbonate concentration by multiply-ing by 0.60.
Diversity index is a numerical expression of evenness of distribution of aquatic organisms. The formula for diversity index is:
where ni is the number of individuals per taxon, n is the total number ofindividuals, and s is the total number of taxa in the sample of the community.Diversity index values range from zero, when all the organisms in the sampleare the same, to some positive number, when some or all of the organisms inthe sample are different.
Drainage area of a site on a stream is that area, measured in a horizon-tal plane, that has a common outlet at the site for its surface runoff. Figures of drainage area given herein include all closed basins, or noncontributing areas, within the area unless otherwise specified.
Drainage basin is a part of the Earth’s surface that is occupied by a drainage system with a common outlet for its surface runoff (see “Drainage area”).
Dry weight refers to the weight of animal tissue after it has been dried in an oven at 65 °C until a constant weight is achieved. Dry weight represents total organic and inorganic matter in the tissue.
Flow-duration percentiles are values on a scale of 100 that indicate the percentage of time for which a flow is not exceeded. For example, the 90th percentile of river flow is greater than or equal to 90 percent of all recorded flow rates.
Gage datum is the elevation of the zero point of the reference gage from which gage height is determined as compared to sea level (see “Datum”). This elevation is established by a system of levels from known benchmarks, by approximation from topographic maps, or by geographical positioning system.
Gage height (G.H.) is the water-surface elevation referenced to the gage datum. Gage height is often used interchangeably with the more general term “stage,” although gage height is more appropriate when used with a reading on a gage.
Gaging station is a site on a stream, canal, lake, or reservoir where sys-tematic observations of stage, discharge, or other hydrologic data are obtained. When used in connection with a discharge record, the term is applied only to those gaging stations where a continuous record of discharge is computed.
Gas chromatography/flame ionization detector (GC/FID) is a labo-ratory analytical method used as a screening technique for semi-volatile organic compounds that are extractable from water in methylene chloride.
Ground-water level is the elevation of the water table or another potentiometric surface at a particular location.
Hardness of water is a physical-chemical characteristic that is com-monly recognized by the increased quantity of soap required to produce lather. It is attributable to the presence of alkaline earths (principally calcium and magnesium) and is expressed as the equivalent concentration of calcium carbonate (CaCO3).
High tide is the maximum height reached by each rising tide. The high-high and low-high tides are the higher and lower of the two high tides,
respectively, of each tidal day. See NOAA web site: http://www.co-ops.nos.noaa.gov/tideglos.html
Hydrologic benchmark station is one that provides hydrologic data for a basin in which the hydrologic regimen will likely be governed solely by natural conditions. Data collected at a benchmark station may be used to sep-arate effects of natural from human-induced changes in other basins that have been developed and in which the physiography, climate, and geology are similar to those in the undeveloped benchmark basin.
Hydrologic unit is a geographic area representing part or all of a sur-face drainage basin or distinct hydrologic feature as defined by the former Office of Water Data Coordination and delineated on the State Hydrologic Unit Maps by the U.S. Geological Survey. Each hydrologic unit is identified by an 8-digit number.
Land-surface datum (lsd) is a datum plane that is approximately at land surface at each ground-water observation well.
Light-attenuation coefficient, also known as the extinction coeffi-cient, is a measure of water clarity. Light is attenuated according to the Lam-bert-Beer equation
,
where Io is the source light intensity, I is the light intensity at length L (inmeters) from the source, λ is the light-attenuation coefficient, and e is thebase of the natural logarithm. The light attenuation coefficient is defined as
.
Lipid is any one of a family of compounds that are insoluble in water and that make up one of the principal components of living cells. Lipids include fats, oils, waxes, and steroids. Many environmental contaminants such as organochlorine pesticides are lipophilic.
Low tide is the minimum height reached by each falling tide. The high-low and low-low tides are the higher and lower of the two low tides, respec-tively, of each tidal day. See NOAA web site: http://www.co-ops.nos.noaa.gov/tideglos.html
Macrophytes are the macroscopic plants in the aquatic environment. The most common macrophytes are the rooted vascular plants that are usu-ally arranged in zones in aquatic ecosystems and restricted in the area by the extent of illumination through the water and sediment deposition along the shoreline.
Measuring point (MP) is an arbitrary permanent reference point from which the distance to water surface in a well is measured to obtain water level.
Membrane filter is a thin microporous material of specific pore size used to filter bacteria, algae, and other very small particles from water.
Metamorphic stage refers to the stage of development that an organ-ism exhibits during its transformation from an immature form to an adult form. This developmental process exists for most insects, and the degree of difference from the immature stage to the adult form varies from relatively slight to pronounced, with many intermediates. Examples of metamorphic stages of insects are egg-larva-adult or egg-nymph-adult.
Methylene blue active substances (MBAS) are apparent detergents. The determination depends on the formation of a blue color when methylene blue dye reacts with synthetic anionic detergent compounds.
Micrograms per gram (UG/G, µg/g) is a unit expressing the concen-tration of a chemical constituent as the mass (micrograms) of the element per unit mass (gram) of material analyzed.
dni
n----
i 1ª
s
∑ni
n----2log–=
I IoeλL–
=
λ 1L--- elog
IIo----–=

17WATER RESOURCES DATA FOR MINNESOTA, 2002
Micrograms per kilogram (UG/KG, µg/kg) is a unit expressing the concentration of a chemical constituent as the mass (micrograms) of the con-stituent per unit mass (kilogram) of the material analyzed. One microgram per kilogram is equivalent to 1 part per billion.
Micrograms per liter (UG/L, µg/L) is a unit expressing the concentra-tion of chemical constituents in water as mass (micrograms) of constituent per unit volume (liter) of water. One thousand micrograms per liter is equiv-alent to 1 milligram per liter.
Microsiemens per centimeter (US/CM, µS/cm) is a unit expressing the amount of electrical conductivity of a solution as measured between opposite faces of a centimeter cube of solution at a specified temperature. Siemens is the International System of Units nomenclature. It is synonymous with mhos and is the reciprocal of resistance in ohms.
Milligrams per liter (MG/L, mg/L) is a unit for expressing the concen-tration of chemical constituents in water as the mass (milligrams) of constit-uent per unit volume (liter) of water. Concentration of suspended sediment also is expressed in mg/L and is based on the mass of dry sediment per liter of water-sediment mixture.
Miscellaneous site, or miscellaneous station, is a site where stream-flow, sediment, and/or water-quality data are collected once, or more often on a random or discontinuous basis.
Most probable number (MPN) is an index of the number of coliform bacteria that, more probably than any other number, would give the results shown by the laboratory examination; it is not an actual enumeration. MPN is determined from the distribution of gas-positive cultures among multiple inoculated tubes.
Multiple-plate samplers are artificial substrates of known surface area used for obtaining benthic invertebrate samples. They consist of a series of spaced, hardboard plates on an eyebolt.
Nanograms per liter (NG/L, ng/L) is a unit expressing the concentra-tion of chemical constituents in solution as mass (nanograms) of solute per unit volume (liter) of water. One million nanograms per liter is equivalent to 1 milligram per liter.
North American Vertical Datum of 1988 (NAVD of 1988) is the ver-tical control datum established in 1991 by the minimum-constraint adjust-ment of the Canadian-Mexican-U.S. leveling observations. It held fixed the height of the primary tidal bench mark, referenced to the new International Great Lakes Datum of 1985 local mean sea level height value, at Father Point/Rimouski, Quebec, Canada. See NOAA web site: http://www.ngs.noaa.gov/faq.shtml#WhatVD29VD88
National Geodetic Vertical Datum of 1929 (NGVD of 1929) is a geo-detic datum derived from a general adjustment of the first order level nets of the United States and Canada. It was formerly called “Sea Level Datum of 1929” or “mean sea level” in this series of reports. Although the datum was derived from the average sea level over a period of many years at 26 tide sta-tions along the Atlantic, Gulf of Mexico, and Pacific Coasts, it does not nec-essarily represent local mean sea level at any particular place. See NOAA web site: http://www.ngs.noaa.gov/faq.shtml#WhatVD29VD88
Nekton are the consumers in the aquatic environment and consist of large free-swimming organisms that are capable of sustained, directed mobil-ity.
Nephelometric turbidity unit (NTU) is the measurement for reporting turbidity that is based on use of a standard suspension of Formazin. Turbidity measured in NTU uses nephelometric methods that depend on passing spe-cific light of a specific wavelength through the sample.
Open or screened interval is the length of unscreened opening or of well screen through which water enters a well, in feet below land surface.
Organic carbon (OC) is a measure of organic matter present in aque-ous solution, suspension, or bottom sediments. May be reported as dissolved organic carbon (DOC), suspended organic carbon (SOC), or total organic carbon (TOC).
Organism is any living entity.
Organism count/area refers to the number of organisms collected and enumerated in a sample and adjusted to the number per area habitat, usually square meter (m2), acre, or hectare. Periphyton, benthic organisms, and mac-rophytes are expressed in these terms.
Organism count/volume refers to the number of organisms collected and enumerated in a sample and adjusted to the number per sample volume, usually milliliter (mL) or liter (L). Numbers of planktonic organisms can be expressed in these terms.
Total organism count is the total number of organisms collected and enumerated in any particular sample.
Organochlorine compounds are any chemicals that contain carbon and chlorine. Organochlorine compounds that are important in investigations of water, sediment, and biological quality include certain pesticides and industrial compounds.
Parameter Code is a 5-digit number used in the U.S. Geological Sur-vey computerized data system, National Water Information System (NWIS), to uniquely identify a specific constituent or property.
Partial-record station is a site where discrete measurements of one or more hydrologic parameters are obtained over a period of time without con-tinuous data being recorded or computed. A common example is a crest-stage gage partial-record station at which only peak stages and flows are recorded.
Particle size is the diameter, in millimeters (mm), of a particle deter-mined by sieve or sedimentation methods. The sedimentation method utilizes the principle of Stokes Law to calculate sediment particle sizes. Sedimenta-tion methods (pipet, bottom-withdrawal tube, visual-accumulation tube, Sedigraph) determine fall diameter of particles in either distilled water (chemically dispersed) or in native water (the river water at the time and point of sampling).
Particle-size classification used in this report agrees with the recom-mendation made by the American Geophysical Union Subcommittee on Sed-iment Terminology. The classification is as follows:
Classification Size (mm) Method of analysis
Clay 0.00024 - 0.004 SedimentationSilt 0.004 - 0.062 SedimentationSand 0.062 - 2.0 Sedimentation/sieveGravel 2.0 - 64.0 Sieve
The particle-size distributions given in this report are not necessarily representative of all particles in transport in the stream. Most of the organic matter is removed, and the sample is subjected to mechanical and chemical dispersion before analysis in distilled water. Chemical dispersion is not used for native water analysis.
Percent composition or percent of total is a unit for expressing the ratio of a particular part of a sample or population to the total sample or pop-ulation, in terms of types, numbers, weight, or volume.
Periodic station is a site where stage, discharge, sediment, chemical, or other hydrologic measurements are made one or more times during a year, but at a frequency insufficient to develop a daily record.
Periphyton is the assemblage of microorganisms attached to and living upon submerged solid surfaces. While primarily consisting of algae, they also include bacteria, fungi, protozoa, rotifers, and other small organisms. Periphyton are useful indicators of water quality.

WATER RESOURCES DATA FOR MINNESOTA, 200218
Pesticides are chemical compounds used to control undesirable organ-isms. Major categories of pesticides include insecticides, miticides, fungi-cides, herbicides, and rodenticides.
pH of water is the negative logarithm of the hydrogen-ion activity. Solutions with pH less than 7 are termed “acidic,” and solutions with a pH greater than 7 are termed “basic.” Solutions with a pH of 7 are neutral. The presence and concentration of many dissolved chemical constituents found in water are, in part, influenced by the hydrogen-ion activity of water. Bio-logical processes including growth, distribution of organisms, and toxicity of the water to organisms are also influenced, in part, by the hydrogen-ion activ-ity of water.
Picocurie (PC, pCi) is one trillionth (1 x 10-12) of the amount of radio-activity represented by a curie (Ci). A curie is the amount of radioactivity that yields 3.7 x 10¹⁰ radioactive disintegrations per second. A picocurie yields 2.22 dpm (disintegrations per minute).
Plankton is the community of suspended, floating, or weakly swim-ming organisms that live in the open water of lakes and rivers. Concentra-tions are expressed as a number of cells per milliliter (cells/mL of sample).
Phytoplankton is the plant part of the plankton. They are usu-ally microscopic, and their movement is subject to the water currents. Phytoplankton growth is dependent upon solar radiation and nutrient substances. Because they are able to incorporate as well as release materials to the surrounding water, the phytoplankton have a profound effect upon the quality of the water. They are the primary food produc-ers in the aquatic environment and are commonly known as algae.
Blue-green algae (Cyanophyta) are a group of phytoplank-ton organisms having a blue pigment, in addition to the green pigment called chlorophyll. Blue-green algae often cause nui-sance conditions in water.
Diatoms are the unicellular or colonial algae having a sili-ceous shell. Their concentrations are expressed as number of cells per milliliter (cells/mL) of sample.
Euglenoids (Euglenophyta) are a group of algae that are usually free-swimming and rarely creeping. They have the abil-ity to grow either photosynthetically in the light or heterotrophi-cally in the dark.
Fire algae (Pyrrhophyta) are a group of algae that are free-swimming unicells characterized by a red pigment spot.
Green algae have chlorophyll pigments similar in color to those of higher green plants. Some forms produce algae mats or floating “moss” in lakes. Their concentrations are expressed as number of cells per milliliter (cells/mL) of sample.
Zooplankton is the animal part of the plankton. Zooplankton are capable of extensive movements within the water column and are often large enough to be seen with the unaided eye. Zooplankton are secondary consumers feeding upon bacteria, phytoplankton, and detri-tus. Because they are the grazers in the aquatic environment, the zoop-lankton are a vital part of the aquatic food web. The zooplankton community is dominated by small crustaceans and rotifers.
Polychlorinated biphenyls (PCB’s) are industrial chemicals that are mixtures of chlorinated biphenyl compounds having various percentages of chlorine. They are similar in structure to organochlorine insecticides.
Polychlorinated naphthalenes (PCN’s) are industrial chemicals that are mixtures of chlorinated naphthalene compounds. They have properties
and applications similar to polychlorinated biphenyls (PCB’s) and have been identified in commercial PCB preparations.
Primary productivity is a measure of the rate at which new organic matter is formed and accumulated through photosynthetic and chemosyn-thetic activity of producer organisms (chiefly, green plants). The rate of pri-mary production is estimated by measuring the amount of oxygen released (oxygen method) or the amount of carbon assimilated (carbon method) by the plants.
Primary productivity (carbon method) is expressed as milli-grams of carbon per area per unit time [mg C/(m2/time)] for periphy-ton and macrophytes or per volume [mg C/(m3/time)] for phytoplankton. Carbon method defines the amount of carbon dioxide consumed as measured by radioactive carbon (carbon-14). The carbon-14 method is of greater sensitivity than the oxygen light and dark bottle method and is preferred for use in unenriched waters. Unit time may be either the hour or day, depending on the incubation period.
Primary productivity (oxygen method) is expressed as milli-grams of oxygen per area per unit time [mg O/(m2/time)] for periphy-ton and macrophytes or per volume [mg O/(m3/time)] for phytoplankton. Oxygen method defines production and respiration rates as estimated from changes in the measured dissolved-oxygen concentration. The oxygen light and dark bottle method is preferred if the rate of primary production is sufficient for accurate measurements to be made within 24 hours. Unit time may be either the hour or day, depending on the incubation period.
Radioisotopes are isotopic forms of an element that exhibit radioactiv-ity. Isotopes are varieties of a chemical element that differ in atomic weight, but are very nearly alike in chemical properties. The difference arises because the atoms of the isotopic forms of an element differ in the number of neutrons in the nucleus; for example, ordinary chlorine is a mixture of iso-topes having atomic weights of 35 and 37, and the natural mixture has an atomic weight of about 35.453. Many of the elements similarly exist as mix-tures of isotopes, and a great many new isotopes have been produced in the operation of nuclear devices such as the cyclotron. There are 275 isotopes of the 81 stable elements, in addition to more than 800 radioactive isotopes.
Recoverable from bottom material is the amount of a given constit-uent that is in solution after a representative sample of bottom material has been digested by a method (usually using an acid or mixture of acids) that results in dissolution of readily soluble substances. Complete dissolution of all bottom material is not achieved by the digestion treatment and thus the determination represents less than the total amount (that is, less than 95 per-cent) of the constituent in the sample. To achieve comparability of analytical data, equivalent digestion procedures would be required of all laboratories performing such analyses because different digestion procedures are likely to produce different analytical results.
Recurrence interval, also referred to as return period, is the average time, usually expressed in years, between occurrences of hydrologic events of a specified type (such as exceedances of a specified high flow or non-exceedance of a specified low flow). The terms “return period” and “recur-rence interval” do not imply regular cyclic occurrence. The actual times between occurrences vary randomly, with most of the times being less than the average and a few being substantially greater than the average. For exam-ple, the 100-year flood is the flow rate that is exceeded by the annual maxi-mum peak flow at intervals whose average length is 100 years (that is, once in 100 years, on average); almost two-thirds of all exceedances of the 100-year flood occur less than 100 years after the previous exceedance, half occur less than 70 years after the previous exceedance, and about one-eighth occur more than 200 years after the previous exceedance. Similarly, the 7-day 10-year low flow (7Q10) is the flow rate below which the annual minimum 7-day-mean flow dips at intervals whose average length is 10 years (that is,

19WATER RESOURCES DATA FOR MINNESOTA, 2002
once in 10 years, on average); almost two-thirds of the non-exceedances of the 7Q10 occur less than 10 years after the previous non-exceedance, half occur less than 7 years after, and about one-eighth occur more than 20 years after the previous non-exceedance. The recurrence interval for annual events is the reciprocal of the annual probability of occurrence. Thus, the 100-year flood has a 1-percent chance of being exceeded by the maximum peak flow in any year, and there is a 10-percent chance in any year that the annual min-imum 7-day-mean flow will be less than the 7Q10.
Replicate samples are a group of samples collected in a manner such that the samples are thought to be essentially identical in composition.
River mile is the distance of a point on a river measured in miles from the river’s mouth along the low-water channel.
River mileage is the linear distance along the meandering path of a stream channel determined in accordance with Bulletin No. 14 (October 1968) of the Water Resources Council.
Runoff in inches (IN., in.) is the depth, in inches, to which the drainage area would be covered if all the runoff for a given time period were uniformly distributed on it.
Sea level refers to the National Geodetic Vertical Datum of 1929 (NGVD of 1929)—a geodetic datum derived from a general adjustment of the first-order level nets of the United States and Canada, formerly called Sea Level Datum of 1929. See: http://www.co-ops.nos.noaa.gov/ glossary/gloss_n.html#NGVD
Sediment is solid material that is transported by, suspended in, or deposited from water. It originates mostly from disintegrated rocks; it also includes chemical and biochemical precipitates and decomposed organic material, such as humus. The quantity, characteristics, and cause of the occurrence of sediment in streams are influenced by environmental factors. Some major factors are degree of slope, length of slope, soil characteristics, land usage, and quantity and intensity of precipitation.
Bed load is the sediment that is transported in a stream by roll-ing, sliding, or skipping along or very close to the bed. In this report, bed load is considered to consist of particles in transit from the bed to an elevation equal to the top of the bed-load sampler nozzle (usually within 0.25 ft of the streambed).
Bed-load discharge (tons per day) is the quantity of sediment moving as bed load, reported as dry weight, that passes a cross section in a given time.
Suspended sediment is the sediment that is maintained in sus-pension by the upward components of turbulent currents or that exists in suspension as a colloid.
Suspended-sediment concentration is the velocity-weighted concentration of suspended sediment in the sampled zone (from the water surface to a point approximately 0.3 ft above the bed) expressed as milligrams of dry sediment per liter of water-sediment mixture (mg/L). The entire sample is used for the analysis.
Mean concentration of suspended sediment is the time-weighted concentration of suspended sediment passing a stream section during a 24-hour day.
Suspended-sediment discharge (tons/day) is the quantity of sediment moving in suspension, reported as dry weight, that passes a cross section in a given time. It is calculated in units of tons per day as follows: concentration (mg/L) x discharge (ft3/s) x 0.0027.
Suspended-sediment load is a term that refers to material in suspension. The term needs to be qualified, such as “annual sus-pended-sediment load” or “sand-size suspended-sediment load,” and
so on. It is not synonymous with either suspended-sediment discharge or concentration.
Total sediment discharge (tons/day) is the sum of the sus-pended-sediment discharge and the bed-load discharge. It is the total quantity of sediment, reported as dry weight, that passes a cross sec-tion in a given time.
Total sediment load or total load is a term that refers to the total sediment (bed load plus suspended-sediment load) that is in transport. The term needs to be qualified, such as “annual suspended-sediment load” or “sand-size suspended-sediment load,” and so on. It is not syn-onymous with total sediment discharge.
Seven-day 10-year low flow (7Q10, 7Q10) is the minimum flow aver-aged over 7 consecutive days that is expected to occur on average, once in any 10-year period. The 7Q10 has a 10-percent chance of occurring in any given year.
Sodium adsorption ratio (SAR) is the expression of relative activity of sodium ions in exchange reactions within soil and is an index of sodium or alkali hazard to the soil. Waters range in respect to sodium hazard from those which can be used for irrigation on almost all soils to those which are generally unsatisfactory for irrigation.
Solute is any substance that is dissolved in water.
Specific conductance is a measure of the ability of a water to conduct an electrical current. It is expressed in microsiemens per centimeter at 25 °C. Specific conductance is related to the type and concentration of ions in solu-tion and can be used for approximating the dissolved-solids content of the water. Commonly, the concentration of dissolved solids (in milligrams per liter) is from 55 to 75 percent of the specific conductance (in microsiemens). This relation is not constant from stream to stream, and it may vary in the same source with changes in the composition of the water.
Stable isotope ratio (per MILL/MIL) is a unit expressing the ratio of the abundance of two radioactive isotopes. Isotope ratios are used in hydro-logic studies to determine the age or source of specific waters, to evaluate mixing of different waters, as an aid in determining reaction rates, and other chemical or hydrologic processes.
Stage: See “Gage height.”
Stage-discharge relation is the relation between the water-surface ele-vation, termed stage (gage height), and the volume of water flowing in a channel per unit time.
Streamflow is the discharge that occurs in a natural channel. Although the term “discharge” can be applied to the flow of a canal, the word “stream-flow” uniquely describes the discharge in a surface stream course. The term “streamflow” is more general than “runoff” as streamflow may be applied to discharge whether or not it is affected by diversion or regulation.
Substrate is the physical surface upon which an organism lives.
Artificial substrate is a device that is purposely placed in a stream or lake for colonization of organisms. The artificial substrate simplifies the community structure by standardizing the substrate from which each sample is taken. Examples of artificial substrates are bas-ket samplers (made of wire cages filled with clean streamside rocks) and multiplate samplers (made of hardboard) for benthic organism collection, and plexiglass strips for periphyton collection.
Natural substrate refers to any naturally occurring immersed or submersed solid surface, such as a rock or tree, upon which an organ-ism lives.
Surface area of a lake or impoundment is that area encompassed by the boundary of the lake or impoundment as shown on USGS topographic maps, or on other available maps or photographs. The computed surface areas

WATER RESOURCES DATA FOR MINNESOTA, 200220
reflect the water levels of the lakes or impoundments at the times when the information for the maps or photographs was obtained.
Surficial bed material is the top 0.1 to 0.2 ft of the bed material that is sampled using U.S. Series Bed-Material Samplers.
Suspended (as used in tables of chemical analyses) refers to the amount (concentration) of undissolved material in a water-sediment mixture. It is associated with the material retained on a 0.45-micrometer filter.
Suspended, recoverable is the amount of a given constituent that is in solution after the part of a representative suspended-sediment sample that is retained on a 0.45-micrometer membrane filter has been digested by a method (usually using a dilute acid solution) that results in dissolution of only readily soluble substances. Complete dissolution of all the particulate matter is not achieved by the digestion treatment and thus the determination represents something less than the “total” amount (that is, less than 95 percent) of the constituent present in the sample. To achieve comparability of analytical data, equivalent diges-tion procedures are required of all laboratories performing such analy-ses because different digestion procedures are likely to produce different analytical results.
Determinations of “suspended, recoverable” constituents are made either by analyzing portions of the material collected on the fil-ter or, more commonly, by difference, based on determinations of (1) dissolved and (2) total recoverable concentrations of the constituent.
Suspended, total is the total amount of a given constituent in the part of a representative suspended-sediment sample that is retained on a 0.45-micrometer membrane filter. This term is used only when the analytical procedure assures measurement of at least 95 percent of the constituent determined. Knowledge of the expected form of the con-stituent in the sample, as well as the analytical methodology used, is required to determine when the results should be reported as “sus-pended, total.”
Determinations of “suspended, total” constituents are made either by analyzing portions of the material collected on the filter or, more commonly, by difference, based on determinations of (1) dis-solved and (2) total concentrations of the constituent.
Synoptic Studies are short-term investigations of specific water-qual-ity conditions during selected seasonal or hydrologic periods to provide improved spatial resolution for critical water-quality conditions. For the period and conditions sampled, they assess the spatial distribution of selected water-quality conditions in relation to causative factors, such as land use and contaminant sources.
Taxonomy is the division of biology concerned with the classification and naming of organisms. The classification of organisms is based upon a hierarchial scheme beginning with Kingdom and ending with Species at the base. The higher the classification level, the fewer features the organisms have in common. For example, the taxonomy of a particular mayfly, Hexage-nia limbata, is the following:
Kingdom AnimalPhylum Arthropoda
Class InsectaOrder Ephemeroptera
Family EphemeridaeGenus Hexagenia
Species Hexagenia limbata
Time-weighted average is computed by multiplying the number of days in the sampling period by the concentrations of individual constituents for the corresponding period and dividing the sum of the products by the total number of days. A time-weighted average represents the composition of
water that would be contained in a vessel or reservoir that had received equal quantities of water from the stream each day for the year.
Tons per acre-foot is the dry mass of dissolved solids in 1 acre-foot of water. It is computed by multiplying the concentration of the constituent, in milligrams per liter, by 0.00136.
Tons per day (T/DAY, tons/d) is the rate representing a mass of 1 ton of a constituent in streamflow passing a cross section in 1 day. It is equivalent to 2,000 pounds per day, or 0.9072 metric tons per day.
Total is the total amount of a given constituent in a representative sus-pended-sediment sample, regardless of the constituent’s physical or chemi-cal form. This term is used only when the analytical procedure assures measurement of at least 95 percent of the constituent present in both the dis-solved and suspended phases of the sample. A knowledge of the expected form of the constituent in the sample, as well as the analytical methodology used, is required to judge when the results should be reported as “total.” (Note that the word “total” does double duty here, indicating both that the sample consists of a suspended-sediment mixture and that the analytical method determined all of the constituent in the sample.)
Total discharge is the quantity of a given constituent, measured as dry mass or volume, that passes a stream cross section per unit of time. When referring to constituents other than water, this term needs to be qualified, such as “total sediment discharge,” “total chloride discharge,” and so on.
Total in bottom material is the total amount of a given constituent in a representative sample of bottom material. This term is used only when the analytical procedure assures measurement of at least 95 percent of the con-stituent determined. A knowledge of the expected form of the constituent in the sample, as well as the analytical methodology used, is required to judge when the results should be reported as “total in bottom material.”
Total length (fish) is the straight-line distance from the anterior point of a fish specimen’s snout, with the mouth closed, to the posterior end of the caudal (tail) fin, with the lobes of the caudal fin squeezed together.
Total load refers to all of a constituent in transport. When referring to sediment, it includes suspended load plus bed load.
Total recoverable is the amount of a given constituent that is in solu-tion after a representative suspended-sediment sample has been digested by a method (usually using a dilute acid solution) that results in dissolution of only readily soluble substances. Complete dissolution of all particulate mat-ter is not achieved by the digestion treatment, and thus the determination rep-resents something less than the “total” amount (that is, less than 95 percent) of the constituent present in the dissolved and suspended phases of the sam-ple. To achieve comparability of analytical data, equivalent digestion proce-dures are required of all laboratories performing such analyses because different digestion procedures are likely to produce different analytical results.
Turbidity is a measurement of the collective optical properties of a water sample that cause light to be scattered and absorbed rather than trans-mitted in straight lines; the higher the intensity of scattered light, the higher the turbidity. Turbidity is expressed in nephelometric turbidity units (NTU) or Formazin turbidity units (FTU) depending on the method and equipment used.
Volatile organic compounds (VOC’s) are organic compounds that can be isolated from the water phase of a sample by purging the water sample with inert gas, such as helium, and subsequently analyzed by gas chromatog-raphy. Many VOC’s are manmade chemicals that are used and produced in the manufacture of paints, adhesives, petroleum products, pharmaceuticals, and refrigerants. They are often components of fuels, solvents, hydraulic flu-ids, paint thinners, and dry cleaning agents commonly used in urban settings. VOC contamination of drinking-water supplies is a human health concern

21WATER RESOURCES DATA FOR MINNESOTA, 2002
because many are toxic and are known or suspected human carcinogens (U.S. Environmental Protection Agency, 1996).
Water level is the water-surface elevation or stage of the free surface of a body of water above or below any datum (see “Gage height”), or the sur-face of water standing in a well, usually indicative of the position of the water table or other potentiometric surface.
Water table is the surface of a ground-water body at which the water is at atmospheric pressure.
Water-table aquifer is an unconfined aquifer within which is found the water table.
Water year in U.S. Geological Survey reports dealing with surface-water supply is the 12-month period October 1 through September 30. The water year is designated by the calendar year in which it ends and which includes 9 of the 12 months. Thus, the year ending September 30, 1999, is called the “1999 water year.”
WDR is used as an abbreviation for “Water-Data Report” in the REVISED RECORDS paragraph to refer to State annual hydrologic-data reports. (WRD was used as an abbreviation for “Water-Resources Data” in reports published prior to 1976.)
Weighted average is used in this report to indicate discharge-weighted average. It is computed by multiplying the discharge for a sampling period by the concentrations of individual constituents for the corresponding period and dividing the sum of the products by the sum of the discharges. A discharge-weighted average approximates the composition of water that would be found in a reservoir containing all the water passing a given loca-tion during the water year after thorough mixing in the reservoir.
Well is an excavation (pit, hole, tunnel), generally cylindrical in form and often walled in, drilled, dug, driven, bored, or jetted into the ground to such a depth as to penetrate water-yielding geologic material and allow the water to flow or to be pumped to the surface.
Wet weight refers to the weight of animal tissue or other substance including its contained water.
WSP is used as an abbreviation for “Water-Supply Paper” in reference to previously published reports

PUBLICATIONS ON TECHNIQUES OF WATER-RESOURCES INVESTIGATIONS22
The USGS publishes a series of manuals titled the “Techniques of Water-Resources Investigations” that describe procedures for planning and conducting specialized work in water-resources investigations. The material in these manuals is grouped under major subject headings called books and is further divided into sections and chapters. For example, section A of book 3 (Applications of Hydraulics) pertains to surface water. Each chapter then is limited to a narrow field of the section subject matter. This publication format permits flexibility when revision or printing is required.
Manuals in the Techniques of Water-Resources Investigations series, which are listed below, are available online at http://water.usgs.gov/pubs/twri. Printed copies are available for sale from the USGS, Information Services, Box 25286, Federal Center, Denver, Colorado 80225 (an authorized agent of the Superintendent of Documents, Government Printing Office). Please telephone “1-888-ASK-USGS” for current prices, and refer to the title, book number, section number, chapter number, and mention the “U.S. Geological Survey Techniques of Water-Resources Investigations.” Other products can be viewed online at http://www.usgs.gov/sales.html, or ordered by telephone or by FAX to (303)236-4693. Order forms for FAX requests are available online at http://mac.usgs.gov/isb/pubs/forms/. Prepayment by major credit card or by a check or money order payable to the “U.S. Geological Survey” is required.
Book 1. Collection of Water Data by Direct Measurement
Section D. Water Quality
1–D1. Water temperature—Influential factors, field measurement, and data presentation, by H.H. Stevens, Jr., J.F. Ficke, and G.F. Smoot: USGS–TWRI book 1, chap. D1. 1975. 65 p.
1–D2. Guidelines for collection and field analysis of ground-water samples for selected unstable constituents, by W.W. Wood: USGS–TWRI book 1, chap. D2. 1976. 24 p.
Book 2. Collection of Environmental Data
Section D. Surface Geophysical Methods
2–D1. Application of surface geophysics to ground-water investigations, by A.A.R. Zohdy, G.P. Eaton, and D.R. Mabey: USGS–TWRI book 2, chap. D1. 1974. 116 p.
2–D2. Application of seismic-refraction techniques to hydrologic studies, by F.P. Haeni: USGS–TWRI book 2, chap. D2. 1988. 86 p.
Section E. Subsurface Geophysical Methods
2–E1. Application of borehole geophysics to water-resources investigations, by W.S. Keys and L.M. MacCary: USGS–TWRI book 2, chap. E1. 1971. 126 p.
2–E2. Borehole geophysics applied to ground-water investigations, by W.S. Keys: USGS–TWRI book 2, chap. E2. 1990. 150 p.
Section F. Drilling and Sampling Methods
2–F1. Application of drilling, coring, and sampling techniques to test holes and wells, by Eugene Shuter and W.E. Teasdale: USGS–TWRI book 2, chap. F1. 1989. 97 p.
Book 3. Applications of Hydraulics
Section A. Surface-Water Techniques
3–A1. General field and office procedures for indirect discharge measurements, by M.A. Benson and Tate Dalrymple: USGS–TWRI book 3, chap. A1. 1967. 30 p.
3–A2. Measurement of peak discharge by the slope-area method, by Tate Dalrymple and M.A. Benson: USGS–TWRI book 3, chap. A2. 1967. 12 p.
3–A3. Measurement of peak discharge at culverts by indirect methods, by G.L. Bodhaine: USGS–TWRI book 3, chap. A3. 1968. 60 p.
3–A4. Measurement of peak discharge at width contractions by indirect methods, by H.F. Matthai: USGS-TWRI book 3, chap. A4. 1967. 44 p.
3–A5. Measurement of peak discharge at dams by indirect methods, by Harry Hulsing: USGS–TWRI book 3, chap. A5. 1967. 29 p.
3–A6. General procedure for gaging streams, by R.W. Carter and Jacob Davidian: USGS–TWRI book 3, chap. A6. 1968. 13 p.

23PUBLICATIONS ON TECHNIQUES OF WATER-RESOURCE INVESTIGATIONS--CONTINUED
3–A7. Stage measurement at gaging stations, by T.J. Buchanan and W.P. Somers: USGS–TWRI book 3, chap. A7. 1968. 28 p.
3–A8. Discharge measurements at gaging stations, by T.J. Buchanan and W.P. Somers: USGS–TWRI book 3, chap. A8. 1969. 65 p.
3–A9. Measurement of time of travel in streams by dye tracing, by F.A. Kilpatrick and J.F. Wilson, Jr.: USGS–TWRI book 3, chap. A9. 1989. 27 p.
3–Al0. Discharge ratings at gaging stations, by E.J. Kennedy: USGS–TWRI book 3, chap. A10. 1984. 59 p.
3–A11. Measurement of discharge by the moving-boat method, by G.F. Smoot and C.E. Novak: USGS–TWRI book 3, chap. A11. 1969. 22 p.
3–A12. Fluorometric procedures for dye tracing, Revised, by J.F. Wilson, Jr., E.D. Cobb, and F.A. Kilpatrick: USGS–TWRI book 3, chap. A12. 1986. 34 p.
3–A13. Computation of continuous records of streamflow, by E.J. Kennedy: USGS–TWRI book 3, chap. A13. 1983. 53 p.
3–A14. Use of flumes in measuring discharge, by F.A. Kilpatrick and V.R. Schneider: USGS–TWRI book 3, chap. A14. 1983. 46 p.
3–A15. Computation of water-surface profiles in open channels, by Jacob Davidian: USGS–TWRI book 3, chap. A15. 1984. 48 p.
3–A16. Measurement of discharge using tracers, by F.A. Kilpatrick and E.D. Cobb: USGS–TWRI book 3, chap. A16. 1985. 52 p.
3–A17. Acoustic velocity meter systems, by Antonius Laenen: USGS–TWRI book 3, chap. A17. 1985. 38 p.
3–A18. Determination of stream reaeration coefficients by use of tracers, by F.A. Kilpatrick, R.E. Rathbun, Nobuhiro Yotsukura, G.W. Parker, and L.L. DeLong: USGS–TWRI book 3, chap. A18. 1989. 52 p.
3–A19. Levels at streamflow gaging stations, by E.J. Kennedy: USGS–TWRI book 3, chap. A19. 1990. 31 p.
3–A20. Simulation of soluble waste transport and buildup in surface waters using tracers, by F.A. Kilpatrick: USGS–TWRI book 3, chap. A20. 1993. 38 p.
3–A21 Stream-gaging cableways, by C. Russell Wagner: USGS–TWRI book 3, chap. A21. 1995. 56 p.
Section B. Ground-Water Techniques
3–B1. Aquifer-test design, observation, and data analysis, by R.W. Stallman: USGS–TWRI book 3, chap. B1. 1971. 26 p.
3–B2. Introduction to ground-water hydraulics, a programed text for self-instruction, by G.D. Bennett: USGS–TWRI book 3, chap. B2. 1976. 172 p.
3–B3. Type curves for selected problems of flow to wells in confined aquifers, by J.E. Reed: USGS–TWRI book 3, chap. B3. 1980. 106 p.
3–B4. Regression modeling of ground-water flow, by R.L. Cooley and R.L. Naff: USGS–TWRI book 3, chap. B4. 1990. 232 p.
3–B4. Supplement 1. Regression modeling of ground-water flow—Modifications to the computer code for nonlinear regression solution of steady-state ground-water flow problems, by R.L. Cooley: USGS–TWRI book 3, chap. B4. 1993. 8 p.
3–B5. Definition of boundary and initial conditions in the analysis of saturated ground-water flow systems—An introduction, by O.L. Franke, T.E. Reilly, and G.D. Bennett: USGS–TWRI book 3, chap. B5. 1987. 15 p.
3–B6. The principle of superposition and its application in ground-water hydraulics, by T.E. Reilly, O.L. Franke, and G.D. Bennett: USGS–TWRI book 3, chap. B6. 1987. 28 p.
3–B7. Analytical solutions for one-, two-, and three-dimensional solute transport in ground-water systems with uniform flow, by E.J. Wexler: USGS–TWRI book 3, chap. B7. 1992. 190 p.

TECHNIQUES ON WATER - RESOURCES INVESTIGATIONS--CONTINUED 24
3–B8. System and boundary conceptualization in ground-water flow simulation, by T.E. Reilly: USGS–TWRI book 3, chap. B8. 2001. 29 p.
Section C. Sedimentation and Erosion Techniques
3–C1. Fluvial sediment concepts, by H.P. Guy: USGS–TWRI book 3, chap. C1. 1970. 55 p.
3–C2. Field methods for measurement of fluvial sediment, by T.K. Edwards and G.D. Glysson: USGS–TWRI book 3, chap. C2. 1999. 89 p.
3–C3. Computation of fluvial-sediment discharge, by George Porterfield: USGS–TWRI book 3, chap. C3. 1972. 66 p.
Book 4. Hydrologic Analysis and Interpretation
Section A. Statistical Analysis
4–A1. Some statistical tools in hydrology, by H.C. Riggs: USGS–TWRI book 4, chap. A1. 1968. 39 p.
4–A2. Frequency curves, by H.C. Riggs: USGS–TWRI book 4, chap. A2. 1968. 15 p.
4–A3. Statistical methods in water resources, by D.R. Helsel and R.M. Hirsch: USGS–TWRI book 4, chap. A3. 1991. Available only online at http://water.usgs.gov/pubs/twri/twri4a3/. (Accessed August 30, 2002.)
Section B. Surface Water
4–B1. Low-flow investigations, by H.C. Riggs: USGS–TWRI book 4, chap. B1. 1972. 18 p.
4–B2. Storage analyses for water supply, by H.C. Riggs and C.H. Hardison: USGS–TWRI book 4, chap. B2. 1973. 20 p.
4–B3. Regional analyses of streamflow characteristics, by H.C. Riggs: USGS–TWRI book 4, chap. B3. 1973.15 p.
Section D. Interrelated Phases of the Hydrologic Cycle
4–D1. Computation of rate and volume of stream depletion by wells, by C.T. Jenkins: USGS–TWRI book 4, chap. D1. 1970. 17 p.
Book 5. Laboratory Analysis
Section A. Water Analysis
5–A1. Methods for determination of inorganic substances in water and fluvial sediments, by M.J. Fishman and L.C. Friedman, editors: USGS–TWRI book 5, chap. A1. 1989. 545 p.
5–A2. Determination of minor elements in water by emission spectroscopy, by P.R. Barnett and E.C. Mallory, Jr.: USGS–TWRI book 5, chap. A2. 1971. 31 p.
5–A3. Methods for the determination of organic substances in water and fluvial sediments, edited by R.L. Wershaw, M.J. Fishman, R.R. Grabbe, and L.E. Lowe: USGS–TWRI book 5, chap. A3. 1987. 80 p.
5–A4. Methods for collection and analysis of aquatic biological and microbiological samples, by L.J. Britton and P.E. Greeson, editors: USGS–TWRI book 5, chap. A4. 1989. 363 p.
5–A5. Methods for determination of radioactive substances in water and fluvial sediments, by L.L. Thatcher, V.J. Janzer, and K.W. Edwards: USGS–TWRI book 5, chap. A5. 1977. 95 p.
5–A6. Quality assurance practices for the chemical and biological analyses of water and fluvial sediments, by L.C. Friedman and D.E. Erdmann: USGS–TWRI book 5, chap. A6. 1982. 181 p.

25PUBLICATIONS ON TECHNIQUES OF WATER-RESOURCE INVESTIGATIONS--CONTINUED
Section C. Sediment Analysis
5–C1. Laboratory theory and methods for sediment analysis, by H.P. Guy: USGS–TWRI book 5, chap. C1. 1969. 58 p.
Book 6. Modeling Techniques
Section A. Ground Water
6–A1. A modular three-dimensional finite-difference ground-water flow model, by M.G. McDonald and A.W. Harbaugh: USGS–TWRI book 6, chap. A1. 1988. 586 p.
6–A2. Documentation of a computer program to simulate aquifer-system compaction using the modular finite-difference ground-water flow model, by S.A. Leake and D.E. Prudic: USGS–TWRI book 6, chap. A2. 1991. 68 p.
6–A3. A modular finite-element model (MODFE) for areal and axisymmetric ground-water-flow problems, Part 1: Model Description and User’s Manual, by L.J. Torak: USGS–TWRI book 6, chap. A3. 1993. 136 p.
6–A4. A modular finite-element model (MODFE) for areal and axisymmetric ground-water-flow problems, Part 2: Derivation of finite-element equations and comparisons with analytical solutions, by R.L. Cooley: USGS–TWRI book 6, chap. A4. 1992. 108 p.
6–A5. A modular finite-element model (MODFE) for areal and axisymmetric ground-water-flow problems, Part 3: Design philosophy and programming details, by L.J. Torak: USGS–TWRI book 6, chap. A5. 1993. 243 p.
6–A6. A coupled surface-water and ground-water flow model (MODBRANCH) for simulation of stream-aquifer interaction, by Eric D. Swain and Eliezer J. Wexler: USGS–TWRI book 6, chap. A6. 1996. 125 p.
6–A7. User’s guide to SEAWAT: A computer program for simulation of three-dimensional variable-density ground-water flow, by Weixing Guo and Christian D. Langevin: USGS–TWRI book 6, chap. A7. 2002. 77 p.
Book 7. Automated Data Processing and Computations
Section C. Computer Programs
7–C1. Finite difference model for aquifer simulation in two dimensions with results of numerical experiments, by P.C. Trescott, G.F. Pinder, and S.P. Larson: USGS–TWRI book 7, chap. C1. 1976. 116 p.
7–C2. Computer model of two-dimensional solute transport and dispersion in ground water, by L.F. Konikow and J.D. Bredehoeft: USGS–TWRI book 7, chap. C2. 1978. 90 p.
7–C3. A model for simulation of flow in singular and interconnected channels, by R.W. Schaffranek, R.A. Baltzer, and D.E. Goldberg: USGS–TWRI book 7, chap. C3. 1981. 110 p.
Book 8. Instrumentation
Section A. Instruments for Measurement of Water Level
8–A1. Methods of measuring water levels in deep wells, by M.S. Garber and F.C. Koopman: USGS–TWRI book 8, chap. A1. 1968. 23 p.
8–A2. Installation and service manual for U.S. Geological Survey manometers, by J.D. Craig: USGS–TWRI book 8, chap. A2. 1983. 57 p.
Section B. Instruments for Measurement of Discharge
8–B2. Calibration and maintenance of vertical-axis type current meters, by G.F. Smoot and C.E. Novak: USGS–TWRI book 8, chap. B2. 1968. 15 p.

TECHNIQUES ON WATER - RESOURCES INVESTIGATIONS--CONTINUED 26
Book 9. Handbooks for Water-Resources Investigations
Section A. National Field Manual for the Collection of Water-Quality Data
9–A1. National field manual for the collection of water-quality data: Preparations for water sampling, by F.D. Wilde, D.B. Radtke, Jacob Gibs, and R.T. Iwatsubo: USGS–TWRI book 9, chap. A1. 1998. 47 p.
9–A2. National field manual for the collection of water-quality data: Selection of equipment for water sampling, edited by F.D. Wilde, D.B. Radtke, Jacob Gibs, and R.T. Iwatsubo: USGS–TWRI book 9, chap. A2. 1998. 94 p.
9–A3. National field manual for the collection of water-quality data: Cleaning of equipment for water sampling, edited by F.D. Wilde, D.B. Radtke, Jacob Gibs, and R.T. Iwatsubo: USGS–TWRI book 9, chap. A3. 1998. 75 p.
9–A4. National field manual for the collection of water-quality data: Collection of water samples, edited by F.D. Wilde, D.B. Radtke, Jacob Gibs, and R.T. Iwatsubo: USGS–TWRI book 9, chap. A4. 1999. 156 p.
9–A5. National field manual for the collection of water-quality data: Processing of water samples, edited by F.D. Wilde, D.B. Radtke, Jacob Gibs, and R.T. Iwatsubo: USGS–TWRI book 9, chap. A5. 1999, 149 p.
9–A6. National field manual for the collection of water-quality data: Field measurements, edited by F.D. Wilde and D.B. Radtke: USGS–TWRI book 9, chap. A6. 1998. Variously paginated.
9–A7. National field manual for the collection of water-quality data: Biological indicators, edited by D.N. Myers and F.D. Wilde: USGS–TWRI book 9, chap. A7. 1997 and 1999. Variously paginated.
9–A8. National field manual for the collection of water-quality data: Bottom-material samples, by D.B. Radtke: USGS–TWRI book 9, chap. A8. 1998. 48 p.
9–A9. National field manual for the collection of water-quality data: Safety in field activities, by S.L. Lane and R.G. Fay: USGS–TWRI book 9, chap. A9. 1998. 60 p.

27
Surface-Water Stations
Hydrographer installing temporary gage at Roseau River near Malung -
June 2002

28
Figure 5. Location of lake and stream-gaging stations.
Base from U.S. Geological Survey digital data1:2,000,000, 1972, Albers Equal-Area ConicProjection, standard parallels 29°30' and 45°30',Central meridian 93°30'
0 25 50 75 MILES
0 25 50 75 KILOMETERS
Hudson Bay Basin
Great Lakes Basin
Upper MississippiRiver Basin
Missouri River Basin
EXPLANATION
Stream gage
Lake gage
�MontevideoMontevideo
�RochesterRochester
�MankatoMankato
�St. CloudSt. Cloud
�St. PaulSt. Paul
�MinneapolisMinneapolis
�
GrandRapidsGrand
RapidsGrand
Rapids
�DuluthDuluth
�International
FallsInternational
FallsInternational
Falls
�BemidjiBemidji
UpperRed Lake
UpperRed Lake
Red LakeLower
Red LakeLower
�
Lake
Superior
MoorheadMoorhead
94°
92°
48°
46°
44°
92°
90°
96° of theLake
Woodsof theLake
Woods
MilleLacsLake
0512800005128000
0533158005331580
0504600005046000
0503050005030500
0511200005112000 0514052105140521
0512940005129400
0507350005073500
0507365005073650
0504999505049995
0401050004010500
0529200005292000
0529270405292704
0537850005378500
0507900005079000
0547600005476000
0531950005319500
0532000005320000
0532050005320500
0532500005325000
0535380005353800
0532700005327000
0534500005345000
0535520005355200
0533000005330000
05344500053445000533100005331000
0528850005288500
0534485005344850
0534605005346050
0528000005280000
0528789005287890
0534050005340500
0533670005336700
0533740005337400
0533850005338500
0528400005284000
05267000052670000524510005245100
0522750005227500
0524230005242300
0524400005244000
0402409804024098
0402400004024000
0401533004015330
0521100005211000
0524372505243725
0520051005200510
0513050005130500
0505150005051500
0505152205051522
0506150005061500
0505400005054000
0506200005062000
0506400005064000
0506450005064500
0506750005067500
0506250005062500
0506900005069000
0508250005082500
0508750005087500
0507450005074500
0507400005074000
0509200005092000
0510750005107500
05106000
0510450005104500
0507600005076000
05078000050780000507850005078500
0507823005078230
0513350005133500
0513150005131500
0512911505129115
0512750005127500
0512700005127000 0512448005124480
0529000005290000
0505000005050000
0505130005051300
0506100005061000
0524750005247500
05286000052860000527500005275000
05270700052707000527050005270500
0530100005301000
05315000053150000531650005316500
0531350005313500
0531100005311000
0530450005304500
0529100005291000
0531720005317200
0531700005317000
0545700005457000
0537299505372995
0514052005140520
0513200005132000
0512929005129290
05131450051314500513145505131455
0513144805131448
0508000005080000
0509400005094000
0529965005299650
0529980005299800
0530000005300000
0521270005212700
0532027005320270
0528870505288705
0529300005293000
0531658005316580

29
MilleLacsLake
Figure 6. Location of surface-water quality stations.
Base from U.S. Geological Survey digital data1:2,000,000, 1972, Albers Equal-Area ConicProjection, standard parallels 29°30' and 45°30',Central meridian 93°30'
Hudson Bay Basin
Great Lakes Basin
Upper MississippiRiver Basin
Missouri River Basin
EXPLANATION
Water-quality and/orsediment station
0 25 50 75 MILES
0 25 50 75 KILOMETERS
94°
92°
48°
46°
44°
92°
90°
96°
�MontevideoMontevideo
�RochesterRochester
�MankatoMankato
�St. CloudSt. Cloud
�
St. PaulSt. Paul�MinneapolisMinneapolis
�
GrandRapidsGrand
RapidsGrand
Rapids
�DuluthDuluth
�International
FallsInternational
FallsInternational
Falls
�BemidjiBemidji
UpperRed Lake
UpperRed Lake
Red LakeLower
Red LakeLower
�
Lake
Superior
MoorheadMoorhead
of theLake
Woodsof theLake
Woods
0528789005287890
0533158005331580
0532500005325000
0528870505288705
0532027005320270
0531700005317000

30 STREAMS TRIBUTARY TO LAKE SUPERIOR
04010500 PIGEON RIVER AT MIDDLE FALLS, NEAR GRAND PORTAGE, MN
LOCATION.--Lat 48°00’44", long 89°36’58", in SW1⁄4NE1⁄4 sec. 24, T.64 N., R.6 E., Cook County, Hydrologic Unit 04010101, on the
Grand Portage Indian Reservation, on right bank 400 ft upstream from Middle Falls, 2.5 mi upstream from Grand Portage Port of Entry, 3.5 mi upstream from mouth, and 4.7 mi northeast of city of Grand Portage.
DRAINAGE AREA.--609 mi2.
PERIOD OF RECORD.--June to October 1921, April to November 1922, March 1923 to current year. Published as "at International Bridge" April 1924 to September 1940; as "below International Bridge" October 1940 to September 1965. Monthly discharge only for some periods, published in WSP 1307.
REVISED RECORDS.--WSP 744:1927-28. WSP 804: 1934(M). WSP 974: Drainage area. WSP 1337:1924(M), 1925, 1926-28(M), 1931(M), 1938(M), 1941(M), 1945-46(M), 1947, 1948(M), 1950(M).
GAGE.--Water-stage recorder. Datum of gage is 787.58 ft above sea level (NGVD of 1929). Prior to Sept. 30, 1940, nonrecording gage at International Bridge, 5.8 mi upstream at datum 102.24 ft higher. Oct. 1, 1940 to Dec. 31, 1975, at present site at datum 2.00 ft higher.
REMARKS.--Records good except those for estimated daily discharges, which are poor.
EXTREMES FOR CURRENT YEAR.--Peak discharges greater than base discharge of 2,700 ft3/s and maximum (*):
Discharge Gage height Discharge Gage height Date Time (ft3/s) (ft) Date Time (ft3/s) (ft)
Apr 17 1300 *2,890 *8.03 No other peak greater than base discharge.
Minimum discharge, 46 ft3/s, Sept. 27, 28, gage height, 2.23 ft.
DISCHARGE, CUBIC FEET PER SECOND, WATER YEAR OCTOBER 2001 TO SEPTEMBER 2002 DAILY MEAN VALUES DAY OCT NOV DEC JAN FEB MAR APR MAY JUN JUL AUG SEP 1 94 399 e600 e215 e145 e115 e110 603 420 349 176 79 2 93 414 e560 e215 e140 e115 e110 571 394 312 220 99 3 90 385 e520 e210 e140 e115 e110 548 361 282 233 144 4 89 360 e500 e205 e140 e115 e110 540 335 256 211 115 5 86 318 e540 e205 e140 e115 e110 596 318 236 181 110 6 86 288 e760 e200 e135 e115 e110 618 307 214 155 107 7 88 266 e700 e200 e135 e115 e115 605 294 198 135 96 8 88 308 e620 e195 e135 e115 e120 610 284 189 122 86 9 89 326 e540 e195 e135 e115 e130 803 274 182 113 81 10 102 324 e490 e190 e135 e115 e150 864 259 172 105 90 11 112 297 e460 e185 e130 e110 e200 808 257 161 100 86 12 120 273 e430 e185 e130 e100 e400 711 285 152 98 81 13 131 262 e410 e180 e130 e90 e830 669 301 144 100 78 14 324 250 e390 e180 e130 e145 1320 655 310 139 98 74 15 411 243 e370 e180 e130 e125 1480 668 423 131 120 69 16 349 233 e355 e175 e125 e115 1730 637 515 125 152 65 17 293 227 e340 e175 e125 e115 2180 618 442 119 220 60 18 262 221 e325 e175 e125 e110 2040 569 375 111 233 57 19 252 221 e315 e170 e125 e110 1830 524 327 105 216 59 20 240 219 e300 e170 e125 e110 1480 493 325 98 193 57 21 225 221 e290 e170 e120 e110 1170 465 343 95 165 53 22 208 210 e280 e170 e120 e110 979 444 326 103 143 50 23 217 206 e275 e170 e120 e110 842 436 316 101 128 49 24 252 370 e270 e150 e120 e110 798 434 381 96 115 48 25 316 1870 e260 e140 e120 e110 795 429 619 94 104 49 26 395 1610 e250 e190 e120 e110 722 401 721 89 96 49 27 382 1010 e240 e170 e120 e110 653 386 633 85 89 47 28 345 e605 e235 e160 e120 e110 608 371 531 101 85 48 29 305 e660 e230 e155 --- e110 604 357 448 97 82 49 30 284 e670 e225 e150 --- e110 615 362 389 106 79 48 31 339 --- e220 e145 --- e110 --- 402 --- 106 77 ---
TOTAL 6667 13266 12300 5575 3615 3490 22451 17197 11513 4748 4344 2183 MEAN 215 442 397 180 129 113 748 555 384 153 140 72.8 MAX 411 1870 760 215 145 145 2180 864 721 349 233 144 MIN 86 206 220 140 120 90 110 357 257 85 77 47 AC-FT 13220 26310 24400 11060 7170 6920 44530 34110 22840 9420 8620 4330 CFSM 0.35 0.73 0.65 0.30 0.21 0.18 1.23 0.91 0.63 0.25 0.23 0.12 IN. 0.41 0.81 0.75 0.34 0.22 0.21 1.37 1.05 0.70 0.29 0.27 0.13

31 STREAMS TRIBUTARY TO LAKE SUPERIOR
04010500 PIGEON RIVER AT MIDDLE FALLS, NEAR GRAND PORTAGE, MN--Continued
STATISTICS OF MONTHLY MEAN DATA FOR WATER YEARS 1921 - 2002, BY WATER YEAR (WY)
OCT NOV DEC JAN FEB MAR APR MAY JUN JUL AUG SEP
MEAN 359 356 209 151 126 176 1203 1602 836 417 241 286 MAX 2095 1461 720 431 300 1169 2724 4016 2801 1127 1029 2985 (WY) 1978 1971 1978 1975 1969 1945 2001 1950 1947 1968 1950 1977 MIN 17.4 11.4 2.85 2.18 8.02 60.0 290 138 125 78.0 46.5 40.2 (WY) 1977 1977 1977 1977 1977 1941 1977 1977 1977 1958 1998 1976
SUMMARY STATISTICS FOR 2001 CALENDAR YEAR FOR 2002 WATER YEAR WATER YEARS 1921 - 2002 ANNUAL TOTAL 249138 107349 ANNUAL MEAN 683 294 499 HIGHEST ANNUAL MEAN 840 1971 LOWEST ANNUAL MEAN 158 1958 HIGHEST DAILY MEAN 5710 Apr 26 2180 Apr 17 10700 May 5 1934 LOWEST DAILY MEAN 65 Jan 1 47 Sep 27 1.0a Jan 15-21 1977 ANNUAL SEVEN-DAY MINIMUM 67 Jan 1 48 Sep 24 1.0 Jan 15 1977 MAXIMUM PEAK FLOW 2890 Apr 17 11000b May 5 1934 MAXIMUM PEAK STAGE 8.03 Apr 17 12.37c Sep 24 1977 INSTANTANEOUS LOW FLOW 46 Sep 27 1.0a Jan 15 1977 ANNUAL RUNOFF (AC-FT) 494200 212900 361800 ANNUAL RUNOFF (CFSM) 1.12 0.48 0.82 ANNUAL RUNOFF (INCHES) 15.22 6.56 11.14 10 PERCENT EXCEEDS 2000 616 1280 50 PERCENT EXCEEDS 264 193 223 90 PERCENT EXCEEDS 87 90 84 a Minimum observed. b Gage height 7.60 ft, site and datum then in use. c At present site and datum, discharge 10,500 ft3/s. e Estimated.
O N D2001
J F M A M J J A S2002
10
20
50
100100
200
500
10001000
2000
5000
10,000
DAILY-MEAN DISCHARGE,
IN CUBIC FEET PER SECOND

32 STREAMS TRIBUTARY TO LAKE SUPERIOR--Continued
04015330 KNIFE RIVER NEAR TWO HARBORS, MN
LOCATION.--Lat 46°56’49", long 91°47’32", in SW1⁄4NW1⁄4 sec. 31, T.52 N., R.11 W., Lake County, Hydrologic Unit 04010102, on
right bank 600 ft downstream from bridge on U.S. Highway 61, 0.5 mi upstream from bridge on County Highway 102, in town of Knife River, 0.8 mi upstream from Lake Superior, and 7.8 mi southwest of Two Harbors.
DRAINAGE AREA.--83.6 mi2.
PERIOD OF RECORD.--July 1974 to current year.
GAGE.--Water-stage recorder. Elevation of gage is 640 ft above sea level (from topographic map).
REMARKS.--Records good except those for estimated daily discharges, which are poor. Flow regulated intermittently by fish ladder operation just upstream of gage.
EXTREMES FOR CURRENT YEAR.--Peak discharges greater than base discharge of 1,800 ft3/s and maximum (*):
Discharge Gage height Discharge Gage height Date Time (ft3/s) (ft) Date Time (ft3/s) (ft)
Jun 23 1130 2,170 6.56 Jul 8 0700 *2,390 *6.79
Minimum discharge, 0.45 ft3/s, July 5, gage height, 2.04 ft.
DISCHARGE, CUBIC FEET PER SECOND, WATER YEAR OCTOBER 2001 TO SEPTEMBER 2002 DAILY MEAN VALUES DAY OCT NOV DEC JAN FEB MAR APR MAY JUN JUL AUG SEP 1 7.0 33 69 e11 e3.9 e3.1 e31 133 22 18 22 14 2 7.0 29 62 e10 e3.9 e3.0 e29 111 20 13 28 24 3 6.8 26 51 e10 e3.9 e2.9 e27 92 19 11 19 40 4 6.7 23 50 e9.3 e3.9 e2.9 e24 89 19 8.5 16 24 5 6.7 22 206 e10 e3.9 e2.9 e23 116 19 6.9 13 56 6 6.6 21 237 e11 4.0 e2.8 e21 119 18 8.4 11 44 7 6.7 21 98 e13 e4.2 2.8 e75 105 18 16 10 28 8 7.4 51 69 e14 e4.3 e2.9 e290 188 17 1210 11 20 9 8.7 51 39 e13 e4.4 e3.0 e230 647 15 457 11 15 10 20 42 53 e11 e4.4 3.0 e600 339 14 136 8.5 176 11 37 36 42 e9.6 e4.4 e3.2 1110 195 14 72 7.5 83 12 28 32 36 e8.8 e4.4 e3.5 817 279 14 42 21 42 13 26 30 33 e7.8 e4.4 e4.0 971 232 16 28 37 27 14 44 29 e38 e7.0 4.3 e4.6 971 167 19 21 23 21 15 37 27 e39 e6.4 e4.3 e5.2 796 132 16 16 22 15 16 30 26 27 e5.8 e4.4 e5.9 619 114 13 13 77 12 17 24 24 31 e5.4 e4.6 e6.7 439 96 11 11 162 11 18 21 23 32 e5.0 e5.0 e6.2 401 82 9.6 11 118 10 19 19 23 30 e5.1 e4.7 e5.6 333 71 12 8.9 70 12 20 18 22 e28 e5.4 e4.5 e5.2 196 63 24 8.4 47 20 21 16 21 e26 e5.6 e4.5 e4.4 138 57 26 9.2 38 16 22 16 21 e24 e5.7 e4.5 e5.0 116 52 21 10 41 13 23 30 21 e22 e5.4 e4.9 e5.6 106 50 1510 8.7 33 14 24 65 144 e20 e5.0 e4.6 e6.2 97 47 951 7.8 31 22 25 75 662 e19 e6.5 e4.2 e6.6 89 43 477 13 26 22 26 62 218 e18 e6.1 e3.8 e6.8 78 41 176 20 18 26 27 51 132 e16 e5.0 e3.5 e7.2 71 37 95 16 15 23 28 43 108 e15 e4.4 e3.2 e9.0 81 34 57 20 13 19 29 38 95 e14 e4.1 --- e14 115 32 37 18 13 18 30 37 62 e13 e4.0 --- e21 177 29 25 13 13 18 31 33 --- e12 e3.9 --- e30 --- 27 --- 13 12 ---
TOTAL 833.6 2075 1469 234.3 119.0 195.2 9071 3819 3704.6 2264.8 987.0 885 MEAN 26.9 69.2 47.4 7.56 4.25 6.30 302 123 123 73.1 31.8 29.5 MAX 75 662 237 14 5.0 30 1110 647 1510 1210 162 176 MIN 6.6 21 12 3.9 3.2 2.8 21 27 9.6 6.9 7.5 10 AC-FT 1650 4120 2910 465 236 387 17990 7570 7350 4490 1960 1760 CFSM 0.32 0.83 0.57 0.09 0.05 0.08 3.62 1.47 1.48 0.87 0.38 0.35 IN. 0.37 0.92 0.65 0.10 0.05 0.09 4.04 1.70 1.65 1.01 0.44 0.39

33 STREAMS TRIBUTARY TO LAKE SUPERIOR--Continued
04015330 KNIFE RIVER NEAR TWO HARBORS, MN--Continued
STATISTICS OF MONTHLY MEAN DATA FOR WATER YEARS 1974 - 2002, BY WATER YEAR (WY)
OCT NOV DEC JAN FEB MAR APR MAY JUN JUL AUG SEP
MEAN 90.7 82.9 24.4 11.4 13.4 60.0 380 155 89.3 90.6 36.7 79.8 MAX 267 238 75.1 31.4 79.2 204 889 427 240 402 163 314 (WY) 1996 1999 1999 1975 1998 1998 2001 1979 1984 1999 1988 1977 MIN 3.06 1.58 0.000 0.000 0.000 6.30 73.6 16.0 13.0 4.87 2.95 1.43 (WY) 1977 1977 1977 1977 1977 2002 1977 1976 1995 1988 1976 1976
SUMMARY STATISTICS FOR 2001 CALENDAR YEAR FOR 2002 WATER YEAR WATER YEARS 1974 - 2002 ANNUAL TOTAL 40288.8 25657.5 ANNUAL MEAN 110 70.3 93.2 HIGHEST ANNUAL MEAN 164 1999 LOWEST ANNUAL MEAN 44.2 1977 HIGHEST DAILY MEAN 2640 Apr 23 1510 Jun 23 4840 Jul 5 1999 LOWEST DAILY MEAN 3.5 Feb 24 2.8 Mar 6, 7 0.00a Dec 2 1976 ANNUAL SEVEN-DAY MINIMUM 3.6 Feb 21 2.9 Mar 2 0.00 Dec 2 1976 MAXIMUM PEAK FLOW 2390 Jul 8 9100 Jul 5 1999 MAXIMUM PEAK STAGE 6.79 Jul 8 12.14 Jul 5 1999 INSTANTANEOUS LOW FLOW 0.45b Jul 5 ANNUAL RUNOFF (AC-FT) 79910 50890 67530 ANNUAL RUNOFF (CFSM) 1.32 0.84 1.12 ANNUAL RUNOFF (INCHES) 17.93 11.42 15.15 10 PERCENT EXCEEDS 238 134 229 50 PERCENT EXCEEDS 16 21 23 90 PERCENT EXCEEDS 4.6 4.4 5.0 a Many days in 1977. b Result of regulation. e Estimated.
O N D2001
J F M A M J J A S2002
1
2
5
1010
20
50
100100
200
500
10001000
2000
5000
10,000
DAILY-MEAN DISCHARGE,
IN CUBIC FEET PER SECOND

34 STREAMS TRIBUTARY TO LAKE SUPERIOR--Continued
04024000 ST. LOUIS RIVER AT SCANLON, MN
LOCATION.--Lat 46°42’12", long 92°25’07", in NW1⁄4 sec. 30, T.49 N., R.16 W., Carlton County, Hydrologic Unit 04010201, on right bank 80 ft downstream from lower bridge on U.S. Highway 61 at Scanlon, 0.6 mi downstream from Minnesota Power Co. power plant, 3 mi upstream from Thomson Reservoir, and 3.2 mi upstream from Midway River.
DRAINAGE AREA.--3,430 mi2 (approximately).
PERIOD OF RECORD.--January 1908 to current year. Monthly discharge only for some periods published in WSP 1307. Published as "near Thomson" 1908-50.
REVISED RECORDS.--WSP 1337: 1911-12.
GAGE.--Water-stage recorder. Datum of gage is 1,101.23 ft above sea level (NGVD of 1929). Oct. 5, 1909 to Sept. 5, 1914, nonrecording gage 3 mi downstream and 50 ft below power plant at datum about 420 ft lower. Sept. 6, 1914 to Aug. 4, 1953, power plant record at Thomson hydroelectric plant.
REMARKS.--Records good except those for estimated daily discharges, which are fair. Diurnal fluctuation caused by power plant upstream. Flow regulated by Whiteface Reservoir and Boulder, Island, Rice and Fish Lakes, combined capacity, 332,160 acre-ft; the water-discharge table shows the monthly change in contents (+).
DISCHARGE, CUBIC FEET PER SECOND, WATER YEAR OCTOBER 2001 TO SEPTEMBER 2002 DAILY MEAN VALUES DAY OCT NOV DEC JAN FEB MAR APR MAY JUN JUL AUG SEP 1 584 1330 2390 e1100 1060 e900 1230 3510 1340 6690 2510 1600 2 548 1230 2180 e1360 1050 624 1190 3360 1260 5400 3430 1820 3 555 1290 2210 e1340 1020 e1000 1110 2960 1170 4370 3520 1930 4 583 1300 2260 e1270 e1010 809 1010 3000 1110 3550 3020 1800 5 570 1200 2200 e1320 e1020 532 933 2810 1020 2840 2690 1640 6 509 1150 2460 e1300 1020 e1200 919 3020 991 2460 2340 1650 7 503 1150 2680 1260 1050 e1100 972 3040 877 2430 2160 1680 8 534 1230 2730 1290 1070 874 1320 3080 870 8880 1980 1560 9 603 1220 2090 1380 1060 908 1640 3600 836 12000 1910 1550 10 760 1270 2210 1380 1040 e1040 2460 3890 737 8970 1880 1670 11 870 1310 2030 1330 1030 1120 4470 3880 764 7300 1690 2050 12 946 1230 2210 1350 1010 e1140 4920 3930 778 6010 1850 2060 13 1100 1190 2130 1330 1070 e1100 5350 4470 767 5040 1830 1810 14 1110 1210 1760 1240 1030 e1070 6560 4600 818 4410 1800 1660 15 1140 1190 1730 1210 985 e1060 7520 4650 830 3810 1670 1490 16 1130 1190 1880 1190 1030 e1040 7220 4110 788 3260 1700 1420 17 1110 1190 1960 1100 953 e1250 6920 3900 775 2850 3140 1310 18 1200 1180 1880 e1120 1020 e1300 6660 3400 798 2380 3620 1190 19 1190 1090 1590 e1130 1060 e1230 6990 3100 980 2250 3640 1180 20 1120 1050 1550 1150 1060 e1120 7100 2820 1010 1840 3020 1480 21 1090 1090 1400 1100 994 1030 6630 2500 987 1740 2780 1750 22 1060 1080 1410 1110 1020 928 6220 2380 1080 1680 2780 1640 23 1090 1050 1490 1150 1040 1120 5760 2300 9550 1670 2850 1530 24 1150 1150 e1250 1090 1030 1110 5450 2000 21800 1490 2710 1530 25 1220 1370 e1230 1040 1060 1020 4870 1920 25400 1490 2370 1540 26 1280 1750 e1300 1090 895 1030 4490 1780 24300 1460 2190 1520 27 1240 2050 1380 1100 e600 956 4060 1760 20700 1500 2040 1430 28 1300 1500 e1270 1100 707 934 3900 1590 15600 1900 1860 1310 29 1320 1610 e1200 e1070 --- 1020 3630 1590 11200 3030 1680 1230 30 1260 2050 e1260 990 --- 1080 3620 1420 8500 2650 1580 1220 31 1330 --- e1180 1050 --- 1170 --- 1340 --- 2300 1470 ---
TOTAL 30005 38900 56500 37040 27994 31815 125124 91710 157636 117650 73710 47250 MEAN 968 1297 1823 1195 1000 1026 4171 2958 5255 3795 2378 1575 MAX 1330 2050 2730 1380 1070 1300 7520 4650 25400 12000 3640 2060 MIN 503 1050 1180 990 600 532 919 1340 737 1460 1470 1180 AC-FT 59510 77160 112100 73470 55530 63110 248200 181900 312700 233400 146200 93720 CFSM 0.28 0.38 0.53 0.35 0.29 0.30 1.22 0.86 1.53 1.11 0.69 0.46 IN. 0.33 0.42 0.61 0.40 0.30 0.35 1.36 0.99 1.71 1.28 0.80 0.51
+ 61.6 186 -309 -611 -539 -469 892 272 780 301 1.04 -111‡MEAN 1030 1483 1514 584 461 557 5063 3230 6034 4096 2379 1464‡CFSM .30 .43 .44 .17 .13 .16 1.48 .94 1.76 1.19 .69 .43‡IN .35 .48 .51 .20 .14 .18 1.65 1.08 1.96 1.37 .80 .48
CAL YR 01 TOTAL 1220088 MEAN 3343 MAX 27100 MIN 503 ‡MEAN 3126 ‡CFSM 0.91 ‡IN 12.38 WTR YR 02 TOTAL 835334 MEAN 2289 MAX 25400 MIN 503 ‡MEAN 2327 ‡CFSM 0.68 ‡IN 9.21

35 STREAMS TRIBUTARY TO LAKE SUPERIOR--Continued
04024000 ST. LOUIS RIVER AT SCANLON, MN--Continued
STATISTICS OF MONTHLY MEAN DATA FOR WATER YEARS 1908 - 2002, BY WATER YEAR (WY)
OCT NOV DEC JAN FEB MAR APR MAY JUN JUL AUG SEP
MEAN 2034 1756 1295 1078 1063 1461 5733 5112 3568 2503 1673 1765 MAX 7508 8518 2993 2272 2200 6026 15860 22210 16480 12630 9197 7594 (WY) 1974 1972 1972 1966 1966 1945 2001 1950 1908 1999 1953 1928 MIN 407 473 282 265 249 301 667 593 458 199 377 402 (WY) 1935 1935 1911 1911 1924 1924 1977 1977 1988 1988 1977 1934
SUMMARY STATISTICS FOR 2001 CALENDAR YEAR FOR 2002 WATER YEAR WATER YEARS 1908 - 2002 ANNUAL TOTAL 1220088 835334 ANNUAL MEAN 3343 2289 2408 HIGHEST ANNUAL MEAN 4276 1972 LOWEST ANNUAL MEAN 945 1924 HIGHEST DAILY MEAN 27100 Apr 25 25400 Jun 25 37900 May 9 1950 LOWEST DAILY MEAN 503 Oct 7 503 Oct 7 88 Aug 24 1977 ANNUAL SEVEN-DAY MINIMUM 543 Oct 2 543 Oct 2 134 Jul 26 1988 MAXIMUM PEAK FLOW 25900 Jun 25 37900 May 9 1950 MAXIMUM PEAK STAGE 11.87 Jun 25 15.80 May 9 1950 ANNUAL RUNOFF (AC-FT) 2420000 1657000 1745000 ANNUAL RUNOFF (CFSM) 0.97 0.67 0.70 ANNUAL RUNOFF (INCHES) 13.23 9.06 9.54 10 PERCENT EXCEEDS 11300 4390 5300 50 PERCENT EXCEEDS 1180 1340 1400 90 PERCENT EXCEEDS 652 941 656 + Change in contents, equivalent in cubic feet per second, in Whiteface Reservoir, and Boulder, Island, Rice and Fish Lakes; records furnished by Minnesota Power Co. ‡ Adjusted for change in reservoir contents. e Estimated.
O N D2001
J F M A M J J A S2002
100
200
500
10001000
2000
5000
10,00010,000
20,000
50,000
100,000
DAILY-MEAN DISCHARGE,
IN CUBIC FEET PER SECOND

36 STREAMS TRIBUTARY TO LAKE SUPERIOR--Continued
04024098 DEER CREEK NEAR HOLYOKE, MN
LOCATION.--Lat 46°31’30", long 92°23’20", in NE1⁄4SE1⁄4 sec. 29, T.47 N., R.16 W., Carlton County, Hydrologic Unit 04010301, on
left bank 179 ft west of State Highway No. 23, 0.9 mi upstream from mouth and 4.0 mi north of Holyoke.
DRAINAGE AREA.--7.70 mi2.
PERIOD OF RECORD.--October 1976 to December, 2001 (discontinued).
GAGE.--Water-stage recorder and crest-stage gage. Datum of gage is 786.14 ft above sea level (NGVD of 1929).
REMARKS.--Records fair except those for estimated daily discharges, which are poor.
DISCHARGE, CUBIC FEET PER SECOND, WATER YEAR OCTOBER 2001 TO SEPTEMBER 2002 DAILY MEAN VALUES DAY OCT NOV DEC JAN FEB MAR APR MAY JUN JUL AUG SEP 1 1.5 2.0 3.1 --- --- --- --- --- --- --- --- --- 2 1.6 2.0 3.8 --- --- --- --- --- --- --- --- --- 3 1.5 1.8 3.4 --- --- --- --- --- --- --- --- --- 4 1.6 1.8 3.4 --- --- --- --- --- --- --- --- --- 5 1.9 1.8 12 --- --- --- --- --- --- --- --- --- 6 1.8 1.9 15 --- --- --- --- --- --- --- --- --- 7 1.8 1.8 10 --- --- --- --- --- --- --- --- --- 8 2.0 1.8 3.6 --- --- --- --- --- --- --- --- --- 9 2.1 1.8 3.5 --- --- --- --- --- --- --- --- --- 10 3.5 1.8 2.9 --- --- --- --- --- --- --- --- --- 11 2.4 1.8 2.7 --- --- --- --- --- --- --- --- --- 12 1.8 1.6 2.5 --- --- --- --- --- --- --- --- --- 13 2.2 1.9 e1.9 --- --- --- --- --- --- --- --- --- 14 2.5 1.8 e1.9 --- --- --- --- --- --- --- --- --- 15 2.6 1.8 2.4 --- --- --- --- --- --- --- --- --- 16 2.6 1.7 2.6 --- --- --- --- --- --- --- --- --- 17 3.7 1.7 3.0 --- --- --- --- --- --- --- --- --- 18 2.5 1.8 3.2 --- --- --- --- --- --- --- --- --- 19 2.4 1.7 2.5 --- --- --- --- --- --- --- --- --- 20 2.0 1.7 e2.3 --- --- --- --- --- --- --- --- --- 21 1.9 1.6 e2.2 --- --- --- --- --- --- --- --- --- 22 2.1 1.7 e2.1 --- --- --- --- --- --- --- --- --- 23 2.8 1.9 e2.1 --- --- --- --- --- --- --- --- --- 24 2.0 4.0 e1.9 --- --- --- --- --- --- --- --- --- 25 1.9 7.1 e1.8 --- --- --- --- --- --- --- --- --- 26 2.1 4.2 e1.7 --- --- --- --- --- --- --- --- --- 27 1.9 17 e1.7 --- --- --- --- --- --- --- --- --- 28 1.8 17 e1.6 --- --- --- --- --- --- --- --- --- 29 1.9 6.0 e1.6 --- --- --- --- --- --- --- --- --- 30 1.9 3.8 e1.6 --- --- --- --- --- --- --- --- --- 31 1.9 --- e1.5 --- --- --- --- --- --- --- --- ---
TOTAL 66.2 100.3 105.5 --- --- --- --- --- --- --- --- --- MEAN 2.14 3.34 3.40 --- --- --- --- --- --- --- --- --- MAX 3.7 17 15 --- --- --- --- --- --- --- --- --- MIN 1.5 1.6 1.5 --- --- --- --- --- --- --- --- --- AC-FT 131 199 209 --- --- --- --- --- --- --- --- --- CFSM 0.28 0.43 0.44 --- --- --- --- --- --- --- --- --- IN. 0.32 0.48 0.51 --- --- --- --- --- --- --- --- ---

37 STREAMS TRIBUTARY TO LAKE SUPERIOR--Continued
04024098 DEER CREEK NEAR HOLYOKE, MN--Continued
STATISTICS OF MONTHLY MEAN DATA FOR WATER YEARS 1976 - 2002, BY WATER YEAR (WY)
OCT NOV DEC JAN FEB MAR APR MAY JUN JUL AUG SEP
MEAN 5.99 4.60 2.48 1.90 2.70 8.45 24.7 10.1 7.63 6.98 4.99 6.75 MAX 21.8 12.2 4.35 2.92 9.29 21.5 90.8 24.3 31.4 26.7 36.9 30.4 (WY) 1983 1983 1999 1992 1998 1995 1986 1991 1993 1999 1986 1986 MIN 1.69 1.59 1.31 0.97 1.06 2.34 4.11 2.15 1.39 1.50 0.89 1.24 (WY) 1988 1977 1977 1979 1979 1986 1977 1980 1995 1988 1982 1993
SUMMARY STATISTICS FOR 2001 CALENDAR YEAR WATER YEARS 1976 - 2002 ANNUAL TOTAL 3660.3 ANNUAL MEAN 10.0 7.29 HIGHEST ANNUAL MEAN 19.3 1986 LOWEST ANNUAL MEAN 3.65 1980 HIGHEST DAILY MEAN 393 Apr 23 553 Sep 6 1990 LOWEST DAILY MEAN 1.4 Feb 15 0.21 Jul 2 1976 ANNUAL SEVEN-DAY MINIMUM 1.5 Aug 5 0.47 Aug 10 1982 MAXIMUM PEAK FLOW 2000a Sep 3 1985 MAXIMUM PEAK STAGE 32.76b Sep 3 1985 INSTANTANEOUS LOW FLOW 0.10 Nov 13 1996 ANNUAL RUNOFF (AC-FT) 7260 5280 ANNUAL RUNOFF (CFSM) 1.30 0.95 ANNUAL RUNOFF (INCHES) 17.68 12.87 10 PERCENT EXCEEDS 18 14 50 PERCENT EXCEEDS 2.1 2.5 90 PERCENT EXCEEDS 1.6 1.5 a From rating curve extended above 1000 ft3/s on basis of flow-thru-culvert computations. b From floodmark. e Estimated.
O N D2001
J F M A M J J A S2002
1
2
5
1010
20
50
100
DAILY-MEAN DISCHARGE,
IN CUBIC FEET PER SECOND
Gap indicatesmissing record

38 RED RIVER OF THE NORTH BASIN
05030500 OTTER TAIL RIVER NEAR ELIZABETH, MN
LOCATION.--Lat 46°22’10", long 96°01’02", in SW1⁄4SE1⁄4 sec. 31, T.134 N., R.42 W.,Ottertail County, Hydrologic Unit 09020103,
on right bank at County Highway 10, 2.5 miles below Taplin Gorge Dam, 5.0 miles above the Diversion Dam, 5.7 miles east of Elizabeth and 6.6 miles northeast of Fergus Falls.
DRAINAGE AREA.--1,230 mi2 (approximately).
PERIOD OF RECORD.--May 1904 to September 1917, monthly discharge only, published as "at German Church near Fergus Falls" in WSP 1308. July 1992 to current year.
GAGE.--Water-stage recorder. Elevation of gage is 1,250 ft above sea level (from topographic map). Nonrecording gage at same site Nov. 1913 to September 1917 at elevation 1,265 ft (from topographic map).
REMARKS.--Records good except those for estimated daily discharge, which are fair. Flow regulated by power plant upstream.
DISCHARGE, CUBIC FEET PER SECOND, WATER YEAR OCTOBER 2001 TO SEPTEMBER 2002 DAILY MEAN VALUES DAY OCT NOV DEC JAN FEB MAR APR MAY JUN JUL AUG SEP 1 273 251 279 e345 e301 286 305 453 525 409 486 352 2 273 251 279 e345 303 287 308 449 519 413 485 393 3 266 251 280 e345 e305 286 306 451 504 420 475 410 4 265 251 293 e350 e305 286 307 452 490 406 460 397 5 259 251 313 e350 e305 287 309 452 488 418 476 394 6 256 251 335 e345 303 289 314 453 487 404 475 412 7 252 251 349 e345 303 289 316 455 488 398 465 394 8 253 251 346 350 304 291 318 480 461 470 438 387 9 254 252 347 344 305 293 323 527 428 456 413 366 10 252 251 348 343 e303 293 347 518 432 539 458 355 11 258 251 352 342 300 291 363 527 434 589 444 358 12 258 251 351 340 298 305 361 534 433 562 419 358 13 259 251 352 340 298 313 362 536 422 544 438 357 14 258 251 352 337 298 313 365 545 404 558 421 352 15 258 251 351 333 296 311 374 556 416 548 412 349 16 258 251 350 e325 294 309 402 553 405 533 401 337 17 258 251 351 e324 295 309 401 554 395 541 398 330 18 255 251 368 e326 294 308 403 555 389 536 395 330 19 255 251 356 e324 294 307 400 556 392 534 375 320 20 255 251 355 e325 294 307 401 558 386 537 380 296 21 253 251 359 324 294 303 407 560 382 517 379 287 22 252 252 359 326 294 298 412 564 377 536 370 287 23 243 253 352 e325 294 300 418 554 383 523 366 287 24 242 254 336 e320 294 301 418 542 395 522 364 287 25 241 261 331 318 291 302 412 537 396 480 360 286 26 235 316 338 316 283 300 415 535 395 537 352 282 27 248 315 345 317 279 302 438 534 409 519 372 265 28 240 279 e350 e310 284 302 462 534 414 485 375 255 29 240 264 e350 e310 --- 303 452 536 413 497 375 254 30 245 277 e345 e305 --- 303 453 530 415 463 375 249 31 251 --- e345 e305 --- 302 --- 525 --- 430 374 ---
TOTAL 7865 7743 10517 10254 8311 9276 11272 16115 12877 15324 12776 9986 MEAN 254 258 339 331 297 299 376 520 429 494 412 333 MAX 273 316 368 350 305 313 462 564 525 589 486 412 MIN 235 251 279 305 279 286 305 449 377 398 352 249 AC-FT 15600 15360 20860 20340 16480 18400 22360 31960 25540 30400 25340 19810 CFSM 0.21 0.21 0.28 0.27 0.24 0.24 0.31 0.42 0.35 0.40 0.34 0.27 IN. 0.24 0.23 0.32 0.31 0.25 0.28 0.34 0.49 0.39 0.46 0.39 0.30

39 RED RIVER OF THE NORTH BASIN
05030500 OTTER TAIL RIVER NEAR ELIZABETH, MN--Continued
STATISTICS OF MONTHLY MEAN DATA FOR WATER YEARS 1992 - 2002, BY WATER YEAR (WY)
OCT NOV DEC JAN FEB MAR APR MAY JUN JUL AUG SEP
MEAN 311 337 346 335 350 393 550 729 659 583 433 353 MAX 740 571 529 479 523 477 725 1056 1003 770 759 817 (WY) 1994 1994 1999 1999 1999 1999 1999 2001 2001 1998 1993 1993 MIN 112 143 141 181 209 299 357 453 429 358 218 134 (WY) 1997 1993 1993 1993 1993 2002 1993 1993 2002 1995 1996 1996
SUMMARY STATISTICS FOR 2001 CALENDAR YEAR FOR 2002 WATER YEAR WATER YEARS 1992 - 2002 ANNUAL TOTAL 194160 132316 ANNUAL MEAN 532 363 452 HIGHEST ANNUAL MEAN 593 1999 LOWEST ANNUAL MEAN 349 1995 HIGHEST DAILY MEAN 1110 May 23 589 Jul 11 1110 May 23 2001 LOWEST DAILY MEAN 235 Oct 26 235 Oct 26 99 Oct 15 1996 ANNUAL SEVEN-DAY MINIMUM 241 Oct 23 241 Oct 23 101 Oct 10 1996 MAXIMUM PEAK FLOW 663 Jul 10 1170 May 23 2001 MAXIMUM PEAK STAGE 7.33 Jul 10 9.37 May 23 2001 INSTANTANEOUS LOW FLOW 175a Oct 26 61a Aug 9 1996 ANNUAL RUNOFF (AC-FT) 385100 262400 327200 ANNUAL RUNOFF (CFSM) 0.43 0.29 0.37 ANNUAL RUNOFF (INCHES) 5.87 4.00 4.99 10 PERCENT EXCEEDS 1020 524 746 50 PERCENT EXCEEDS 435 345 416 90 PERCENT EXCEEDS 253 253 217 a Result of regulation. e Estimated.
O N D2001
J F M A M J J A S2002
100
200
500
1000
DAILY-MEAN DISCHARGE,
IN CUBIC FEET PER SECOND

40 RED RIVER OF THE NORTH BASIN--Continued
05046000 OTTER TAIL RIVER BELOW ORWELL DAM, NEAR FERGUS FALLS, MN
LOCATION.--Lat 46°12’35", long 96°11’05", in NE1⁄4 sec. 34, T.132 N., R.44 W., Otter Tail County, Hydrologic Unit 09020103, on left bank 0.7 mi downstream from Orwell Dam on County Highway 15, 6.1 mi downstream from Dayton Hollow Dam, 8 mi southwest of Fergus Falls, and 11.1 mi downstream from Pelican River.
DRAINAGE AREA.--1,740 mi2.
PERIOD OF RECORD.--October 1930 to current year. Prior to October 1952, published as "Otter Tail River below Pelican River, near Fergus Falls". Monthly discharge only for some periods, published in WSP 1308.
REVISED RECORDS.--WSP 785: 1934(M). WSP 1208: 1947(M). WSP 1308: 1931(M).
GAGE.--Water-stage recorder. Datum of gage is 1,029.65 ft above sea level ((NGVD of 1912, levels by U.S. Army Corps of Engineers). Oct. 11, 1930 to Nov. 17, 1933, at same site at datum 2.00 ft higher; Nov. 18, 1933 to Mar. 21, 1953, at site 6.1 mi upstream at datum 40.30 ft higher.
REMARKS.--Records good. Flow regulated at Orwell Lake (station 05045950) beginning Mar. 21, 1953, and by power plant upstream.
DISCHARGE, CUBIC FEET PER SECOND, WATER YEAR OCTOBER 2001 TO SEPTEMBER 2002 DAILY MEAN VALUES DAY OCT NOV DEC JAN FEB MAR APR MAY JUN JUL AUG SEP 1 428 399 425 518 415 407 526 699 738 500 629 531 2 446 400 425 518 390 446 513 687 733 467 589 530 3 400 398 425 518 392 446 513 676 713 468 562 578 4 370 397 425 492 397 425 513 678 672 473 562 606 5 370 397 423 477 422 390 513 675 654 476 562 609 6 370 397 442 479 440 377 512 647 632 477 562 623 7 368 376 457 477 440 396 513 641 608 481 565 635 8 369 340 458 478 440 411 492 719 585 621 567 634 9 367 340 458 477 440 413 477 786 585 723 567 629 10 370 340 475 477 440 411 480 831 588 832 567 627 11 412 340 489 477 460 432 601 857 589 1070 564 614 12 456 341 489 477 495 446 651 858 588 1070 546 543 13 477 342 489 477 511 446 561 858 587 1060 534 504 14 476 340 489 505 488 485 565 878 584 1050 513 503 15 472 344 489 523 476 513 663 813 584 886 496 502 16 465 348 489 521 475 513 717 766 583 765 496 473 17 446 349 489 518 473 512 718 840 580 725 499 452 18 419 349 490 500 471 511 717 858 578 694 502 449 19 411 349 516 479 471 512 717 855 548 693 503 428 20 404 374 516 477 474 509 717 811 512 693 594 411 21 404 397 470 477 474 483 713 761 525 699 668 415 22 404 397 453 461 472 454 679 747 545 695 660 415 23 404 397 456 452 471 440 658 749 548 658 577 411 24 405 397 456 452 475 440 662 747 552 635 523 396 25 405 397 457 468 473 440 637 747 568 589 422 383 26 404 397 453 477 472 440 623 748 584 618 179 344 27 404 397 421 477 423 462 624 746 560 675 202 314 28 404 411 420 477 375 477 628 742 545 675 216 340 29 404 431 452 477 --- 522 713 739 545 675 272 343 30 403 425 453 463 --- 549 729 741 545 671 478 334 31 397 --- 490 452 --- 546 --- 741 --- 649 528 ---
TOTAL 12734 11306 14339 14998 12645 14254 18345 23641 17758 21463 15704 14576 MEAN 411 377 463 484 452 460 612 763 592 692 507 486 MAX 477 431 516 523 511 549 729 878 738 1070 668 635 MIN 367 340 420 452 375 377 477 641 512 467 179 314 AC-FT 25260 22430 28440 29750 25080 28270 36390 46890 35220 42570 31150 28910 CFSM 0.24 0.22 0.27 0.28 0.26 0.26 0.35 0.44 0.34 0.40 0.29 0.28 IN. 0.27 0.24 0.31 0.32 0.27 0.30 0.39 0.51 0.38 0.46 0.34 0.31

41 RED RIVER OF THE NORTH BASIN--Continued
05046000 OTTER TAIL RIVER BELOW ORWELL DAM, NEAR FERGUS FALLS, MN--Continued
STATISTICS OF MONTHLY MEAN DATA FOR WATER YEARS 1931 - 2002, BY WATER YEAR (WY)
OCT NOV DEC JAN FEB MAR APR MAY JUN JUL AUG SEP
MEAN 256 268 260 253 256 341 509 612 597 453 308 259 MAX 973 831 740 737 742 785 1199 1427 1442 1246 1080 1026 (WY) 1994 1986 1999 1999 1999 1999 1997 1986 2001 1953 1985 1993 MIN 9.15 8.42 8.10 15.1 10.8 23.5 39.5 14.1 14.2 12.8 11.5 7.99 (WY) 1977 1977 1977 1937 1935 1937 1934 1977 1934 1936 1934 1934
SUMMARY STATISTICS FOR 2001 CALENDAR YEAR FOR 2002 WATER YEAR WATER YEARS 1931 - 2002 ANNUAL TOTAL 281121 191763 ANNUAL MEAN 770 525 365 HIGHEST ANNUAL MEAN 846 1999 LOWEST ANNUAL MEAN 20.4 1934 HIGHEST DAILY MEAN 1580 May 29 1070 Jul 11,12 1670 Jun 20 1953 LOWEST DAILY MEAN 119 Aug 15 179 Aug 26 1.6a Feb 7 1937 ANNUAL SEVEN-DAY MINIMUM 340 Nov 8 327 Aug 24 5.9 Sep 15 1934 MAXIMUM PEAK FLOW 1080 Jul 12 2040 May 29 2001 MAXIMUM PEAK STAGE 4.04 Jul 12 5.60 Jun 17 1953 INSTANTANEOUS LOW FLOW 154b Aug 25 0.70a Aug 5 1970 ANNUAL RUNOFF (AC-FT) 557600 380400 264200 ANNUAL RUNOFF (CFSM) 0.44 0.30 0.21 ANNUAL RUNOFF (INCHES) 6.01 4.10 2.85 10 PERCENT EXCEEDS 1310 718 790 50 PERCENT EXCEEDS 667 489 295 90 PERCENT EXCEEDS 397 394 37 a Due in part to regulation. b Due to regulation.
O N D2001
J F M A M J J A S2002
100
200
500
10001000
2000
5000
10,000
DAILY-MEAN DISCHARGE,
IN CUBIC FEET PER SECOND

42 RED RIVER OF THE NORTH BASIN--Continued
05049995 MUD LAKE ABOVE WHITE ROCK DAM NEAR WHITE ROCK, SD
LOCATION.--Lat 45°51’41", long 96°34’20", in NW1⁄4NW1⁄4 sec. 34, T.128 N., R.47 W., Roberts County, Hydrologic Unit 09020101, on
Sisseton Indian Reservation, on left bank, 10 ft west of White Rock Dam, 4 mi south of White Rock and 5 mi northwest of Wheaton, MN.
DRAINAGE AREA.--
PERIOD OF RECORD.--October 2000 to current year. Gage height record prior to October 2000 can be obtained from Corp of Engineers.
GAGE.--Water-stage recorder. Datum of gage is 960.00 ft, adjustment of 1912 (levels by U.S. Army Corps of Engineers).
REMARKS.--Records fair. Lake regulated by Lake Traverse-Boise de Sioux Flood Control and Water Conservation project.
EXTREMES FOR PERIOD OF RECORD.---Maximum gage-height, 80.90 ft, Apr. 29, 2001; maximum daily, 80.76 ft, Apr. 19, 2001; minimum gage-height recorded, 65.14 ft, many days in Sep. 2002, but may have been lower in Apr. June, July, or Sep. 2002 when stage was below detection limits of gage; minimum daily recorded, 65.22 ft, June 14, 2002.
EXTREMES FOR CURRENT YEAR.--Maximum gage-height, 72.64 ft, Nov. 1; maximum daily, 72.39 ft, Nov. 1; minimum gage-height recorded, 65.14 ft, many days in Sep., but may have been lower in Apr. June, July, or Sep. when stage was below detection limits of gage; minimum daily recorded, 65.22 ft, June 14.
GAGE HEIGHT, FEET, WATER YEAR OCTOBER 2001 TO SEPTEMBER 2002 DAILY MEAN VALUES DAY OCT NOV DEC JAN FEB MAR APR MAY JUN JUL AUG SEP 1 72.16 72.39 72.25 72.09 71.95 71.93 --- 67.04 65.79 65.46 67.26 65.46 2 72.08 72.32 72.24 72.08 71.94 71.59 66.24 67.22 65.54 65.34 67.40 65.28 3 72.10 72.29 72.24 72.07 71.94 71.79 66.40 67.50 65.23 65.24 67.32 65.32 4 72.11 72.32 72.03 72.07 71.93 71.87 66.49 67.04 65.25 65.34 67.05 65.43 5 72.07 72.35 71.94 72.07 71.93 71.65 66.32 67.29 65.38 65.24 66.77 65.42 6 72.10 72.20 72.06 72.06 71.92 71.72 66.66 66.93 65.80 --- 66.66 65.24 7 72.12 72.20 72.12 72.05 71.92 71.99 66.18 66.89 65.53 65.79 66.69 65.49 8 72.10 72.18 72.17 72.05 71.92 71.91 66.01 66.94 65.39 65.47 66.56 65.78 9 72.07 72.27 72.21 72.05 71.93 71.93 66.53 67.30 66.04 65.41 67.08 65.46 10 72.16 72.22 72.24 72.05 71.92 71.98 66.41 67.43 66.06 65.34 69.83 65.31 11 72.35 72.27 72.28 72.05 71.93 71.90 66.42 67.41 --- 65.28 69.91 65.23 12 72.30 72.23 72.25 72.04 71.93 71.90 66.60 67.65 65.33 66.22 67.95 --- 13 72.27 72.22 72.15 72.04 71.93 71.89 66.66 67.65 65.38 67.20 66.55 --- 14 72.27 72.21 72.19 72.04 71.92 71.85 66.43 67.95 65.22 68.14 67.03 --- 15 72.23 72.20 72.23 72.04 71.92 71.89 66.16 67.87 --- 68.67 67.14 --- 16 72.25 72.22 72.22 72.03 71.92 71.83 66.42 67.75 --- 68.60 67.17 --- 17 72.33 72.28 72.20 72.03 71.92 71.75 66.45 68.23 65.41 68.43 67.11 --- 18 72.24 71.97 72.19 72.02 71.93 71.90 65.80 68.25 65.35 68.44 66.96 --- 19 72.28 72.15 72.19 72.02 71.96 72.15 --- 68.25 65.36 68.23 66.84 --- 20 72.25 72.17 72.18 72.01 71.98 72.01 66.06 68.44 --- 67.99 66.70 --- 21 72.24 72.14 72.18 72.00 71.98 71.98 66.19 69.04 65.61 67.80 66.20 --- 22 72.30 72.10 72.17 72.00 71.98 71.99 66.53 68.88 65.73 67.66 66.01 --- 23 72.26 72.10 72.17 71.99 71.99 71.95 66.60 67.91 65.40 67.53 65.96 --- 24 72.25 71.67 72.16 71.99 72.01 71.88 65.86 67.90 65.30 67.46 65.88 --- 25 72.20 71.95 72.15 71.98 72.02 71.87 66.54 67.79 65.56 67.32 65.74 --- 26 72.26 71.85 72.14 71.98 72.02 71.65 66.96 67.60 66.71 67.24 65.64 --- 27 72.35 72.18 72.13 71.98 72.12 70.23 66.51 67.41 66.68 67.23 65.53 --- 28 72.23 72.26 72.13 71.97 72.22 69.39 66.98 67.30 65.52 67.19 65.52 --- 29 72.25 72.26 72.12 71.96 --- --- 67.23 66.91 65.34 67.18 65.59 --- 30 72.35 72.25 72.11 71.95 --- --- 67.14 66.87 65.39 67.21 65.57 --- 31 72.33 --- 72.10 71.95 --- --- --- 66.15 --- 67.30 65.77 ---
MEAN 72.22 72.18 72.17 72.02 71.96 --- --- 67.57 --- --- 66.75 --- MAX 72.35 72.39 72.28 72.09 72.22 --- --- 69.04 --- --- 69.91 --- MIN 72.07 71.67 71.94 71.95 71.92 --- --- 66.15 --- --- 65.52 ---

43 RED RIVER OF THE NORTH BASIN--Continued
05049995 MUD LAKE ABOVE WHITE ROCK DAM NEAR WHITE ROCK, SD--Continued
O N D2001
J F M A M J J A S2002
65
66
67
68
69
70
71
72
73
GAGE HEIGHT, IN FEET
Gap indicatesmissing record

44 RED RIVER OF THE NORTH BASIN--Continued
05050000 BOIS DE SIOUX RIVER NEAR WHITE ROCK, SD
LOCATION.--Lat 45°51’45", long 96°34’25", in SW1⁄4SW1⁄4 sec. 27, T.128 N., R.47 W., Roberts County, Hydrologic Unit 09020101, on
Sisseton Indian Reservation, on left bank at Big Slough Outlet, 300 ft downstream from White Rock Dam, 4 mi south of White Rock and 5 mi northwest of Wheaton, MN.
DRAINAGE AREA.--1,160 mi2 (approximately).
PERIOD OF RECORD.--October 1941 to current year.
GAGE.--Water-stage recorder. Datum of gage is 960.00 ft. above sea level, (adjustment of 1912, levels by U.S. Army Corps of Engineers). Prior to Jan. 14, 1943, nonrecording gage at same site at datum 0.11 ft lower. Jan. 15, 1943 to Sept. 30, 1963, water-stage recorder at same site at datum 0.11 ft lower.
REMARKS.--Records good except those for estimated daily discharges, which are poor. Flow regulated by Lake Traverse-Boise de Sioux Flood Control and Water Conservation project.
DISCHARGE -TAILWATER, in CFS, WATER YEAR OCTOBER 2001 TO SEPTEMBER 2002 DAILY MEAN VALUES DAY OCT NOV DEC JAN FEB MAR APR MAY JUN JUL AUG SEP 1 5.0 7.3 e14 e6.9 e4.4 148 156 183 31 7.2 217 23 2 5.0 6.8 e15 e6.5 e4.3 e250 64 203 10 5.3 238 12 3 5.0 6.6 e21 e6.2 e4.2 e250 139 235 4.4 2.4 228 12 4 4.8 6.3 167 e6.0 e4.2 e250 106 185 4.8 3.5 185 21 5 4.7 6.2 354 e5.8 4.2 e340 77 205 7.0 2.0 124 20 6 4.7 6.3 344 e5.6 4.3 e440 118 160 29 1.1 90 9.2 7 4.6 12 338 e5.5 4.4 e440 64 149 7.4 6.0 91 28 8 4.9 19 348 e5.6 4.9 e500 51 167 7.7 43 66 43 9 5.2 22 342 e6.3 5.9 e540 104 235 54 21 27 8.8 10 22 20 328 8.0 5.7 e540 92 233 e30 8.5 2.2 8.5 11 40 22 319 9.9 5.4 e540 107 227 e17 9.8 1.9 7.5 12 27 20 313 10 5.9 e540 128 257 e9.5 98 66 3.6 13 18 19 259 9.5 6.0 e540 139 264 4.7 283 128 2.9 14 15 18 111 8.1 6.0 e460 107 287 3.5 418 213 2.3 15 13 17 25 7.7 6.2 e460 80 283 2.8 494 236 2.0 16 11 19 20 7.4 6.5 e460 110 268 2.6 548 250 2.1 17 8.6 22 21 7.0 6.8 e440 112 303 4.9 552 243 2.2 18 8.0 12 22 6.6 7.8 381 34 302 3.8 554 220 3.8 19 7.4 14 21 6.3 10 264 20 301 4.5 502 198 2.0 20 7.2 15 18 6.2 11 228 55 307 3.1 442 175 1.9 21 6.9 14 14 5.8 9.7 146 71 327 18 387 90 1.8 22 6.7 12 14 5.7 9.7 137 114 321 34 334 58 1.4 23 6.7 13 12 5.8 11 84 124 268 11 300 52 0.77 24 7.3 7.1 12 5.4 11 82 47 267 6.4 276 45 0.63 25 7.0 17 e10 5.4 8.4 35 116 254 4.2 243 31 0.77 26 6.9 14 e9.5 5.7 9.4 144 172 233 2.4 225 23 0.77 27 6.9 e18 e9.2 5.6 12 292 110 208 4.4 222 14 0.77 28 7.7 e16 e8.6 5.3 17 316 177 192 5.8 211 14 1.3 29 7.6 e15 e8.1 5.0 --- 277 213 143 5.1 206 24 2.2 30 7.0 e14 e7.7 4.7 --- 244 198 123 4.1 211 29 1.9 31 7.0 --- e7.3 4.6 --- 186 --- 71 --- 222 45 ---
TOTAL 298.8 430.6 3512.4 200.1 206.3 9954 3205 7161 337.1 6837.8 3424.1 228.11 MEAN 9.639 14.35 113.3 6.455 7.368 321.1 106.8 231.0 11.24 220.6 110.5 7.604 MAX 40 22 354 10 17 540 213 327 54 554 250 43 MIN 4.6 6.2 7.3 4.6 4.2 35 20 71 2.4 1.1 1.9 0.63 AC-FT 593 854 6970 397 409 19740 6360 14200 669 13560 6790 452 CFSM 0.01 0.01 0.10 0.01 0.01 0.28 0.09 0.20 0.01 0.19 0.10 0.01 IN. 0.01 0.01 0.11 0.01 0.01 0.32 0.10 0.23 0.01 0.22 0.11 0.01
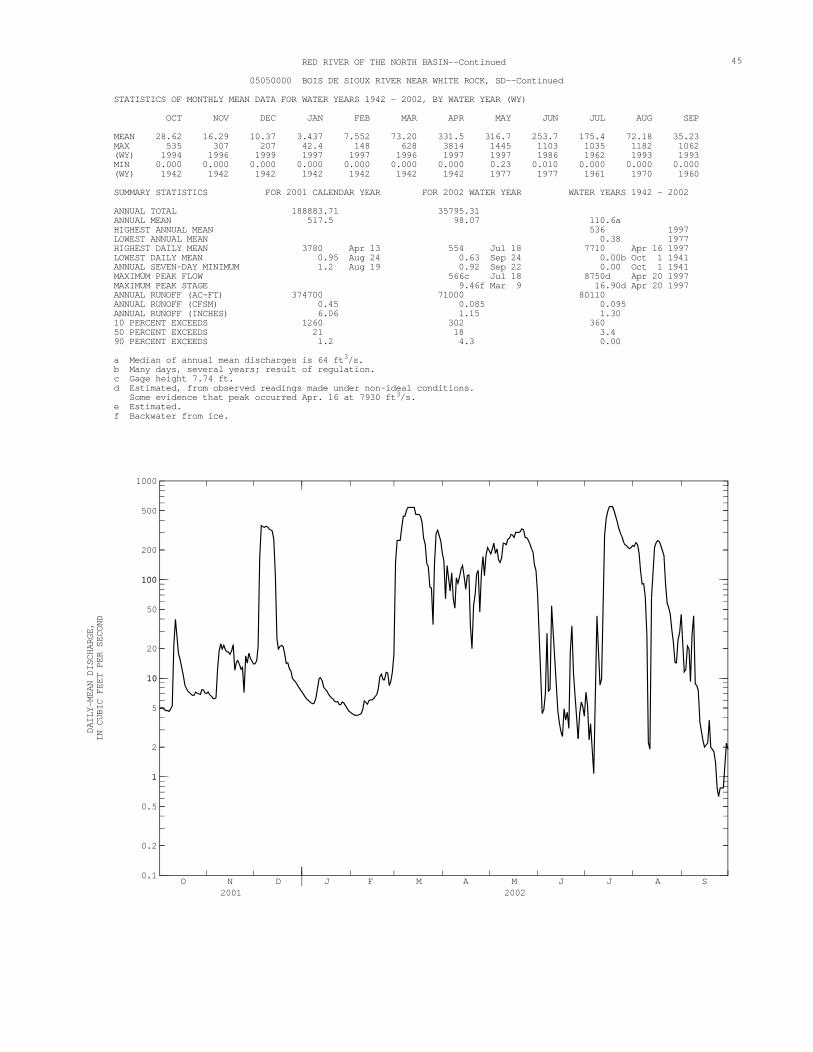
45 RED RIVER OF THE NORTH BASIN--Continued
05050000 BOIS DE SIOUX RIVER NEAR WHITE ROCK, SD--Continued
STATISTICS OF MONTHLY MEAN DATA FOR WATER YEARS 1942 - 2002, BY WATER YEAR (WY)
OCT NOV DEC JAN FEB MAR APR MAY JUN JUL AUG SEP
MEAN 28.62 16.29 10.37 3.437 7.552 73.20 331.5 316.7 253.7 175.4 72.18 35.23 MAX 535 307 207 42.4 148 628 3814 1445 1103 1035 1182 1062 (WY) 1994 1996 1999 1997 1997 1996 1997 1997 1986 1962 1993 1993 MIN 0.000 0.000 0.000 0.000 0.000 0.000 0.000 0.23 0.010 0.000 0.000 0.000 (WY) 1942 1942 1942 1942 1942 1942 1942 1977 1977 1961 1970 1960
SUMMARY STATISTICS FOR 2001 CALENDAR YEAR FOR 2002 WATER YEAR WATER YEARS 1942 - 2002 ANNUAL TOTAL 188883.71 35795.31 ANNUAL MEAN 517.5 98.07 110.6a HIGHEST ANNUAL MEAN 536 1997 LOWEST ANNUAL MEAN 0.38 1977 HIGHEST DAILY MEAN 3780 Apr 13 554 Jul 18 7710 Apr 16 1997 LOWEST DAILY MEAN 0.95 Aug 24 0.63 Sep 24 0.00b Oct 1 1941 ANNUAL SEVEN-DAY MINIMUM 1.2 Aug 19 0.92 Sep 22 0.00 Oct 1 1941 MAXIMUM PEAK FLOW 566c Jul 18 8750d Apr 20 1997 MAXIMUM PEAK STAGE 9.46f Mar 9 16.90d Apr 20 1997 ANNUAL RUNOFF (AC-FT) 374700 71000 80110 ANNUAL RUNOFF (CFSM) 0.45 0.085 0.095 ANNUAL RUNOFF (INCHES) 6.06 1.15 1.30 10 PERCENT EXCEEDS 1260 302 360 50 PERCENT EXCEEDS 21 18 3.4 90 PERCENT EXCEEDS 1.2 4.3 0.00 a Median of annual mean discharges is 64 ft3/s. b Many days, several years; result of regulation. c Gage height 7.74 ft. d Estimated, from observed readings made under non-ideal conditions. Some evidence that peak occurred Apr. 16 at 7930 ft3/s. e Estimated. f Backwater from ice.
O N D2001
J F M A M J J A S2002
0.1
0.2
0.5
11
2
5
1010
20
50
100100
200
500
1000
DAILY-MEAN DISCHARGE,
IN CUBIC FEET PER SECOND

46 RED RIVER OF THE NORTH BASIN--Continued
05051300 BOIS DE SIOUX RIVER NEAR DORAN, MN
LOCATION.--Lat 46°09’08", long 96°34’44", in NE1⁄4 NE1⁄4 sec. 21, T.131 N., R.47 W., Wilken County, MN, Hydrologic Unit
09020101, on right bank, 10 ft downstream from bridge on County Highway 6, 3 miles downstream from Rabbit River, 4.3 mi southwest of Doran.
DRAINAGE AREA.--1,880 mi2 (approximately).
PERIOD OF RECORD.--October 12, 1989 to current year.
GAGE.--Water-stage recorder. Datum of gage is 943.90 ft above sea level (NGVD of 1929), elevation data obtained from Wilkin County Highway Engineers.
REMARKS.--Records good except for estimated daily discharges, which are poor. Flow regulated by Lake Traverse-Bois de Sioux Flood Control and Water Conservation project near White Rock, S.D.
DISCHARGE, CUBIC FEET PER SECOND, WATER YEAR OCTOBER 2001 TO SEPTEMBER 2002 DAILY MEAN VALUES DAY OCT NOV DEC JAN FEB MAR APR MAY JUN JUL AUG SEP 1 3.1 26 e28 e11 e6.3 e10 e425 265 106 5.1 320 51 2 2.6 43 e27 e10 e6.2 e16 311 234 63 5.3 325 71 3 4.6 45 e28 e9.8 e6.0 e110 138 284 40 5.3 340 67 4 2.1 39 e43 e9.2 e5.9 e180 137 332 25 5.3 294 58 5 2.7 31 e150 e8.7 e5.9 e205 134 235 19 5.5 212 51 6 3.0 23 e400 e8.2 e5.9 e260 105 238 16 5.5 146 47 7 2.5 18 e390 e7.8 e6.3 e320 157 175 17 5.6 120 39 8 2.8 16 e385 e7.6 e6.8 e355 163 207 22 12 120 26 9 3.4 20 e395 e8.5 e7.4 e380 166 437 17 100 111 25 10 10 27 e400 e10 e7.9 e390 203 574 18 801 96 30 11 37 25 e390 e12 e8.4 e400 228 515 34 1570 70 27 12 48 23 e380 e13 e8.5 e400 272 500 29 1650 46 19 13 47 22 e360 e13 e8.4 e400 246 581 13 1230 39 15 14 36 21 e250 e14 e8.4 e400 219 559 11 880 185 12 15 27 20 e140 e13 e8.6 e385 165 557 11 760 287 8.9 16 22 20 e70 e11 e9.3 e370 134 485 9.3 735 324 6.7 17 16 20 e37 e10 e11 e340 157 478 7.0 719 331 6.4 18 11 20 e35 e9.4 e12 e325 140 510 5.8 701 307 6.3 19 8.0 21 e33 e8.5 e14 e300 82 500 6.7 681 256 5.7 20 8.3 19 e32 e7.8 e16 e260 61 495 8.8 616 219 5.0 21 8.4 18 e37 e7.3 e18 e207 81 510 11 564 175 4.2 22 7.4 18 e30 e7.2 e17 e170 106 540 13 520 120 3.8 23 7.9 17 e24 e7.4 e16 e145 146 498 18 469 98 3.7 24 7.2 18 e20 e7.3 e15 e115 135 392 24 424 85 3.5 25 10 20 e18 e7.1 e14 e95 89 389 25 370 75 3.3 26 10 22 e16 e7.3 e13 e80 153 355 17 308 64 3.1 27 14 e25 e15 e7.7 e12 e190 195 308 12 284 52 3.1 28 13 e30 e14 e7.9 e11 e400 149 252 7.9 275 43 3.1 29 13 e33 e13 e7.3 --- e640 268 277 5.6 256 40 3.2 30 15 e32 e12 e6.8 --- e620 293 415 4.9 254 38 3.3 31 18 --- e12 e6.5 --- e540 --- 217 --- 284 39 ---
TOTAL 421.0 732 4184 282.3 285.2 9008 5258 12314 617.0 14500.6 4977 611.3 MEAN 13.6 24.4 135 9.11 10.2 291 175 397 20.6 468 161 20.4 MAX 48 45 400 14 18 640 425 581 106 1650 340 71 MIN 2.1 16 12 6.5 5.9 10 61 175 4.9 5.1 38 3.1 AC-FT 835 1450 8300 560 566 17870 10430 24420 1220 28760 9870 1210 CFSM 0.01 0.01 0.07 0.00 0.01 0.15 0.09 0.21 0.01 0.25 0.09 0.01 IN. 0.01 0.01 0.08 0.01 0.01 0.18 0.10 0.24 0.01 0.29 0.10 0.01

47 RED RIVER OF THE NORTH BASIN--Continued
05051300 BOIS DE SIOUX RIVER NEAR DORAN, MN--Continued
STATISTICS OF MONTHLY MEAN DATA FOR WATER YEARS 1990 - 2002, BY WATER YEAR (WY)
OCT NOV DEC JAN FEB MAR APR MAY JUN JUL AUG SEP
MEAN 89.7 49.3 33.6 6.99 29.9 464 1327 719 440 472 203 149 MAX 592 465 222 43.9 155 1757 5936 1893 1432 1477 1486 1244 (WY) 1994 1996 1999 1997 1998 1995 1997 1997 2001 1993 1993 1993 MIN 0.026 1.97 0.65 0.077 0.000 25.5 12.6 11.8 12.6 4.37 0.000 0.000 (WY) 1991 1991 1991 1991 1990 1990 1990 1990 1990 1990 1990 1990
SUMMARY STATISTICS FOR 2001 CALENDAR YEAR FOR 2002 WATER YEAR WATER YEARS 1990 - 2002 ANNUAL TOTAL 291931.18 53190.4 ANNUAL MEAN 800 146 333 HIGHEST ANNUAL MEAN 786 2001 LOWEST ANNUAL MEAN 8.77 1990 HIGHEST DAILY MEAN 8220 Apr 14 1650 Jul 12 11500 Apr 16 1997 LOWEST DAILY MEAN 0.00 Jan 20 2.1 Oct 4 0.00a Jan 7 1990 ANNUAL SEVEN-DAY MINIMUM 0.00 Jan 20 2.9 Oct 2 0.00 Jan 7 1990 MAXIMUM PEAK FLOW 1720 Jul 12 12300 Apr 16 1997 MAXIMUM PEAK STAGE 14.86 Jul 12 24.42 Apr 16 1997 INSTANTANEOUS LOW FLOW 1.8 Oct 4 0.00a Jan 7 1990 ANNUAL RUNOFF (AC-FT) 579000 105500 240900 ANNUAL RUNOFF (CFSM) 0.43 0.078 0.18 ANNUAL RUNOFF (INCHES) 5.78 1.05 2.40 10 PERCENT EXCEEDS 1630 400 1150 50 PERCENT EXCEEDS 33 31 14 90 PERCENT EXCEEDS 0.05 6.3 0.29 a Many days, several years; result of regulation. e Estimated.
O N D2001
J F M A M J J A S2002
1
2
5
1010
20
50
100100
200
500
10001000
2000
5000
10,000
DAILY-MEAN DISCHARGE,
IN CUBIC FEET PER SECOND

48 RED RIVER OF THE NORTH BASIN--Continued
05051500 RED RIVER OF THE NORTH AT WAHPETON, ND
LOCATION.--Lat 46°15’55", long 96°35’40", in NE1⁄4 sec.8, T.132 N., R.47 W., Richland County, Hydrologic Unit 09020104, on left bank in Wahpeton, 800 ft downstream from confluence of Bois de Sioux and Otter Tail Rivers, and at mile 548.6.
DRAINAGE AREA.--4,010 mi2 (approximately).
PERIOD OF RECORD.--April to October 1942, March 1943 to current year. Gage-height records collected in this vicinity since 1917 are contained in reports of the National Weather Service.
GAGE.--Water-stage recorder and concrete and wooden dam. Datum of gage is 942.97 ft above sea level. Prior to Aug. 6, 1943, National Weather Service non-recording gage 800 ft upstream, converted to present datum. Aug. 6, 1943, to Oct. 27, 1950, nonrecording gage at present site and datum.
REMARKS.--Records good except those for estimated daily discharge, which are poor. Flow regulated by Orwell Reservoir, flood storage capacity, 13,300 acre-ft at elevation 1,070 ft above mean sea level, adjustment of 1912; Mud Lake, flood storage capacity, 78,600 acre-ft at elevation 981 ft above mean sea level, adjustment of 1912; Lake Traverse, flood storage capacity, 75,100 acre-ft at elevation 981 ft above mean sea level, adjustment of 1912; and numerous other controlled lakes and ponds and several powerplants.
EXTREMES OUTSIDE PERIOD OF RECORD.--A stage of 17.0 ft, discharge, 10,500 ft3/s, occurred in the spring of 1897.
DISCHARGE, CUBIC FEET PER SECOND, WATER YEAR OCTOBER 2001 TO SEPTEMBER 2002 DAILY MEAN VALUES DAY OCT NOV DEC JAN FEB MAR APR MAY JUN JUL AUG SEP 1 385 469 e550 e540 572 e470 901 999 809 477 903 571 2 404 497 e480 e600 529 e510 774 931 737 444 871 585 3 429 496 e470 e640 499 e540 647 946 700 411 863 553 4 397 483 e470 e650 435 e565 606 978 670 410 806 572 5 366 469 e500 e640 509 e590 624 909 623 406 730 594 6 366 461 e560 e620 574 e630 613 904 595 402 666 588 7 368 455 e600 587 610 e680 657 838 582 430 626 585 8 367 439 e670 627 608 e730 744 909 568 491 630 585 9 375 407 e740 640 607 e780 724 1260 532 688 608 598 10 444 406 e800 625 545 e840 721 1440 529 1500 601 612 11 448 408 e900 607 594 e940 752 1390 574 2720 573 588 12 467 404 e960 600 620 e1050 874 1400 550 3300 554 562 13 519 406 e950 595 650 e1150 923 1460 540 2980 546 516 14 519 406 e880 592 676 e1100 807 1450 538 2370 605 479 15 513 403 e730 e610 665 e1100 753 1440 529 2000 695 477 16 507 403 e600 e620 650 e1140 789 1340 522 1780 721 476 17 498 402 e530 e610 668 e1170 859 1230 521 1560 740 463 18 474 397 e480 594 700 e1160 874 1310 516 1500 727 449 19 446 401 e410 571 707 e1030 823 1340 523 1430 688 448 20 433 402 e420 585 667 e930 787 1320 506 1360 657 436 21 434 415 e500 e575 563 e850 787 1290 474 1290 703 416 22 433 442 e540 e550 537 e810 817 1260 484 1230 727 416 23 433 443 e440 e510 528 e760 823 1210 546 1160 689 421 24 433 444 e350 e470 528 e690 796 1120 538 1080 611 423 25 448 459 e380 e490 e440 571 751 1090 508 982 544 409 26 455 455 e440 e495 e400 524 763 1070 507 865 464 399 27 445 441 e540 e500 e410 525 822 1030 516 848 278 373 28 441 e280 e560 513 e440 836 805 977 497 894 299 348 29 448 e240 e530 528 --- 1080 855 1080 476 883 387 366 30 450 e420 e500 549 --- 1150 1000 1220 472 864 379 366 31 452 --- e500 568 --- 1060 --- 969 --- 881 493 ---
TOTAL 13597 12653 17980 17901 15931 25961 23471 36110 16682 37636 19384 14674 MEAN 439 422 580 577 569 837 782 1165 556 1214 625 489 MAX 519 497 960 650 707 1170 1000 1460 809 3300 903 612 MIN 366 240 350 470 400 470 606 838 472 402 278 348 AC-FT 26970 25100 35660 35510 31600 51490 46550 71620 33090 74650 38450 29110

49 RED RIVER OF THE NORTH BASIN--Continued
05051500 RED RIVER OF THE NORTH AT WAHPETON, ND--Continued
STATISTICS OF MONTHLY MEAN DATA FOR WATER YEARS 1942 - 2002, BY WATER YEAR (WY)
OCT NOV DEC JAN FEB MAR APR MAY JUN JUL AUG SEP
MEAN 342 321 295 286 308 705 1473 1148 1079 831 443 344 MAX 1599 952 820 678 868 2629 8717 3344 2981 2787 2496 2148 (WY) 1994 1987 1987 1986 1998 1995 1997 1997 2001 1993 1993 1993 MIN 5.72 7.40 6.60 8.81 18.0 84.3 138 22.5 90.0 65.6 53.5 2.18 (WY) 1977 1977 1977 1977 1977 1977 1977 1977 1977 1977 1977 1976
SUMMARY STATISTICS FOR 2001 CALENDAR YEAR FOR 2002 WATER YEAR WATER YEARS 1942 - 2002 ANNUAL TOTAL 578631 251980 ANNUAL MEAN 1585 690 628 HIGHEST ANNUAL MEAN 1600 1997 LOWEST ANNUAL MEAN 54.0 1977 HIGHEST DAILY MEAN 9260 Apr 9 3300 Jul 12 12700 Apr 15 1997 LOWEST DAILY MEAN 188 Aug 16 240 Nov 29 1.7 Aug 28 1976 ANNUAL SEVEN-DAY MINIMUM 381 Oct 3 381 Oct 3 1.7 Aug 28 1976 MAXIMUM PEAK FLOW 3350 Jul 12 12800 Apr 15 1997 MAXIMUM PEAK STAGE 10.09 Jul 12 19.42a Apr 6 1997 INSTANTANEOUS LOW FLOW 1.7 Aug 28 1976 ANNUAL RUNOFF (AC-FT) 1148000 499800 455200 10 PERCENT EXCEEDS 3260 1110 1450 50 PERCENT EXCEEDS 650 585 390 90 PERCENT EXCEEDS 420 409 109 a Backwater from ice; from floodmark. e Estimated.
O N D2001
J F M A M J J A S2002
100
200
500
10001000
2000
5000
10,000
DAILY-MEAN DISCHARGE,
IN CUBIC FEET PER SECOND

50 RED RIVER OF THE NORTH BASIN--Continued
05051522 RED RIVER OF THE NORTH AT HICKSON, ND
LOCATION.--Lat 46°39’35", long 96 47’44", in SW1⁄4 sec. 19, T.137 N., R.48 W., Clay County, MN, Hydrologic Unit 09020104, on right bank 60 ft downstream from bridge on township road, and 1 mi southeast of Hickson, ND.
DRAINAGE AREA.--4,300 mi2 (approximately).
PERIOD OF RECORD.--October 1975 to current year.
GAGE.--Water-stage recorder and concrete control. Datum of gage is 877.06 ft above sea level, National Geodetic Vertical Datum of 1929.
REMARKS.--Records good except those for periods of estimated daily discharges, which are poor. Flow regulated by Orwell Reservoir, flood storage capacity, 13,300 acre-ft at elevation 1,070 ft above mean sea level, adjustment of 1912; Mud Lake, flood storage capacity, 78,600 acre-ft at elevation 981 ft above mean sea level, adjustment of 1912; Lake Traverse, flood storage capacity, 75,100 acre-ft at elevation 981 ft above mean sea level, adjustment of 1912; and numerous other controlled lakes and ponds and several powerplants.
DISCHARGE, CUBIC FEET PER SECOND, WATER YEAR OCTOBER 2001 TO SEPTEMBER 2002 DAILY MEAN VALUES DAY OCT NOV DEC JAN FEB MAR APR MAY JUN JUL AUG SEP 1 371 466 566 e510 548 e450 1980 1000 1110 488 872 562 2 376 485 611 e530 578 e480 1800 1060 930 485 894 588 3 376 510 559 605 547 e510 1450 1030 815 477 877 605 4 396 523 520 640 519 e540 1150 1010 758 435 873 585 5 407 513 562 661 471 e570 957 1030 722 415 831 573 6 372 497 582 654 446 e600 923 1020 676 412 763 597 7 352 482 599 640 520 e640 919 984 630 414 693 602 8 350 470 672 610 584 e700 787 989 610 511 638 591 9 353 454 717 597 608 e760 878 1030 611 646 620 589 10 388 429 787 632 614 e820 911 1310 592 881 615 587 11 426 405 833 640 604 e870 904 1530 571 2160 593 601 12 454 403 982 633 577 e930 924 1560 590 3110 570 596 13 451 405 1020 624 612 e1050 961 1520 592 3600 536 577 14 490 403 1030 624 641 e1140 1050 1520 572 3760 517 548 15 533 402 976 624 663 e1200 986 1530 567 3470 545 506 16 531 402 924 630 678 e1170 909 1500 549 2800 642 482 17 522 402 859 e630 674 e1170 882 1430 541 2190 702 482 18 513 410 732 e630 677 e1200 937 1300 549 1810 722 491 19 498 402 649 e610 e690 e1250 975 1310 559 1600 720 478 20 468 397 573 e590 e700 e1250 947 1350 607 1470 698 461 21 442 408 419 e590 e700 e1180 906 1350 585 1380 667 454 22 432 419 503 e585 e670 e1000 887 1330 522 1300 673 429 23 431 435 585 e580 e620 e820 894 1300 516 1240 725 418 24 437 446 560 e560 e620 e770 905 1260 594 1180 704 419 25 441 448 445 e510 e610 e720 886 1200 610 1120 646 427 26 442 450 360 e510 e550 e720 852 1160 586 1040 574 425 27 448 430 435 e510 e440 e760 841 1130 553 952 535 409 28 442 198 532 e510 e410 826 878 1100 553 873 394 398 29 437 272 e560 e515 --- 993 901 1060 544 899 321 359 30 434 372 e560 520 --- 1530 895 1060 509 898 650 349 31 449 --- e520 530 --- 1930 --- 1180 --- 873 666 ---
TOTAL 13462 12738 20232 18234 16571 28549 30075 38143 18723 42889 20476 15188 MEAN 434 425 653 588 592 921 1002 1230 624 1384 661 506 MAX 533 523 1030 661 700 1930 1980 1560 1110 3760 894 605 MIN 350 198 360 510 410 450 787 984 509 412 321 349 AC-FT 26700 25270 40130 36170 32870 56630 59650 75660 37140 85070 40610 30130 CFSM 0.10 0.10 0.15 0.14 0.14 0.21 0.23 0.29 0.15 0.32 0.15 0.12 IN. 0.12 0.11 0.18 0.16 0.14 0.25 0.26 0.33 0.16 0.37 0.18 0.13

51 RED RIVER OF THE NORTH BASIN--Continued
05051522 RED RIVER OF THE NORTH AT HICKSON, ND--Continued
STATISTICS OF MONTHLY MEAN DATA FOR WATER YEARS 1975 - 2002, BY WATER YEAR (WY)
OCT NOV DEC JAN FEB MAR APR MAY JUN JUL AUG SEP
MEAN 418 361 334 324 390 993 2251 1372 1110 976 552 443 MAX 1558 900 817 747 1058 2687 9864 3925 3264 2674 2674 2135 (WY) 1994 1987 1986 1986 1998 1995 1997 1997 2001 1993 1993 1993 MIN 2.02 0.000 0.000 4.95 14.0 75.9 165 22.0 86.4 73.4 35.6 12.6 (WY) 1977 1977 1977 1977 1977 1977 1977 1977 1977 1977 1977 1976
SUMMARY STATISTICS FOR 2001 CALENDAR YEAR FOR 2002 WATER YEAR WATER YEARS 1975 - 2002 ANNUAL TOTAL 642904 275280 ANNUAL MEAN 1761 754 794 HIGHEST ANNUAL MEAN 1772 2001 LOWEST ANNUAL MEAN 53.1 1977 HIGHEST DAILY MEAN 11400 Apr 12 3760 Jul 14 13100 Apr 15 1997 LOWEST DAILY MEAN 188 Aug 18 198 Nov 28 0.00 Oct 26 1976 ANNUAL SEVEN-DAY MINIMUM 365 Sep 28 372 Oct 3 0.00 Oct 26 1976 MAXIMUM PEAK FLOW 3780 Jul 14 13300 Apr 14 1997 MAXIMUM PEAK STAGE 18.75 Jul 14 37.60 Apr 16 1997 ANNUAL RUNOFF (AC-FT) 1275000 546000 575100 ANNUAL RUNOFF (CFSM) 0.41 0.18 0.18 ANNUAL RUNOFF (INCHES) 5.56 2.38 2.51 10 PERCENT EXCEEDS 3770 1200 1850 50 PERCENT EXCEEDS 690 610 450 90 PERCENT EXCEEDS 420 419 98 e Estimated.
O N D2001
J F M A M J J A S2002
100
200
500
10001000
2000
5000
10,000
DAILY-MEAN DISCHARGE,
IN CUBIC FEET PER SECOND

52 RED RIVER OF THE NORTH BASIN--Continued
05054000 RED RIVER OF THE NORTH AT FARGO, ND
LOCATION.--Lat 46°51’40", long 96°47’00", in NW1⁄4NE1⁄4 sec.18, T.139 N., R.48 W., Cass County, Hydrologic Unit 09020104, at
waterplant on 4th St. S. in Fargo, 25 mi upstream from mouth of Sheyenne River, and at mile 453.
DRAINAGE AREA.--6,800 mi2 (approximately).
PERIOD OF RECORD.--May 1901 to current year. Published as "at Moorhead, MN.", 1901. Monthly discharge only for some periods, published in WSP 1308.
REVISED RECORDS.--WSP 1308: 1902-4, 1906-7, 1910-14, 1916, 1918, 1924. WSP 1388: 1905-6, 1917-20(M), 1935(M), 1938-39(M), 1943.
GAGE.--Water-stage recorder and concrete control. Datum of gage is 861.8 ft above sea level. Oct. 1, 1960, to Sept. 30, 1962, water-stage recorder at present site at datum 5.6 ft higher. See WSP 1728 or 1913 for history of changes prior to Oct. 1, 1960.
REMARKS.--Records fair except for estimated daily discharges, which are poor. Flow regulated by Orwell Reservoir, flood storage capacity, 13,300 acre-ft at elevation 1,070 ft above mean sea level, adjustment of 1912; Mud Lake, flood storage capacity, 78,600 acre-ft at elevation 981 ft above mean sea level, adjustment of 1912; Lake Traverse, flood storage capacity, 75,100 acre-ft at elevation 981 ft above mean sea level, adjustment of 1912; and numerous other controlled lakes and ponds and several powerplants. Figures of daily discharge do not include diversions from the Sheyenne River to the cities of Fargo, ND and Moorhead, MN
EXTREMES OUTSIDE PERIOD OF RECORD.--Flood of Apr. 7, 1897, reached a stage of 39.1 ft present datum, discharge, 25,000 ft3/s at site 1.5 mi downstream.
DISCHARGE, CUBIC FEET PER SECOND, WATER YEAR OCTOBER 2001 TO SEPTEMBER 2002 DAILY MEAN VALUES
DAY OCT NOV DEC JAN FEB MAR APR MAY JUN JUL AUG SEP 1 430 655 561 e590 614 e520 e1940 1220 1550 829 1230 1100 2 451 709 736 e570 640 e550 e1910 1350 1380 796 1200 1010 3 452 736 783 e550 643 e580 e1680 1380 1200 781 1200 935 4 459 758 723 e550 e590 e600 e1410 1330 1090 755 1180 903 5 484 743 696 e650 e560 e640 e1180 1340 1020 697 1150 846 6 488 719 715 e690 e530 e700 e1050 1360 975 661 1090 830 7 452 689 731 e680 e510 e730 e1050 1310 922 792 1010 848 8 430 660 777 e660 e530 e770 e1100 1480 878 808 926 830 9 432 633 839 e650 e570 e830 e1190 1400 2020 894 868 812 10 588 611 870 e650 e610 e880 e1350 1580 1520 1920 874 805 11 527 579 904 e670 e620 e930 e1320 1940 966 3200 851 799 12 545 545 e1050 684 e610 e990 e1300 2100 846 3720 817 802 13 566 540 1150 672 e624 e1080 1330 2100 850 4210 763 766 14 581 538 1170 665 e660 e1160 1430 2070 829 e4200 728 723 15 639 533 1160 665 e688 e1260 1440 2050 809 e3700 727 652 16 655 530 1080 663 e700 e1280 1290 2010 791 e3000 820 577 17 656 524 1040 676 e700 e1280 1180 1950 768 e2300 977 554 18 671 524 926 e670 e710 e1300 1190 1810 791 e2050 1000 590 19 666 535 792 e660 e720 e1350 1240 1700 810 e1900 1020 615 20 647 522 711 e650 e730 e1350 1250 1720 822 e1780 1010 551 21 609 554 588 e650 e720 e1300 1210 1760 990 e1660 973 515 22 576 577 501 e650 e690 e1200 1170 1740 905 e1600 944 492 23 565 597 592 e640 e650 e979 1150 1700 967 e1510 995 482 24 598 605 646 e620 e645 e762 1170 1650 898 e1470 1020 464 25 590 623 591 e580 e640 e830 1180 1600 1150 e1400 978 457 26 578 616 469 e550 e600 e903 1150 1520 1060 e1350 866 469 27 598 650 438 e560 e540 e840 1130 1470 957 e1300 756 457 28 601 487 520 e560 e510 e874 1130 1480 890 1260 670 445 29 599 325 e585 e570 --- e986 1170 1470 882 1220 506 426 30 594 398 e610 e580 --- e1300 1170 1450 870 1240 583 383 31 608 --- e600 600 --- e1670 --- 1470 --- 1210 1040 ---
TOTAL 17335 17715 23554 19475 17554 30424 38460 50510 30406 54213 28772 20138 MEAN 559 590 760 628 627 981 1282 1629 1014 1749 928 671 MAX 671 758 1170 690 730 1670 1940 2100 2020 4210 1230 1100 MIN 430 325 438 550 510 520 1050 1220 768 661 506 383 AC-FT 34380 35140 46720 38630 34820 60350 76290 100200 60310 107500 57070 39940 CFSM 0.08 0.09 0.11 0.09 0.09 0.14 0.19 0.24 0.15 0.26 0.14 0.10 IN. 0.09 0.10 0.13 0.11 0.10 0.17 0.21 0.28 0.17 0.30 0.16 0.11
OCT NOV DEC JAN FEB MAR APR MAY JUN JUL AUG SEP + 1290 1180 1180 1210 1120 1160 1150 1320 1420 1580 1570 1440 ‡ 35670 36320 47900 39840 35940 61510 77440 101500 61740 109100 58640 41380

53 RED RIVER OF THE NORTH BASIN--Continued
05054000 RED RIVER OF THE NORTH AT FARGO, ND--Continued
STATISTICS OF MONTHLY MEAN DATA FOR WATER YEARS 1901 - 2002, BY WATER YEAR (WY)
OCT NOV DEC JAN FEB MAR APR MAY JUN JUL AUG SEP
MEAN 328 289 243 224 236 773 2010 1157 1080 923 439 330 MAX 1741 942 801 740 1353 4722 17920 5365 5120 5690 3293 2280 (WY) 1994 1907 1987 1986 1998 1995 1997 1997 1962 1962 1993 1993 MIN 0.000 0.000 0.000 0.000 0.18 26.8 102 8.12 2.87 0.000 0.000 0.000 (WY) 1935 1937 1938 1933 1933 1937 1934 1934 1936 1934 1932 1934
SUMMARY STATISTICS FOR 2001 CALENDAR YEAR FOR 2002 WATER YEAR WATER YEARS 1901 - 2002 ANNUAL TOTAL 807908 348556 ANNUAL MEAN 2213 955 671 HIGHEST ANNUAL MEAN 2619 1997 LOWEST ANNUAL MEAN 17.5 1934 HIGHEST DAILY MEAN 20200 Apr 14 4210 Jul 13 27800 Apr 17 1997 LOWEST DAILY MEAN 293 Aug 19 325 Nov 29 0.00 Jul 25 1932 ANNUAL SEVEN-DAY MINIMUM 449 Sep 29 443 Sep 24 0.00 Jul 25 1932 MAXIMUM PEAK FLOW 4250 Jul 13 28000 Apr 17 1997 MAXIMUM PEAK STAGE 19.17 Jul 13 39.72 Apr 18 1997 ANNUAL RUNOFF (AC-FT) 1602000 691400 485800 ANNUAL RUNOFF (CFSM) 0.33 0.14 0.099 ANNUAL RUNOFF (INCHES) 4.42 1.91 1.34 10 PERCENT EXCEEDS 4370 1520 1500 50 PERCENT EXCEEDS 777 792 330 90 PERCENT EXCEEDS 545 530 41 + Diversions, in acre-ft, to cities of Fargo and Moorhead. ‡ Adjusted for diversions to cities of Fargo and Moorhead. e Estimated.
O N D2001
J F M A M J J A S2002
100
200
500
10001000
2000
5000
10,000
DAILY-MEAN DISCHARGE,
IN CUBIC FEET PER SECOND

54 RED RIVER OF THE NORTH BASIN--Continued
05061000 BUFFALO RIVER NEAR HAWLEY, MN
LOCATION.--Lat 46°51’00", long 96°19’45", in NW1⁄4SE1⁄4 sec. 14, T.139 N., R.45 W., Clay County, Hydrologic Unit 09020106, near
left downstream end of bridge on farm lane, 2 mi southwest of Hawley.
DRAINAGE AREA.--325 mi2.
PERIOD OF RECORD.--March 1945 to current year. Water year 1981 (annual maximum only); March 1982 to September 1985 (no winter records).
REVISED RECORDS.--WSP 1308: 1945-46(M), 1948(M).
GAGE.--Water-stage recorder. Datum of gage is 1,111.91 ft above sea level (NGVD of 1929). Prior to Jan. 29, 1953, nonrecording gage at bridge 1,800 ft upstream at datum 3.17 ft lower.
REMARKS.--Records good except those for estimated daily discharges, which are poor.
EXTREMES OUTSIDE PERIOD OF RECORD.--Maximum stage known, about 11.3 ft, present datum, spring of 1921, from information by local resident.
DISCHARGE, CUBIC FEET PER SECOND, WATER YEAR OCTOBER 2001 TO SEPTEMBER 2002 DAILY MEAN VALUES
DAY OCT NOV DEC JAN FEB MAR APR MAY JUN JUL AUG SEP 1 36 109 79 e56 e45 e43 e71 92 54 212 129 173 2 38 126 e84 e55 e45 e43 e69 86 50 173 114 153 3 35 123 e84 e55 e44 e43 e68 80 52 151 104 134 4 36 119 84 e54 e44 e43 e67 76 51 132 94 118 5 36 103 84 e53 e43 e43 e66 73 48 116 83 103 6 34 91 e81 e53 e43 e43 e68 76 44 103 73 97 7 36 86 79 e53 e43 e43 e76 75 40 96 66 88 8 35 83 e78 e52 e43 e43 91 90 38 150 61 77 9 35 82 e76 e52 e44 e43 96 143 273 214 56 69 10 58 87 72 e53 e44 e43 114 180 483 545 54 65 11 73 87 e71 e55 e45 e43 170 166 310 921 50 60 12 80 80 70 e55 e44 e43 139 161 196 798 58 56 13 74 74 e69 e54 e43 e44 130 160 144 599 62 52 14 71 70 e68 e54 44 e44 142 149 121 415 54 48 15 69 70 66 e53 45 e45 151 138 104 293 50 45 16 66 73 76 e52 46 e47 153 132 83 224 50 43 17 74 71 80 e52 48 e49 170 116 65 194 57 41 18 70 70 78 e52 50 e52 172 112 55 178 58 54 19 66 77 e76 e51 53 e54 154 106 93 168 53 84 20 66 87 e73 e51 54 e58 139 99 215 156 49 83 21 64 88 e69 e51 51 e64 127 91 285 150 47 69 22 59 78 e65 e52 50 e58 118 85 271 139 47 60 23 57 72 e64 e52 e48 e53 111 86 282 126 47 63 24 64 72 e62 e52 e47 e49 110 84 392 124 45 65 25 71 73 e61 e52 e46 e47 103 78 469 320 42 62 26 53 74 e60 e51 e45 e47 93 75 531 627 53 57 27 43 70 e59 e50 e44 e49 89 71 537 494 67 52 28 81 e70 e59 e49 e43 e54 91 66 480 255 91 46 29 92 70 e58 e48 --- e60 99 60 385 199 142 44 30 93 76 e57 e47 --- e74 95 56 298 170 97 44 31 97 --- e57 e46 --- e73 --- 56 --- 144 108 ---
TOTAL 1862 2511 2199 1615 1284 1537 3342 3118 6449 8586 2161 2205 MEAN 60.1 83.7 70.9 52.1 45.9 49.6 111 101 215 277 69.7 73.5 MAX 97 126 84 56 54 74 172 180 537 921 142 173 MIN 34 70 57 46 43 43 66 56 38 96 42 41 AC-FT 3690 4980 4360 3200 2550 3050 6630 6180 12790 17030 4290 4370 CFSM 0.18 0.26 0.22 0.16 0.14 0.15 0.34 0.31 0.66 0.85 0.21 0.23 IN. 0.21 0.29 0.25 0.18 0.15 0.18 0.38 0.36 0.74 0.98 0.25 0.25

55 RED RIVER OF THE NORTH BASIN--Continued
05061000 BUFFALO RIVER NEAR HAWLEY, MN--Continued
STATISTICS OF MONTHLY MEAN DATA FOR WATER YEARS 1945 - 2002, BY WATER YEAR (WY)
OCT NOV DEC JAN FEB MAR APR MAY JUN JUL AUG SEP
MEAN 44.6 45.9 30.9 24.5 27.3 92.3 274 141 118 115 53.5 43.2 MAX 151 298 127 70.2 170 434 1036 383 589 784 472 192 (WY) 1974 2001 1999 2001 1998 1966 1997 1998 2000 1993 1955 1999 MIN 11.6 12.2 10.6 9.94 9.88 15.0 33.3 21.5 12.7 10.1 5.87 8.52 (WY) 1979 1977 1977 1962 1949 1969 1981 1977 1977 1976 1976 1976
SUMMARY STATISTICS FOR 2001 CALENDAR YEAR FOR 2002 WATER YEAR WATER YEARS 1945 - 2002 ANNUAL TOTAL 58704 36869 ANNUAL MEAN 161 101 84.8 HIGHEST ANNUAL MEAN 188 1998 LOWEST ANNUAL MEAN 16.7 1977 HIGHEST DAILY MEAN 1730 Apr 8 921 Jul 11 2360a Apr 6 1997 LOWEST DAILY MEAN 28 Aug 30 34 Oct 6 3.2 Aug 25 1976 ANNUAL SEVEN-DAY MINIMUM 30 Aug 26 35 Oct 3 4.3 Aug 22 1976 MAXIMUM PEAK FLOW 963 Jul 11 2360a Apr 6 1997 MAXIMUM PEAK STAGE 8.55 Jul 11 10.86 Jun 22 2000 INSTANTANEOUS LOW FLOW 33 Oct 6 2.8 Aug 26 1977 ANNUAL RUNOFF (AC-FT) 116400 73130 61470 ANNUAL RUNOFF (CFSM) 0.49 0.31 0.26 ANNUAL RUNOFF (INCHES) 6.72 4.22 3.55 10 PERCENT EXCEEDS 334 170 194 50 PERCENT EXCEEDS 70 70 35 90 PERCENT EXCEEDS 41 44 14 a Estimated daily discharge, backwater from ice. e Estimated.
O N D2001
J F M A M J J A S2002
10
20
50
100100
200
500
1000
DAILY-MEAN DISCHARGE,
IN CUBIC FEET PER SECOND

56 RED RIVER OF THE NORTH BASIN--Continued
05061500 SOUTH BRANCH BUFFALO RIVER AT SABIN, MN
LOCATION--Lat 46°46’20", long 96°37’40", in SW1⁄4 SW1⁄4 sec. 9, T.138 N., R.47 W., Clay County, Hydrologic Unit 09020106, on
left bank, on downstream side of County Road 67 bridge, 0.3 mi downstream from Stony Creek and 1 mi east of Sabin.
DRAINAGE AREA.--454 mi2.
PERIOD OF RECORD.--March 1945 to current year. Water year 1981, annual maximum only; March 1982 to September 1985, no winter records.
REVISED RECORDS.--WSP 1308: 1949(M). WRIR 97-4249: Drainage area.
GAGE.--Water-stage recorder. Datum of gage is 902.39 ft above sea level (NGVD of 1929, levels by Soil Conservation Service). Prior to April 17, 1948, nonrecording gage at site 1 mi downstream at different datum. Aug. 17, 1948 to Oct. 4, 1989, nonrecording gage at present site and datum.
REMARKS.--Records good except those for estimated daily discharges, which are poor.
DISCHARGE, CUBIC FEET PER SECOND, WATER YEAR OCTOBER 2001 TO SEPTEMBER 2002 DAILY MEAN VALUES
DAY OCT NOV DEC JAN FEB MAR APR MAY JUN JUL AUG SEP 1 6.5 92 e34 e18 e12 e22 e68 101 72 92 36 75 2 5.5 100 e43 e17 e12 e22 e64 97 46 65 32 61 3 6.6 92 e48 e17 e11 e22 e56 88 35 e50 28 53 4 7.7 78 e49 e17 e11 e21 e52 78 29 e38 23 51 5 10 72 e49 e17 e10 e21 e50 69 26 e32 21 48 6 9.0 63 e48 e17 e10 e21 e48 63 24 28 19 43 7 6.7 55 e47 e17 e11 e21 e53 60 24 25 17 36 8 7.1 49 e46 e17 e11 e21 e60 66 23 37 14 28 9 8.8 45 e44 e18 e12 e21 e76 96 149 139 14 21 10 19 43 e42 e19 e12 e22 e100 212 272 198 12 18 11 34 41 e40 e20 e13 e23 e123 304 259 412 14 14 12 52 40 e38 e21 e14 e24 e133 310 230 627 13 13 13 62 38 e37 e21 e14 e26 141 253 179 835 14 11 14 67 38 e37 e20 e15 e28 140 208 103 893 17 10 15 59 38 e36 e20 e15 e31 142 172 64 804 13 9.2 16 50 37 e38 e19 e16 e34 146 134 46 589 12 7.6 17 51 37 e42 e19 e17 e38 141 108 33 355 13 6.9 18 50 36 e46 e18 e18 e43 137 88 26 235 14 12 19 47 35 e46 e17 e20 e48 140 73 22 173 15 74 20 43 33 e38 e16 e21 e57 145 64 130 121 14 37 21 39 33 e35 e16 e22 e54 139 57 259 87 14 35 22 35 38 e32 e16 e24 e50 123 51 339 71 12 34 23 33 40 e29 e16 e25 e45 108 45 436 61 11 26 24 34 34 e26 e16 e26 e42 98 41 539 53 8.3 22 25 40 34 e24 e16 e27 e41 89 40 640 47 8.3 20 26 36 32 e23 e16 e26 e41 87 36 703 41 8.6 20 27 40 e30 e21 e16 e25 e42 84 33 643 37 7.5 19 28 57 e27 e20 e15 e23 e44 80 47 473 34 17 17 29 65 e27 e19 e14 --- e48 85 185 272 36 20 15 30 67 e29 e18 e13 --- e53 94 275 150 42 26 14 31 74 --- e18 e13 --- e59 --- 158 --- 41 66 ---
TOTAL 1121.9 1386 1113 532 473 1085 3002 3612 6246 6298 553.7 850.7 MEAN 36.2 46.2 35.9 17.2 16.9 35.0 100 117 208 203 17.9 28.4 MAX 74 100 49 21 27 59 146 310 703 893 66 75 MIN 5.5 27 18 13 10 21 48 33 22 25 7.5 6.9 AC-FT 2230 2750 2210 1060 938 2150 5950 7160 12390 12490 1100 1690 CFSM 0.08 0.10 0.08 0.04 0.04 0.08 0.22 0.26 0.46 0.45 0.04 0.06 IN. 0.09 0.11 0.09 0.04 0.04 0.09 0.25 0.30 0.51 0.52 0.05 0.07

57 RED RIVER OF THE NORTH BASIN--Continued
05061500 SOUTH BRANCH BUFFALO RIVER AT SABIN, MN--Continued
STATISTICS OF MONTHLY MEAN DATA FOR WATER YEARS 1945 - 2002, BY WATER YEAR (WY)
OCT NOV DEC JAN FEB MAR APR MAY JUN JUL AUG SEP
MEAN 19.4 21.6 8.11 2.84 6.91 110 291 93.3 101 85.8 12.0 17.3 MAX 108 194 66.8 18.5 205 581 1683 580 1068 1112 152 186 (WY) 1999 2001 1999 2001 1998 1966 1997 1962 1962 1975 1993 1999 MIN 0.023 2.05 0.006 0.000 0.000 0.000 27.9 8.28 1.30 0.000 0.000 0.000 (WY) 1977 1977 1961 1946 1946 1951 1973 1980 1976 1988 1976 1976
SUMMARY STATISTICS FOR 2001 CALENDAR YEAR FOR 2002 WATER YEAR WATER YEARS 1945 - 2002 ANNUAL TOTAL 55544.1 26273.3 ANNUAL MEAN 152 72.0 64.9a HIGHEST ANNUAL MEAN 198 1962 LOWEST ANNUAL MEAN 12.2 1977 HIGHEST DAILY MEAN 3870 Apr 9 893 Jul 14 8200 Jul 1 1975 LOWEST DAILY MEAN 3.7 Aug 19 5.5 Oct 2 0.00b Dec 13 1945 ANNUAL SEVEN-DAY MINIMUM 4.1 Aug 19 7.4 Oct 1 0.00 Dec 13 1945 MAXIMUM PEAK FLOW 905 Jul 14 8500 Jul 2 1975 MAXIMUM PEAK STAGE 12.25 Jul 14 19.90 Jul 2 1975 INSTANTANEOUS LOW FLOW 5.2 Oct 2 ANNUAL RUNOFF (AC-FT) 110200 52110 47000 ANNUAL RUNOFF (CFSM) 0.34 0.16 0.14 ANNUAL RUNOFF (INCHES) 4.55 2.15 1.94 10 PERCENT EXCEEDS 309 143 117 50 PERCENT EXCEEDS 20 37 8.4 90 PERCENT EXCEEDS 6.9 13 0.07 a Median of annual mean discharges is 51 ft3/s. b Many days, several years. e Estimated.
O N D2001
J F M A M J J A S2002
1
2
5
1010
20
50
100100
200
500
1000
DAILY-MEAN DISCHARGE,
IN CUBIC FEET PER SECOND

58 RED RIVER OF THE NORTH BASIN--Continued
05062000 BUFFALO RIVER NEAR DILWORTH, MN
LOCATION--Lat 46°57’40", long 96°39’40", in SW1⁄4 SE1⁄4 sec. 6, T.140 N., R.47 W., Clay County, Hydrologic Unit 09020106, on
left bank, at County Road 94 bridge, 4.5 mi southeast of Kragnes, 6.5 mi northeast of Dilworth, and 9 mi downstream from SouthBranch.
DRAINAGE AREA.--975 mi2.
PERIOD OF RECORD.--March 1931 to current year. Monthly discharge only for some periods, published in WSP 1308.
REVISED RECORDS.--WSP 1308: 1931(M).
GAGE.--Water-stage recorder. Datum of gage is 878.31 ft above sea level (NGVD of 1929, levels by U.S. Army Corps of Engineers). Prior to April 5, 1937, nonrecording gage at same site and datum.
REMARKS.--Records good except those for estimated daily discharges, which are poor.
DISCHARGE, CUBIC FEET PER SECOND, WATER YEAR OCTOBER 2001 TO SEPTEMBER 2002 DAILY MEAN VALUES DAY OCT NOV DEC JAN FEB MAR APR MAY JUN JUL AUG SEP 1 50 205 e125 e91 e57 e78 e178 222 288 703 247 253 2 47 230 e135 e89 e55 e74 e182 223 200 466 219 303 3 45 255 e145 e87 e54 e73 e184 219 138 324 198 303 4 47 256 e152 e85 e53 e72 e170 207 110 254 181 260 5 46 242 e152 e83 e52 e72 e162 195 96 217 160 227 6 45 222 e150 e81 e51 e71 e158 182 85 188 141 204 7 46 199 e148 e79 e52 e70 e175 174 79 169 124 188 8 46 181 e145 e78 e53 e70 e200 181 72 216 112 169 9 49 163 e140 e79 e54 e70 e227 233 597 198 103 144 10 56 151 e137 e80 e55 e71 e250 293 1580 344 95 125 11 76 148 e132 e83 e56 e72 e270 377 1630 579 90 111 12 100 147 e128 e86 e56 e73 e288 461 1490 800 87 99 13 139 139 e126 e87 e56 e75 e305 495 1180 1000 86 90 14 154 130 e124 e84 e57 e77 321 476 755 1180 88 82 15 161 123 e123 e81 e58 e80 320 425 459 1280 85 76 16 160 120 e127 e79 e60 e88 328 372 315 1280 80 74 17 142 120 e133 e75 e63 e97 331 329 239 1160 79 68 18 134 119 e139 e73 e65 e107 342 285 185 901 81 64 19 136 120 e137 e71 e68 e115 360 253 152 607 79 70 20 129 116 e130 e70 e71 e131 348 231 180 450 78 193 21 122 127 e126 e70 e75 e135 333 211 361 370 72 213 22 115 134 e122 e71 e78 e131 315 192 546 309 69 154 23 106 126 e117 e72 e83 e127 292 175 642 270 69 124 24 103 122 e113 e73 e87 e122 272 164 776 244 67 119 25 108 120 e109 e72 e91 e120 254 156 909 286 64 113 26 117 118 e107 e70 e88 e120 238 144 998 364 60 104 27 115 e117 e104 e68 e85 e124 224 136 1070 515 55 97 28 93 e116 e101 e65 e83 e132 219 128 1110 580 84 90 29 111 e116 e98 e63 --- e142 215 130 1080 504 125 83 30 176 e118 e95 e61 --- e155 220 195 943 360 330 79 31 191 --- e93 e59 --- e167 --- 305 --- 285 266 ---
TOTAL 3165 4600 3913 2365 1816 3111 7681 7769 18265 16403 3674 4279 MEAN 102 153 126 76.3 64.9 100 256 251 609 529 119 143 MAX 191 256 152 91 91 167 360 495 1630 1280 330 303 MIN 45 116 93 59 51 70 158 128 72 169 55 64 AC-FT 6280 9120 7760 4690 3600 6170 15240 15410 36230 32540 7290 8490 CFSM 0.10 0.16 0.13 0.08 0.07 0.10 0.26 0.26 0.62 0.54 0.12 0.15 IN. 0.12 0.18 0.15 0.09 0.07 0.12 0.29 0.30 0.70 0.63 0.14 0.16

59 RED RIVER OF THE NORTH BASIN--Continued
05062000 BUFFALO RIVER NEAR DILWORTH, MN--Continued
STATISTICS OF MONTHLY MEAN DATA FOR WATER YEARS 1931 - 2002, BY WATER YEAR (WY)
OCT NOV DEC JAN FEB MAR APR MAY JUN JUL AUG SEP
MEAN 62.9 65.4 38.8 24.5 27.8 199 610 252 228 215 74.1 63.2 MAX 279 575 240 99.0 285 1308 3412 1144 2138 2814 910 517 (WY) 1999 2001 1999 2001 1998 1966 1997 1998 1962 1975 1993 1944 MIN 5.48 8.74 4.75 0.87 0.76 2.26 33.5 27.2 15.1 2.23 0.000 0.79 (WY) 1940 1937 1938 1940 1940 1940 1931 1931 1934 1936 1936 1936
SUMMARY STATISTICS FOR 2001 CALENDAR YEAR FOR 2002 WATER YEAR WATER YEARS 1931 - 2002 ANNUAL TOTAL 144094 77041 ANNUAL MEAN 395 211 157 HIGHEST ANNUAL MEAN 477 1998 LOWEST ANNUAL MEAN 25.6 1934 HIGHEST DAILY MEAN 6390 Apr 10 1630 Jun 11 13500 Jul 2 1975 LOWEST DAILY MEAN 34 Aug 31 45 Oct 3, 6 0.00a Jul 22 1936 ANNUAL SEVEN-DAY MINIMUM 35 Aug 28 46 Oct 2 0.00 Jul 28 1936 MAXIMUM PEAK FLOW 1650 Jun 10 13600 Jul 2 1975 MAXIMUM PEAK STAGE 15.00 Jun 10 27.10 Jul 2 1975 INSTANTANEOUS LOW FLOW 44 Oct 5 ANNUAL RUNOFF (AC-FT) 285800 152800 113400 ANNUAL RUNOFF (CFSM) 0.40 0.22 0.16 ANNUAL RUNOFF (INCHES) 5.50 2.94 2.18 10 PERCENT EXCEEDS 712 374 339 50 PERCENT EXCEEDS 108 128 42 90 PERCENT EXCEEDS 52 66 10 a Occurred many days in 1936. e Estimated.
O N D2001
J F M A M J J A S2002
10
20
50
100100
200
500
10001000
2000
5000
10,000
DAILY-MEAN DISCHARGE,
IN CUBIC FEET PER SECOND

60 RED RIVER OF THE NORTH BASIN--Continued
05062500 WILD RICE RIVER AT TWIN VALLEY, MN
LOCATION.--Lat 47°16’00", long 96°14’40", in NW1⁄4NE1⁄4 sec. 27, T.144 N., R.44, Norman County, Hydrologic Unit 09020108, on
left bank, 100 ft upstream from County Highway 29 bridge, 0.8 mi northeast of Twin Valley, and 2 mi upstream from small tributary.
DRAINAGE AREA.--934 mi2.
PERIOD OF RECORD.--June 1909 to September 1917, July 1930 to September 1983, October 1989 to current year. Monthly discharge only for some periods, published in WSP 1308. October 1983 to September 1989, annual maximums only.
REVISED RECORDS.--WSP 955: 1941. WSP 1308: 1915(M), 1917(M).
GAGE.--Water-stage recorder. Datum of gage is 1,008.16 ft above sea level (NGVD of 1929, U.S. Army Corps of Engineers bench mark). June 1909 to September 1917, nonrecording gage at site 0.2 mi downstream at different datum. July 23, 1930 to Nov. 24, 1934, nonrecording gage at highway bridge 100 ft downstream from present site at present datum. Nov. 25, 1934 to Aug. 2, 1950, water-stage recorder 80 ft upstream from present site at present datum.
REMARKS.--Records good except those for estimated daily discharges, which are poor. Flow slightly regulated by Rice Lake and many other small lakes above station.
DISCHARGE, CUBIC FEET PER SECOND, WATER YEAR OCTOBER 2001 TO SEPTEMBER 2002 DAILY MEAN VALUES DAY OCT NOV DEC JAN FEB MAR APR MAY JUN JUL AUG SEP 1 46 410 e245 e160 e120 e123 e280 454 291 3130 666 577 2 45 459 e243 e160 e120 e120 e260 430 254 2760 620 622 3 45 412 e240 e158 e120 e118 e255 415 231 2420 585 626 4 39 359 e236 e155 e120 e115 e250 394 218 2140 557 581 5 36 325 e230 e155 e118 e115 e240 381 218 1880 527 531 6 35 313 e222 e175 e118 e115 e240 384 202 1590 502 491 7 37 308 e220 e170 e116 e114 e240 364 188 1350 479 471 8 35 294 e220 e165 e115 e114 e270 382 180 1470 459 455 9 36 279 e215 e163 e115 e113 e310 485 4780 1760 439 431 10 72 268 e210 e160 e115 e116 369 610 8940 3400 419 409 11 138 254 e205 e158 e115 e116 390 592 5700 5260 404 388 12 202 254 e200 e155 e120 e118 430 567 3880 3990 399 363 13 195 241 e200 e154 e129 e125 487 591 2770 3250 397 336 14 209 239 e198 e150 e138 e135 483 571 2010 2520 392 312 15 218 241 e197 e147 e140 e148 471 540 1670 2030 373 291 16 217 e240 e210 e145 e151 e170 467 506 1490 1680 356 271 17 204 e231 e220 e143 e157 e200 462 491 1260 1380 367 254 18 195 e225 e220 e140 e160 e240 485 458 1080 1150 411 236 19 191 219 e210 e140 e160 e265 533 442 1050 1040 420 227 20 192 211 e190 e137 e158 e255 533 415 1210 987 398 225 21 186 200 e183 e135 e155 e238 514 388 1340 1050 362 211 22 181 204 e180 e133 e150 e219 495 367 1410 1170 326 194 23 177 211 e180 e130 e145 e195 484 353 10800 1170 293 181 24 201 215 e177 e130 e140 e176 502 356 16600 1080 269 176 25 241 227 e175 e128 e138 e165 526 339 9030 987 252 174 26 e260 225 e175 e128 e132 e153 510 303 7660 926 236 171 27 e300 174 e170 e125 e128 e155 469 292 e6200 906 299 169 28 e280 140 e168 e125 e125 e190 458 272 e5000 898 341 166 29 e280 206 e165 e123 --- e250 472 264 4040 841 339 163 30 e300 238 e163 e123 --- e310 469 271 3530 777 411 160 31 339 --- e162 e121 --- e300 --- 300 --- 719 493 ---
TOTAL 5132 7822 6229 4491 3718 5286 12354 12977 103232 55711 12791 9862 MEAN 166 261 201 145 133 171 412 419 3441 1797 413 329 MAX 339 459 245 175 160 310 533 610 16600 5260 666 626 MIN 35 140 162 121 115 113 240 264 180 719 236 160 AC-FT 10180 15510 12360 8910 7370 10480 24500 25740 204800 110500 25370 19560 CFSM 0.18 0.28 0.22 0.16 0.14 0.18 0.44 0.45 3.68 1.92 0.44 0.35 IN. 0.20 0.31 0.25 0.18 0.15 0.21 0.49 0.52 4.11 2.22 0.51 0.39

61 RED RIVER OF THE NORTH BASIN--Continued
05062500 WILD RICE RIVER AT TWIN VALLEY, MN--Continued
STATISTICS OF MONTHLY MEAN DATA FOR WATER YEARS 1909 - 2002, BY WATER YEAR (WY)
OCT NOV DEC JAN FEB MAR APR MAY JUN JUL AUG SEP
MEAN 99.8 101 65.4 48.9 48.6 154 628 447 380 283 120 101 MAX 614 941 343 200 336 828 2471 2259 3441 1926 1024 842 (WY) 1974 2001 2001 2001 1998 1995 1997 1950 2002 1909 1993 1999 MIN 6.10 9.31 6.00 4.00 4.00 12.8 73.8 30.9 26.4 8.04 3.02 2.96 (WY) 1933 1933 1933 1933 1933 1940 1931 1977 1977 1934 1932 1936
SUMMARY STATISTICS FOR 2001 CALENDAR YEAR FOR 2002 WATER YEAR WATER YEARS 1909 - 2002 ANNUAL TOTAL 157080 239605 ANNUAL MEAN 430 656 204a HIGHEST ANNUAL MEAN 656 2002 LOWEST ANNUAL MEAN 22.7 1977 HIGHEST DAILY MEAN 4890 Apr 8 16600 Jun 24 16600 Jun 24 2002 LOWEST DAILY MEAN 35 Oct 6 35 Oct 6 1.1 Aug 13 1932 ANNUAL SEVEN-DAY MINIMUM 38 Oct 3 38 Oct 3 1.3 Aug 11 1932 MAXIMUM PEAK FLOW 20300 Jun 24 20300 Jun 24 2002 MAXIMUM PEAK STAGE 17.96b Jun 24 17.96b Jun 24 2002 INSTANTANEOUS LOW FLOW 0.50 Nov 4 1939 ANNUAL RUNOFF (AC-FT) 311600 475300 147500 ANNUAL RUNOFF (CFSM) 0.46 0.70 0.22 ANNUAL RUNOFF (INCHES) 6.26 9.54 2.96 10 PERCENT EXCEEDS 993 1230 514 50 PERCENT EXCEEDS 198 250 75 90 PERCENT EXCEEDS 83 123 16 a Median of annual mean discharges is 170 ft3/s. b Gage-height 20.00 ft., July 22, 1909; site and datum then in use. e Estimated.
O N D2001
J F M A M J J A S2002
10
20
50
100100
200
500
10001000
2000
5000
10,00010,000
20,000
50,000
100,000
DAILY-MEAN DISCHARGE,
IN CUBIC FEET PER SECOND

62 RED RIVER OF THE NORTH BASIN--Continued
05064000 WILD RICE RIVER AT HENDRUM, MN
LOCATION.--Lat 47°16’05", long 96°47’50", in SE1⁄4SE1⁄4 sec. 19, T.144 N., R.48 W., Norman County, Hydrologic Unit 09020108, on
right bank 30 ft downstream from County Highway 25 bridge, 0.5 mi east of Hendrum and 4 mi upstream from mouth.
DRAINAGE AREA.--1,560 mi2.
PERIOD OF RECORD.--March 1944 to September 1984 and May 1985 to current year. Operated as a high-flow partial-record station October 1984 to April 1985.
REVISED RECORDS.--WSP 1728: 1958.
GAGE.--Water-stage recorder. Datum of gage is 836.75 ft above sea level (NGVD of 1929, levels by U.S. Army Corps of Engineers). Prior to July 18, 1989, nonrecording gage at same site and datum.
REMARKS.--Records good except those for estimated daily discharges, which are poor. Large part of high flow diverted into Marsh River Basin at overflow section 3.5 mi east of Ada. Another diversion into the Marsh River Basin formed in 1947, 1.5 mi southeast of Ada and diverted water at all stages 1947-51, after which it was closed except for a small regulated flow diverted for abatement of contamination from Ada sewage plant effluent. Amount of diversion not known.
DISCHARGE, CUBIC FEET PER SECOND, WATER YEAR OCTOBER 2001 TO SEPTEMBER 2002 DAILY MEAN VALUES DAY OCT NOV DEC JAN FEB MAR APR MAY JUN JUL AUG SEP 1 133 467 e270 e178 e135 e140 e460 665 394 7240 1010 1070 2 130 609 e265 e177 e133 e135 e410 644 395 6380 930 1170 3 129 735 e260 e175 e130 e128 e370 613 371 5410 853 1070 4 126 682 e255 e170 e130 e125 e340 592 341 4560 792 943 5 125 586 e250 e170 e130 e123 e320 560 321 3840 735 829 6 120 516 e250 e170 e130 e123 e320 536 312 3190 689 728 7 119 471 e243 e170 e130 e122 e345 535 302 2520 649 652 8 119 446 e235 e175 e129 e120 e400 530 290 2210 626 641 9 121 421 e225 e180 e127 e120 e460 638 1090 2390 574 588 10 129 395 e220 e180 e124 e120 e520 965 4300 3290 557 534 11 154 375 e220 e175 e123 e120 e580 1050 6210 4390 512 495 12 202 353 e219 e170 e123 e120 e640 987 7990 5690 517 461 13 271 344 e215 e167 e123 e125 e730 936 8450 6260 535 440 14 298 332 e213 e165 e126 e130 e800 941 8230 6170 534 411 15 292 321 e220 e163 e130 e138 740 896 7570 5600 e500 385 16 308 324 e231 e160 e138 e153 693 824 6630 4730 474 362 17 308 321 e245 e160 e144 e176 678 755 5550 3830 479 342 18 297 320 e255 e160 e155 e210 676 705 4260 2870 533 322 19 280 310 e235 e157 e160 e250 710 657 2570 2160 595 306 20 267 293 e215 e155 e163 e300 773 613 1500 1710 549 326 21 260 291 e205 e152 e163 e300 771 579 1730 1600 484 345 22 258 284 e197 e150 e163 e250 732 543 1730 1800 438 320 23 249 276 e195 e148 e163 e210 695 518 2700 2020 410 299 24 251 280 e190 e144 e163 e190 671 497 5050 1840 394 289 25 271 284 e190 e142 e160 e180 685 494 6990 1650 375 284 26 305 290 e188 e141 e158 e180 723 479 8080 2000 355 276 27 326 263 e185 e140 e155 e195 710 438 8560 1960 473 264 28 317 225 e183 e139 e148 e240 669 417 8660 1730 750 257 29 315 270 e180 e137 --- e320 654 444 8390 1520 745 248 30 341 273 e180 e135 --- e420 663 395 7860 1310 900 242 31 400 --- e180 e135 --- e490 --- 379 --- 1140 919 ---
TOTAL 7221 11357 6814 4940 3956 5953 17938 19825 126826 103010 18886 14899 MEAN 233 379 220 159 141 192 598 640 4228 3323 609 497 MAX 400 735 270 180 163 490 800 1050 8660 7240 1010 1170 MIN 119 225 180 135 123 120 320 379 290 1140 355 242 AC-FT 14320 22530 13520 9800 7850 11810 35580 39320 251600 204300 37460 29550 CFSM 0.15 0.24 0.14 0.10 0.09 0.12 0.38 0.41 2.71 2.13 0.39 0.32 IN. 0.17 0.27 0.16 0.12 0.09 0.14 0.43 0.47 3.02 2.46 0.45 0.36

63 RED RIVER OF THE NORTH BASIN--Continued
05064000 WILD RICE RIVER AT HENDRUM, MN--Continued
STATISTICS OF MONTHLY MEAN DATA FOR WATER YEARS 1944 - 2002, BY WATER YEAR (WY)
OCT NOV DEC JAN FEB MAR APR MAY JUN JUL AUG SEP
MEAN 145 152 86.5 62.5 69.9 332 1237 666 560 457 173 144 MAX 744 1305 390 245 767 1485 5115 2137 4228 3323 1833 1329 (WY) 1972 2001 2001 2001 1998 1966 1997 1998 2002 2002 1993 1999 MIN 0.44 3.32 1.08 0.092 0.22 0.46 106 56.1 9.15 8.82 1.07 0.18 (WY) 1949 1949 1977 1977 1977 1949 1981 1977 1952 1951 1977 1948
SUMMARY STATISTICS FOR 2001 CALENDAR YEAR FOR 2002 WATER YEAR WATER YEARS 1944 - 2002 ANNUAL TOTAL 279475 341625 ANNUAL MEAN 766 936 335a HIGHEST ANNUAL MEAN 936 2002 LOWEST ANNUAL MEAN 28.9 1977 HIGHEST DAILY MEAN 9470 Apr 10 8660 Jun 28 10300 Apr 18 1997 LOWEST DAILY MEAN 119 Oct 7 119 Oct 7,8 0.00b Sep 13 1948 ANNUAL SEVEN-DAY MINIMUM 123 Oct 3 121 Mar 6 0.00 Sep 27 1948 MAXIMUM PEAK FLOW 8690c Jun 28 10600d Apr 18 1997 MAXIMUM PEAK STAGE 28.02 Jun 13 33.85f Apr 18 1997 ANNUAL RUNOFF (AC-FT) 554300 677600 242600 ANNUAL RUNOFF (CFSM) 0.49 0.60 0.21 ANNUAL RUNOFF (INCHES) 6.66 8.15 2.92 10 PERCENT EXCEEDS 1890 2180 779 50 PERCENT EXCEEDS 260 332 101 90 PERCENT EXCEEDS 156 134 17 a Median of annual mean discharges is 287 ft3/s. b Many days, Sep.-Oct. 1948. c Gage-height, 26.48 ft. d From measurement of discharge. e Estimated. f Backwater from Red River of the North.
O N D2001
J F M A M J J A S2002
100
200
500
10001000
2000
5000
10,000
DAILY-MEAN DISCHARGE,
IN CUBIC FEET PER SECOND

64 RED RIVER OF THE NORTH BASIN--Continued
05067500 MARSH RIVER NEAR SHELLY, MN
LOCATION.--Lat 47°24’45", long 96°45’50", in NE1⁄4NW1⁄4 sec. 3, T.145 N., R.48W., Norman County, Hydrologic Unit 09020107, on
left bank, 10 ft downstream of County Road 129 bridge, 3.8 mi southeast of Shelly and 10 mi upstream from mouth.
DRAINAGE AREA.--220 mi2.
PERIOD OF RECORD.--March 1944 to September 1983 and April 1985 to current year (no winter records since 1989). Monthly discharge only for March 1944, published in WSP 1308. Operated as a high-flow partial-record station October 1983 to March 1985.
GAGE.--Water-stage recorder. Datum of gage is 841.14 ft above sea level (NGVD of 1929, levels by U.S. Army Corps of Engineers). Prior to Oct. 1, 1965, nonrecording gage at datum 3.0 ft higher. Oct. 1, 1965 to May 17, 1989, nonrecording gage at present site and datum.
REMARKS.--Records good except those for estimated daily discharges, which are poor. Large part of high flow of Wild Rice River diverted into Marsh River Basin at overflow section 4.6 mi east of Ada. Another diversion from Wild Rice River Basin formed in 1947, 1.5 mi southeast of Ada and diverted water at all stages 1947- 51, after which it was closed except for a small regulated flow diverted for abatement of pollution from Ada sewage plant effluent.
DISCHARGE, in CFS, WATER YEAR OCTOBER 2001 TO SEPTEMBER 2002 DAILY MEAN VALUES DAY OCT NOV DEC JAN FEB MAR APR MAY JUN JUL AUG SEP 1 e0.34 e11 --- --- --- --- e20 16 14 1050 29 73 2 e0.34 e13 --- --- --- --- e19 16 7.4 e400 25 55 3 e0.30 e19 --- --- --- --- e17 15 4.6 e300 20 37 4 e0.28 e23 --- --- --- --- e15 12 2.8 e200 17 24 5 e0.26 e30 --- --- --- --- e15 11 2.2 e140 15 16 6 e0.24 e34 --- --- --- --- e16 12 2.9 e90 15 8.9 7 e0.22 e32 --- --- --- --- e19 14 2.4 e55 14 5.7 8 e0.20 e26 --- --- --- --- e28 16 1.7 45 12 3.4 9 e0.20 e23 --- --- --- --- 34 25 661 41 10 2.6 10 e0.28 e21 --- --- --- --- 36 48 2420 950 9.1 2.4 11 e0.30 e17 --- --- --- --- 35 67 3480 2110 11 2.1 12 e0.21 e14 --- --- --- --- 32 71 4580 2070 14 1.6 13 e0.18 e12 --- --- --- --- 32 58 4370 1580 15 1.4 14 e0.16 e9.0 --- --- --- --- 32 47 3260 1180 13 1.2 15 e0.13 e7.0 --- --- --- --- 28 38 2260 783 11 0.93 16 e0.12 6.6 --- --- --- --- 23 35 1400 383 9.3 0.82 17 e0.10 5.9 --- --- --- --- 17 31 692 257 11 0.71 18 e0.03 5.4 --- --- --- --- 15 26 378 222 14 0.71 19 e0.03 4.2 --- --- --- --- 15 22 296 171 11 0.83 20 e0.03 4.1 --- --- --- --- 16 18 275 144 8.4 0.64 21 e0.08 3.7 --- --- --- --- 13 15 281 134 6.7 0.54 22 e0.08 3.2 --- --- --- --- 14 11 237 330 5.9 0.49 23 e0.11 3.6 --- --- --- --- 14 7.4 708 218 5.6 0.70 24 e2.0 3.0 --- --- --- --- 13 8.4 1680 117 5.1 0.72 25 e4.8 2.7 --- --- --- --- 16 9.0 2880 74 4.1 0.79 26 e6.5 1.9 --- --- --- --- 15 7.3 5190 125 3.5 0.83 27 e6.0 1.7 --- --- --- --- 11 5.8 5290 144 4.0 0.82 28 e3.5 1.5 --- --- --- --- 10 6.5 4140 95 16 0.84 29 e5.0 1.7 --- --- --- --- 14 12 2870 61 20 0.83 30 e7.0 2.5 --- --- --- --- 16 22 1930 42 40 0.87 31 e9.0 --- --- --- --- --- --- 19 --- 34 70 ---
TOTAL 48.02 342.7 --- --- --- --- 600 721.4 49316.0 13545 464.7 246.37 MEAN 1.549 11.42 --- --- --- --- 20.00 23.27 1644 436.9 14.99 8.212 MAX 9.0 34 --- --- --- --- 36 71 5290 2110 70 73 MIN 0.03 1.5 --- --- --- --- 10 5.8 1.7 34 3.5 0.49 AC-FT 95 680 --- --- --- --- 1190 1430 97820 26870 922 489 CFSM 0.01 0.05 --- --- --- --- 0.09 0.11 7.47 1.99 0.07 0.04 IN. 0.01 0.06 --- --- --- --- 0.10 0.12 8.34 2.29 0.08 0.04

65 RED RIVER OF THE NORTH BASIN--Continued
05067500 MARSH RIVER NEAR SHELLY, MN--Continued
STATISTICS OF MONTHLY MEAN DATA FOR WATER YEARS 1944 - 2002, BY WATER YEAR (WY)
OCT NOV DEC JAN FEB MAR APR MAY JUN JUL AUG SEP
MEAN 13.22 10.99 5.602 3.793 3.294 77.47 301.1 122.9 112.5 80.71 18.58 12.52 MAX 130 102 77.1 64.5 62.1 437 1537 2617 1644 820 363 144 (WY) 1952 1952 1951 1951 1951 1945 1950 1950 2002 1950 1949 1944 MIN 0.000 0.000 0.000 0.000 0.000 0.000 0.078 0.87 0.000 0.000 0.000 0.000 (WY) 1955 1956 1956 1946 1946 1964 1981 1980 1980 1961 1959 1954
SUMMARY STATISTICS FOR 2001 CALENDAR YEAR FOR 2002 WATER YEAR WATER YEARS 1944 - 2002 ANNUAL MEAN 63.28 HIGHEST ANNUAL MEAN 543a 1950 LOWEST ANNUAL MEAN 1.24 1977 HIGHEST DAILY MEAN 2350 Apr 10 5290 Jun 27 5290 Jun 27 2002 LOWEST DAILY MEAN 0.00 Aug 22 0.03 Oct 18-20 0.00b Sep 4 1945 ANNUAL SEVEN-DAY MINIMUM 0.00 Aug 22 0.07 Oct 17 0.00 Sep 12 1945 MAXIMUM PEAK FLOW 5530 Jun 26c 5530c Jun 26 2002 MAXIMUM PEAK STAGE 24.90 Jun 12 25.45d Apr 18 1997 ANNUAL RUNOFF (AC-FT) 45850 ANNUAL RUNOFF (CFSM) 0.29 ANNUAL RUNOFF (INCHES) 3.91 10 PERCENT EXCEEDS 106 50 PERCENT EXCEEDS 0.80 90 PERCENT EXCEEDS 0.00 a Based on complete years only, 1945-83, 86-89. b Many days, most years. c Gage-height, 24.35 ft. d From floodmark. e Estimated.
O N D2001
J F M A M J J A S2002
0.01
0.02
0.05
0.10.1
0.2
0.5
11
2
5
1010
20
50
100100
200
500
10001000
2000
5000
10,000
DAILY-MEAN DISCHARGE,
IN CUBIC FEET PER SECOND
Gap indicatesmissing record

66 RED RIVER OF THE NORTH BASIN--Continued
05069000 SAND HILL RIVER AT CLIMAX, MN
LOCATION.--Lat 47°36’43", long 96°48’52", in NE1⁄4NE1⁄4 sec. 30, T.148 N., R.48 W., Polk County, Hydrologic Unit 09020301, on
left bank 25 ft upstream from bridge on U.S. Highway 75 in Climax and 3.7 mi upstream from mouth.
DRAINAGE AREA.--420 mi2.
PERIOD OF RECORD.--March 1943 to September 1984, June 1985 to current year (winter records incomplete prior to 1947). Monthly discharge only for some periods, published in WSP 1308 and 1728. October 1984 to May 1985, operated as a high-flow partial-record station.
REVISED RECORDS.--WSP 1388: 1943(M), 1944, 1947(M). WSP 1728: 1951(M), 1960 (average discharge).
GAGE.--Water-stage recorder. Datum of gage is 820.10 ft above sea level (NGVD or 1929, levels by U.S. Army Corps of Engineers). Prior to Oct. 1, 1966, nonrecording gage at site 3.2 mi upstream at datum 12.78 ft higher. Oct. 1, 1966 to Sept 5, 1989, nonrecording gage at present site and datum.
REMARKS.--Records fair except those for estimated daily discharges, which are poor.
DISCHARGE, in CFS, WATER YEAR OCTOBER 2001 TO SEPTEMBER 2002 DAILY MEAN VALUES DAY OCT NOV DEC JAN FEB MAR APR MAY JUN JUL AUG SEP 1 22 56 e30 e23 e39 e28 e185 79 84 553 161 646 2 22 e66 e32 e23 e41 e28 e175 77 113 471 144 e700 3 21 e75 e33 e24 e43 e27 e170 68 119 409 130 e604 4 21 e90 e31 e25 e44 e27 e160 62 103 362 117 e545 5 21 99 e30 e25 e44 e27 e150 60 78 325 105 497 6 21 101 e30 e26 e44 e27 e145 60 62 285 94 423 7 21 87 e29 e27 e43 e27 e140 63 55 263 87 351 8 21 79 e28 e28 e42 e27 e135 74 50 246 82 297 9 37 e74 e28 e28 e41 e26 e130 142 996 226 79 253 10 49 e71 e28 e29 e40 e26 e128 183 2120 2480 77 217 11 36 e69 e28 e29 e39 e26 e124 170 1070 3360 72 190 12 29 e66 e27 e29 e39 e26 133 164 894 e3000 73 171 13 27 e64 e27 e29 e38 e26 154 160 1150 e2200 75 156 14 36 e61 e26 e29 e37 e26 144 159 1320 e1700 70 142 15 43 e58 e25 e28 e36 e26 114 137 1090 e1300 68 130 16 47 e57 e25 e27 e35 e26 106 119 768 e900 72 119 17 46 e55 e25 e27 e34 e26 97 105 564 e500 77 113 18 38 e52 e24 e26 e33 e26 96 96 451 428 83 106 19 32 48 e24 e25 e33 e26 106 86 446 365 75 100 20 29 42 e23 e24 e32 e26 113 77 358 319 72 94 21 27 40 e23 e24 e32 e27 103 74 315 286 70 88 22 25 38 e23 e23 e31 e29 97 68 384 263 68 84 23 24 38 e22 e23 e31 e32 89 64 1220 239 74 82 24 30 41 e22 e23 e30 e39 81 65 1200 218 84 82 25 17 39 e22 e23 e30 e48 81 60 932 192 86 80 26 42 29 e22 e24 e29 e65 76 58 1180 180 80 78 27 44 22 e22 e25 e29 e85 e78 60 1160 160 76 75 28 43 23 e22 e26 e29 e110 e81 59 973 147 172 74 29 47 e26 e23 e28 --- e140 83 60 781 135 e212 74 30 49 e29 e23 e31 --- e200 84 59 648 127 188 74 31 49 --- e23 e35 --- e195 --- 57 --- 154 522 ---
TOTAL 1016 1695 800 816 1018 1500 3558 2825 20684 21793 3445 6645 MEAN 32.77 56.50 25.81 26.32 36.36 48.39 118.6 91.13 689.5 703.0 111.1 221.5 MAX 49 101 33 35 44 200 185 183 2120 3360 522 700 MIN 17 22 22 23 29 26 76 57 50 127 68 74 AC-FT 2020 3360 1590 1620 2020 2980 7060 5600 41030 43230 6830 13180 CFSM 0.08 0.13 0.06 0.06 0.09 0.12 0.28 0.22 1.64 1.67 0.26 0.53 IN. 0.09 0.15 0.07 0.07 0.09 0.13 0.32 0.25 1.83 1.93 0.31 0.59

67 RED RIVER OF THE NORTH BASIN--Continued
05069000 SAND HILL RIVER AT CLIMAX, MN--Continued
STATISTICS OF MONTHLY MEAN DATA FOR WATER YEARS 1943 - 2002, BY WATER YEAR (WY)
OCT NOV DEC JAN FEB MAR APR MAY JUN JUL AUG SEP
MEAN 38.55 35.28 20.21 14.91 17.66 94.42 382.9 132.9 112.6 93.42 41.51 36.53 MAX 223 284 58.0 36.8 183 610 1568 1156 689 703 426 374 (WY) 1972 2001 1999 2001 1998 1999 1997 1950 2002 2002 1993 1999 MIN 9.43 8.64 5.11 2.02 3.55 5.81 25.3 23.7 11.5 8.95 6.30 6.49 (WY) 1977 1956 1964 1962 1962 1948 1981 1958 1980 1980 1961 1955
SUMMARY STATISTICS FOR 2001 CALENDAR YEAR FOR 2002 WATER YEAR WATER YEARS 1943 - 2002 ANNUAL TOTAL 43405 65795 ANNUAL MEAN 118.9 180.3 85.44a HIGHEST ANNUAL MEAN 249 1999 LOWEST ANNUAL MEAN 18.4 1977 HIGHEST DAILY MEAN 3400 Apr 10 3360 Jul 11 4360 Apr 14 1965 LOWEST DAILY MEAN 17 Oct 25 17 Oct 25 1.0 Jan 17 1962 ANNUAL SEVEN-DAY MINIMUM 21 Oct 2 21 Oct 2 1.1 Jan 12 1962 MAXIMUM PEAK FLOW 3530 Jul 10 4560b Apr 14 1965 MAXIMUM PEAK STAGE 16.62 Jul 10 39.40c Apr 20 1997 ANNUAL RUNOFF (AC-FT) 86090 130500 61890 ANNUAL RUNOFF (CFSM) 0.28 0.43 0.20 ANNUAL RUNOFF (INCHES) 3.84 5.83 2.76 10 PERCENT EXCEEDS 216 425 165 50 PERCENT EXCEEDS 38 66 25 90 PERCENT EXCEEDS 24 25 9.0 a Median of annual mean discharges is 65 ft3/s. b Gage-height, 17.81 ft, site and datum then in use. c Backwater from Red River of the North. e Estimated.
O N D2001
J F M A M J J A S2002
10
20
50
100100
200
500
10001000
2000
5000
10,000
DAILY-MEAN DISCHARGE,
IN CUBIC FEET PER SECOND

68 RED RIVER OF THE NORTH BASIN
05073500 UPPER RED LAKE AT WASKISH, MN
LOCATION.--Lat 48°10’32", long 94°30’51", in SW1⁄4NE1⁄4NE
1⁄4 sec. 8, T.154 N., R. 30 W., Beltrami County, Hydrologic Unit 09020302, on east side of Upper Red Lake, near mouth of Tamarac River, on Minnesota Department of Natural Resources property, 500 feet west of State Highway 72 bridge on north edge of Waskish.
PERIOD OF RECORD.-- October 1921 to September 1929, fragmentary gage height record in files of Minnesota Department of Natural Resources, April 1930 to September 1933, published as "Red Lake at Waskish", May 1940 to July 1946, October 1995 to current year.
GAGE.-- Water-stage recorder. Datum of gage is 1,100.00 ft above sea level, adjustment of 1912. October 1921 to September 1929, non-recording gage at datum 1,170.00 ft (no winter readings). April 1930 to September 1933, non-recording gage at datum 1,100.00 ft (some winter readings). May 1940 to July 1946, non-recording gage at datum 1170.00 ft.
REMARKS.-- Records good. Water level subject to fluctuation caused by seiches, and the stage of the Tamarac River.
EXTREMES FOR PERIOD OF RECORD.-- Maximum gage height, 78.34 ft (present datum), June 28, 1943; minimum recorded, 72.10 ft, Oct. 17, 1932.
EXTREMES FOR CURRENT YEAR.-- Maximum gage height, 76.22 ft, Aug. 17; maximum daily, 75.51 ft, Nov. 1; minimum gage height, 73.34 ft, June 9; minimum daily, 73.87 ft, Sept. 27,28.
GAGE HEIGHT, FEET, WATER YEAR OCTOBER 2001 TO SEPTEMBER 2002 DAILY MEAN VALUES DAY OCT NOV DEC JAN FEB MAR APR MAY JUN JUL AUG SEP 1 75.23 75.51 74.91 74.79 74.68 74.57 74.49 74.58 74.45 75.08 75.10 74.51 2 74.91 75.39 74.87 74.79 74.67 74.56 74.48 74.70 74.32 75.17 74.95 74.88 3 75.18 75.12 74.86 74.78 74.68 74.56 74.48 74.42 74.31 75.11 74.74 74.79 4 75.47 75.07 74.86 74.78 74.66 74.55 74.46 74.52 74.44 74.80 74.70 74.32 5 75.34 75.09 74.93 74.78 74.66 74.55 74.46 74.39 74.41 74.70 74.53 74.40 6 75.16 75.04 74.92 74.78 74.66 74.55 74.43 74.25 74.45 74.93 74.50 74.40 7 75.09 74.96 74.85 74.76 74.65 74.53 74.45 74.42 74.60 74.92 74.57 74.44 8 75.00 75.16 74.86 74.77 74.65 74.54 74.44 74.21 74.39 74.97 74.63 74.45 9 75.05 75.20 74.85 74.77 74.65 74.61 74.44 75.03 74.12 74.85 74.78 74.35 10 75.05 75.03 74.86 74.77 74.64 74.60 74.42 74.59 74.21 74.78 74.83 74.40 11 75.21 74.98 74.83 74.75 74.65 74.58 74.42 74.50 74.51 75.03 74.62 74.42 12 75.11 74.96 74.85 74.76 74.65 74.57 74.42 74.50 74.59 75.12 74.91 74.54 13 75.17 75.00 74.84 74.73 74.63 74.58 74.41 74.53 74.51 75.09 74.78 74.31 14 75.22 74.99 74.81 74.73 74.62 74.56 74.44 74.44 74.55 75.09 74.79 74.42 15 75.36 75.01 74.81 74.74 74.63 74.56 74.44 74.51 74.58 75.07 74.66 74.38 16 75.21 74.93 74.83 74.73 74.62 74.55 74.43 74.33 74.58 75.07 74.73 74.28 17 75.14 74.98 74.82 74.74 74.61 74.54 74.52 74.41 74.54 74.92 75.25 74.19 18 75.21 75.01 74.84 74.72 74.60 74.55 74.44 74.39 74.54 74.95 74.73 74.14 19 75.31 75.09 74.83 74.72 74.59 74.55 74.55 74.32 74.67 74.99 74.61 74.23 20 75.21 75.07 74.81 74.70 74.59 74.55 74.51 74.44 74.98 74.97 74.60 74.28 21 75.17 74.90 74.80 74.70 74.59 74.57 74.45 74.48 74.69 75.04 74.46 74.65 22 75.00 74.82 74.81 74.71 74.57 74.55 74.55 74.46 74.70 75.08 74.39 74.37 23 75.11 74.85 74.85 74.72 74.59 74.54 74.51 74.50 74.75 74.88 74.51 74.00 24 74.79 74.61 74.84 74.71 74.58 74.52 74.88 74.40 74.92 74.83 74.48 74.13 25 75.41 74.62 74.84 74.70 74.59 74.52 75.05 74.41 75.06 74.91 74.47 74.10 26 75.30 74.24 74.83 74.69 74.59 74.50 74.51 74.51 74.98 74.90 74.39 74.18 27 75.17 74.16 74.83 74.70 74.57 74.49 74.31 74.34 75.00 74.84 74.37 73.87 28 75.17 74.72 74.82 74.69 74.58 74.51 74.46 74.37 75.01 74.93 74.46 73.87 29 75.07 74.89 74.82 74.68 --- 74.51 74.64 74.44 75.09 74.93 74.43 73.89 30 75.01 74.89 74.81 74.68 --- 74.51 74.51 74.61 75.20 74.84 74.43 73.91 31 75.04 --- 74.81 74.67 --- 74.51 --- 74.59 --- 74.72 74.48 ---
MEAN 75.16 74.94 74.84 74.73 74.62 74.55 74.50 74.47 74.64 74.95 74.64 74.30 MAX 75.47 75.51 74.93 74.79 74.68 74.61 75.05 75.03 75.20 75.17 75.25 74.88 MIN 74.79 74.16 74.80 74.67 74.57 74.49 74.31 74.21 74.12 74.70 74.37 73.87

69 RED RIVER OF THE NORTH BASIN--Continued
05073500 UPPER RED LAKE AT WASKISH, MN--Continued
O N D2001
J F M A M J J A S2002
73.5
74
74.5
75
75.5
76
GAGE HEIGHT, IN FEET

70 RED RIVER OF THE NORTH BASIN--Continued
05073650 LOWER RED LAKE AT BATTLE RIVER MOUTH NEAR SAUM, MN
LOCATION.-- Lat 47°57’35", long 94°44’31", in SE1⁄4NE1⁄4NE
1⁄4 sec. 28, T. 152 N., R. 32 W., Beltrami County, Hydrologic Unit 09020302, on east side of Lower Red Lake, 200 feet upstream of mouth of Battle River, 900 feet southwest of highway bridge, and 3.2 mi southwest of Saum.
PERIOD OF RECORD.--June 5, 1996 to current year.
GAGE.--Water-stage recorder. Datum of gage is 1,100.00 ft above sea level, adjustment of 1912.
REMARKS.--Records fair. Water level subject to the stage of the Battle River and ice pile up at the mouth; and by lake seiches.
EXTREMES FOR PERIOD OF RECORD.--Maximum gage height, 76.75 ft, Aug. 9, 2001; minimum recorded, 73.29 ft, Oct. 4, 1998.
EXTREMES FOR CURRENT YEAR.--Maximum gage height, 75.82 ft, Aug. 17; maximum daily, 75.52 ft, Oct. 25; minimum gage height, 73.90 ft, Sep. 29; minimum daily, 73.92 ft, Sep. 29.
REVISIONS.--Prior to Oct. 1, 1997, daily-mean, daily-maximum, and daily-minimum gage heights revised upwards by 0.11 ft. Datum of gage had been established 0.11 ft too low.
GAGE HEIGHT, FEET, WATER YEAR OCTOBER 2001 TO SEPTEMBER 2002 DAILY MEAN VALUES
DAY OCT NOV DEC JAN FEB MAR APR MAY JUN JUL AUG SEP 1 75.20 75.33 75.11 74.99 74.80 74.66 --- 74.61 74.60 75.12 75.04 74.58 2 75.21 75.39 75.00 74.96 74.80 74.66 --- 74.68 74.51 75.10 74.91 74.67 3 75.23 75.24 75.00 74.94 74.81 74.67 --- 74.52 74.47 75.09 74.78 74.62 4 75.30 75.20 75.00 74.92 74.80 74.66 --- 74.59 74.47 74.96 74.81 74.43 5 75.26 75.16 75.12 74.92 74.79 74.64 74.58 74.53 74.44 74.93 74.77 74.43 6 75.13 75.19 75.21 74.92 74.78 74.63 74.55 74.56 74.40 74.94 74.66 74.43 7 75.04 75.20 75.06 74.91 74.77 74.63 74.56 74.54 74.42 74.99 74.65 74.44 8 74.97 75.25 75.00 74.90 74.76 74.64 74.56 74.56 74.40 75.10 74.62 74.44 9 75.04 75.16 75.01 74.90 74.76 74.65 --- 74.87 74.47 75.06 74.63 74.46 10 75.23 75.17 74.96 74.89 74.74 74.67 --- 74.69 74.63 75.08 74.66 74.44 11 75.24 75.12 74.99 74.88 74.75 74.66 --- 74.62 74.67 75.08 74.66 74.39 12 75.16 75.10 74.99 74.87 74.68 74.70 --- 74.60 74.70 75.09 74.73 74.41 13 75.23 75.10 74.99 74.86 74.70 74.68 --- 74.64 74.74 75.07 74.63 74.33 14 75.29 75.11 74.97 74.85 74.74 74.66 --- 74.56 74.75 75.07 74.55 74.35 15 75.39 75.12 74.95 74.86 74.72 74.64 --- 74.57 74.74 75.03 74.68 74.24 16 75.31 75.08 74.98 74.85 74.72 74.62 --- 74.58 74.77 75.03 74.60 74.19 17 75.18 75.06 74.99 74.86 74.70 74.61 --- 74.53 74.64 75.06 75.08 74.15 18 75.22 75.13 75.01 74.88 74.68 74.62 --- 74.53 74.55 75.03 74.67 74.15 19 75.25 75.14 74.99 74.89 74.68 74.63 --- 74.51 74.71 74.99 74.58 74.26 20 75.31 75.02 74.94 74.87 74.68 74.64 --- 74.50 74.94 74.97 74.53 74.23 21 75.24 75.00 74.94 74.85 74.67 74.64 --- 74.47 --- 75.06 74.53 74.36 22 75.16 74.99 74.94 74.84 74.65 74.64 --- 74.43 --- 75.06 74.54 74.25 23 75.19 74.98 74.97 74.84 74.65 74.62 74.62 74.54 --- 74.92 74.51 74.12 24 75.29 75.03 74.96 74.83 74.65 74.58 74.86 74.45 --- 74.84 74.54 74.01 25 75.52 75.13 74.96 74.84 74.65 74.59 74.88 74.44 --- 74.91 74.49 74.05 26 75.48 75.03 74.96 74.82 74.66 74.58 74.62 74.42 --- 74.94 74.47 74.03 27 75.31 75.06 74.96 74.82 74.65 74.58 74.56 74.39 --- 74.91 74.42 73.97 28 75.22 74.98 74.96 74.82 74.66 --- 74.59 74.41 --- 74.97 74.42 73.96 29 75.22 74.98 74.96 74.81 --- --- 74.67 74.51 75.13 74.92 74.49 73.92 30 75.17 75.02 75.00 74.81 --- --- 74.58 74.62 75.13 74.90 74.46 73.96 31 75.17 --- 74.99 74.81 --- --- --- 74.64 --- 74.85 74.49 ---
MEAN 75.23 75.12 75.00 74.87 74.72 --- --- 74.55 --- 75.00 74.63 74.28 MAX 75.52 75.39 75.21 74.99 74.81 --- --- 74.87 --- 75.12 75.08 74.67 MIN 74.97 74.98 74.94 74.81 74.65 --- --- 74.39 --- 74.84 74.42 73.92

71 RED RIVER OF THE NORTH BASIN--Continued
05073650 LOWER RED LAKE AT BATTLE RIVER MOUTH NEAR SAUM, MN--Continued
O N D2001
J F M A M J J A S2002
73.8
74
74.2
74.4
74.6
74.8
75
75.2
75.4
75.6
GAGE HEIGHT, IN FEET
Gap indicatesmissing record

72 RED RIVER OF THE NORTH BASIN--Continued
05074000 LOWER RED LAKE NEAR RED LAKE, MN
LOCATION.--Lat 47°57’27", long 95°16’34", in SW1⁄4NW1⁄4 sec. 28, T.152 N., R.36 W., Clearwater County, Hydrologic Unit 09020302,
on Red Lake Indian Reservation, on left bank just upstream from dam at outlet of Lower Red Lake, and 13 mi northwest of city of Red Lake.
DRAINAGE AREA.--1,950 mi2 (approximately).
PERIOD OF RECORD.--June 1930 to November 1932, May 1933 to September 1997, October 1999 to September 2000. Published as "Red Lake at Redby" prior to May 1933 and as "Red Lake near Red Lake" May 1933 to September 1940. Fragmentary gage-height record, October 1921 to September 1929, for "Red Lake at Redby" in files of Minnesota Department of Natural Resources. Gage height record, October 1997 to September 1999, in files of U.S. Army Corps of Engineers.
GAGE.--Water-stage recorder. Datum of gage is 1,100.00 ft above sea level, adjustment of 1912 (levels by U.S. Army Corps of Engineers). May 1933 to Sept. 6, 1934, nonrecording gage. Sept. 7, 1934 to Sept. 30, 1986, water-stage recorder at present site at datum 69.00 ft higher.
REMARKS.--Records fair. Water level subject to fluctuation caused by seiches, and by drawdown from dam gate changes.
EXTREMES FOR PERIOD OF RECORD.--Maximum gage height recorded, 78.53 ft, June 25, 1950; minimum recorded, 69.80 ft, Nov. 20, 1936.
EXTREMES FOR CURRENT YEAR.--Maximum gage height, 75.71 ft, Oct. 24; maximum daily, 75.37 ft, July 10; minimum gage height, 73.51 ft, Sept. 22; minimum daily, 73.67 ft, Sept. 26.
GAGE HEIGHT, FEET, WATER YEAR OCTOBER 2001 TO SEPTEMBER 2002 DAILY MEAN VALUES DAY OCT NOV DEC JAN FEB MAR APR MAY JUN JUL AUG SEP 1 75.07 74.94 74.60 74.85 74.66 74.57 74.49 74.29 74.45 75.00 74.56 74.45 2 75.28 --- 74.70 74.85 74.66 74.56 74.47 74.21 74.51 74.86 74.58 74.23 3 75.12 --- 74.75 74.83 74.66 74.56 74.47 74.36 74.48 74.82 74.64 74.23 4 74.92 --- 74.78 74.81 74.65 74.56 74.47 74.27 74.38 74.97 74.62 74.34 5 74.96 --- 74.68 74.81 74.65 74.55 74.46 74.36 74.38 74.98 74.69 74.31 6 75.01 --- 74.81 74.80 74.67 74.55 74.48 74.43 74.35 74.81 74.67 74.28 7 75.01 74.86 74.92 74.81 74.68 74.56 74.45 74.33 74.26 74.90 74.55 74.26 8 75.09 74.72 74.91 74.79 74.68 74.55 74.43 74.51 74.34 75.05 74.51 74.23 9 75.00 74.68 74.91 74.78 74.67 74.54 74.40 74.06 74.61 75.19 74.40 74.25 10 75.11 74.77 74.90 74.78 74.67 74.57 74.39 74.41 74.61 75.37 74.39 74.19 11 75.10 74.80 74.88 74.78 74.65 74.58 74.38 74.46 74.57 75.18 74.47 74.15 12 75.12 74.80 74.84 74.76 74.64 74.58 74.38 74.45 74.55 75.08 74.35 74.04 13 75.12 74.77 74.87 74.79 74.65 74.56 74.39 74.41 74.61 75.06 74.36 74.12 14 75.04 74.77 74.89 74.77 74.64 74.57 74.39 74.49 74.56 75.05 74.29 74.01 15 74.99 74.74 74.90 74.75 74.64 74.56 74.38 74.43 74.56 75.03 74.34 73.97 16 75.06 74.78 74.88 74.76 74.63 74.56 74.36 74.51 74.58 74.97 74.35 73.99 17 75.08 74.74 74.88 74.74 74.65 74.55 74.35 74.46 74.61 75.04 74.14 74.03 18 --- 74.69 74.84 74.76 74.63 74.54 74.46 74.43 74.59 75.01 74.30 74.03 19 --- 74.65 74.86 74.74 74.62 74.54 74.37 74.46 74.64 74.91 74.32 73.95 20 --- 74.63 74.87 74.75 74.61 74.53 74.37 74.39 74.55 74.86 74.29 73.87 21 --- 74.70 74.88 74.74 74.62 74.52 74.40 74.37 74.74 74.80 74.35 73.69 22 75.10 74.74 74.87 74.73 74.62 74.52 74.35 74.37 74.89 74.72 74.37 73.75 23 75.04 74.72 74.86 74.72 74.60 74.51 74.37 74.29 74.99 74.78 74.29 73.85 24 75.27 74.83 74.86 74.74 74.58 74.52 74.16 74.37 74.93 74.77 74.30 73.76 25 74.85 74.85 74.85 74.73 74.58 74.51 74.05 74.32 74.91 74.74 74.29 73.74 26 74.96 75.18 74.85 74.73 74.57 74.52 74.35 74.26 74.99 74.76 74.31 73.67 27 75.04 75.18 74.85 74.72 74.59 74.53 74.48 74.35 75.01 74.77 74.32 73.81 28 75.02 74.65 74.85 74.72 74.56 74.50 74.36 74.38 75.04 74.71 74.37 73.80 29 75.08 74.51 74.85 74.68 --- 74.49 74.25 74.42 75.03 74.69 74.54 73.79 30 75.14 74.56 74.85 74.68 --- 74.49 74.34 74.35 74.98 74.69 74.51 73.77 31 75.17 --- 74.84 74.66 --- 74.48 --- 74.39 --- 74.75 74.46 ---
MEAN --- --- 74.84 74.76 74.63 74.54 74.38 74.37 74.66 74.91 74.42 74.02 MAX --- --- 74.92 74.85 74.68 74.58 74.49 74.51 75.04 75.37 74.69 74.45 MIN --- --- 74.60 74.66 74.56 74.48 74.05 74.06 74.26 74.69 74.14 73.67

73 RED RIVER OF THE NORTH BASIN--Continued
05074000 LOWER RED LAKE NEAR RED LAKE, MN--Continued
O N D2001
J F M A M J J A S2002
73.5
74
74.5
75
75.5
GAGE HEIGHT, IN FEET
Gap indicatesmissing record

74 RED RIVER OF THE NORTH BASIN--Continued
05074500 RED LAKE RIVER NEAR RED LAKE, MN
LOCATION.--Lat 47°57’27", long 95°16’35", in SW1⁄4NW1⁄4 sec. 28, T.152 N., R.36 W., Clearwater County, Hydrologic Unit 09020302,
on Red Lake Indian Reservation, on left bank 50 ft downstream from dam outlet at outlet of Lower Red Lake, and 13 mi northwest of city of Red Lake.
DRAINAGE AREA.--1,950 mi2 (approximately).
PERIOD OF RECORD.--May 1933 to September 1994 (monthly discharge only for May 1933, published in WSP 1308), October 1999 to current year.
GAGE.--Water-stage recorder. Datum of gage is 1,100.00 ft above sea level, adjustment of 1912 (levels by U.S. Army Corps of Engineers). Prior to Sept. 7, 1934, nonrecording gage at site 50 ft upstream at datum 69.00 ft higher. Sept. 7, 1934 to Nov. 26, 1951, water-stage recorder at present site at datum 69.00 ft higher. Nov. 27,1951 to Sept. 30, 1986, water-stage recorder at present site at datum 67.00 ft higher.
REMARKS.--Records poor. Flow completely regulated by outlet dam on Lower Red Lake.
DISCHARGE, CUBIC FEET PER SECOND, WATER YEAR OCTOBER 2001 TO SEPTEMBER 2002 DAILY MEAN VALUES DAY OCT NOV DEC JAN FEB MAR APR MAY JUN JUL AUG SEP 1 782 782 e830 e710 e730 e710 711 1260 995 435 1120 667 2 861 750 e880 e740 e730 e710 714 1250 996 773 1110 655 3 869 754 e950 e770 e730 e705 713 1250 997 1040 1100 677 4 820 755 e1030 e760 e730 e705 697 1240 991 1130 1100 898 5 802 755 e1100 e760 e730 e705 695 1240 981 1170 1130 965 6 788 745 e900 e760 e740 e705 685 1260 980 1180 1160 1050 7 778 1030 e700 e757 e750 e705 690 1260 971 1220 1140 1050 8 743 1370 e690 e755 755 e700 729 1280 966 1100 1120 1050 9 764 1420 e700 e755 740 e700 861 1280 1020 666 1090 1060 10 768 1460 e710 e755 e740 e700 969 1070 896 e250 1080 1050 11 613 1480 e715 e755 e740 e705 992 1050 433 e150 1090 1040 12 772 1500 e720 e755 e730 e710 1020 1040 366 e150 1070 1020 13 815 1500 e725 e755 726 e710 1050 1040 353 518 1080 1040 14 828 1490 e730 e755 713 e720 1080 1040 475 543 1080 1020 15 824 1480 e735 e755 719 725 1100 1030 772 590 1090 1010 16 820 1480 e740 e755 735 728 1130 1040 802 754 1110 1010 17 e815 1470 e745 e755 723 730 1180 1040 811 801 1110 1020 18 e800 1460 e750 e755 717 740 1180 1040 789 819 1120 1020 19 e780 1440 e760 e755 715 750 1200 1040 796 917 1140 996 20 e770 1440 e760 e755 712 743 1260 1030 810 1060 1150 968 21 e775 1440 e760 e750 713 761 1290 1020 727 1080 1170 903 22 e790 1440 e750 e750 e715 765 1280 1010 425 1080 1180 890 23 806 1440 e745 e745 e715 736 1290 1010 406 1080 1160 915 24 854 1440 e740 e745 e715 709 1290 1000 402 1080 1160 882 25 842 1460 e730 e740 e715 700 1260 992 397 1070 1160 873 26 813 e1450 e720 e740 e710 702 1250 982 395 1070 1170 841 27 799 e1250 e715 e740 e710 702 1260 972 388 1070 1180 870 28 789 e1000 e710 e740 e710 737 1280 967 380 1060 1000 878 29 788 e700 e710 e740 --- 751 1280 984 367 1050 554 869 30 790 e810 e710 e735 --- 748 1260 1000 364 1080 471 861 31 785 --- e710 e735 --- 735 --- 1000 --- 1140 642 ---
TOTAL 24643 36991 23870 23232 20308 22352 31396 33717 20451 27126 33037 28048 MEAN 795 1233 770 749 725 721 1047 1088 682 875 1066 935 MAX 869 1500 1100 770 755 765 1290 1280 1020 1220 1180 1060 MIN 613 700 690 710 710 700 685 967 353 150 471 655 AC-FT 48880 73370 47350 46080 40280 44340 62270 66880 40560 53800 65530 55630 CFSM 0.41 0.63 0.39 0.38 0.37 0.37 0.54 0.56 0.35 0.45 0.55 0.48 IN. 0.47 0.71 0.46 0.44 0.39 0.43 0.60 0.64 0.39 0.52 0.63 0.54

75 RED RIVER OF THE NORTH BASIN--Continued
05074500 RED LAKE RIVER NEAR RED LAKE, MN--Continued
STATISTICS OF MONTHLY MEAN DATA FOR WATER YEARS 1933 - 2002, BY WATER YEAR (WY)
OCT NOV DEC JAN FEB MAR APR MAY JUN JUL AUG SEP
MEAN 487 492 477 484 478 447 364 505 576 546 484 478 MAX 2071 1765 1498 1418 1342 1396 1357 1624 2025 1840 1464 1712 (WY) 1951 2000 1951 1951 1951 1951 2000 1950 1950 1950 1975 1950 MIN 5.10 3.57 0.95 0.35 0.40 0.60 4.00 0.60 2.15 4.63 2.73 1.61 (WY) 1934 1934 1934 1934 1934 1936 1936 1933 1933 1934 1936 1934
SUMMARY STATISTICS FOR 2001 CALENDAR YEAR FOR 2002 WATER YEAR WATER YEARS 1933 - 2002 ANNUAL TOTAL 318517 325171 ANNUAL MEAN 873 891 488 HIGHEST ANNUAL MEAN 1292 1951 LOWEST ANNUAL MEAN 5.55 1936 HIGHEST DAILY MEAN 1500 Nov 12 1500 Nov 12,13 2240 Oct 6 1950 LOWEST DAILY MEAN 142 Apr 11 150 Jul 11,12 0.00a Sep 19 1933 ANNUAL SEVEN-DAY MINIMUM 174 Apr 11 385 Jun 24 0.00 Sep 1 1934 MAXIMUM PEAK FLOW 1500b Nov 12 3600 Jun 25 1950 MAXIMUM PEAK STAGE 74.20c Nov 28 78.19 Jun 25 1950 ANNUAL RUNOFF (AC-FT) 631800 645000 353800 ANNUAL RUNOFF (CFSM) 0.45 0.46 0.25 ANNUAL RUNOFF (INCHES) 6.08 6.20 3.40 10 PERCENT EXCEEDS 1140 1250 1020 50 PERCENT EXCEEDS 855 802 429 90 PERCENT EXCEEDS 682 700 41 a Many days in 1933, 1934 and 1936. b Gage-height, 73.53 ft. c Backwater from ice. e Estimated.
O N D2001
J F M A M J J A S2002
100
200
500
10001000
2000
5000
10,000
DAILY-MEAN DISCHARGE,
IN CUBIC FEET PER SECOND

76 RED RIVER OF THE NORTH BASIN--Continued
05076000 THIEF RIVER NEAR THIEF RIVER FALLS, MN
LOCATION.--Lat 48°11’08", long 96°10’11", in NW1⁄4SW1⁄4 sec. 3, T.154 N., R.43 W., Marshall County, Hydrologic Unit 09020304, on
right bank, 0.2 mi upstream from highway bridge, 5 mi north of Thief River Falls, 7 mi upstream from mouth, and 9 mi downstream from Mud Lake National Wildlife Refuge.
DRAINAGE AREA.--985 mi2.
PERIOD OF RECORD.--July 1909 to September 1917, April 1920 to September 1921, October 1922 to September 1924, October 1928 to September 1981, March 1982 to current year. Monthly discharge only for some periods, annual maximums for water years 1919, 1922, 1925, 1926, published in WSP 1308. October 1981 to February 1982, operated as a high-flow partial-record station.
REVISED RECORDS.--WSP 925: Drainage area. WSP 1308: 1917(M), 1924(M), 1929(M), 1931-33(M), 1935(M), 1937(M).
GAGE.--Water-stage recorder and control of grouted boulders. Datum of gage is 1,112.33 ft above sea level (NGVD of 1929, levels by Minnesota Department of Transportation). Prior to May 4, 1939, nonrecording gages at same site and datum.
REMARKS.--Records good except those for estimated daily discharges, which are poor. Some regulation by Thief and Mud Lakes.
DISCHARGE, CUBIC FEET PER SECOND, WATER YEAR OCTOBER 2001 TO SEPTEMBER 2002 DAILY MEAN VALUES DAY OCT NOV DEC JAN FEB MAR APR MAY JUN JUL AUG SEP 1 130 223 e93 e2.2 0.62 e1.3 e52 62 521 2370 1190 536 2 117 233 e90 e2.2 0.55 e1.2 e40 51 411 2280 1140 554 3 118 224 e88 e2.1 0.47 e1.1 e28 44 324 2190 1130 518 4 93 212 e87 e2.1 0.36 e0.58 e21 41 267 2120 1120 498 5 86 206 e86 e2.1 0.26 e0.58 e16 38 249 2080 1070 470 6 83 200 e45 e2.1 e0.36 e0.66 e14 51 289 2020 917 455 7 83 197 e45 e2.2 e0.39 0.13 e12 69 275 2000 887 444 8 80 191 e45 e2.2 e0.46 0.10 e13 96 322 2040 809 435 9 32 189 e45 e2.3 0.52 0.16 e14 313 1180 2100 792 432 10 26 188 e45 e2.4 0.56 e0.38 e15 449 3350 2330 755 375 11 26 181 e45 e2.4 0.58 e0.46 e20 379 3350 2570 745 375 12 26 177 e45 e2.5 0.72 1.4 e32 305 3260 2470 701 370 13 27 174 e45 e2.4 0.80 e1.7 e48 273 3260 2300 545 284 14 29 172 e45 e2.3 1.4 e2.1 e90 252 3190 2160 503 193 15 37 193 e45 e2.2 e1.5 e2.5 e85 223 3110 2050 383 181 16 38 488 e45 e2.1 e1.6 e2.9 50 206 3020 1970 371 187 17 34 743 e45 e2.1 e1.7 e4.0 43 191 2880 1900 368 182 18 32 736 e45 e2.0 e1.9 e7.1 64 151 2680 1850 360 147 19 31 649 e15 e1.9 e2.3 e4.6 104 133 2650 1810 372 116 20 27 426 e6.0 e1.9 e3.3 e3.6 102 125 2930 1760 416 100 21 26 392 e4.6 e1.8 e2.5 e3.0 67 122 2990 1730 412 47 22 26 146 e3.8 e1.8 e2.0 e3.2 47 108 3040 1690 408 36 23 30 103 e3.2 e1.7 e1.7 e3.6 36 55 3240 1650 405 30 24 71 104 e2.8 e1.6 e1.6 e3.7 64 51 3250 1610 400 30 25 63 104 e2.6 e1.6 e1.6 e3.9 119 50 3190 1580 397 26 26 132 66 e2.5 e1.5 e1.6 e4.3 97 46 3070 1550 392 24 27 159 e65 e2.4 e1.5 e1.5 e5.4 63 43 2920 1490 389 22 28 191 e100 e2.3 1.4 e1.5 e40 50 44 2790 1460 418 25 29 188 e98 e2.3 1.1 --- e55 44 169 2640 1420 427 21 30 180 e96 e2.2 0.93 --- e60 71 483 2490 1340 437 21 31 184 --- e2.2 0.78 --- e57 --- 569 --- 1250 493 ---
TOTAL 2405 7276 1080.9 59.41 34.35 275.65 1521 5192 67138 59140 19152 7134 MEAN 77.6 243 34.9 1.92 1.23 8.89 50.7 167 2238 1908 618 238 MAX 191 743 93 2.5 3.3 60 119 569 3350 2570 1190 554 MIN 26 65 2.2 0.78 0.26 0.10 12 38 249 1250 360 21 AC-FT 4770 14430 2140 118 68 547 3020 10300 133200 117300 37990 14150 CFSM 0.08 0.25 0.04 0.00 0.00 0.01 0.05 0.17 2.27 1.94 0.63 0.24 IN. 0.09 0.27 0.04 0.00 0.00 0.01 0.06 0.20 2.54 2.23 0.72 0.27

77 RED RIVER OF THE NORTH BASIN--Continued
05076000 THIEF RIVER NEAR THIEF RIVER FALLS, MN--Continued
STATISTICS OF MONTHLY MEAN DATA FOR WATER YEARS 1909 - 2002, BY WATER YEAR (WY)
OCT NOV DEC JAN FEB MAR APR MAY JUN JUL AUG SEP
MEAN 94.9 85.6 24.7 5.73 5.36 78.0 619 506 340 255 120 117 MAX 637 1019 215 100 101 773 2827 4274 2238 2103 1130 1619 (WY) 1986 2001 1999 1910 1998 1995 1966 1950 2002 1975 2001 1999 MIN 0.000 0.000 0.000 0.000 0.000 0.000 7.75 1.83 0.032 0.000 0.000 0.000 (WY) 1911 1911 1911 1911 1911 1930 1981 1990 1980 1932 1932 1929
SUMMARY STATISTICS FOR 2001 CALENDAR YEAR FOR 2002 WATER YEAR WATER YEARS 1909 - 2002 ANNUAL TOTAL 162693.1 170408.31 ANNUAL MEAN 446 467 187a HIGHEST ANNUAL MEAN 791 1999 LOWEST ANNUAL MEAN 1.28 1939 HIGHEST DAILY MEAN 3400 Apr 9 3350 Jun 10,11 5580 May 13 1950 LOWEST DAILY MEAN 2.2 Dec 30 0.10 Mar 8 0.00b Oct 1 1910 ANNUAL SEVEN-DAY MINIMUM 2.4 Dec 25 0.35 Mar 5 0.00 Oct 1 1910 MAXIMUM PEAK FLOW 3410 Jun 10 5610 May 13 1950 MAXIMUM PEAK STAGE 14.55 Jun 10 17.38 May 13 1950 INSTANTANEOUS LOW FLOW 0.07 Mar 7 ANNUAL RUNOFF (AC-FT) 322700 338000 135700 ANNUAL RUNOFF (CFSM) 0.45 0.47 0.19 ANNUAL RUNOFF (INCHES) 6.14 6.44 2.58 10 PERCENT EXCEEDS 1340 1980 582 50 PERCENT EXCEEDS 198 80 10 90 PERCENT EXCEEDS 3.8 1.6 0.00 a Median of annual mean discharges is 146 ft3/s. b Many days, several years. e Estimated.
O N D2001
J F M A M J J A S2002
0.1
0.2
0.5
11
2
5
1010
20
50
100100
200
500
10001000
2000
5000
10,000
DAILY-MEAN DISCHARGE,
IN CUBIC FEET PER SECOND

78 RED RIVER OF THE NORTH BASIN--Continued
05078000 CLEARWATER RIVER AT PLUMMER, MN
LOCATION.--Lat 47°55’24", long 96°02’46", in SE1⁄4SW1⁄4 sec. 4, T.151 N., R.42 W., Red Lake County, Hydrologic Unit 09020305, on
right bank 200 ft downstream from Soo Line Railroad bridge, 300 ft downstream from bridge on U.S. Highway 59, 0.9 mi northwest of railroad depot in Plummer, and 8 mi upstream from Hill River.
DRAINAGE AREA.--555 mi2.
PERIOD OF RECORD.--April 1939 to September 1979, March 1982 to current year. Annual maximums only, October 1979 to February 1982.
GAGE.--Water-stage recorder. Datum of gage is 1,098.57 ft above sea level (NGVD of 1929, levels by U.S. Army Corps of Engineers). Prior to Nov. 10, 1939, nonrecording gage at site 100 ft upstream at same datum.
REMARKS.--Records good except those for estimated daily discharges, which are poor. Since 1968, undetermined amounts of water diverted for the flooding of wild rice paddies upstream.
EXTREMES FOR CURRENT YEAR.--Peak discharges greater than base discharge of 630 ft3/s and maximum (*):
Discharge Gage height Discharge Gage height Date Time (ft3/s) (ft) Date Time (ft3/s) (ft)
Jun 10 0500 1,030 7.16 Aug 29 0900 683 5.87 Jun 23 1230 *1,410 *8.32 Sep 1 1400 814 6.38 Jul 12 1600 1,210 7.77
Minimum discharge, 40 ft3/s, Oct. 9, 10, Sept. 20, 23, 24, gage height, 2.59 ft.
DISCHARGE, CUBIC FEET PER SECOND, WATER YEAR OCTOBER 2001 TO SEPTEMBER 2002 DAILY MEAN VALUES DAY OCT NOV DEC JAN FEB MAR APR MAY JUN JUL AUG SEP 1 53 97 e102 e80 e65 e60 e75 187 207 899 234 792 2 51 96 e97 e80 e64 e59 e71 184 209 925 277 646 3 44 119 e92 e80 e63 e59 e67 181 196 910 260 433 4 48 160 e89 e81 e63 e59 e66 183 179 827 241 313 5 49 153 e85 e83 e64 e58 e65 196 177 687 192 248 6 46 124 e83 e85 e64 e58 e65 191 186 542 158 228 7 45 104 e82 e87 e65 e58 e65 177 189 468 158 219 8 54 101 e82 e89 e66 e58 e66 173 160 628 151 193 9 42 87 e81 e92 e67 e58 e69 253 468 655 140 174 10 40 91 e80 e93 e68 e58 e73 348 916 696 127 162 11 54 97 e82 e91 e68 e60 e90 360 615 937 114 158 12 132 94 e88 e89 e69 e61 e120 325 470 1170 114 147 13 153 80 e86 e87 e69 e63 e170 305 391 1090 133 137 14 138 68 e84 e85 e70 e66 e200 283 464 829 135 127 15 142 67 e87 e83 e71 e69 188 268 469 598 111 118 16 134 71 e91 e80 e71 e72 152 240 394 544 108 109 17 142 70 e91 e78 e71 e72 135 220 327 498 124 94 18 130 70 e90 e77 e71 e70 142 242 316 404 185 82 19 120 70 e87 e76 e71 e67 211 277 391 349 198 54 20 112 80 e85 e75 e70 e65 297 224 698 318 185 44 21 110 75 e83 e75 e69 e63 294 175 851 316 160 46 22 107 71 e83 e74 e68 e62 273 164 1070 288 141 48 23 93 75 e82 e73 e66 e61 225 153 1370 244 130 42 24 86 80 e81 e72 e65 e60 200 185 1280 248 124 42 25 88 96 e80 e71 e64 e60 246 184 1280 226 125 47 26 97 74 e80 e70 e63 e60 282 171 1330 229 117 46 27 91 e64 e80 e69 e62 e62 270 170 1280 221 110 46 28 99 e60 e80 e68 e61 e67 261 136 1160 213 270 45 29 99 e59 e80 e68 --- e79 245 155 1010 216 601 42 30 94 e107 e80 e67 --- e88 200 193 905 275 414 47 31 88 --- e80 e66 --- e80 --- 213 --- 254 570 ---
TOTAL 2781 2660 2633 2444 1868 1992 4883 6716 18958 16704 6107 4929 MEAN 89.7 88.7 84.9 78.8 66.7 64.3 163 217 632 539 197 164 MAX 153 160 102 93 71 88 297 360 1370 1170 601 792 MIN 40 59 80 66 61 58 65 136 160 213 108 42 AC-FT 5520 5280 5220 4850 3710 3950 9690 13320 37600 33130 12110 9780 CFSM 0.16 0.16 0.15 0.14 0.12 0.12 0.29 0.39 1.14 0.97 0.35 0.30 IN. 0.19 0.18 0.18 0.16 0.13 0.13 0.33 0.45 1.27 1.12 0.41 0.33

79 RED RIVER OF THE NORTH BASIN--Continued
05078000 CLEARWATER RIVER AT PLUMMER, MN--Continued
STATISTICS OF MONTHLY MEAN DATA FOR WATER YEARS 1939 - 2002, BY WATER YEAR (WY)
OCT NOV DEC JAN FEB MAR APR MAY JUN JUL AUG SEP
MEAN 117 100 67.9 54.6 52.5 119 541 363 265 232 128 115 MAX 483 617 211 125 184 445 1472 1974 1140 1072 507 666 (WY) 1972 2001 2001 2001 1998 1995 1997 1950 1962 1997 1985 1973 MIN 21.5 23.8 24.4 18.4 19.0 22.8 26.8 7.52 30.1 16.0 13.3 14.1 (WY) 1941 1991 1990 1940 1940 1940 1977 1977 1991 1940 1940 1940
SUMMARY STATISTICS FOR 2001 CALENDAR YEAR FOR 2002 WATER YEAR WATER YEARS 1939 - 2002 ANNUAL TOTAL 105635 72675 ANNUAL MEAN 289 199 181a HIGHEST ANNUAL MEAN 354 1950 LOWEST ANNUAL MEAN 57.0 1990 HIGHEST DAILY MEAN 2100 Apr 13 1370 Jun 23 3840 Apr 25 1979 LOWEST DAILY MEAN 40 Oct 10 40 Oct 10 2.6 May 16 1977 ANNUAL SEVEN-DAY MINIMUM 46 Oct 4 44 Sep 23 2.9 May 10 1977 MAXIMUM PEAK FLOW 1410 Jun 23 3940b Apr 25 1979 MAXIMUM PEAK STAGE 8.32 Jun 23 12.74c Apr 16 1997 INSTANTANEOUS LOW FLOW 40 Oct 9,Sep 20,23 2.5 May 16 1977 ANNUAL RUNOFF (AC-FT) 209500 144200 130800 ANNUAL RUNOFF (CFSM) 0.52 0.36 0.33 ANNUAL RUNOFF (INCHES) 7.08 4.87 4.42 10 PERCENT EXCEEDS 789 468 419 50 PERCENT EXCEEDS 120 97 80 90 PERCENT EXCEEDS 73 60 34 a Median of annual mean discharges is 178 ft3/s. b Gage-height, 12.31 ft. c Backwater from ice. e Estimated.
O N D2001
J F M A M J J A S2002
10
20
50
100100
200
500
10001000
2000
5000
10,000
DAILY-MEAN DISCHARGE,
IN CUBIC FEET PER SECOND

80 RED RIVER OF THE NORTH BASIN--Continued
05078230 LOST RIVER AT OKLEE, MN
LOCATION.--Lat 47°50’35", long 95°51’30", in SE1⁄4NE1⁄4 sec. 2, T.150 N., R.41 W., Red Lake County, Hydrologic Unit 09020305, on
left bank 30 ft upstream of bridge on State Highway 222 at northwest edge of Oklee, 12 mi upstream from mouth.
DRAINAGE AREA.--254 mi2.
PERIOD OF RECORD.--April 1960 to September 1981, February 1982 to current year. Monthly and daily figures for April 1960 to June 1960, published in WSP 2113.
GAGE.--Water-stage recorder. Datum of gage is 1,126.94 ft above sea level, adjustment of 1912 (levels by U.S. Army Corps of Engineers). Prior to Sept. 9, 1960, reference points at same site at datum 8.00 ft higher. Sept. 9, 1960 to Sept. 30, 1964, nonrecording gage at same site at datum 8.00 ft higher. Oct. 1, 1964 to Sept. 30, 1981, and Feb. 24, 1982 to Sept. 6, 1989, nonrecording gage at same site and datum.
REMARKS.--Records good except those for estimated daily discharges, which are fair.
EXTREMES OUTSIDE PERIOD OF RECORD.--Maximum stage known since at least 1897, 18.39 ft, present datum, Apr. 21, 1950, from floodmarks, discharge, 2,790 ft3/s.
DISCHARGE, CUBIC FEET PER SECOND, WATER YEAR OCTOBER 2001 TO SEPTEMBER 2002 DAILY MEAN VALUES DAY OCT NOV DEC JAN FEB MAR APR MAY JUN JUL AUG SEP 1 16 57 e36 e18 e17 e15 e65 101 62 171 48 161 2 15 55 e35 e17 e17 e15 e53 98 60 159 48 101 3 17 52 e34 e17 e17 e15 e47 93 60 140 46 70 4 16 49 e33 e17 e17 e16 e44 91 56 126 44 54 5 21 48 e33 e17 e17 e16 e42 89 54 116 40 44 6 26 47 e33 e17 e17 e16 e41 91 53 108 34 39 7 29 45 e33 e17 e18 e16 e41 92 51 106 27 35 8 32 45 e32 e18 e18 e16 e41 107 48 126 21 31 9 34 45 e32 e19 e18 e16 e42 252 83 118 19 28 10 36 46 e32 e21 e18 e17 e43 254 134 292 16 26 11 48 45 e33 e23 e18 e17 e50 196 157 493 15 23 12 49 44 e33 e23 e18 e17 e65 154 136 363 16 21 13 51 42 e32 e24 e18 e18 e125 135 123 234 18 18 14 54 42 e32 e24 e18 e18 e130 123 210 159 16 15 15 53 41 e32 e24 e18 e20 123 110 159 122 14 13 16 51 40 e34 e23 e18 e22 117 106 107 104 13 12 17 49 39 e36 e21 e18 e32 115 96 85 94 17 11 18 48 39 e37 e19 e18 e45 135 89 71 94 31 11 19 46 38 e34 e18 e18 e36 180 84 72 88 38 11 20 45 38 e32 e18 e18 e30 159 79 386 84 37 11 21 43 38 e30 e18 e18 e27 128 75 578 80 35 15 22 42 38 e28 e18 e18 e24 108 72 556 75 31 22 23 42 38 e27 e18 e18 e22 98 77 765 70 26 28 24 46 38 e25 e18 e17 e21 107 76 818 58 21 29 25 57 38 e24 e17 e17 e20 129 72 699 53 17 28 26 59 33 e24 e17 e16 e21 115 70 549 62 14 27 27 59 e32 e23 e17 e16 e23 108 65 382 59 13 26 28 60 e30 e23 e17 e16 e50 105 64 279 54 24 25 29 62 e29 e22 e17 --- e85 108 67 226 51 83 26 30 59 e37 e21 e17 --- e100 105 67 190 47 71 26 31 57 --- e20 e17 --- e84 --- 63 --- 43 124 ---
TOTAL 1322 1248 935 586 490 890 2769 3208 7209 3949 1017 987 MEAN 42.6 41.6 30.2 18.9 17.5 28.7 92.3 103 240 127 32.8 32.9 MAX 62 57 37 24 18 100 180 254 818 493 124 161 MIN 15 29 20 17 16 15 41 63 48 43 13 11 AC-FT 2620 2480 1850 1160 972 1770 5490 6360 14300 7830 2020 1960 CFSM 0.17 0.16 0.12 0.07 0.07 0.11 0.36 0.41 0.95 0.50 0.13 0.13 IN. 0.19 0.18 0.14 0.09 0.07 0.13 0.41 0.47 1.06 0.58 0.15 0.14

81 RED RIVER OF THE NORTH BASIN--Continued
05078230 LOST RIVER AT OKLEE, MN--Continued
STATISTICS OF MONTHLY MEAN DATA FOR WATER YEARS 1960 - 2002, BY WATER YEAR (WY)
OCT NOV DEC JAN FEB MAR APR MAY JUN JUL AUG SEP
MEAN 48.6 36.7 16.3 10.2 10.8 76.1 307 140 95.9 84.5 40.0 41.9 MAX 470 232 56.6 26.7 76.3 264 904 622 657 442 351 330 (WY) 1972 1972 1978 1998 1998 1999 1996 1962 1962 1962 1985 1973 MIN 1.02 1.11 0.050 0.002 0.000 0.19 29.5 10.5 8.20 1.99 1.17 0.000 (WY) 1991 1977 1977 1977 1977 1964 1991 1980 1980 1961 1961 1990
SUMMARY STATISTICS FOR 2001 CALENDAR YEAR FOR 2002 WATER YEAR WATER YEARS 1960 - 2002 ANNUAL TOTAL 37836.9 24610 ANNUAL MEAN 104 67.4 75.7 HIGHEST ANNUAL MEAN 177 1962 LOWEST ANNUAL MEAN 18.2 1990 HIGHEST DAILY MEAN 1960 Apr 8 818 Jun 24 3040 Apr 11 1969 LOWEST DAILY MEAN 8.1 Sep 5 11 Sep 17-20 0.00a Feb 16 1963 ANNUAL SEVEN-DAY MINIMUM 9.3 Aug 31 12 Sep 14 0.00 Feb 16 1963 MAXIMUM PEAK FLOW 833 Jun 24 3210b Apr 11 1969 MAXIMUM PEAK STAGE 10.12 Jun 24 16.91c Apr 8 1997 INSTANTANEOUS LOW FLOW 9.9 Sep 21 ANNUAL RUNOFF (AC-FT) 75050 48810 54860 ANNUAL RUNOFF (CFSM) 0.41 0.27 0.30 ANNUAL RUNOFF (INCHES) 5.54 3.60 4.05 10 PERCENT EXCEEDS 221 127 169 50 PERCENT EXCEEDS 32 38 20 90 PERCENT EXCEEDS 15 17 2.7 a Many days, several years. b Gage-height, 14.91, from floodmark. c Backwater from ice. e Estimated.
O N D2001
J F M A M J J A S2002
10
20
50
100100
200
500
1000
DAILY-MEAN DISCHARGE,
IN CUBIC FEET PER SECOND

82 RED RIVER OF THE NORTH BASIN--Continued
05078500 CLEARWATER RIVER AT RED LAKE FALLS, MN
LOCATION.--Lat 47°53’15", long 96°16’25", in NW1⁄4NE1⁄4 sec. 22, T.151 N., R.44 W., Red Lake County, Hydrologic Unit 09020305,
on left bank 40 ft downstream from Great Northern Railroad bridge in Red Lake Falls, 1.4 mi upstream from mouth, and 3 mi downstream from Badger Creek.
DRAINAGE AREA.--1,380 mi2.
PERIOD OF RECORD.--June 1909 to September 1917, October 1934 to September 1981, March 1982 to current year. Monthly discharge only for October, November, 1934, published in WSP 1308. October 1981 to February 1982, operated as a high-flow partial-record station.
REVISED RECORDS.--WSP 355: 1911-12. WSP 1438: 1910-11, 1917(M). WDR MN-84-1:1983.
GAGE.--Water-stage recorder. Datum of gage is 948.94 ft above sea level (NGVD of 1929, levels by U.S. Army Corps of Engineers). Prior to Sept. 12, 1911, nonrecording gage at site 0.5 mi upstream, and Sept. 12, 1911 to Sept. 30, 1917, nonrecording gage at site 40 ft upstream at different datum.
REMARKS.--Records good except those for estimated daily discharges, which are poor.
DISCHARGE, CUBIC FEET PER SECOND, WATER YEAR OCTOBER 2001 TO SEPTEMBER 2002 DAILY MEAN VALUES DAY OCT NOV DEC JAN FEB MAR APR MAY JUN JUL AUG SEP 1 78 253 e170 e131 e127 e118 e205 410 334 1550 452 5510 2 84 265 e160 e132 e126 e117 e193 400 325 1520 463 3490 3 80 252 e150 e133 e126 e116 e185 379 312 1490 477 1980 4 68 276 e145 e134 e125 e116 e180 370 290 1430 450 1410 5 74 295 e140 e136 e126 e116 e177 377 268 1310 402 1080 6 78 271 e137 e138 e126 e116 e178 377 257 1130 339 887 7 78 229 e136 e143 e127 e116 e180 375 262 1050 302 771 8 76 209 e136 e145 e132 e116 e185 384 252 1090 298 656 9 91 204 e135 e148 e134 e117 e200 614 1390 1170 289 586 10 84 188 e134 e148 e136 e117 e220 919 2570 1940 260 532 11 83 194 e133 e148 e138 e118 e230 926 1930 2770 236 485 12 134 200 e145 e147 e139 e121 e255 832 1590 2600 216 443 13 260 190 e142 e146 e140 e126 e360 734 1370 2280 212 399 14 266 173 e140 e145 e141 e132 e460 662 1340 1820 233 366 15 263 161 e146 e143 e143 e136 492 602 1450 1470 219 336 16 263 159 e150 e142 e143 e140 460 547 1290 1230 198 297 17 247 160 e149 e141 e143 e140 410 492 1100 1120 211 270 18 251 158 e146 e140 e144 e136 406 447 957 966 239 243 19 237 153 e144 e139 e144 e133 489 478 963 840 306 222 20 220 152 e140 e138 e143 e130 633 453 1100 758 298 187 21 204 160 e138 e137 e140 e128 632 383 1520 723 278 165 22 202 152 e136 e137 e136 e127 586 330 1920 672 246 162 23 194 148 e135 e136 e132 e125 510 328 2690 595 234 168 24 207 151 e134 e136 e128 e125 444 312 2870 547 211 168 25 196 159 e133 e135 e126 e126 471 358 2810 514 199 164 26 235 153 e132 e134 e124 e129 537 323 2660 474 227 166 27 250 e62 e132 e133 e122 e138 538 308 2470 479 240 162 28 253 e55 e131 e132 e120 e160 510 293 2220 454 1530 163 29 265 e140 e131 e131 --- e175 491 294 1950 421 2540 159 30 267 e180 e131 e130 --- e230 463 288 1690 434 2130 154 31 257 --- e131 e128 --- e217 --- 334 --- 476 4550 ---
TOTAL 5545 5502 4342 4286 3731 4157 11280 14329 42150 35323 18485 21781 MEAN 179 183 140 138 133 134 376 462 1405 1139 596 726 MAX 267 295 170 148 144 230 633 926 2870 2770 4550 5510 MIN 68 55 131 128 120 116 177 288 252 421 198 154 AC-FT 11000 10910 8610 8500 7400 8250 22370 28420 83600 70060 36660 43200 CFSM 0.13 0.13 0.10 0.10 0.10 0.10 0.27 0.33 1.02 0.83 0.43 0.53 IN. 0.15 0.15 0.12 0.12 0.10 0.11 0.30 0.39 1.14 0.95 0.50 0.59

83 RED RIVER OF THE NORTH BASIN--Continued
05078500 CLEARWATER RIVER AT RED LAKE FALLS, MN--Continued
STATISTICS OF MONTHLY MEAN DATA FOR WATER YEARS 1909 - 2002, BY WATER YEAR (WY)
OCT NOV DEC JAN FEB MAR APR MAY JUN JUL AUG SEP
MEAN 193 156 97.1 77.2 74.2 248 1184 701 510 414 217 203 MAX 1350 1233 321 221 385 1136 3507 5059 3042 2389 1686 1599 (WY) 1972 1972 2001 1998 1998 1995 1997 1950 1962 1997 1985 1999 MIN 10.0 19.0 21.4 21.4 19.1 13.6 61.0 32.2 26.5 8.34 1.49 2.92 (WY) 1935 1935 1937 1940 1937 1937 1981 1977 1980 1936 1936 1936
SUMMARY STATISTICS FOR 2001 CALENDAR YEAR FOR 2002 WATER YEAR WATER YEARS 1909 - 2002 ANNUAL TOTAL 197157 170911 ANNUAL MEAN 540 468 337a HIGHEST ANNUAL MEAN 855 1950 LOWEST ANNUAL MEAN 64.4 1939 HIGHEST DAILY MEAN 5300 Apr 12 5510 Sep 1 9930 Apr 25 1979 LOWEST DAILY MEAN 55 Nov 28 55 Nov 28 0.10 Sep 15 1936 ANNUAL SEVEN-DAY MINIMUM 77 Oct 2 77 Oct 2 0.24 Sep 12 1936 MAXIMUM PEAK FLOW 5890 Sep 1 10300b Apr 25 1979 MAXIMUM PEAK STAGE 9.65 Sep 1 15.85c Mar 6 1983 INSTANTANEOUS LOW FLOW 36d Nov 28 0.00f Sep 15 1936 ANNUAL RUNOFF (AC-FT) 391100 339000 244200 ANNUAL RUNOFF (CFSM) 0.39 0.34 0.24 ANNUAL RUNOFF (INCHES) 5.31 4.61 3.32 10 PERCENT EXCEEDS 1460 1300 800 50 PERCENT EXCEEDS 207 211 119 90 PERCENT EXCEEDS 131 126 38 a Median of annual mean discharges is 293 ft3/s. b Gage-height, 12.38 ft. c From highwater mark, backwater from ice. d Result of freezeup. e Estimated. f Also occurred Sep. 14, 1939, and Aug. 19-22, 1940.
O N D2001
J F M A M J J A S2002
10
20
50
100100
200
500
10001000
2000
5000
10,000
DAILY-MEAN DISCHARGE,
IN CUBIC FEET PER SECOND

84 RED RIVER OF THE NORTH BASIN--Continued
05079000 RED LAKE RIVER AT CROOKSTON, MN
LOCATION.--Lat 47°46’32", long 96°36’33", in SW1⁄4SW1⁄4 sec. 30, T.150 N., R.46 W., Polk County, Hydrologic Unit 09020303, on
right bank 100 ft upstream from Sargent Street bridge in Crookston, 0.3 mi downstream from Interstate Power Co.’s dam, 0.6 mi downstream from bridge on U.S. Highway 75, and 53 mi upstream from mouth.
DRAINAGE AREA.--5,270 mi2.
PERIOD OF RECORD.--May 1901 to current year. Monthly discharge only for some periods, published in WSP 1308. Figures of daily discharge for Apr. 3-30, 1904, published in WSP 130, have been found unreliable and should not be used.
REVISED RECORDS.--WSP 1115: 1906, 1915-16, 1919-20, 1922, 1925, 1927, 1929. WSP 1308: 1916(M), 1919(M), 1928(M), 1930(M). (See also PERIOD OF RECORD).
GAGE.--Water-stage recorder. Datum of gage is 832.72 ft above sea level (NGVD of 1929). May 18, 1901 to June 30, 1909, nonrecording gage at bridge 300 ft upstream at same datum. July 1, 1909 to Sept. 25, 1911, nonrecording gage, Sept. 26, 1911 to Sept. 30, 1919, water-stage recorder, Oct. 1, 1919 to Sept. 30, 1930, nonrecording gage, at present site and datum.
REMARKS.--Records good except those for estimated daily discharges, which are poor. Diurnal fluctuation prior to 1975 caused by power plant 1,000 ft upstream. Runoff from 1,950 mi2 in the headwaters of Red Lake River is completely controlled by dam at outlet of Lower Red Lake. Flow partially affected by occasional regulation at Thief and Mud Lakes in Thief River Basin (see station 05076000).
DISCHARGE, in CFS, WATER YEAR OCTOBER 2001 TO SEPTEMBER 2002 DAILY MEAN VALUES DAY OCT NOV DEC JAN FEB MAR APR MAY JUN JUL AUG SEP 1 1190 1630 1190 e1390 e830 e690 e1300 2010 2130 4560 2640 10600 2 1240 1740 1190 e1380 e840 e720 e1350 1970 2040 4290 2530 9060 3 1140 1780 1250 e1350 e840 e750 e1380 1930 1920 4140 2530 5250 4 1140 1760 1250 e1330 e840 e790 e1410 e1850 1810 4080 2510 3350 5 1060 1710 1320 e1300 e840 e820 e1420 e1800 1720 4070 2450 2580 6 1150 1670 1530 e1260 e840 e850 e1460 e1800 1620 3990 2370 2180 7 1070 1650 1550 e1240 e840 e870 e1500 e1810 1630 3890 2210 2000 8 1050 1580 1710 e1220 e840 e890 e1520 1980 1630 4870 2150 1900 9 1030 1540 1560 e1200 e840 e900 e1550 2280 4520 4790 2140 1870 10 1070 1610 1610 e1170 e840 e920 e1560 2910 13200 7390 2090 1900 11 1040 1780 1660 e1150 e840 e930 e1600 3180 15400 10700 2040 1800 12 1020 1950 1300 e1130 e840 e940 e1620 2850 11600 9870 2000 1730 13 1110 1970 1480 e1100 e830 e940 e1650 2520 8440 7930 1940 1690 14 1170 2080 1560 e1080 e830 e940 e1750 2310 6480 5920 1830 1610 15 1150 1940 1600 e1050 e830 e930 1810 2190 5890 4710 1830 1510 16 1270 2100 1590 e1020 e830 e930 1810 2090 5580 4110 1740 1450 17 1270 2340 1560 e1000 e830 e910 1710 2000 5170 3790 1750 1420 18 1310 2600 1680 e960 e820 e900 1790 1920 4760 3590 1730 1430 19 1290 2630 2110 e940 e820 e880 1920 1860 4540 3400 1740 1400 20 1270 2590 e2100 e900 e820 e870 2090 e1780 5260 3280 1780 1360 21 1250 2380 e1900 e890 e830 e870 2120 e1710 6460 3180 1830 1330 22 1240 2320 e1600 e870 e840 e870 2070 1660 6410 3120 1800 1290 23 1200 2120 e1600 e860 e850 e880 2050 1610 8040 3070 1810 1280 24 1320 2000 e1580 e850 e850 e890 2020 1570 8950 3010 1790 1260 25 1390 2040 e1550 e840 e840 e910 1990 1550 9150 2970 1790 1230 26 1360 2030 e1500 e840 e810 e950 2090 1550 8290 2900 1780 1240 27 1420 1860 e1480 e830 e730 e980 2050 1540 7070 2870 1910 1240 28 1530 1370 e1450 e820 e660 e1020 2020 1520 6230 2780 4310 1230 29 1570 1320 e1450 e820 --- e1090 2010 1490 5610 2750 9250 1220 30 1600 1260 e1420 e820 --- e1170 2020 1580 5030 2700 6020 1230 31 1620 --- e1400 e820 --- e1220 --- 2030 --- 2660 7350 ---
TOTAL 38540 57350 47730 32430 23090 28220 52640 60850 176580 135380 81640 68640 MEAN 1243 1912 1540 1046 824.6 910.3 1755 1963 5886 4367 2634 2288 MAX 1620 2630 2110 1390 850 1220 2120 3180 15400 10700 9250 10600 MIN 1020 1260 1190 820 660 690 1300 1490 1620 2660 1730 1220 AC-FT 76440 113800 94670 64320 45800 55970 104400 120700 350200 268500 161900 136100 CFSM 0.24 0.36 0.29 0.20 0.16 0.17 0.33 0.37 1.12 0.83 0.50 0.43 IN. 0.27 0.40 0.34 0.23 0.16 0.20 0.37 0.43 1.25 0.96 0.58 0.48

85 RED RIVER OF THE NORTH BASIN--Continued
05079000 RED LAKE RIVER AT CROOKSTON, MN--Continued
STATISTICS OF MONTHLY MEAN DATA FOR WATER YEARS 1901 - 2002, BY WATER YEAR (WY)
OCT NOV DEC JAN FEB MAR APR MAY JUN JUL AUG SEP
MEAN 861.7 753.2 605.1 533.1 515.0 1020 3128 2157 1757 1407 893.4 887.0 MAX 2836 3620 1900 1663 1778 4257 11870 15290 7205 6851 3868 5408 (WY) 1972 2001 1904 1951 1998 1995 1997 1950 1962 1975 1985 1999 MIN 8.02 10.1 5.34 15.6 17.8 24.9 232 154 80.4 26.2 12.3 8.87 (WY) 1937 1937 1937 1934 1937 1936 1981 1934 1934 1936 1934 1934
SUMMARY STATISTICS FOR 2001 CALENDAR YEAR FOR 2002 WATER YEAR WATER YEARS 1901 - 2002 ANNUAL TOTAL 849070 803090 ANNUAL MEAN 2326 2200 1206 HIGHEST ANNUAL MEAN 3129 1950 LOWEST ANNUAL MEAN 83.6 1934 HIGHEST DAILY MEAN 20000 Apr 9 15400 Jun 11 27500 Apr 18 1997 LOWEST DAILY MEAN 920 Mar 13 660 Feb 28 2.5 Sep 29 1936 ANNUAL SEVEN-DAY MINIMUM 926 Mar 9 736 Feb 26 3.9 Sep 28 1936 MAXIMUM PEAK FLOW 16100 Jun 11 28400 Apr 12 1969 MAXIMUM PEAK STAGE 20.85 Jun 11 28.40a Apr 17 1997 INSTANTANEOUS LOW FLOW 0.00b Jul 13 1960 ANNUAL RUNOFF (AC-FT) 1684000 1593000 874000 ANNUAL RUNOFF (CFSM) 0.44 0.42 0.23 ANNUAL RUNOFF (INCHES) 5.99 5.67 3.11 10 PERCENT EXCEEDS 4550 4530 2640 50 PERCENT EXCEEDS 1600 1600 750 90 PERCENT EXCEEDS 950 840 120 a From highwater mark, backwater from ice. b From regulation by power plant upstream. e Estimated.
O N D2001
J F M A M J J A S2002
100
200
500
10001000
2000
5000
10,00010,000
20,000
50,000
100,000
DAILY-MEAN DISCHARGE,
IN CUBIC FEET PER SECOND

86 RED RIVER OF THE NORTH BASIN--Continued
05080000 RED LAKE RIVER AT FISHER, MN
LOCATION.--Lat 47°48’01", long 96°48’31", in SW1⁄4NE1⁄4 sec. 21, T.150 N., R.48 W., Polk County, Hydrologic Unit 09020303, on
left bank 10 ft upstream from bridge on county highway, 0.3 mile west of Fisher and at river mile 27.6.
DRAINAGE AREA.--5,678 mi2.
PERIOD OF RECORD.--Mar. to Sep. 1999 (gage heights and maximum discharge only), Oct. 1, 1999 to current year.
GAGE.--Water-stage recorder. Datum of gage is 800.00 ft above sea level (levels by Minnesota Department of Transportation).
REMARKS.-- Records good except those for estimated daily discharges, which are poor. Runoff from 1,950 mi2 of Red Lake River basin above Lower Red Lake outlet is completely comtrolled by dam at outlet of Lower Red Lake. Flow partially affected by occasional runoff of Thief and Mud Lakes in Thief River Basin.
EXTREMES OUTSIDE PERIOD OF RECORD.-- A stage of 41.00 ft occurred in spring of 1997 (from information provided by the National Weather Service).
DISCHARGE, in CFS, WATER YEAR OCTOBER 2001 TO SEPTEMBER 2002 DAILY MEAN VALUES DAY OCT NOV DEC JAN FEB MAR APR MAY JUN JUL AUG SEP 1 1180 1660 1290 e1430 e840 e700 e1300 2030 2220 5810 3280 9250 2 1190 1660 1230 e1410 e840 e720 e1350 1990 2170 5340 3150 10200 3 1170 1690 e1250 e1380 e840 e740 e1400 1900 1920 5030 3050 9010 4 1140 1730 e1300 e1360 e840 e770 e1450 1860 1750 4860 3070 6590 5 1100 1660 e1400 e1330 e850 e800 e1460 1800 1660 4800 2990 4460 6 1120 1650 e1550 e1290 e850 e830 e1500 1800 1660 4740 2890 3490 7 1110 1660 e1650 e1270 e850 e850 e1530 1820 1640 4610 2690 3030 8 1050 1660 e1750 e1240 e850 e880 e1570 1920 1660 4970 2490 2760 9 1010 1630 e1730 e1220 e850 e900 e1580 2210 3170 5430 2510 2610 10 1050 1610 e1680 e1200 e850 e910 e1600 3080 8740 7380 2400 2620 11 1050 1660 e1650 e1170 e850 e920 e1610 3650 13600 11700 2310 2500 12 1000 1770 e1450 e1140 e850 e930 e1650 3540 14200 14100 2210 2330 13 1030 1890 e1450 e1120 e850 e940 e1700 3090 10700 12400 2200 2200 14 1170 1960 e1580 e1080 e850 e940 e1750 2740 8830 10200 1880 2090 15 1130 1950 e1600 e1070 e850 e930 1810 2500 7900 8360 1890 1880 16 1230 1980 e1600 e1040 e850 e920 1740 2290 7320 7000 1820 1750 17 1280 2100 e1600 e1020 e850 e910 1670 2140 6750 6020 1740 1640 18 1290 2180 e1750 e982 e830 e900 1670 1950 6160 5330 1730 1660 19 1300 e2600 e2030 e951 e820 e900 1750 1850 5650 4730 1710 1630 20 1270 2720 2140 e923 e820 e880 2080 1780 5540 4330 1760 1550 21 1260 2550 1910 e880 e840 e880 2250 1690 6300 4070 1810 1470 22 1240 2380 1690 e860 e860 e880 2190 1660 6800 3920 1840 1420 23 1220 2240 1620 e850 e880 e890 2110 1660 7540 3820 1810 1360 24 1270 2000 e1620 e850 e880 e910 2080 1610 9020 3740 1790 1330 25 1380 1980 e1590 e850 e870 e940 1990 1550 9660 3690 1780 1270 26 1410 2000 e1560 e840 e850 e970 2080 1550 9170 3610 1760 1250 27 1390 1940 e1520 e840 e770 e1020 2120 1540 8450 3550 1860 1270 28 1490 1470 e1490 e840 e680 e1080 2060 1510 7650 3480 3180 1260 29 1590 1350 e1470 e810 --- e1150 2020 1450 6990 3400 7920 1240 30 1600 1340 e1470 e840 --- e1200 2040 1500 6410 3330 9050 1210 31 1650 --- e1430 e840 --- e1250 --- 1790 --- 3280 7970 ---
TOTAL 38370 56670 49050 32926 23510 28440 53110 63450 191230 177030 88540 86330 MEAN 1238 1889 1582 1062 839.6 917.4 1770 2047 6374 5711 2856 2878 MAX 1650 2720 2140 1430 880 1250 2250 3650 14200 14100 9050 10200 MIN 1000 1340 1230 810 680 700 1300 1450 1640 3280 1710 1210 AC-FT 76110 112400 97290 65310 46630 56410 105300 125900 379300 351100 175600 171200 CFSM 0.22 0.33 0.28 0.19 0.15 0.16 0.31 0.36 1.12 1.01 0.50 0.51 IN. 0.25 0.37 0.32 0.22 0.15 0.19 0.35 0.42 1.25 1.16 0.58 0.57

87 RED RIVER OF THE NORTH BASIN--Continued
05080000 RED LAKE RIVER AT FISHER, MN--Continued
STATISTICS OF MONTHLY MEAN DATA FOR WATER YEARS 2000 - 2002, BY WATER YEAR (WY)
OCT NOV DEC JAN FEB MAR APR MAY JUN JUL AUG SEP
MEAN 1531 2645 1444 1106 1017 1443 4031 2423 4022 3334 2350 1735 MAX 2261 4103 1566 1187 1106 2280 8063 3666 6374 5711 3188 2878 (WY) 2000 2001 2002 2001 2001 2000 2001 2001 2002 2002 2001 2002 MIN 1095 1889 1324 1044 840 917 1770 1555 2770 1772 1006 858 (WY) 2001 2002 2000 2002 2002 2002 2002 2000 2000 2001 2000 2000
SUMMARY STATISTICS FOR 2001 CALENDAR YEAR FOR 2002 WATER YEAR WATER YEARS 2000 - 2002 ANNUAL TOTAL 888010 888656 ANNUAL MEAN 2433 2435 2257 HIGHEST ANNUAL MEAN 2591 2001 LOWEST ANNUAL MEAN 1748 2000 HIGHEST DAILY MEAN 22200 Apr 10 14200 Jun 12 22200 Apr 10 2001 LOWEST DAILY MEAN 1000 Oct 12 680 Feb 28 589 Sep 21 2000 ANNUAL SEVEN-DAY MINIMUM 1030 Mar 7 740 Feb 27 613 Sep 17 2000 MAXIMUM PEAK FLOW 15000 Jun 12 24500 Apr 10 2001 MAXIMUM PEAK STAGE 34.35 Jun 12 38.00 Apr 10 2001 ANNUAL RUNOFF (AC-FT) 1761000 1763000 1635000 ANNUAL RUNOFF (CFSM) 0.43 0.43 0.40 ANNUAL RUNOFF (INCHES) 5.82 5.82 5.40 10 PERCENT EXCEEDS 4540 5580 4380 50 PERCENT EXCEEDS 1640 1650 1610 90 PERCENT EXCEEDS 1100 850 940 e Estimated.
O N D2001
J F M A M J J A S2002
100
200
500
10001000
2000
5000
10,00010,000
20,000
50,000
100,000
GAGE HEIGHT, IN FEET

88 RED RIVER OF THE NORTH BASIN--Continued
05082500 RED RIVER OF THE NORTH AT GRAND FORKS, ND
LOCATION.--Lat 47°55’38", long 97°01’34", in sec.2, T.151 N., R.50 W., Grand Forks County, Hydrologic Unit 09020301, on right bank 200 ft upstream from the DeMers Avenue bridge, 0.4 mi downstream from Red Lake River, and at mile 297.6.
DRAINAGE AREA.--30,100 mi2 (approximately), including 3,800 mi2 in closed basins.
PERIOD OF RECORD.--April 1882 to current year. Prior to January 1904 monthly discharge only, published in WSP 1308.
REVISED RECORDS.--WSP 855: 1936(M). WSP 1115: 1942. WSP 1175: 1897(M). WSP 1388: 1904, 1914-15, 1917-19, 1921-22, 1927, 1950. WSP 1728: Drainage area. WRD-ND-81-1: 1882, 1897 (M).
GAGE.--Acoustic-doppler velocity meter and water-stage recorder. Datum of gage is 779.00 ft above sea level, National Geodetic Vertical Datum of 1929. Oct. 1, 1983, to Sept. 30, 1986, datum of gage was 780.00 ft at same site. Apr. 14, 1965, to Sept. 30, 1983, water-stage recorder 1.9 mi downstream at a datum of 778.35 ft. Nov. 3, 1933, to Apr. 13, 1965, water-stage recorder 0.3 mi upstream at 778.35 ft datum. See WSP 1728 or 1913 for history of changes prior to Nov. 3, 1933.
REMARKS.--Records good except for periods of estimated discharge, which are poor.
DISCHARGE, CUBIC FEET PER SECOND, WATER YEAR OCTOBER 2001 TO SEPTEMBER 2002 DAILY MEAN VALUES DAY OCT NOV DEC JAN FEB MAR APR MAY JUN JUL AUG SEP 1 2040 2980 1960 2010 1890 2050 e3670 4490 4450 21300 7420 16600 2 1920 3130 1720 2000 1870 1940 e3810 4480 4530 19200 6880 17000 3 1820 3440 1630 1990 1880 1880 e3790 e4400 4450 16800 6270 16600 4 1810 3730 1950 1980 1810 1730 e3760 e4300 4360 14600 6060 14300 5 1730 3930 2310 1950 1700 e1710 e3700 e4310 4070 12900 5750 10600 6 1760 4030 2630 1980 1690 1710 3660 e4300 3700 11400 5410 7460 7 1760 3930 2740 1940 1700 1670 3480 e4300 3460 10200 5100 6200 8 1620 3860 2750 1970 1730 1670 3390 4360 3300 9240 5030 5580 9 1690 3670 2690 2160 e1750 1700 3390 4580 6310 9090 5030 5200 10 1790 3530 2740 2190 e1670 e1750 3740 5280 13200 14900 4790 4980 11 1640 3400 2690 2170 1720 e1670 4190 6330 20900 24700 4680 4780 12 1680 3460 2910 2170 1750 e1750 4660 6870 26500 33200 4690 4580 13 1860 3500 2770 2160 1750 1730 5640 6940 28700 36600 4420 4300 14 2110 3470 2760 2130 1770 1840 5880 6730 29100 37400 4210 4200 15 2260 3560 2820 2150 1740 2010 5600 6670 27100 36000 3910 3970 16 2210 3420 3120 2160 1710 2060 5180 6500 25100 32900 3740 3720 17 2180 3500 3290 2130 1710 2020 5170 6300 22000 29300 3590 3520 18 2360 3720 3320 2110 1710 e2200 5080 6020 18900 25100 3440 3390 19 2360 3960 3160 2060 1740 e2460 4760 5710 15800 21300 3370 3440 20 2370 3940 3020 2020 1840 e2580 4880 5400 12800 17500 3440 3140 21 2410 3910 2720 1960 1950 e2710 5000 5120 10900 14200 3660 3050 22 2110 3750 2530 1960 2000 e2760 e5200 4880 10700 11800 3710 2990 23 2310 3630 2230 1980 2060 e2750 e5100 4870 12000 e10600 3690 2950 24 2470 3430 2120 1950 2150 e2660 e4850 4730 15600 e9700 3710 2800 25 2580 3350 2030 1900 2270 e2500 e4690 4600 19500 9170 3700 2530 26 2620 3280 1860 1880 e2340 e2490 4590 4520 22200 8630 3700 2450 27 2560 3320 1920 1870 2340 e2480 4580 4390 24200 8700 3720 2380 28 2620 2550 2030 1970 2210 e2420 e4630 4210 25100 8910 5120 2320 29 2720 1900 2050 1960 --- e2540 4570 4040 24700 8890 8450 2230 30 2710 1910 2040 1920 --- e2940 4460 3970 22900 8610 13200 2270 31 2810 --- 2010 1860 --- e3380 --- 4110 --- 7880 15600 ---
TOTAL 68890 103190 76520 62640 52450 67760 135100 157710 466530 540720 165490 169530 MEAN 2158 3440 2468 2021 1873 2186 4503 5087 15550 17440 5338 5651 MAX 2810 4030 3320 2190 2340 3380 5880 6940 29100 37400 15600 17000 MIN 1620 1900 1630 1860 1670 1670 3390 3970 3300 7880 3370 2230 AC-FT 132700 204700 151800 124200 104000 134400 268000 312800 925400 1073000 328200 336300 CFSM 0.08 0.13 0.09 0.08 0.07 0.08 0.17 0.19 0.59 0.66 0.20 0.21 IN. 0.10 0.15 0.11 0.09 0.07 0.10 0.19 0.22 0.66 0.76 0.23 0.24

89 RED RIVER OF THE NORTH BASIN--Continued
05082500 RED RIVER OF THE NORTH AT GRAND FORKS, ND--Continued
STATISTICS OF MONTHLY MEAN DATA FOR WATER YEARS 1904 - 2002, BY WATER YEAR (WY)
OCT NOV DEC JAN FEB MAR APR MAY JUN JUL AUG SEP
MEAN 1496 1377 1080 894 875 2789 10290 5595 4307 3752 1898 1615 MAX 5127 9971 3832 2656 3520 15370 56210 36500 19250 25230 17050 11340 (WY) 1995 2001 2001 2001 1998 1995 1997 1950 1962 1975 1993 1999 MIN 12.1 30.5 17.8 18.8 2.87 42.1 954 373 151 88.5 30.6 20.3 (WY) 1937 1937 1937 1937 1937 1937 1938 1934 1934 1936 1934 1936
SUMMARY STATISTICS FOR 2001 CALENDAR YEAR FOR 2002 WATER YEAR WATER YEARS 1904 - 2002 ANNUAL TOTAL 2785830 2064530 ANNUAL MEAN 7631 5656 2983 HIGHEST ANNUAL MEAN 10070 1997 LOWEST ANNUAL MEAN 244 1934 HIGHEST DAILY MEAN 57300 Apr 14 37400 Jul 14 127000 Apr 18 1997 LOWEST DAILY MEAN 1620 Oct 8 1620 Oct 8 1.8 Sep 2 1977 ANNUAL SEVEN-DAY MINIMUM 1710 Oct 6 1700 Mar 5 2.5 Feb 12 1937 MAXIMUM PEAK FLOW 38000a Jul 13 137000b Apr 18 1997 MAXIMUM PEAK STAGE 38.67 Jul 14 54.35c Apr 22 1997 ANNUAL RUNOFF (AC-FT) 5526000 4095000 2161000 ANNUAL RUNOFF (CFSM) 0.29 0.21 0.11 ANNUAL RUNOFF (INCHES) 3.94 2.92 1.51 10 PERCENT EXCEEDS 17400 14200 6500 50 PERCENT EXCEEDS 3340 3440 1440 90 PERCENT EXCEEDS 2240 1810 284 a Gage height, 38.14 ft. b Maximum observed, affected by breakout flow from Red River of the North about 20 miles upstream of gage, that entered Red Lake River about 2 miles from the confluence with Red River of the North. c From floodmark. e Estimated.
O N D2001
J F M A M J J A S2002
1000
2000
5000
10,00010,000
20,000
50,000
100,000
DAILY-MEAN DISCHARGE,
IN CUBIC FEET PER SECOND

90 RED RIVER OF THE NORTH BASIN--Continued
05087500 MIDDLE RIVER AT ARGYLE, MN
LOCATION.--Lat 48°20’25", long 96°48’58", in NE1⁄4NW1⁄4 sec. 15, T.156 N., R.48 W., Marshall County, Hydrologic Unit 09020309,
on left bank 30 ft upstream of bridge on County Highway 4 in Argyle and 14 mi upstream from mouth.
DRAINAGE AREA.--255 mi2.
PERIOD OF RECORD.--March to September 1945, November 1950 to September 1981, February 1982 to current year. Monthly discharge only for some periods, published in WSP 1728. October 1981 to January 1982, operated as a high-flow partial-record station.
GAGE.--Water-stage recorder. Datum of gage is 828.53 ft above sea level (NGVD of 1929). Prior to Nov. 8, 1951, nonrecording gage and Nov. 8, 1951 to Sept. 18, 1952, water-stage recorder at site 800 ft downstream at datum 1.0 ft higher. Sept. 19, 1952 to June 28, 1982, recording gage at site 800 feet downstream at present datum. June 29, 1982 to Sept. 20, 1983, nonrecording gage at present site and datum.
REMARKS.--Records good except those for estimated daily discharges, which are poor.
EXTREMES OUTSIDE PERIOD OF RECORD.--Flood of April 1950 reached a stage of 15.25 ft present datum, site then in use, from floodmarks, discharge, 2,790 ft3/s.
DISCHARGE, CUBIC FEET PER SECOND, WATER YEAR OCTOBER 2001 TO SEPTEMBER 2002 DAILY MEAN VALUES DAY OCT NOV DEC JAN FEB MAR APR MAY JUN JUL AUG SEP 1 2.8 1.6 e10 e3.8 e3.0 e2.6 e8.0 e120 127 169 13 130 2 3.0 1.7 e9.7 e3.8 e3.0 e2.6 22 97 138 132 12 286 3 2.3 14 e9.3 e3.8 e3.0 e2.5 53 84 121 107 13 193 4 2.4 49 e8.3 e3.7 e2.9 e2.5 36 71 91 89 12 144 5 2.3 66 e7.7 e3.9 e2.9 e2.4 28 62 68 75 10 113 6 2.3 58 e7.5 e3.9 e2.9 e2.4 22 57 53 65 9.8 83 7 2.6 51 e7.0 e3.9 e2.9 e2.3 20 60 43 60 9.0 61 8 2.9 44 e6.4 e3.8 e2.9 e2.3 18 98 36 106 8.4 45 9 2.8 39 e6.1 e3.6 e2.8 e2.2 16 122 41 e150 9.9 34 10 3.2 34 e6.0 e3.6 e2.8 e2.2 15 162 67 e220 9.4 28 11 2.9 30 e5.8 e3.6 e2.8 e2.2 16 258 496 e320 8.2 23 12 2.7 28 e5.8 e3.6 e2.8 e2.2 16 268 2140 e360 7.7 20 13 2.7 26 e5.7 e3.7 e2.8 e2.2 18 243 2550 e300 7.0 17 14 2.7 24 e5.6 e3.7 e2.7 e2.2 24 202 2060 e240 6.8 14 15 3.1 23 e5.5 e3.7 e2.7 e2.2 37 169 1620 e170 6.8 12 16 2.6 21 e5.3 e3.6 e2.9 e2.2 48 145 1350 e120 6.7 12 17 2.5 20 e5.0 e3.5 e3.1 e2.2 45 126 1140 e90 7.5 e11 18 2.8 20 e4.7 e3.4 e3.1 e2.2 39 104 886 e65 6.7 11 19 3.5 19 e4.5 e3.4 e3.0 e2.2 37 88 636 52 6.5 21 20 3.6 18 e4.4 e3.2 e3.0 e2.2 37 74 478 43 6.1 32 21 3.6 17 e4.4 e3.3 e2.9 e2.2 39 61 386 36 5.7 20 22 3.8 17 e4.3 e3.2 e2.9 e2.2 35 52 323 31 4.9 15 23 2.4 16 e4.3 e3.3 e2.8 e2.2 31 45 448 26 4.5 11 24 4.7 15 e4.2 e3.3 e2.8 e2.3 30 41 598 24 4.8 10 25 4.7 15 e4.2 e3.2 e2.7 e2.3 57 38 786 21 4.4 8.5 26 5.6 14 e4.2 e3.1 e2.7 e2.3 292 35 856 19 4.2 8.1 27 6.3 13 e4.3 e3.1 e2.7 e2.3 325 33 706 17 6.1 7.0 28 4.1 e12 e4.1 e3.1 e2.6 e2.3 297 33 483 13 186 6.2 29 3.0 e11 e4.0 e3.1 --- e2.4 216 32 336 12 192 5.5 30 2.4 e10 e4.0 e3.1 --- e3.0 153 31 233 11 89 5.5 31 1.8 --- e3.9 e3.0 --- e4.0 --- 64 --- 11 62 ---
TOTAL 98.1 727.3 176.2 108.0 80.1 73.5 2030.0 3075 19296 3154 740.1 1386.8 MEAN 3.16 24.2 5.68 3.48 2.86 2.37 67.7 99.2 643 102 23.9 46.2 MAX 6.3 66 10 3.9 3.1 4.0 325 268 2550 360 192 286 MIN 1.8 1.6 3.9 3.0 2.6 2.2 8.0 31 36 11 4.2 5.5 AC-FT 195 1440 349 214 159 146 4030 6100 38270 6260 1470 2750 CFSM 0.01 0.10 0.02 0.01 0.01 0.01 0.27 0.39 2.52 0.40 0.09 0.18 IN. 0.01 0.11 0.03 0.02 0.01 0.01 0.30 0.45 2.81 0.46 0.11 0.20

91 RED RIVER OF THE NORTH BASIN--Continued
05087500 MIDDLE RIVER AT ARGYLE, MN--Continued
STATISTICS OF MONTHLY MEAN DATA FOR WATER YEARS 1945 - 2002, BY WATER YEAR (WY)
OCT NOV DEC JAN FEB MAR APR MAY JUN JUL AUG SEP
MEAN 12.8 19.2 3.83 1.53 2.98 36.6 237 94.3 91.8 62.5 15.0 18.6 MAX 94.1 535 22.2 8.77 69.8 335 966 896 660 688 265 272 (WY) 1983 2001 1995 1995 2000 1995 1997 1996 1970 1975 1993 1993 MIN 0.000 0.000 0.000 0.000 0.000 0.000 0.20 2.12 0.37 0.000 0.000 0.000 (WY) 1954 1954 1954 1953 1953 1954 1991 1981 1973 1961 1961 1952
SUMMARY STATISTICS FOR 2001 CALENDAR YEAR FOR 2002 WATER YEAR WATER YEARS 1945 - 2002 ANNUAL TOTAL 32009.5 30945.1 ANNUAL MEAN 87.7 84.8 49.8a HIGHEST ANNUAL MEAN 198 1999 LOWEST ANNUAL MEAN 1.60 1977 HIGHEST DAILY MEAN 2190 Apr 9 2550 Jun 13 4800 May 19 1996 LOWEST DAILY MEAN 1.6 Nov 1 1.6 Nov 1 0.00b Aug 18 1952 ANNUAL SEVEN-DAY MINIMUM 2.5 Oct 3 2.2 Mar 9 0.00 Aug 18 1952 MAXIMUM PEAK FLOW 2730 Jun 12 5020 May 19 1996 MAXIMUM PEAK STAGE 16.16 Jun 12 18.27c May 19 1996 ANNUAL RUNOFF (AC-FT) 63490 61380 36100 ANNUAL RUNOFF (CFSM) 0.34 0.33 0.20 ANNUAL RUNOFF (INCHES) 4.67 4.51 2.65 10 PERCENT EXCEEDS 191 188 101 50 PERCENT EXCEEDS 8.0 10 3.0 90 PERCENT EXCEEDS 3.2 2.5 0.00 a Median of annual mean discharges is 41 ft3/s. b Many days, several years. c From floodmark. e Estimated.
O N D2001
J F M A M J J A S2002
1
2
5
1010
20
50
100100
200
500
10001000
2000
5000
10,000
DAILY-MEAN DISCHARGE,
IN CUBIC FEET PER SECOND

92 RED RIVER OF THE NORTH BASIN--Continued
05092000 RED RIVER OF THE NORTH AT DRAYTON, ND
LOCATION.--Lat 48°34’20", long 97°08’50", in SE1⁄4SE1⁄4SE
1⁄4 sec.24, T.159 N., R.51 W., Pembina County, Hydrologic Unit 09020311, on downstream side of bridge on North Dakota State Highway 66, at the North Dakota-Minnesota border, 1.5 mi northeast of Drayton, and at mile 206.7.
DRAINAGE AREA.--34,800 mi2 (approximately) includes 3,800 mi2 in closed basins.
PERIOD OF RECORD.--April 1936 to June 1937, April 1941 to current year (fragmentary prior to April 1949).
REVISED RECORDS.--WSP 1388: 1949-50. WSP 1728: Drainage area.
GAGE.--Water-stage recorder and concrete control. Datum of gage is 755.00 ft above sea level, National Geodetic Vertical Datum of 1929 (Minnesota Department of Transportation benchmark). Prior to Nov. 30, 1954, nonrecording gage at site 1.5 mi upstream at datum 1.59 ft higher.
REMARKS.--Records fair except those for estimated daily discharges, which are poor.
EXTREMES OUTSIDE PERIOD OF RECORD.--Flood of April 1897 reached a stage of about 41 ft at site and datum in use prior to Nov. 30, 1954.
DISCHARGE, CUBIC FEET PER SECOND, WATER YEAR OCTOBER 2001 TO SEPTEMBER 2002 DAILY MEAN VALUES
DAY OCT NOV DEC JAN FEB MAR APR MAY JUN JUL AUG SEP 1 2460 3050 2410 e2200 e1900 e2350 e3500 4630 4030 25300 7870 17900 2 2460 3160 2130 e2150 e1900 e2250 e3900 4530 4230 24900 7480 18800 3 2430 3290 2060 e2100 e1900 e2100 e4300 4500 4440 24300 7100 e19000 4 2390 3460 2120 e2100 e1900 e2050 e4700 4420 4510 23200 6620 e19000 5 2330 3740 2130 e2050 e1900 e1900 e4750 4370 4460 21900 6090 e18000 6 2280 4030 2100 e2000 e1800 e1850 e4700 4350 4270 20100 5690 e15000 7 2250 4210 2350 e2000 e1750 e1750 e4500 4330 4030 18100 5360 e11000 8 2220 4260 2740 e2000 e1750 e1750 e4400 4330 3840 16000 5110 e9000 9 2190 4190 2930 e2100 e1700 e1750 e4200 4530 3850 13800 5000 e7600 10 2160 4050 3080 e2200 e1700 e1750 e4200 5060 7240 12300 e4850 e6400 11 2140 3870 3180 e2200 e1700 e1750 e4500 5410 15500 13700 e4800 5560 12 2120 3750 3180 e2200 e1750 e1750 e5300 6220 22000 17300 e4800 4940 13 2110 3700 3230 e2200 e1750 e1750 e5800 7220 26900 21100 e4750 4590 14 2100 3710 3260 e2200 e1750 e1850 e6150 7710 30200 24300 e4650 e4400 15 2090 3740 3240 e2150 e1750 e1900 6220 7660 e32000 26800 e4500 e4300 16 2250 3760 e3250 e2150 e1750 e1950 6030 7480 e33500 28700 e4300 e4150 17 2420 3780 e3280 e2200 e1700 e2050 5730 7200 e34500 30100 e4100 e4000 18 2490 3800 e3300 e2200 e1700 e2050 5350 6880 34700 31100 e3950 e3850 19 2600 3870 e3300 e2150 e1750 e2100 5040 6560 34700 30900 e3800 e3700 20 2670 3990 e3300 e2100 e1850 e2300 4820 6210 34200 30200 e3600 e3550 21 2720 4020 e3280 e2100 e1900 e2500 4710 5880 33200 28800 e3600 e3450 22 2750 4000 e3180 e2000 e1950 e2700 4800 5520 31900 27000 e3600 e3300 23 2750 3930 2940 e2000 e2050 e2850 4900 5150 30800 24500 e3700 e3200 24 2740 3820 2750 e2000 e2150 e2850 4930 4930 29200 21600 e3800 e3100 25 2720 3730 2570 e2000 e2250 e2850 4870 4720 27800 18600 e3800 e2900 26 2730 3580 2420 e1950 e2300 e2800 4740 4570 26300 15600 e3800 e2800 27 2780 3510 2300 e1900 e2400 e2800 4700 4460 25100 12900 e4000 e2700 28 2790 3610 2190 e1900 e2400 e2750 4860 4350 25200 10900 5840 e2550 29 2790 3310 e2010 e1950 --- e2750 4900 4260 25400 9640 9140 e2500 30 2860 2770 e2180 e1950 --- e2900 4790 4160 25400 8910 13300 e2400 31 2950 --- e2180 e1900 --- e3100 --- 4050 --- 8350 16100 ---
TOTAL 76740 111690 84570 64300 53050 69800 146290 165650 623400 640900 175100 213640 MEAN 2475 3723 2728 2074 1895 2252 4876 5344 20780 20670 5648 7121 MAX 2950 4260 3300 2200 2400 3100 6220 7710 34700 31100 16100 19000 MIN 2090 2770 2010 1900 1700 1750 3500 4050 3840 8350 3600 2400 AC-FT 152200 221500 167700 127500 105200 138400 290200 328600 1237000 1271000 347300 423800 CFSM 0.08 0.12 0.09 0.07 0.06 0.07 0.16 0.17 0.67 0.67 0.18 0.23 IN. 0.09 0.13 0.10 0.08 0.06 0.08 0.18 0.20 0.75 0.77 0.21 0.26

93 RED RIVER OF THE NORTH BASIN--Continued
05092000 RED RIVER OF THE NORTH AT DRAYTON, ND--Continued
STATISTICS OF MONTHLY MEAN DATA FOR WATER YEARS 1936 - 2002, BY WATER YEAR (WY)
OCT NOV DEC JAN FEB MAR APR MAY JUN JUL AUG SEP
MEAN 1943 1905 1459 1200 1167 3389 14950 9307 5837 5388 2632 2147 MAX 5194 11840 4168 2679 2598 16290 54710 58890 23420 28240 21580 12140 (WY) 1995 2001 1999 2001 1998 1998 1997 1950 1962 1975 1993 1999 MIN 13.8 277 149 174 201 280 1275 938 399 118 50.1 27.4 (WY) 1937 1977 1977 1990 1977 1962 1981 1977 1936 1936 1936 1936
SUMMARY STATISTICS FOR 2001 CALENDAR YEAR FOR 2002 WATER YEAR WATER YEARS 1936 - 2002 ANNUAL TOTAL 3181980 2425130 ANNUAL MEAN 8718 6644 4417 HIGHEST ANNUAL MEAN 11280 1997 LOWEST ANNUAL MEAN 536 1977 HIGHEST DAILY MEAN 55000 Apr 18 34700 Jun 18 124000 Apr 24 1997 LOWEST DAILY MEAN 2010 Dec 29 1700 Feb 9-11,17,18 7.7 Oct 16 1936 ANNUAL SEVEN-DAY MINIMUM 2130 Oct 9 1730 Feb 7 9.9 Oct 11 1936 MAXIMUM PEAK FLOW 34800 Jun 18 124000 Apr 24 1997 MAXIMUM PEAK STAGE 35.86 Jun 18 45.55 Apr 24 1997 INSTANTANEOUS LOW FLOW 7.7 Oct 16 1936 ANNUAL RUNOFF (AC-FT) 6311000 4810000 3200000 ANNUAL RUNOFF (CFSM) 0.28 0.21 0.14 ANNUAL RUNOFF (INCHES) 3.82 2.91 1.94 10 PERCENT EXCEEDS 28500 20500 10200 50 PERCENT EXCEEDS 3580 3740 1930 90 PERCENT EXCEEDS 2500 1950 495 e Estimated.
O N D2001
J F M A M J J A S2002
1000
2000
5000
10,00010,000
20,000
50,000
100,000
DAILY-MEAN DISCHARGE,
IN CUBIC FEET PER SECOND

94 RED RIVER OF THE NORTH BASIN--Continued
05094000 SOUTH BRANCH TWO RIVERS AT LAKE BRONSON, MN
LOCATION.--Lat 48°43’50", long 96°39’50", in SW1⁄4SW1⁄4 sec. 30, T.161 N., R.46 W., Kittson County, Hydrologic Unit 09020312, on
left bank 70 ft upstream from culvert on U.S. Highway 59 at Lake Bronson and 3.4 mi downstream from dam at outlet of Bronson Lake.
DRAINAGE AREA.--422 mi2.
PERIOD OF RECORD.--September 1928 to November 1936, April to September 1937, April 1941 to October 1943, April to December 1944, April 1945 to September 1947, October 1953 to September 1981, April 1985 to current year. Monthly discharge only for some periods, published in WSP 1308. October 1981 to March 1985, annual maximums only. Published as South Fork Two Rivers at Bronson prior to 1941.
REVISED RECORDS.--WSP 1308: 1929(M), 1931(M), 1936(M), 1944(M), 1947(M).
GAGE.--Water-stage recorder. Datum of gage is 928.53 ft above sea level (NGVD of 1929, Minnesota Department of Transportation benchmark). Prior to Nov. 23, 1953, nonrecording gage at bridge 100 ft downstream at datum 2.00 ft higher. Nov 23, 1953 to Oct. 5, 1963, water-stage recorder at same site at datum 2.00 ft higher.
REMARKS.--Records good except those for estimated daily discharges, which are poor. Flow partly regulated since 1937 at Bronson Lake; usable capacity, 3,700 acre-ft.
DISCHARGE, CUBIC FEET PER SECOND, WATER YEAR OCTOBER 2001 TO SEPTEMBER 2002 DAILY MEAN VALUES DAY OCT NOV DEC JAN FEB MAR APR MAY JUN JUL AUG SEP 1 9.4 21 14 8.5 e5.0 e4.1 343 28 275 826 246 87 2 4.4 28 14 8.5 e4.9 e4.0 280 24 123 846 233 258 3 3.4 39 14 8.3 e4.9 e3.9 221 24 70 821 229 384 4 3.4 50 13 8.5 e4.8 e3.7 162 24 32 744 218 125 5 3.7 57 14 e8.4 e4.8 e3.7 104 25 29 772 214 12 6 3.7 67 14 e7.8 e4.8 e3.6 64 25 25 769 209 34 7 4.7 72 13 e7.4 e4.7 e3.4 47 25 25 748 117 67 8 8.0 64 13 e7.1 e4.7 e3.4 39 134 25 762 38 62 9 10 59 13 e6.9 e4.7 e3.3 34 190 26 854 165 61 10 14 56 12 e6.6 e4.6 e3.2 32 240 291 847 224 61 11 15 52 12 e6.4 e4.5 e3.2 30 374 2070 763 210 54 12 13 47 11 e6.5 e4.4 e3.2 28 325 2400 684 175 38 13 12 42 11 e6.4 e4.5 e3.2 27 279 2630 683 122 3.7 14 12 38 11 e6.3 e4.6 e3.2 29 222 2680 654 87 2.9 15 12 35 11 e6.2 e5.0 e3.2 35 205 2410 610 91 2.3 16 13 26 11 e6.2 e5.3 e3.2 37 205 2030 546 98 2.1 17 13 18 11 e6.1 e5.5 e3.2 37 171 1730 493 119 1.7 18 13 23 11 e6.0 e5.5 e3.2 31 86 1490 526 160 1.6 19 12 23 11 e6.0 e5.4 e3.2 30 83 1310 504 190 2.0 20 13 23 11 e5.9 e5.3 e3.3 29 61 831 435 185 1.9 21 13 23 e11 e5.8 e5.1 e3.3 29 28 862 466 153 7.0 22 13 22 e11 e5.7 e5.0 e3.3 23 28 953 469 92 16 23 11 21 e10 e5.6 e4.9 e3.4 15 27 1510 452 25 90 24 18 20 e10 e5.5 e4.8 e3.5 16 25 1710 410 28 3.1 25 19 19 e9.9 e5.4 e4.7 e13 17 25 1980 358 35 1.8 26 17 18 e9.6 e5.4 e4.5 e30 228 25 1850 336 53 2.8 27 15 16 e9.2 e5.3 e4.4 e45 244 26 1700 347 70 6.1 28 13 16 e9.0 e5.2 e4.3 e80 54 26 1550 348 76 7.3 29 12 15 e8.6 e5.2 --- e170 41 27 1180 324 74 8.5 30 12 14 e8.6 e5.1 --- e260 30 40 904 305 73 9.1 31 13 --- 8.5 e5.0 --- 332 --- 299 --- 257 79 ---
TOTAL 348.7 1024 350.4 199.2 135.6 1011.9 2336 3326 34701 17959 4088 1412.9 MEAN 11.2 34.1 11.3 6.43 4.84 32.6 77.9 107 1157 579 132 47.1 MAX 19 72 14 8.5 5.5 332 343 374 2680 854 246 384 MIN 3.4 14 8.5 5.0 4.3 3.2 15 24 25 257 25 1.6 AC-FT 692 2030 695 395 269 2010 4630 6600 68830 35620 8110 2800 CFSM 0.03 0.08 0.03 0.02 0.01 0.08 0.18 0.25 2.74 1.37 0.31 0.11 IN. 0.03 0.09 0.03 0.02 0.01 0.09 0.21 0.29 3.06 1.58 0.36 0.12

95 RED RIVER OF THE NORTH BASIN--Continued
05094000 SOUTH BRANCH TWO RIVERS AT LAKE BRONSON, MN--Continued
STATISTICS OF MONTHLY MEAN DATA FOR WATER YEARS 1929 - 2002, BY WATER YEAR (WY)
OCT NOV DEC JAN FEB MAR APR MAY JUN JUL AUG SEP
MEAN 22.2 33.2 6.04 3.45 6.02 77.8 451 220 189 121 54.1 44.7 MAX 153 1132 37.9 15.3 93.1 689 1977 1500 1336 1136 1349 525 (WY) 1958 2001 2001 2001 1998 1995 1966 1996 1970 1956 1993 1957 MIN 0.40 0.38 0.13 0.12 0.12 0.66 0.54 0.98 1.43 0.44 0.089 0.000 (WY) 1991 1990 1987 1987 1987 1934 1991 1991 1980 1988 1988 1937
SUMMARY STATISTICS FOR 2001 CALENDAR YEAR FOR 2002 WATER YEAR WATER YEARS 1929 - 2002 ANNUAL TOTAL 79236.8 66892.7 ANNUAL MEAN 217 183 103a HIGHEST ANNUAL MEAN 314 2001 LOWEST ANNUAL MEAN 2.89 1934 HIGHEST DAILY MEAN 3290 Apr 10 2680 Jun 14 5290 Apr 5 1966 LOWEST DAILY MEAN 3.2 Jul 17 1.6 Sep 18 0.00b Jul 25 1937 ANNUAL SEVEN-DAY MINIMUM 4.0 Aug 30 2.1 Sep 14 0.00 Aug 2 1937 MAXIMUM PEAK FLOW 2730 Jun 14 5410 Apr 5 1966 MAXIMUM PEAK STAGE 11.23 Jun 14 18.23 Apr 5 1966 ANNUAL RUNOFF (AC-FT) 157200 132700 74960 ANNUAL RUNOFF (CFSM) 0.51 0.43 0.25 ANNUAL RUNOFF (INCHES) 6.98 5.90 3.33 10 PERCENT EXCEEDS 613 534 244 50 PERCENT EXCEEDS 18 23 5.2 90 PERCENT EXCEEDS 8.8 3.8 0.88 a Median of annual mean discharges is 67 ft3/s. b Many days, several years. e Estimated.
O N D2001
J F M A M J J A S2002
1
2
5
1010
20
50
100100
200
500
10001000
2000
5000
10,000
DAILY-MEAN DISCHARGE,
IN CUBIC FEET PER SECOND

96 RED RIVER OF THE NORTH BASIN--Continued
05104500 ROSEAU RIVER BELOW SOUTH FORK NEAR MALUNG, MN
LOCATION.--Lat 48°47’30", long 95°44’40", in NW1⁄4SW1⁄4 sec. 6, T.161 N., R.39 W., Roseau County, Hydrologic Unit 09020314, on
left bank 0.3 mi downstream from South Fork and 1.5 mi northwest of Malung.
DRAINAGE AREA.--430 mi2.
PERIOD OF RECORD.--October 1946 to current year.
REVISED RECORDS.--WSP 2113: 1948, 1950, 1951, 1956(M), 1957(M), 1962(M). WRIR 97-4249: Drainage area.
GAGE.--Water-stage recorder and concrete control. Datum of gage is 1,029.67 ft above sea level (NGVD of 1912).
REMARKS.--Records good except those for estimated daily discharges, which are fair. Some flow bypasses the gaging station through a natural overflow channel 0.8 mi. upstream and returns to river 0.5 mi downstream. Overflow begins at stage of about 13.0 ft, discharge, 1,800 ft3/s. These records include any flow in the overflow channel.
DISCHARGE, CUBIC FEET PER SECOND, WATER YEAR OCTOBER 2001 TO SEPTEMBER 2002 DAILY MEAN VALUES DAY OCT NOV DEC JAN FEB MAR APR MAY JUN JUL AUG SEP 1 25 85 55 e17 e6.9 4.9 e34 221 547 609 34 52 2 25 100 50 e16 e6.4 e4.8 e30 208 544 471 32 73 3 26 116 47 15 6.3 e4.8 e27 188 478 374 29 102 4 25 117 49 15 e6.1 e4.5 e25 176 377 273 26 102 5 24 110 48 15 e6.1 e4.2 e23 167 297 361 25 92 6 21 104 47 e15 e6.4 e4.1 e22 188 244 391 22 75 7 21 99 45 14 e6.6 e4.0 22 240 209 320 21 63 8 21 97 45 14 e6.6 e4.0 24 290 180 290 20 52 9 24 95 44 15 e6.6 e4.1 27 432 192 365 21 44 10 24 94 45 15 e6.6 e4.0 33 588 1380 406 21 45 11 26 94 42 15 e6.8 e4.0 47 634 11200 332 21 46 12 27 90 40 15 e6.6 e4.0 64 606 15800 258 23 49 13 28 87 40 14 e6.8 e3.9 92 549 12600 211 22 50 14 34 84 38 13 e7.1 3.9 131 512 7440 161 18 45 15 49 81 38 12 e7.3 3.9 170 490 4880 131 16 39 16 41 78 e38 11 e7.5 4.1 190 451 3580 109 24 34 17 37 76 e37 11 e7.6 4.3 161 382 2680 94 37 30 18 35 74 e35 e11 7.6 e5.6 146 324 1990 83 39 23 19 35 71 e34 e11 7.7 e6.3 149 274 1570 75 40 27 20 34 68 e32 e11 7.7 e7.1 150 239 1300 70 47 23 21 34 65 e30 e10 7.1 e8.2 138 217 1110 66 44 21 22 36 63 e28 e10 7.2 e8.4 124 195 1220 60 42 e20 23 37 61 e26 e10 7.4 e8.5 112 176 1810 54 37 e19 24 40 61 e24 e10 6.6 e7.8 217 166 2240 50 33 e18 25 42 60 22 e9.7 6.2 7.9 360 161 2530 48 30 e17 26 47 59 21 e9.7 5.6 7.9 438 155 2250 45 25 e16 27 54 41 e21 e9.2 5.1 e8.2 378 146 1780 43 22 e16 28 54 48 e20 e8.9 4.9 e12 292 140 1370 40 27 e15 29 62 57 e19 e8.4 --- e20 244 154 1030 38 28 e15 30 68 60 18 e7.8 --- e41 227 233 781 37 29 e15 31 78 --- e18 e7.6 --- e37 --- 453 --- 37 33 ---
TOTAL 1134 2395 1096 376.3 187.4 257.4 4097 9355 83609 5902 888 1238 MEAN 36.6 79.8 35.4 12.1 6.69 8.30 137 302 2787 190 28.6 41.3 MAX 78 117 55 17 7.7 41 438 634 15800 609 47 102 MIN 21 41 18 7.6 4.9 3.9 22 140 180 37 16 15 AC-FT 2250 4750 2170 746 372 511 8130 18560 165800 11710 1760 2460 CFSM 0.09 0.19 0.08 0.03 0.02 0.02 0.32 0.70 6.48 0.44 0.07 0.10 IN. 0.10 0.21 0.09 0.03 0.02 0.02 0.35 0.81 7.23 0.51 0.08 0.11
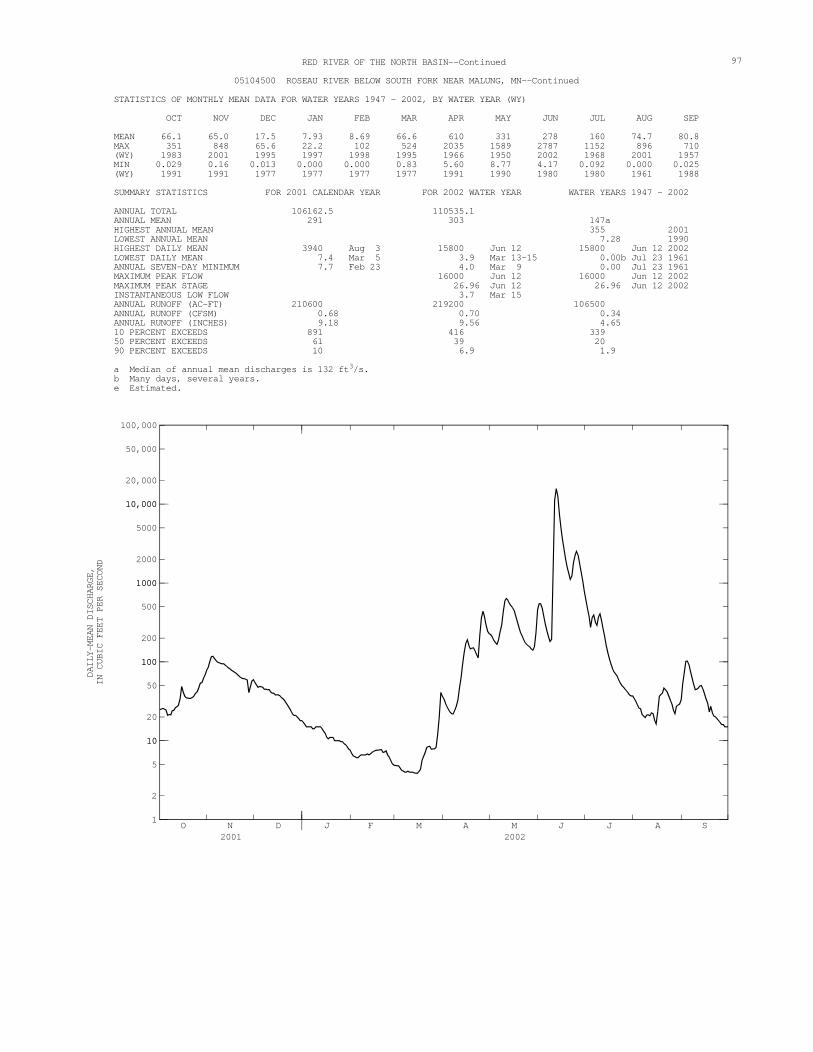
97 RED RIVER OF THE NORTH BASIN--Continued
05104500 ROSEAU RIVER BELOW SOUTH FORK NEAR MALUNG, MN--Continued
STATISTICS OF MONTHLY MEAN DATA FOR WATER YEARS 1947 - 2002, BY WATER YEAR (WY)
OCT NOV DEC JAN FEB MAR APR MAY JUN JUL AUG SEP
MEAN 66.1 65.0 17.5 7.93 8.69 66.6 610 331 278 160 74.7 80.8 MAX 351 848 65.6 22.2 102 524 2035 1589 2787 1152 896 710 (WY) 1983 2001 1995 1997 1998 1995 1966 1950 2002 1968 2001 1957 MIN 0.029 0.16 0.013 0.000 0.000 0.83 5.60 8.77 4.17 0.092 0.000 0.025 (WY) 1991 1991 1977 1977 1977 1977 1991 1990 1980 1980 1961 1988
SUMMARY STATISTICS FOR 2001 CALENDAR YEAR FOR 2002 WATER YEAR WATER YEARS 1947 - 2002 ANNUAL TOTAL 106162.5 110535.1 ANNUAL MEAN 291 303 147a HIGHEST ANNUAL MEAN 355 2001 LOWEST ANNUAL MEAN 7.28 1990 HIGHEST DAILY MEAN 3940 Aug 3 15800 Jun 12 15800 Jun 12 2002 LOWEST DAILY MEAN 7.4 Mar 5 3.9 Mar 13-15 0.00b Jul 23 1961 ANNUAL SEVEN-DAY MINIMUM 7.7 Feb 23 4.0 Mar 9 0.00 Jul 23 1961 MAXIMUM PEAK FLOW 16000 Jun 12 16000 Jun 12 2002 MAXIMUM PEAK STAGE 26.96 Jun 12 26.96 Jun 12 2002 INSTANTANEOUS LOW FLOW 3.7 Mar 15 ANNUAL RUNOFF (AC-FT) 210600 219200 106500 ANNUAL RUNOFF (CFSM) 0.68 0.70 0.34 ANNUAL RUNOFF (INCHES) 9.18 9.56 4.65 10 PERCENT EXCEEDS 891 416 339 50 PERCENT EXCEEDS 61 39 20 90 PERCENT EXCEEDS 10 6.9 1.9 a Median of annual mean discharges is 132 ft3/s. b Many days, several years. e Estimated.
O N D2001
J F M A M J J A S2002
1
2
5
1010
20
50
100100
200
500
10001000
2000
5000
10,00010,000
20,000
50,000
100,000
DAILY-MEAN DISCHARGE,
IN CUBIC FEET PER SECOND

98 RED RIVER OF THE NORTH BASIN--Continued
05106000 SPRAGUE CREEK NEAR SPRAGUE, MANITOBA
LOCATION.--Lat 48°59’33", long 95°39’43", in NE1⁄4 sec. 34, T.164 N., R.39 W., Roseau County, Hydrologic Unit 09020314, on left bank 0.5 mi south of international boundary, 3.5 mi south of Sprague, Manitoba, 8 mi upstream from mouth, and 10.5 mi northeast of Roseau, MN.
DRAINAGE AREA.--176 mi2.
PERIOD OF RECORD.--September 1928 to December 1981, October, 1999 to current year.
REVISED RECORDS.--WSP 1055: 1944. WSP 1308: 1931(M). WDR MN-81-1: Drainage area.
GAGE.--Water-stage recorder and concrete control. Datum of gage is 1,038.40 ft above sea level, 1928 datum, (levels by Geodetic Survey of Canada). Prior to Mar. 15, 1929, nonrecording gage at same site and datum.
REMARKS.--Records good except those for estimated daily discharges, which are poor.
DISCHARGE, CUBIC FEET PER SECOND, WATER YEAR OCTOBER 2001 TO SEPTEMBER 2002 DAILY MEAN VALUES DAY OCT NOV DEC JAN FEB MAR APR MAY JUN JUL AUG SEP 1 10 41 e16 e4.7 e2.0 e1.6 e17 e89 118 229 41 111 2 10 46 e16 e4.6 e1.9 e1.5 e16 e83 106 235 37 109 3 13 44 e15 e4.6 e1.9 e1.5 e14 e78 97 192 33 95 4 12 42 e14 e4.4 e1.8 e1.4 e12 e74 87 153 31 73 5 16 38 e14 e4.3 e1.8 e1.4 e12 e70 76 448 28 60 6 12 37 e14 e4.2 e1.8 e1.4 e10 e88 67 694 24 53 7 11 37 e13 e4.2 e1.8 e1.4 e9.5 e110 62 620 22 47 8 11 37 e13 e4.3 e1.9 e1.4 e10 e130 54 567 23 41 9 11 37 e13 e4.3 e1.9 e1.4 e11 e190 105 426 33 37 10 12 36 e13 e4.3 e1.9 e1.4 e15 e230 2090 320 55 36 11 18 40 e12 e4.0 e1.9 e1.4 e24 e285 e8070 246 65 33 12 15 34 e12 e3.7 e2.0 e1.4 e33 e265 e6940 197 66 30 13 15 31 e12 e3.5 e2.0 e1.4 e49 e255 e4820 171 59 27 14 15 31 e12 e3.4 e2.0 e1.4 e60 e245 e3170 144 50 23 15 23 32 e12 e3.4 e2.1 e1.4 e130 e230 1840 126 42 21 16 18 32 e11 e3.3 e2.1 e1.5 e96 e210 1180 112 38 20 17 15 30 e11 e3.2 e2.2 e1.5 e69 e190 997 103 63 19 18 15 30 e11 e3.2 e2.2 e1.7 e62 e170 838 95 130 19 19 14 27 e10 e3.1 e2.2 e2.0 e64 e155 709 82 124 50 20 15 30 e9.8 e3.1 e2.2 e2.1 e62 e140 698 84 103 71 21 14 26 e9.3 e3.0 e2.1 e2.2 e57 127 553 125 82 56 22 15 23 e8.5 e3.0 e2.1 e2.3 e53 117 485 122 63 54 23 15 23 e7.8 e2.9 e2.0 e2.4 e46 109 600 103 51 51 24 17 24 e7.3 e2.9 e1.9 e2.3 e80 104 595 88 51 45 25 20 24 e6.6 e2.8 e1.8 e2.2 e130 99 600 77 49 45 26 21 e21 e6.2 e2.7 e1.7 e2.1 e180 95 590 69 42 40 27 21 e19 e5.8 e2.6 e1.6 e3.0 e150 89 539 61 38 35 28 22 e18 e5.6 e2.5 e1.6 e5.6 e125 91 434 57 48 34 29 27 e17 e5.4 e2.4 --- e10 e105 117 349 52 77 32 30 28 e17 e5.2 e2.2 --- e20 e97 150 279 48 94 30 31 33 --- e4.9 e2.1 --- e18 --- 140 --- 43 105 ---
TOTAL 514 924 326.4 106.9 54.4 100.3 1798.5 4525 37148 6089 1767 1397 MEAN 16.6 30.8 10.5 3.45 1.94 3.24 60.0 146 1238 196 57.0 46.6 MAX 33 46 16 4.7 2.2 20 180 285 8070 694 130 111 MIN 10 17 4.9 2.1 1.6 1.4 9.5 70 54 43 22 19 AC-FT 1020 1830 647 212 108 199 3570 8980 73680 12080 3500 2770 CFSM 0.09 0.17 0.06 0.02 0.01 0.02 0.34 0.83 7.04 1.12 0.32 0.26 IN. 0.11 0.20 0.07 0.02 0.01 0.02 0.38 0.96 7.85 1.29 0.37 0.30

99 RED RIVER OF THE NORTH BASIN--Continued
05106000 SPRAGUE CREEK NEAR SPRAGUE, MANITOBA--Continued
STATISTICS OF MONTHLY MEAN DATA FOR WATER YEARS 1929 - 2002, BY WATER YEAR (WY)
OCT NOV DEC JAN FEB MAR APR MAY JUN JUL AUG SEP
MEAN 34.2 30.5 5.68 2.20 1.83 16.5 175 162 127 51.5 26.6 41.3 MAX 259 460 30.1 10.3 7.32 193 633 709 1238 315 160 419 (WY) 1942 2001 2001 1966 2000 1945 1966 1950 2002 1937 1968 1941 MIN 0.95 1.10 0.20 0.23 0.13 0.53 7.16 2.21 0.11 0.032 0.094 0.39 (WY) 1953 1977 1977 1977 1977 1964 1981 1980 1980 1980 1961 1934
SUMMARY STATISTICS FOR 2001 CALENDAR YEAR FOR 2002 WATER YEAR WATER YEARS 1929 - 2002 ANNUAL TOTAL 33207.8 54750.5 ANNUAL MEAN 91.0 150 60.6 HIGHEST ANNUAL MEAN 150 2002 LOWEST ANNUAL MEAN 4.07 1980 HIGHEST DAILY MEAN 617 Apr 12 8070e Jun 11 8070e Jun 11 2002 LOWEST DAILY MEAN 4.0 Feb 23 1.4 Mar 4-15 0.00a Apr 1 1930 ANNUAL SEVEN-DAY MINIMUM 4.1 Feb 21 1.4 Mar 4 0.00 Aug 7 1936 MAXIMUM PEAK FLOW 8440e Jun 11 8440be Jun 11 2002 MAXIMUM PEAK STAGE 17.08 Jun 11 17.08 Jun 11 2002 ANNUAL RUNOFF (AC-FT) 65870 108600 43910 ANNUAL RUNOFF (CFSM) 0.52 0.85 0.34 ANNUAL RUNOFF (INCHES) 7.02 11.57 4.68 10 PERCENT EXCEEDS 325 218 170 50 PERCENT EXCEEDS 18 28 8.9 90 PERCENT EXCEEDS 5.2 2.0 1.1 a Many days, several years. b From rating curve extended above 2,560 ft3/s. e Estimated.
O N D2001
J F M A M J J A S2002
1
2
5
1010
20
50
100100
200
500
10001000
2000
5000
10,000
DAILY-MEAN DISCHARGE,
IN CUBIC FEET PER SECOND

100 RED RIVER OF THE NORTH BASIN--Continued
05107500 ROSEAU RIVER AT ROSS, MN
LOCATION.--Lat 48°54’37", long 95°55’18", in NE1⁄4SE1⁄4 sec. 27, T. 163 N., R. 41 W., Roseau County, Hydrologic Unit 09020314,
on left bank 300 ft downstream from State Highway 89 bridge, 0.2 mi. north of Ross, and 2.3 mi downstream from Pine Creek.
DRAINAGE AREA.--1,090 mi2.
PERIOD OF RECORD.--July 1928 to September 1991, April 1995 to current year.
REVISED RECORDS.--WSP 1055: 1945. WSP 1175: Drainage area. WSP 1308: 1936(m). WSP 1508: 1848-49(P).
GAGE.--Water-stage recorder. Datum of gage is 1,018.61 ft above sea level (NGVD of 1929, levels by Geodetic Survey of Canada). Prior to Mar. 13, 1929, nonrecording gage at same site and datum.
REMARKS.--Records good except those for estimated daily discharges, which are poor. High flow affected by natural storage in Roseau Lake.
EXTREMES OUTSIDE PERIOD OF RECORD.--Maximum stage known, about 19 ft in 1896. Other floods reached the following stages, from information by local residents: flood of July 1919, 17.5 ft; flood of 1927, about 16 ft.
DISCHARGE, CUBIC FEET PER SECOND, WATER YEAR OCTOBER 2001 TO SEPTEMBER 2002 DAILY MEAN VALUES DAY OCT NOV DEC JAN FEB MAR APR MAY JUN JUL AUG SEP 1 47 163 e110 e33 e15 e10 e115 461 614 4490 765 286 2 46 195 e106 e33 e14 e9.8 e100 423 634 4150 672 340 3 49 213 e103 e33 e13 e9.7 e90 385 608 3830 588 327 4 50 220 e100 e32 e13 e9.3 e80 356 569 3610 506 295 5 50 214 e98 e32 e13 e8.8 e75 346 522 3550 440 258 6 52 202 e95 e31 e13 e8.3 e69 377 471 3270 366 224 7 47 189 e93 e30 e13 e8.1 e66 444 415 3110 305 193 8 43 181 e91 e30 e13 e8.0 e64 488 351 2910 261 165 9 45 180 e89 e30 e13 e8.0 e64 614 352 2800 317 143 10 48 174 e87 e31 e13 e8.0 e74 895 1100 2720 332 129 11 51 170 e86 e32 e14 e8.0 e92 946 1800 2600 325 121 12 57 171 e84 e30 e14 e8.0 e240 918 2750 2500 282 113 13 63 163 e82 e28 e14 e8.1 432 885 5320 2420 210 108 14 66 158 e81 e26 e14 e8.2 524 841 7360 2340 158 102 15 72 155 e80 e24 e15 e8.3 531 803 9010 2260 130 93 16 92 149 e78 e24 e15 e8.4 451 783 10100 2180 113 83 17 90 144 e77 e23 e16 e8.6 401 761 10100 2100 204 74 18 80 140 e74 e23 e16 e8.8 373 727 9470 2000 389 69 19 73 135 e70 e22 e15 e9.3 321 688 8670 1910 372 134 20 70 125 e65 e22 e15 e11 283 642 7790 1840 309 173 21 72 126 e60 e22 e15 e13 256 593 7160 1790 251 160 22 73 125 e56 e21 e15 e14 227 550 6520 1700 202 140 23 71 120 e52 e21 e14 e15 203 513 6260 1610 170 129 24 75 120 e47 e20 e14 e16 310 485 6080 1520 187 117 25 80 118 e44 e20 e13 e18 636 455 5940 1430 173 107 26 89 105 e41 e19 e12 e19 641 432 5780 1330 145 100 27 94 e89 e39 e19 e11 e20 597 412 5620 1240 120 92 28 101 e96 e38 e18 e11 e23 558 391 5390 1150 166 83 29 108 e113 e36 e18 --- e26 517 411 5100 1070 244 78 30 122 e117 e35 e17 --- e31 495 465 4720 983 236 72 31 136 --- e34 e16 --- e54 --- 550 --- 881 228 ---
TOTAL 2212 4570 2231 780 386 423.7 8885 18040 136576 71294 9166 4508 MEAN 71.4 152 72.0 25.2 13.8 13.7 296 582 4553 2300 296 150 MAX 136 220 110 33 16 54 641 946 10100 4490 765 340 MIN 43 89 34 16 11 8.0 64 346 351 881 113 69 AC-FT 4390 9060 4430 1550 766 840 17620 35780 270900 141400 18180 8940 CFSM 0.07 0.14 0.07 0.02 0.01 0.01 0.27 0.53 4.18 2.11 0.27 0.14 IN. 0.08 0.16 0.08 0.03 0.01 0.01 0.30 0.62 4.66 2.43 0.31 0.15

101 RED RIVER OF THE NORTH BASIN--Continued
05107500 ROSEAU RIVER AT ROSS, MN--Continued
STATISTICS OF MONTHLY MEAN DATA FOR WATER YEARS 1928 - 2002, BY WATER YEAR (WY)
OCT NOV DEC JAN FEB MAR APR MAY JUN JUL AUG SEP
MEAN 134 120 37.6 16.5 14.6 85.1 883 922 574 336 139 132 MAX 974 1926 395 66.5 99.2 551 3234 4583 4553 2300 1352 1041 (WY) 1942 2001 2001 1997 1998 1946 1966 1950 2002 2002 1968 1968 MIN 1.91 1.63 0.27 0.001 0.000 2.76 32.1 29.5 6.83 1.39 0.84 0.38 (WY) 1991 1977 1977 1977 1977 1989 1991 1988 1980 1980 1961 1990
SUMMARY STATISTICS FOR 2001 CALENDAR YEAR FOR 2002 WATER YEAR WATER YEARS 1928 - 2002 ANNUAL TOTAL 207251 259071.7 ANNUAL MEAN 568 710 284a HIGHEST ANNUAL MEAN 753 2001 LOWEST ANNUAL MEAN 28.9 1934 HIGHEST DAILY MEAN 2640 Apr 18 10100 Jun 16,17 10100 Jun 16 2002 LOWEST DAILY MEAN 20 Mar 1 8.0 Mar 8-12 0.00b Aug 29 1961 ANNUAL SEVEN-DAY MINIMUM 20 Mar 1 8.0 Mar 7 0.00 Jan 3 1977 MAXIMUM PEAK FLOW 10500 Jun 16 10500 Jun 16 2002 MAXIMUM PEAK STAGE 18.89 Jun 16 18.89 Jun 16 2002 ANNUAL RUNOFF (AC-FT) 411100 513900 205500 ANNUAL RUNOFF (CFSM) 0.52 0.65 0.26 ANNUAL RUNOFF (INCHES) 7.07 8.84 3.54 10 PERCENT EXCEEDS 1740 2040 907 50 PERCENT EXCEEDS 132 120 41 90 PERCENT EXCEEDS 26 14 6.0 a Median of annual mean discharges is 239 ft3/s. b Many days, several years. e Estimated.
O N D2001
J F M A M J J A S2002
1
2
5
1010
20
50
100100
200
500
10001000
2000
5000
10,00010,000
20,000
50,000
100,000
DAILY-MEAN DISCHARGE,
IN CUBIC FEET PER SECOND

102 RED RIVER OF THE NORTH BASIN--Continued
05112000 ROSEAU RIVER BELOW STATE DITCH 51, NEAR CARIBOU, MN
LOCATION.--Lat 48°58’54", long 96°27’46", in SE1⁄4SW1⁄4 sec. 34, T.164 N., R.45 W., Kittson County, Hydrologic Unit 09020314, on
left bank 400 ft downstream from State ditch 51 (known locally as Caribou cutoff ditch) and 0.6 mi west of Caribou.
DRAINAGE AREA.--1,420 mi2.
PERIOD OF RECORD.--April to October 1917, April 1920 to current year (no winter records in water years 1931, 1932, 1934-36, 1938-40, 1944-72). Published as "at Caribou," prior to April 1929; as "below Cutoff ditch, near Caribou April 1929 to September 1936. Records published for both sites April 1929 to September 1930. Monthly discharge only for some periods, published in WSP 1308.
REVISED RECORDS.--WSP 1308: 1938(M). WSP 1508: 1917(M), 1920, 1932(M), 1934-35(M). WSP 1913: 1954(M).
GAGE.--Water-stage recorder. Datum of gage is 1,002.31 ft above sea level (NGVD of 1929, levels by Geodetic Survey of Canada). Prior to Apr. 1, 1929, nonrecording gage at site at Caribou 0.6 mi upstream at datum 0.95 ft lower.
REMARKS.--Records good except those for estimated daily discharges, which are poor. Some regulation from wildlife management impoundments several miles upstream of gage. Occasionally, at high stages, there is some natural diversion of flow above station to headwaters of Two Rivers.
COOPERATION.--Red Lake Watershed Management Board.
EXTREMES OUTSIDE PERIOD OF RECORD.--Flood of 1916 is reported to have reached a stage of about 15.5 ft at former site.
DISCHARGE, CUBIC FEET PER SECOND, WATER YEAR OCTOBER 2001 TO SEPTEMBER 2002 DAILY MEAN VALUES DAY OCT NOV DEC JAN FEB MAR APR MAY JUN JUL AUG SEP 1 60 211 e125 e41 e21 e15 e60 545 583 3990 2000 356 2 51 231 e120 e40 e20 e14 e150 504 650 3940 1890 383 3 47 278 e116 e39 e19 e13 e135 490 688 3860 1790 406 4 46 281 e112 e38 e18 e13 e120 469 686 3790 1670 395 5 48 265 e110 e37 e18 e12 e110 447 655 3770 1520 367 6 52 249 e108 e37 e18 e12 e100 438 607 3750 1320 329 7 58 234 e107 e36 e17 e11 e93 491 547 3710 1050 292 8 61 216 e104 e36 e17 e11 e87 576 486 3670 823 258 9 56 204 e102 e35 e17 e11 e84 648 453 3590 874 229 10 56 198 e100 e35 e17 e11 e87 783 1210 3520 885 200 11 58 192 e98 e36 e17 e11 e91 942 2420 3440 799 164 12 59 186 e97 e38 e17 e10 e120 1010 2120 3360 714 147 13 62 182 e96 e37 e17 e10 e200 1040 2000 3270 608 136 14 71 168 e95 e35 e18 e11 e340 1050 1950 3190 427 127 15 79 162 e93 e32 e18 e11 e460 1050 2010 3100 322 120 16 83 163 e92 e31 e19 e11 e480 1040 2150 3020 281 109 17 94 159 e91 e30 e19 e11 461 1010 2370 2950 360 100 18 103 155 e90 e29 e20 e11 437 991 2740 2880 529 93 19 96 150 e88 e29 e20 e12 394 959 3090 2820 595 116 20 92 144 e85 e29 e20 e12 345 919 3400 2800 551 237 21 88 147 e81 e28 e20 e13 302 859 3650 2820 458 260 22 201 142 e77 e28 e20 e16 265 794 3910 2760 362 233 23 223 137 e73 e28 e20 e18 231 732 4160 2690 288 199 24 223 133 e67 e27 e19 e20 221 678 4280 2610 271 174 25 220 131 e62 e26 e18 e21 332 598 4320 2540 290 175 26 215 e90 e58 e26 e18 e23 596 527 4270 2470 258 163 27 208 e51 e53 e25 e17 e24 665 492 4200 2390 216 152 28 198 e70 e50 e25 e16 e26 653 467 4160 2310 214 141 29 200 e125 e47 e24 --- e29 619 451 4110 2220 308 124 30 195 e130 e45 e23 --- e33 579 462 4050 2160 356 104 31 200 --- e43 e22 --- e40 --- 507 --- 2080 343 ---
TOTAL 3503 5184 2685 982 515 496 8817 21969 71925 95470 22372 6289 MEAN 113 173 86.6 31.7 18.4 16.0 294 709 2398 3080 722 210 MAX 223 281 125 41 21 40 665 1050 4320 3990 2000 406 MIN 46 51 43 22 16 10 60 438 453 2080 214 93 AC-FT 6950 10280 5330 1950 1020 984 17490 43580 142700 189400 44370 12470 CFSM 0.08 0.12 0.06 0.02 0.01 0.01 0.21 0.50 1.69 2.17 0.51 0.15 IN. 0.09 0.14 0.07 0.03 0.01 0.01 0.23 0.58 1.88 2.50 0.59 0.16

103 RED RIVER OF THE NORTH BASIN--Continued
05112000 ROSEAU RIVER BELOW STATE DITCH 51, NEAR CARIBOU, MN--Continued
STATISTICS OF MONTHLY MEAN DATA FOR WATER YEARS 1917 - 2002, BY WATER YEAR (WY)
OCT NOV DEC JAN FEB MAR APR MAY JUN JUL AUG SEP
MEAN 173 172 71.2 27.7 23.3 131 834 973 649 460 179 181 MAX 1302 2022 813 134 75.4 793 2168 3029 2588 3080 1582 1451 (WY) 1942 2001 2001 1927 1997 1995 1966 1950 1970 2002 1993 1968 MIN 0.12 0.26 0.53 0.090 0.060 1.57 38.2 26.9 6.70 0.65 2.09 0.30 (WY) 1991 1991 1991 1991 1991 1989 1981 1988 1980 1980 1936 1990
SUMMARY STATISTICS FOR 2001 CALENDAR YEAR FOR 2002 WATER YEAR WATER YEARS 1917 - 2002 ANNUAL TOTAL 255925 240207 ANNUAL MEAN 701 658 341 HIGHEST ANNUAL MEAN 933 2001 LOWEST ANNUAL MEAN 35.9 1977 HIGHEST DAILY MEAN 2870 Apr 15 4320 Jun 25 4320 Jun 25 2002 LOWEST DAILY MEAN 25 Mar 1 10 Mar 12 0.00 Sep 15-17 1990 ANNUAL SEVEN-DAY MINIMUM 25 Mar 1 11 Mar 7 0.04 Sep 12 1990 MAXIMUM PEAK FLOW 4320 Jun 24 4320 Jun 24 2002 MAXIMUM PEAK STAGE 11.91 Jun 24 11.91 Jun 24 2002 INSTANTANEOUS LOW FLOW 0.00a Aug 13 1936 ANNUAL RUNOFF (AC-FT) 507600 476500 247200 ANNUAL RUNOFF (CFSM) 0.49 0.46 0.24 ANNUAL RUNOFF (INCHES) 6.70 6.29 3.26 10 PERCENT EXCEEDS 2020 2640 1180 50 PERCENT EXCEEDS 190 163 66 90 PERCENT EXCEEDS 31 18 8.5 a many days, several years. e Estimated.
O N D2001
J F M A M J J A S2002
10
20
50
100100
200
500
10001000
2000
5000
10,000
DAILY-MEAN DISCHARGE,
IN CUBIC FEET PER SECOND

104 RAINY RIVER BASIN
05124480 KAWISHIWI RIVER NEAR ELY, MN
LOCATION.--Lat 47°55’22", long 91°32’06", in SE1⁄4SE1⁄4 sec. 24, T.63 N., R.10 W., Lake County, Hydrologic Unit 09030001, in
Superior National Forest, on left bank 100 ft upstream from rapids, 2 mi upstream from South Kawishiwi River, 2.2 mi southwest of Fernberg Lookout Tower and 14 mi east of Ely.
DRAINAGE AREA.--254 mi2.
PERIOD OF RECORD.--June 1966 to current year.
GAGE.--Water-stage recorder. Elevation of gage is 1,450 ft above sea level, from topographic map.
REMARKS.--Records good.
DISCHARGE, CUBIC FEET PER SECOND, WATER YEAR OCTOBER 2001 TO SEPTEMBER 2002 DAILY MEAN VALUES DAY OCT NOV DEC JAN FEB MAR APR MAY JUN JUL AUG SEP 1 96 91 149 189 113 73 56 208 206 166 117 93 2 94 92 151 186 111 72 56 213 196 157 128 90 3 90 92 153 184 109 70 55 219 188 147 129 84 4 86 93 154 181 108 69 54 228 181 138 126 78 5 84 93 158 177 105 68 53 241 174 136 120 75 6 82 92 162 176 103 67 53 248 169 134 113 73 7 79 93 164 172 101 66 53 252 163 132 105 70 8 79 96 167 169 100 69 53 256 157 140 99 68 9 81 96 169 167 98 76 53 265 152 135 93 65 10 88 96 170 165 97 76 53 271 146 129 95 67 11 92 97 172 162 96 73 55 273 163 122 98 65 12 89 98 173 160 94 71 57 277 165 115 96 62 13 88 99 175 157 92 70 62 276 177 110 92 60 14 89 99 175 154 90 68 76 276 190 106 85 57 15 86 99 176 152 89 66 92 276 192 103 88 54 16 85 99 179 149 87 65 106 272 187 97 91 52 17 82 99 181 146 85 64 119 268 180 93 94 51 18 81 102 182 144 84 63 134 263 168 87 91 50 19 79 104 183 142 83 64 150 257 168 83 88 55 20 77 103 183 140 85 63 159 252 172 81 84 56 21 75 103 183 138 83 63 166 248 163 80 83 54 22 75 102 186 136 81 62 173 243 158 79 80 50 23 80 103 202 133 80 61 180 239 167 75 78 49 24 80 109 201 130 78 59 185 232 178 72 75 47 25 85 125 199 129 77 58 187 229 187 72 72 45 26 88 129 199 126 76 58 188 226 190 73 70 44 27 85 133 199 124 75 57 192 222 187 76 67 43 28 83 138 197 122 74 58 196 217 184 91 64 43 29 82 141 196 120 --- 59 201 215 179 87 64 44 30 83 145 194 118 --- 59 205 217 174 84 89 44 31 89 --- 191 116 --- 58 --- 215 --- 81 97 ---
TOTAL 2612 3161 5523 4664 2554 2025 3422 7594 5261 3281 2871 1788 MEAN 84.3 105 178 150 91.2 65.3 114 245 175 106 92.6 59.6 MAX 96 145 202 189 113 76 205 277 206 166 129 93 MIN 75 91 149 116 74 57 53 208 146 72 64 43 AC-FT 5180 6270 10950 9250 5070 4020 6790 15060 10440 6510 5690 3550 CFSM 0.33 0.41 0.70 0.59 0.36 0.26 0.45 0.96 0.69 0.42 0.36 0.23 IN. 0.38 0.46 0.81 0.68 0.37 0.30 0.50 1.11 0.77 0.48 0.42 0.26

105 RAINY RIVER BASIN
05124480 KAWISHIWI RIVER NEAR ELY, MN--Continued
STATISTICS OF MONTHLY MEAN DATA FOR WATER YEARS 1966 - 2002, BY WATER YEAR (WY)
OCT NOV DEC JAN FEB MAR APR MAY JUN JUL AUG SEP
MEAN 150 161 136 94.2 68.3 56.9 242 646 369 208 146 135 MAX 881 684 345 163 107 85.2 785 1133 1070 523 758 698 (WY) 1978 1971 1983 1984 1971 1969 1976 1979 1970 1999 1988 1988 MIN 12.1 9.43 7.25 5.32 4.77 5.87 8.95 13.3 115 65.1 36.0 18.5 (WY) 1977 1977 1977 1977 1977 1977 1977 1977 1977 1998 1998 1976
SUMMARY STATISTICS FOR 2001 CALENDAR YEAR FOR 2002 WATER YEAR WATER YEARS 1966 - 2002 ANNUAL TOTAL 95429 44756 ANNUAL MEAN 261 123 202 HIGHEST ANNUAL MEAN 313 1971 LOWEST ANNUAL MEAN 81.3 1998 HIGHEST DAILY MEAN 1850 May 3 277 May 12 1850 May 3 2001 LOWEST DAILY MEAN 52 Mar 29 43 Sep 27,28 4.5a Jan 31 1977 ANNUAL SEVEN-DAY MINIMUM 53 Mar 28 44 Sep 24 4.6 Jan 29 1977 MAXIMUM PEAK FLOW 280 May 15 1870 May 4 2001 MAXIMUM PEAK STAGE 4.02 May 15 6.07 May 4 2001 INSTANTANEOUS LOW FLOW 42 Sep 27 4.5 Jan 30 1977 ANNUAL RUNOFF (AC-FT) 189300 88770 146300 ANNUAL RUNOFF (CFSM) 1.03 0.48 0.80 ANNUAL RUNOFF (INCHES) 13.98 6.55 10.81 10 PERCENT EXCEEDS 619 200 495 50 PERCENT EXCEEDS 136 99 109 90 PERCENT EXCEEDS 66 59 37 a Occurred Jan. 31 to Feb. 2, 1977.
O N D2001
J F M A M J J A S2002
10
20
50
100100
200
500
1000
DAILY-MEAN DISCHARGE,
IN CUBIC FEET PER SECOND

106 RAINY RIVER BASIN--Continued
05127000 KAWISHIWI RIVER NEAR WINTON, MN
LOCATION.--Lat 47°56’05", long 91°45’50", in NE1⁄4NW1⁄4 sec. 20, T.63 N., R.11 W., Lake County, Hydrologic Unit 09030001,
Superior National Forest, at power plant of Minnesota Power Co., just upstream from Fall Lake, and 1.8 mi east of Winton.
DRAINAGE AREA.--1,230 mi2.
PERIOD OF RECORD.--June 1905 to June 1907, October 1912 to September 1919 (fragmentary), September 1923 to current year. Monthly discharge only for some periods, published in WSP 1308.
REVISED RECORDS.--WDR MN-77-1: Drainage area.
REMARKS.--No estimated daily discharges. Records fair. Daily discharge computed from power plant records. Flow regulated by power plant and by Camp Six, Bald Eagle, Gabbro, Little Gabbro, Birch, White Iron, South Farm, and Garden Lakes.
COOPERATION.--Records collected by Minnesota Power Co., under general supervision of the Geological Survey, in connection with a Federal Energy Regulatory Commission project.
DISCHARGE, CUBIC FEET PER SECOND, WATER YEAR OCTOBER 2001 TO SEPTEMBER 2002 DAILY MEAN VALUES DAY OCT NOV DEC JAN FEB MAR APR MAY JUN JUL AUG SEP 1 355 889 1060 840 459 400 448 1780 442 1140 1000 452 2 345 889 1060 801 459 400 449 1830 442 1150 1280 452 3 118 889 1060 750 459 400 448 1570 670 1150 1280 452 4 141 889 1040 731 459 400 448 1390 798 1150 985 452 5 206 889 955 682 459 392 448 1390 839 984 850 453 6 206 889 883 620 352 332 448 1250 879 819 663 453 7 206 839 888 656 386 329 448 1140 878 700 581 453 8 300 742 891 656 386 329 447 1150 808 755 512 453 9 432 570 890 657 386 329 447 1260 636 769 539 452 10 433 534 890 656 385 329 447 1400 298 797 605 452 11 451 534 890 656 385 329 447 1540 400 772 512 452 12 391 716 890 655 385 373 447 1630 846 608 213 452 13 267 933 889 655 385 414 446 1620 1130 555 217 452 14 253 949 889 655 385 443 447 1420 1140 498 283 452 15 337 950 889 655 385 443 415 1270 1080 228 594 445 16 352 951 889 655 384 341 217 1270 877 173 795 295 17 345 951 889 639 384 223 119 1270 874 237 876 117 18 285 951 889 555 385 148 119 1280 850 219 839 117 19 253 941 889 555 386 332 119 1280 770 116 613 315 20 262 955 889 555 394 372 312 1260 788 286 458 405 21 280 785 881 555 406 413 399 1370 795 432 435 392 22 296 620 837 556 406 421 419 1520 795 238 400 354 23 338 620 838 555 406 421 718 1520 1270 117 400 243 24 412 578 840 555 406 290 883 1310 1270 117 400 116 25 441 811 840 555 406 257 1150 1160 1260 204 400 119 26 443 1060 840 494 406 257 1250 1150 1260 345 400 158 27 675 1060 840 483 406 257 1150 467 1260 371 400 120 28 889 1060 840 483 404 262 1150 280 1150 444 404 120 29 889 1060 840 472 --- 388 1380 384 1140 444 328 120 30 889 1060 840 459 --- 431 1710 434 1140 637 352 223 31 889 --- 830 459 --- 443 --- 442 --- 797 452 ---
TOTAL 12379 25564 27775 18910 11294 10898 17775 38037 26785 17252 18066 9991 MEAN 399 852 896 610 403 352 592 1227 893 557 583 333 MAX 889 1060 1060 840 459 443 1710 1830 1270 1150 1280 453 MIN 118 534 830 459 352 148 119 280 298 116 213 116 AC-FT 24550 50710 55090 37510 22400 21620 35260 75450 53130 34220 35830 19820 CFSM 0.32 0.69 0.73 0.50 0.33 0.29 0.48 1.00 0.73 0.45 0.47 0.27 IN. 0.37 0.77 0.84 0.57 0.34 0.33 0.54 1.15 0.81 0.52 0.55 0.30
+ 47.7 16.2 -68.9 -178 -164 -127 542 -2.81 8.82 -24.3 24.3 -25.1MEAN ‡ 447 868 827 432 239 225 1134 1224 902 532 607 308CFSM ‡ 0.36 0.71 0.67 0.35 0.19 0.18 0.92 1.00 0.73 0.43 0.49 0.25 IN ‡ 0.42 0.79 0.77 0.40 0.20 0.21 1.03 1.15 0.81 0.50 0.56 0.2
CAL. YR. 01 TOTAL 498321 MEAN 1365 MAX 8940 MIN 116 MEAN ‡ 1382 CFSM ‡ 1.12 IN ‡ 15.26 WTR. YR 02 TOTAL 234726 MEAN 634 MAX 1830 MIN 116 MEAN ‡ 647 CFSM ‡ 0.53 IN ‡ 7.14

107 RAINY RIVER BASIN--Continued
05127000 KAWISHIWI RIVER NEAR WINTON, MN--Continued
STATISTICS OF MONTHLY MEAN DATA FOR WATER YEARS 1905 - 2002, BY WATER YEAR (WY)
OCT NOV DEC JAN FEB MAR APR MAY JUN JUL AUG SEP
MEAN 887 765 600 456 350 378 1221 3109 1898 1164 694 732 MAX 4277 3572 1422 862 770 844 5020 9278 5661 3382 3775 3149 (WY) 1947 1971 1983 1978 1927 1945 1945 1950 1968 1999 1988 1928 MIN 66.5 8.97 76.1 80.3 74.5 103 19.3 111 519 217 51.7 38.1 (WY) 1924 1924 1977 1977 1977 1924 1924 1924 1980 1961 1919 1919
SUMMARY STATISTICS FOR 2001 CALENDAR YEAR FOR 2002 WATER YEAR WATER YEARS 1905 - 2002 ANNUAL TOTAL 498321 234726 ANNUAL MEAN 1365 643 1031 HIGHEST ANNUAL MEAN 1967 1950 LOWEST ANNUAL MEAN 240 1924 HIGHEST DAILY MEAN 8940 May 4 1830 May 2 16000 May 18 1950 LOWEST DAILY MEAN 116 Jul 14 116 Jul 19 0.00a Aug 24 1905 ANNUAL SEVEN-DAY MINIMUM 217 Oct 2 139 Sep 24 0.00 Oct 13 1923 ANNUAL RUNOFF (AC-FT) 988400 465600 747300 ANNUAL RUNOFF (CFSM) 1.11 0.52 0.84 ANNUAL RUNOFF (INCHES) 15.07 7.10 11.39 10 PERCENT EXCEEDS 3950 1150 2440 50 PERCENT EXCEEDS 655 498 603 90 PERCENT EXCEEDS 304 257 201 + Change in contents, equivalent in cubic feet per second, in Camp Six, Bald Eagle, Gabbro, Little Gabbro, Birch, White Iron, Farm, South Farm, and Garden Lakes. ‡ Adjusted for change in reservoir contents. a Many days, several years.
O N D2001
J F M A M J J A S2002
100
200
500
10001000
2000
5000
10,000
DAILY-MEAN DISCHARGE,
IN CUBIC FEET PER SECOND

108
RAINY RIVER BASIN--Continued
05127500 BASSWOOD RIVER NEAR WINTON, MN (International Gaging Station)
LOCATION.--Lat 48°04’57", long 91°39’09", in SE1⁄4SE1⁄4 sec. 30, T.65 N., R.10 W., Lake County, Hydrologic Unit 09030001, in
Superior National Forest, on island in Jackfish Bay of Basswood Lake, used to determine discharge at outlet (lat 48°06’21", long 91°38’51", in sec. 19, T.65 N., R.10 W., on international boundary 14 mi northeast of Winton).
DRAINAGE AREA.--1,740 mi2, approximately, (above outlet of Basswood Lake).
PERIOD OF RECORD.--March to June 1924, September 1925 to March 1928, January 1930 to current year. Monthly discharge only for some periods, published in WSP 1308.
REVISED RECORDS.--WSP 955: Drainage area. WSP 1145: 1935, 1937.
GAGE.--Water-stage recorder. Datum of gage is 1,296.80 ft above sea level (NGVD of 1928, levels by Geodetic Survey of Canada). Prior to Oct. 27, 1938, nonrecording gages at several sites in vicinity of gage, at datum 3.0 ft higher. Oct. 28, 1938 to Sept. 30, 1966, water-stage recorder at datum 3.0 ft higher.
REMARKS.--Records good. Some regulation by power plant on Kawishiwi River at Winton, and by many lakes located upstream from station.
COOPERATION.--This station is one of the international gaging stations maintained by the United States under agreement with Canada.
DISCHARGE, in CFS, WATER YEAR OCTOBER 2001 TO SEPTEMBER 2002 DAILY MEAN VALUES DAY OCT NOV DEC JAN FEB MAR APR MAY JUN JUL AUG SEP 1 850 850 1250 1300 888 642 578 1160 1370 1570 638 604 2 835 861 1280 1300 879 637 576 1230 1310 1530 642 604 3 802 888 1290 1290 860 634 576 1330 1250 1500 668 586 4 763 908 1300 1270 853 634 581 1390 1200 1470 681 586 5 740 938 1330 1250 843 625 584 1460 1170 1500 704 584 6 716 949 1330 1240 829 619 587 1510 1160 1520 710 576 7 697 976 1350 1220 813 617 588 1530 1140 1490 707 569 8 684 986 1340 1200 804 634 589 1540 1120 1460 702 566 9 681 999 1340 1180 792 664 593 1560 1130 1420 687 552 10 718 991 1330 1170 780 676 596 1580 1100 1380 695 568 11 738 988 1340 1160 773 671 600 1600 1150 1320 703 563 12 738 979 1320 1150 752 669 610 1620 1130 1280 707 545 13 743 978 1320 1140 748 656 626 1650 1170 1240 690 536 14 744 978 1320 1110 738 652 659 1690 1180 1200 668 515 15 737 988 1320 1110 728 646 695 1720 1200 1170 667 504 16 730 1010 1310 1090 714 644 731 1700 1200 1100 668 490 17 720 1020 1300 1070 711 640 767 1680 1210 1050 675 481 18 708 1030 1300 1070 703 633 791 1660 1210 992 676 470 19 699 1040 1300 1060 695 621 814 1650 1230 927 685 499 20 681 1060 1300 1050 690 612 821 1630 1240 873 689 500 21 671 1060 1300 1040 679 605 820 1630 1240 844 681 472 22 668 1060 1300 1020 675 601 821 1620 1250 811 674 451 23 695 1050 1360 1010 671 600 827 1620 1350 776 663 444 24 698 1090 1360 998 665 598 846 1630 1420 740 644 432 25 697 1140 1350 986 656 593 870 1630 1480 703 632 413 26 723 1160 1350 976 652 585 900 1610 1540 668 621 401 27 738 1190 1350 963 648 578 956 1590 1560 666 604 384 28 737 1200 1340 947 644 584 996 1550 1580 686 579 383 29 748 1210 1330 938 --- 585 1040 1520 1590 665 571 378 30 784 1240 1320 921 --- 578 1090 1480 1580 652 616 367 31 822 --- 1310 900 --- 576 --- 1420 --- 644 620 ---
TOTAL 22705 30817 40940 34129 20883 19309 22128 48190 38460 33847 20567 15023 MEAN 732.4 1027 1321 1101 745.8 622.9 737.6 1555 1282 1092 663.5 500.8 MAX 850 1240 1360 1300 888 676 1090 1720 1590 1570 710 604 MIN 668 850 1250 900 644 576 576 1160 1100 644 571 367 AC-FT 45040 61130 81200 67690 41420 38300 43890 95580 76290 67140 40790 29800 CFSM 0.42 0.59 0.76 0.63 0.43 0.36 0.42 0.89 0.74 0.63 0.38 0.29 IN. 0.49 0.66 0.88 0.73 0.45 0.41 0.47 1.03 0.82 0.72 0.44 0.32

109
RAINY RIVER BASIN--Continued
05127500 BASSWOOD RIVER NEAR WINTON, MN--Continued (International Gaging Station)
STATISTICS OF MONTHLY MEAN DATA FOR WATER YEARS 1931 - 2002, BY WATER YEAR (WY)
OCT NOV DEC JAN FEB MAR APR MAY JUN JUL AUG SEP
MEAN 1080 1020 889.8 736.1 601.7 573.1 1235 3721 2826 1828 1134 984.3 MAX 5320 3879 2510 1475 1229 1143 5069 9114 7332 4453 3487 5034 (WY) 1978 1971 1983 1966 1966 1966 1945 1950 1950 1944 1944 1988 MIN 65.1 60.2 76.2 86.2 95.0 135 269 225 696 512 278 120 (WY) 1977 1977 1977 1977 1977 1977 1977 1977 1980 1980 1998 1976
SUMMARY STATISTICS FOR 2001 CALENDAR YEAR FOR 2002 WATER YEAR WATER YEARS 1931 - 2002 ANNUAL TOTAL 717503 346998 ANNUAL MEAN 1966 950.7 1398 HIGHEST ANNUAL MEAN 2643 1950 LOWEST ANNUAL MEAN 557 1958 HIGHEST DAILY MEAN 8950 May 9 1720 May 15 15200 May 24 1950 LOWEST DAILY MEAN 448 Mar 29 367 Sep 30 58 Nov 3 1976 ANNUAL SEVEN-DAY MINIMUM 452 Mar 25 394 Sep 24 58 Nov 7 1976 MAXIMUM PEAK FLOW 1730 May 15 15600 May 24 1950 MAXIMUM PEAK STAGE 3.99 May 15 9.94a May 24 1950 INSTANTANEOUS LOW FLOW 360b Sep 30 55 Nov 18 1976 ANNUAL RUNOFF (AC-FT) 1423000 688300 1013000 ANNUAL RUNOFF (CFSM) 1.13 0.55 0.80 ANNUAL RUNOFF (INCHES) 15.34 7.42 10.92 10 PERCENT EXCEEDS 5170 1480 3230 50 PERCENT EXCEEDS 1110 850 879 90 PERCENT EXCEEDS 505 584 375 a Present datum. b Falling stage.
O N D2001
J F M A M J J A S2002
100
200
500
10001000
2000
5000
10,000
DAILY-MEAN DISCHARGE,
IN CUBIC FEET PER SECOND

110 RAINY RIVER BASIN--Continued
05128000 NAMAKAN RIVER AT OUTLET OF LAC LA CROIX, ONTARIO (International Gaging Station)
LOCATION.--Lat 48°21’14", long 92°13’01", at Campbell’s Camp, on Lac La Croix Lake, used to determine discharge at outlet [Lat 48°23’00", long 92°10’40", 2.5 mi east of Campbell’s Camp].
DRAINAGE AREA.--5,170 mi2.
PERIOD OF RECORD.--September 1921 to January 1922, April 1922 to current year, in reports of Geological Survey. Monthly discharge only for some periods, published in WSP 1308. August 1921 to current year, in reports of Water Survey of Canada.
GAGE.--Water-stage recorder. Datum of gage is sea level (United States and Canadian Boundary Survey). Prior to October 1933, nonrecording gages at various sites on Lac la Croix. October 1933 to Mar. 13, 1963, nonrecording gage at present site and datum.
REMARKS.--Records furnished by Water Survey of Canada.
COOPERATION.--This station is one of the international stations maintained by Canada under agreement with the United States.
DISCHARGE, CUBIC FEET PER SECOND, WATER YEAR OCTOBER 2001 TO SEPTEMBER 2002 DAILY MEAN VALUES DAY OCT NOV DEC JAN FEB MAR APR MAY JUN JUL AUG SEP 1 3600 2880 3230 3640 2790 2070 1790 2970 3990 5860 3170 1860 2 3530 2860 3300 3640 2750 2050 1780 3030 3990 5830 3090 1850 3 3420 2910 3310 3600 2720 2030 1780 3140 3920 5760 3020 1800 4 3280 2910 3330 3570 2700 2010 1770 3180 3880 5760 2890 1830 5 3260 2920 3400 3570 2660 2000 1750 3270 3810 6000 2810 e1820 6 3230 2900 3430 3530 2640 1970 1750 3340 3780 6110 2730 e1790 7 3170 2930 3570 3520 2600 1960 1740 3390 3670 6110 2630 e1770 8 3150 2900 3600 3480 2570 1960 1730 3490 3640 6040 2530 e1750 9 3100 2920 3640 3450 2550 1980 1720 3500 3670 5970 2440 e1730 10 3110 2910 3670 3430 2520 1980 1720 3600 3600 5900 2430 e1710 11 3170 2930 3710 3400 2510 1970 1720 3670 3780 5720 2390 e1690 12 3160 2930 3710 3370 2470 1970 1720 3740 3880 5580 2340 e1670 13 3140 2930 3740 3350 2450 1950 1740 3780 3990 5470 2270 e1650 14 3110 2930 3740 3320 2430 1940 1770 3850 4100 5330 2230 e1630 15 3090 2920 3740 3280 2400 1920 1820 3880 4170 5230 2210 e1620 16 3100 2940 3740 3260 2370 1920 1870 3880 4240 5080 2210 e1600 17 3100 2930 3740 3220 2350 1910 1940 3880 4340 4940 2120 e1580 18 3060 2910 3740 3190 2330 1890 2000 3920 4410 4840 2140 e1560 19 3040 2890 3740 3170 2300 1880 2080 3950 4480 4700 2120 e1540 20 3000 2910 3710 3140 2270 1870 2150 3950 4520 4560 2090 e1530 21 2990 2910 3710 3120 2240 1860 2220 3920 4630 4410 2070 e1500 22 2990 2910 3710 3090 2220 1850 2300 3920 4770 4240 2040 e1490 23 2970 2880 3780 3060 2200 1840 2370 3880 4940 4130 2000 e1470 24 2980 2930 3780 3030 2160 1830 2430 3880 5120 4030 1960 e1450 25 2880 3040 3780 3000 2140 1820 2460 3880 5330 3920 1940 e1430 26 2930 3110 3780 2970 2120 1810 2570 3810 5510 3810 1930 e1420 27 2960 3150 3780 2930 2100 1800 2680 3810 5650 3740 1900 1390 28 2920 3200 3780 2900 2080 1810 2740 3810 5760 3640 1860 1400 29 2910 3210 3740 2880 --- 1810 2810 3880 5830 3530 1860 1400 30 2920 3240 3740 2850 --- 1810 2890 3950 5830 3430 1870 1380 31 2930 --- 3710 2820 --- 1800 --- 3950 --- 3350 1870 ---
TOTAL 96200 88840 113080 100780 67640 59270 61810 114100 133230 153020 71160 48310 MEAN 3103 2961 3648 3251 2416 1912 2060 3681 4441 4936 2295 1610 MAX 3600 3240 3780 3640 2790 2070 2890 3950 5830 6110 3170 1860 MIN 2880 2860 3230 2820 2080 1800 1720 2970 3600 3350 1860 1380 AC-FT 190800 176200 224300 199900 134200 117600 122600 226300 264300 303500 141100 95820 CFSM 0.60 0.57 0.71 0.63 0.47 0.37 0.40 0.71 0.86 0.95 0.44 0.31 IN. 0.69 0.64 0.81 0.73 0.49 0.43 0.44 0.82 0.96 1.10 0.51 0.35

111 RAINY RIVER BASIN--Continued
05128000 NAMAKAN RIVER AT OUTLET OF LAC LA CROIX, ONTARIO--Continued (International Gaging Station)
STATISTICS OF MONTHLY MEAN DATA FOR WATER YEARS 1921 - 2002, BY WATER YEAR (WY)
OCT NOV DEC JAN FEB MAR APR MAY JUN JUL AUG SEP
MEAN 3059 2916 2616 2210 1899 1684 2597 7690 7950 6071 4080 3175 MAX 14200 10610 7189 4568 3432 2996 9071 16900 22120 15930 11200 13140 (WY) 1978 1978 1972 1978 1966 1966 1945 1938 1950 1968 1944 1988 MIN 744 624 567 547 540 535 614 899 1475 1263 1123 774 (WY) 1999 1977 1977 1977 1924 1924 1977 1977 1924 1924 1998 1998
SUMMARY STATISTICS FOR 2001 CALENDAR YEAR FOR 2002 WATER YEAR WATER YEARS 1921 - 2002 ANNUAL TOTAL 1963010 1107440 ANNUAL MEAN 5378 3034 3847 HIGHEST ANNUAL MEAN 7270 1950 LOWEST ANNUAL MEAN 964 1924 HIGHEST DAILY MEAN 16500 May 14 6110 Jul 6,7 28200a May 31 1950 LOWEST DAILY MEAN 1480 Apr 4 1380 Sep 30 535 Feb 4 1924 ANNUAL SEVEN-DAY MINIMUM 1490 Mar 30 1410 Sep 24 535 Feb 4 1924 MAXIMUM PEAK FLOW 6250 Jul 5 28200 May 31 1950 MAXIMUM PEAK STAGE 1185.67 Jul 5 1193.30a May 31 1950 INSTANTANEOUS LOW FLOW 535b Feb 1 1924 ANNUAL RUNOFF (AC-FT) 3894000 2197000 2787000 ANNUAL RUNOFF (CFSM) 1.04 0.59 0.74 ANNUAL RUNOFF (INCHES) 14.12 7.97 10.11 10 PERCENT EXCEEDS 13100 4240 8290 50 PERCENT EXCEEDS 3710 2960 2710 90 PERCENT EXCEEDS 1650 1780 1180 a Occurred May 31 to June 2, 1950. b Many days in 1924.
O N D2001
J F M A M J J A S2002
1000
2000
5000
10,000
DAILY-MEAN DISCHARGE,
IN CUBIC FEET PER SECOND

112 RAINY RIVER BASIN--Continued
05129115 VERMILION RIVER NEAR CRANE LAKE, MN
LOCATION.--Lat 48°15’53", long 92°33’57", in NE1⁄4NE1⁄4 sec. 30, T.67 N., R.17 W., St. Louis County, Hydrologic Unit 09030002,
in Superior National Forest, on left bank 350 ft downstream from bridge on Forest Route 491, 3.5 mi upstream from mouth, and 3.5 mi west of city of Crane Lake.
DRAINAGE AREA.--905 mi2.
PERIOD OF RECORD.--August 1979 to current year.
GAGE.--Water-stage recorder. Elevation of gage is 1,180 ft above sea level (from topographic map).
REMARKS.--Records good except those for estimated daily discharges, which are fair.
EXTREMES OUTSIDE PERIOD OF RECORD.--Flood of April 1979 reached a stage of 15.15 ft, from high-water mark, discharge approximately 4,600 ft3/s.
DISCHARGE, CUBIC FEET PER SECOND, WATER YEAR OCTOBER 2001 TO SEPTEMBER 2002 DAILY MEAN VALUES DAY OCT NOV DEC JAN FEB MAR APR MAY JUN JUL AUG SEP 1 444 852 927 561 330 233 193 673 582 698 334 272 2 423 858 885 549 324 228 191 652 563 657 319 270 3 403 831 856 539 323 220 188 628 544 620 310 272 4 394 804 846 538 319 214 186 619 522 583 305 268 5 380 782 896 524 322 216 184 615 492 607 292 275 6 366 e765 1100 515 320 212 182 616 469 642 285 274 7 353 e750 1180 501 317 205 191 616 449 620 284 271 8 355 e725 1180 495 313 205 212 613 419 605 287 262 9 382 698 1120 492 307 214 218 653 403 587 283 250 10 423 e675 1090 489 303 220 248 671 404 572 293 246 11 573 e660 1030 480 298 230 271 686 448 559 305 238 12 674 e650 992 476 296 230 412 695 523 540 302 234 13 736 e635 945 467 288 231 637 694 613 511 296 225 14 784 625 895 457 285 229 959 697 750 491 286 215 15 777 614 856 449 284 223 1150 699 807 474 293 205 16 746 599 841 442 281 219 1240 668 778 459 297 196 17 703 591 841 435 275 216 1310 646 704 442 313 190 18 673 577 829 421 273 213 1270 626 629 422 309 183 19 638 563 797 413 271 212 1260 605 595 409 308 193 20 600 550 755 408 270 208 1210 590 594 396 300 197 21 572 540 720 403 266 201 1130 581 552 386 292 189 22 555 531 689 401 260 198 1070 571 546 367 285 178 23 565 528 683 398 257 195 1000 552 622 352 279 167 24 580 532 658 389 255 192 947 530 761 342 271 160 25 611 750 642 383 252 185 874 514 929 348 262 152 26 635 926 636 376 246 184 798 505 941 348 253 146 27 667 915 626 366 242 183 754 483 900 345 249 137 28 694 820 613 358 239 187 732 477 854 355 252 135 29 715 846 598 353 --- 193 717 484 793 351 258 134 30 731 907 587 343 --- 197 693 531 747 344 257 132 31 775 --- 569 334 --- 195 --- 584 --- 337 267 ---
TOTAL 17927 21099 25882 13755 8016 6488 20427 18774 18933 14769 8926 6266 MEAN 578 703 835 444 286 209 681 606 631 476 288 209 MAX 784 926 1180 561 330 233 1310 699 941 698 334 275 MIN 353 528 569 334 239 183 182 477 403 337 249 132 AC-FT 35560 41850 51340 27280 15900 12870 40520 37240 37550 29290 17700 12430 CFSM 0.64 0.78 0.92 0.49 0.32 0.23 0.75 0.67 0.70 0.53 0.32 0.23 IN. 0.74 0.87 1.06 0.57 0.33 0.27 0.84 0.77 0.78 0.61 0.37 0.26

113 RAINY RIVER BASIN--Continued
05129115 VERMILION RIVER NEAR CRANE LAKE, MN--Continued
STATISTICS OF MONTHLY MEAN DATA FOR WATER YEARS 1979 - 2002, BY WATER YEAR (WY)
OCT NOV DEC JAN FEB MAR APR MAY JUN JUL AUG SEP
MEAN 570 556 430 295 239 290 1192 1413 961 782 556 478 MAX 1436 1138 872 476 374 574 2286 3012 2234 1609 2225 1880 (WY) 1996 1983 1983 1996 1997 1995 2001 2001 2001 1985 2001 1988 MIN 110 152 116 97.8 94.1 89.5 627 507 205 113 60.0 69.1 (WY) 1998 1988 1988 1988 1988 1988 1987 1980 1980 1980 1980 1998
SUMMARY STATISTICS FOR 2001 CALENDAR YEAR FOR 2002 WATER YEAR WATER YEARS 1979 - 2002 ANNUAL TOTAL 431915 181262 ANNUAL MEAN 1183 497 650 HIGHEST ANNUAL MEAN 1132 2001 LOWEST ANNUAL MEAN 280 1998 HIGHEST DAILY MEAN 3690 May 27 1310 Apr 17 4300 Apr 25 1985 LOWEST DAILY MEAN 194 Mar 30 132 Sep 30 38 Aug 13 1980 ANNUAL SEVEN-DAY MINIMUM 197 Mar 25 142 Sep 24 40 Aug 10 1980 MAXIMUM PEAK FLOW 1320 Apr 17 4360 Apr 25 1985 MAXIMUM PEAK STAGE 9.60 Apr 17 15.20 Apr 25 1985 INSTANTANEOUS LOW FLOW 132 Sep 28,30 38 Aug 13 1980 ANNUAL RUNOFF (AC-FT) 856700 359500 470600 ANNUAL RUNOFF (CFSM) 1.31 0.55 0.72 ANNUAL RUNOFF (INCHES) 17.75 7.45 9.75 10 PERCENT EXCEEDS 2970 846 1450 50 PERCENT EXCEEDS 733 469 444 90 PERCENT EXCEEDS 222 207 162 e Estimated.
O N D2001
J F M A M J J A S2002
100
200
500
10001000
2000
5000
10,000
DAILY-MEAN DISCHARGE,
IN CUBIC FEET PER SECOND

114 RAINY RIVER BASIN--Continued
05129290 GOLD PORTAGE OUTLET FROM KABETOGAMA LAKE NEAR RAY, MN
LOCATION.--Lat 48°31’28", long 93°04’29", in SW1⁄4NE1⁄4 sec. 30, T.70 N., R.21 W., St. Louis County, Hydrologic Unit 09030003,
on right bank in bay at head of Gold Portage Outlet from Kabetogama Lake, 9.8 mi northeast of Ray.
PERIOD OF RECORD.--October 1982 to September 1993, October 1993 to September 1994 (peak gage height and discharge only), October 1997 to current year.
GAGE.--Water-stage recorder. Elevation of gage is 1,100 ft above sea level (NGVD of 1912, U.S. Army Corp of Engineers benchmark), water surface transfer.
REMARKS.--Records fair except those for estimated daily discharges, which are poor. Flow completely regulated by outlet dam on Namakan Lake.
DISCHARGE, CUBIC FEET PER SECOND, WATER YEAR OCTOBER 2001 TO SEPTEMBER 2002 DAILY MEAN VALUES DAY OCT NOV DEC JAN FEB MAR APR MAY JUN JUL AUG SEP 1 366 257 176 64 19 e2.8 0.00 11 371 808 479 398 2 369 243 182 59 18 e2.6 0.00 12 404 800 472 393 3 363 247 177 57 17 e2.3 0.00 18 440 792 478 370 4 345 241 174 54 16 e2.1 0.00 20 459 817 464 387 5 343 239 175 53 15 e1.9 0.00 26 486 904 464 390 6 353 228 e170 50 e14 e1.8 0.00 30 518 942 466 389 7 355 230 e160 49 e13 e1.7 0.00 36 509 925 474 388 8 361 216 e155 48 e12 e1.5 0.00 45 527 897 470 386 9 348 219 150 46 e12 e1.4 0.00 46 575 872 458 378 10 344 214 148 e44 e11 e1.3 0.00 53 632 850 458 380 11 355 213 149 e43 e10 e1.1 0.00 63 713 809 456 385 12 363 211 142 e41 e9.8 e1.0 0.00 69 721 771 454 383 13 349 203 136 e40 e9.2 e0.94 0.00 73 734 741 443 392 14 341 199 135 e39 e8.5 e0.84 0.00 84 729 709 446 380 15 329 193 132 e38 e8.0 e0.76 0.00 90 718 685 440 387 16 326 196 127 e36 e7.6 e0.71 0.00 93 706 653 439 386 17 329 191 121 e35 e7.2 e0.64 e0.01 102 703 632 418 393 18 312 181 118 e34 e6.7 e0.54 e0.02 108 698 620 414 395 19 300 172 e115 e33 e6.3 e0.47 e0.03 117 697 598 417 390 20 289 178 e110 e31 e5.8 e0.39 e0.06 125 680 583 415 395 21 285 176 e105 e30 e5.4 e0.30 e0.11 137 680 565 409 378 22 287 176 e102 e29 e5.0 e0.23 e0.20 150 689 540 406 374 23 279 169 e100 e28 e4.6 e0.15 e0.40 155 713 549 405 383 24 283 168 98 e27 e4.3 e0.09 e0.84 175 723 553 400 386 25 249 173 91 e26 e3.9 e0.06 e1.6 195 722 555 400 377 26 265 184 88 e25 e3.6 e0.04 3.5 202 722 548 402 376 27 280 188 85 e24 e3.3 0.00 5.7 227 729 557 408 373 28 275 189 81 23 e3.2 0.00 6.8 252 766 547 398 380 29 269 187 75 22 --- 0.00 7.0 286 794 533 400 385 30 276 182 71 21 --- 0.00 8.7 319 806 520 403 382 31 272 --- 67 20 --- 0.00 --- 339 --- 514 407 ---
TOTAL 9860 6063 3915 1169 259.4 27.66 34.97 3658 19364 21389 13463 11539 MEAN 318 202 126 37.7 9.26 0.89 1.17 118 645 690 434 385 MAX 369 257 182 64 19 2.8 8.7 339 806 942 479 398 MIN 249 168 67 20 3.2 0.00 0.00 11 371 514 398 370 AC-FT 19560 12030 7770 2320 515 55 69 7260 38410 42430 26700 22890

115 RAINY RIVER BASIN--Continued
05129290 GOLD PORTAGE OUTLET FROM KABETOGAMA LAKE NEAR RAY, MN--Continued
STATISTICS OF MONTHLY MEAN DATA FOR WATER YEARS 1983 - 2002, BY WATER YEAR (WY)
OCT NOV DEC JAN FEB MAR APR MAY JUN JUL AUG SEP
MEAN 378 199 83.1 20.0 3.82 0.52 7.03 165 432 569 558 509 MAX 530 267 149 57.2 32.7 4.48 98.9 798 950 690 686 787 (WY) 1986 1990 1992 2000 2000 2000 2001 2001 2001 2002 1988 1988 MIN 140 115 16.5 1.10 0.000 0.000 0.000 0.000 96.0 323 288 181 (WY) 1999 1988 1988 1988 1983 1983 1983 1987 1987 1998 1998 1998
SUMMARY STATISTICS FOR 2001 CALENDAR YEAR FOR 2002 WATER YEAR WATER YEARS 1983 - 2002 ANNUAL TOTAL 125377.94 90742.03 ANNUAL MEAN 344 249 245 HIGHEST ANNUAL MEAN 340 2001 LOWEST ANNUAL MEAN 141 1998 HIGHEST DAILY MEAN 1310 May 30 942 Jul 6 1310 May 30 2001 LOWEST DAILY MEAN 0.47 Mar 30 0.00 Mar 27 - Apr. 16 0.00a Jan 21 1983 ANNUAL SEVEN-DAY MINIMUM 0.68 Mar 26 0.00 Mar 27 0.00 Jan 21 1983 MAXIMUM PEAK FLOW 985 Jul 6 1310 May 29 2001 MAXIMUM PEAK STAGE 19.58 Jul 6 20.53 May 31 2001 ANNUAL RUNOFF (AC-FT) 248700 180000 177600 10 PERCENT EXCEEDS 793 640 594 50 PERCENT EXCEEDS 269 182 160 90 PERCENT EXCEEDS 5.1 0.51 0.00 a Many days, several years. e Estimated.
O N D2001
J F M A M J J A S2002
0.001
0.002
0.005
0.010.01
0.02
0.05
0.10.1
0.2
0.5
11
2
5
1010
20
50
100100
200
500
1000
DAILY-MEAN DISCHARGE,
IN CUBIC FEET PER SECOND

116 RAINY RIVER BASIN--Continued
05129400 RAINY LAKE NEAR FORT FRANCES, ONTARIO (International Gaging Station)
LOCATION.--Lat 48°38’30", long 93°20’00", at Five Mile dock, approximately 5 mi northeast of city of Fort Frances.
PERIOD OF RECORD.--January 1910 to September 1917 and October 1934 to current year, in reports of Geological Survey. August 1911 to current year, in reports of Water Survey of Canada. Prior to October 1949, published as "at Ranier, Minn.", and as "at Fort Frances, Ontario" October 1949 to September 1964.
GAGE.--Water-stage recorder. Datum of gage is sea level (United States and Canadian Boundary Survey). January 1910 to December 1949, nonrecording gage 3 mi northeast at Ranier, Minn., at same datum. January 1950 to October 1964, water-stage recorder on Government dock at Pither’s Point at Fort Frances, and supplementary gage in town pumping station, 0.5 mi south, used during winter months, at same datum.
REMARKS.-- Records furnished by Water Survey of Canada.
COOPERATION.--This station is one of the international gaging stations maintained by Canada under agreement with the United States.
EXTREMES FOR PERIOD OF RECORD.--Maximum elevation observed, 1,112.97 ft, July 5, 1950; minimum observed, 1,101.26 ft, Apr. 17, 1923, Apr. 2, 1930.
EXTREMES FOR CURRENT YEAR.--Maximum elevation, 1,110.82 ft, June 30; maximum daily, 1110.81 ft, June 27; minimum elevation, 1,105.10 ft, Apr. 11; minimum daily, 1105.11 ft, Apr. 11.
MONTH-END ELEVATION, IN SEA LEVEL, WATER YEAR OCTOBER 2001 TO SEPTEMBER 2002
Oct. 31..........1107.26 Apr. 30..........1105.89
Nov. 30..........1107.27 May 31..........1106.95
Dec. 31..........1106.95 June 30..........1110.72
Jan. 31..........1106.34 July 31..........1107.69
Feb. 28..........1105.68 Aug. 31..........1107.55
Mar. 31..........1105.17 Sep. 30..........1107.08

117 RAINY RIVER BASIN--Continued
05129400 RAINY LAKE NEAR FORT FRANCES, ONTARIO--Continued

118 RAINY RIVER BASIN--Continued
05130500 STURGEON RIVER NEAR CHISHOLM, MN
LOCATION.--Lat 47°40’25", long 92°54’00", in NE1⁄4NW1⁄4 sec. 20, T.60 N., R.20 W., St. Louis County, Hydrologic Unit 09030005,
on left bank 1,000 ft upstream from County Highway 65 bridge, 0.6 mi downstream from East Branch Sturgeon River, and 11.5 mi north of Chisholm.
DRAINAGE AREA.--180 mi2.
PERIOD OF RECORD.--August 1942 to current year.
REVISED RECORDS.--WSP 1438: 1946.
GAGE.--Water-stage recorder. Datum of gage is 1,305.7 ft above sea level (NGVD of 1929). Prior to Aug. 24, 1944, nonrecording gage at site 1,000 ft downstream at different datum. Aug. 25, 1944 to Sept. 30, 1975 at present site at datum 1.00 ft higher.
REMARKS.--Records good except those for estimated daily discharges, which are fair.
EXTREMES FOR CURRENT YEAR.--Peak discharges greater than base discharge of 500 ft3/s and maximum (*):
Discharge Gage height Discharge Gage height Date Time (ft3/s) (ft) Date Time (ft3/s) (ft)
Jun 25 0700 *1,730 *5.92 No other peak greater than base discharge.
Minimum discharge, 17 ft3/s, Mar. 5, 6, 7, 8, gage height, 1.47 ft.
DISCHARGE, CUBIC FEET PER SECOND, WATER YEAR OCTOBER 2001 TO SEPTEMBER 2002 DAILY MEAN VALUES DAY OCT NOV DEC JAN FEB MAR APR MAY JUN JUL AUG SEP 1 31 104 e118 66 31 22 e25 144 87 261 237 78 2 30 101 e127 65 30 20 e26 140 80 214 267 81 3 30 94 141 65 30 19 e26 132 71 175 260 81 4 30 90 151 64 29 18 e27 126 65 146 228 77 5 30 86 148 63 28 18 e28 133 60 125 182 74 6 29 82 172 60 28 18 e28 136 55 109 144 72 7 28 80 181 56 29 17 e32 137 50 99 129 69 8 28 86 175 55 30 e17 e41 134 48 220 125 66 9 32 87 165 54 30 e18 e54 146 45 227 116 64 10 54 88 152 54 30 e18 e76 157 42 185 120 68 11 92 86 142 54 29 e18 e103 154 44 153 138 68 12 92 84 135 53 29 e19 e128 157 46 125 147 64 13 101 82 127 52 28 e20 e210 166 45 108 145 60 14 113 81 120 50 27 e20 e310 176 44 96 134 57 15 117 79 115 48 27 e21 389 177 50 86 141 54 16 110 76 118 48 27 e22 403 171 47 83 181 53 17 101 74 121 46 27 e22 403 157 47 71 231 50 18 94 73 120 43 27 e22 389 142 41 66 249 49 19 87 73 97 41 27 e22 385 128 43 60 231 57 20 82 71 93 40 28 e23 348 118 49 58 199 61 21 77 69 93 39 27 e22 298 110 46 59 167 68 22 74 66 87 39 26 e22 253 100 111 59 147 71 23 84 64 85 39 26 e21 219 96 756 56 130 75 24 89 75 82 38 26 e21 195 94 1310 53 117 70 25 104 154 80 38 25 e21 185 89 1680 64 107 63 26 107 179 78 37 24 e21 168 86 1390 69 98 59 27 103 128 76 37 23 e21 150 82 1000 78 91 57 28 106 e115 73 35 23 e22 143 77 676 84 85 55 29 105 e108 72 34 --- e23 143 79 466 94 84 59 30 101 e113 70 33 --- e24 148 90 338 92 81 57 31 102 --- 68 31 --- e25 --- 92 --- 84 79 ---
TOTAL 2363 2748 3582 1477 771 637 5333 3926 8832 3459 4790 1937 MEAN 76.2 91.6 116 47.6 27.5 20.5 178 127 294 112 155 64.6 MAX 117 179 181 66 31 25 403 177 1680 261 267 81 MIN 28 64 68 31 23 17 25 77 41 53 79 49 AC-FT 4690 5450 7100 2930 1530 1260 10580 7790 17520 6860 9500 3840 CFSM 0.42 0.51 0.64 0.26 0.15 0.11 0.99 0.70 1.64 0.62 0.86 0.36 IN. 0.49 0.57 0.74 0.31 0.16 0.13 1.10 0.81 1.83 0.71 0.99 0.40

119 RAINY RIVER BASIN--Continued
05130500 STURGEON RIVER NEAR CHISHOLM, MN--Continued
STATISTICS OF MONTHLY MEAN DATA FOR WATER YEARS 1942 - 2002, BY WATER YEAR (WY)
OCT NOV DEC JAN FEB MAR APR MAY JUN JUL AUG SEP
MEAN 121 95.8 50.5 29.6 23.9 50.8 367 299 183 125 73.6 91.4 MAX 600 264 135 66.0 47.7 337 868 1451 528 623 268 424 (WY) 1996 1978 1999 1966 1984 1945 1948 1950 1944 1993 1988 1977 MIN 7.85 8.90 4.82 3.98 4.54 10.0 41.0 22.9 14.7 5.99 12.6 4.60 (WY) 1977 1977 1977 1977 1977 1957 1977 1977 1988 1988 1961 1976
SUMMARY STATISTICS FOR 2001 CALENDAR YEAR FOR 2002 WATER YEAR WATER YEARS 1942 - 2002 ANNUAL TOTAL 60576 39855 ANNUAL MEAN 166 109 126 HIGHEST ANNUAL MEAN 218 1996 LOWEST ANNUAL MEAN 63.1 1977 HIGHEST DAILY MEAN 1670 Apr 14 1680 Jun 25 3530 May 8 1950 LOWEST DAILY MEAN 24 Sep 6 17 Mar 7,8 2.5 Jul 30 1988 ANNUAL SEVEN-DAY MINIMUM 25 Sep 15 18 Mar 4 3.0 Jul 24 1988 MAXIMUM PEAK FLOW 1730 Jun 25 3630a May 7 1950 MAXIMUM PEAK STAGE 5.92 Jun 25 7.41b May 7 1950 ANNUAL RUNOFF (AC-FT) 120200 79050 91410 ANNUAL RUNOFF (CFSM) 0.92 0.61 0.70 ANNUAL RUNOFF (INCHES) 12.52 8.24 9.52 10 PERCENT EXCEEDS 526 181 295 50 PERCENT EXCEEDS 64 77 60 90 PERCENT EXCEEDS 26 26 18 a From rating curve extended above 1,600 ft3/s, on basis of slope-area measurement of peak flow. b Present datum. e Estimated.
O N D2001
J F M A M J J A S2002
10
20
50
100100
200
500
10001000
2000
5000
10,000
DAILY-MEAN DISCHARGE,
IN CUBIC FEET PER SECOND

120 RAINY RIVER BASIN
05131448 WOOD DUCK CREEK NEAR NETT LAKE, MN
LOCATION.--Lat 48°09’24", long 93°08’20", in SW1⁄4SW1⁄4 sec. 35, T.66 N., R.22 W., Koochiching County, Hydrologic Unit
09030005, at bridge on Tribal Service Road, 2.9 miles above mouth at Nett Lake, and 3.5 miles northwest of the town of Nett Lake.
DRAINAGE AREA.--31.8 mi2.
PERIOD OF RECORD.--October 1995 to current year.
GAGE.--Water-stage recorder. Elevation of gage 1,270 ft above sea level (from topographic map).
REMARKS.--Records poor. Backwater from Nett Lake occurs at times.
DISCHARGE, CUBIC FEET PER SECOND, WATER YEAR OCTOBER 2001 TO SEPTEMBER 2002 DAILY MEAN VALUES DAY OCT NOV DEC JAN FEB MAR APR MAY JUN JUL AUG SEP 1 2.8 21 e31 e7.1 e2.9 e0.70 e0.47 24 12 23 0.90 0.52 2 2.7 23 e29 e6.9 e2.8 e0.68 e0.51 22 13 16 0.87 0.50 3 2.7 24 e26 e6.7 e2.6 e0.65 e0.55 22 13 9.4 0.84 0.44 4 2.3 21 e25 e6.5 e2.5 e0.61 e0.66 23 11 8.2 0.75 0.45 5 2.2 18 e25 e6.3 e2.4 e0.58 e0.85 24 10 13 0.70 0.45 6 2.6 15 e27 e6.1 e2.3 e0.55 e1.1 24 10 16 0.72 0.43 7 2.8 14 e30 e5.9 e2.2 e0.52 e1.5 24 9.1 12 0.98 0.41 8 3.6 12 e32 e5.7 e2.1 e0.49 e2.0 25 8.5 14 1.0 0.38 9 3.4 13 e34 e5.4 e2.0 e0.47 e3.0 34 11 11 0.94 0.31 10 4.5 13 e29 e5.3 e1.9 e0.46 e5.0 48 12 9.3 0.92 0.30 11 13 11 e26 e5.2 e1.8 e0.44 e9.0 54 32 6.3 0.89 0.29 12 18 10 e23 e5.1 e1.7 e0.44 e17 55 87 4.0 0.96 0.25 13 19 8.4 e21 e4.9 e1.7 e0.43 e30 54 132 3.5 0.87 0.26 14 22 7.2 e20 e4.7 e1.6 e0.43 e45 61 136 2.8 0.87 0.22 15 19 6.0 e19 e4.6 e1.5 e0.43 e80 58 115 2.6 0.85 0.24 16 18 5.5 e17 e4.6 e1.4 e0.43 e110 51 86 2.3 0.93 0.22 17 19 5.0 e16 e4.5 e1.4 e0.43 132 46 60 2.0 1.4 0.23 18 16 5.1 e15 e4.4 e1.3 e0.42 140 40 44 1.8 1.4 0.23 19 15 3.3 e14 e4.4 e1.2 e0.42 144 34 47 1.7 1.4 0.21 20 13 3.2 e13 e4.3 e1.1 e0.42 125 28 59 1.6 1.2 0.22 21 13 3.3 e12 e4.2 e1.1 e0.42 104 25 53 1.4 1.0 0.20 22 14 3.3 e11 e4.1 e1.0 e0.42 84 22 52 1.3 0.88 0.18 23 14 3.1 e11 e4.1 e0.96 e0.42 64 15 108 1.2 0.81 0.18 24 15 3.8 e10 e3.9 e0.92 e0.42 52 17 140 1.2 0.73 0.20 25 12 13 e9.7 e3.8 e0.87 e0.42 44 16 150 1.1 0.68 0.18 26 17 e36 e9.2 e3.6 e0.83 e0.43 37 11 122 1.0 0.66 0.17 27 19 e30 e8.8 e3.5 e0.79 e0.43 31 12 94 1.1 0.63 0.16 28 20 e25 e8.4 e3.4 e0.73 e0.43 28 13 64 1.1 0.56 0.17 29 19 e23 e8.1 e3.2 --- e0.44 27 16 43 1.1 0.54 0.20 30 23 e26 e7.8 e3.1 --- e0.44 25 17 31 1.0 0.54 0.20 31 22 --- e7.5 e3.0 --- e0.45 --- 14 --- 1.0 0.56 ---
TOTAL 389.6 405.2 575.5 148.5 45.60 14.72 1343.64 929 1764.6 173.0 26.98 8.40 MEAN 12.6 13.5 18.6 4.79 1.63 0.47 44.8 30.0 58.8 5.58 0.87 0.28 MAX 23 36 34 7.1 2.9 0.70 144 61 150 23 1.4 0.52 MIN 2.2 3.1 7.5 3.0 0.73 0.42 0.47 11 8.5 1.0 0.54 0.16 AC-FT 773 804 1140 295 90 29 2670 1840 3500 343 54 17 CFSM 0.40 0.42 0.58 0.15 0.05 0.01 1.41 0.94 1.85 0.18 0.03 0.01 IN. 0.46 0.47 0.67 0.17 0.05 0.02 1.57 1.09 2.06 0.20 0.03 0.01

121 RAINY RIVER BASIN--Continued
05131448 WOOD DUCK CREEK NEAR NETT LAKE, MN--Continued
STATISTICS OF MONTHLY MEAN DATA FOR WATER YEARS 1996 - 2002, BY WATER YEAR (WY)
OCT NOV DEC JAN FEB MAR APR MAY JUN JUL AUG SEP
MEAN 22.2 20.6 8.04 2.62 1.89 4.02 85.7 68.0 17.7 14.4 20.4 12.5 MAX 65.4 43.0 18.6 6.18 4.61 10.9 148 136 58.8 32.5 75.7 48.0 (WY) 1996 2001 2002 1997 1998 1998 2001 1996 2002 1996 2001 1999 MIN 3.11 6.00 3.02 0.19 0.000 0.47 20.1 18.4 6.78 3.70 0.83 0.042 (WY) 1999 1999 2000 1999 1999 2002 2000 1998 1998 2001 1998 1998
SUMMARY STATISTICS FOR 2001 CALENDAR YEAR FOR 2002 WATER YEAR WATER YEARS 1996 - 2002 ANNUAL TOTAL 13498.8 5824.74 ANNUAL MEAN 37.0 16.0 23.2 HIGHEST ANNUAL MEAN 38.3 2001 LOWEST ANNUAL MEAN 9.77 1998 HIGHEST DAILY MEAN 432 May 23 150 Jun 25 432 May 23 2001 LOWEST DAILY MEAN 1.3 Mar 6 0.16 Sep 27 0.00a Sep 8 1998 ANNUAL SEVEN-DAY MINIMUM 1.3 Mar 6 0.18 Sep 22 0.00 Sep 8 1998 MAXIMUM PEAK FLOW 153b Jun 25 445c May 23 2001 MAXIMUM PEAK STAGE 8.85d Apr 15 12.88f Apr 7 1997 INSTANTANEOUS LOW FLOW 0.15 Sep 25 0.00 Sep 7 1998 ANNUAL RUNOFF (AC-FT) 26770 11550 16800 ANNUAL RUNOFF (CFSM) 1.16 0.50 0.73 ANNUAL RUNOFF (INCHES) 15.79 6.81 9.91 10 PERCENT EXCEEDS 126 44 57 50 PERCENT EXCEEDS 8.7 4.7 6.7 90 PERCENT EXCEEDS 1.4 0.43 0.60 a Many days, several years. b Gage height, 8.65 ft. c Gage height, 11.50 ft. d Backwater from ice. e Estimated. f From highwater mark, backwater from ice.
O N D2001
J F M A M J J A S2002
0.1
0.2
0.5
11
2
5
1010
20
50
100100
200
500
1000
DAILY-MEAN DISCHARGE,
IN CUBIC FEET PER SECOND

122 RAINY RIVER BASIN--Continued
05131450 NETT LAKE AT NETT LAKE, MN
LOCATION.--Lat 48°06’57", long 93°05’58", in NE1⁄4SE1⁄4 sec. 13, T.65 N., R.22 W., Koochiching County, Hydrologic Unit
09030005, on Bois Forte Indian Reservation at Nett Lake town boat ramp.
PERIOD OF RECORD.--June 1998 to September 2001 (no winter record), October 2001 to current year.
GAGE.--Water-stage recorder. Datum of gage 1,270 ft above sea level (from topographic map).
EXTREMES FOR PERIOD OF RECORD.--Maximum-recorded gage height, 8.57 ft., Apr. 18, 2001; maximum daily, 8.52 ft., Apr. 21, 2001; minimum-recorded gage height, 5.15 ft, Mar. 6, 2002, but may have been lower during period of no gage-height record, Mar. 7-26 and Mar. 28 to April 1, 2002; minimum daily, 5.17 ft, Mar. 6, 2002.
EXTREMES FOR CURRENT YEAR.--Maximum-recorded gage height, 7.63 ft., Oct. 30; maximum daily, 7.58 ft., Oct. 29, 30; minimum-recorded gage height, 5.15 ft, Mar. 6, but may have been lower during period of no gage-height record, Mar. 7-26 and Mar. 28 to April 1; minimum daily, 5.17 ft, Mar. 6.
GAGE HEIGHT, FEET, WATER YEAR OCTOBER 2001 TO SEPTEMBER 2002 DAILY MEAN VALUES DAY OCT NOV DEC JAN FEB MAR APR MAY JUN JUL AUG SEP 1 6.84 7.46 6.37 5.90 5.48 5.26 --- 6.46 6.88 6.39 6.19 6.26 2 6.83 7.40 6.33 5.89 5.47 5.26 5.31 6.52 6.83 6.40 6.18 6.28 3 6.83 7.32 6.30 5.87 5.47 5.25 5.31 6.48 6.81 6.37 6.14 6.29 4 6.85 7.25 6.26 5.85 5.45 5.24 5.31 6.54 6.80 6.30 6.14 6.25 5 6.84 7.19 6.28 5.84 5.44 5.21 5.32 6.53 6.79 6.35 6.12 6.25 6 6.83 7.12 6.30 5.81 5.43 5.17 5.32 6.58 6.80 6.37 6.10 6.25 7 6.82 7.05 6.31 5.79 5.42 --- 5.32 6.57 6.82 6.39 6.17 6.25 8 6.84 7.01 6.31 5.78 5.40 --- 5.33 6.59 6.76 6.43 6.22 6.24 9 6.88 6.96 6.31 5.77 5.40 --- 5.34 6.71 6.76 6.41 6.23 6.22 10 6.97 6.90 6.30 5.75 5.39 --- 5.36 6.73 6.78 6.36 6.23 6.22 11 7.07 6.85 6.29 5.74 5.38 --- 5.39 6.73 6.89 6.34 6.23 6.21 12 7.10 6.80 6.28 5.73 5.39 --- 5.44 6.76 6.92 6.35 6.27 6.21 13 7.15 6.77 6.27 5.72 5.37 --- 5.53 6.83 6.98 6.32 6.26 6.19 14 7.21 6.72 6.24 5.70 5.36 --- 5.66 6.84 6.97 6.31 6.24 6.19 15 7.26 6.68 6.21 5.69 5.36 --- 5.77 6.89 6.97 6.28 6.27 6.18 16 7.28 6.64 6.20 5.67 5.35 --- 5.86 6.91 6.90 6.27 6.28 6.15 17 7.29 6.60 6.18 5.67 5.34 --- 5.95 6.89 6.81 6.23 6.37 6.15 18 7.31 6.57 6.16 5.65 5.34 --- 5.99 6.89 6.75 6.19 6.33 6.14 19 7.34 6.54 6.14 5.63 5.33 --- 6.05 6.90 6.76 6.19 6.32 6.16 20 7.36 6.49 6.13 5.62 5.33 --- 6.12 6.87 6.82 6.18 6.32 6.17 21 7.38 6.46 6.10 5.61 5.30 --- 6.17 6.88 6.72 6.21 6.31 6.17 22 7.39 6.42 6.08 5.61 5.30 --- 6.24 6.87 6.70 6.20 6.30 6.15 23 7.42 6.40 6.09 5.60 5.29 --- 6.27 6.90 6.73 6.14 6.31 6.14 24 7.44 6.39 6.07 5.58 5.28 --- 6.37 6.85 6.77 6.13 6.30 6.14 25 7.50 6.47 6.05 5.57 5.28 --- 6.41 6.85 6.80 6.11 6.28 6.13 26 7.53 6.49 6.03 5.56 5.28 --- 6.38 6.89 6.74 6.11 6.27 6.13 27 7.55 6.47 6.01 5.55 5.26 5.25 6.35 6.82 6.66 6.14 6.25 6.11 28 7.55 6.45 5.99 5.53 5.26 --- 6.37 6.82 6.60 6.18 6.25 6.12 29 7.58 6.42 5.97 5.52 --- --- 6.43 6.84 6.54 6.18 6.26 6.13 30 7.58 6.39 5.95 5.51 --- --- 6.45 6.90 6.50 6.18 6.25 6.13 31 7.51 --- 5.93 5.50 --- --- --- 6.91 --- 6.16 6.26 ---
MEAN 7.20 6.76 6.18 5.68 5.36 --- --- 6.77 6.79 6.26 6.25 6.19 MAX 7.58 7.46 6.37 5.90 5.48 --- --- 6.91 6.98 6.43 6.37 6.29 MIN 6.82 6.39 5.93 5.50 5.26 --- --- 6.46 6.50 6.11 6.10 6.11

123 RAINY RIVER BASIN--Continued
05131450 NETT LAKE AT NETT LAKE, MN--Continued
O N D2001
J F M A M J J A S2002
5
5.5
6
6.5
7
7.5
8
GAGE HEIGHT, IN FEET
Gap indicatesmissing record

124 RAINY RIVER BASIN--Continued
05131455 NETT LAKE RIVER NEAR NETT LAKE, MN
LOCATION.--Lat 48°06’36", long 93°11’12", in NE1⁄4NE1⁄4 sec. 20, T.65 N., R.22 W., Koochiching County, Hydrologic Unit 09030005,
downstream from dam at outlet of Nett Lake, 4 miles west of the town of Nett Lake.
DRAINAGE AREA.--128 mi2.
PERIOD OF RECORD.--October 1995 to current year.
GAGE.--Water-stage recorder. Elevation of gage 1,270 ft above sea level (from topographic map).
REMARKS.--Records fair except those for estimated daily discharges, which are poor. Regulation from Nett Lake Dam upstream of gage.
DISCHARGE, CUBIC FEET PER SECOND, WATER YEAR OCTOBER 2001 TO SEPTEMBER 2002 DAILY MEAN VALUES DAY OCT NOV DEC JAN FEB MAR APR MAY JUN JUL AUG SEP 1 64 384 e175 e72 e35 e0.24 e0.13 e13 54 257 e2.2 e3.1 2 2.2 363 e163 e69 e33 e0.22 e0.13 e12 59 8.4 e2.0 e3.0 3 e1.9 369 e154 e67 e31 e0.20 e0.13 e11 57 8.7 e1.8 e2.8 4 e1.8 346 e145 e65 e30 e0.19 e0.13 e11 51 13 e1.7 e2.8 5 e1.7 318 e160 e63 e28 e0.18 e0.13 17 50 26 e1.6 e2.8 6 e1.7 293 e180 e62 e26 e0.17 e0.13 22 44 17 e1.6 e2.7 7 e1.7 283 e200 e61 e24 e0.17 e0.14 17 34 19 e3.5 e2.6 8 e2.1 244 e195 e60 e22 e0.16 e0.40 31 42 47 e3.7 e2.4 9 e3.0 236 e185 e59 e20 e0.16 e1.5 23 59 68 e3.7 e2.1 10 e3.8 224 e170 e58 e17 e0.15 e6.0 27 54 68 e3.8 e2.0 11 e5.0 213 e160 e57 e15 e0.15 21 37 65 52 e3.8 e1.8 12 e6.1 205 e150 e56 e13 e0.15 84 41 103 45 e3.8 1.6 13 e6.8 188 e140 e56 e11 e0.15 94 44 220 42 e3.8 e1.8 14 e7.0 178 e130 e55 e9.0 e0.15 121 55 334 37 e3.8 e1.5 15 e7.0 164 e125 e54 e7.5 e0.15 160 52 328 36 e3.9 e1.7 16 e7.0 162 e117 e54 e6.0 e0.14 186 60 307 e4.7 e3.9 e1.4 17 7.0 147 e112 e53 e4.5 e0.14 218 58 294 e4.5 e4.0 e1.6 18 6.7 134 e106 e52 e3.5 e0.14 276 58 276 e4.3 e4.0 e1.5 19 6.7 120 e100 e52 e2.8 e0.14 345 61 273 e4.0 e4.1 e1.3 20 7.3 121 e96 e51 e2.2 e0.14 333 57 256 e3.6 e4.1 e1.5 21 8.3 122 e93 e50 e1.7 e0.13 320 51 264 e3.2 e4.0 e1.2 22 12 120 e89 e49 e1.3 e0.13 300 49 263 e2.9 e3.8 e1.1 23 12 111 e87 48 e1.0 e0.13 286 47 288 e2.7 e3.7 e1.2 24 21 122 e95 e47 e0.80 e0.13 274 54 363 e2.3 e3.6 e1.4 25 9.7 129 e110 e46 e0.60 e0.13 268 50 403 e2.1 e3.5 e1.3 26 21 164 e100 e44 e0.48 0.13 262 39 399 e1.9 e3.4 e1.2 27 29 250 e94 e42 e0.38 e0.13 e250 52 389 e2.3 e3.3 e1.1 28 31 e225 e87 e41 e0.30 e0.13 e247 49 368 e2.8 2.9 e1.2 29 35 e205 e83 e39 --- e0.13 e186 56 341 e3.4 e2.8 e1.4 30 200 e185 e79 e38 --- e0.13 e15 47 306 e2.8 e2.6 e1.5 31 474 --- e75 e37 --- e0.13 --- 48 --- e2.4 e3.4 ---
TOTAL 1003.5 6325 3955 1657 347.06 4.72 4254.82 1249 6344 794.0 101.8 54.6 MEAN 32.4 211 128 53.5 12.4 0.15 142 40.3 211 25.6 3.28 1.82 MAX 474 384 200 72 35 0.24 345 61 403 257 4.1 3.1 MIN 1.7 111 75 37 0.30 0.13 0.13 11 34 1.9 1.6 1.1 AC-FT 1990 12550 7840 3290 688 9.4 8440 2480 12580 1570 202 108 CFSM 0.25 1.65 1.00 0.42 0.10 0.00 1.11 0.31 1.65 0.20 0.03 0.01 IN. 0.29 1.84 1.15 0.48 0.10 0.00 1.24 0.36 1.84 0.23 0.03 0.02

125 RAINY RIVER BASIN--Continued
05131455 NETT LAKE RIVER NEAR NETT LAKE, MN--Continued
STATISTICS OF MONTHLY MEAN DATA FOR WATER YEARS 1996 - 2002, BY WATER YEAR (WY)
OCT NOV DEC JAN FEB MAR APR MAY JUN JUL AUG SEP
MEAN 79.1 101 60.8 31.9 19.4 17.1 304 338 120 51.8 25.5 37.9 MAX 187 211 128 54.3 37.3 40.1 464 566 322 94.8 98.0 154 (WY) 2001 2002 2002 1997 1996 1998 1999 2001 2001 1997 2001 1999 MIN 0.22 0.063 1.38 1.50 1.45 0.15 142 40.3 11.9 1.41 0.059 0.000 (WY) 1999 1999 1999 1999 1999 2002 2002 2002 2000 1996 1998 1998
SUMMARY STATISTICS FOR 2001 CALENDAR YEAR FOR 2002 WATER YEAR WATER YEARS 1996 - 2002 ANNUAL TOTAL 58809.7 26090.50 ANNUAL MEAN 161 71.5 99.0 HIGHEST ANNUAL MEAN 162 2001 LOWEST ANNUAL MEAN 52.6 1998 HIGHEST DAILY MEAN 936 Apr 27 474 Oct 31 1470 Apr 13 1999 LOWEST DAILY MEAN 1.7 Oct 5 0.13 Mar 21 - Apr 6 0.00a Jun 21 1996 ANNUAL SEVEN-DAY MINIMUM 1.9 Oct 2 0.13 Mar 21 0.00 Aug 13 1996 MAXIMUM PEAK FLOW 481 Oct 31 1490 Apr 13 1999 MAXIMUM PEAK STAGE 5.32 Oct 31 7.26 Apr 13 1999 ANNUAL RUNOFF (AC-FT) 116600 51750 71740 ANNUAL RUNOFF (CFSM) 1.26 0.56 0.77 ANNUAL RUNOFF (INCHES) 17.09 7.58 10.51 10 PERCENT EXCEEDS 494 250 299 50 PERCENT EXCEEDS 70 27 29 90 PERCENT EXCEEDS 17 0.21 0.19 a Many days in 1996, 1998 and 1999. e Estimated.
O N D2001
J F M A M J J A S2002
0.1
0.2
0.5
11
2
5
1010
20
50
100100
200
500
1000
DAILY-MEAN DISCHARGE,
IN CUBIC FEET PER SECOND

126 RAINY RIVER BASIN--Continued
05131500 LITTLE FORK RIVER AT LITTLEFORK, MN
LOCATION.--Lat 48°23’45", long 93°32’57", in NE1⁄4SE1⁄4 sec. 9, T.68 N., R.25 W., Koochiching County, Hydrologic Unit 09030005,
on right bank at town of Littlefork, 0.9 mi upstream from bridge on State Highway 217, 2.8 mi upstream from Beaver Creek, and 19 mi upstream from mouth.
DRAINAGE AREA.--1,680 mi2.
PERIOD OF RECORD.--June to November 1909, April to November 1910, April 1911 to June 1917, September 1917, October 1917 to March 1919 (gage heights only), June 1928 to current year.
REVISED RECORDS.--WSP 955: Drainage area. WSP 1508: 1913, 1916, 1928-32, 1934. WRD MN-74: 1963.
GAGE.--Water-stage recorder. Datum of gage is 1,083.59 ft above sea level (NGVD of 1929). June 23, 1909 to March 4, 1917, nonrecording gage, and July 21, 1937 to October 23, 1979, water-stage recorder at site 1.2 mi downstream at datum 10.53 ft lower; March 5 to September 30, 1917, and June 22, 1928 to July 20, 1937, non-recording gage at site 1.18 mi downstream at datum 10.53 ft lower.
REMARKS.--Records good except those for estimated daily discharges, which are fair.
DISCHARGE, in CFS, WATER YEAR OCTOBER 2001 TO SEPTEMBER 2002 DAILY MEAN VALUES DAY OCT NOV DEC JAN FEB MAR APR MAY JUN JUL AUG SEP 1 282 1340 e1750 e560 e250 e125 e124 1320 1200 2930 505 531 2 273 1740 e1680 e540 e245 e125 e126 1250 1200 2110 457 489 3 266 1800 e1580 e510 e240 e124 e127 1210 1080 1500 413 476 4 231 1710 e1450 e490 e235 e123 e129 1170 960 1080 464 476 5 196 1560 e1470 e475 e225 e121 e132 1150 850 923 528 475 6 182 1420 e1500 e460 e220 e119 e137 1170 757 864 521 493 7 178 1310 e1600 e450 e215 e118 e145 1190 682 798 528 480 8 173 1220 e1750 e435 e210 e116 e150 1210 619 792 4950 446 9 184 1180 e1900 e425 e205 e114 e160 1350 579 850 4950 418 10 208 1160 e1750 e410 e200 e110 e180 1620 741 1230 2910 383 11 254 1140 e1600 e400 e195 e112 e260 1780 3580 1760 2030 360 12 427 1110 e1500 e390 e190 e114 e400 1820 3080 1710 1740 337 13 583 1060 e1420 e380 e185 e115 e600 1770 2360 1430 1680 321 14 812 1010 e1350 e370 e185 e116 e1000 1910 2210 1170 1490 313 15 960 960 e1250 e360 e180 e117 e1800 2130 2170 983 1310 291 16 994 914 e1200 e350 e175 e118 e3420 2130 2060 827 1330 271 17 976 870 e1130 e345 e170 e118 e4080 1960 1800 684 1350 255 18 923 835 e1050 e340 e170 e118 3510 1760 1520 561 1470 245 19 851 793 e1000 e335 e165 e118 3570 1570 1610 482 1600 236 20 782 755 e950 e325 e160 e118 3600 1400 3080 425 1580 228 21 724 722 e910 e320 e155 e118 3300 1260 2680 384 1370 224 22 678 706 e860 e315 e155 e118 2860 1140 2270 347 1180 230 23 657 687 e810 e310 e150 e118 2480 1050 3480 315 1000 244 24 655 676 e770 e305 e145 e118 2180 995 5670 296 857 249 25 713 723 e730 e295 e145 e118 1980 960 6920 294 741 249 26 827 1470 e700 e285 e140 e118 1800 919 7630 300 653 251 27 912 e1990 e670 e280 e135 e119 1640 866 7260 283 582 250 28 979 e1750 e640 e275 e130 e120 1510 813 6350 301 558 248 29 1000 e1200 e610 e270 --- e121 1430 902 5100 406 511 242 30 1030 e1450 e600 e265 --- e122 1380 1020 3930 508 488 240 31 1080 --- e580 e255 --- e123 --- 1160 --- 537 545 ---
TOTAL 18990 35261 36760 11525 5175 3672 44210 41955 83428 27080 40291 9951 MEAN 612.6 1175 1186 371.8 184.8 118.5 1474 1353 2781 873.5 1300 331.7 MAX 1080 1990 1900 560 250 125 4080 2130 7630 2930 4950 531 MIN 173 676 580 255 130 110 124 813 579 283 413 224 AC-FT 37670 69940 72910 22860 10260 7280 87690 83220 165500 53710 79920 19740 CFSM 0.36 0.70 0.71 0.22 0.11 0.07 0.88 0.81 1.66 0.52 0.77 0.20 IN. 0.42 0.78 0.81 0.26 0.11 0.08 0.98 0.93 1.85 0.60 0.89 0.22

127 RAINY RIVER BASIN--Continued
05131500 LITTLE FORK RIVER AT LITTLEFORK, MN--Continued
STATISTICS OF MONTHLY MEAN DATA FOR WATER YEARS 1909 - 2002, BY WATER YEAR (WY)
OCT NOV DEC JAN FEB MAR APR MAY JUN JUL AUG SEP
MEAN 904.8 737.4 324.5 153.0 115.9 282.1 3210 2875 1752 997.2 573.8 730.0 MAX 4450 3044 972 477 270 3022 8421 12190 5490 3643 2679 5189 (WY) 1996 1972 1983 1966 1969 1945 1966 1950 1944 1944 1988 1977 MIN 43.4 60.8 52.6 43.5 42.2 50.2 292 173 182 75.4 34.3 29.2 (WY) 1977 1977 1977 1931 1963 1940 1977 1977 1988 1988 1936 1976
SUMMARY STATISTICS FOR 2001 CALENDAR YEAR FOR 2002 WATER YEAR WATER YEARS 1909 - 2002 ANNUAL TOTAL 672128 358298 ANNUAL MEAN 1841 981.6 1069 HIGHEST ANNUAL MEAN 1912 1966 LOWEST ANNUAL MEAN 306 1931 HIGHEST DAILY MEAN 18500 Apr 14 7630 Jun 26 25000 Apr 18 1916 LOWEST DAILY MEAN 173 Oct 8 110 Mar 10 21 Aug 26 1936 ANNUAL SEVEN-DAY MINIMUM 181 Mar 18 114 Mar 8 22 Aug 21 1936 MAXIMUM PEAK FLOW 7690 Jun 26 25000 Apr 18 1916 MAXIMUM PEAK STAGE 11.64 Jun 26 37.00a Apr 18 1916 INSTANTANEOUS LOW FLOW 21 Aug 26 1936 ANNUAL RUNOFF (AC-FT) 1333000 710700 774600 ANNUAL RUNOFF (CFSM) 1.10 0.58 0.64 ANNUAL RUNOFF (INCHES) 14.88 7.93 8.65 10 PERCENT EXCEEDS 5880 1970 2830 50 PERCENT EXCEEDS 688 676 374 90 PERCENT EXCEEDS 186 131 87 a Also occurred May 11, 1950, site and datum then in use. e Estimated.
O N D2001
J F M A M J J A S2002
100
200
500
10001000
2000
5000
10,000
DAILY-MEAN DISCHARGE,
IN CUBIC FEET PER SECOND

128 RAINY RIVER BASIN--Continued
05132000 BIG FORK RIVER AT BIG FALLS, MN
LOCATION.--Lat 48°11’45", long 93°48’25", in SW1⁄4SE1⁄4 sec.35, T.155 N., R.25 W., Koochiching County, Hydrologic Unit 09030006,
on left bank at town of Big Falls, 700 ft downstream from falls, 0.3 mi downstream from bridge on U.S. Highway 71, and 4.8 mi upstream from Sturgeon River.
DRAINAGE AREA.--1,480 mi2.
PERIOD OF RECORD.--August to November 1909, April to November 1910, April 1911 to September 1912 (gage heights and discharge measurements only), June 1928 to September 1979, October 1979 to September 1982 (annual maximum only), October 1982 to September 1993, October 1993 to September 1994 (annual maximum only) and October 1997 to current year.
REVISED RECORDS.--WSP 1308:1935 (M).
GAGE.--Water-stage recorder. Datum of gage is 1,144.71 ft above sea level (NGVD of 1929). Prior to June 10, 1911, nonrecording gage at railroad bridge about 0.4 mi upstream at different datum. June 10, 1911 to Sept. 30, 1912, and June 22, 1928 to Dec. 17, 1937, nonrecording gage at site 200 ft upstream at same datum.
REMARKS.--Records good except those for estimated daily discharges, which are fair. Prior to 1971, a powerplant, located 0.3 mi upstream, caused some diurnal fluctuation at low flows.
DISCHARGE, CUBIC FEET PER SECOND, WATER YEAR OCTOBER 2001 TO SEPTEMBER 2002 DAILY MEAN VALUES DAY OCT NOV DEC JAN FEB MAR APR MAY JUN JUL AUG SEP 1 357 980 e620 e420 e300 e195 e215 1040 797 2360 520 465 2 355 1000 e660 e415 e300 e190 e215 1030 774 1960 468 445 3 359 994 e690 e410 e295 e185 e220 990 688 1680 436 448 4 359 974 e675 e405 e290 e190 e225 950 605 1430 408 437 5 357 935 e655 e400 e285 e195 e230 942 537 1260 381 429 6 356 894 e675 e390 e280 e200 e240 944 490 1140 355 429 7 357 875 e685 e385 e275 e200 e260 960 460 1050 1150 420 8 361 893 e690 e380 e270 e200 e300 975 441 1090 1380 411 9 364 896 e680 e375 e265 e200 e370 1120 434 1140 976 401 10 396 887 e665 e370 e265 e200 e440 1370 557 1520 894 391 11 511 864 e635 e365 e260 e200 e500 1570 1130 1670 838 380 12 646 835 e615 e365 e260 e200 e590 1570 1240 1580 775 365 13 713 819 e590 e360 e255 e200 e700 1480 1310 1410 727 364 14 765 807 e580 e360 e250 e200 e920 1450 1440 1240 641 347 15 810 799 e565 e360 e245 e200 e1500 1390 1320 1100 653 339 16 805 783 e550 e357 e245 e200 e2500 1310 1130 991 774 329 17 805 771 e540 e355 e240 e200 1970 1210 945 879 730 331 18 787 746 e530 e350 e235 e200 1760 1120 776 786 710 325 19 761 736 e520 e340 e230 e200 1900 1020 802 710 652 335 20 728 722 e510 e340 e225 e200 2000 932 1210 645 609 336 21 718 695 e505 e335 e225 e200 1970 857 1220 610 568 333 22 710 671 e495 e330 e220 e200 1820 777 1210 560 531 336 23 707 655 e485 e330 e215 e200 1620 742 4150 530 480 338 24 730 651 e480 e325 e215 e200 1480 738 7910 501 452 335 25 795 724 e470 e325 e210 e200 1390 741 9420 468 429 330 26 868 825 e465 e320 e210 e200 1270 716 8450 445 404 327 27 916 e680 e455 e320 e205 e205 1180 657 6570 440 407 319 28 919 e580 e445 e315 e205 e205 1080 640 4920 461 430 323 29 910 e400 e440 e310 --- e210 1030 654 3800 530 476 325 30 925 e385 e435 e310 --- e210 1030 734 2970 589 465 325 31 950 --- e430 e305 --- e210 --- 796 --- 567 464 ---
TOTAL 20100 23476 17435 11027 6975 6195 30925 31425 67706 31342 19183 11018 MEAN 648 783 562 356 249 200 1031 1014 2257 1011 619 367 MAX 950 1000 690 420 300 210 2500 1570 9420 2360 1380 465 MIN 355 385 430 305 205 185 215 640 434 440 355 319 AC-FT 39870 46560 34580 21870 13830 12290 61340 62330 134300 62170 38050 21850 CFSM 0.44 0.53 0.38 0.24 0.17 0.14 0.70 0.68 1.52 0.68 0.42 0.25 IN. 0.51 0.59 0.44 0.28 0.18 0.16 0.78 0.79 1.70 0.79 0.48 0.28

129 RAINY RIVER BASIN--Continued
05132000 BIG FORK RIVER AT BIG FALLS, MN--Continued
STATISTICS OF MONTHLY MEAN DATA FOR WATER YEARS 1909 - 2002, BY WATER YEAR (WY)
OCT NOV DEC JAN FEB MAR APR MAY JUN JUL AUG SEP
MEAN 669 553 294 178 142 253 1915 2010 1185 654 417 565 MAX 2247 2034 685 399 335 1928 5186 7496 2890 2321 1799 2989 (WY) 1970 1972 1970 1969 1969 1945 1966 1950 1974 1944 1978 1937 MIN 38.3 44.5 31.6 22.2 22.9 32.9 175 138 180 46.0 26.7 22.4 (WY) 1932 1935 1935 1935 1935 1940 1931 1931 1934 1931 1934 1934
SUMMARY STATISTICS FOR 2001 CALENDAR YEAR FOR 2002 WATER YEAR WATER YEARS 1909 - 2002 ANNUAL TOTAL 454241 276807 ANNUAL MEAN 1244 758 737 HIGHEST ANNUAL MEAN 1362 1950 LOWEST ANNUAL MEAN 92.0 1931 HIGHEST DAILY MEAN 9360 Apr 15 9420 Jun 25 14800 May 9 1950 LOWEST DAILY MEAN 237 Mar 18 185 Mar 3 14 Jan 10 1940 ANNUAL SEVEN-DAY MINIMUM 237 Mar 18 194 Mar 1 18 Jan 22 1935 MAXIMUM PEAK FLOW 9570 Jun 25 14800 May 8 1950 MAXIMUM PEAK STAGE 12.50 Jun 25 17.08 May 8 1950 INSTANTANEOUS LOW FLOW 7.0 Aug 7 1939 ANNUAL RUNOFF (AC-FT) 901000 549000 533900 ANNUAL RUNOFF (CFSM) 0.84 0.51 0.50 ANNUAL RUNOFF (INCHES) 11.42 6.96 6.77 10 PERCENT EXCEEDS 3920 1310 1810 50 PERCENT EXCEEDS 510 530 337 90 PERCENT EXCEEDS 242 215 81 e Estimated.
O N D2001
J F M A M J J A S2002
100
200
500
10001000
2000
5000
10,000
DAILY-MEAN DISCHARGE,
IN CUBIC FEET PER SECOND

130 RAINY RIVER BASIN--Continued
05133500 RAINY RIVER AT MANITOU RAPIDS, MN (International Gaging Station)
LOCATION.--Lat 48°38’04", long 93°54’47", in NW1⁄4SE1⁄4 sec. 36, T.160 N., R.26 W., Koochiching County, Hydrologic Unit
09030004, on left bank at Manitou Rapids, 4 mi west of Indus.
DRAINAGE AREA.--19,400 mi2 (approximately).
PERIOD OF RECORD.--July 1928 to current year. Monthly discharge only for some periods, published in WSP 1308. October 1911 to October 1924 (gage heights only) at site near Birchdale in files of U.S. Army Corps of Engineers. Published as "near Birchdale" 1932-34.
GAGE.--Water-stage recorder. Datum of gage is 1,062.48 ft above sea level (NGVD of 1929). Prior to Nov. 10, 1934, nonrecording gage at site near Birchdale, 7 mi. downstream at different datum.
REMARKS.--Records good except those for estimated daily discharges, which are fair. Diurnal fluctuation caused by power plants at International Falls. Some regulation at Rainy and Namakan Lakes affects low and medium flows.
COOPERATION.--This station is one of the international gaging stations maintained by the United States under agreement with Canada.
DISCHARGE, CUBIC FEET PER SECOND, WATER YEAR OCTOBER 2001 TO SEPTEMBER 2002 DAILY MEAN VALUES DAY OCT NOV DEC JAN FEB MAR APR MAY JUN JUL AUG SEP 1 6920 14200 15100 e15000 e11900 e10000 5510 8170 7540 50200 16500 8300 2 9100 14400 15400 e15000 e11900 e9800 7050 8130 7650 47800 16200 8510 3 9140 15100 15400 e15000 e11700 e8200 7810 8140 7470 45900 13700 8450 4 9120 14800 15300 e15300 e11700 e8200 6630 7870 7170 44300 11200 9330 5 9040 14700 15300 e15200 e11700 e9500 5710 7910 6890 46900 10500 9160 6 8590 14200 15500 e15000 e12000 e9800 5580 7890 6600 48500 10200 8900 7 6180 14100 e15000 e14800 e12000 e9800 5420 7940 6310 46200 8980 8960 8 5420 14200 e14600 e14700 e12000 e9400 5490 8050 6190 44800 8450 9040 9 6370 14700 e14500 e14600 e11800 e8800 5500 8300 6190 44000 12300 8870 10 7190 15000 e14500 e14300 e11600 e7200 5660 9100 15700 43400 12300 8810 11 9800 15000 e16500 e14000 e11300 e7800 5970 9770 35900 43300 10200 8460 12 11100 15000 e17900 e13700 e11100 e8800 6440 10100 46100 43100 9010 7170 13 12600 13900 e17800 e13600 e11000 e9400 7200 10100 47000 42300 8460 6430 14 14600 14000 e17700 e13500 e10900 e9600 8110 10100 49400 41300 8230 5860 15 15700 14200 e17000 e12600 e10700 e9700 8980 9970 49300 40400 8050 5810 16 16000 14200 e16300 e12600 e10600 e9600 10100 9840 48000 39300 9090 5690 17 16100 13900 e16000 e12700 e10400 e8700 13200 9620 46600 38500 10600 5630 18 15900 13200 e16000 e12500 e10300 e8700 12900 9230 45300 37700 11400 5530 19 15800 13100 e15700 e12200 e10600 e9800 11900 8850 45100 36800 11600 5460 20 16100 13400 e15400 e12000 e10700 e9700 11800 8440 46500 36000 11600 5470 21 16200 13200 e15000 e12000 e10600 e9400 11600 8050 47600 35300 11400 5410 22 16100 13300 e14700 e12100 e10500 e9600 11300 7710 48900 34300 11000 5460 23 15100 13300 e15300 e12200 e10400 e10000 10700 7370 52100 33600 10200 5430 24 14600 13100 e15400 e12100 e10000 e9300 10100 7310 55400 32800 9420 5430 25 14500 12300 e15800 e12000 e9800 e9000 9700 7190 60200 32000 9010 5350 26 14700 12500 e16500 e12000 e9700 e10100 9540 7060 63100 31100 8760 5330 27 14300 14100 e16500 e11800 e10100 e9700 9090 7030 63100 30000 8290 5300 28 14400 15000 e16100 e11700 e10200 e9400 8680 6850 60600 28400 7970 5310 29 14600 14800 e14800 e11800 --- 9080 8340 6730 56900 26300 7880 5290 30 14600 14800 e14800 e11900 --- 6460 8280 6820 53300 22600 7840 5230 31 14200 --- e15000 e11900 --- 5570 --- 7210 --- 18200 7920 ---
TOTAL 384070 421700 486800 409800 307200 280110 254290 256850 1098110 1185300 318260 203380 MEAN 12390 14060 15700 13220 10970 9036 8476 8285 36600 38240 10270 6779 MAX 16200 15100 17900 15300 12000 10100 13200 10100 63100 50200 16500 9330 MIN 5420 12300 14500 11700 9700 5570 5420 6730 6190 18200 7840 5230 AC-FT 761800 836400 965600 812800 609300 555600 504400 509500 2178000 2351000 631300 403400 CFSM 0.64 0.72 0.81 0.68 0.57 0.47 0.44 0.43 1.89 1.97 0.53 0.35 IN. 0.74 0.81 0.93 0.79 0.59 0.54 0.49 0.49 2.11 2.27 0.61 0.39

131 RAINY RIVER BASIN--Continued
05133500 RAINY RIVER AT MANITOU RAPIDS, MN--Continued (International Gaging Station)
STATISTICS OF MONTHLY MEAN DATA FOR WATER YEARS 1929 - 2002, BY WATER YEAR (WY)
OCT NOV DEC JAN FEB MAR APR MAY JUN JUL AUG SEP
MEAN 11890 11500 10270 9194 8741 8954 15580 19740 20330 16950 11690 11120 MAX 42410 37280 27790 18430 17240 16640 38100 52880 49480 47970 33700 30620 (WY) 1942 1972 1972 1972 1969 1945 1966 1950 1950 1950 1944 1988 MIN 4728 3796 3190 2900 3129 2926 4378 4106 3676 3483 3422 3746 (WY) 1981 1977 1930 1931 1931 1931 1977 1977 1980 1980 1980 1998
SUMMARY STATISTICS FOR 2001 CALENDAR YEAR FOR 2002 WATER YEAR WATER YEARS 1929 - 2002 ANNUAL TOTAL 7606430 5605870 ANNUAL MEAN 20840 15360 13010 HIGHEST ANNUAL MEAN 23260 1950 LOWEST ANNUAL MEAN 4470 1931 HIGHEST DAILY MEAN 60100 May 25 63100 Jun 26,27 71300 May 11 1950 LOWEST DAILY MEAN 5400 Feb 19 5230a Sep 30 928 Dec 26 1929 ANNUAL SEVEN-DAY MINIMUM 6140 Apr 1 5320 Sep 24 1500 Dec 24 1929 MAXIMUM PEAK FLOW 63800 Jun 26 71600 May 12 1950 MAXIMUM PEAK STAGE 19.33 Jun 26 21.04 May 12 1950 ANNUAL RUNOFF (AC-FT) 15090000 11120000 9427000 ANNUAL RUNOFF (CFSM) 1.07 0.79 0.67 ANNUAL RUNOFF (INCHES) 14.59 10.75 9.11 10 PERCENT EXCEEDS 41900 38000 25700 50 PERCENT EXCEEDS 15000 11600 10300 90 PERCENT EXCEEDS 8000 6620 5060 a Falling stage. e Estimated.
O N D2001
J F M A M J J A S2002
1000
2000
5000
10,00010,000
20,000
50,000
100,000
DAILY-MEAN DISCHARGE,
IN CUBIC FEET PER SECOND

132 RAINY RIVER BASIN--Continued
05140520 LAKE OF THE WOODS AT WARROAD, MN (International gaging station)
LOCATION.--Lat 48°54’15", long 95°18’57", in SW1⁄4SE1⁄4 sec.29, T. 163 N., R. 36 W., Roseau County, Hydrologic Unit 09030009, on
left bank of Warroad River in Warroad, 300 ft downstream from Canadian National railroad bridge, 1000 ft downstream from bridge on State Highway 11, and 4000 ft upstream from mouth of Warroad River.
DRAINAGE AREA.--27,200 mi2.
PERIOD OF RECORD.--April to September 1978, month-end elevations only. October 1978 to September 1985, daily-mean elevations; October 1985 to December 1994 and October 1997 to current year, daily-mean elevations (gage heights). Records collected prior to April 1978 are in reports of the Water Survey of Canada.
GAGE.--Water-stage recorder. Datum at gage is 1,000.00 ft above sea level (Lake of the Woods datum).
REMARKS.--Records good. Runoff conditions of the Warroad River can affect water levels at this station. Water level subject to fluctuation caused by changes in direction and velocity of wind and resulting seiches.
COOPERATION.--This station is one of the international gaging stations maintained by the United States under agreement with Canada.
EXTREMES FOR PERIOD OF RECORD.--Maximum gage height, 62.55 ft, June 27, 2001; maximum daily, 62.31 ft, Jul. 9, 2002; minimum gage height recorded, 55.94 ft, Sept. 4, 1980; minimum daily recorded, 56.52 ft, Apr. 15, 1981.
EXTREMES FOR CURRENT YEAR.--Maximum gage height, 62.44 ft, Jul. 10; maximum daily, 62.31 ft, Jul. 9; minimum gage height, 57.81 ft, May 2; minimum daily, 58.01 ft, Apr. 12.
GAGE HEIGHT FEET, WATER YEAR OCTOBER 2001 TO SEPTEMBER 2002 DAILY MEAN VALUES DAY OCT NOV DEC JAN FEB MAR APR MAY JUN JUL AUG SEP 1 59.68 59.17 59.31 59.41 --- 58.55 58.19 58.14 58.53 61.95 61.30 59.87 2 60.02 59.40 59.48 59.40 --- 58.54 58.15 58.10 58.59 61.83 61.28 59.58 3 59.61 59.53 59.46 59.41 --- 58.52 58.14 58.21 58.56 61.89 61.34 59.68 4 59.38 59.57 59.42 59.39 59.02 58.51 58.14 58.20 58.48 62.07 61.32 60.01 5 59.54 59.54 59.53 59.38 59.01 58.47 58.11 58.39 58.52 62.11 61.33 59.87 6 59.55 59.63 59.39 59.38 58.98 58.45 58.13 58.46 58.42 62.12 61.17 59.83 7 59.60 59.68 59.46 59.38 58.99 58.46 58.07 58.30 58.34 62.15 61.10 59.76 8 59.57 59.52 59.44 59.36 58.97 58.46 58.06 58.59 58.57 62.18 60.90 59.77 9 59.51 59.46 59.45 59.34 58.95 58.41 58.04 58.30 59.19 62.31 60.77 59.81 10 59.60 59.61 59.44 59.36 58.93 58.41 58.05 58.37 --- 62.25 60.77 59.74 11 59.47 59.68 59.49 59.35 58.90 58.43 58.02 58.34 --- 62.12 60.79 59.69 12 59.44 59.65 59.38 59.33 58.88 58.43 58.01 58.34 --- 62.07 60.56 59.57 13 59.52 59.55 59.45 59.37 58.88 58.39 58.02 58.43 --- 62.04 60.48 59.54 14 59.49 59.52 59.48 59.34 58.87 58.40 58.04 58.40 --- 62.04 60.42 59.54 15 59.40 59.56 59.48 59.31 58.83 58.39 58.05 58.51 60.75 62.02 60.51 59.28 16 59.51 59.59 59.47 59.31 58.81 58.38 58.08 58.66 60.85 62.03 60.38 59.41 17 59.43 59.55 59.48 59.27 58.83 58.39 58.06 58.52 60.86 62.10 59.94 59.41 18 59.39 59.52 59.45 59.27 58.79 58.34 58.10 58.50 60.83 62.10 60.35 59.42 19 59.30 59.47 59.45 59.25 58.78 58.34 58.08 58.57 60.95 62.00 60.26 59.47 20 59.41 59.35 59.46 59.26 58.77 58.33 58.10 58.46 60.95 62.01 60.15 59.20 21 59.44 59.62 59.51 59.25 58.74 58.29 58.11 58.36 61.15 61.94 60.34 59.01 22 59.59 59.65 59.48 59.23 58.74 58.27 58.10 58.38 61.29 61.96 60.33 59.16 23 59.45 59.53 59.42 59.20 58.69 58.27 58.13 58.72 61.48 61.92 60.15 59.33 24 60.24 59.90 59.42 59.20 58.67 58.29 58.13 58.44 61.46 61.89 60.15 59.04 25 59.70 60.34 59.41 59.20 58.63 58.28 58.13 58.39 61.53 61.83 60.05 59.02 26 59.57 60.35 59.41 59.19 58.62 58.27 58.22 58.29 61.65 61.79 60.16 59.08 27 59.41 60.48 59.40 59.16 58.61 58.28 58.26 58.43 61.70 61.75 60.09 59.14 28 59.44 59.76 59.41 59.14 58.57 58.24 58.20 58.42 61.75 61.72 59.96 59.18 29 59.57 59.50 59.41 --- --- 58.22 58.19 58.47 61.80 61.63 59.99 59.04 30 59.59 59.46 59.40 --- --- 58.21 58.24 58.39 61.73 61.58 59.91 59.07 31 59.63 --- 59.39 --- --- 58.19 --- 58.44 --- 61.54 59.75 ---
MEAN 59.55 59.64 59.44 --- --- 58.37 58.11 58.40 --- 61.97 60.52 59.45 MAX 60.24 60.48 59.53 --- --- 58.55 58.26 58.72 --- 62.31 61.34 60.01 MIN 59.30 59.17 59.31 --- --- 58.19 58.01 58.10 --- 61.54 59.75 59.01

133 RAINY RIVER BASIN--Continued
05140520 LAKE OF THE WOODS AT WARROAD, MN--Continued (International gaging station)
O N D2001
J F M A M J J A S2002
58
59
60
61
62
63
GAGE HEIGHT, IN FEET
Gap indicatesmissing record

134 RAINY RIVER BASIN--Continued
05140521 LAKE OF THE WOODS AT SPRINGSTEEL ISLAND NEAR WARROAD, MN
LOCATION.--Lat 48°56’45", long 95°18’24", in SW1⁄4SW1⁄4 sec. 9, T. 163 N., R. 36 W., Roseau County, Hydrologic Unit 09030009, at
Springsteel Resort on Springsteel Island, 2.8 mi north of Warroad.
DRAINAGE AREA.--27,200 mi2.
PERIOD OF RECORD.--June 1985 to current year.
GAGE.--Water-stage recorder. Datum at gage is 1,000.00 ft above sea level (Lake of the Woods datum).
REMARKS.--Records fair. Water level subject to fluctuation caused by changes in direction and velocity of wind and resulting seiches.
EXTREMES FOR PERIOD OF RECORD.--Maximum gage height, 62.53 ft, July 5, 2002; maximum daily, 62.25 ft, July 9, 2002; minimum gage height, 57.22 ft, Nov. 22, 1990; minimum daily, 57.43 ft, Mar. 18, 19, 20, 1988.
EXTREMES FOR CURRENT YEAR.--Maximum gage height, 62.53 ft, July 5; maximum daily, 62.25 ft, July 9; minimum gage height, 57.87 ft, May 2; minimum daily, 57.99 ft, Apr. 12, 13.
GAGE HEIGHT, FEET, WATER YEAR OCTOBER 2001 TO SEPTEMBER 2002 DAILY MEAN VALUES DAY OCT NOV DEC JAN FEB MAR APR MAY JUN JUL AUG SEP 1 59.67 59.22 59.31 59.38 59.05 58.59 58.17 58.14 58.52 62.00 61.30 59.85 2 59.94 59.40 59.48 59.38 59.04 58.57 58.13 58.09 58.57 61.90 61.28 59.59 3 59.61 59.54 59.47 59.39 59.00 58.55 58.13 58.25 58.54 61.97 61.35 59.67 4 59.38 59.59 59.42 59.36 59.00 58.54 58.12 58.17 58.48 62.16 61.34 59.99 5 59.52 59.54 59.51 59.35 58.98 58.51 58.10 58.33 58.51 62.24 61.36 59.88 6 59.56 59.61 59.39 59.35 58.95 58.48 58.13 58.37 58.46 62.12 61.10 59.80 7 59.60 59.67 59.47 59.36 58.96 58.49 58.08 58.26 58.36 62.11 60.96 59.72 8 59.58 59.51 59.45 59.34 58.95 58.49 58.05 58.48 58.55 62.14 60.78 59.71 9 59.50 59.47 59.46 59.31 58.92 58.45 58.04 58.25 59.10 62.25 60.65 59.75 10 59.57 59.60 59.45 59.32 58.91 58.46 58.04 58.34 59.50 62.22 60.63 59.74 11 59.48 59.66 59.50 59.32 58.88 58.47 58.02 58.32 59.91 62.09 60.64 59.71 12 59.47 59.63 59.40 59.30 58.86 58.41 57.99 58.33 60.12 62.04 60.42 59.60 13 59.52 59.54 59.47 59.34 58.86 58.36 57.99 58.38 60.40 62.01 60.33 59.59 14 59.49 59.52 59.51 59.31 58.85 58.37 58.00 58.40 60.56 62.00 60.29 59.58 15 59.39 59.54 59.51 59.28 58.82 58.35 58.01 58.47 60.67 62.00 60.37 59.34 16 59.51 59.58 59.49 59.28 58.80 58.35 58.04 58.58 60.81 62.02 60.23 59.41 17 59.47 59.54 59.51 59.24 58.82 58.35 58.03 58.49 60.87 62.08 59.84 59.46 18 59.40 59.50 59.43 59.25 58.78 58.31 58.07 58.46 60.88 62.06 60.25 59.44 19 59.32 59.45 59.43 59.22 58.78 58.31 58.07 58.51 60.90 61.96 60.17 59.47 20 59.41 59.36 59.44 59.23 58.77 58.29 58.10 58.44 60.87 61.97 60.08 59.22 21 59.45 59.60 59.47 59.21 58.75 58.26 58.12 58.38 61.07 61.91 60.25 59.03 22 59.59 59.64 59.44 59.19 58.75 58.25 58.12 58.39 61.20 61.89 60.24 59.17 23 59.45 59.53 59.39 59.17 58.71 58.24 58.15 58.60 61.38 61.87 60.11 59.31 24 60.04 59.80 59.40 59.17 58.68 58.26 58.14 58.42 61.41 61.86 60.14 59.07 25 59.63 60.14 59.39 59.16 58.65 58.24 58.13 58.39 61.48 61.81 60.01 59.05 26 59.56 60.19 59.38 59.15 58.65 58.24 58.24 58.30 61.62 61.79 60.18 59.09 27 59.44 60.32 59.39 59.13 58.64 58.25 58.28 58.43 61.69 61.72 60.09 59.12 28 59.46 59.75 59.39 59.11 58.60 58.22 58.24 58.43 61.77 61.66 59.90 59.16 29 59.56 59.49 59.38 59.10 --- 58.19 58.22 58.46 61.85 61.57 59.93 59.05 30 59.61 59.45 59.38 59.09 --- 58.18 58.23 58.42 61.80 61.54 59.90 59.07 31 59.63 --- 59.37 59.07 --- 58.17 --- 58.45 --- 61.53 59.76 ---
MEAN 59.54 59.61 59.43 59.25 58.84 58.36 58.11 58.38 60.26 61.95 60.45 59.45 MAX 60.04 60.32 59.51 59.39 59.05 58.59 58.28 58.60 61.85 62.25 61.36 59.99 MIN 59.32 59.22 59.31 59.07 58.60 58.17 57.99 58.09 58.36 61.53 59.76 59.03

135 RAINY RIVER BASIN--Continued
05140521 LAKE OF THE WOODS AT SPRINGSTEEL ISLAND NEAR WARROAD, MN--Continued
O N D2001
J F M A M J J A S2002
57
58
59
60
61
62
63
GAGE HEIGHT, IN FEET

136 UPPER MISSISSIPPI RIVER MAIN STEM
05200510 MISSISSIPPI RIVER NEAR BEMIDJI, MN
LOCATION.--Lat 47°29’00", long 94°43’40", in SE1⁄4SW1⁄4 sec. 3, T.146 N., R.32 W., Beltrami County, Hydrologic Unit 07010101, on
right bank 100 ft upstream of County Highway 12, 400 ft downstream from Stump Lake dam, and 3.5 mi east of Bemidji .
DRAINAGE AREA.--610 mi2 (approximately).
PERIOD OF RECORD.--September 1987 to current year (no winter records).
GAGE.--Water-stage recorder. Elevation of gage is 1,315 ft above sea level (from topographic map).
REMARKS.--Records good. Flow regulated by Stump Lake Dam upstream from station.
DISCHARGE, CUBIC FEET PER SECOND, WATER YEAR OCTOBER 2001 TO SEPTEMBER 2002 DAILY MEAN VALUES DAY OCT NOV DEC JAN FEB MAR APR MAY JUN JUL AUG SEP 1 143 484 --- --- --- 200 197 397 380 1250 422 313 2 142 395 --- --- --- 200 197 397 372 1270 570 314 3 143 389 --- --- --- 200 184 385 364 1200 668 316 4 147 382 --- --- --- 200 145 389 363 1150 640 312 5 144 500 --- --- --- 200 144 386 361 1140 426 312 6 140 641 --- --- --- 200 143 382 279 1120 271 315 7 136 746 --- --- --- 200 137 380 239 1110 258 315 8 135 910 --- --- --- 200 105 351 239 1220 264 315 9 139 845 --- --- --- 200 82 411 241 1140 265 371 10 154 813 --- --- --- 200 106 405 253 1130 271 467 11 158 766 --- --- --- 200 104 397 261 1050 273 459 12 157 688 --- --- --- 200 103 399 260 941 275 456 13 167 636 --- --- --- 200 102 401 262 936 275 453 14 173 366 --- --- --- 200 100 397 264 919 275 451 15 177 201 --- --- --- 200 97 400 264 845 275 444 16 176 200 --- --- --- 200 93 401 266 746 275 439 17 174 200 --- --- --- 200 94 401 265 728 278 433 18 184 198 --- --- --- 200 176 401 265 728 277 430 19 189 197 --- --- --- 200 311 402 275 695 277 432 20 194 198 --- --- --- 200 302 402 281 660 275 377 21 197 200 --- --- --- 200 302 397 273 665 275 351 22 202 200 --- --- --- 202 305 392 283 596 275 351 23 212 200 --- --- --- 200 306 398 310 547 276 347 24 325 200 --- --- --- 201 319 394 363 550 274 346 25 442 200 --- --- --- 202 323 391 417 461 271 343 26 432 127 --- --- --- 201 311 391 529 427 269 343 27 419 40 --- --- --- 200 312 384 738 431 268 269 28 416 42 --- --- --- 200 317 381 946 430 308 228 29 563 45 --- --- --- 199 369 386 987 428 307 228 30 594 47 --- --- --- 197 396 391 1040 428 308 218 31 469 --- --- --- --- 197 --- 387 --- 425 310 ---
TOTAL 7443 11056 --- --- --- 6199 6182 12176 11640 25366 9951 10748 MEAN 240 369 --- --- --- 200 206 393 388 818 321 358 MAX 594 910 --- --- --- 202 396 411 1040 1270 668 467 MIN 135 40 --- --- --- 197 82 351 239 425 258 218 AC-FT 14760 21930 --- --- --- 12300 12260 24150 23090 50310 19740 21320 CFSM 0.39 0.60 --- --- --- 0.33 0.34 0.64 0.64 1.34 0.53 0.59 IN. 0.45 0.67 --- --- --- 0.38 0.38 0.74 0.71 1.55 0.61 0.66

137 UPPER MISSISSIPPI RIVER MAIN STEM
05200510 MISSISSIPPI RIVER NEAR BEMIDJI, MN--Continued
STATISTICS OF MONTHLY MEAN DATA FOR WATER YEARS 1987 - 2002, BY WATER YEAR (WY)
OCT NOV DEC JAN FEB MAR APR MAY JUN JUL AUG SEP
MEAN 233 469 330 --- --- 230 435 464 329 344 220 263 MAX 471 790 406 --- --- 247 889 858 866 912 477 837 (WY) 2000 2001 2001 --- --- 1998 1997 2001 2001 1997 1999 1999 MIN 75.5 322 254 --- --- 200 148 181 104 62.2 61.9 62.3 (WY) 1991 2000 2000 --- --- 2002 1992 1992 1988 1988 1989 1990
SUMMARY STATISTICS FOR 2001 CALENDAR YEAR FOR 2002 WATER YEAR WATER YEARS 1987 - 2002 HIGHEST DAILY MEAN 1270 Apr 23 1270 Jul 2 1320 Jul 14 1997 LOWEST DAILY MEAN 40 Nov 27 40 Nov 27 22a Jul 12 1988 ANNUAL SEVEN-DAY MINIMUM 87 Aug 10 99 Apr 11 24 Jul 7 1988 MAXIMUM PEAK FLOW 1520 Jul 1 1820 Jul 11 1997 MAXIMUM PEAK STAGE 5.66 Jul 1 5.98 Jul 11 1997 INSTANTANEOUS LOW FLOW 32a Apr 8
a Minimum recorded.
O N D2001
J F M A M J J A S2002
10
20
50
100100
200
500
10001000
2000
5000
10,000
DAILY-MEAN DISCHARGE,
IN CUBIC FEET PER SECOND
Gap indicatesmissing record

138 UPPER MISSISSIPPI RIVER MAIN STEM-Continued
05211000 MISSISSIPPI RIVER AT GRAND RAPIDS, MN
LOCATION.--Lat 47°13’56", long 93°31’48", in SW1⁄4NW1⁄4 sec. 27, T.55 N., R.25 W., Itasca County, Hydrologic Unit 07010103, on
left bank, in utility room of Blandin Paper Mill in Grand Rapids, 400 ft downstream from Blandin Dam, 400 ft upstream from bridge on U.S. Highway 169, 2.5 mi upstream from Prairie River, and at mile 1,182 upstream from Ohio River.
DRAINAGE AREA.--3,370 mi2 (approximately).
PERIOD OF RECORD.--October 1883 to current year.
GAGE.--Water-stage recorder. Datum of gage is 1,242.03 ft above sea level (NGVD of 1929). See WSP 1914 for history of changes prior to Jan. 17, 1951.
REMARKS.--Records good except those for estimated daily discharges, which are fair. Flow regulated by Winnibigoshish Lake, Leech Lake, Pokegama Lake, Blandin Paper Mill (up to 16 ft3/s diverted for paper production), and occasionally at low flow by power plant at Blandin Dam. Backwater from Prairie River occurs at times in most years.
DISCHARGE, CUBIC FEET PER SECOND, WATER YEAR OCTOBER 2001 TO SEPTEMBER 2002 DAILY MEAN VALUES DAY OCT NOV DEC JAN FEB MAR APR MAY JUN JUL AUG SEP 1 1470 2080 e1150 e1860 e1690 1360 427 421 517 e1580 2150 1160 2 1610 2060 e1160 e1860 e1640 1450 493 480 559 e1580 2280 951 3 1700 2030 e1180 e1870 e1660 1460 440 423 466 e1590 2040 1070 4 1580 2010 e1220 e1880 e1680 1440 456 366 387 e1590 2060 1050 5 1700 1990 e1250 e1890 e1690 1380 502 464 412 e1590 2000 974 6 1710 1940 1760 e1910 e1700 1160 497 384 379 e1820 1730 1110 7 1620 1920 1680 e1920 e1710 1230 431 421 354 e1820 1720 1090 8 1650 2000 1760 e1940 1750 1190 510 449 430 e1820 1820 946 9 1770 1880 1820 e1950 1620 1250 484 546 411 e1750 1770 1010 10 1750 1850 1840 e1960 1690 1350 486 607 364 1520 1750 1130 11 2190 1890 1960 1980 1680 1170 564 594 417 1560 1760 983 12 2340 1880 2030 1960 1740 930 445 623 403 1280 1840 993 13 2270 1830 2050 1960 1720 902 540 752 336 1300 1780 1040 14 2310 1820 2180 1900 1720 929 522 955 457 1300 1650 1030 15 2290 1780 2100 1890 1760 949 677 914 363 1460 1580 975 16 2230 1800 2170 1940 1830 988 746 892 386 2040 1630 950 17 2190 1760 2150 1950 1870 958 797 871 402 2030 1540 e940 18 2190 1750 2250 e1950 1820 921 1090 751 436 2000 1680 e940 19 e2190 1840 2250 e1940 1840 948 880 747 483 1970 1530 e780 20 e2170 1690 e2100 e1940 1870 635 1000 714 405 1960 1370 e740 21 e2150 1680 e1700 e1930 1880 741 1030 723 517 1950 1290 735 22 e2120 1740 e1650 e1920 1810 472 791 710 e630 1930 1310 795 23 e2000 1710 e1750 e1910 1780 413 550 690 e700 1840 1280 738 24 2180 1710 e1780 e1910 1770 460 634 493 e1350 1610 1340 794 25 2130 1790 e1820 e1900 1720 434 423 504 e1580 1810 1260 997 26 2160 1780 e1850 e1900 1450 439 496 573 e1580 1960 1130 778 27 2200 1720 e1900 e1880 1250 425 354 495 e1590 1830 1100 921 28 2110 1730 e1870 e1860 1380 452 450 545 e1600 1670 e1070 814 29 2050 1470 e1850 e1830 --- 457 523 544 e1590 1730 e1070 858 30 2100 1320 e1850 e1790 --- 472 326 513 e1580 1750 1080 855 31 2110 --- e1850 e1740 --- 478 --- 509 --- 1820 1020 ---
TOTAL 62240 54450 55930 59020 47720 27843 17564 18673 21084 53460 48630 28147 MEAN 2008 1815 1804 1904 1704 898 585 602 703 1725 1569 938 MAX 2340 2080 2250 1980 1880 1460 1090 955 1600 2040 2280 1160 MIN 1470 1320 1150 1740 1250 413 326 366 336 1280 1020 735 AC-FT 123500 108000 110900 117100 94650 55230 34840 37040 41820 106000 96460 55830 CFSM 0.60 0.54 0.54 0.56 0.51 0.27 0.17 0.18 0.21 0.51 0.47 0.28 IN. 0.69 0.60 0.62 0.65 0.53 0.31 0.19 0.21 0.23 0.59 0.54 0.31

139 UPPER MISSISSIPPI RIVER MAIN STEM-Continued
05211000 MISSISSIPPI RIVER AT GRAND RAPIDS, MN--Continued
STATISTICS OF MONTHLY MEAN DATA FOR WATER YEARS 1884 - 2002, BY WATER YEAR (WY)
OCT NOV DEC JAN FEB MAR APR MAY JUN JUL AUG SEP
MEAN 1458 1357 1156 1141 1130 1074 1040 1163 1246 1372 1352 1396 MAX 3544 3259 2608 2410 2729 2762 3622 3668 3271 3363 4505 4438 (WY) 1902 1903 2000 1952 1945 1945 1901 1901 1962 1962 1905 1905 MIN 103 122 150 165 155 129 106 32.5 185 125 88.3 89.2 (WY) 1937 1937 1937 1937 1934 1937 1937 1949 1936 1961 1934 1934
SUMMARY STATISTICS FOR 2001 CALENDAR YEAR FOR 2002 WATER YEAR WATER YEARS 1884 - 2002 ANNUAL TOTAL 811426 494761 ANNUAL MEAN 2223 1356 1250a HIGHEST ANNUAL MEAN 2429 1906 LOWEST ANNUAL MEAN 193 1934 HIGHEST DAILY MEAN 3340 Jun 16 2340 Oct 12 8900 Sep 29 1914 LOWEST DAILY MEAN 200 Apr 11 326 Apr 30 0.00b Oct 2 1948 ANNUAL SEVEN-DAY MINIMUM 804 Apr 8 388 Jun 7 24 May 9 1949 MAXIMUM PEAK FLOW 2470c Aug 1 12500d Sep 3 1948 MAXIMUM PEAK STAGE 9.35f Jun 29 15.20g Sep 3 1948 INSTANTANEOUS LOW FLOW 145h Mar 22 ANNUAL RUNOFF (AC-FT) 1609000 981400 905400 ANNUAL RUNOFF (CFSM) 0.66 0.40 0.37 ANNUAL RUNOFF (INCHES) 8.96 5.46 5.04 10 PERCENT EXCEEDS 2860 2030 2360 50 PERCENT EXCEEDS 2300 1580 1160 90 PERCENT EXCEEDS 1490 457 311 a Median of annual mean discharges is 1240 ft3/s. b Many days, several years. c Gage height, 7.16 ft. d From rating curve extended above 4500 ft3/s. e Estimated. f Backwater from Prairie River. g From floodmark; result of dam failure. h Result of regulation.
O N D2001
J F M A M J J A S2002
100
200
500
10001000
2000
5000
10,000
DAILY-MEAN DISCHARGE,
IN CUBIC FEET PER SECOND

140 UPPER MISSISSIPPI RIVER MAIN STEM-Continued
05212700 PRAIRIE RIVER NEAR TACONITE, MN
LOCATION.--Lat 47°23’20", long 93°22’50", in NW1⁄4SW1⁄4 sec. 21, T.57 N., R.24 W., Itasca County, Hydrologic Unit 07010103, on
left bank 125 ft downstream from bridge on County Highway 7, 1.5 mi downstream from outlet of Lawrence Lake and 5 mi north of Taconite.
DRAINAGE AREA.--371 mi2 (revised).
PERIOD OF RECORD.--April 1967 to September 1983, February 2001 to current year.
GAGE.--Water-stage recorder. Datum of gage is 1,294.81 ft above sea level (NGVD of 1929). Prior to Aug. 31, 1967, nonrecording gage at site 125 ft downstream (same datum).
REMARKS.--Records good except those for estimated daily discharges, which are poor.
DISCHARGE, CUBIC FEET PER SECOND, WATER YEAR OCTOBER 2001 TO SEPTEMBER 2002 DAILY MEAN VALUES DAY OCT NOV DEC JAN FEB MAR APR MAY JUN JUL AUG SEP 1 49 162 243 e137 e91 e78 87 265 190 1790 165 116 2 48 163 e231 e134 e91 e77 87 256 191 1510 174 116 3 47 161 e237 e131 e90 e76 86 246 189 1280 196 116 4 45 160 250 e126 e90 e76 85 244 182 1070 226 108 5 44 156 258 e125 e90 e75 85 237 172 926 246 106 6 42 155 269 e121 e90 e75 82 234 158 810 251 102 7 40 152 275 e119 e90 e75 87 227 151 717 251 98 8 39 154 280 e117 e90 e76 93 226 144 674 242 96 9 41 147 283 e117 e90 e78 96 239 135 611 221 95 10 52 147 277 e114 e90 e80 106 243 131 565 203 98 11 64 145 276 e113 e90 e82 124 244 135 517 185 91 12 70 144 276 e111 e89 e84 137 254 131 472 180 86 13 84 144 271 e109 e89 e86 162 262 131 426 168 83 14 98 144 260 e107 e88 e88 195 272 129 379 159 80 15 112 142 247 e106 e88 e91 225 281 124 339 163 73 16 120 137 242 e105 e88 e93 255 286 117 303 169 69 17 123 134 239 e104 e88 e93 295 281 109 275 185 65 18 127 135 234 e102 e88 e92 337 276 102 246 197 63 19 134 131 e207 e100 e88 92 370 265 105 218 210 64 20 131 126 e200 e98 e88 e86 387 251 101 198 226 61 21 129 124 e188 e98 e87 e83 396 232 97 184 239 58 22 126 122 e177 e97 e86 e80 397 216 123 166 235 57 23 131 120 e170 e95 e87 e76 388 208 812 149 221 58 24 134 127 e165 e94 e87 e77 379 195 1510 140 205 53 25 146 152 e160 e93 e85 e73 361 183 2450 137 185 52 26 150 161 e157 e92 e83 e72 338 175 3100 133 163 50 27 150 184 e151 e92 e81 e74 317 166 3170 128 147 49 28 154 e200 e149 e92 e79 80 300 160 2900 125 138 49 29 158 e225 e143 e92 --- 82 286 166 2510 123 147 47 30 158 236 e142 e92 --- 86 275 177 2130 125 134 46 31 162 --- e140 e91 --- 86 --- 186 --- 128 121 ---
TOTAL 3108 4590 6797 3324 2461 2522 6818 7153 21629 14864 5952 2305 MEAN 100 153 219 107 87.9 81.4 227 231 721 479 192 76.8 MAX 162 236 283 137 91 93 397 286 3170 1790 251 116 MIN 39 120 140 91 79 72 82 160 97 123 121 46 AC-FT 6160 9100 13480 6590 4880 5000 13520 14190 42900 29480 11810 4570 CFSM 0.27 0.41 0.59 0.29 0.24 0.22 0.61 0.62 1.94 1.29 0.52 0.21 IN. 0.31 0.46 0.68 0.33 0.25 0.25 0.68 0.72 2.17 1.49 0.60 0.23

141 UPPER MISSISSIPPI RIVER MAIN STEM-Continued
05212700 PRAIRIE RIVER NEAR TACONITE, MN--Continued
STATISTICS OF MONTHLY MEAN DATA FOR WATER YEARS 1967 - 2002, BY WATER YEAR (WY)
OCT NOV DEC JAN FEB MAR APR MAY JUN JUL AUG SEP
MEAN 201 203 111 75.2 71.4 93.2 613 543 363 238 114 128 MAX 586 605 222 110 106 170 1329 1094 866 618 295 482 (WY) 1974 1972 1978 1978 1969 1983 1969 1975 1974 1975 1978 1977 MIN 11.4 14.0 15.5 24.1 37.0 60.1 86.9 57.0 69.7 61.3 24.3 15.4 (WY) 1977 1977 1977 1977 1968 1977 1977 1977 1980 1980 1976 1976
SUMMARY STATISTICS FOR 2002 WATER YEAR WATER YEARS 1967 - 2002 ANNUAL TOTAL 81523 ANNUAL MEAN 223 227 HIGHEST ANNUAL MEAN 327 1974 LOWEST ANNUAL MEAN 89.1 1977 HIGHEST DAILY MEAN 3170 Jun 27 3240 Apr 17 1969 LOWEST DAILY MEAN 39 Oct 8 8.0 Oct 5 1970 ANNUAL SEVEN-DAY MINIMUM 43 Oct 3 11 Oct 17 1976 MAXIMUM PEAK FLOW 3220 Jun 27 3260 Apr 17 1969 MAXIMUM PEAK STAGE 11.78 Jun 27 11.81 Apr 17 1969 INSTANTANEOUS LOW FLOW 39 Oct 7 7.0 Oct 5 1970 ANNUAL RUNOFF (AC-FT) 161700 164200 ANNUAL RUNOFF (CFSM) 0.62 0.63 ANNUAL RUNOFF (INCHES) 8.42 8.55 10 PERCENT EXCEEDS 290 523 50 PERCENT EXCEEDS 135 115 90 PERCENT EXCEEDS 76 48 e Estimated.
O N D2001
J F M A M J J A S2002
10
20
50
100100
200
500
10001000
2000
5000
10,000
DAILY-MEAN DISCHARGE,
IN CUBIC FEET PER SECOND

142 UPPER MISSISSIPPI RIVER MAIN STEM--Continued
05227500 MISSISSIPPI RIVER AT AITKIN, MN
LOCATION.--Lat 46°32’26", long 93°42’26", in SW1⁄4NW1⁄4 sec. 24, T.47 N., R.27 W., Aitkin County, Hydrologic Unit 07010104, on
right bank upstream side of highway bridge at north edge of Aitkin, 1 mi downstream from Ripple River and at mile 1,055.9 upstream from Ohio River.
DRAINAGE AREA.--6,140 mi2 (approximately).
PERIOD OF RECORD.--March 1945 to current year.
GAGE.--Water-stage recorder. Datum of gage is 1,182.41 ft above sea level (NGVD of 1929, levels by U.S. Army Corps of Engineers). Mar. 1, 1945 to Mar. 14, 1961, nonrecording gage, and Mar. 15, 1961 to Sept. 30, 1967, water-stage recorder at same site at datum 3.0 ft higher. Diversion channel: Non-recording gage and crest-stage gage. Datum of gage is 1,182.02 ft above sea level (NGVD of 1929). Apr. 9, 1955 to Apr. 10, 1956, nonrecording gage at site 4 mi downstream at different datum. Apr. 11, 1956 to Sept. 30, 1967, non-recording gage at same site at datum 3.0 ft higher.
REMARKS.--Records good except those for estimated daily discharges, which are fair. Flow regulated by Winnibigoshish Lake, Leech Lake, Pokegama Lake, and Sandy Lake. Water diverted at medium and high stages into Aitkin diversion channel 6.5 mi above station, bypasses station and returns to river 15.5 mi below station. Diversion began Apr. 2, 1955. These records include flow in diversion channel.
EXTREMES FOR CURRENT YEAR.--Main channel: maximum discharge, 4100 ft3/s, July 11; gage height, 12.27 ft. Diversion channel: maximum discharge, 3200 ft3/s, July 11, gage height, 11.78 ft.
DISCHARGE, CUBIC FEET PER SECOND, WATER YEAR OCTOBER 2001 TO SEPTEMBER 2002 DAILY MEAN VALUES DAY OCT NOV DEC JAN FEB MAR APR MAY JUN JUL AUG SEP 1 1750 2930 2700 e2740 e2240 e1900 e1320 3440 1780 6360 3270 1900 2 1750 2920 2610 e2700 e2220 e1830 e1330 3330 1730 6370 3280 1930 3 1770 2910 2590 e2680 e2200 e1760 e1320 3140 1670 6260 3420 1920 4 1770 2900 2670 e2680 e2180 e1730 e1300 3030 1620 6060 3630 1910 5 1830 2870 2710 e2680 e2170 e1730 e1280 2950 1580 5760 3680 1870 6 1890 2820 2730 e2690 e2160 e1740 e1270 2860 1460 5390 3500 1830 7 1900 2760 2810 e2700 e2140 e1740 e1260 2750 1330 5050 3230 1800 8 1920 2720 2990 e2730 e2120 e1730 e1340 2780 1260 5880 3010 1760 9 1950 2690 3050 e2770 e2100 e1690 e1450 2980 1170 6880 2750 1770 10 1970 2720 3030 e2790 e2090 e1670 e1680 3170 1100 6990 2590 1810 11 2000 2760 3110 e2800 e2070 e1660 e2100 3320 1080 7470 2540 1760 12 2110 2710 3190 e2820 e2070 e1670 e2380 3560 1070 7560 2610 1780 13 2340 2660 3210 e2830 e2060 e1670 e2800 3900 1030 7290 2650 1840 14 2630 2640 3100 e2850 e2070 e1660 e3350 4180 1010 6900 2640 1810 15 2830 2610 3130 e2850 e2080 e1640 e3800 4350 1010 6460 2670 1740 16 2940 2570 3090 e2800 e2090 e1590 e3880 4500 956 6090 2660 1700 17 2990 2540 3370 e2730 e2100 e1560 e4150 4560 947 5680 2770 1650 18 3020 2510 3280 e2650 e2100 e1560 4450 4430 891 5290 2920 1590 19 2980 2490 e2950 e2570 e2120 e1560 4650 4160 885 5030 2950 1590 20 2930 2440 e2700 e2500 e2140 e1560 4860 3810 926 4710 2910 1590 21 2900 2410 e2500 e2450 e2170 e1560 4970 3480 977 4400 2920 1530 22 2890 2400 e2300 e2400 e2190 e1550 4950 3190 1050 4170 2870 1460 23 2890 2360 e2250 e2380 e2200 e1500 4890 2980 1150 3990 2700 1480 24 2870 2370 e2260 e2380 e2220 e1400 4850 2820 1920 3790 2540 1480 25 2820 2430 e2350 e2380 e2200 e1300 4650 2650 3820 3550 2380 1470 26 2800 2510 e2470 e2400 e2160 e1200 4370 2460 5060 3340 2280 1480 27 2890 2680 e2600 e2420 e2080 e1160 4120 2240 5690 3190 2190 1520 28 2970 2680 e2720 e2420 e2000 e1170 3860 2080 5990 3330 2100 1570 29 3010 2610 e2770 e2390 --- e1230 3660 1970 6160 3420 2000 1560 30 3000 2640 e2780 e2350 --- e1260 3510 1890 6290 3350 1910 1540 31 2970 --- e2760 e2260 --- e1300 --- 1830 --- 3280 1890 ---
TOTAL 77280 79260 86780 80790 59740 48280 93800 98790 62612 163290 85460 50640 MEAN 2493 2642 2799 2606 2134 1557 3127 3187 2087 5267 2757 1688 MAX 3020 2930 3370 2850 2240 1900 4970 4560 6290 7560 3680 1930 MIN 1750 2360 2250 2260 2000 1160 1260 1830 885 3190 1890 1460 AC-FT 153300 157200 172100 160200 118500 95760 186100 196000 124200 323900 169500 100400 CFSM 0.41 0.43 0.46 0.42 0.35 0.25 0.51 0.52 0.34 0.86 0.45 0.27 IN. 0.47 0.48 0.53 0.49 0.36 0.29 0.57 0.60 0.38 0.99 0.52 0.31

143 UPPER MISSISSIPPI RIVER MAIN STEM--Continued
05227500 MISSISSIPPI RIVER AT AITKIN, MN--Continued
STATISTICS OF MONTHLY MEAN DATA FOR WATER YEARS 1945 - 2002, BY WATER YEAR (WY)
OCT NOV DEC JAN FEB MAR APR MAY JUN JUL AUG SEP
MEAN 2704 2838 2325 2005 1909 2258 5216 5291 3695 3158 2379 2236 MAX 6534 6756 4498 3525 3196 5415 10830 15510 8072 8201 8270 6689 (WY) 1966 1972 1997 1966 1966 1945 1966 1950 1965 1993 1953 1986 MIN 313 328 324 345 398 638 1074 669 540 346 273 321 (WY) 1977 1977 1977 1977 1977 1977 1977 1958 1988 1961 1961 1976
SUMMARY STATISTICS FOR 2001 CALENDAR YEAR FOR 2002 WATER YEAR WATER YEARS 1945 - 2002 ANNUAL TOTAL 1602370 986722 ANNUAL MEAN 4390 2703 2995 HIGHEST ANNUAL MEAN 4985 1966 LOWEST ANNUAL MEAN 796 1977 HIGHEST DAILY MEAN 14200 Apr 27 7560 Jul 12 19900 May 20 1950 LOWEST DAILY MEAN 1600 Sep 22 885 Jun 19 153 Sep 1 1961 ANNUAL SEVEN-DAY MINIMUM 1690 Sep 18 942 Jun 15 195 Aug 26 1961 MAXIMUM PEAK FLOW 7610 Jul 11 20000 May 20 1950 MAXIMUM PEAK STAGE 12.27 Jul 11 22.49a May 20 1950 INSTANTANEOUS LOW FLOW 856 Jun 19 151 Sep 1 1961 ANNUAL RUNOFF (AC-FT) 3178000 1957000 2169000 ANNUAL RUNOFF (CFSM) 0.71 0.44 0.49 ANNUAL RUNOFF (INCHES) 9.71 5.98 6.63 10 PERCENT EXCEEDS 9620 4410 5900 50 PERCENT EXCEEDS 2940 2570 2380 90 PERCENT EXCEEDS 1950 1470 990 a Present datum. e Estimated.
O N D2001
J F M A M J J A S2002
100
200
500
10001000
2000
5000
10,000
DAILY-MEAN DISCHARGE,
IN CUBIC FEET PER SECOND

144 UPPER MISSISSIPPI RIVER MAIN STEM--Continued
05242300 MISSISSIPPI RIVER AT BRAINERD, MN
LOCATION.--Lat 46°22’40", long 94°10’59", in SE1⁄4/SW1⁄4 sec. 18, T. 145 N., R.30 W., Crow Wing County, Hydrologic Unit
07010104, on left bank in hydropower plant of Potlach Corporation, Northwest Paper Division in Brainerd, 12.7 mi upstream from Crow Wing River, and at mile 1003.7 upstream from Ohio River.
DRAINAGE AREA.--7,320 mi2 (approximately).
PERIOD OF RECORD.--October 1987 to current year.
GAGE.--Water-stage recorder. Datum of gage is 1,146.96 ft above sea level (NGVD of 1929).
REMARKS.--Records good except those for estimated daily discharges, which are fair. Flow regulated by Winnibigoshish Lake, Leech Lake, Pokegama Lake, Sandy Lake, Pine River Reservoir at Cross Lake, and by hydropower plant in Brainerd.
DISCHARGE, CUBIC FEET PER SECOND, WATER YEAR OCTOBER 2001 TO SEPTEMBER 2002 DAILY MEAN VALUES DAY OCT NOV DEC JAN FEB MAR APR MAY JUN JUL AUG SEP 1 2020 3410 3480 e3020 e2500 e2280 e1580 4140 2350 7570 4030 2580 2 2000 3430 3630 e3010 e2500 e2200 e1580 4100 2300 7620 4000 2430 3 2000 3380 3480 e3000 e2480 e2130 1550 4030 2020 7420 4140 2230 4 1990 3290 3480 e3000 e2470 e2060 1530 3830 2030 7190 4240 2480 5 1920 3310 3530 e3010 e2470 e2020 1550 3750 2030 6790 4380 2400 6 1960 3320 3760 e3020 e2460 e2030 1530 3800 1840 6410 4160 2310 7 2240 3230 3580 e3040 e2460 e2060 1510 3580 1950 6140 3960 2230 8 2070 2990 3770 e3070 e2450 e2070 1590 3920 1660 7630 3600 2220 9 2170 3120 3400 e3100 e2450 e2080 1720 3700 1570 8160 3440 2190 10 2410 3170 3890 e3120 e2450 e2000 2200 4320 1540 9020 3100 2310 11 2250 3100 3390 e3150 e2450 e1920 2490 4430 1450 9640 3100 2130 12 2230 3160 3850 e3170 e2440 e1900 3060 4590 1510 9820 3180 2310 13 2570 3220 3770 e3190 e2440 e1900 3780 4870 1320 9950 3110 2150 14 2780 3000 3490 e3200 e2440 e1920 4520 5380 1420 9680 3100 2300 15 3080 3010 3300 e3200 e2440 e1930 4910 5630 1350 9130 3230 2150 16 3260 3060 4260 e3200 e2450 e1850 4990 5790 1320 8630 3100 2120 17 3350 2990 4650 e3170 2480 e1800 5110 5800 1270 8180 3420 2160 18 3430 2950 4510 e3100 2490 e1780 5450 5790 1190 7500 3530 1980 19 3490 2650 3530 e3000 2590 e1790 5360 5560 1580 7070 3560 1980 20 3440 2970 3170 e2850 2590 e1810 5680 4980 1390 6640 3440 1850 21 3440 2860 2910 e2770 2560 e1830 5810 4700 1260 6260 3490 1860 22 3420 2860 2780 e2670 2670 e1830 5850 4200 1410 5720 3400 1900 23 3600 2910 2530 e2650 2680 e1770 5850 3870 1910 5440 3390 1920 24 3350 3040 e2470 e2650 2680 e1670 5760 3580 1900 5170 3240 1830 25 3590 2870 e2470 e2660 2680 e1550 5660 3350 3670 4780 2860 1810 26 3500 3160 e2550 e2670 e2570 e1460 5430 3170 5320 4510 2870 1850 27 3460 3220 e2700 e2660 e2450 e1430 5040 2940 6600 4260 2810 1840 28 3660 3210 e2850 e2630 e2370 1380 4660 2700 7120 4210 2480 1880 29 3830 3420 e3000 e2560 --- e1460 4520 2570 7370 4290 2680 1940 30 3630 3430 e3030 e2540 --- e1550 4370 2410 7600 4350 2410 1900 31 3740 --- e3050 e2520 --- e1570 --- 2350 --- 4160 2300 ---
TOTAL 89880 93740 104260 90600 70160 57030 114640 127830 77250 213340 103750 63240 MEAN 2899 3125 3363 2923 2506 1840 3821 4124 2575 6882 3347 2108 MAX 3830 3430 4650 3200 2680 2280 5850 5800 7600 9950 4380 2580 MIN 1920 2650 2470 2520 2370 1380 1510 2350 1190 4160 2300 1810 AC-FT 178300 185900 206800 179700 139200 113100 227400 253600 153200 423200 205800 125400 CFSM 0.40 0.43 0.46 0.40 0.34 0.25 0.52 0.56 0.35 0.94 0.46 0.29 IN. 0.46 0.48 0.53 0.46 0.36 0.29 0.58 0.65 0.39 1.08 0.53 0.32

145 UPPER MISSISSIPPI RIVER MAIN STEM--Continued
05242300 MISSISSIPPI RIVER AT BRAINERD, MN--Continued
STATISTICS OF MONTHLY MEAN DATA FOR WATER YEARS 1987 - 2002, BY WATER YEAR (WY)
OCT NOV DEC JAN FEB MAR APR MAY JUN JUL AUG SEP
MEAN 3383 3802 3210 2704 2504 2879 6250 6052 4180 4552 2748 2558 MAX 8002 6655 5926 4081 3973 4306 12890 12890 10100 10260 6950 6925 (WY) 1996 2001 1997 1997 1997 2000 1997 2001 2001 1993 1999 1999 MIN 1840 1931 1362 1140 1040 1435 3400 1928 662 442 935 1067 (WY) 1992 1993 1991 1991 1991 1991 1990 1988 1988 1988 1990 1998
SUMMARY STATISTICS FOR 2001 CALENDAR YEAR FOR 2002 WATER YEAR WATER YEARS 1987 - 2002 ANNUAL TOTAL 1958050 1205720 ANNUAL MEAN 5365 3303 3782 HIGHEST ANNUAL MEAN 5707 2001 LOWEST ANNUAL MEAN 1950 1988 HIGHEST DAILY MEAN 17400 Apr 28 9950 Jul 13 17400 Apr 28 2001 LOWEST DAILY MEAN 1800 Sep 23 1190 Jun 18 348 Jul 30 1988 ANNUAL SEVEN-DAY MINIMUM 1950 Sep 19 1340 Jun 15 357 Jul 29 1988 MAXIMUM PEAK FLOW 10100 Jul 13 17500 Apr 30 2001 MAXIMUM PEAK STAGE 12.10 Jul 13 16.70 Apr 30 2001 INSTANTANEOUS LOW FLOW 638a Jun 19 273 Jul 12 1988 ANNUAL RUNOFF (AC-FT) 3884000 2392000 2740000 ANNUAL RUNOFF (CFSM) 0.73 0.45 0.52 ANNUAL RUNOFF (INCHES) 9.95 6.13 7.02 10 PERCENT EXCEEDS 12000 5590 7020 50 PERCENT EXCEEDS 3480 3000 3170 90 PERCENT EXCEEDS 2240 1810 1520 a Result of regulation. e Estimated.
O N D2001
J F M A M J J A S2002
1000
2000
5000
10,000
DAILY-MEAN DISCHARGE,
IN CUBIC FEET PER SECOND

146 UPPER MISSISSIPPI RIVER MAIN STEM--Continued
05243725 STRAIGHT RIVER NEAR PARK RAPIDS, MN
LOCATION.--Lat 46°52’30", long 95°03’56", in NW1⁄4NE1⁄4 sec. 11, T. 139 N., R. 35 W., Hubbard County, Hydrologic Unit 07010106,
upstream from culvert on U.S. Highway 71, 3.2 mi south of Park Rapids.
DRAINAGE AREA.--53.2 mi2.
PERIOD OF RECORD.--Occasional low-flow measurements, water years 1970-71, 1973, 1975-76. October 1986 to current year (no winter records in 1987, 1990-91). May 1988 through August 1989, records of hourly water temperature (available in files of the Geological Survey).
GAGE.--Water-stage recorder. Datum of gage is 1,399.55 ft above sea level (NGVD of 1929, levels by Minnesota Department of Natural Resources).
REMARKS.--Records good except those for estimated daily discharges, which are fair. Diurnal flucations in flow due to ground-water withdrawals.
DISCHARGE, CUBIC FEET PER SECOND, WATER YEAR OCTOBER 2001 TO SEPTEMBER 2002 DAILY MEAN VALUES DAY OCT NOV DEC JAN FEB MAR APR MAY JUN JUL AUG SEP 1 53 58 64 e64 e63 e58 56 58 53 56 60 74 2 53 57 63 e64 e63 e58 57 57 53 55 59 71 3 53 57 62 e64 e63 e59 56 56 52 54 59 67 4 52 57 62 e64 e63 e59 56 56 52 52 57 64 5 52 57 63 e64 e63 e58 56 56 52 49 55 64 6 52 57 62 e64 e63 e58 56 56 50 49 55 60 7 51 58 64 e64 e63 e58 57 55 50 53 53 60 8 51 58 61 e64 e63 e58 58 60 50 61 54 58 9 51 58 65 e63 e62 e58 57 67 50 62 56 60 10 61 57 62 e62 e61 e58 59 63 49 67 62 60 11 67 57 61 e62 e61 e58 62 62 50 65 60 59 12 64 58 61 e62 e60 e59 61 63 51 62 68 57 13 65 58 61 e62 e60 e59 62 62 50 59 68 57 14 67 58 61 e61 e59 e58 63 61 50 57 69 56 15 67 58 61 e61 57 e57 62 60 49 55 69 55 16 64 59 63 e61 57 57 62 60 48 54 69 53 17 61 59 63 e61 56 56 67 59 47 54 69 52 18 59 59 62 e61 57 56 68 58 49 54 66 55 19 58 59 58 e61 57 56 67 57 66 53 63 57 20 57 58 e56 e61 57 56 65 57 65 55 62 57 21 56 58 e57 e61 57 55 62 58 61 55 63 58 22 55 59 e59 e61 57 e56 61 60 58 54 61 58 23 55 59 e61 e61 58 e58 60 61 93 54 61 60 24 59 62 e63 e62 57 e57 60 62 103 57 60 61 25 62 65 e64 e62 57 e56 59 60 96 59 58 61 26 61 63 e64 e62 e58 55 58 58 89 60 57 59 27 59 49 e64 e62 e58 55 58 57 80 65 57 59 28 57 e60 e64 e62 e58 57 60 56 72 65 60 59 29 57 e70 e64 e62 --- 58 59 55 64 61 77 59 30 57 e67 e64 e62 --- 57 60 55 60 58 81 57 31 57 --- e64 e62 --- 57 --- 54 --- 57 75 ---
TOTAL 1793 1769 1923 1929 1668 1775 1804 1819 1812 1771 1943 1787 MEAN 57.8 59.0 62.0 62.2 59.6 57.3 60.1 58.7 60.4 57.1 62.7 59.6 MAX 67 70 65 64 63 59 68 67 103 67 81 74 MIN 51 49 56 61 56 55 56 54 47 49 53 52 AC-FT 3560 3510 3810 3830 3310 3520 3580 3610 3590 3510 3850 3540 CFSM 1.09 1.11 1.17 1.17 1.12 1.08 1.13 1.10 1.14 1.07 1.18 1.12 IN. 1.25 1.24 1.34 1.35 1.17 1.24 1.26 1.27 1.27 1.24 1.36 1.25

147 UPPER MISSISSIPPI RIVER MAIN STEM--Continued
05243725 STRAIGHT RIVER NEAR PARK RAPIDS, MN--Continued
STATISTICS OF MONTHLY MEAN DATA FOR WATER YEARS 1987 - 2002, BY WATER YEAR (WY)
OCT NOV DEC JAN FEB MAR APR MAY JUN JUL AUG SEP
MEAN 63.3 64.8 61.7 56.8 56.8 63.3 72.0 67.4 61.2 58.8 56.6 59.8 MAX 83.1 77.6 74.5 77.7 69.8 76.8 101 86.6 76.1 81.5 81.2 81.4 (WY) 1996 1998 1995 1999 1998 1995 1997 1999 1999 1997 1999 1999 MIN 42.2 47.4 46.0 41.9 44.8 50.9 56.1 46.2 41.9 39.5 35.9 38.7 (WY) 1993 1989 1989 1992 1992 1989 1991 1992 1992 1988 1990 1990
SUMMARY STATISTICS FOR 2001 CALENDAR YEAR FOR 2002 WATER YEAR WATER YEARS 1987 - 2002 ANNUAL TOTAL 22824 21793 ANNUAL MEAN 62.5 59.7 63.0 HIGHEST ANNUAL MEAN 78.3 1999 LOWEST ANNUAL MEAN 48.0 1992 HIGHEST DAILY MEAN 103 Apr 8 103 Jun 24 144 Apr 6 1997 LOWEST DAILY MEAN 47 Jan 23 47 Jun 17 28a Jan 9 1992 ANNUAL SEVEN-DAY MINIMUM 47 Jan 23 49 Jun 12 34 Aug 5 1990 MAXIMUM PEAK FLOW 108b Jun 24 149 Apr 6 1997 MAXIMUM PEAK STAGE 2.53c Feb 13 3.08c Dec 22 1999 INSTANTANEOUS LOW FLOW 40d Dec 19 28a Jan 9 1992 ANNUAL RUNOFF (AC-FT) 45270 43230 45610 ANNUAL RUNOFF (CFSM) 1.18 1.12 1.18 ANNUAL RUNOFF (INCHES) 15.96 15.24 16.08 10 PERCENT EXCEEDS 82 65 79 50 PERCENT EXCEEDS 59 59 62 90 PERCENT EXCEEDS 50 54 46 a Estimated, result of freezeup. b Gage height, 2.17 ft. c Backwater from ice. d Result of freezeup. e Estimated.
O N D2001
J F M A M J J A S2002
10
20
50
100100
200
500
1000
DAILY-MEAN DISCHARGE,
IN CUBIC FEET PER SECOND

148 UPPER MISSISSIPPI RIVER MAIN STEM--Continued
05244000 CROW WING RIVER AT NIMROD, MN
LOCATION.--Lat 46°38’25", long 94°52’44", in SE1⁄4NW1⁄4 sec. 32, T. 137 N., R. 33 W., Wadena County, Hydrologic Unit 07010106,
on right bank 200 ft upstream from County Highway 227 bridge, 0.2 mi north of Nimrod, and 0.7 mi upstream from Cat River.
DRAINAGE AREA.--1,030 mi2.
PERIOD OF RECORD.--April 1910 to September 1914, July 1930 to September 1981, October 1991 to current year (winter records incomplete prior to 1940). October 1981 to September 1987, annual maximums only.
REVISED RECORDS.--WSP 1508: 1910-11, 1913-14, 1937, 1942(M), 1944(M).
GAGE.--Water-stage recorder. Datum of gage is 1,313.27 ft above sea level (NGVD of 1929, levels by Wadena County Highway Department from Minnesota Department of Transportation benchmark). Apr. 15, 1910 to Sept. 30, 1914, nonrecording gage at same site, at datum 2.2 ft lower. July 28, 1930 to Nov. 4, 1949, nonrecording gages at same site and datum.
REMARKS.--Records good except those for estimated daily discharges, which are fair. Flow affected by natural storage in many lakes.
DISCHARGE, CUBIC FEET PER SECOND, WATER YEAR OCTOBER 2001 TO SEPTEMBER 2002 DAILY MEAN VALUES DAY OCT NOV DEC JAN FEB MAR APR MAY JUN JUL AUG SEP 1 283 440 e410 e340 e287 e282 e262 500 435 654 511 520 2 283 427 e470 e333 e285 e280 e264 511 413 626 517 524 3 281 423 e495 e328 e283 e277 e274 516 401 598 505 506 4 279 443 e490 e325 e280 e275 e285 523 393 571 500 483 5 279 478 e480 e322 e279 e272 e315 531 382 550 486 482 6 277 500 e475 e320 e277 e270 e340 541 372 527 483 475 7 272 510 e470 e321 e276 e270 e365 542 357 564 464 458 8 271 515 e475 e323 e280 e271 e390 617 348 864 448 442 9 270 511 e490 e325 e285 e272 408 732 331 790 442 441 10 336 500 e510 e329 e289 e272 445 744 329 889 494 473 11 376 488 e505 e332 e291 e273 506 736 327 965 485 474 12 379 480 e495 e327 e293 e275 522 779 326 882 502 490 13 406 476 e490 e322 e295 e278 531 794 318 809 528 504 14 422 472 e485 e319 e297 e280 555 782 318 763 523 507 15 439 457 e480 e314 e299 e280 575 760 313 728 543 506 16 453 416 e465 e309 e300 e280 583 739 295 705 567 489 17 450 381 e460 e304 e302 e279 624 699 286 679 591 482 18 441 364 e440 e298 e305 e277 629 666 276 664 597 447 19 425 359 e425 e292 e308 e272 632 644 357 626 573 399 20 407 355 e420 e290 e309 e265 613 624 400 593 556 372 21 394 358 e410 e290 e310 e258 589 608 396 585 549 340 22 385 356 e405 e297 e308 e258 574 590 389 575 540 316 23 388 355 e400 e300 e305 e259 558 574 538 554 526 327 24 392 370 e395 e302 e300 e260 537 565 679 549 499 332 25 397 409 e385 e305 e292 e260 513 550 750 544 473 325 26 402 418 e377 e304 e288 e261 489 523 739 536 458 318 27 400 405 e373 e300 e286 e264 482 504 712 522 445 309 28 407 e335 e365 e295 e285 e268 503 489 704 520 440 300 29 424 e330 e360 e292 --- e268 505 484 700 516 516 294 30 439 e350 e352 e290 --- e268 498 488 677 506 526 296 31 440 --- e345 e288 --- e265 --- 457 --- 499 524 ---
TOTAL 11497 12681 13597 9636 8194 8389 14366 18812 13261 19953 15811 12631 MEAN 371 423 439 311 293 271 479 607 442 644 510 421 MAX 453 515 510 340 310 282 632 794 750 965 597 524 MIN 270 330 345 288 276 258 262 457 276 499 440 294 AC-FT 22800 25150 26970 19110 16250 16640 28490 37310 26300 39580 31360 25050 CFSM 0.37 0.42 0.43 0.31 0.29 0.27 0.47 0.60 0.44 0.64 0.50 0.42

149 UPPER MISSISSIPPI RIVER MAIN STEM--Continued
05244000 CROW WING RIVER AT NIMROD, MN--Continued
STATISTICS OF MONTHLY MEAN DATA FOR WATER YEARS 1910 - 2002, BY WATER YEAR (WY)
OCT NOV DEC JAN FEB MAR APR MAY JUN JUL AUG SEP
MEAN 418 418 354 308 314 415 769 683 579 456 380 386 MAX 1463 871 692 462 527 780 1624 1615 1354 1124 1452 929 (WY) 1974 1972 1999 1966 2000 1995 1966 1950 1965 1997 1944 1944 MIN 137 146 131 125 170 171 202 181 149 84.0 74.3 131 (WY) 1937 1937 1940 1940 1940 1940 1911 1911 1934 1936 1936 1934
SUMMARY STATISTICS FOR 2001 CALENDAR YEAR FOR 2002 WATER YEAR WATER YEARS 1910 - 2002 ANNUAL TOTAL 200364 158828 ANNUAL MEAN 549 435 486 HIGHEST ANNUAL MEAN 757 1999 LOWEST ANNUAL MEAN 230 1940 HIGHEST DAILY MEAN 1720 Apr 13 965 Jul 11 3580 Oct 10 1973 LOWEST DAILY MEAN 270 Oct 9 258 Mar 21,22 45 Aug 7 1936 ANNUAL SEVEN-DAY MINIMUM 276 Oct 3 260 Mar 21 55 Aug 3 1936 MAXIMUM PEAK FLOW 995a Jul 10 3700 Oct 10 1973 MAXIMUM PEAK STAGE 5.08b Dec 20 7.64b Apr 20 1950 INSTANTANEOUS LOW FLOW 45 Aug 7 1936 ANNUAL RUNOFF (AC-FT) 397400 315000 352100 ANNUAL RUNOFF (CFSM) 0.54 0.43 0.48 10 PERCENT EXCEEDS 1080 620 833 50 PERCENT EXCEEDS 427 422 402 90 PERCENT EXCEEDS 305 279 242 a Gage-height, 3.95 ft. b Backwater from ice. e Estimated.
O N D2001
J F M A M J J A S2002
100
200
500
1000
DAILY-MEAN DISCHARGE,
IN CUBIC FEET PER SECOND

150 UPPER MISSISSIPPI RIVER MAIN STEM--Continued
05245100 LONG PRAIRIE RIVER AT LONG PRAIRIE, MN
LOCATION.--Lat 45°58’30", long 94°51’56", in NE1⁄4NW1⁄4 sec. 20, T. 129 N., R. 33 W., Todd County, Hydrologic Unit 07010108, on
right bank 90 ft upstream from bridge on First Avenue at Long Prairie and 400 ft downstream from Venewitz Creek.
DRAINAGE AREA.--434 mi2.
PERIOD OF RECORD.--October 1971 to current year.
GAGE.--Water-stage recorder. Datum of gage is 1,281.74 ft above sea level (NGVD of 1929).
REMARKS.--Records good except those for estimated daily discharges, which are fair to poor.
DISCHARGE, in CFS, WATER YEAR OCTOBER 2001 TO SEPTEMBER 2002 DAILY MEAN VALUES DAY OCT NOV DEC JAN FEB MAR APR MAY JUN JUL AUG SEP 1 128 112 e76 e62 e81 e72 e207 339 211 157 199 175 2 127 111 e80 e62 e81 e71 e202 316 203 147 189 190 3 125 109 e90 e62 e80 e71 e187 286 200 140 190 191 4 124 108 e97 e68 e79 e72 e176 271 192 130 188 187 5 121 106 e98 e74 e79 e73 e163 261 184 124 177 179 6 127 105 e99 e80 e80 e77 e135 256 174 118 170 199 7 129 103 e99 e86 e82 e80 e160 258 168 117 165 180 8 124 103 e101 e90 e83 e85 262 319 166 234 162 159 9 122 102 e101 e96 e85 e88 279 389 164 192 159 162 10 136 102 e101 e95 e85 e93 302 447 160 492 156 185 11 136 101 e101 e94 e86 e96 359 479 158 735 149 181 12 140 101 e101 e90 e87 e102 409 510 155 581 162 e165 13 153 101 e101 e92 e87 e108 429 514 149 508 154 e150 14 151 101 e98 e93 e87 e106 436 496 144 470 146 e140 15 150 100 e98 e93 e87 e105 422 485 139 444 150 e130 16 149 98 e96 e93 e87 e102 400 471 132 416 146 e125 17 147 99 e92 e92 e87 e99 393 444 127 371 168 e120 18 145 99 e90 e92 e87 e96 392 412 123 326 162 120 19 140 97 e87 e91 e87 e94 406 375 188 279 154 114 20 134 96 e85 e91 e87 e91 417 341 211 257 151 111 21 130 95 e83 e91 e86 e89 418 312 218 253 160 108 22 129 94 e81 e91 e82 e89 404 290 228 257 157 105 23 126 94 e79 e91 e80 e88 374 277 278 242 148 104 24 123 106 e78 e91 e78 e88 350 268 325 243 144 101 25 124 128 e75 e91 e76 e89 333 259 293 242 136 100 26 124 e103 e72 e90 e74 e88 305 252 270 247 131 96 27 124 e64 e68 e89 e73 e89 286 246 251 241 127 91 28 120 e61 e65 e88 e73 e97 292 241 224 232 126 92 29 116 e60 e63 e86 --- e113 315 235 193 223 222 93 30 115 e59 e62 e85 --- e132 337 237 172 210 216 92 31 115 --- e62 e83 --- e180 --- 224 --- 203 180 ---
TOTAL 4054 2918 2679 2672 2306 2923 9550 10510 5800 8831 5044 4145 MEAN 130.8 97.27 86.42 86.19 82.36 94.29 318.3 339.0 193.3 284.9 162.7 138.2 MAX 153 128 101 96 87 180 436 514 325 735 222 199 MIN 115 59 62 62 73 71 135 224 123 117 126 91 AC-FT 8040 5790 5310 5300 4570 5800 18940 20850 11500 17520 10000 8220 CFSM 0.30 0.22 0.20 0.20 0.19 0.22 0.73 0.78 0.45 0.66 0.37 0.32 IN. 0.35 0.25 0.23 0.23 0.20 0.25 0.82 0.90 0.50 0.76 0.43 0.36

151 UPPER MISSISSIPPI RIVER MAIN STEM--Continued
05245100 LONG PRAIRIE RIVER AT LONG PRAIRIE, MN--Continued
STATISTICS OF MONTHLY MEAN DATA FOR WATER YEARS 1972 - 2002, BY WATER YEAR (WY)
OCT NOV DEC JAN FEB MAR APR MAY JUN JUL AUG SEP
MEAN 130.4 117.6 76.09 63.55 66.95 171.6 382.2 283.6 228.8 197.5 140.9 121.4 MAX 512 425 270 217 208 441 1062 653 774 777 715 607 (WY) 1987 1972 1987 1987 1987 1985 2001 1986 2001 1972 1972 1986 MIN 13.4 8.69 3.19 1.05 1.62 19.8 71.8 45.5 27.5 4.73 10.0 5.32 (WY) 1977 1977 1977 1977 1977 1989 1977 1977 1988 1988 1989 1976
SUMMARY STATISTICS FOR 2001 CALENDAR YEAR FOR 2002 WATER YEAR WATER YEARS 1972 - 2002 ANNUAL TOTAL 108375 61432 ANNUAL MEAN 296.9 168.3 165.3 HIGHEST ANNUAL MEAN 366 1972 LOWEST ANNUAL MEAN 25.2 1977 HIGHEST DAILY MEAN 2710 Apr 9 735 Jul 11 2900 Jul 22 1972 LOWEST DAILY MEAN 45 Jan 1 59a Nov 30 0.84a Jan 12 1977 ANNUAL SEVEN-DAY MINIMUM 49 Jan 1 63 Dec 28 0.84 Jan 12 1977 MAXIMUM PEAK FLOW 788 Jul 11 3270 Jul 22 1972 MAXIMUM PEAK STAGE 5.77 Jul 11 9.37 Jul 22 1972 INSTANTANEOUS LOW FLOW 59a Nov 30 0.84a Jan 12 1977 ANNUAL RUNOFF (AC-FT) 215000 121900 119700 ANNUAL RUNOFF (CFSM) 0.68 0.39 0.38 ANNUAL RUNOFF (INCHES) 9.29 5.27 5.17 10 PERCENT EXCEEDS 819 335 371 50 PERCENT EXCEEDS 138 127 106 90 PERCENT EXCEEDS 51 80 26 a Estimated daily-mean discharge, backwater from ice. e Estimated.
O N D2001
J F M A M J J A S2002
10
20
50
100100
200
500
1000
DAILY-MEAN DISCHARGE,
IN CUBIC FEET PER SECOND

152 UPPER MISSISSIPPI RIVER MAIN STEM--Continued
05247500 CROW WING RIVER NEAR PILLAGER, MN
LOCATION.--Lat 46°18’18", long 94°22’38", in SW1⁄4NE1⁄4 sec. 30, T. 133 N., R. 29 W., Cass County, Hydrologic Unit 07010106, at
Sylvan Dam power plant of Minnesota Power Co., 3.6 mi above mouth and 4.9 mi southeast of Pillager.
DRAINAGE AREA.--3,520 mi2 (approximately).
PERIOD OF RECORD.--October 1968 to September 1986, October 1987 to current year. Records for August 1924 to September 1968 available in files of the Minnesota District Office.
GAGE.--Water-stage recorder. Datum of gage is 1,151.00 ft above sea level, adjustment of 1912. Prior to January 16, 1991, staff gage attached to retaining wall approximately 20 ft below the turbine outlet bays, at datum 1150.00 ft, adjustment of 1912.
REMARKS.--Records good except those for estimated daily discharges, which are fair. Discharge computed on the basis of power plant records prior to January 16, 1991. Records for Oct. 1, 1968 to Sept. 30, 1975, were adjusted for storage change in the Sylvan Dam reservoir. Flow partly regulated by Sylvan Dam power plant and Gull Lake reservoir.
COOPERATION.--Prior to February 1991, records collected by Minnesota Power Company in connection with a Federal Energy Regulatory Commision project.
EXTREMES OUTSIDE PERIOD OF RECORD.--Maximum daily discharge since 1924, 18,300 ft3/s, Apr. 14, 1965.
DISCHARGE, CUBIC FEET PER SECOND, WATER YEAR OCTOBER 2001 TO SEPTEMBER 2002 DAILY MEAN VALUES DAY OCT NOV DEC JAN FEB MAR APR MAY JUN JUL AUG SEP 1 857 1060 e1420 1040 734 842 1770 2440 1710 2240 1580 e1590 2 825 1070 e1440 1040 734 923 1770 2400 1590 1740 1450 e1590 3 804 1120 e1460 1040 733 800 1660 2330 1430 1530 1510 e1580 4 800 1130 e1570 1030 776 743 1580 2320 1280 1540 1990 e1640 5 761 1120 e1740 1020 789 728 1590 2210 1160 1480 1790 e1700 6 808 1140 e1610 990 787 720 1620 2250 1170 1320 1610 1450 7 822 1110 e1270 968 787 758 1670 2260 1160 1250 1390 1290 8 768 1070 e1280 966 785 812 1920 2390 1160 2510 1360 1200 9 761 1070 e1320 966 785 812 2220 2840 1160 3300 1260 1250 10 848 1080 1500 965 787 812 2210 3150 1060 4240 e1170 1280 11 1090 1150 1470 952 784 809 2680 3220 987 5070 e1180 1160 12 1180 1150 1360 982 833 808 2820 3330 958 4450 e1300 1210 13 1280 1150 1460 1070 833 804 3080 3490 964 4420 e1270 1230 14 1230 1150 1380 1090 835 816 2940 3590 962 4480 e1360 1180 15 1240 1150 1180 1050 838 885 2900 3650 963 4320 e1280 1150 16 1320 1150 1520 989 835 910 2910 3560 938 4320 e1240 1140 17 1360 1100 1750 960 840 911 3000 3400 835 4230 e1470 1110 18 1170 1100 1620 910 847 944 3000 3190 812 4220 e1440 1100 19 1140 1090 1160 937 939 982 3380 3100 1260 3880 e1520 1080 20 1130 1070 951 892 947 980 3290 2760 1270 3440 e1630 1070 21 1120 1020 1010 888 945 984 3000 2570 1390 3180 e1550 1040 22 1120 1020 890 818 948 984 3020 2380 1460 2720 e1390 956 23 1140 1020 1140 734 958 907 3110 2160 1900 2500 e1390 994 24 1120 1060 1080 842 997 859 2990 2320 2300 2040 e2170 976 25 1060 e1150 1040 781 989 837 2640 2200 2540 2050 e1990 966 26 1030 e1300 965 865 940 927 2540 2000 2670 2000 e1900 958 27 1060 e1340 978 887 906 973 2440 1860 2720 1880 1710 971 28 1130 e960 1010 884 898 934 2440 1680 2730 1690 1460 946 29 1210 e940 1110 872 --- 1260 2500 1600 2540 1810 1290 975 30 1200 e1150 1220 830 --- 1650 2520 1710 2290 1800 1410 664 31 1080 --- 1150 769 --- 1780 --- 1720 --- 1540 e1520 ---
TOTAL 32464 33190 40054 29027 23809 28894 75210 80080 45369 87190 46580 35446 MEAN 1047 1106 1292 936 850 932 2507 2583 1512 2813 1503 1182 MAX 1360 1340 1750 1090 997 1780 3380 3650 2730 5070 2170 1700 MIN 761 940 890 734 733 720 1580 1600 812 1250 1170 664 AC-FT 64390 65830 79450 57580 47230 57310 149200 158800 89990 172900 92390 70310 CFSM 0.32 0.34 0.39 0.28 0.26 0.28 0.76 0.78 0.46 0.85 0.46 0.36 IN. 0.37 0.37 0.45 0.33 0.27 0.33 0.85 0.90 0.51 0.98 0.53 0.40

153 UPPER MISSISSIPPI RIVER MAIN STEM--Continued
05247500 CROW WING RIVER NEAR PILLAGER, MN--Continued
STATISTICS OF MONTHLY MEAN DATA FOR WATER YEARS 1969 - 2002, BY WATER YEAR (WY)
OCT NOV DEC JAN FEB MAR APR MAY JUN JUL AUG SEP
MEAN 1240 1243 886 723 739 1394 3451 2486 1774 1506 1028 963 MAX 3771 3674 1699 1188 1360 2996 8266 5671 5307 3295 3520 3309 (WY) 1974 1972 1999 1986 1998 1972 2001 1986 2001 1972 1972 1986 MIN 215 215 199 218 255 548 882 545 447 206 120 161 (WY) 1977 1977 1977 1977 1977 1981 1981 1977 1988 1988 1976 1976
SUMMARY STATISTICS FOR 2001 CALENDAR YEAR FOR 2002 WATER YEAR WATER YEARS 1969 - 2002 ANNUAL TOTAL 847214 557313 ANNUAL MEAN 2321 1527 1454 HIGHEST ANNUAL MEAN 2564 1972 LOWEST ANNUAL MEAN 446 1977 HIGHEST DAILY MEAN 16900 Apr 12 5070 Jul 11 16900 Apr 12 2001 LOWEST DAILY MEAN 580 Jul 18 664 Sep 30 60 Aug 10 1976 ANNUAL SEVEN-DAY MINIMUM 789 Oct 3 760 Jan 31 68 Aug 9 1976 MAXIMUM PEAK FLOW 5310 Jul 10 17500a Apr 12 2001 MAXIMUM PEAK STAGE 6.57 Jul 10 12.11a Apr 12 2001 INSTANTANEOUS LOW FLOW 162b Jun 11 78b Jul 17 2001 ANNUAL RUNOFF (AC-FT) 1680000 1105000 1053000 ANNUAL RUNOFF (CFSM) 0.70 0.46 0.44 ANNUAL RUNOFF (INCHES) 9.55 6.28 5.99 10 PERCENT EXCEEDS 5670 2830 2950 50 PERCENT EXCEEDS 1120 1180 990 90 PERCENT EXCEEDS 849 824 459 a Since stage record began, Jan. 16, 1991. b Result of regulation. e Estimated.
O N D2001
J F M A M J J A S2002
100
200
500
10001000
2000
5000
10,000
DAILY-MEAN DISCHARGE,
IN CUBIC FEET PER SECOND
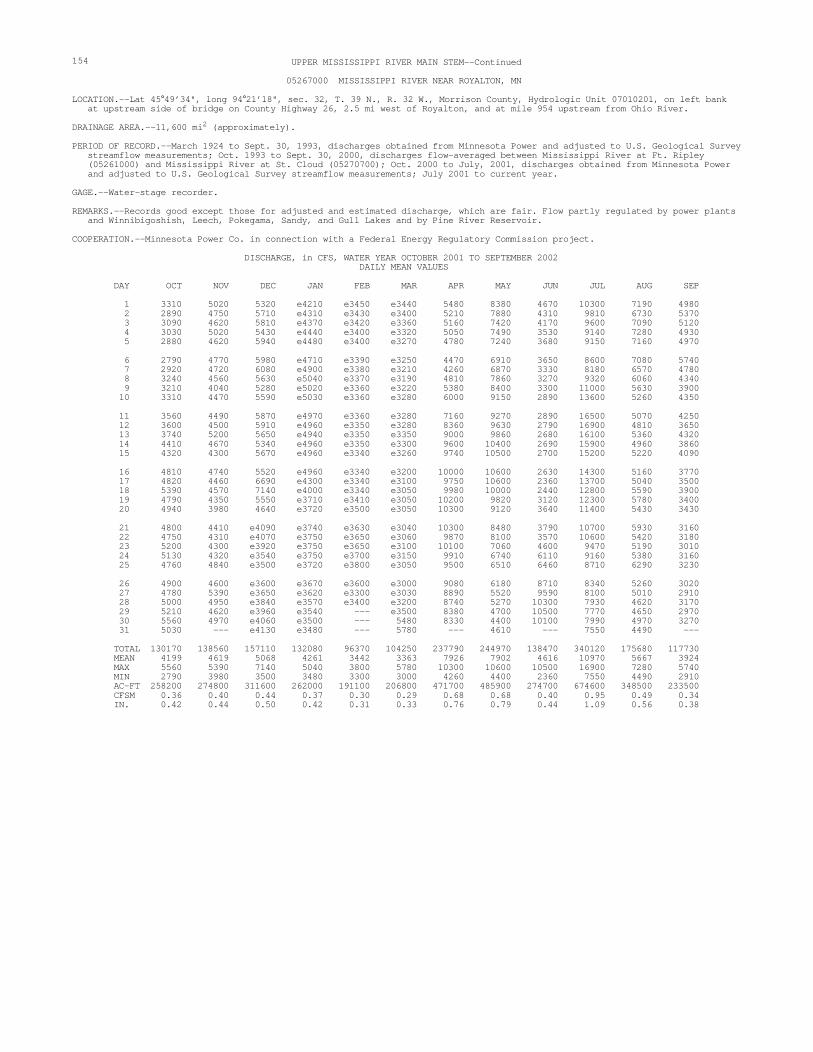
154 UPPER MISSISSIPPI RIVER MAIN STEM--Continued
05267000 MISSISSIPPI RIVER NEAR ROYALTON, MN
LOCATION.--Lat 45°49’34", long 94°21’18", sec. 32, T. 39 N., R. 32 W., Morrison County, Hydrologic Unit 07010201, on left bank at upstream side of bridge on County Highway 26, 2.5 mi west of Royalton, and at mile 954 upstream from Ohio River.
DRAINAGE AREA.--11,600 mi2 (approximately).
PERIOD OF RECORD.--March 1924 to Sept. 30, 1993, discharges obtained from Minnesota Power and adjusted to U.S. Geological Survey streamflow measurements; Oct. 1993 to Sept. 30, 2000, discharges flow-averaged between Mississippi River at Ft. Ripley (05261000) and Mississippi River at St. Cloud (05270700); Oct. 2000 to July, 2001, discharges obtained from Minnesota Power and adjusted to U.S. Geological Survey streamflow measurements; July 2001 to current year.
GAGE.--Water-stage recorder.
REMARKS.--Records good except those for adjusted and estimated discharge, which are fair. Flow partly regulated by power plants and Winnibigoshish, Leech, Pokegama, Sandy, and Gull Lakes and by Pine River Reservoir.
COOPERATION.--Minnesota Power Co. in connection with a Federal Energy Regulatory Commission project.
DISCHARGE, in CFS, WATER YEAR OCTOBER 2001 TO SEPTEMBER 2002 DAILY MEAN VALUES DAY OCT NOV DEC JAN FEB MAR APR MAY JUN JUL AUG SEP 1 3310 5020 5320 e4210 e3450 e3440 5480 8380 4670 10300 7190 4980 2 2890 4750 5710 e4310 e3430 e3400 5210 7880 4310 9810 6730 5370 3 3090 4620 5810 e4370 e3420 e3360 5160 7420 4170 9600 7090 5120 4 3030 5020 5430 e4440 e3400 e3320 5050 7490 3530 9140 7280 4930 5 2880 4620 5940 e4480 e3400 e3270 4780 7240 3680 9150 7160 4970 6 2790 4770 5980 e4710 e3390 e3250 4470 6910 3650 8600 7080 5740 7 2920 4720 6080 e4900 e3380 e3210 4260 6870 3330 8180 6570 4780 8 3240 4560 5630 e5040 e3370 e3190 4810 7860 3270 9320 6060 4340 9 3210 4040 5280 e5020 e3360 e3220 5380 8400 3300 11000 5630 3900 10 3310 4470 5590 e5030 e3360 e3280 6000 9150 2890 13600 5260 4350 11 3560 4490 5870 e4970 e3360 e3280 7160 9270 2890 16500 5070 4250 12 3600 4500 5910 e4960 e3350 e3280 8360 9630 2790 16900 4810 3650 13 3740 5200 5650 e4940 e3350 e3350 9000 9860 2680 16100 5360 4320 14 4410 4670 5340 e4960 e3350 e3300 9600 10400 2690 15900 4960 3860 15 4320 4300 5670 e4960 e3340 e3260 9740 10500 2700 15200 5220 4090 16 4810 4740 5520 e4960 e3340 e3200 10000 10600 2630 14300 5160 3770 17 4820 4460 6690 e4300 e3340 e3100 9750 10600 2360 13700 5040 3500 18 5390 4570 7140 e4000 e3340 e3050 9980 10000 2440 12800 5590 3900 19 4790 4350 5550 e3710 e3410 e3050 10200 9820 3120 12300 5780 3400 20 4940 3980 4640 e3720 e3500 e3050 10300 9120 3640 11400 5430 3430 21 4800 4410 e4090 e3740 e3630 e3040 10300 8480 3790 10700 5930 3160 22 4750 4310 e4070 e3750 e3650 e3060 9870 8100 3570 10600 5420 3180 23 5200 4300 e3920 e3750 e3650 e3100 10100 7060 4600 9470 5190 3010 24 5130 4320 e3540 e3750 e3700 e3150 9910 6740 6110 9160 5380 3160 25 4760 4840 e3500 e3720 e3800 e3050 9500 6510 6460 8710 6290 3230 26 4900 4600 e3600 e3670 e3600 e3000 9080 6180 8710 8340 5260 3020 27 4780 5390 e3650 e3620 e3300 e3030 8890 5520 9590 8100 5010 2910 28 5000 4950 e3840 e3570 e3400 e3200 8740 5270 10300 7930 4620 3170 29 5210 4620 e3960 e3540 --- e3500 8380 4700 10500 7770 4650 2970 30 5560 4970 e4060 e3500 --- 5480 8330 4400 10100 7990 4970 3270 31 5030 --- e4130 e3480 --- 5780 --- 4610 --- 7550 4490 ---
TOTAL 130170 138560 157110 132080 96370 104250 237790 244970 138470 340120 175680 117730 MEAN 4199 4619 5068 4261 3442 3363 7926 7902 4616 10970 5667 3924 MAX 5560 5390 7140 5040 3800 5780 10300 10600 10500 16900 7280 5740 MIN 2790 3980 3500 3480 3300 3000 4260 4400 2360 7550 4490 2910 AC-FT 258200 274800 311600 262000 191100 206800 471700 485900 274700 674600 348500 233500 CFSM 0.36 0.40 0.44 0.37 0.30 0.29 0.68 0.68 0.40 0.95 0.49 0.34 IN. 0.42 0.44 0.50 0.42 0.31 0.33 0.76 0.79 0.44 1.09 0.56 0.38

155 UPPER MISSISSIPPI RIVER MAIN STEM--Continued
05267000 MISSISSIPPI RIVER NEAR ROYALTON, MN--Continued
STATISTICS OF MONTHLY MEAN DATA FOR WATER YEARS 1924 - 2002, BY WATER YEAR (WY)
OCT NOV DEC JAN FEB MAR APR MAY JUN JUL AUG SEP
MEAN 4186 4066 3194 2807 2692 3894 9362 8760 6546 5041 3760 3590 MAX 12930 14640 7297 5713 5480 12290 25430 24600 18160 15250 15230 12940 (WY) 1966 1972 1997 1966 1997 1966 1997 1950 1965 1993 1953 1986 MIN 632 618 627 534 758 968 1924 1663 1071 648 449 535 (WY) 1937 1937 1935 1935 1937 1940 1931 1977 1988 1988 1934 1934
SUMMARY STATISTICS FOR 2001 CALENDAR YEAR FOR 2002 WATER YEAR WATER YEARS 1924 - 2002 ANNUAL TOTAL 2959060 2013300 ANNUAL MEAN 8107 5516 4852 HIGHEST ANNUAL MEAN 9555 1966 LOWEST ANNUAL MEAN 1213 1934 HIGHEST DAILY MEAN 35500 Apr 13 16900 Jul 12 38200 Apr 8 1997 LOWEST DAILY MEAN 2790 Oct 6 2360 Jun 17 254 Nov 25 1936 ANNUAL SEVEN-DAY MINIMUM 2980 Oct 2 2610 Jun 12 358 Sep 3 1936 ANNUAL RUNOFF (AC-FT) 5869000 3993000 3515000 ANNUAL RUNOFF (CFSM) 0.70 0.48 0.42 ANNUAL RUNOFF (INCHES) 9.49 6.46 5.68 10 PERCENT EXCEEDS 19500 9670 9880 50 PERCENT EXCEEDS 4670 4760 3560 90 PERCENT EXCEEDS 3490 3200 1340 e Estimated.
O N D2001
J F M A M J J A S2002
1000
2000
5000
10,00010,000
20,000
50,000
100,000
DAILY-MEAN DISCHARGE,
IN CUBIC FEET PER SECOND

156 UPPER MISSISSIPPI RIVER MAIN STEM--Continued
05270500 SAUK RIVER NEAR ST. CLOUD, MN
LOCATION.--Lat 45°33’35", long 94°14’00", in SW1⁄4SW1⁄4 sec. 8, T. 124 N., R. 28 W., Stearns County, Hydrologic Unit 07010203,
on right bank 0.5 mi northwest of Waite Park, 3 mi west of St. Cloud, and 5 mi upstream from mouth.
DRAINAGE AREA.--1,030 mi2.
PERIOD OF RECORD.--July 1909 to December 1912, April to December 1913, May to November 1929, March 1930 to September 1931, April to November 1932, March to November 1933, March 1934 to September 1981. Monthly discharge only for some periods, published in WSP 1308.October 1990 to current year.
REVISED RECORD--WSP 895: Drainage area. WSP 1308: 1912(M), 1932 (M). WSP 1508: 1937(m).
GAGE.--Water-stage recorder. Datum of gage is 1,034.63 ft above sea level (NGVD of 1929). Prior to Nov. 22, 1934, nonrecording gage on highway bridge 1 mi downstream at datum 6.77 ft lower.
REMARKS.--Records good except those for estimated daily discharge, which are fair to poor. Flow may be influenced by minor regulation from small lakes and a powerplant upstream from gage.
DISCHARGE, CUBIC FEET PER SECOND, WATER YEAR OCTOBER 2001 TO SEPTEMBER 2002 DAILY MEAN VALUES DAY OCT NOV DEC JAN FEB MAR APR MAY JUN JUL AUG SEP 1 136 138 e218 e103 e132 e103 e378 609 411 505 1010 1100 2 133 147 e220 e103 e131 e103 e387 592 370 482 998 1200 3 130 131 e226 e103 e132 e103 e366 550 330 450 1120 1180 4 138 125 e232 e106 e134 e105 e333 526 336 418 1540 1060 5 149 122 e231 e112 e135 e109 e311 503 327 378 1520 954 6 148 124 e230 e117 e137 e113 e287 488 312 352 1590 1030 7 136 113 e225 e126 e138 e120 e324 476 321 341 1620 864 8 128 116 e222 e138 e139 e133 e666 510 304 363 1560 779 9 168 112 e218 e146 e140 e150 e1020 619 279 361 1460 736 10 201 107 e207 e150 e138 e167 e1260 599 279 542 1380 845 11 218 101 e204 e160 e138 e185 e1460 604 305 530 1300 782 12 198 115 e200 e160 e140 e201 1490 669 284 470 1200 737 13 213 146 e197 e160 e141 e212 1510 710 281 498 1090 704 14 228 146 e192 e158 e142 e203 1530 724 262 554 968 682 15 235 148 e182 e150 e141 e197 1500 736 239 646 881 640 16 223 148 e174 e140 e140 e190 1420 746 223 759 813 596 17 212 146 e164 e135 e139 e178 1400 727 211 860 781 560 18 207 158 e155 e137 e134 e164 1300 720 197 924 719 526 19 208 156 e147 e140 e127 e153 1240 695 204 977 662 544 20 197 150 e143 e143 e122 e145 1160 669 207 1050 645 509 21 187 146 e137 e148 e116 e136 1090 661 244 1140 750 485 22 177 142 e134 e149 e112 e132 1060 630 271 1150 719 457 23 171 142 e129 e150 e107 e125 969 628 284 1120 708 422 24 178 165 e126 e149 e107 e129 897 569 340 1090 708 400 25 211 220 e120 e148 e106 e129 838 535 386 1170 689 381 26 173 206 e116 e147 e104 e132 727 512 417 1130 657 377 27 137 192 e110 e145 e103 e136 651 488 458 1090 608 370 28 131 e250 e107 e142 e103 e149 672 473 495 1130 580 365 29 132 e236 e105 e140 --- e174 674 479 512 1100 675 362 30 125 e222 e103 e137 --- e213 630 469 517 1060 902 360 31 129 --- e103 e133 --- e271 --- 448 --- 1040 951 ---
TOTAL 5357 4570 5277 4275 3578 4760 27550 18364 9606 23680 30804 20007 MEAN 173 152 170 138 128 154 918 592 320 764 994 667 MAX 235 250 232 160 142 271 1530 746 517 1170 1620 1200 MIN 125 101 103 103 103 103 287 448 197 341 580 360 AC-FT 10630 9060 10470 8480 7100 9440 54650 36420 19050 46970 61100 39680 CFSM 0.17 0.15 0.17 0.13 0.12 0.15 0.89 0.58 0.31 0.74 0.96 0.65 IN. 0.19 0.17 0.19 0.15 0.13 0.17 1.00 0.66 0.35 0.86 1.11 0.72

157 UPPER MISSISSIPPI RIVER MAIN STEM--Continued
05270500 SAUK RIVER NEAR ST. CLOUD, MN--Continued
STATISTICS OF MONTHLY MEAN DATA FOR WATER YEARS 1909 - 2002, BY WATER YEAR (WY)
OCT NOV DEC JAN FEB MAR APR MAY JUN JUL AUG SEP
MEAN 170 182 137 102 110 312 848 529 418 328 217 186 MAX 1154 1091 528 336 568 1380 2997 1862 1333 1262 1250 1136 (WY) 1996 1972 1972 1980 1966 1966 1997 2001 1957 1993 1972 1957 MIN 6.22 6.18 5.15 3.25 7.61 28.7 16.5 7.84 15.9 10.6 10.5 10.7 (WY) 1934 1934 1935 1935 1935 1940 1934 1934 1934 1934 1933 1933
SUMMARY STATISTICS FOR 2001 CALENDAR YEAR FOR 2002 WATER YEAR WATER YEARS 1909 - 2002 ANNUAL TOTAL 212695 157828 ANNUAL MEAN 583 432 310a HIGHEST ANNUAL MEAN 732 1972 LOWEST ANNUAL MEAN 51.0 1931 HIGHEST DAILY MEAN 4550 Apr 14 1620 Aug 7 7940 Apr 14 1965 LOWEST DAILY MEAN 74 Aug 25 101 Nov 11 1.3 Jan 6 1935 ANNUAL SEVEN-DAY MINIMUM 75 Jan 1 103 Feb 26 1.5 Jan 2 1935 MAXIMUM PEAK FLOW 1620 Aug 6 9100 Apr 13 1965 MAXIMUM PEAK STAGE 4.99 Aug 6 10.68 Apr 13 1965 INSTANTANEOUS LOW FLOW 53b Nov 27 0.30 Nov 25 1936 ANNUAL RUNOFF (AC-FT) 421900 313100 224900 ANNUAL RUNOFF (CFSM) 0.57 0.42 0.30 ANNUAL RUNOFF (INCHES) 7.68 5.70 4.09 10 PERCENT EXCEEDS 1770 1060 780 50 PERCENT EXCEEDS 147 232 150 90 PERCENT EXCEEDS 86 123 40 a Median of annual mean discharges is 300 ft3/s. b Result of ice dam upstream. e Estimated.
O N D2001
J F M A M J J A S2002
100
200
500
10001000
2000
5000
10,000
DAILY-MEAN DISCHARGE,
IN CUBIC FEET PER SECOND

158 UPPER MISSISSIPPI RIVER MAIN STEM--Continued
05270700 MISSISSIPPI RIVER AT ST. CLOUD, MN
LOCATION.--Lat 45°32’50", long 94°08’44", in SE1⁄4SW1⁄4 sec. 1, T. 35 N., R. 31 W., Sherburne County, Hydrologic Unit 07010203,
on left bank about 250 ft below the left downstream end of the City of St. Cloud hydropower dam and at mile 926.3 upstream from Ohio River.
DRAINAGE AREA.--13,320 mi2 (approximately).
PERIOD OF RECORD.--October 1988 to current year.
GAGE.--Water-stage recorder. Datum of gage is 958.49 ft above sea level (NGVD of 1929).
REMARKS.--Records good except those for estimated daily discharge, which are fair to poor. Flow partly regulated by power plants and reservoirs.
DISCHARGE, in CFS, WATER YEAR OCTOBER 2001 TO SEPTEMBER 2002 DAILY MEAN VALUES DAY OCT NOV DEC JAN FEB MAR APR MAY JUN JUL AUG SEP 1 4080 5570 5560 e4440 e3750 e3670 7610 9790 5980 11300 8400 6190 2 e4000 5430 5960 e4520 e3720 e3590 7450 9050 5450 11000 7980 7270 3 e3970 5110 6440 e4600 e3680 e3540 7090 8430 5360 10500 8580 7160 4 3530 5420 5800 e4660 e3660 e3480 6780 8620 4760 9480 9340 6780 5 3630 5110 6380 e4770 e3640 e3420 6570 8300 4630 9640 8930 6660 6 3300 5260 6450 e4980 e3640 e3360 6370 7950 4520 8920 8660 9370 7 3270 5280 6560 e5100 e3620 e3310 6740 7860 4670 8460 8390 8290 8 3770 5060 6230 e5160 e3620 e3350 7290 8650 4090 9390 7780 7410 9 3720 4440 5600 e5150 e3610 e3390 7970 9910 4290 11400 7370 6790 10 3810 4820 6100 e5180 e3610 e3390 8840 10000 3810 15800 7010 7010 11 4040 4850 6290 e5170 e3600 e3400 10300 11100 3710 20000 6740 6830 12 4290 4920 6470 e5160 e3600 e3430 11700 11500 3520 21100 6540 6020 13 4140 5680 6150 e5190 e3600 e3440 12600 12000 3470 20000 6620 6190 14 4890 5370 5710 e5200 e3600 e3420 13400 12300 3350 19500 6370 5960 15 5070 4820 6030 e5210 e3600 e3370 13400 12800 3330 18700 6230 5530 16 5380 5100 6070 e5050 e3590 e3320 13500 12900 3050 17400 6270 5560 17 5350 4780 6730 e4340 e3590 e3300 13200 12500 2900 16500 6260 4970 18 5840 5170 7210 e4140 e3610 e3220 13100 12200 2610 15500 6480 5260 19 5530 4690 6020 e3970 e3690 e3300 13200 11500 3500 14500 6460 4890 20 5520 4360 5170 e4030 e3820 e3330 12700 11100 4400 13800 6520 4680 21 5540 4900 e4170 e4000 e3870 e3290 12900 9820 4220 12800 6980 4240 22 5350 4660 e4160 e4010 e3880 e3240 12200 9410 4450 12400 6730 4340 23 5670 4550 e4090 e4010 e3910 e3350 12100 8790 5190 11100 6310 3910 24 6190 5010 e3710 e4010 e3950 e3270 12100 7810 6900 10700 6270 3950 25 5910 5080 e3610 e4000 e4050 e3230 11400 7840 7180 10300 6900 4280 26 5160 5450 e3720 e3970 e3900 e3140 10400 7550 9030 9680 6300 4000 27 5130 5830 e3790 e3920 e3790 e3200 10400 7040 10900 9550 5920 3860 28 5690 5510 e3920 e3890 e3730 e3500 10100 6600 11500 9650 5440 4010 29 5570 5110 e4040 e3850 --- 4630 9770 6430 12000 9060 6040 3940 30 6270 5260 e4200 e3810 --- 6510 9340 5620 11600 9260 6140 4130 31 5540 --- e4360 e3790 --- 7900 --- 5820 --- 8940 5950 ---
TOTAL 149150 152600 166700 139280 103930 113290 310520 291190 164370 396330 215910 169480 MEAN 4811 5087 5377 4493 3712 3655 10350 9393 5479 12780 6965 5649 MAX 6270 5830 7210 5210 4050 7900 13500 12900 12000 21100 9340 9370 MIN 3270 4360 3610 3790 3590 3140 6370 5620 2610 8460 5440 3860 AC-FT 295800 302700 330600 276300 206100 224700 615900 577600 326000 786100 428300 336200 CFSM 0.36 0.38 0.40 0.34 0.28 0.27 0.78 0.71 0.41 0.96 0.52 0.42 IN. 0.42 0.43 0.47 0.39 0.29 0.32 0.87 0.81 0.46 1.11 0.60 0.47

159 UPPER MISSISSIPPI RIVER MAIN STEM--Continued
05270700 MISSISSIPPI RIVER AT ST. CLOUD, MN--Continued
STATISTICS OF MONTHLY MEAN DATA FOR WATER YEARS 1988 - 2002, BY WATER YEAR (WY)
OCT NOV DEC JAN FEB MAR APR MAY JUN JUL AUG SEP
MEAN 5708 6026 4835 4118 4001 6389 14060 12050 8451 8489 5024 4835 MAX 15680 9675 7434 5616 5796 10600 29710 22020 20310 16830 9687 9763 (WY) 1996 1996 1997 1997 1997 1995 2001 2001 2001 1993 1999 1999 MIN 3106 2953 2310 1927 1815 3655 6134 5653 3743 3930 1535 2297 (WY) 1993 1989 1991 1991 1990 2002 2000 1998 1992 1989 1989 1990
SUMMARY STATISTICS FOR 2001 CALENDAR YEAR FOR 2002 WATER YEAR WATER YEARS 1988 - 2002 ANNUAL TOTAL 3540080 2372750 ANNUAL MEAN 9699 6501 6992 HIGHEST ANNUAL MEAN 9947 2001 LOWEST ANNUAL MEAN 4615 1990 HIGHEST DAILY MEAN 44000 Apr 12 21100 Jul 12 45100 Apr 9 1997 LOWEST DAILY MEAN 3270 Oct 7 2610 Jun 18 1010 Aug 24 1989 ANNUAL SEVEN-DAY MINIMUM 3550 Sep 10 3170 Jun 13 1250 Aug 13 1989 MAXIMUM PEAK FLOW 22200a Jul 12 46900 Apr 8 1997 MAXIMUM PEAK STAGE 8.06a Jul 12 11.44 Apr 8 1997 INSTANTANEOUS LOW FLOW 1600a Jun 18 484a Oct 18 1992 ANNUAL RUNOFF (AC-FT) 7022000 4706000 5066000 ANNUAL RUNOFF (CFSM) 0.73 0.49 0.52 ANNUAL RUNOFF (INCHES) 9.89 6.63 7.13 10 PERCENT EXCEEDS 26000 11500 12800 50 PERCENT EXCEEDS 5080 5450 5600 90 PERCENT EXCEEDS 3920 3540 2790 a Due to regulation. e Estimated.
O N D2001
J F M A M J J A S2002
1000
2000
5000
10,00010,000
20,000
50,000
100,000
DAILY-MEAN DISCHARGE,
IN CUBIC FEET PER SECOND

160 UPPER MISSISSIPPI RIVER MAIN STEM--Continued
05275000 ELK RIVER NEAR BIG LAKE, MN
LOCATION.--Lat 45°20’02", long 93°40’00", in NE1⁄4SW1⁄4 sec. 23, T.33 N., R.27 W., Sherburne County, Hydrologic Unit 07010203,
on right bank at upstream side of County Highway 15 bridge, 4 mi east of Big Lake and 4 mi downstream from St. Francis River.
DRAINAGE AREA.--559 mi2.
PERIOD OF RECORD.--April 1911 to September 1917, April to September 1931, April to November 1932, March to November 1933, March 1934 to September 1987, October 1990 to current year.
REVISED RECORDS.--WSP 895: 1939. WSP 1308: 1912(M), 1915-17(M).
GAGE.--Water-stage recorder. Datum of gage is 899.60 ft above sea level (NGVD of 1929). April 1911 to Sept. 30, 1917, April 1, 1931 to July 26, 1934, nonrecording gage at same site and datum.
REMARKS.--Records good except those for periods of estimated daily discharge, which are fair.
DISCHARGE, CUBIC FEET PER SECOND, WATER YEAR OCTOBER 2001 TO SEPTEMBER 2002 DAILY MEAN VALUES DAY OCT NOV DEC JAN FEB MAR APR MAY JUN JUL AUG SEP 1 78 100 189 e86 e94 e88 e157 488 222 500 719 498 2 77 100 175 e86 e93 e88 e195 483 208 496 735 526 3 74 100 179 e87 e93 e87 e229 490 200 512 754 544 4 74 100 182 e89 e93 e87 e227 486 194 506 1070 518 5 72 100 187 e93 e93 e89 e217 473 189 479 1030 479 6 69 100 201 e99 e94 e92 e208 472 178 440 953 609 7 69 101 196 e102 e95 e94 e239 457 178 393 911 702 8 70 101 195 e106 e95 e98 e383 484 180 346 927 690 9 70 101 179 e113 e95 e101 e675 532 179 308 1010 1150 10 77 101 219 e115 e96 e106 899 527 174 403 983 1830 11 82 98 221 e117 e97 e112 1090 526 196 562 894 1940 12 84 99 189 e119 e98 e119 1170 574 203 583 809 1830 13 87 104 183 e119 e98 e128 1230 630 195 640 720 1730 14 93 108 205 e119 e99 e126 1570 652 188 991 637 1680 15 96 109 176 e119 e99 e119 1820 637 178 1620 577 1590 16 96 110 165 e119 e99 e114 1900 628 169 2050 534 1490 17 95 109 166 e119 e100 e108 1850 637 160 2220 519 1360 18 97 109 165 e117 e100 e102 1690 646 153 2210 478 1210 19 100 110 e143 e116 e100 e98 1500 646 151 2040 437 1040 20 100 110 e130 e116 e99 e94 1260 622 151 1780 399 876 21 100 109 e119 e114 e97 e88 1090 581 162 1550 543 732 22 103 110 e110 e109 e95 e85 995 539 202 1350 518 625 23 103 110 e103 e105 e93 e84 902 501 222 1170 469 560 24 104 126 e99 e102 e91 e85 830 461 251 1000 470 514 25 106 168 e96 e101 e90 e85 749 413 315 903 527 487 26 105 180 e93 e100 e89 e88 672 356 351 815 617 483 27 107 151 e91 e99 e89 e92 612 318 372 755 680 459 28 104 143 e89 e98 e88 e95 586 293 413 752 629 439 29 100 181 e88 e97 --- e100 546 278 463 699 560 433 30 101 195 e88 e96 --- e107 511 264 494 649 528 428 31 103 --- e87 e95 --- e121 --- 240 --- 653 503 ---
TOTAL 2796 3543 4708 3272 2662 3080 26002 15334 6891 29375 21140 27452 MEAN 90.2 118 152 106 95.1 99.4 867 495 230 948 682 915 MAX 107 195 221 119 100 128 1900 652 494 2220 1070 1940 MIN 69 98 87 86 88 84 157 240 151 308 399 428 AC-FT 5550 7030 9340 6490 5280 6110 51570 30410 13670 58270 41930 54450 CFSM 0.16 0.21 0.27 0.19 0.17 0.18 1.55 0.88 0.41 1.70 1.22 1.64 IN. 0.19 0.24 0.31 0.22 0.18 0.20 1.73 1.02 0.46 1.95 1.41 1.83

161 UPPER MISSISSIPPI RIVER MAIN STEM--Continued
05275000 ELK RIVER NEAR BIG LAKE, MN--Continued
STATISTICS OF MONTHLY MEAN DATA FOR WATER YEARS 1911 - 2002, BY WATER YEAR (WY)
OCT NOV DEC JAN FEB MAR APR MAY JUN JUL AUG SEP
MEAN 204 209 149 111 117 298 667 443 336 271 185 206 MAX 778 794 410 290 392 1125 1823 1620 1647 1026 926 1050 (WY) 1985 1972 1966 1979 1984 1966 1969 1986 1984 1978 1972 1986 MIN 32.7 56.3 44.1 38.4 29.8 58.8 75.5 37.5 20.5 8.94 8.74 23.4 (WY) 1934 1935 1935 1935 1936 1934 1934 1934 1934 1934 1934 1932
SUMMARY STATISTICS FOR 2001 CALENDAR YEAR FOR 2002 WATER YEAR WATER YEARS 1911 - 2002 ANNUAL TOTAL 121348 146255 ANNUAL MEAN 332 401 276a HIGHEST ANNUAL MEAN 669 1986 LOWEST ANNUAL MEAN 88.0 1935 HIGHEST DAILY MEAN 4370 Apr 27 2220 Jul 17 7170 Apr 16 1965 LOWEST DAILY MEAN 58 Feb 21 69 Oct 6,7 4.0 Aug 1 1934 ANNUAL SEVEN-DAY MINIMUM 59 Feb 18 71 Oct 3 4.5 Jul 27 1934 MAXIMUM PEAK FLOW 2240 Jul 17 7360 Apr 16 1965 MAXIMUM PEAK STAGE 6.25 Jul 17 10.86 Apr 16 1965 INSTANTANEOUS LOW FLOW 68 Oct 6 3.6 Jul 31 1934 ANNUAL RUNOFF (AC-FT) 240700 290100 200100 ANNUAL RUNOFF (CFSM) 0.59 0.72 0.49 ANNUAL RUNOFF (INCHES) 8.08 9.73 6.71 10 PERCENT EXCEEDS 880 993 575 50 PERCENT EXCEEDS 100 181 170 90 PERCENT EXCEEDS 63 91 72 a Median of annual mean discharges is 258 ft3/s. e Estimated.
O N D2001
J F M A M J J A S2002
10
20
50
100100
200
500
10001000
2000
5000
10,000
DAILY-MEAN DISCHARGE,
IN CUBIC FEET PER SECOND

162 UPPER MISSISSIPPI RIVER MAIN STEM--Continued
05280000 CROW RIVER AT ROCKFORD, MN
LOCATION.--Lat 45°05’12", long 93°44’02", in sec. 29, T.119 N., R.24 W., Hennepin County, Hydrologic Unit 07010204, on right bank at Rockford, 150 ft downstream from bridge on State Highway 55, 2 miles downstream from confluence of North and South Forks, and 23 miles upstream from confluence with the Mississippi River.
DRAINAGE AREA.--2,640 mi2.
PERIOD OF RECORD.--April to July 1906 (published as "near Dayton"), June 1909 to September 1917, April to November 1929, March 1930 to September 1931, April to November 1932, March to November 1933, March 1934 to current year. Monthly discharge only for some periods, published in WSP 1308.
REVISED RECORDS.--WSP 1115: 1932. WSP 1508: 1933. WDR MN-77-2: 1972 (M)(m).
GAGE.--Water-stage recorder. Datum of gage is 893.08 ft above sea level (NGVD of 1929). Apr. 13 to July 21, 1906, nonrecording gage at Berning Mill 14 mi downstream at different datum. June 4, 1909 to Sept. 30, 1917, nonrecording gage at site 600 ft downstream at different datum;. Apr. 23, 1929 to Aug. 21, 1934, nonrecording gage at site 600 ft downstream at present datum.
REMARKS.--Records good except those for estimated daily discharges, which are fair.
DISCHARGE, CUBIC FEET PER SECOND, WATER YEAR OCTOBER 2001 TO SEPTEMBER 2002 DAILY MEAN VALUES DAY OCT NOV DEC JAN FEB MAR APR MAY JUN JUL AUG SEP 1 93 90 224 e151 e155 e150 1350 1650 1120 11900 1950 4530 2 91 88 236 e150 e154 e148 1510 1600 1070 11700 1890 4390 3 87 86 206 e152 e154 e149 1700 1550 1080 11200 1920 4160 4 84 85 230 e153 e153 e148 1720 1500 1080 10300 2940 3910 5 80 84 264 e155 e152 e148 1770 1480 1060 9390 3650 3650 6 79 83 283 e157 e153 e152 1720 1600 1020 8430 4670 3990 7 79 83 285 e163 e155 e150 1600 1570 1060 7880 5570 3830 8 79 83 293 e167 e157 e156 1570 1660 1100 7110 5970 3710 9 79 83 221 e170 e160 e160 1570 1900 1130 6370 5960 3600 10 85 82 289 e177 e167 e162 1610 1930 1100 6030 5680 3470 11 85 83 282 e179 168 e165 1780 2000 1150 5850 5240 3260 12 82 85 278 e180 170 e168 1880 2090 1130 5280 4760 3020 13 83 93 273 e181 171 e170 1990 2130 1160 4830 4280 2780 14 86 94 212 e180 173 e169 2100 2140 1170 4480 3810 2580 15 90 94 e230 e176 174 218 2170 2120 1130 4140 3410 2390 16 93 96 e245 e173 e172 250 2210 2060 1040 3830 3060 2230 17 92 99 e251 e163 e170 221 2220 2000 940 3540 2970 2090 18 91 101 e249 e153 e167 205 2230 1920 863 3260 3090 1950 19 92 98 e200 e155 e167 199 2200 1820 848 3040 3150 1850 20 90 96 e195 e157 e165 e194 2130 1730 1100 2830 3090 1750 21 90 94 e190 e159 e165 e193 2070 1630 1980 2720 3600 1650 22 91 93 e184 e160 e160 e193 2000 1540 2710 2610 4040 1550 23 94 93 e180 e160 e158 e192 1930 1460 3130 2440 4340 1460 24 93 117 e175 e159 e154 e192 1870 1390 3580 2300 4680 1360 25 91 145 e167 e159 e150 e193 1810 1300 5630 2210 5000 1240 26 90 169 e162 e159 e148 e205 1750 1200 7000 2080 5190 1170 27 90 189 e158 e158 e149 272 1700 1130 9100 2000 5280 1140 28 89 183 e156 e157 e150 366 1710 1070 10700 1980 5280 1080 29 91 227 e154 e157 --- 635 1700 1090 11500 1970 5170 1050 30 94 218 e153 e156 --- 1040 1680 1200 11900 1950 5010 1010 31 93 --- e152 e156 --- 1210 --- 1160 --- 1970 4770 ---
TOTAL 2726 3314 6777 5032 4491 8173 55250 50620 88581 155620 129420 75850 MEAN 87.9 110 219 162 160 264 1842 1633 2953 5020 4175 2528 MAX 94 227 293 181 174 1210 2230 2140 11900 11900 5970 4530 MIN 79 82 152 150 148 148 1350 1070 848 1950 1890 1010 AC-FT 5410 6570 13440 9980 8910 16210 109600 100400 175700 308700 256700 150400 CFSM 0.03 0.04 0.08 0.06 0.06 0.10 0.70 0.62 1.12 1.90 1.58 0.96 IN. 0.04 0.05 0.10 0.07 0.06 0.12 0.78 0.71 1.25 2.19 1.82 1.07

163 UPPER MISSISSIPPI RIVER MAIN STEM--Continued
05280000 CROW RIVER AT ROCKFORD, MN--Continued
STATISTICS OF MONTHLY MEAN DATA FOR WATER YEARS 1906 - 2002, BY WATER YEAR (WY)
OCT NOV DEC JAN FEB MAR APR MAY JUN JUL AUG SEP
MEAN 433 412 291 173 172 852 2243 1491 1293 1076 593 501 MAX 3809 1909 1477 928 1115 4085 9026 5992 6166 6759 4175 4941 (WY) 1986 1972 1983 1992 1966 1983 1965 1986 1906 1993 2002 1991 MIN 16.6 28.3 17.3 12.4 12.5 25.1 57.1 26.7 14.8 5.76 5.87 13.0 (WY) 1934 1937 1938 1938 1959 1934 1934 1934 1934 1934 1934 1933
SUMMARY STATISTICS FOR 2001 CALENDAR YEAR FOR 2002 WATER YEAR WATER YEARS 1906 - 2002 ANNUAL TOTAL 490621 585854 ANNUAL MEAN 1344 1605 826a HIGHEST ANNUAL MEAN 2754 1986 LOWEST ANNUAL MEAN 64.5 1931 HIGHEST DAILY MEAN 13000 Apr 29 11900 Jun 30, July 1 22100 Apr 16 1965 LOWEST DAILY MEAN 79 Oct 6 79 Oct 6-9 3.8 Aug 4 1934 ANNUAL SEVEN-DAY MINIMUM 81 Oct 4 81 Oct 4 4.0 Jul 31 1934 MAXIMUM PEAK FLOW 12000 Jul 1 22400 Apr 16 1965 MAXIMUM PEAK STAGE 13.97 Jul 1 19.27b Apr 16 1965 INSTANTANEOUS LOW FLOW 79 Oct 5 1.8c Nov 15 1936 ANNUAL RUNOFF (AC-FT) 973100 1162000 598100 ANNUAL RUNOFF (CFSM) 0.51 0.61 0.31 ANNUAL RUNOFF (INCHES) 6.91 8.26 4.25 10 PERCENT EXCEEDS 4280 4430 2310 50 PERCENT EXCEEDS 126 940 281 90 PERCENT EXCEEDS 86 92 41 a Median of annual mean discharges is 632 ft3/s. b From floodmark. c Result of ice jam upstream. e Estimated.
O N D2001
J F M A M J J A S2002
10
20
50
100100
200
500
10001000
2000
5000
10,00010,000
20,000
50,000
100,000
DAILY-MEAN DISCHARGE,
IN CUBIC FEET PER SECOND

164 UPPER MISSISSIPPI RIVER MAIN STEM--Continued
05284000 MILLE LACS LAKE AT COVE BAY NEAR ONAMIA, MN
LOCATION.--Lat 46°06’36", long 93°37’08", in NE1⁄4NE1⁄4 sec. 21, T.42 N., R.26 W., Mille Lacs County, Hydrologic Unit 07010207,
in Minnesota Department of Natural Resources boathouse at Cove Bay boatlanding, 3.6 mi northeast of Onamia.
PERIOD OF RECORD.--June 1931 to current year. Monthend records for the period October 1939 to September 1953 published in WSP 1278 (fragmentary 1940-41). Published as "at Wealthwood" prior to October 1939, and as "at Garrison" October 1939 to September 1987 (gage heights collected at Wealthwood October 1939 to September 1941, but converted to gage datum at Garrison for publication).
GAGE.--Water-stage recorder. Datum of gage is 1,240.40 ft above sea level (NGVD of 1929, levels by Minnesota Department of Natural Resources). Gage readings have been converted to elevations above sea level. Prior to Oct. 1, 1941, nonrecording gage at Wealthwood, 17 mi north of present site, at various datums; gage readings were converted to elevations (adjustment of 1912). Oct. 1, 1941 to Sept. 30, 1958, water-stage recorder at Garrison, 16 mi northwest of present site at datum 1,240.50 ft (adjustment of 1912). To convert these readings to NGVD of 1929, subtract 0.10 ft. Oct. 1, 1958 to Sept. 30, 1987, water-stage recorder at Garrison at present datum.
REMARKS.--Records good to fair. Water level affected by fixed-crest spillway constructed in 1953 at outlet of Ogechie Lake, 2.7 mi downstream from outlet of Mille Lacs Lake, with crest at elevation 1,250.50 ft. Water level subject to fluctuation caused by seiches.
EXTREMES FOR PERIOD OF RECORD.--Maximum gage-height, 13.64 ft, July 21, 2002, affected by seiche action; maximum daily, 13.03 ft, Aug. 22, 1972; minimum gage-height observed, 5.34 ft (present datum) Oct. 16-19, 1936.
EXTREMES FOR CURRENT YEAR.--Maximum gage-height, 13.64 ft, July 21, affected by seiche action; maximum daily, 12.95 ft, July 22, Aug. 1, 4, Sept. 10; minimum gage height recorded, 10.66 ft, June 6, affected by seiche action; minimum daily recorded, 10.86 ft, Nov. 12, 20.
GAGE HEIGHT, FEET, WATER YEAR OCTOBER 2001 TO SEPTEMBER 2002 DAILY MEAN VALUES
DAY OCT NOV DEC JAN FEB MAR APR MAY JUN JUL AUG SEP 1 11.25 10.94 11.04 10.93 10.91 11.02 11.13 11.54 11.65 11.79 12.95 12.72 2 11.26 10.97 11.00 10.93 10.90 11.02 11.15 11.57 11.64 11.83 12.85 12.78 3 11.28 10.94 11.03 10.91 10.91 11.01 11.16 11.50 11.63 --- 12.84 12.76 4 11.26 10.93 11.05 10.92 --- 11.01 11.15 11.54 11.62 --- 12.95 12.70 5 11.24 10.88 11.06 10.92 --- 11.01 11.15 11.53 11.59 --- 12.90 12.67 6 11.15 10.93 11.06 10.92 --- 11.02 11.15 11.56 11.52 --- 12.81 12.69 7 11.06 10.95 11.06 10.92 10.90 11.02 11.15 11.57 11.55 --- 12.75 12.69 8 11.01 11.06 11.07 10.92 10.90 11.05 11.16 11.67 11.57 12.30 12.75 12.67 9 11.07 10.89 10.97 10.91 10.92 11.08 11.16 11.75 11.55 12.31 12.75 12.71 10 11.17 10.93 11.05 10.92 10.91 11.07 11.24 11.72 11.56 12.37 12.74 12.95 11 11.17 10.87 10.96 10.92 10.91 11.08 11.31 11.72 11.59 12.44 12.74 12.77 12 11.16 10.86 11.04 10.92 10.90 11.07 11.33 11.77 11.58 12.45 12.83 12.73 13 11.22 10.90 11.02 10.93 10.90 11.08 11.34 11.79 11.59 12.46 12.79 12.72 14 11.22 10.92 10.99 10.92 10.91 11.09 11.37 11.79 11.61 12.45 12.70 12.76 15 11.23 10.93 10.94 10.93 10.90 11.12 11.38 11.76 11.64 12.42 12.75 12.68 16 11.22 10.92 10.96 10.92 10.91 11.12 11.39 11.85 11.57 12.41 12.73 12.64 17 11.11 10.89 10.96 10.91 10.91 11.12 11.42 11.78 11.55 12.52 12.85 12.63 18 11.17 11.00 11.01 10.91 10.92 11.12 11.49 11.76 11.49 12.64 12.82 12.60 19 11.12 10.98 11.00 10.91 10.95 11.13 11.46 11.74 11.65 12.59 12.81 12.67 20 11.12 10.86 10.93 10.91 10.97 11.14 11.44 11.72 11.73 12.57 12.74 12.65 21 11.12 10.88 10.91 10.91 10.96 11.13 11.46 11.65 11.71 12.91 12.78 12.59 22 11.08 10.90 10.94 10.91 10.95 11.13 11.46 11.61 11.69 12.95 12.80 12.56 23 11.07 10.91 10.98 10.91 10.96 11.13 11.41 11.73 11.78 12.88 12.79 12.47 24 11.05 11.05 10.94 10.90 11.00 11.13 11.54 11.72 11.83 12.83 12.79 12.31 25 11.46 11.14 10.94 10.91 11.03 11.13 11.61 11.66 11.83 12.89 12.79 12.34 26 11.21 11.04 10.94 10.91 11.02 11.13 11.45 11.68 11.89 12.91 12.78 12.32 27 11.14 11.16 10.93 10.91 11.02 11.13 11.43 11.70 11.85 12.88 12.75 12.31 28 11.20 11.09 10.94 10.91 11.01 11.12 11.51 11.64 11.83 12.91 12.71 12.30 29 11.06 11.05 10.93 10.91 --- 11.13 11.52 11.65 11.80 12.91 12.76 12.29 30 10.90 11.05 10.93 10.91 --- 11.13 11.49 11.66 11.80 12.88 12.73 12.28 31 10.93 --- 10.93 10.91 --- 11.13 --- 11.66 --- 12.88 12.66 ---
MEAN 11.15 10.96 10.98 10.92 --- 11.09 11.35 11.68 11.66 --- 12.79 12.60 MAX 11.46 11.16 11.07 10.93 --- 11.14 11.61 11.85 11.89 --- 12.95 12.95 MIN 10.90 10.86 10.91 10.90 --- 11.01 11.13 11.50 11.49 --- 12.66 12.28

165 UPPER MISSISSIPPI RIVER MAIN STEM--Continued
05284000 MILLE LACS LAKE AT COVE BAY NEAR ONAMIA, MN--Continued
O N D2001
J F M A M J J A S2002
10.5
11
11.5
12
12.5
13
GAGE HEIGHT, IN FEET
Gap indicatesmissing record
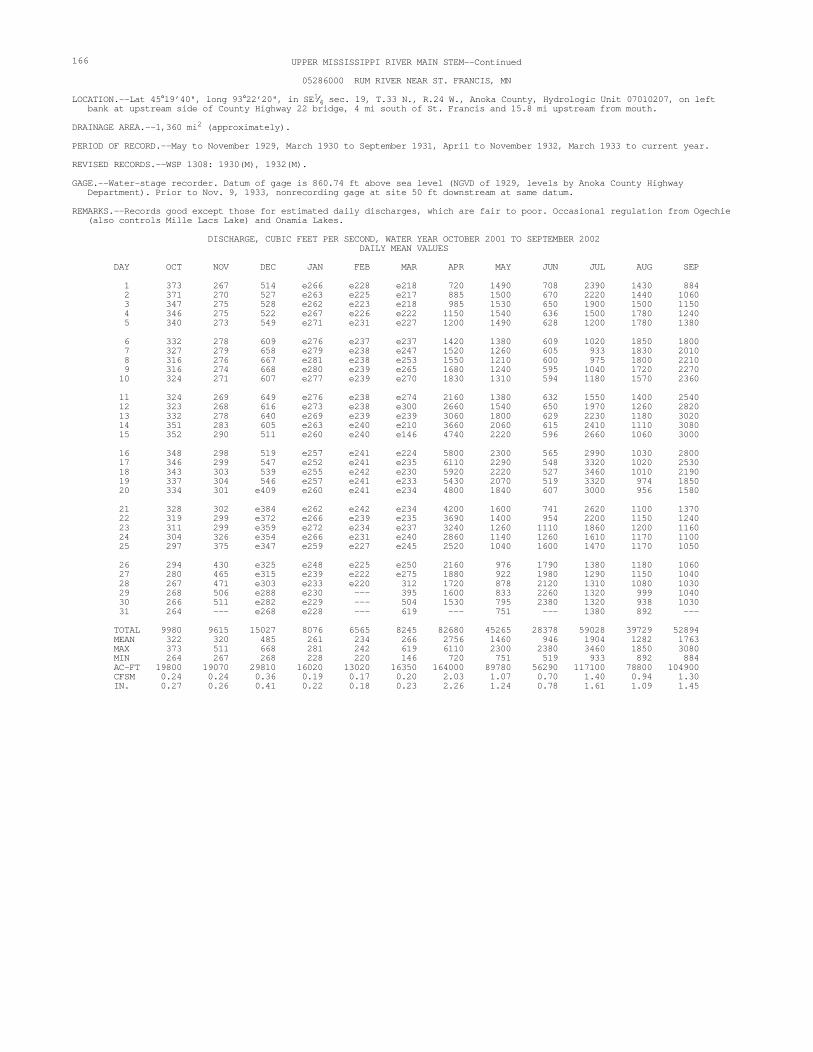
166 UPPER MISSISSIPPI RIVER MAIN STEM--Continued
05286000 RUM RIVER NEAR ST. FRANCIS, MN
LOCATION.--Lat 45°19’40", long 93°22’20", in SE1⁄4 sec. 19, T.33 N., R.24 W., Anoka County, Hydrologic Unit 07010207, on left bank at upstream side of County Highway 22 bridge, 4 mi south of St. Francis and 15.8 mi upstream from mouth.
DRAINAGE AREA.--1,360 mi2 (approximately).
PERIOD OF RECORD.--May to November 1929, March 1930 to September 1931, April to November 1932, March 1933 to current year.
REVISED RECORDS.--WSP 1308: 1930(M), 1932(M).
GAGE.--Water-stage recorder. Datum of gage is 860.74 ft above sea level (NGVD of 1929, levels by Anoka County Highway Department). Prior to Nov. 9, 1933, nonrecording gage at site 50 ft downstream at same datum.
REMARKS.--Records good except those for estimated daily discharges, which are fair to poor. Occasional regulation from Ogechie (also controls Mille Lacs Lake) and Onamia Lakes.
DISCHARGE, CUBIC FEET PER SECOND, WATER YEAR OCTOBER 2001 TO SEPTEMBER 2002 DAILY MEAN VALUES DAY OCT NOV DEC JAN FEB MAR APR MAY JUN JUL AUG SEP 1 373 267 514 e266 e228 e218 720 1490 708 2390 1430 884 2 371 270 527 e263 e225 e217 885 1500 670 2220 1440 1060 3 347 275 528 e262 e223 e218 985 1530 650 1900 1500 1150 4 346 275 522 e267 e226 e222 1150 1540 636 1500 1780 1240 5 340 273 549 e271 e231 e227 1200 1490 628 1200 1780 1380 6 332 278 609 e276 e237 e237 1420 1380 609 1020 1850 1800 7 327 279 658 e279 e238 e247 1520 1260 605 933 1830 2010 8 316 276 667 e281 e238 e253 1550 1210 600 975 1800 2210 9 316 274 668 e280 e239 e265 1680 1240 595 1040 1720 2270 10 324 271 607 e277 e239 e270 1830 1310 594 1180 1570 2360 11 324 269 649 e276 e238 e274 2160 1380 632 1550 1400 2540 12 323 268 616 e273 e238 e300 2660 1540 650 1970 1260 2820 13 332 278 640 e269 e239 e239 3060 1800 629 2230 1180 3020 14 351 283 605 e263 e240 e210 3660 2060 615 2410 1110 3080 15 352 290 511 e260 e240 e146 4740 2220 596 2660 1060 3000 16 348 298 519 e257 e241 e224 5800 2300 565 2990 1030 2800 17 346 299 547 e252 e241 e235 6110 2290 548 3320 1020 2530 18 343 303 539 e255 e242 e230 5920 2220 527 3460 1010 2190 19 337 304 546 e257 e241 e233 5430 2070 519 3320 974 1850 20 334 301 e409 e260 e241 e234 4800 1840 607 3000 956 1580 21 328 302 e384 e262 e242 e234 4200 1600 741 2620 1100 1370 22 319 299 e372 e266 e239 e235 3690 1400 954 2200 1150 1240 23 311 299 e359 e272 e234 e237 3240 1260 1110 1860 1200 1160 24 304 326 e354 e266 e231 e240 2860 1140 1260 1610 1170 1100 25 297 375 e347 e259 e227 e245 2520 1040 1600 1470 1170 1050 26 294 430 e325 e248 e225 e250 2160 976 1790 1380 1180 1060 27 280 465 e315 e239 e222 e275 1880 922 1980 1290 1150 1040 28 267 471 e303 e233 e220 312 1720 878 2120 1310 1080 1030 29 268 506 e288 e230 --- 395 1600 833 2260 1320 999 1040 30 266 511 e282 e229 --- 504 1530 795 2380 1320 938 1030 31 264 --- e268 e228 --- 619 --- 751 --- 1380 892 ---
TOTAL 9980 9615 15027 8076 6565 8245 82680 45265 28378 59028 39729 52894 MEAN 322 320 485 261 234 266 2756 1460 946 1904 1282 1763 MAX 373 511 668 281 242 619 6110 2300 2380 3460 1850 3080 MIN 264 267 268 228 220 146 720 751 519 933 892 884 AC-FT 19800 19070 29810 16020 13020 16350 164000 89780 56290 117100 78800 104900 CFSM 0.24 0.24 0.36 0.19 0.17 0.20 2.03 1.07 0.70 1.40 0.94 1.30 IN. 0.27 0.26 0.41 0.22 0.18 0.23 2.26 1.24 0.78 1.61 1.09 1.45

167 UPPER MISSISSIPPI RIVER MAIN STEM--Continued
05286000 RUM RIVER NEAR ST. FRANCIS, MN--Continued
STATISTICS OF MONTHLY MEAN DATA FOR WATER YEARS 1929 - 2002, BY WATER YEAR (WY)
OCT NOV DEC JAN FEB MAR APR MAY JUN JUL AUG SEP
MEAN 449 439 323 242 246 612 1581 1118 868 651 424 442 MAX 2300 1715 1051 660 813 2699 4269 3899 3400 2532 2251 2362 (WY) 1969 1972 1983 1987 1966 1966 1969 1986 1984 1954 1972 1986 MIN 65.4 71.8 55.8 51.5 59.2 75.8 154 73.6 43.7 34.5 37.3 47.1 (WY) 1934 1934 1934 1934 1934 1934 1934 1934 1934 1934 1934 1933
SUMMARY STATISTICS FOR 2001 CALENDAR YEAR FOR 2002 WATER YEAR WATER YEARS 1929 - 2002 ANNUAL TOTAL 337333 365482 ANNUAL MEAN 924 1001 634 HIGHEST ANNUAL MEAN 1512 1986 LOWEST ANNUAL MEAN 66.1 1934 HIGHEST DAILY MEAN 8090 Apr 29 6110 Apr 17 10000 Apr 13 1969 LOWEST DAILY MEAN 127 Feb 20 146 Mar 15 30 Aug 3 1934 ANNUAL SEVEN-DAY MINIMUM 127 Feb 20 216 Mar 14 31 Aug 1 1934 MAXIMUM PEAK FLOW 6200 Apr 17 10100a Apr 20 1965 MAXIMUM PEAK STAGE 8.70 Apr 17 11.63 Apr 13 1969 INSTANTANEOUS LOW FLOW 90b Mar 15 29 Aug 18 1934 ANNUAL RUNOFF (AC-FT) 669100 724900 459300 ANNUAL RUNOFF (CFSM) 0.68 0.74 0.47 ANNUAL RUNOFF (INCHES) 9.23 10.00 6.33 10 PERCENT EXCEEDS 2310 2240 1390 50 PERCENT EXCEEDS 432 607 373 90 PERCENT EXCEEDS 132 239 118 a Also occurred Apr. 13, 1969. b Result of freezeup. e Estimated.
O N D2001
J F M A M J J A S2002
100
200
500
10001000
2000
5000
10,000
DAILY-MEAN DISCHARGE,
IN CUBIC FEET PER SECOND

168 UPPER MISSISSIPPI RIVER MAIN STEM--Continued
05287890 ELM CREEK NEAR CHAMPLIN, MN
LOCATION.--Lat 45°09’48", long 93°26’11", in NE1⁄4NW1⁄4 sec. 35, T.120 N., R.22 W., Hennepin County, Hydrologic Unit 07010206,
on left bank, 33 ft downstream from bridge on Elm Creek Road, 2.5 mi southwest of Champlin.
DRAINAGE AREA.--86.0 mi2.
PERIOD OF RECORD.--October 1978 to current year.
GAGE.--Water-stage recorder. Datum of gage is 850.70 ft above sea level (NGVD of 1929). Prior to March 16, 1979, nonrecording gage at present site and datum.
REMARKS.--Records good except those for estimated daily discharges, which are poor.
REVISIONS.--The maximum discharge has been revised for water years; 1982, 471 ft3/s; 1985, 579 ft3/s; 1986, 812 ft3/s; 1994, 669 ft3/s; 1996, 404 ft3/s; 1997, 511 ft3/s; and 1999, 538 ft3/s.
DISCHARGE, in CFS, WATER YEAR OCTOBER 2001 TO SEPTEMBER 2002 DAILY MEAN VALUES DAY OCT NOV DEC JAN FEB MAR APR MAY JUN JUL AUG SEP 1 6.7 2.5 22 e4.3 e1.2 e6.4 95 91 26 361 125 99 2 8.4 2.6 22 e4.1 e1.2 e6.1 e97 89 23 328 115 129 3 8.1 2.5 22 e4.1 e1.1 e5.8 e100 86 40 304 117 137 4 5.2 2.3 23 e4.5 e1.0 e5.4 e97 81 51 276 203 130 5 3.0 2.3 30 e4.0 e0.98 e5.2 e95 79 51 240 231 122 6 2.2 2.4 e35 e3.5 e0.95 e5.2 e92 123 48 201 228 164 7 2.7 3.0 e38 e3.4 0.92 e5.2 e91 168 47 175 237 227 8 2.8 2.8 e42 e3.8 0.89 e5.4 e91 268 48 152 235 275 9 2.5 2.7 e44 3.8 e0.86 e5.8 90 471 46 133 221 315 10 2.8 2.5 e44 3.5 e0.85 e6.3 94 522 42 129 199 329 11 2.7 2.5 e43 3.2 e0.84 6.4 137 531 47 142 167 315 12 2.6 2.5 e40 3.0 e0.85 5.1 174 501 52 153 137 292 13 3.0 3.0 e35 2.9 e0.86 e5.6 193 446 54 155 113 266 14 3.8 2.9 31 e2.9 e0.90 e6.2 207 395 54 152 94 237 15 4.3 2.9 30 e2.9 e0.96 e6.5 213 361 53 143 83 207 16 3.6 2.7 27 e2.9 e1.0 e7.0 205 327 49 129 74 173 17 2.5 2.4 24 e2.8 1.1 7.6 188 289 44 113 69 146 18 2.6 2.6 21 e2.8 1.5 7.5 180 253 39 96 62 127 19 2.2 2.5 e13 e2.8 2.6 7.5 167 214 40 86 53 110 20 2.2 2.1 e11 e2.7 4.0 8.2 150 176 40 77 45 99 21 2.7 1.9 e9.4 e3.0 4.9 e8.2 135 145 93 71 85 88 22 2.7 1.5 e8.5 3.4 e5.4 e8.0 124 119 230 69 141 81 23 2.7 1.5 e7.5 3.0 6.9 e7.7 114 99 300 63 185 77 24 2.7 3.9 e7.0 3.1 7.7 e7.3 102 87 360 56 236 71 25 2.8 10 e6.5 2.5 11 6.9 94 76 460 62 258 68 26 2.9 10 e6.0 2.6 e9.5 7.2 87 67 511 71 233 69 27 3.4 14 e5.6 2.4 e7.5 8.7 82 58 512 77 208 65 28 3.8 17 e5.4 e1.9 e6.8 36 84 49 486 86 167 60 29 3.0 20 e5.2 e1.7 --- 61 89 44 435 108 141 57 30 3.3 22 e5.0 e1.4 --- 78 91 38 391 123 123 55 31 3.2 --- e4.5 e1.3 --- 93 --- 32 --- 127 108 ---
TOTAL 107.1 153.5 667.6 94.2 84.26 446.4 3758 6285 4672 4458 4693 4590 MEAN 3.455 5.117 21.54 3.039 3.009 14.40 125.3 202.7 155.7 143.8 151.4 153.0 MAX 8.4 22 44 4.5 11 93 213 531 512 361 258 329 MIN 2.2 1.5 4.5 1.3 0.84 5.1 82 32 23 56 45 55 AC-FT 212 304 1320 187 167 885 7450 12470 9270 8840 9310 9100 CFSM 0.04 0.06 0.25 0.04 0.03 0.17 1.46 2.36 1.81 1.67 1.76 1.78 IN. 0.05 0.07 0.29 0.04 0.04 0.19 1.63 2.72 2.02 1.93 2.03 1.99

169 UPPER MISSISSIPPI RIVER MAIN STEM--Continued
05287890 ELM CREEK NEAR CHAMPLIN, MN--Continued
STATISTICS OF MONTHLY MEAN DATA FOR WATER YEARS 1979 - 2002, BY WATER YEAR (WY)
OCT NOV DEC JAN FEB MAR APR MAY JUN JUL AUG SEP
MEAN 27.20 20.72 11.59 5.445 10.04 64.73 108.6 70.34 45.77 37.90 34.15 30.50 MAX 240 67.4 41.3 22.0 99.1 185 414 203 156 157 151 170 (WY) 1986 1994 1992 1992 1984 1985 2001 2002 2002 1993 2002 1991 MIN 1.13 1.03 0.92 0.74 0.91 3.86 5.31 3.54 1.34 0.76 1.44 1.08 (WY) 1990 1990 1990 1991 1990 2001 1987 2000 1988 1988 1989 1988
SUMMARY STATISTICS FOR 2001 CALENDAR YEAR FOR 2002 WATER YEAR WATER YEARS 1979 - 2002 ANNUAL TOTAL 21724.5 30009.06 ANNUAL MEAN 59.52 82.22 39.00 HIGHEST ANNUAL MEAN 82.2 2002 LOWEST ANNUAL MEAN 4.54 1988 HIGHEST DAILY MEAN 815 Apr 25 531 May 11 815 Apr 25 2001 LOWEST DAILY MEAN 1.4 Mar 9 0.84a Feb 11 0.31 Jun 30 1988 ANNUAL SEVEN-DAY MINIMUM 1.5 Mar 7 0.86 Feb 8 0.35 Jun 26 1988 MAXIMUM PEAK FLOW 554 May 10 875 Apr 25 2001 MAXIMUM PEAK STAGE 9.44 May 10 10.02 Apr 25 2001 INSTANTANEOUS LOW FLOW 0.29 Jul 9 1989 ANNUAL RUNOFF (AC-FT) 43090 59520 28250 ANNUAL RUNOFF (CFSM) 0.69 0.96 0.45 ANNUAL RUNOFF (INCHES) 9.40 12.98 6.16 10 PERCENT EXCEEDS 167 232 109 50 PERCENT EXCEEDS 6.5 40 12 90 PERCENT EXCEEDS 2.4 2.5 2.0 a Estimated, backwater from ice. e Estimated.
O N D2001
J F M A M J J A S2002
0.1
0.2
0.5
11
2
5
1010
20
50
100100
200
500
1000
DAILY-MEAN DISCHARGE,
IN CUBIC FEET PER SECOND

170 UPPER MISSISSIPPI RIVER MAIN STEM--Continued
05287890 ELM CREEK NEAR CHAMPLIN, MN--Continued
WATER-QUALITY RECORDS
PERIOD OF RECORD.--February 1988 to current year.
WATER-QUALITY DATA, WATER YEAR OCTOBER 2001 TO SEPTEMBER 2002 DIS- BARO- OXYGEN, PH SPE- CHARGE, METRIC DIS- WATER CIFIC SPE- INST. PRES- SOLVED WHOLE CON- CIFIC CUBIC SURE OXYGEN, (PER- FIELD DUCT- CON- TEMPER- TEMPER- Sample Medium GAGE FEET (MM DIS- CENT (STAND- ANCE DUCT- ATURE ATURE Date Time type code HEIGHT PER OF SOLVED SATUR- ARD LAB ANCE AIR WATER (FEET) SECOND HG) (MG/L) ATION) UNITS) (US/CM) (US/CM) (DEG C) (DEG C) (00065) (00061) (00025) (00300) (00301) (00400) (90095) (00095) (00020) (00010) OCT 22... 1200 ENVIRONMENTAL 3.47 2.5 738 7.3 61 7.6 -- 586 16.0 6.4NOV 19... 1100 ENVIRONMENTAL 3.38 2.6 744 4.7 38 7.8 -- 640 3.3 5.6DEC 19... 1015 ENVIRONMENTAL 3.90 13 742 11.8 83 7.8 -- 548 2.0 .2JAN 24... 1030 ENVIRONMENTAL 3.48 5.0 741 10.9 77 7.7 -- 714 -5.0 .3FEB 13... 1035 ENVIRONMENTAL 3.19 1.2 745 11.2 79 8.2 -- 770 3.0 .4MAR 26... 1040 ENVIRONMENTAL 3.68 8.1 750 12.0 88 8.6 -- 792 5.0 2.0MAR 28-29 0100 COMPOSITE (TIME) -- -- -- -- -- 7.4 -- 411 -- --APR 02-02 1221 COMPOSITE (TIME) -- -- -- -- -- 7.8 -- 440 -- --APR 10-13 2327 COMPOSITE (TIME) -- -- -- -- -- 7.9 -- 490 -- -- 18... 1230 ENVIRONMENTAL 7.31 183 729 7.2 75 7.3 -- 550 19.0 15.3MAY 05-08 2004 COMPOSITE (TIME) -- -- -- -- -- 7.8 -- 519 -- --MAY 08-11 2235 COMPOSITE (TIME) -- -- -- -- -- -- 452 -- -- --JUN 11-12 0102 COMPOSITE (TIME) -- -- -- -- -- 8.0 -- 490 -- -- 12... 0950 ENVIRONMENTAL 4.97 54 742 5.8 66 7.5 -- 493 21.0 20.0JUN 21-24 0741 COMPOSITE (TIME) -- -- -- -- -- 7.7 -- 368 -- --JUL 23... 1030 ENVIRONMENTAL 5.24 63 749 4.7 54 7.3 -- 436 21.0 21.0JUL 25-28 1043 COMPOSITE (TIME) -- -- -- -- -- 8.2 -- 417 -- --AUG 20... 1400 ENVIRONMENTAL 4.78 45 743 6.8 76 7.2 -- 418 27.5 20.0 20... 1402 BLANK -- -- -- -- -- -- <3 -- -- --AUG 21-23 0407 COMPOSITE (TIME) -- -- -- -- -- 7.9 326 343 -- --

171 UPPER MISSISSIPPI RIVER MAIN STEM--Continued
05287890 ELM CREEK NEAR CHAMPLIN, MN--Continued
WATER-QUALITY DATA, WATER YEAR OCTOBER 2001 TO SEPTEMBER 2002 RESIDUE NITRO- NITRO- NITRO- NITRO- OXYGEN CHLO- TOTAL RESIDUE GEN, GEN,AM- GEN, GEN, PHOS- DEMAND, RIDE, AT 105 VOLA- AMMONIA MONIA + NO2+NO3 NITRITE PHORUS PHOS- CHEM- DIS- DEG. C, TILE, DIS- ORGANIC DIS- DIS- DIS- PHORUS ICAL Data SOLVED SUS- SUS- SOLVED TOTAL SOLVED SOLVED SOLVED TOTAL (HIGH base Date (MG/L PENDED PENDED (MG/L (MG/L (MG/L (MG/L (MG/L (MG/L LEVEL) number AS CL) (MG/L) (MG/L) AS N) AS N) AS N) AS N) AS P) AS P) (MG/L) (00940) (00530) (00535) (00608) (00625) (00631) (00613) (00666) (00665) (00340) OCT 22... 26.1 <10 <10 <.04 .59 .12 .008 E.05 .10 20 01 NOV 19... 24.3 <10 <10 .05 .51 .07 E.004 E.04 .07 10 01 DEC 19... 55.6 10 <10 E.02 1.2 .18 E.006 E.05 .10 30 01 JAN 24... 61.0 <10 <10 .13 .97 .07 <.008 E.03 .07 30 01 FEB 13... 75.2 <10 <10 E.02 .80 E.11 <.008 <.06 .07 20 01 MAR 26... 109 <10 <10 .07 .98 .11 <.008 <.06 .07 30 01 MAR 28-29 59.4 36 -- .25 1.6 .89 .024 .18 .34 40 01 APR 02-02 56.1 62 -- .23 2.1 1.31 .030 .17 .41 50 01 APR 10-13 62.3 27 -- .08 1.4 1.14 .023 .10 .18 30 01 18... 64.0 17 <10 <.04 1.3 .48 .017 .07 .13 30 01 MAY 05-08 66.4 40 -- <.04 1.3 <.05 .071 .09 .18 30 01 MAY 08-11 57.6 37 -- <.04 1.2 .52 .016 .10 .19 40 01 JUN 11-12 49.0 <10 -- <.04 1.3 .14 .015 .22 .30 90 01 12... 51.2 <10 <10 <.04 1.2 .27 .018 .22 .31 40 01 JUN 21-24 36.0 50 -- .04 1.3 .59 .033 .24 .36 40 01 JUL 23... 30.1 54 <10 <.04 1.5 .22 .065 .25 .44 40 01 JUL 25-28 29.2 <10 -- .07 1.3 .17 .036 .19 .33 40 01 AUG 20... 27.8 <10 <10 .09 1.1 .79 <.008 .13 .20 40 01 20... <.30 <10 <10 <.04 <.10 <.05 <.008 <.06 <.06 <10 77 AUG 21-23 25.3 <10 -- .05 1.2 .15 .013 .15 .28 30 01

172 UPPER MISSISSIPPI RIVER MAIN STEM--Continued
05288500 MISSISSIPPI RIVER NEAR ANOKA, MN
LOCATION.--Lat 45°07’36", long 93°17’48", in SW1⁄4 sec. 12, T.119 N., R.21 W., Hennepin County, Hydrologic Unit 07010206, on right bank 0.4 mi downstream from Coon Creek, 1.3 mi downstream from Coon Rapids Dam at Coon Rapids, 6.5 mi downstream from Anoka, and at mile 864.8 upstream from Ohio River.
DRAINAGE AREA.--19,100 mi2, approximately.
PERIOD OF RECORD.--June 1931 to current year. Prior to October 1931 published as "at Coon Rapids, near Anoka."
GAGE.--Water-stage recorder. Datum of gage is 804.53 ft above sea level (NGVD of 1929). Prior to June 14, 1932, at site 1.2 mi upstream at different datum.
REMARKS.--Records good except those for estimated days, which are fair. Flow slightly regulated by six reservoirs on headwaters; total usable capacity, 1,640,600 acre-ft. Diurnal regulation caused by Coon Rapids Dam 1.3 mi. above station.
DISCHARGE, CUBIC FEET PER SECOND, WATER YEAR OCTOBER 2001 TO SEPTEMBER 2002 DAILY MEAN VALUES DAY OCT NOV DEC JAN FEB MAR APR MAY JUN JUL AUG SEP 1 4190 5970 6700 e5200 4660 e4820 10200 14400 8370 26500 14200 13500 2 4230 6110 6950 e5310 4780 e4720 e9810 14700 8340 26300 13700 14400 3 3890 5810 7350 e5500 4510 e4670 e9310 14000 8070 25300 13700 15000 4 3860 5590 7740 e5670 4550 e4600 e9060 13400 7780 24000 17700 14700 5 3780 5970 7280 e5850 e4630 e4510 e8810 13500 7190 22300 17900 14300 6 3830 5620 7950 e5960 4640 e4420 e9600 13200 7050 21100 18400 17000 7 3540 5810 8120 e6100 4420 4380 e10400 12700 6960 19700 19100 18600 8 3520 5740 8330 e6130 e4450 4210 11500 13400 7150 18500 18900 17500 9 4000 5520 7540 e6130 e4430 e4070 12300 15900 6600 18900 18500 16600 10 4240 4940 7330 e6190 4360 3930 13200 15800 6760 21400 17600 17000 11 4240 5360 7530 e6210 4320 4230 15300 16800 6620 27300 16600 17000 12 4470 5430 7870 e6170 e4330 4550 17200 17900 6500 29800 15600 16500 13 4740 5660 7980 6150 4320 4690 18900 18500 6330 30100 14600 15700 14 4750 6260 7120 e6210 e4310 4520 20600 18900 6130 28900 14200 15800 15 5350 5860 7370 6140 e4310 4200 22600 19500 5960 28600 13200 15000 16 5520 5430 7460 6070 e4330 4150 23800 19700 5810 27900 12700 14400 17 5730 5770 7460 e5680 e4310 4630 24700 19300 5440 26900 12600 13700 18 5760 5490 8270 e5490 e4480 4870 24400 18900 5170 26300 12300 12500 19 6190 5820 8480 e5330 e4550 4700 23900 17900 5040 24800 12500 12300 20 5870 5390 6810 e5460 e4640 4520 22900 17100 6070 23600 12500 11100 21 5910 5090 6050 5520 e4710 4200 21900 15900 7890 22000 14500 10500 22 5890 5580 5810 5470 e4760 4080 21200 14400 9570 20500 15000 9610 23 5740 5440 5750 5250 e4840 4210 19900 13800 9920 19200 14600 9450 24 6060 5700 4810 5120 e4910 4620 19400 12500 11700 17300 14400 8750 25 6580 6210 e4670 5120 4980 4570 18600 11700 15300 17100 14800 8660 26 6000 6330 e4650 4930 e4890 4540 17300 11200 16900 16000 15700 8970 27 5420 6920 e4700 4990 e4870 4520 16300 10700 20800 15200 15000 8510 28 5510 7010 e4780 5010 e4840 4810 16300 9940 23600 15700 14600 8290 29 6220 6730 e4890 e4950 --- 5850 15400 9110 25700 15400 14100 8440 30 6070 6470 e5040 e4910 --- 7050 14800 9100 26600 14800 14300 8230 31 6430 --- e5160 e4770 --- 9160 --- 8210 --- 14900 14100 ---
TOTAL 157530 175030 207950 172990 128130 147000 499590 452060 301320 686300 467600 392010 MEAN 5082 5834 6708 5580 4576 4742 16650 14580 10040 22140 15080 13070 MAX 6580 7010 8480 6210 4980 9160 24700 19700 26600 30100 19100 18600 MIN 3520 4940 4650 4770 4310 3930 8810 8210 5040 14800 12300 8230 AC-FT 312500 347200 412500 343100 254100 291600 990900 896700 597700 1361000 927500 777600 CFSM 0.27 0.31 0.35 0.29 0.24 0.25 0.87 0.76 0.53 1.16 0.79 0.68 IN. 0.31 0.34 0.41 0.34 0.25 0.29 0.97 0.88 0.59 1.34 0.91 0.76

173 UPPER MISSISSIPPI RIVER MAIN STEM--Continued
05288500 MISSISSIPPI RIVER NEAR ANOKA, MN--Continued
STATISTICS OF MONTHLY MEAN DATA FOR WATER YEARS 1931 - 2002, BY WATER YEAR (WY)
OCT NOV DEC JAN FEB MAR APR MAY JUN JUL AUG SEP
MEAN 6439 6379 4939 4309 4225 7354 17860 15120 11570 8965 6216 5920 MAX 21250 22800 10800 8304 9948 23410 43690 39760 29910 27240 22490 23570 (WY) 1987 1972 1972 1986 1966 1966 1997 1986 1943 1993 1972 1986 MIN 1128 1152 1006 935 1079 1602 3575 2796 1646 1022 715 888 (WY) 1937 1937 1935 1935 1933 1940 1959 1934 1934 1934 1934 1934
SUMMARY STATISTICS FOR 2001 CALENDAR YEAR FOR 2002 WATER YEAR WATER YEARS 1931 - 2002 ANNUAL TOTAL 4653510 3787510 ANNUAL MEAN 12750 10380 8306 HIGHEST ANNUAL MEAN 17750 1986 LOWEST ANNUAL MEAN 1603 1934 HIGHEST DAILY MEAN 65100 Apr 15 30100 Jul 13 90300 Apr 17 1965 LOWEST DAILY MEAN 3520 Oct 8 3520 Oct 8 602 Sep 10 1934 ANNUAL SEVEN-DAY MINIMUM 3770 Oct 3 3770 Oct 3 646 Aug 26 1934 MAXIMUM PEAK FLOW 30500 Jul 13 91000 Apr 17 1965 MAXIMUM PEAK STAGE 9.41 Jul 13 19.53 Apr 17 1965 INSTANTANEOUS LOW FLOW 3380a Oct 4 529a Aug 29 1976 ANNUAL RUNOFF (AC-FT) 9230000 7513000 6017000 ANNUAL RUNOFF (CFSM) 0.67 0.54 0.43 ANNUAL RUNOFF (INCHES) 9.06 7.38 5.91 10 PERCENT EXCEEDS 33800 19400 17900 50 PERCENT EXCEEDS 5820 7330 5800 90 PERCENT EXCEEDS 4570 4510 2190 a Due in part to regulation. e Estimated.
O N D2001
J F M A M J J A S2002
1000
2000
5000
10,00010,000
20,000
50,000
100,000
DAILY-MEAN DISCHARGE,
IN CUBIC FEET PER SECOND

174 UPPER MISSISSIPPI RIVER MAIN STEM--Continued
05288705 SHINGLE CREEK AT QUEEN AVE. IN MINNEAPOLIS, MN
LOCATION.-- Lat 45°03’00", long 93°18’36", in NE1⁄4NW1⁄4 sec. 11, T.118 N., R.21 W., Hennepin County, Hydrologic Unit 07010206,
at bridge over Shingle Creek at intersection of Queen Avenue North and 52nd Avenue North in Minneapolis.
DRAINAGE AREA.-- 28.2 mi2.
PERIOD OF RECORD.-- May 1996 to September 1999, May 2001 to current year.
GAGE.-- Water-stage recorder. Elevation of gage is 850 ft above sea level (from topographic map).
REMARKS.-- Records good except those for estimated daily discharges, which are fair.
DISCHARGE, CUBIC FEET PER SECOND, WATER YEAR OCTOBER 2001 TO SEPTEMBER 2002 DAILY MEAN VALUES DAY OCT NOV DEC JAN FEB MAR APR MAY JUN JUL AUG SEP 1 4.4 6.6 13 e2.1 1.9 e2.5 14 33 18 49 70 37 2 4.1 5.5 12 e2.1 1.8 e2.2 13 26 16 41 60 40 3 3.9 5.4 11 e2.1 1.8 e1.9 13 21 42 65 69 35 4 3.1 5.7 14 2.5 1.7 e2.0 11 19 46 52 89 32 5 2.6 6.6 22 2.6 1.8 e2.1 10 47 40 45 79 30 6 2.6 7.2 29 2.3 2.1 e2.2 10 89 33 54 73 80 7 3.5 7.4 25 2.0 2.6 e2.3 15 83 46 70 65 66 8 5.0 8.7 19 2.6 3.2 e2.7 17 128 39 60 56 60 9 4.6 7.0 14 3.7 3.3 e3.0 16 135 32 53 49 50 10 7.8 7.0 11 3.9 2.6 3.4 25 118 28 103 43 44 11 5.8 6.5 9.1 3.5 2.7 5.8 65 110 52 91 36 40 12 4.4 7.0 8.6 3.2 2.8 14 56 102 43 82 35 38 13 8.1 8.7 7.4 2.9 3.0 23 51 94 42 77 33 36 14 4.6 11 6.6 3.3 4.1 30 47 86 38 67 28 37 15 6.8 19 6.2 3.2 4.5 31 41 77 31 57 e25 34 16 5.0 8.3 6.3 3.0 4.2 7.6 36 66 27 48 e51 31 17 4.0 4.8 6.2 2.6 3.6 9.5 32 58 24 39 38 28 18 3.4 4.1 5.9 1.9 3.8 13 42 53 23 33 29 25 19 1.9 2.9 5.3 1.9 6.8 18 37 47 61 30 25 27 20 0.81 2.3 6.0 2.1 8.0 e21 32 43 54 35 23 21 21 0.70 2.5 5.1 2.1 6.5 e15 32 39 109 38 112 18 22 1.1 2.3 6.7 2.4 6.4 e10 33 37 104 33 97 15 23 2.1 2.8 e6.3 2.4 7.9 e7.8 32 34 103 27 90 14 24 2.1 39 e5.2 2.2 8.1 e6.4 32 31 127 33 83 13 25 3.3 40 e4.6 2.4 e5.2 e6.0 25 28 105 78 75 17 26 5.8 32 e4.1 2.7 e4.2 6.1 20 26 91 57 66 28 27 5.6 25 e3.5 2.4 e3.6 14 21 23 84 63 59 25 28 6.5 21 e3.1 2.0 e3.0 34 40 27 76 75 50 21 29 7.8 18 e2.8 1.7 --- 37 43 29 68 94 50 18 30 7.6 16 e2.5 1.7 --- 31 40 24 59 86 45 12 31 9.2 --- e2.3 1.7 --- 21 --- 21 --- 79 40 ---
TOTAL 138.21 340.3 283.8 77.2 111.2 385.5 901 1754 1661 1814 1743 972 MEAN 4.46 11.3 9.15 2.49 3.97 12.4 30.0 56.6 55.4 58.5 56.2 32.4 MAX 9.2 40 29 3.9 8.1 37 65 135 127 103 112 80 MIN 0.70 2.3 2.3 1.7 1.7 1.9 10 19 16 27 23 12 AC-FT 274 675 563 153 221 765 1790 3480 3290 3600 3460 1930 CFSM 0.16 0.40 0.32 0.09 0.14 0.44 1.07 2.01 1.96 2.08 1.99 1.15 IN. 0.18 0.45 0.37 0.10 0.15 0.51 1.19 2.31 2.19 2.39 2.30 1.28

175 UPPER MISSISSIPPI RIVER MAIN STEM--Continued
05288705 SHINGLE CREEK AT QUEEN AVE. IN MINNEAPOLIS, MN--Continued
STATISTICS OF MONTHLY MEAN DATA FOR WATER YEARS 1996 - 2002, BY WATER YEAR (WY)
OCT NOV DEC JAN FEB MAR APR MAY JUN JUL AUG SEP
MEAN 15.9 14.1 7.05 4.27 6.10 16.0 29.9 37.6 30.0 29.1 24.2 13.0 MAX 185 28.2 9.21 7.25 11.3 24.3 32.1 56.6 55.4 58.5 56.2 32.4 (WY) 2000 1997 1997 1997 1999 1997 1998 2002 2002 2002 2002 2002 MIN 4.46 5.22 3.49 2.49 3.97 12.4 27.1 13.3 7.47 7.92 5.04 2.92 (WY) 2002 1998 2000 2002 2002 2002 1999 1997 1997 1996 1996 1996
SUMMARY STATISTICS FOR 2002 WATER YEAR WATER YEARS 1996 - 2002 ANNUAL TOTAL 10181.21 ANNUAL MEAN 27.9 20.8 HIGHEST ANNUAL MEAN 79.0 2000 LOWEST ANNUAL MEAN 12.1 1998 HIGHEST DAILY MEAN 135 May 9 185 Oct 1 1999 LOWEST DAILY MEAN 0.70 Oct 21 0.13a Oct 13 1996 ANNUAL SEVEN-DAY MINIMUM 1.7 Oct 19 0.14 Oct 8 1996 MAXIMUM PEAK FLOW 222 May 8 225 Jul 1 1997 MAXIMUM PEAK STAGE 12.58 May 8 13.07 Jul 1 1997 INSTANTANEOUS LOW FLOW 0.56 Oct 21 0.11a Oct 11 1996 ANNUAL RUNOFF (AC-FT) 20190 15070 ANNUAL RUNOFF (CFSM) 0.99 0.74 ANNUAL RUNOFF (INCHES) 13.43 10.02 10 PERCENT EXCEEDS 71 54 50 PERCENT EXCEEDS 19 11 90 PERCENT EXCEEDS 2.4 3.0 a Minimum observed. e Estimated.
O N D2001
J F M A M J J A S2002
0.1
0.2
0.5
11
2
5
1010
20
50
100100
200
500
1000
DAILY-MEAN DISCHARGE,
IN CUBIC FEET PER SECOND

176 UPPER MISSISSIPPI RIVER MAIN STEM--Continued
05288705 SHINGLE CREEK AT QUEEN AVE. IN MINNEAPOLIS, MN--Continued (National Water-Quality Assessment Program)
WATER-QUALITY RECORDS
PERIOD OF RECORD.--Water years 1996 to current year.
PERIOD OF DAILY RECORD:
WATER TEMPERATURES.-- May 1996 to September 30, 1998.
SPECIFIC CONDUCTANCE.-- May 1996 to September 30, 1998.
REVISED RECORDS.--WDR MN-96-1: Specific conductance.
WATER-QUALITY DATA, WATER YEAR OCTOBER 2001 TO SEPTEMBER 2002 DIS- BARO- OXYGEN, PH PH SPE- CHARGE, METRIC DIS- WATER WATER CIFIC SPE- INST. PRES- SOLVED WHOLE WHOLE CON- CIFIC CUBIC SURE OXYGEN, (PER- FIELD LAB DUCT- CON- TEMPER- Sample Medium GAGE FEET (MM DIS- CENT (STAND- (STAND- ANCE DUCT- ATURE Date Time type code HEIGHT PER OF SOLVED SATUR- ARD ARD LAB ANCE AIR (FEET) SECOND HG) (MG/L) ATION) UNITS) UNITS) (US/CM) (US/CM) (DEG C) (00065) (00061) (00025) (00300) (00301) (00400) (00403) (90095) (00095) (00020) OCT 17... 1130 ENVIRONMENTAL 9.46 4.2 747 7.3 63 7.6 -- -- 1030 9.0NOV 27... 1045 ENVIRONMENTAL 9.88 25 740 14.4 100 7.7 -- -- 601 -1.1DEC 19... 1000 ENVIRONMENTAL 9.34 4.9 740 11.7 81 7.7 -- -- 1100 .0 19... 1002 BLANK -- -- -- -- -- -- -- 5 -- --JAN 23... 1000 ENVIRONMENTAL 9.23 2.4 743 2.4 19 7.6 -- -- 1880 3.3FEB 14... 0855 ENVIRONMENTAL 9.28 3.5 734 11.2 83 8.0 -- -- 1620 4.0MAR 08... 1540 ENVIRONMENTAL 9.29 3.7 -- -- -- -- -- -- 2310 -- 11... 1610 ENVIRONMENTAL 9.57 13 -- -- -- -- -- -- 5520 -- 11... 2045 ENVIRONMENTAL 9.44 8.2 -- -- -- 7.3 7.2 6470 6620 -- 12... 1640 ENVIRONMENTAL 9.83 26 -- -- -- 6.9 7.2 4620 4590 --APR 16... 0930 ENVIRONMENTAL 10.04 36 731 8.2 100 7.8 -- -- 759 19.0 16... 0935 REPLICATE -- -- -- -- -- -- -- -- -- --MAY 08... 1145 ENVIRONMENTAL 11.07 107 738 8.0 71 7.5 -- -- 401 9.0JUN 13... 0930 ENVIRONMENTAL 10.17 43 740 4.2 46 7.3 -- -- 641 19.0JUL 22... 1030 ENVIRONMENTAL 10.16 33 741 3.6 42 7.1 -- -- 766 24.0 22... 1035 REPLICATE -- -- -- -- -- -- -- -- -- --AUG 15... 0915 ENVIRONMENTAL 9.81 26 731 4.6 54 7.4 -- -- 919 -- 15... 0916 SPIKE -- -- -- -- -- -- -- -- -- --SEP 11... 1115 ENVIRONMENTAL 10.16 41 746 4.7 53 7.3 -- -- 568 20.5

177 UPPER MISSISSIPPI RIVER MAIN STEM--Continued
05288705 SHINGLE CREEK AT QUEEN AVE. IN MINNEAPOLIS, MN--Continued (National Water-Quality Assessment Program)
WATER-QUALITY DATA, WATER YEAR OCTOBER 2001 TO SEPTEMBER 2002 ALKA- BICAR- CAR- SOLIDS, MAGNE- POTAS- LINITY BONATE BONATE CHLO- FLUO- SILICA, RESIDUE CALCIUM SIUM, SIUM, SODIUM, WAT DIS WATER WATER RIDE, RIDE, DIS- SULFATE AT 180 TEMPER- DIS- DIS- DIS- DIS- TOT IT DIS IT DIS IT DIS- DIS- SOLVED DIS- DEG. C ATURE SOLVED SOLVED SOLVED SOLVED FIELD FIELD FIELD SOLVED SOLVED (MG/L SOLVED DIS- Date WATER (MG/L (MG/L (MG/L (MG/L MG/L AS MG/L AS MG/L AS (MG/L (MG/L AS (MG/L SOLVED (DEG C) AS CA) AS MG) AS K) AS NA) CACO3 HCO3 CO3 AS CL) AS F) SIO2) AS SO4) (MG/L) (00010) (00915) (00925) (00935) (00930) (39086) (00453) (00452) (00940) (00950) (00955) (00945) (70300) OCT 17... 8.4 -- -- -- -- 228 278 0 145 -- -- 82.2 --NOV 27... .5 -- -- -- -- 104 127 0 103 -- -- 30.8 --DEC 19... .8 -- -- -- -- 231 282 0 169 -- -- 80.2 -- 19... -- -- -- -- -- -- -- -- 2.18 -- -- <.1 --JAN 23... 1.2 -- -- -- -- 294 359 0 351 -- -- 122 --FEB 14... 1.2 -- -- -- -- 265 323 0 298 -- -- 111 --MAR 08... -- -- -- -- 287 -- -- -- 515 -- -- -- -- 11... -- -- -- -- 1080 -- -- -- 1690 -- -- -- -- 11... .5 91.1 22.7 8.83 1210 177 213 0 2020 .2 10.8 70.8 3540 12... 4.0 60.9 15.1 14.8 821 118 141 0 1390 .2 7.91 53.8 2530APR 16... 16.7 -- -- -- -- 129 158 0 131 -- -- 28.8 -- 16... -- -- -- -- -- -- -- -- 130 -- -- 28.7 --MAY 08... 8.7 -- -- -- -- 79 96 0 62.4 -- -- 15.8 --JUN 13... 19.0 -- -- -- -- 147 179 0 82.0 -- -- 27.0 --JUL 22... 23.0 -- -- -- -- 168 205 0 103 -- -- 42.5 -- 22... -- -- -- -- -- -- -- -- -- -- -- -- --AUG 15... 21.4 -- -- -- -- 194 237 -- -- -- -- -- -- 15... -- -- -- -- -- -- -- -- -- -- -- -- --SEP 11... 19.5 -- -- -- -- 86 105 0 73.7 -- -- 26.3 --
NITRO- NITRO- NITRO- NITRO- ORTHO- 2,6-DI- GEN, GEN,AM- GEN, GEN, PHOS- MANGA- ETHYL ACETO- ALA- ATRA- AMMONIA MONIA + NO2+NO3 NITRITE PHATE, PHOS- IRON, NESE, ANILINE CHLOR, CHLOR, ALPHA ZINE, DIS- ORGANIC DIS- DIS- DIS- PHORUS DIS- DIS- WAT FLT WATER WATER, BHC WATER, SOLVED TOTAL SOLVED SOLVED SOLVED TOTAL SOLVED SOLVED 0.7 U FLTRD DISS, DIS- DISS, Date (MG/L (MG/L (MG/L (MG/L (MG/L (MG/L (UG/L (UG/L GF, REC REC REC, SOLVED REC AS N) AS N) AS N) AS N) AS P) AS P) AS FE) AS MN) (UG/L) (UG/L) (UG/L) (UG/L) (UG/L) (00608) (00625) (00631) (00613) (00671) (00665) (01046) (01056) (82660) (49260) (46342) (34253) (39632) OCT 17... .38 1.2 .18 .017 <.02 .098 -- -- <.002 <.004 <.002 <.005 <.007NOV 27... .12 .75 .41 .014 <.02 .085 -- -- -- -- -- -- --DEC 19... .17 .77 .51 .021 E.02 .055 -- -- <.002 <.004 <.002 <.005 .011 19... <.04 <.10 <.05 <.008 <.02 <.004 -- -- -- -- -- -- --JAN 23... .50 .97 1.00 .027 E.01 .036 -- -- -- -- -- -- --FEB 14... .34 .94 .89 .018 <.02 .045 -- -- <.006 <.006 <.004 <.005 <.007MAR 08... -- -- -- -- -- -- -- -- -- -- -- -- -- 11... -- -- -- -- -- -- -- -- -- -- -- -- -- 11... -- -- -- -- -- -- <50 109 -- -- -- -- -- 12... -- -- -- -- -- -- <30 5.7 -- -- -- -- --APR 16... <.04 1.2 .37 .023 <.02 .118 -- -- <.006 .051 <.004 <.005 .085 16... <.04 1.1 .34 .022 <.02 .109 -- -- -- -- -- -- --MAY 08... .23 1.2 .71 .034 <.02 .131 -- -- <.006 .178 <.007 <.005 .412JUN 13... .21 1.0 .34 .036 .02 .131 -- -- <.006 .023 <.004 <.005 .830JUL 22... .12 .71 .38 .083 E.01 .064 -- -- <.006 <.006 <.004 <.005 .041 22... -- -- -- -- -- -- -- -- <.006 <.006 <.004 <.005 .039AUG 15... <.04 .64 .42 .033 <.02 .055 -- -- <.006 <.006 <.004 <.005 .043 15... -- -- -- -- -- -- -- -- .097 .113 .121 .140 .168SEP 11... <.04 .83 .24 .019 .04 .086 -- -- <.006 <.006 <.004 <.005 .033

178 UPPER MISSISSIPPI RIVER MAIN STEM--Continued
05288705 SHINGLE CREEK AT QUEEN AVE. IN MINNEAPOLIS, MN--Continued (National Water-Quality Assessment Program)
WATER-QUALITY DATA, WATER YEAR OCTOBER 2001 TO SEPTEMBER 2002 BEN- CAR- CARBO- DEETHYL DISUL- ETHAL- FLUR- BUTYL- BARYL FURAN CYANA- DCPA ATRA- FOTON EPTC FLUR- ALIN ATE, WATER WATER CHLOR- ZINE, WATER ZINE, DI- DI- WATER WATER ALIN WAT FLD WATER, FLTRD FLTRD PYRIFOS WATER, FLTRD WATER, AZINON, ELDRIN FLTRD FLTRD WAT FLT 0.7 U DISS, 0.7 U 0.7 U DIS- DISS, 0.7 U DISS, DIS- DIS- 0.7 U 0.7 U 0.7 U Date GF, REC REC GF, REC GF, REC SOLVED REC GF, REC REC SOLVED SOLVED GF, REC GF, REC GF, REC (UG/L) (UG/L) (UG/L) (UG/L) (UG/L) (UG/L) (UG/L) (UG/L) (UG/L) (UG/L) (UG/L) (UG/L) (UG/L) (82673) (04028) (82680) (82674) (38933) (04041) (82682) (04040) (39572) (39381) (82677) (82668) (82663) OCT 17... <.010 <.002 <.041 <.030 <.005 <.018 <.003 <.006 .030 <.005 <.02 <.002 <.009NOV 27... -- -- -- -- -- -- -- -- -- -- -- -- --DEC 19... <.010 <.002 <.041 <.020 <.005 <.018 <.003 E.005 <.005 <.005 <.02 <.002 <.009 19... -- -- -- -- -- -- -- -- -- -- -- -- --JAN 23... -- -- -- -- -- -- -- -- -- -- -- -- --FEB 14... <.010 <.002 <.041 <.020 <.005 <.018 <.003 <.006 <.005 <.005 <.02 <.002 <.009MAR 08... -- -- -- -- -- -- -- -- -- -- -- -- -- 11... -- -- -- -- -- -- -- -- -- -- -- -- -- 11... -- -- -- -- -- -- -- -- -- -- -- -- -- 12... -- -- -- -- -- -- -- -- -- -- -- -- --APR 16... <.010 <.002 <.041 <.020 <.005 <.018 <.003 E.005 <.005 <.005 <.02 <.002 <.009 16... -- -- -- -- -- -- -- -- -- -- -- -- --MAY 08... E.004 <.002 E.018 <.020 <.005 <.018 E.002 E.030 .056 <.005 <.02 .049 <.009JUN 13... <.010 <.002 E.011 <.020 <.005 <.018 <.003 E.103 .072 <.005 <.02 <.002 <.009JUL 22... <.010 <.002 <.041 <.020 <.005 <.018 <.003 <.010 .025 <.005 <.02 <.002 <.009 22... <.010 <.002 <.041 <.020 <.005 <.018 <.003 <.013 .022 <.005 <.02 <.002 <.009AUG 15... <.010 <.002 <.041 <.020 <.005 <.018 <.003 E.013 .007 <.005 <.02 <.002 <.009 15... .092 .097 E.124 E.157 .101 .156 .117 E.071 .104 .096 E.10 .105 .123SEP 11... <.010 <.002 <.041 <.020 <.005 <.018 <.003 E.014 .013 <.005 <.02 <.002 <.009
ETHO- LIN- METHYL METHYL MOL- NAPROP- PROP URON AZIN- PARA- METRI- INATE AMIDE WATER FONOFOS WATER MALA- PHOS THION METO- BUZIN WATER WATER PARA- FLTRD WATER LINDANE FLTRD THION, WAT FLT WAT FLT LACHLOR SENCOR FLTRD FLTRD P,P’ THION, 0.7 U DISS DIS- 0.7 U DIS- 0.7 U 0.7 U WATER WATER 0.7 U 0.7 U DDE DIS- Date GF, REC REC SOLVED GF, REC SOLVED GF, REC GF, REC DISSOLV DISSOLV GF, REC GF, REC DISSOLV SOLVED (UG/L) (UG/L) (UG/L) (UG/L) (UG/L) (UG/L) (UG/L) (UG/L) (UG/L) (UG/L) (UG/L) (UG/L) (UG/L) (82672) (04095) (39341) (82666) (39532) (82686) (82667) (39415) (82630) (82671) (82684) (34653) (39542) OCT 17... <.005 <.003 <.004 <.035 <.027 <.050 <.006 <.013 <.006 <.002 <.007 <.003 <.007NOV 27... -- -- -- -- -- -- -- -- -- -- -- -- --DEC 19... <.005 <.003 <.004 <.035 <.027 <.050 <.006 E.005 <.006 <.002 <.007 <.003 <.007 19... -- -- -- -- -- -- -- -- -- -- -- -- --JAN 23... -- -- -- -- -- -- -- -- -- -- -- -- --FEB 14... <.005 <.003 <.004 <.035 <.027 <.050 <.006 <.013 <.006 <.002 <.007 <.003 <.010MAR 08... -- -- -- -- -- -- -- -- -- -- -- -- -- 11... -- -- -- -- -- -- -- -- -- -- -- -- -- 11... -- -- -- -- -- -- -- -- -- -- -- -- -- 12... -- -- -- -- -- -- -- -- -- -- -- -- --APR 16... <.005 <.003 <.004 <.035 <.027 <.050 <.006 .029 <.006 <.002 <.007 <.003 <.010 16... -- -- -- -- -- -- -- -- -- -- -- -- --MAY 08... <.005 <.003 <.004 <.035 <.027 <.050 <.006 .048 <.006 <.002 <.007 <.003 <.010JUN 13... <.005 <.003 <.004 <.035 <.027 <.050 <.006 E.012 <.006 <.002 <.007 <.003 <.010JUL 22... <.005 <.003 <.004 <.035 <.027 <.050 <.006 <.013 <.006 <.002 <.007 <.003 <.010 22... <.005 <.003 <.004 <.035 <.027 <.050 <.006 <.013 <.006 <.002 <.007 <.003 <.010AUG 15... <.005 <.003 <.004 <.035 <.027 <.050 <.006 <.013 <.006 <.002 <.007 <.003 <.010 15... .106 .090 .103 .145 .123 E.159 .141 .118 .118 .107 .090 .057 .136SEP 11... <.005 <.003 <.004 <.035 <.040 <.050 <.006 <.013 <.006 <.002 <.007 <.003 <.010

179 UPPER MISSISSIPPI RIVER MAIN STEM--Continued
05288705 SHINGLE CREEK AT QUEEN AVE. IN MINNEAPOLIS, MN--Continued (National Water-Quality Assessment Program)
WATER-QUALITY DATA, WATER YEAR OCTOBER 2001 TO SEPTEMBER 2002 PEB- PENDI- PER- PRON- PRO- PRO- TEBU- TER- TER- ULATE METH- METHRIN PHORATE PRO- AMIDE PROPA- PANIL PARGITE SI- THIURON BACIL BUFOS WATER ALIN CIS WATER METON, WATER CHLOR, WATER WATER MAZINE, WATER WATER WATER FILTRD WAT FLT WAT FLT FLTRD WATER, FLTRD WATER, FLTRD FLTRD WATER, FLTRD FLTRD FLTRD 0.7 U 0.7 U 0.7 U 0.7 U DISS, 0.7 U DISS, 0.7 U 0.7 U DISS, 0.7 U 0.7 U 0.7 U Date GF, REC GF, REC GF, REC GF, REC REC GF, REC REC GF, REC GF, REC REC GF, REC GF, REC GF, REC (UG/L) (UG/L) (UG/L) (UG/L) (UG/L) (UG/L) (UG/L) (UG/L) (UG/L) (UG/L) (UG/L) (UG/L) (UG/L) (82669) (82683) (82687) (82664) (04037) (82676) (04024) (82679) (82685) (04035) (82670) (82665) (82675) OCT 17... <.002 <.010 <.006 <.011 .02 <.004 <.010 <.011 <.03 <.011 .02 <.034 <.02NOV 27... -- -- -- -- -- -- -- -- -- -- -- -- --DEC 19... <.002 <.010 <.006 <.011 <.01 <.004 <.010 <.011 <.02 <.011 <.02 <.034 <.02 19... -- -- -- -- -- -- -- -- -- -- -- -- --JAN 23... -- -- -- -- -- -- -- -- -- -- -- -- --FEB 14... <.004 <.022 <.006 <.011 <.03 <.004 <.010 <.011 <.02 <.005 <.02 <.034 <.02MAR 08... -- -- -- -- -- -- -- -- -- -- -- -- -- 11... -- -- -- -- -- -- -- -- -- -- -- -- -- 11... -- -- -- -- -- -- -- -- -- -- -- -- -- 12... -- -- -- -- -- -- -- -- -- -- -- -- --APR 16... <.004 <.022 <.006 <.011 E.01 <.004 <.010 <.011 <.02 <.005 <.02 <.034 <.02 16... -- -- -- -- -- -- -- -- -- -- -- -- --MAY 08... <.004 E.020 <.006 <.011 .02 <.004 <.010 <.011 <.02 <.007 <.02 <.034 <.02JUN 13... <.004 <.022 <.006 <.011 .22 <.004 <.010 <.011 <.02 <.005 <.02 <.034 <.02JUL 22... <.004 <.022 <.006 <.011 .04 <.004 <.010 <.011 <.02 <.005 <.02 <.034 <.02 22... <.004 <.022 <.006 <.011 .04 <.004 <.010 <.011 <.02 <.005 <.02 <.034 <.02AUG 15... <.004 <.022 <.006 <.011 .04 <.011 <.010 <.011 <.02 <.005 E.01 <.034 <.02 15... .117 .154 .053 E.104 .18 .123 .134 .118 .12 .087 .19 E.136 E.10SEP 11... <.004 <.022 <.006 <.011 .06 <.020 <.010 <.011 <.02 <.005 <.02 <.034 <.02
THIO- TRIAL- TRI- SED. BENCARB LATE FLUR- SUSP. WATER WATER ALIN SIEVE SEDI- FLTRD FLTRD WAT FLT DIAM. MENT, Data 0.7 U 0.7 U 0.7 U % FINER SUS- base Date GF, REC GF, REC GF, REC THAN PENDED number (UG/L) (UG/L) (UG/L) .062 MM (MG/L) (82681) (82678) (82661) (70331) (80154) OCT 17... <.005 <.002 <.009 -- -- 01 NOV 27... -- -- -- 9 9.4 01 DEC 19... <.005 <.002 <.009 -- 87 01 19... -- -- -- -- .8 77 JAN 23... -- -- -- -- 202 01 FEB 14... <.005 <.002 <.009 -- 166 01 MAR 08... -- -- -- -- -- 01 11... -- -- -- -- -- 01 11... -- -- -- -- -- 01 12... -- -- -- -- -- 01 APR 16... <.005 <.002 <.009 -- 16 01 16... -- -- -- -- 17 77 MAY 08... <.005 <.002 E.004 -- 39 01 JUN 13... <.005 <.002 <.009 -- 14 01 JUL 22... <.005 <.002 <.009 -- 4.8 01 22... <.005 <.002 <.009 -- -- 77 AUG 15... <.005 <.002 <.009 -- 21 01 15... .117 .121 .095 -- -- 77 SEP 11... <.005 <.002 <.009 -- 12 01

180 MINNESOTA RIVER BASIN--Continued
05290000 LITTLE MINNESOTA RIVER NEAR PEEVER, SD
LOCATION.--Lat 45°36’05", long 96°52’18", in SW1⁄4SW1⁄4 sec. 13, T.125 N., R.50 W., Roberts County, Hydrologic Unit 07020001, on
Sisseton Indian Reservation, on right bank 2 mi northwest of town of Browns Valley, MN, 5.3 mi northeast of Peever, 7.2 mi downstream from Jorgenson River, and 8 mi upstream from Big Stone Lake.
DRAINAGE AREA.--438 mi2.
PERIOD OF RECORD.--October 1939 to September 1981, October 1989 to September, 2002 (discontinued).
REVISED RECORDS.--WSP 1308: 1943(M).
GAGE.--Water-stage recorder. Datum of gage is 1,002.20 ft above sea level (NGVD of 1929). Oct. 1, 1939 to Mar. 20, 1940, nonrecording gage at site 4.5 mi downstream at different datum. Mar. 21 to Apr. 12, 1940, nonrecording gage at site 100 ft downstream at present datum. April 13 to Aug. 27, 1940, nonrecording gage at present site and datum.
REMARKS.--Records fair except those for estimated daily discharges, which are fair to poor. Breakout flow into Lake Traverse (Red River of the North Basin) may occur 3.5 miles downstream when the stage exceeds approximately 8.0 ft.
DISCHARGE, in CFS, WATER YEAR OCTOBER 2001 TO SEPTEMBER 2002 DAILY MEAN VALUES DAY OCT NOV DEC JAN FEB MAR APR MAY JUN JUL AUG SEP 1 3.6 8.3 13 e12 e9.6 e22 138 100 41 16 4.4 3.6 2 3.4 8.3 12 e12 e9.5 e23 125 91 35 14 3.7 3.6 3 3.4 8.3 12 e11 e9.5 e24 92 81 30 13 4.2 3.5 4 3.1 7.9 14 e12 e9.5 e23 82 71 28 11 7.0 3.3 5 3.1 7.9 15 e13 e9.5 e21 75 62 25 10 14 3.1 6 3.1 7.9 15 e14 e9.6 e20 72 57 24 9.6 12 2.9 7 3.3 7.9 16 e15 e9.7 e18 74 54 23 8.9 9.7 2.5 8 3.8 7.9 16 e14 e9.8 e16 120 63 20 8.7 7.8 2.1 9 4.2 7.9 15 e14 e10 e15 116 256 20 8.5 6.2 1.8 10 8.4 7.9 15 e13 e10 e12 105 318 19 10 6.7 1.7 11 12 7.9 15 e13 e10 e14 121 244 18 11 6.0 1.7 12 15 7.9 15 e13 e11 e19 132 246 17 11 7.0 1.6 13 13 8.2 15 e13 e11 e18 120 269 15 9.5 6.7 1.4 14 11 8.9 14 e12 e11 e18 113 231 15 8.3 7.6 1.4 15 9.1 9.2 14 e12 e12 e19 106 200 14 7.4 8.1 1.3 16 8.4 8.9 14 e11 e13 e19 98 173 13 6.2 6.7 1.2 17 7.9 9.4 14 e10 e13 e25 91 145 12 5.1 5.6 1.2 18 7.3 9.6 15 e10 e14 e24 83 125 11 5.6 4.5 1.1 19 7.0 9.6 13 e10 e16 e23 75 109 12 5.9 3.9 1.1 20 6.6 9.2 15 e10 e27 e23 69 94 11 7.4 3.6 1.1 21 6.4 9.2 14 e10 40 e22 64 82 16 7.4 3.9 0.99 22 6.3 9.5 14 e10 46 e22 64 74 58 7.1 4.1 0.95 23 6.4 9.6 14 e10 44 e22 65 69 71 11 5.2 0.90 24 6.6 11 18 e10 36 e22 62 63 50 9.0 5.7 0.89 25 7.0 13 21 e11 e29 e22 59 61 42 8.1 5.2 0.90 26 7.0 15 25 e11 e28 e22 54 60 42 6.8 4.6 0.95 27 7.4 15 22 e10 e24 e23 52 58 33 6.2 4.3 0.94 28 7.4 16 e16 e10 e24 e31 63 56 26 5.9 3.8 1.2 29 7.4 15 e15 e9.8 --- e50 96 53 22 6.1 3.5 2.0 30 7.4 14 e14 e9.7 --- e158 104 51 19 5.7 3.1 2.0 31 7.9 --- e13 e9.6 --- e159 --- 46 --- 5.0 3.5 ---
TOTAL 213.9 296.3 473 355.1 505.7 949 2690 3662 782 265.4 182.3 52.92 MEAN 6.900 9.877 15.26 11.45 18.06 30.61 89.67 118.1 26.07 8.561 5.881 1.764 MAX 15 16 25 15 46 159 138 318 71 16 14 3.6 MIN 3.1 7.9 12 9.6 9.5 12 52 46 11 5.0 3.1 0.89 AC-FT 424 588 938 704 1000 1880 5340 7260 1550 526 362 105 CFSM 0.02 0.02 0.03 0.03 0.04 0.07 0.20 0.27 0.06 0.02 0.01 0.00 IN. 0.02 0.03 0.04 0.03 0.04 0.08 0.23 0.31 0.07 0.02 0.02 0.00
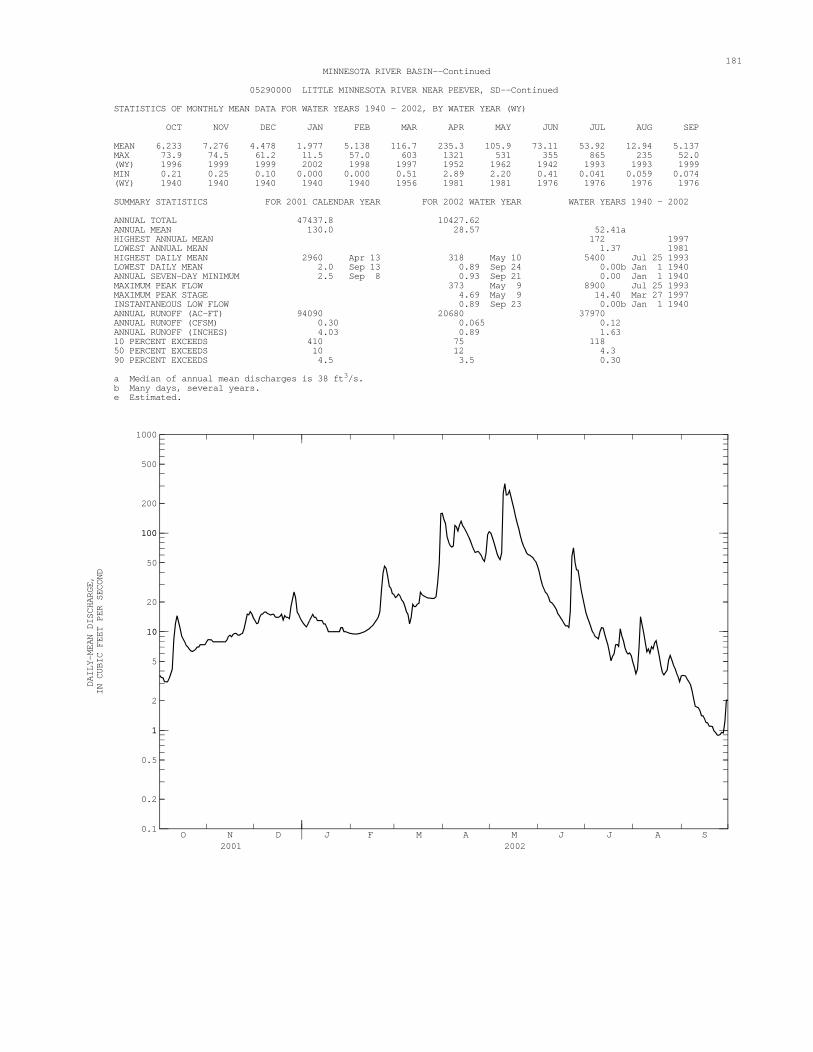
181 MINNESOTA RIVER BASIN--Continued
05290000 LITTLE MINNESOTA RIVER NEAR PEEVER, SD--Continued
STATISTICS OF MONTHLY MEAN DATA FOR WATER YEARS 1940 - 2002, BY WATER YEAR (WY)
OCT NOV DEC JAN FEB MAR APR MAY JUN JUL AUG SEP
MEAN 6.233 7.276 4.478 1.977 5.138 116.7 235.3 105.9 73.11 53.92 12.94 5.137 MAX 73.9 74.5 61.2 11.5 57.0 603 1321 531 355 865 235 52.0 (WY) 1996 1999 1999 2002 1998 1997 1952 1962 1942 1993 1993 1999 MIN 0.21 0.25 0.10 0.000 0.000 0.51 2.89 2.20 0.41 0.041 0.059 0.074 (WY) 1940 1940 1940 1940 1940 1956 1981 1981 1976 1976 1976 1976
SUMMARY STATISTICS FOR 2001 CALENDAR YEAR FOR 2002 WATER YEAR WATER YEARS 1940 - 2002 ANNUAL TOTAL 47437.8 10427.62 ANNUAL MEAN 130.0 28.57 52.41a HIGHEST ANNUAL MEAN 172 1997 LOWEST ANNUAL MEAN 1.37 1981 HIGHEST DAILY MEAN 2960 Apr 13 318 May 10 5400 Jul 25 1993 LOWEST DAILY MEAN 2.0 Sep 13 0.89 Sep 24 0.00b Jan 1 1940 ANNUAL SEVEN-DAY MINIMUM 2.5 Sep 8 0.93 Sep 21 0.00 Jan 1 1940 MAXIMUM PEAK FLOW 373 May 9 8900 Jul 25 1993 MAXIMUM PEAK STAGE 4.69 May 9 14.40 Mar 27 1997 INSTANTANEOUS LOW FLOW 0.89 Sep 23 0.00b Jan 1 1940 ANNUAL RUNOFF (AC-FT) 94090 20680 37970 ANNUAL RUNOFF (CFSM) 0.30 0.065 0.12 ANNUAL RUNOFF (INCHES) 4.03 0.89 1.63 10 PERCENT EXCEEDS 410 75 118 50 PERCENT EXCEEDS 10 12 4.3 90 PERCENT EXCEEDS 4.5 3.5 0.30 a Median of annual mean discharges is 38 ft3/s. b Many days, several years. e Estimated.
O N D2001
J F M A M J J A S2002
0.1
0.2
0.5
11
2
5
1010
20
50
100100
200
500
1000
DAILY-MEAN DISCHARGE,
IN CUBIC FEET PER SECOND

182 MINNESOTA RIVER BASIN--Continued
05291000 WHETSTONE RIVER NEAR BIG STONE CITY, SD
LOCATION.--Lat 45°17’30", long 96°29’14", in SE1⁄4NW1⁄4 sec. 18, T.121 N., R.46 W., Grant County, Hydrologic Unit 07020001, on
right bank 20 ft downstream from former highway bridge site, 1.5 mi west of Big Stone City, S.D., and 4.5 mi upstream from Big Stone Lake.
DRAINAGE AREA.--398 mi2.
PERIOD OF RECORD.--March 1910 to November 1912 (no winter records), and March 1931 to current year. Monthly discharge only for some periods, published in WSP 1308.
REVISED RECORDS.--WSP 895: Drainage area. WSP 1308: 1932(M), 1935(M).
GAGE.--Water-stage recorder. Datum of gage is 996.96 ft in sea level (NGVD of 1912). Mar. 8, 1910 to Nov. 30, 1912, nonrecording gage 2 mi downstream at different datum. Mar. 18, 1931 to May 3, 1939, nonrecording gage, at site 20 ft upstream at present datum. May 4, 1939 to Nov. 8, 1952, water-stage recorder at site 80 ft downstream at present datum.
REMARKS.--Records good except those for estimated daily discharges, which are fair to poor.
EXTREMES OUTSIDE PERIOD OF RECORD.--Maximum stage known, about 26 ft in June 1919, present site and datum, from information by local resident, discharge 29,000 ft3/s, from dam break.
EXTREMES FOR CURRENT YEAR.--Peak discharges greater than base discharge of 230 ft3/s and maximum (*):
Discharge Gage height Discharge Gage height Date Time (ft3/s) (ft) Date Time (ft3/s) (ft)
Mar 30 0200 *1,690 *7.89 May 13 2300 278 3.38 Apr 8 1900 233 3.12 Jun 23 0000 550 4.80 May 10 1500 243 3.17
Minimum discharge, 4.0 ft3/s, Sept. 25, gage height, 0.79 ft.
DISCHARGE, in CFS, WATER YEAR OCTOBER 2001 TO SEPTEMBER 2002 DAILY MEAN VALUES DAY OCT NOV DEC JAN FEB MAR APR MAY JUN JUL AUG SEP 1 9.8 15 22 e22 e20 e42 320 108 34 23 9.3 8.1 2 9.6 15 24 e22 e20 e38 220 86 32 20 8.3 7.8 3 9.5 15 26 e22 e20 e35 130 72 30 20 14 7.3 4 9.3 15 26 e21 e20 e33 97 63 29 18 16 6.9 5 9.8 15 26 e21 e20 e32 89 57 29 17 14 6.9 6 10 15 28 e21 e21 e31 88 54 30 16 13 7.4 7 9.5 15 30 e21 e21 e30 108 53 29 15 12 7.0 8 10 16 27 e22 e22 e29 197 64 30 14 11 6.0 9 11 17 27 e23 e22 e28 195 133 32 13 10 6.0 10 13 16 25 e23 e23 e27 148 225 29 13 10 6.4 11 13 17 26 e23 e24 e27 133 185 26 13 10 6.3 12 15 16 26 e23 e25 e27 134 164 24 13 15 6.3 13 17 15 24 e22 e27 e26 119 220 23 13 18 6.2 14 16 17 24 e22 e29 e26 108 247 22 12 22 6.1 15 15 18 23 e21 e31 e26 98 169 20 11 22 5.9 16 14 17 24 e21 e33 e27 90 121 19 11 18 5.2 17 13 17 24 e21 e37 e27 79 94 18 9.4 15 4.8 18 14 17 22 e20 e43 e27 70 81 17 10 12 4.9 19 13 17 e28 e20 e64 e27 62 71 17 9.7 10 4.9 20 13 16 24 e20 e89 e27 55 66 16 10 9.8 4.9 21 12 17 e23 e20 e95 e26 55 62 74 12 15 4.6 22 12 16 e22 e20 e97 e26 56 60 442 15 18 4.4 23 12 17 e22 e20 e90 e26 56 59 427 16 14 4.4 24 13 22 e23 e21 e83 e26 56 55 204 15 13 4.3 25 13 31 e23 e21 e74 e26 54 54 101 15 11 4.8 26 18 29 e23 e20 e65 e25 51 53 67 14 11 5.3 27 17 e36 e23 e20 e53 e32 52 51 52 13 11 6.5 28 15 33 e22 e20 e47 e79 66 51 40 12 9.6 5.5 29 15 26 e22 e20 --- e362 82 49 33 12 8.8 6.2 30 15 23 e22 e20 --- 1080 101 45 26 11 8.4 6.2 31 15 --- e22 e20 --- 549 --- 41 --- 9.8 8.3 ---
TOTAL 401.5 571 753 653 1215 2849 3169 2913 1972 425.9 397.5 177.5 MEAN 12.95 19.03 24.29 21.06 43.39 91.90 105.6 93.97 65.73 13.74 12.82 5.917 MAX 18 36 30 23 97 1080 320 247 442 23 22 8.1 MIN 9.3 15 22 20 20 25 51 41 16 9.4 8.3 4.3 AC-FT 796 1130 1490 1300 2410 5650 6290 5780 3910 845 788 352 CFSM 0.03 0.05 0.06 0.05 0.11 0.23 0.27 0.24 0.17 0.03 0.03 0.01 IN. 0.04 0.05 0.07 0.06 0.11 0.27 0.30 0.27 0.18 0.04 0.04 0.02

183 MINNESOTA RIVER BASIN--Continued
05291000 WHETSTONE RIVER NEAR BIG STONE CITY, SD--Continued
STATISTICS OF MONTHLY MEAN DATA FOR WATER YEARS 1910 - 2002, BY WATER YEAR (WY)
OCT NOV DEC JAN FEB MAR APR MAY JUN JUL AUG SEP
MEAN 14.75 14.81 9.997 6.623 15.38 155.9 224.2 93.53 79.29 57.36 19.58 10.45 MAX 280 122 56.0 36.3 168 612 1677 491 478 885 327 77.0 (WY) 1996 1996 1999 1994 1998 1978 1997 1972 1984 1993 1991 1995 MIN 0.60 0.40 0.20 0.000 0.000 2.85 3.63 0.77 1.42 0.035 0.000 0.36 (WY) 1932 1935 1935 1934 1934 1969 1934 1934 1936 1934 1934 1935
SUMMARY STATISTICS FOR 2001 CALENDAR YEAR FOR 2002 WATER YEAR WATER YEARS 1910 - 2002 ANNUAL TOTAL 62342.7 15497.4 ANNUAL MEAN 170.8 42.46 60.21a HIGHEST ANNUAL MEAN 232 1997 LOWEST ANNUAL MEAN 1.52 1934 HIGHEST DAILY MEAN 8090 Apr 8 1080 Mar 30 8090 Apr 8 2001 LOWEST DAILY MEAN 5.2 Jan 1 4.3 Sep 24 0.00b Sep 13 1931 ANNUAL SEVEN-DAY MINIMUM 6.0 Jan 1 4.6 Sep 19 0.00 Jul 31 1933 MAXIMUM PEAK FLOW 1690 Mar 30 9930 Apr 8 2001 MAXIMUM PEAK STAGE 7.89 Mar 30 15.93 Apr 8 2001 INSTANTANEOUS LOW FLOW 4.0 Sep 25 0.00b Sep 13 1931 ANNUAL RUNOFF (AC-FT) 123700 30740 43620 ANNUAL RUNOFF (CFSM) 0.43 0.11 0.15 ANNUAL RUNOFF (INCHES) 5.83 1.45 2.06 10 PERCENT EXCEEDS 387 89 112 50 PERCENT EXCEEDS 17 22 9.0 90 PERCENT EXCEEDS 7.0 9.4 1.4 a Median of annual mean discharges is 46.1 ft3/s. b Many days, several years. e Estimated.
O N D2001
J F M A M J J A S2002
1
2
5
1010
20
50
100100
200
500
10001000
2000
5000
10,000
DAILY-MEAN DISCHARGE,
IN CUBIC FEET PER SECOND

184 MINNESOTA RIVER BASIN--Continued
05292000 MINNESOTA RIVER AT ORTONVILLE, MN
LOCATION.--Lat 45°17’44", long 96°26’38", in NE1⁄4NW1⁄4 sec. 16, T.121 N., R.46 W., Big Stone County, Hydrologic Unit 07020001,
on left bank 400 ft downstream from bridge on U.S. Highway 12 and 1,300 ft downstream from dam at outlet of Big Stone Lake, at Ortonville.
DRAINAGE AREA.--1,160 mi2 (approximately).
PERIOD OF RECORD.--February 1938 to current year.
REVISED RECORDS.--WSP 895: 1939. WSP 1508: 1942 (yearly mean).
GAGE.--Water-stage recorder. Datum of gage is 956.38 ft above sea level (NGVD of 1929). Prior to Mar. 31, 1939, nonrecording gage on downstream side of dam 1,300 ft upstream at datum 1.31 ft higher.
REMARKS.--Records good. Affected by regulation of Big Stone Lake.
DISCHARGE, CUBIC FEET PER SECOND, WATER YEAR OCTOBER 2001 TO SEPTEMBER 2002 DAILY MEAN VALUES DAY OCT NOV DEC JAN FEB MAR APR MAY JUN JUL AUG SEP 1 5.9 49 2.3 24 19 18 721 108 46 46 5.8 7.6 2 6.6 30 2.5 24 19 18 718 107 44 19 5.3 6.6 3 6.8 30 2.5 24 19 19 566 103 43 18 8.3 5.6 4 6.4 29 2.5 24 19 20 264 108 44 17 5.6 5.3 5 6.6 27 2.3 23 19 20 263 108 43 16 8.1 5.2 6 6.0 28 2.3 23 19 19 258 111 44 16 8.4 5.0 7 6.7 28 2.3 23 19 19 261 111 43 16 7.3 4.9 8 7.4 21 2.3 23 19 19 261 159 43 15 13 4.8 9 8.0 20 2.3 23 21 22 259 276 41 14 7.5 5.7 10 8.3 20 61 23 35 24 261 263 38 14 7.1 6.0 11 5.5 20 134 23 19 23 261 262 39 27 5.7 5.4 12 5.8 20 136 23 19 22 259 271 39 16 6.0 5.3 13 5.7 20 116 21 19 21 256 507 39 16 4.2 5.0 14 6.2 20 68 22 19 21 261 703 39 15 8.5 5.2 15 5.4 20 31 22 20 22 260 705 40 14 10 4.7 16 11 19 30 22 18 22 258 711 39 11 30 4.5 17 20 19 28 22 18 22 259 683 38 10 9.0 4.1 18 21 14 27 22 18 22 179 670 38 8.3 6.5 4.2 19 21 8.7 27 22 18 22 109 646 38 7.2 5.9 4.5 20 20 8.6 27 22 18 22 106 568 38 7.0 5.9 4.2 21 20 8.6 26 22 18 23 105 396 112 7.4 8.8 4.1 22 20 8.6 26 22 17 24 106 208 348 6.5 9.7 3.5 23 20 9.0 25 22 17 24 80 81 609 6.2 9.3 2.6 24 18 8.6 25 21 18 23 60 80 495 7.3 9.1 2.0 25 15 5.1 25 21 29 20 55 81 278 7.6 8.9 1.9 26 14 4.5 25 20 18 19 52 81 155 13 7.7 1.3 27 14 3.2 25 19 18 18 54 82 94 8.7 7.0 3.9 28 14 3.0 25 19 17 106 55 64 44 7.4 8.5 4.3 29 13 2.8 24 19 --- 884 79 49 44 6.2 7.8 3.5 30 13 2.3 24 19 --- 1590 103 50 45 5.8 7.7 2.8 31 37 --- 24 19 --- 1150 --- 48 --- 5.6 7.6 ---
TOTAL 388.3 507.0 980.3 678 546 4298 6789 8400 3040 404.2 260.2 133.7 MEAN 12.5 16.9 31.6 21.9 19.5 139 226 271 101 13.0 8.39 4.46 MAX 37 49 136 24 35 1590 721 711 609 46 30 7.6 MIN 5.4 2.3 2.3 19 17 18 52 48 38 5.6 4.2 1.3 AC-FT 770 1010 1940 1340 1080 8530 13470 16660 6030 802 516 265 CFSM 0.01 0.01 0.03 0.02 0.02 0.12 0.20 0.23 0.09 0.01 0.01 0.00 IN. 0.01 0.02 0.03 0.02 0.02 0.14 0.22 0.27 0.10 0.01 0.01 0.00

185 MINNESOTA RIVER BASIN--Continued
05292000 MINNESOTA RIVER AT ORTONVILLE, MN--Continued
STATISTICS OF MONTHLY MEAN DATA FOR WATER YEARS 1938 - 2002, BY WATER YEAR (WY)
OCT NOV DEC JAN FEB MAR APR MAY JUN JUL AUG SEP
MEAN 31.6 24.2 22.6 22.3 34.2 201 528 280 188 152 74.6 34.5 MAX 441 269 194 164 273 1519 4109 904 1034 1781 1299 250 (WY) 1996 1996 1943 1943 1998 1994 1997 2001 1962 1993 1993 1942 MIN 0.20 0.20 0.20 0.17 0.16 1.14 1.27 0.91 1.30 1.11 0.25 0.18 (WY) 1939 1939 1939 1940 1940 1941 1941 1941 1977 1977 1959 1988
SUMMARY STATISTICS FOR 2001 CALENDAR YEAR FOR 2002 WATER YEAR WATER YEARS 1938 - 2002 ANNUAL TOTAL 146755.1 26424.7 ANNUAL MEAN 402 72.4 134a HIGHEST ANNUAL MEAN 514 1997 LOWEST ANNUAL MEAN 2.39 1977 HIGHEST DAILY MEAN 4790 Apr 14 1590 Mar 30 5010 Apr 10 1997 LOWEST DAILY MEAN 2.3 Nov 30 1.3 Sep 26 0.00 Dec 13 1940 ANNUAL SEVEN-DAY MINIMUM 2.4 Dec 3 2.4 Dec 3 0.08 Sep 12 1988 MAXIMUM PEAK FLOW 1820 Mar 30 5070 Apr 10 1997 MAXIMUM PEAK STAGE 7.52 Mar 30 12.92 Apr 13 1952 INSTANTANEOUS LOW FLOW 1.1b Sep 26 0.00 Dec 13 1940 ANNUAL RUNOFF (AC-FT) 291100 52410 97190 ANNUAL RUNOFF (CFSM) 0.35 0.062 0.12 ANNUAL RUNOFF (INCHES) 4.71 0.85 1.57 10 PERCENT EXCEEDS 1330 257 351 50 PERCENT EXCEEDS 22 20 21 90 PERCENT EXCEEDS 7.4 5.2 1.2 a Median of annual mean discharges is 91 ft3/s. b Due in part to regulation.
O N D2001
J F M A M J J A S2002
1
2
5
1010
20
50
100100
200
500
10001000
2000
5000
10,000
DAILY-MEAN DISCHARGE,
IN CUBIC FEET PER SECOND
186 MINNESOTA RIVER BASIN
05292704 NORTH FORK YELLOW BANK RIVER NEAR ODESSA, MN
LOCATION.--Lat 45°11’21", long 96°24’54", in NW1⁄4 NW1⁄4 SW
1⁄4 sec.22, T.120 N., R.46 W., Lac qui Parle County, Hydrologic Unit 07020001, on left bank at upstream side of County Highway #7 bridge, 11.0 mi east-southeast of Milbank, SD, 6.4 mi southwest of Odessa, and 2.9 mi upstream from mouth.
DRAINAGE AREA.--208 mi2.
PERIOD OF RECORD.--May 1991 to current year.
GAGE.--Water-stage recorder and crest-stage gage. Elevation of gage is 1,020 ft above NGVD of 1929, from topographic map.
REMARKS.--Records good except those for estimated daily discharges, which are poor. Satellite data-collection platform at station. Water temperature and specific conductance measured during the year are compiled in the Miscellaneous Temperature Measurements and Field Determinations section.
DISCHARGE, CUBIC FEET PER SECOND, WATER YEAR OCTOBER 2001 TO SEPTEMBER 2002 DAILY MEAN VALUES DAY OCT NOV DEC JAN FEB MAR APR MAY JUN JUL AUG SEP 1 4.4 6.8 e5.5 e4.4 e3.0 e15 506 54 24 4.9 1.1 0.78 2 4.5 7.2 e6.0 e4.5 e3.2 e14 311 42 19 4.1 0.80 0.75 3 3.9 7.1 e6.0 e5.0 e3.5 e14 212 35 15 4.9 1.2 0.68 4 4.2 7.1 e6.0 e5.0 e4.0 e13 161 32 14 4.3 1.8 0.63 5 4.5 7.9 e6.0 e5.0 e6.0 e13 137 27 13 3.6 1.5 0.64 6 4.4 8.2 e6.0 e5.0 e10 e12 98 24 12 2.8 1.8 0.63 7 4.3 8.5 e5.5 e5.0 e15 e12 108 24 11 2.5 2.0 0.63 8 5.0 8.0 e5.5 e6.0 e20 e11 157 31 11 2.5 1.3 0.55 9 5.5 6.2 e5.5 e7.0 e30 e10 151 43 10 2.3 1.0 0.54 10 5.8 6.4 e5.5 e8.0 e30 e15 110 68 9.6 2.2 0.96 0.76 11 6.0 6.4 e5.5 e8.0 e40 e20 96 63 8.9 2.5 0.89 0.94 12 6.1 6.3 e5.8 e7.5 e50 e25 87 61 8.1 2.3 1.3 0.75 13 6.6 6.3 e5.8 e7.5 e65 e35 78 100 8.0 1.7 1.1 0.65 14 6.5 6.4 e5.8 e7.5 80 e50 72 98 7.8 1.4 0.89 0.65 15 6.5 6.4 e5.5 e7.5 92 e48 71 67 7.4 1.3 0.78 0.71 16 6.5 6.5 e5.5 e6.0 100 e48 60 51 7.1 1.2 0.96 0.67 17 6.5 6.5 e5.5 e5.5 96 e50 52 40 6.5 1.1 0.71 0.56 18 6.7 7.1 e5.2 e5.5 99 e50 46 34 6.2 1.3 0.64 0.56 19 7.1 6.9 e5.0 e5.5 132 e48 41 29 6.1 1.4 0.65 0.58 20 5.6 6.7 e5.0 e5.5 154 e45 35 26 5.8 1.7 0.77 0.59 21 5.4 6.6 e5.0 e5.5 159 e40 33 24 8.4 1.6 2.3 0.58 22 5.3 6.6 e4.5 e5.5 134 e45 34 22 13 1.9 2.4 0.58 23 6.0 6.6 e4.0 e5.0 100 e50 32 22 13 1.6 1.5 0.51 24 6.1 e6.0 e4.0 e4.5 e40 e45 32 21 10 1.5 1.3 0.54 25 6.1 e5.8 e4.0 e4.5 e20 e40 31 20 9.0 1.6 1.0 0.64 26 6.0 e5.5 e4.0 e4.0 e20 e40 26 18 10 1.4 0.83 0.68 27 6.0 e5.5 e4.0 e3.3 e17 e50 26 18 12 2.2 0.90 0.71 28 6.2 e5.5 e4.0 e3.0 e15 e100 32 18 8.6 2.5 0.96 0.83 29 6.4 e5.5 e4.0 e3.0 --- e250 41 20 7.4 1.6 0.92 0.75 30 6.5 e5.5 e4.0 e3.0 --- 743 56 45 6.0 1.4 0.90 0.90 31 6.8 --- e4.0 e3.0 --- 1100 --- 45 --- 1.1 0.96 ---
TOTAL 177.4 198.0 157.6 165.2 1537.7 3051 2932 1222 307.9 68.4 36.12 19.97 MEAN 5.723 6.600 5.084 5.329 54.92 98.42 97.73 39.42 10.26 2.206 1.165 0.666 MAX 7.1 8.5 6.0 8.0 159 1100 506 100 24 4.9 2.4 0.94 MIN 3.9 5.5 4.0 3.0 3.0 10 26 18 5.8 1.1 0.64 0.51 AC-FT 352 393 313 328 3050 6050 5820 2420 611 136 72 40

187 MINNESOTA RIVER BASIN
05292704 NORTH FORK YELLOW BANK RIVER NEAR ODESSA, MN--Continued STATISTICS OF MONTHLY MEAN DATA FOR WATER YEARS 1992 - 2002, BY WATER YEAR (WY)
MEAN 43.47 26.42 13.42 7.938 39.06 160.3 298.6 91.10 83.04 110.3 23.18 15.82 MAX 342 122 32.7 19.5 166 422 977 267 212 501 107 72.5 (WY) 1996 1996 1996 1996 1996 1997 1997 1995 1992 1993 1995 1995 MIN 0.94 2.42 0.57 0.34 0.56 9.73 12.7 9.14 7.20 2.21 0.79 0.48 (WY) 2001 2001 2001 2001 2001 2001 2000 1992 2000 2002 2000 2000
SUMMARY STATISTICS FOR 2001 CALENDAR YEAR FOR 2002 WATER YEAR WATER YEARS 1992 - 2002 ANNUAL TOTAL 37306.36 9873.29 ANNUAL MEAN 102.2 27.05 76.00a HIGHEST ANNUAL MEAN 134 1997 LOWEST ANNUAL MEAN 7.33 2000 HIGHEST DAILY MEAN 5000 Apr 8 1100 Mar 31 5000 Apr 8 2001 LOWEST DAILY MEAN 0.10 Jan 2 0.51 Sep 23 0.10 Jan 2 2001 ANNUAL SEVEN-DAY MINIMUM 0.18 Jan 1 0.56 Sep 18 0.13 Dec 28 2000 MAXIMUM PEAK FLOW 1410 Mar 31 6840b Apr 8 2001 MAXIMUM PEAK STAGE 11.71 Mar 31 18.02c Mar 29 1997 ANNUAL RUNOFF (AC-FT) 74000 19580 55060 10 PERCENT EXCEEDS 184 60 150 50 PERCENT EXCEEDS 6.0 6.2 16 90 PERCENT EXCEEDS 0.50 0.89 2.7 a Median of annual mean discharges, 97 ft3/s. b Gage height, 16.72 ft, backwater from ice. c Backwater from ice. e Estimated.
O N D2001
J F M A M J J A S2002
0.1
0.2
0.5
11
2
5
1010
20
50
100100
200
500
10001000
2000
5000
10,000
DISCHARGE,
IN CUBIC FEET PER SECOND

188 MINNESOTA RIVER BASIN--Continued
05293000 YELLOW BANK RIVER NEAR ODESSA, MN
LOCATION.--Lat 45°13’37", long 96°21’12", in SW1⁄4SW1⁄4 sec. 6, T. 120 N., R. 45 W., Lac qui Parle County, Hydrologic Unit
07020001, on left bank 1200 ft upstream from highway bridge, 2.5 mi southwest of Odessa, and 4.5 mi upstream from mouth.
DRAINAGE AREA.--459 mi2.
PERIOD OF RECORD.--October 1939 to September 1999, October 1999 to March 2001 (peak flow only), April 2001 to current year.
REVISED RECORDS.--WSP 1388: 1947(M), 1950. WDR MN-95-1: Sept. 5 (Q). WRIR 97-4249: Drainage area.
GAGE.--Water-stage recorder. Datum of gage is 953.34 ft above sea level (U.S. Army Corps of Engineers benchmark, NGVD of 1929). Prior to Aug. 28, 1940, nonrecording gage at site 150 ft upstream at same datum.
REMARKS.--Records good except those for estimated daily discharges, which are fair to poor.
EXTREMES FOR CURRENT YEAR.--Peak discharges greater than base discharge of 300 ft3/s and maximum (*):
Discharge Gage height Discharge Gage height Date Time (ft3/s) (ft) Date Time (ft3/s) (ft)
Mar 31 (daily) *e1300 -- No other peak greater than base discharge.
Minimum discharge, 2.4 ft3/s, Sept. 24, gage height, 1.55 ft.
DISCHARGE, CUBIC FEET PER SECOND, WATER YEAR OCTOBER 2001 TO SEPTEMBER 2002 DAILY MEAN VALUES DAY OCT NOV DEC JAN FEB MAR APR MAY JUN JUL AUG SEP 1 e12 e24 e26 e4.7 e8.6 e31 e851 125 60 19 6.1 6.2 2 e11 e25 e25 e4.4 e9.1 e30 e512 114 49 16 5.7 5.6 3 e9.3 e24 e26 e4.3 e9.3 e28 e299 95 43 18 6.8 5.0 4 e9.3 e23 e27 e4.4 e8.8 e26 222 81 39 16 7.7 4.5 5 e9.0 e22 e28 e4.9 e8.7 e24 206 73 37 17 7.3 3.9 6 e9.4 e21 e29 e5.7 e8.8 e20 218 65 34 15 7.4 3.8 7 e9.1 e19 e27 e6.1 e9.6 e16 232 63 32 15 7.5 3.4 8 e7.7 e21 e23 e7.0 e12 e14 256 79 30 15 6.7 3.0 9 e9.2 e20 e22 e8.1 e19 e10 283 94 29 13 5.7 3.3 10 e14 e20 e22 e9.4 e19 e7.0 232 126 27 12 5.9 4.0 11 e14 e20 e20 e11 e21 e11 199 144 26 13 5.8 3.4 12 e14 e18 e21 e13 e24 e22 185 145 24 10 6.3 3.4 13 e18 e19 e19 e16 e24 e38 175 160 23 9.5 6.2 3.5 14 e20 e18 e18 e17 e29 e33 161 186 22 8.8 5.7 3.4 15 e21 e18 e18 e18 e35 e28 152 161 21 7.7 5.3 3.2 16 e22 e18 e19 e18 e41 e30 139 133 21 7.4 4.9 3.3 17 e22 e18 e18 e18 e41 e34 127 115 19 6.9 4.6 3.1 18 e23 e18 e19 e17 e44 e38 116 98 18 8.0 4.7 3.0 19 e24 e20 e13 e16 e52 e39 101 85 18 7.8 4.6 2.9 20 e23 e20 e16 e17 e74 e38 88 78 16 9.9 4.7 2.8 21 e22 e19 e14 e17 e68 e37 83 74 23 9.5 9.1 2.6 22 e21 e18 e12 e18 e71 e36 82 70 26 9.6 11 2.7 23 e22 e18 e10 e18 e91 e39 80 65 32 7.8 11 2.8 24 e23 e23 e8.9 e17 e77 e39 76 63 28 7.9 26 2.6 25 e23 e24 e8.2 e17 e35 e38 75 61 26 8.3 22 3.0 26 e24 e21 e7.7 e17 e48 e37 69 60 33 8.2 16 3.3 27 e23 e21 e7.7 e16 e50 e39 65 60 45 13 12 3.1 28 e23 e34 e7.0 e13 e36 e95 71 60 34 10 9.9 3.4 29 e22 e32 e6.0 e11 --- e248 85 59 28 11 8.5 3.9 30 e23 e28 e5.4 e9.8 --- e450 112 62 23 7.9 8.1 4.4 31 e23 --- e5.0 e9.1 --- e1300 --- 96 --- 7.1 7.3 ---
TOTAL 550.0 644 527.9 382.9 973.9 2875.0 5552 2950 886 345.3 260.5 106.5 MEAN 17.7 21.5 17.0 12.4 34.8 92.7 185 95.2 29.5 11.1 8.40 3.55 MAX 24 34 29 18 91 1300 851 186 60 19 26 6.2 MIN 7.7 18 5.0 4.3 8.6 7.0 65 59 16 6.9 4.6 2.6 AC-FT 1090 1280 1050 759 1930 5700 11010 5850 1760 685 517 211 CFSM 0.04 0.05 0.04 0.03 0.08 0.20 0.40 0.21 0.06 0.02 0.02 0.01 IN. 0.04 0.05 0.04 0.03 0.08 0.23 0.45 0.24 0.07 0.03 0.02 0.01

189 MINNESOTA RIVER BASIN--Continued
05293000 YELLOW BANK RIVER NEAR ODESSA, MN--Continued
STATISTICS OF MONTHLY MEAN DATA FOR WATER YEARS 1940 - 2002, BY WATER YEAR (WY)
OCT NOV DEC JAN FEB MAR APR MAY JUN JUL AUG SEP
MEAN 25.4 24.8 13.2 7.98 17.6 173 266 111 106 64.8 29.8 17.0 MAX 588 256 86.3 68.0 147 693 1614 652 577 741 281 273 (WY) 1996 1996 1996 1994 1998 1996 1997 1972 1992 1993 1991 1985 MIN 0.31 0.44 0.32 0.090 0.001 1.59 9.13 2.94 1.83 0.27 0.088 0.083 (WY) 1941 1977 1977 1977 1977 1965 1981 1981 1976 1976 1976 1976
SUMMARY STATISTICS FOR 2002 WATER YEAR WATER YEARS 1940 - 2002 ANNUAL TOTAL 16054.0 ANNUAL MEAN 44.0 71.5a HIGHEST ANNUAL MEAN 237 1996 LOWEST ANNUAL MEAN 3.98 1981 HIGHEST DAILY MEAN 1300 Mar 31 6640 Apr 9 1969 LOWEST DAILY MEAN 2.6 Sep 21,24 0.00b Jan 26 1940 ANNUAL SEVEN-DAY MINIMUM 2.8 Sep 18 0.00 Jan 26 1940 MAXIMUM PEAK FLOW 1300c Mar 31 6970 Apr 9 1969 MAXIMUM PEAK STAGE 10.24d Mar 31 19.07 Apr 9 1969 INSTANTANEOUS LOW FLOW 2.4 Sep 24 0.00b Jan 26 1940 ANNUAL RUNOFF (AC-FT) 31840 51830 ANNUAL RUNOFF (CFSM) 0.096 0.16 ANNUAL RUNOFF (INCHES) 1.30 2.12 10 PERCENT EXCEEDS 95 151 50 PERCENT EXCEEDS 19 12 90 PERCENT EXCEEDS 4.9 1.0 a Median of annual mean discharges is 54 ft3/s. b Many days, several years. c Estimated daily discharge. Maximum discharge probably higher. d Backwater from beaver dam. e Estimated.
O N D2001
J F M A M J J A S2002
1
2
5
1010
20
50
100100
200
500
10001000
2000
5000
10,000
DAILY-MEAN DISCHARGE,
IN CUBIC FEET PER SECOND

190 MINNESOTA RIVER BASIN--Continued
05299650 LAC QUI PARLE RIVER NEAR PROVIDENCE, MN
LOCATION.--Lat 44°53’07", long 96°03’07", in SE1⁄4NE1⁄4 sec. 5, T.116 N., R.43 W., Lac qui Parle County, Hydrologic Unit
07020003, on left bank 10 ft downstream from County Road 23 bridge, 6.1 mi upstream from confluence with West Branch of Lac qui Parle River, and 3 mi south of Dawson.
DRAINAGE AREA.--374 mi2.
PERIOD OF RECORD.--April 2001 to current year.
GAGE.--Water-stage recorder.
REMARKS.--Records good to fair except those for estimated daily discharges, which are poor.
DISCHARGE, CUBIC FEET PER SECOND, WATER YEAR OCTOBER 2001 TO SEPTEMBER 2002 DAILY MEAN VALUES DAY OCT NOV DEC JAN FEB MAR APR MAY JUN JUL AUG SEP 1 1.9 4.3 e14 e3.4 e6.4 e20 e301 211 97 44 e2.5 10 2 1.9 4.4 e15 e3.3 e6.3 e19 e469 194 93 e38 e1.9 8.6 3 1.8 5.2 e15 e3.2 e6.0 e17 e518 176 94 e34 e1.5 9.3 4 1.8 5.4 e15 e3.3 e5.7 e15 e360 159 95 30 e1.1 5.2 5 1.5 7.2 e16 e3.6 e5.7 e14 e301 145 91 26 e0.95 4.2 6 1.4 9.3 e16 e3.9 e5.9 e13 e287 135 85 24 e1.2 3.7 7 1.3 7.6 e16 e4.4 e6.1 e11 e313 125 79 e21 e1.6 3.0 8 1.2 7.1 e15 e4.9 e6.5 e9.1 401 130 73 e18 e1.6 2.4 9 1.3 7.1 e14 e5.7 e7.2 e7.1 420 180 69 e16 e1.6 2.2 10 1.2 7.3 e14 e6.5 e7.9 e5.9 330 294 64 e14 e1.4 2.3 11 1.2 7.7 e13 e7.4 e8.8 e5.9 275 315 60 e14 e1.3 1.9 12 1.4 7.2 e13 e8.8 e9.7 e7.2 266 284 58 12 e1.4 1.5 13 1.8 7.9 e12 e11 e11 e9.6 265 285 55 11 e1.3 1.4 14 1.9 6.6 e12 e13 e12 e9.6 253 e292 52 13 e1.1 1.3 15 1.9 5.5 e12 e15 e14 e9.0 247 e268 49 13 e0.96 1.2 16 2.0 5.4 e11 e15 e17 e9.5 247 e254 45 10 e0.90 1.1 17 2.2 5.7 e11 e15 e19 e9.9 236 e242 41 9.0 e0.89 1.0 18 3.9 6.3 e9.9 e14 e22 e11 233 e229 38 7.5 e0.87 0.97 19 3.5 7.7 e9.2 e14 e25 e12 226 e215 36 6.9 e0.85 1.2 20 3.1 5.9 e8.5 e14 e26 e14 208 e197 34 e6.6 2.0 1.2 21 3.1 5.4 e7.7 e14 e28 e15 190 181 37 e7.6 15 0.95 22 2.8 5.5 e6.9 e13 e29 e15 184 171 50 e7.7 57 0.90 23 2.9 5.6 e6.2 e14 e30 e16 183 161 148 e5.8 76 0.86 24 3.5 8.0 e5.9 e14 e31 e16 180 151 140 e5.9 49 0.78 25 4.4 12 e5.5 e15 e29 e16 170 139 106 e6.3 36 0.86 26 4.8 e19 e5.4 e14 e27 e16 150 131 97 e6.6 30 0.86 27 3.6 e15 e5.2 e11 e25 e17 140 126 86 e6.8 24 0.79 28 3.4 e14 e4.9 e9.3 e23 e23 149 117 75 e6.6 19 0.78 29 3.5 e14 e4.4 e7.5 --- e35 181 113 62 e6.1 15 0.81 30 4.0 e14 e4.1 e7.1 --- e79 208 112 51 e5.2 14 0.79 31 4.2 --- e3.8 e6.7 --- e166 --- 104 --- e4.1 13 ---
TOTAL 78.4 243.3 321.6 295.0 450.2 642.8 7891 5836 2160 436.7 374.92 72.05 MEAN 2.53 8.11 10.4 9.52 16.1 20.7 263 188 72.0 14.1 12.1 2.40 MAX 4.8 19 16 15 31 166 518 315 148 44 76 10 MIN 1.2 4.3 3.8 3.2 5.7 5.9 140 104 34 4.1 0.85 0.78 AC-FT 156 483 638 585 893 1270 15650 11580 4280 866 744 143 CFSM 0.01 0.02 0.03 0.03 0.04 0.06 0.70 0.50 0.19 0.04 0.03 0.01 IN. 0.01 0.02 0.03 0.03 0.04 0.06 0.78 0.58 0.21 0.04 0.04 0.01

191 MINNESOTA RIVER BASIN--Continued
05299650 LAC QUI PARLE RIVER NEAR PROVIDENCE, MN--Continued
STATISTICS OF MONTHLY MEAN DATA FOR WATER YEARS 2001 - 2002, BY WATER YEAR (WY)
OCT NOV DEC JAN FEB MAR APR MAY JUN JUL AUG SEP
MEAN 2.53 8.11 10.4 9.52 16.1 20.7 684 259 167 53.9 18.3 2.92 MAX 2.53 8.11 10.4 9.52 16.1 20.7 1349 331 263 93.7 24.6 3.44 (WY) 2002 2002 2002 2002 2002 2002 2001 2001 2001 2001 2001 2001 MIN 2.53 8.11 10.4 9.52 16.1 20.7 263 188 72.0 14.1 12.1 2.40 (WY) 2002 2002 2002 2002 2002 2002 2002 2002 2002 2002 2002 2002
SUMMARY STATISTICS FOR 2002 WATER YEAR WATER YEARS 2001 - 2002 ANNUAL TOTAL 18801.97 ANNUAL MEAN 51.5 124 HIGHEST ANNUAL MEAN 276 2001 LOWEST ANNUAL MEAN 51.5 2002 HIGHEST DAILY MEAN 518 Apr 3 2100 Apr 14 2001 LOWEST DAILY MEAN 0.78 Sep 24, 28 0.78 Sep 24 2002 ANNUAL SEVEN-DAY MINIMUM 0.81 Sep 24 0.81 Sep 24 2002 MAXIMUM PEAK FLOW 518a Apr 3 2140 Apr 14 2001 MAXIMUM PEAK STAGE 14.58b Apr 4 18.29 Apr 14 2001 INSTANTANEOUS LOW FLOW 0.72c Sep 30 0.72c Sep 30 2002 ANNUAL RUNOFF (AC-FT) 37290 89490 ANNUAL RUNOFF (CFSM) 0.14 0.33 ANNUAL RUNOFF (INCHES) 1.87 4.49 10 PERCENT EXCEEDS 183 292 50 PERCENT EXCEEDS 12 15 90 PERCENT EXCEEDS 1.4 1.9 a Estimated daily discharge, backwater from ice. b Backwater from ice. c Falling stage. e Estimated.
O N D2001
J F M A M J J A S2002
0.1
0.2
0.5
11
2
5
1010
20
50
100100
200
500
1000
DAILY-MEAN DISCHARGE,
IN CUBIC FEET PER SECOND

192 MINNESOTA RIVER BASIN--Continued
05299800 WEST BRANCH LAC QUI PARLE RIVER AT DAWSON, MN
LOCATION.--Lat 44°55’45", long 96°03’09", in SW1⁄4NE1⁄4 sec. 21, T.117 N., R.43 W., Lac qui Parle County, Hydrologic Unit
07020003, on left bank 5 ft downstream from Diagonal St. bridge in Dawson and 1.7 mi upstream from confluence with the Lac qui Parle River.
DRAINAGE AREA.--474 mi2.
PERIOD OF RECORD.--April 2001 to current year.
GAGE.--Water-stage recorder.
REMARKS.--Records fair except those for estimated daily discharges, which are poor.
DISCHARGE, CUBIC FEET PER SECOND, WATER YEAR OCTOBER 2001 TO SEPTEMBER 2002 DAILY MEAN VALUES DAY OCT NOV DEC JAN FEB MAR APR MAY JUN JUL AUG SEP 1 e3.0 e18 e26 e11 15 e23 723 196 56 29 e2.3 e8.0 2 e2.8 e12 e27 e10 15 e21 670 177 52 27 e0.96 e7.2 3 e2.6 e13 e29 e9.9 14 e19 556 151 48 19 e0.68 e6.5 4 e2.8 e12 e30 e9.8 14 e18 380 132 48 19 e0.90 e7.2 5 e2.9 e13 e35 e10 14 e16 321 120 47 19 e0.80 e6.5 6 e3.3 e13 43 e11 14 e15 313 109 46 17 e2.3 e5.8 7 e3.7 e16 44 e12 14 e15 299 101 43 15 e4.2 e4.9 8 e3.7 e18 40 e12 15 e14 303 103 41 14 e4.4 e4.3 9 e3.7 e18 40 e14 16 e12 335 129 39 13 e4.4 e4.2 10 e4.1 e19 43 e15 15 e11 291 176 36 12 e4.2 e4.6 11 e5.6 e19 45 17 16 e10 247 189 33 12 e4.0 e4.5 12 e7.5 e17 40 21 16 e12 236 174 32 11 e3.8 e4.3 13 e8.4 e19 44 25 16 e13 235 179 31 11 e3.4 e4.1 14 e7.8 e22 39 26 18 e14 222 197 30 10 e3.0 e3.8 15 e10 e25 36 26 19 e14 205 181 30 9.5 e2.6 e3.5 16 e12 e20 41 25 20 e14 191 156 28 8.3 e2.7 e3.7 17 e12 e22 44 23 22 e14 179 136 28 6.4 e2.8 e4.1 18 e11 e24 41 e21 25 e14 167 119 27 5.0 e2.9 e4.1 19 e9.7 e27 41 e20 28 e15 150 108 27 4.6 e2.8 e4.1 20 e12 e26 33 20 35 e16 134 98 27 4.3 e8.1 e3.8 21 e12 e25 36 20 37 e17 126 92 35 5.3 47 e3.1 22 e13 e24 34 20 36 e18 121 90 35 5.3 100 e2.6 23 e13 e33 29 19 36 e19 125 86 45 3.5 101 e2.2 24 e11 e28 24 18 41 e19 124 80 35 e4.1 76 e1.9 25 e13 e26 22 18 32 e19 117 77 37 e7.4 50 e1.9 26 e13 e51 e23 19 35 e19 112 74 41 e8.3 34 e2.0 27 e18 e35 e20 19 e30 e19 106 71 38 e6.9 24 e2.1 28 e15 e27 e18 18 e26 33 110 67 36 e5.9 e19 e2.3 29 e14 e25 e17 17 --- 112 141 65 33 e5.4 e15 e2.4 30 e15 e26 e15 16 --- 203 184 63 31 e5.5 e12 e2.5 31 e16 --- e12 15 --- 501 --- 60 --- e4.4 e9.9 ---
TOTAL 281.6 673 1011 537.7 634 1279 7423 3756 1115 328.1 549.14 122.2 MEAN 9.08 22.4 32.6 17.3 22.6 41.3 247 121 37.2 10.6 17.7 4.07 MAX 18 51 45 26 41 501 723 197 56 29 101 8.0 MIN 2.6 12 12 9.8 14 10 106 60 27 3.5 0.68 1.9 AC-FT 559 1330 2010 1070 1260 2540 14720 7450 2210 651 1090 242 CFSM 0.02 0.05 0.07 0.04 0.05 0.09 0.52 0.26 0.08 0.02 0.04 0.01 IN. 0.02 0.05 0.08 0.04 0.05 0.10 0.58 0.29 0.09 0.03 0.04 0.01

193 MINNESOTA RIVER BASIN--Continued
05299800 WEST BRANCH LAC QUI PARLE RIVER AT DAWSON, MN--Continued
STATISTICS OF MONTHLY MEAN DATA FOR WATER YEARS 2001 - 2002, BY WATER YEAR (WY)
OCT NOV DEC JAN FEB MAR APR MAY JUN JUL AUG SEP
MEAN 9.08 22.4 32.6 17.3 22.6 41.3 1204 236 206 37.9 14.6 6.81 MAX 9.08 22.4 32.6 17.3 22.6 41.3 2571 351 374 65.2 17.7 9.55 (WY) 2002 2002 2002 2002 2002 2002 2001 2001 2001 2001 2002 2001 MIN 9.08 22.4 32.6 17.3 22.6 41.3 247 121 37.2 10.6 11.6 4.07 (WY) 2002 2002 2002 2002 2002 2002 2002 2002 2002 2002 2001 2002
SUMMARY STATISTICS FOR 2002 WATER YEAR WATER YEARS 2001 - 2002 ANNUAL TOTAL 17709.74 ANNUAL MEAN 48.5 179 HIGHEST ANNUAL MEAN 453 2001 LOWEST ANNUAL MEAN 48.5 2002 HIGHEST DAILY MEAN 723 Apr 1 5050 Apr 13 2001 LOWEST DAILY MEAN 0.68 Aug 3 0.68 Aug 3 2002 ANNUAL SEVEN-DAY MINIMUM 1.7 Aug 1 1.7 Aug 1 2002 MAXIMUM PEAK FLOW 737 Apr 1 5150 Apr 13 2001 MAXIMUM PEAK STAGE 34.24 Apr 1 41.03 Apr 13 2001 ANNUAL RUNOFF (AC-FT) 35130 129700 ANNUAL RUNOFF (CFSM) 0.10 0.38 ANNUAL RUNOFF (INCHES) 1.39 5.13 10 PERCENT EXCEEDS 130 303 50 PERCENT EXCEEDS 19 24 90 PERCENT EXCEEDS 3.8 3.7 e Estimated.
O N D2001
J F M A M J J A S2002
0.1
0.2
0.5
11
2
5
1010
20
50
100100
200
500
1000
DAILY-MEAN DISCHARGE,
IN CUBIC FEET PER SECOND

194 MINNESOTA RIVER BASIN--Continued
05300000 LAC QUI PARLE RIVER NEAR LAC QUI PARLE, MN
LOCATION.--Lat 44°59’42", long 95°55’09", in SW1⁄4SW1⁄4 sec. 27, T.118 N., R.42 W., Lac qui Parle County, Hydrologic Unit
07020003, on right bank 40 ft downstream from highway bridge and 0.5 mi southwest of village of Lac qui Parle.
DRAINAGE AREA.--960 mi2.
PERIOD OF RECORD.--April 1910 to November 1914; March 1931 to September 1999 (winter records incomplete prior to 1934), October 1999 to March 2001 (peak flow only), April 2001 to current year. Published as "at Lac qui Parle," 1910-14.
REVISED RECORDS.--WSP 1308: 1912(M), 1935(M).
GAGE.--Water-stage recorder. Datum of gage is 946.98 ft above sea level (NGVD of 1929, Minnesota Department of Transportation benchmark). Apr. 27, 1910 to Nov. 15, 1914, nonrecording gage at site 2 mi downstream at different datum. Mar. 17, 1931 to Mar. 9, 1937, nonrecording gage at site 40 ft upstream at present datum.
REMARKS.--Records good except those for estimated daily discharges, which are fair to poor.
DISCHARGE, CUBIC FEET PER SECOND, WATER YEAR OCTOBER 2001 TO SEPTEMBER 2002 DAILY MEAN VALUES DAY OCT NOV DEC JAN FEB MAR APR MAY JUN JUL AUG SEP 1 41 34 e51 e17 e23 e49 e1020 415 199 107 14 43 2 e36 36 e51 e17 e23 e43 e1160 393 190 89 13 37 3 e32 39 e55 e16 e22 e39 e1080 354 183 80 14 32 4 e27 36 e56 e16 e22 e36 e982 319 182 82 16 30 5 e26 37 e62 e17 e21 e33 e690 292 180 80 16 24 6 e25 37 e72 e19 e21 e30 616 270 173 65 19 21 7 e23 44 e75 e19 e22 e26 636 255 164 52 16 18 8 e22 44 e69 e21 e24 e22 622 262 153 45 15 16 9 e20 42 e67 e23 e25 e20 694 289 144 39 14 14 10 19 41 e70 e26 e25 e18 657 418 136 34 14 14 11 19 41 e72 e29 e26 e17 567 529 130 32 12 e13 12 23 42 e68 e33 e26 e18 527 519 123 30 15 e10 13 26 45 e67 e40 e29 e23 525 499 118 28 17 e8.5 14 31 43 e70 e44 e30 e27 512 524 109 25 16 e8.3 15 31 46 e64 e47 e33 e29 479 513 101 25 15 e7.5 16 31 44 e65 e47 e37 e29 468 466 93 26 15 e6.6 17 32 44 e68 e44 e42 e29 452 424 86 23 18 e6.2 18 32 43 e78 e41 e47 e30 424 390 79 22 21 e6.0 19 31 43 e80 e40 e55 e33 404 358 71 20 15 5.4 20 32 44 e79 e38 e62 e35 371 333 67 22 16 5.0 21 31 45 e67 e37 e69 e38 347 312 77 21 122 4.3 22 31 43 e57 e37 e75 e40 323 292 112 19 185 3.8 23 31 42 e50 e38 e78 e42 320 275 133 18 243 2.8 24 31 54 e41 e37 e78 e43 316 260 234 19 231 2.5 25 33 86 e38 e37 e74 e45 307 248 215 19 180 2.6 26 33 74 e37 e37 e69 e46 290 235 228 18 142 3.3 27 32 e71 e32 e33 e63 e50 274 225 204 21 116 2.9 28 36 e59 e29 e30 e57 e75 275 221 171 21 90 3.2 29 36 e52 e26 e28 --- e193 308 215 145 20 71 3.6 30 35 e52 e24 e26 --- e367 374 214 124 18 58 3.3 31 33 --- e20 e24 --- e744 --- 207 --- 16 49 ---
TOTAL 921 1403 1760 958 1178 2269 16020 10526 4324 1136 1798 357.8 MEAN 29.7 46.8 56.8 30.9 42.1 73.2 534 340 144 36.6 58.0 11.9 MAX 41 86 80 47 78 744 1160 529 234 107 243 43 MIN 19 34 20 16 21 17 274 207 67 16 12 2.5 AC-FT 1830 2780 3490 1900 2340 4500 31780 20880 8580 2250 3570 710 CFSM 0.03 0.05 0.06 0.03 0.04 0.08 0.56 0.35 0.15 0.04 0.06 0.01 IN. 0.04 0.05 0.07 0.04 0.05 0.09 0.62 0.41 0.17 0.04 0.07 0.01

195 MINNESOTA RIVER BASIN--Continued
05300000 LAC QUI PARLE RIVER NEAR LAC QUI PARLE, MN--Continued
STATISTICS OF MONTHLY MEAN DATA FOR WATER YEARS 1910 - 2002, BY WATER YEAR (WY)
OCT NOV DEC JAN FEB MAR APR MAY JUN JUL AUG SEP
MEAN 43.0 48.5 26.4 11.9 23.4 297 635 254 273 141 76.2 37.8 MAX 629 378 149 88.1 244 1634 5354 1264 1762 1613 765 535 (WY) 1996 1996 1996 1994 1998 1985 1997 1995 1984 1993 1953 1985 MIN 0.000 0.000 0.000 0.000 0.000 0.000 0.000 0.000 0.000 0.000 0.000 0.000 (WY) 1932 1932 1932 1932 1934 1934 1934 1934 1934 1934 1931 1931
SUMMARY STATISTICS FOR 2002 WATER YEAR WATER YEARS 1910 - 2002 ANNUAL TOTAL 42650.8 ANNUAL MEAN 117 158a HIGHEST ANNUAL MEAN 716 2001 LOWEST ANNUAL MEAN 0.000 1934 HIGHEST DAILY MEAN 1160 Apr 2 16000 Apr 10 1969 LOWEST DAILY MEAN 2.5 Sep 24 0.00b Jul 15 1931 ANNUAL SEVEN-DAY MINIMUM 3.0 Sep 23 0.00 Jul 15 1931 MAXIMUM PEAK FLOW 1160c Apr 2 17100 Apr 10 1969 MAXIMUM PEAK STAGE 11.16d Mar 31 24.37f Apr 9 1965 INSTANTANEOUS LOW FLOW 2.3 Sep 23 0.00b Jul 15 1931 ANNUAL RUNOFF (AC-FT) 84600 114600 ANNUAL RUNOFF (CFSM) 0.12 0.16 ANNUAL RUNOFF (INCHES) 1.65 2.24 10 PERCENT EXCEEDS 350 361 50 PERCENT EXCEEDS 42 23 90 PERCENT EXCEEDS 16 0.57 a Median of annual mean discharges is 117 ft3/s. b Many days, several years. c Estimated daily-mean discharge, backwater from ice. d Backwater from ice. e Estimated. f From highwater mark, backwater from ice. Datum then in use.
O N D2001
J F M A M J J A S2002
1
2
5
1010
20
50
100100
200
500
10001000
2000
5000
10,000
DAILY-MEAN DISCHARGE,
IN CUBIC FEET PER SECOND

196 MINNESOTA RIVER BASIN--Continued
05301000 MINNESOTA RIVER NEAR LAC QUI PARLE, MN
LOCATION.--Lat 45°01’17", long 95°52’05", in NW1⁄4NE1⁄4 sec.24, T.118 N., R.42 W., Chippewa County, Hydrologic Unit 07020004, on
left bank 200 ft downstream from highway bridge and dam, 2.4 mi northeast of city of Lac Qui Parle, and 3.5 mi west of city of Watson.
DRAINAGE AREA.--4,050 mi2 (approximately).
PERIOD OF RECORD.--October 1942 to September 1994, October 1998 to present.
REVISED RECORDS.--WDR MN-91-2; 1979
GAGE.--Water-stage recorder. Datum of gage is 900.00 ft above sea level (NGVD or 1929, levels by U.S. Army Corps of Engineers). Prior to Nov. 10, 1944, at datum 0.20 ft. lower.
REMARKS.--Records good except those for estimated daily discharges, which are fair. Part of flow from 2,050 mi2, of Chippewa River Basin at most times diverted into Minnesota River above station. Some regulation by Big Stone Lake since Apr. 17, 1937, Lac qui Parle since Jan. 1938, Marsh Lake since Nov. 1, 1939, and Odessa Dam since May 1974.
EXTREMES OUTSIDE PERIOD OF RECORD.--Flood of Apr. 1997 reached a discharge of approximately 43,000 ft3/s, combination of measured flow through dam and indirect computation of flow over dam; peak stage occurred Apr. 7, 1997 (from U.S. Army Corps of Engineers).
DISCHARGE - TAILWATER, in CFS, WATER YEAR OCTOBER 2001 TO SEPTEMBER 2002 DAILY MEAN VALUES DAY OCT NOV DEC JAN FEB MAR APR MAY JUN JUL AUG SEP 1 131 286 372 e421 318 e731 1630 2140 1160 979 742 497 2 190 293 e383 420 319 736 2020 1950 1030 604 568 497 3 231 302 512 408 308 730 2350 1620 919 695 449 497 4 230 305 635 359 316 645 2600 1280 642 927 520 394 5 231 298 700 303 301 481 2840 1260 606 892 810 261 6 225 276 771 278 289 472 3040 1260 674 794 926 222 7 222 299 739 270 288 487 3110 1260 719 810 925 222 8 223 315 646 250 287 541 3150 1380 762 730 822 224 9 238 263 654 247 278 562 3150 1680 766 556 578 225 10 289 254 581 244 274 e570 3130 1820 738 548 331 172 11 298 255 524 247 277 571 3090 1960 710 576 328 99 12 326 256 515 244 267 570 3010 2070 713 588 331 69 13 316 256 520 246 273 563 2860 2090 713 593 314 69 14 320 251 527 244 271 561 2760 2120 714 516 416 69 15 322 244 532 267 270 611 2680 2190 711 414 382 71 16 322 242 522 306 270 665 2510 2200 709 337 295 71 17 336 252 526 366 278 662 2360 2040 599 567 116 71 18 331 282 519 437 276 648 2350 1820 458 716 61 71 19 296 265 519 485 290 618 2350 1680 428 552 54 71 20 253 255 517 487 329 603 2290 1600 376 441 41 71 21 254 258 525 486 480 521 2200 1450 386 442 438 72 22 242 258 515 456 640 468 2060 1310 529 531 678 72 23 206 258 e513 363 733 467 1700 1190 900 718 879 76 24 219 323 e510 318 738 466 1480 1200 1390 859 1050 72 25 286 375 e510 319 737 468 1320 1200 1830 902 1050 72 26 208 485 e476 316 e733 468 1310 1210 2050 867 928 72 27 183 740 e462 308 e733 470 1310 1330 1900 866 541 72 28 186 703 e463 309 e733 465 1320 1480 1590 863 290 72 29 204 681 e463 313 --- 711 1570 1350 1290 863 397 72 30 245 540 e452 318 --- 1150 2130 1220 1240 860 498 72 31 284 --- e422 319 --- 1230 --- 1210 --- 858 498 ---
TOTAL 7847 10070 16525 10354 11306 18911 69680 49570 27252 21464 16256 4667 MEAN 253.1 335.7 533.1 334.0 403.8 610.0 2323 1599 908.4 692.4 524.4 155.6 MAX 336 740 771 487 738 1230 3150 2200 2050 979 1050 497 MIN 131 242 372 244 267 465 1310 1190 376 337 41 69 AC-FT 15560 19970 32780 20540 22430 37510 138200 98320 54050 42570 32240 9260 CFSM 0.06 0.08 0.13 0.08 0.10 0.15 0.57 0.39 0.22 0.17 0.13 0.04 IN. 0.07 0.09 0.15 0.10 0.10 0.17 0.64 0.46 0.25 0.20 0.15 0.04

197 MINNESOTA RIVER BASIN--Continued
05301000 MINNESOTA RIVER NEAR LAC QUI PARLE, MN--Continued
STATISTICS OF MONTHLY MEAN DATA FOR WATER YEARS 1943 - 2002, BY WATER YEAR (WY)
OCT NOV DEC JAN FEB MAR APR MAY JUN JUL AUG SEP
MEAN 271.7 287.4 232.7 156.9 191.2 844.1 2759 1454 1174 986.0 532.5 266.8 MAX 2924 2327 1204 574 644 4599 14580 5837 4229 7024 6012 2402 (WY) 1987 1985 1985 1987 1999 1994 2001 2001 1984 1993 1993 1986 MIN 4.16 0.46 0.17 0.19 0.094 46.5 151 122 29.5 14.7 11.8 5.59 (WY) 1977 1977 1977 1977 1977 1956 1961 1959 1988 1988 1974 1967
SUMMARY STATISTICS FOR 2001 CALENDAR YEAR FOR 2002 WATER YEAR WATER YEARS 1943 - 2002 ANNUAL TOTAL 855486 263902 ANNUAL MEAN 2344 723.0 763.3 HIGHEST ANNUAL MEAN 2507 1986 LOWEST ANNUAL MEAN 75.7 1959 HIGHEST DAILY MEAN 29800 Apr 14 3150 Apr 8 29800 Apr 14 2001 LOWEST DAILY MEAN 104 Jan 3 41 Aug 20 0.00a Oct 19 1951 ANNUAL SEVEN-DAY MINIMUM 123 Jan 1 70 Sep 12 0.00 Oct 19 1951 MAXIMUM PEAK FLOW 3190 Apr 8 30100 Apr 14 2001 MAXIMUM PEAK STAGE 30.33 Apr 8 40.05 Apr 14 2001 INSTANTANEOUS LOW FLOW 4.1b Aug 18 0.00a Oct 19 1951 ANNUAL RUNOFF (AC-FT) 1697000 523400 553000 ANNUAL RUNOFF (CFSM) 0.58 0.18 0.19 ANNUAL RUNOFF (INCHES) 7.86 2.42 2.56 10 PERCENT EXCEEDS 5770 1750 1840 50 PERCENT EXCEEDS 392 510 232 90 PERCENT EXCEEDS 159 223 27 a Many days, several years. b Result of regulation. e Estimated.
O N D2001
J F M A M J J A S2002
10
20
50
100100
200
500
10001000
2000
5000
10,000
DAILY-MEAN DISCHARGE,
IN CUBIC FEET PER SECOND

198 MINNESOTA RIVER BASIN--Continued
05304500 CHIPPEWA RIVER NEAR MILAN, MN
LOCATION.--Lat 45°06’39", long 95°47’57", in NE1⁄4NE1⁄4 sec. 21, T.119 N., R.41 W., Chippewa County, Hydrologic Unit 07020005,
on right bank 20 ft downstream from bridge on State Highway 40, 2.0 mi upstream from small tributary, and 5.5 mi east of Milan.
DRAINAGE AREA.--1,880 mi2.
PERIOD OF RECORD.--March 1937 to current year.
REVISED RECORDS.--WSP 1145: Drainage area.
GAGE.--Water-stage recorder. Datum of gage is 959.69 ft above sea level (NGVD of 1929). Prior to June 15, 1942, nonrecording gage on bridge 800 ft downstream at same datum.
REMARKS.--Records good except those for estimated daily discharges, which are fair to poor. Flow may be influenced by regulation from several small lakes upstream from gage.
EXTREMES FOR CURRENT YEAR.--Peak discharges greater than base discharge of 600 ft3/s and maximum (*):
Discharge Gage height Discharge Gage height Date Time (ft3/s) (ft) Date Time (ft3/s) (ft)
Apr 5 0900 1,060 3.27 Jun 23 0400 *1,490 *4.00 Apr 17 2200 1,110 3.38 Aug 5 2200 740 2.77 May 13 1100 1,070 3.33
Minimum discharge, 99 ft3/s, Nov. 28, 29, gage height, 1.18 ft.
DISCHARGE, CUBIC FEET PER SECOND, WATER YEAR OCTOBER 2001 TO SEPTEMBER 2002 DAILY MEAN VALUES DAY OCT NOV DEC JAN FEB MAR APR MAY JUN JUL AUG SEP 1 189 194 e262 e158 e153 e191 e894 877 552 608 569 509 2 184 189 e285 e155 e152 e181 e853 848 533 539 571 494 3 180 185 e285 e155 e151 e173 847 823 514 529 592 477 4 175 183 e270 e154 e150 e165 881 781 505 502 667 450 5 169 186 e259 e153 e150 e160 920 754 483 471 720 422 6 166 199 e248 e153 e150 e158 819 735 458 407 730 381 7 166 188 e242 e152 e151 e157 681 720 442 361 713 353 8 168 179 e239 e157 e156 e155 742 774 426 362 707 332 9 170 178 e239 e161 e163 e154 779 904 417 370 697 313 10 174 187 e238 e167 e172 e152 822 992 409 351 697 303 11 173 186 e239 e169 e185 e150 903 985 411 340 679 304 12 176 186 e239 e173 e195 e159 948 1040 425 393 663 304 13 188 185 e237 e177 e201 e205 987 1060 437 387 628 299 14 188 186 e233 e179 e205 e254 988 1060 421 379 578 291 15 189 188 e232 e177 e208 e267 976 1040 393 360 547 281 16 185 187 e228 e173 e208 e263 963 1010 369 333 523 272 17 186 187 e225 e171 e209 e256 1050 958 354 311 500 265 18 191 186 e222 e171 e213 e249 1100 907 337 308 489 257 19 195 181 e220 e169 e218 e241 1060 861 333 294 464 248 20 190 204 e217 e166 e223 e233 1030 818 319 316 443 241 21 187 191 e213 e165 e232 e232 1000 783 420 339 476 231 22 186 192 e208 e162 e244 e231 997 755 1210 372 501 221 23 187 191 e202 e160 e240 e227 990 727 1430 380 528 213 24 185 208 e194 e157 e230 e224 958 701 1310 397 519 208 25 177 243 e189 e159 e220 e219 915 674 1230 431 502 207 26 186 273 e183 e160 e210 e229 874 658 1170 468 482 210 27 179 e160 e176 e161 e200 e242 851 641 1070 483 450 213 28 186 e109 e171 e160 e195 e265 870 628 963 494 430 213 29 193 e142 e168 e157 --- e385 904 614 840 540 428 215 30 190 e215 e164 e155 --- e780 909 609 713 569 447 216 31 191 --- e161 e154 --- e918 --- 588 --- 568 498 ---
TOTAL 5649 5668 6888 5040 5384 7875 27511 25325 18894 12962 17438 8943 MEAN 182 189 222 163 192 254 917 817 630 418 563 298 MAX 195 273 285 179 244 918 1100 1060 1430 608 730 509 MIN 166 109 161 152 150 150 681 588 319 294 428 207 AC-FT 11200 11240 13660 10000 10680 15620 54570 50230 37480 25710 34590 17740 CFSM 0.10 0.10 0.12 0.09 0.10 0.14 0.49 0.43 0.34 0.22 0.30 0.16 IN. 0.11 0.11 0.14 0.10 0.11 0.16 0.54 0.50 0.37 0.26 0.35 0.18

199 MINNESOTA RIVER BASIN--Continued
05304500 CHIPPEWA RIVER NEAR MILAN, MN--Continued
STATISTICS OF MONTHLY MEAN DATA FOR WATER YEARS 1938 - 2002, BY WATER YEAR (WY)
OCT NOV DEC JAN FEB MAR APR MAY JUN JUL AUG SEP
MEAN 235 201 127 74.8 79.1 405 1134 708 599 480 281 223 MAX 1996 1318 655 425 432 2141 6606 2462 2248 2507 2183 2273 (WY) 1985 1985 1985 1987 1998 1985 1997 1986 1984 1995 1993 1986 MIN 5.51 8.67 4.77 0.094 0.000 2.92 90.9 81.6 36.8 15.1 6.19 3.50 (WY) 1977 1977 1977 1940 1940 1965 1959 1939 1940 1940 1976 1976
SUMMARY STATISTICS FOR 2001 CALENDAR YEAR FOR 2002 WATER YEAR WATER YEARS 1938 - 2002 ANNUAL TOTAL 350185 147577 ANNUAL MEAN 959 404 379a HIGHEST ANNUAL MEAN 1307 1986 LOWEST ANNUAL MEAN 45.4 1940 HIGHEST DAILY MEAN 11500 Apr 10 1430 Jun 23 13400 Apr 6 1997 LOWEST DAILY MEAN 54 Jan 2 109 Nov 28 0.00b Jan 4 1940 ANNUAL SEVEN-DAY MINIMUM 56 Jan 1 151 Feb 1 0.00 Jan 4 1940 MAXIMUM PEAK FLOW 1490 Jun 23 14400 Apr 6 1997 MAXIMUM PEAK STAGE 4.54c Mar 30 18.03d Apr 6 1997 INSTANTANEOUS LOW FLOW 99f Nov 28 0.00b Jan 4 1940 ANNUAL RUNOFF (AC-FT) 694600 292700 274900 ANNUAL RUNOFF (CFSM) 0.51 0.22 0.20 ANNUAL RUNOFF (INCHES) 6.93 2.92 2.74 10 PERCENT EXCEEDS 2440 898 995 50 PERCENT EXCEEDS 216 257 149 90 PERCENT EXCEEDS 64 161 17 a Median of annual mean discharges is 322 ft3/s. b Many days in 1940. c Backwater from ice. d From highwater mark. e Estimated. f Measured flow, result of freezeup.
O N D2001
J F M A M J J A S2002
100
200
500
10001000
2000
5000
10,000
DAILY-MEAN DISCHARGE,
IN CUBIC FEET PER SECOND

200 MINNESOTA RIVER BASIN--Continued
05311000 MINNESOTA RIVER AT MONTEVIDEO, MN
LOCATION.--Lat 44°56’00", long 95°44’00", in NW1⁄4NW1⁄4 sec. 19, T.117 N., R.40 W., Yellow Medicine County, Hydrologic Unit
07020004, on right bank 20 ft upstream from bridge on U.S. Highway 212, at Montevideo, and 480 ft downstream from Chippewa River.
DRAINAGE AREA.--6,180 mi2 (approximately).
PERIOD OF RECORD.--July 1909 to September 1917, October 1917 to September 1929 (no winter records), October 1929 to current year. Prior to October 1939, published as "near Montevideo." Monthly discharge only for some periods, published in WSP 1308.
REVISED RECORDS.--WSP 1035: 1919(M). WSP 1085: 1935-36. WSP 1508: 1912, 1925(M), 1929(M), WDR MN-2000-1; 1995, 1996.
GAGE.--Water-stage recorder. Datum of gage is 909.12 ft above sea level (NGVD of 1929). July 22, 1909 to Feb. 4, 1932, nonrecording gage at bridge 600 ft downstream at present datum. Feb. 5, 1932 to Nov. 26, 1934, nonrecording gage at bridge 100 ft downstream at present datum.
REMARKS.--Records good except those for estimated daily discharges, which are fair to poor. Flow regulated by Big Stone Lake since Apr. 17, 1937, Lac qui Parle since Jan. 1938, and Marsh Lake since Nov. 1, 1939.
DISCHARGE, in CFS, WATER YEAR OCTOBER 2001 TO SEPTEMBER 2002 DAILY MEAN VALUES DAY OCT NOV DEC JAN FEB MAR APR MAY JUN JUL AUG SEP 1 265 360 450 e478 e416 e810 1800 2540 1500 1540 1020 715 2 256 361 422 e484 e416 e805 2210 2430 1360 1030 858 713 3 342 369 495 e470 e416 e797 2540 2210 1280 747 726 708 4 353 373 647 e410 e418 e728 2700 1790 957 1070 701 692 5 346 373 671 e360 e413 e628 2870 1680 846 1120 784 549 6 331 356 765 e328 e406 e529 3120 1670 877 954 952 453 7 321 347 763 e317 e402 e552 3390 1640 917 915 1240 434 8 321 386 694 e310 e392 e604 3520 1690 956 911 1290 430 9 324 346 726 e294 386 e628 3580 2000 971 717 1140 423 10 340 315 698 e293 370 e636 3590 2200 953 655 875 352 11 370 308 554 e292 369 e638 3600 2340 879 663 810 319 12 390 310 542 e292 362 e645 3580 2460 871 619 811 267 13 400 312 554 e292 360 652 3490 2500 878 687 802 251 14 395 310 564 e291 362 640 3350 2530 874 687 851 248 15 398 299 580 e305 362 636 3240 2590 887 567 844 245 16 398 294 581 e333 365 704 3120 2620 880 598 826 245 17 402 295 575 e390 371 720 2950 2570 854 450 704 239 18 406 308 582 e460 378 723 2840 2380 669 726 529 186 19 403 332 555 e507 384 695 2800 2200 628 632 479 177 20 346 310 e551 e512 410 682 2740 2120 591 496 494 201 21 331 304 e566 e510 452 639 2670 1940 585 467 965 202 22 329 305 e560 e488 640 575 2610 1760 668 481 1100 199 23 309 306 e553 e445 773 544 2310 1620 899 632 1160 197 24 268 333 e555 e426 808 538 2070 1530 1510 809 1350 198 25 317 436 e554 e411 775 536 1850 1520 2150 932 1360 194 26 333 404 e537 e409 e790 537 1790 1520 2430 898 1300 192 27 272 687 e516 e413 e800 542 1780 1550 2440 888 996 189 28 252 712 e516 e411 e810 569 1800 1730 2180 886 623 187 29 258 695 e518 e413 --- 743 1880 1730 1800 885 563 185 30 288 656 e504 e413 --- 1410 2360 1550 1680 886 697 178 31 341 --- e484 e414 --- 1540 --- 1510 --- 930 715 ---
TOTAL 10405 11502 17832 12171 13606 21625 82150 62120 34970 24478 27565 9768 MEAN 335.6 383.4 575.2 392.6 485.9 697.6 2738 2004 1166 789.6 889.2 325.6 MAX 406 712 765 512 810 1540 3600 2620 2440 1540 1360 715 MIN 252 294 422 291 360 529 1780 1510 585 450 479 177 AC-FT 20640 22810 35370 24140 26990 42890 162900 123200 69360 48550 54680 19370 CFSM 0.05 0.06 0.09 0.06 0.08 0.11 0.44 0.32 0.19 0.13 0.14 0.05 IN. 0.06 0.07 0.11 0.07 0.08 0.13 0.49 0.37 0.21 0.15 0.17 0.06

201 MINNESOTA RIVER BASIN--Continued
05311000 MINNESOTA RIVER AT MONTEVIDEO, MN--Continued
STATISTICS OF MONTHLY MEAN DATA FOR WATER YEARS 1909 - 2002, BY WATER YEAR (WY)
OCT NOV DEC JAN FEB MAR APR MAY JUN JUL AUG SEP
MEAN 361.6 384.3 285.2 182.0 209.8 944.5 2953 1659 1345 1148 593.1 343.9 MAX 3675 3797 1572 760 864 5363 22320 7315 5088 7853 7084 2613 (WY) 1996 1996 1996 1987 1998 1994 1997 1986 1984 1993 1993 1986 MIN 0.76 1.61 2.35 1.57 1.06 5.06 7.82 3.13 1.40 1.89 0.60 0.57 (WY) 1934 1935 1935 1934 1937 1934 1934 1934 1934 1933 1933 1933
SUMMARY STATISTICS FOR 2001 CALENDAR YEAR FOR 2002 WATER YEAR WATER YEARS 1909 - 2002 ANNUAL TOTAL 993494 328192 ANNUAL MEAN 2722 899.2 915.4a HIGHEST ANNUAL MEAN 3166 1997 LOWEST ANNUAL MEAN 4.43 1934 HIGHEST DAILY MEAN 33700 Apr 14 3600 Apr 11 46800 Apr 7 1997 LOWEST DAILY MEAN 142 Jan 1 177 Sep 19 0.00b Aug 14 1933 ANNUAL SEVEN-DAY MINIMUM 151 Feb 16 189 Sep 24 0.00 Jul 5 1934 MAXIMUM PEAK FLOW 3650 Apr 11 47500 Apr 6 1997 MAXIMUM PEAK STAGE 11.44 Apr 11 23.90 Apr 6 1997 INSTANTANEOUS LOW FLOW 174c Sep 19 0.00b Aug 14 1933 ANNUAL RUNOFF (AC-FT) 1971000 651000 663100 ANNUAL RUNOFF (CFSM) 0.44 0.15 0.15 ANNUAL RUNOFF (INCHES) 5.98 1.98 2.01 10 PERCENT EXCEEDS 7760 2200 2330 50 PERCENT EXCEEDS 465 623 277 90 PERCENT EXCEEDS 191 305 34 a Median of annual mean discharges is 672 ft3/s. b Many days in 1933, 34, and 36. c Due in part to regulation. e Estimated.
O N D2001
J F M A M J J A S2002
100
200
500
10001000
2000
5000
10,000
DAILY-MEAN DISCHARGE,
IN CUBIC FEET PER SECOND

202 MINNESOTA RIVER BASIN--Continued
05313500 YELLOW MEDICINE RIVER NEAR GRANITE FALLS, MN
LOCATION.--Lat 44°43’18", long 95°31’07", in NW1⁄4SW1⁄4 sec. 35, T.115 N., R.39 W., Yellow Medicine County, Hydrologic Unit
07020004, on right bank 50 ft downstream from highway bridge, 6 mi upstream from mouth, and 8 mi south of town of Granite Falls.
DRAINAGE AREA.--664 mi2.
PERIOD OF RECORD.--March 1931 to September 1935 (no winter records), October 1935 to September 1938, October 1939 to current year. Monthly discharge only for some periods, published in WSP 1308.
REVISED RECORDS.--WSP 1508: 1931, 1934(M), 1937(M), 1946(M), 1950(M).
GAGE.--Water-stage recorder. Datum of gage is 960.64 ft above sea level (NGVD of 1929). Mar. 16, 1931 to June 13, 1938, nonrecording gage, on bridge 50 ft upstream at present datum. Oct. 12, 1939 to Nov. 30, 1952, nonrecording gage 500 ft downstream at present datum.
REMARKS.--Records good except those for estimated daily discharges, which are fair to poor.
EXTREMES OUTSIDE PERIOD OF RECORD.--Flood in June 1919 reached a stage of 17.5 ft, from information by local residents, discharge, 25,200 ft3/s.
EXTREMES FOR CURRENT YEAR.--Peak discharges greater than base discharge of 260 ft3/s and maximum (*):
Discharge Gage height Discharge Gage height Date Time (ft3/s) (ft) Date Time (ft3/s) (ft)
Apr 3 1700 *1,460 *5.65 May 11 0100 1,170 5.06 May 1 0200 571 4.07 Jun 23 1900 622 4.17
Minimum discharge, 6.1 ft3/s, Oct. 7, 8, 9, gage height, 2.31 ft.
DISCHARGE, CUBIC FEET PER SECOND, WATER YEAR OCTOBER 2001 TO SEPTEMBER 2002 DAILY MEAN VALUES DAY OCT NOV DEC JAN FEB MAR APR MAY JUN JUL AUG SEP 1 7.9 13 e45 e52 e41 e59 e830 562 237 106 12 27 2 8.0 13 e44 e51 e40 e56 e1140 506 235 89 11 26 3 8.0 13 e44 e52 e39 e53 e1310 450 228 78 12 27 4 7.5 14 e46 e53 e38 e49 e1240 402 227 71 17 24 5 7.3 13 e49 e54 e38 e46 e1140 356 222 99 17 22 6 6.7 13 e51 e53 e39 e43 e1060 322 211 80 24 21 7 6.4 13 e54 e54 e39 e42 e952 298 198 65 34 19 8 6.3 13 e56 e55 e38 e40 865 303 182 55 28 18 9 6.9 13 e59 e60 e38 e39 887 452 174 49 29 17 10 8.0 16 e63 e63 e37 e38 796 1010 164 44 33 16 11 7.2 18 e65 e66 e38 e37 704 1100 152 43 25 14 12 9.4 18 e64 e68 e39 e37 679 901 139 42 25 12 13 11 20 e63 e68 e40 e37 691 870 127 46 20 12 14 12 18 e61 e68 e42 e37 672 897 117 47 18 11 15 11 16 e55 e68 e44 e37 640 778 112 41 15 10 16 11 13 e64 e68 e47 e37 627 658 104 35 14 9.4 17 13 14 e70 e65 e51 e36 583 568 97 30 13 8.5 18 13 23 e74 e63 60 e36 599 501 90 28 12 7.7 19 12 20 e73 e63 67 e36 621 451 85 24 10 7.1 20 13 17 e69 e60 76 e36 547 411 80 23 11 7.0 21 11 14 e66 e58 83 e35 480 374 84 21 27 6.8 22 12 13 e61 e57 88 e34 442 343 138 19 27 6.5 23 12 13 e54 e57 84 e34 437 317 532 16 26 6.8 24 12 25 e44 e54 e77 e34 437 295 520 15 54 6.4 25 12 37 e42 e54 e68 e35 423 277 380 18 51 6.7 26 12 e42 e48 e55 e64 e36 383 261 279 17 48 7.1 27 12 e47 e50 e52 e61 e40 347 250 221 17 42 7.1 28 14 e43 e52 e49 e63 e72 340 242 179 15 37 6.9 29 13 e47 e52 e45 --- e134 410 242 149 13 33 7.3 30 24 e47 e51 e44 --- e268 525 239 124 13 44 9.1 31 14 --- e51 e42 --- e521 --- 234 --- 12 33 ---
TOTAL 333.6 639 1740 1771 1479 2074 20807 14870 5787 1271 802 386.4 MEAN 10.8 21.3 56.1 57.1 52.8 66.9 694 480 193 41.0 25.9 12.9 MAX 24 47 74 68 88 521 1310 1100 532 106 54 27 MIN 6.3 13 42 42 37 34 340 234 80 12 10 6.4 AC-FT 662 1270 3450 3510 2930 4110 41270 29490 11480 2520 1590 766 CFSM 0.02 0.03 0.08 0.09 0.08 0.10 1.04 0.72 0.29 0.06 0.04 0.02 IN. 0.02 0.04 0.10 0.10 0.08 0.12 1.17 0.83 0.32 0.07 0.04 0.02

203 MINNESOTA RIVER BASIN--Continued
05313500 YELLOW MEDICINE RIVER NEAR GRANITE FALLS, MN--Continued
STATISTICS OF MONTHLY MEAN DATA FOR WATER YEARS 1931 - 2002, BY WATER YEAR (WY)
OCT NOV DEC JAN FEB MAR APR MAY JUN JUL AUG SEP
MEAN 42.3 45.9 29.7 14.4 19.6 218 526 211 275 139 67.6 41.2 MAX 561 392 256 88.3 149 933 3302 1087 2484 1600 510 1005 (WY) 1996 1996 1996 1996 1998 1986 1969 1944 1984 1993 1953 1986 MIN 1.41 1.60 1.39 0.90 0.13 3.67 2.58 1.18 1.18 0.34 0.38 0.47 (WY) 1937 1938 1936 1948 1959 1975 1934 1934 1934 1933 1934 1976
SUMMARY STATISTICS FOR 2001 CALENDAR YEAR FOR 2002 WATER YEAR WATER YEARS 1931 - 2002 ANNUAL TOTAL 107040.1 51960.0 ANNUAL MEAN 293 142 144a HIGHEST ANNUAL MEAN 566 1993 LOWEST ANNUAL MEAN 8.32 1959 HIGHEST DAILY MEAN 3800 Apr 26 1310 Apr 3 16400 Apr 10 1969 LOWEST DAILY MEAN 3.8 Jan 3 6.3 Oct 8 0.00b Jul 26 1931 ANNUAL SEVEN-DAY MINIMUM 4.0 Jan 1 6.8 Sep 19 0.00 Jan 21 1948 MAXIMUM PEAK FLOW 1460c Apr 3 17200 Apr 10 1969 MAXIMUM PEAK STAGE 5.65d Apr 3 14.90 Apr 10 1969 INSTANTANEOUS LOW FLOW 6.1 Oct 7 0.00b Jul 26 1931 ANNUAL RUNOFF (AC-FT) 212300 103100 104500 ANNUAL RUNOFF (CFSM) 0.44 0.21 0.22 ANNUAL RUNOFF (INCHES) 6.00 2.91 2.95 10 PERCENT EXCEEDS 772 463 335 50 PERCENT EXCEEDS 22 46 22 90 PERCENT EXCEEDS 4.4 12 2.7 a Median of annual mean discharges is 93.2 ft3/s. b Many days, several years. c Measurement of flow. d Backwater from ice. e Estimated
O N D2001
J F M A M J J A S2002
1
2
5
1010
20
50
100100
200
500
10001000
2000
5000
10,000
DAILY-MEAN DISCHARGE,
IN CUBIC FEET PER SECOND

204 MINNESOTA RIVER BASIN--Continued
05315000 REDWOOD RIVER NEAR MARSHALL, MN
LOCATION.--Lat 44°25’49", long 95°50’43", in SW1⁄4SE1⁄4 sec. 12, T.111 N., R.42 W., Lyon County, Hydrologic Unit 07020006, on
right bank 1.7 mi upstream from Redwood River diversion structure on southwest edge of town of Marshall, MN. Prior to Apr. 10, 1980, at site 5 mi downstream.
DRAINAGE AREA.--259 mi2.
PERIOD OF RECORD.--March 1940 to current year. Monthly discharge only for some periods, published in WSP 1308.
REVISED RECORDS.--WDR MN-89-2: Drainage area.
GAGE.--Water-stage recorder. Datum of gage is 1,188.23 ft above sea level (NGVD of 1929). March 1940 to April 9, 1980, nonrecording gage 5.0 mi downstream from present site at datum 43.35 ft lower (crest-stage gage added June 12, 1968). From March 1964 to April 1980, nonrecording gage and crest-stage gage on diversion channel 1.5 mi downstream at datum 1,100.00 ft above sea level.
REMARKS.--Records fair except those for estimated daily discharge, which are fair to poor. Water diverted at medium and high stages into diversion channel 3.4 mi below station. Diversion began Mar. 18, 1964. Unknown amount of natural diversion into Cottonwood River basin occurs at extremely high stages 0.8 mi below station.
DISCHARGE, CUBIC FEET PER SECOND, WATER YEAR OCTOBER 2001 TO SEPTEMBER 2002 DAILY MEAN VALUES DAY OCT NOV DEC JAN FEB MAR APR MAY JUN JUL AUG SEP 1 8.3 10 32 e38 e25 e33 e372 226 107 97 10 25 2 7.9 11 34 e37 e25 e31 e360 206 105 87 8.4 24 3 7.9 11 33 e36 e24 e30 306 189 275 82 9.4 21 4 8.1 11 34 e35 e24 e30 279 177 326 74 13 18 5 8.0 11 40 e34 e24 e28 260 165 278 67 11 17 6 7.9 11 51 e34 e25 e28 247 158 224 61 21 16 7 8.1 11 e51 e33 e28 e27 254 155 189 54 26 13 8 8.3 11 e51 e33 e30 e27 231 217 167 47 28 11 9 8.9 10 e49 e33 e31 e27 209 307 156 42 40 10 10 9.9 11 e48 e35 e31 e27 196 277 146 38 42 12 11 9.3 10 e48 e36 e31 e27 200 264 138 38 33 8.4 12 10 11 e47 e36 e31 e30 217 316 126 32 32 7.4 13 11 11 e47 e36 e30 e36 210 321 118 28 28 7.6 14 11 11 e47 e36 e30 e41 213 299 111 26 25 8.3 15 11 11 e48 e35 e30 e41 205 283 101 23 24 7.4 16 11 11 e50 e33 e30 e40 196 268 93 21 22 6.9 17 11 12 e52 e33 e31 e40 214 255 85 18 23 6.4 18 11 12 e52 e32 e35 e44 223 243 78 17 20 5.6 19 11 13 e50 e32 40 e43 201 232 74 16 19 5.6 20 11 13 e48 e31 43 e43 184 217 73 15 17 5.4 21 11 13 e47 e31 43 e42 182 204 172 13 49 4.4 22 11 13 e46 e31 38 e41 181 189 364 13 62 4.0 23 11 13 e45 e30 44 e41 188 182 310 12 58 4.8 24 9.9 38 e44 e31 e42 e40 186 163 247 11 55 5.1 25 9.6 67 e43 e31 e40 e39 168 152 192 11 48 5.8 26 9.9 45 e43 e30 e38 e38 148 143 159 9.2 41 7.6 27 11 29 e42 e28 e37 e43 150 138 140 8.7 37 7.3 28 11 38 e42 e28 e34 e93 192 129 128 11 34 7.7 29 10 32 e41 e27 --- e186 252 123 116 15 32 9.3 30 10 31 e41 e26 --- e294 252 122 106 17 29 9.3 31 10 --- e40 e26 --- e354 --- 115 --- 13 27 ---
TOTAL 305.0 542 1386 1007 914 1884 6676 6435 4904 1016.9 923.8 301.3 MEAN 9.84 18.1 44.7 32.5 32.6 60.8 223 208 163 32.8 29.8 10.0 MAX 11 67 52 38 44 354 372 321 364 97 62 25 MIN 7.9 10 32 26 24 27 148 115 73 8.7 8.4 4.0 AC-FT 605 1080 2750 2000 1810 3740 13240 12760 9730 2020 1830 598 CFSM 0.04 0.07 0.17 0.13 0.13 0.23 0.86 0.80 0.63 0.13 0.12 0.04 IN. 0.04 0.08 0.20 0.14 0.13 0.27 0.96 0.92 0.70 0.15 0.13 0.04

205 MINNESOTA RIVER BASIN--Continued
05315000 REDWOOD RIVER NEAR MARSHALL, MN--Continued
STATISTICS OF MONTHLY MEAN DATA FOR WATER YEARS 1940 - 2002, BY WATER YEAR (WY)
OCT NOV DEC JAN FEB MAR APR MAY JUN JUL AUG SEP
MEAN 27.4 27.5 16.3 9.28 16.4 121 245 128 121 70.1 34.1 25.3 MAX 310 202 115 59.4 101 571 1252 1205 936 1161 610 292 (WY) 1996 1996 1999 1994 1983 1983 2001 1993 1993 1993 1993 1986 MIN 0.029 0.58 0.87 0.000 0.090 2.70 7.36 3.90 0.83 0.058 0.042 0.007 (WY) 1977 1977 1977 1977 1979 1965 1990 1981 1976 1976 1941 1941
SUMMARY STATISTICS FOR 2001 CALENDAR YEAR FOR 2002 WATER YEAR WATER YEARS 1940 - 2002 ANNUAL TOTAL 65357.1 26295.0 ANNUAL MEAN 179 72.0 70.7a HIGHEST ANNUAL MEAN 421 1993 LOWEST ANNUAL MEAN 5.13 1981 HIGHEST DAILY MEAN 3670 Apr 24 372 Apr 1 5300 May 9 1993 LOWEST DAILY MEAN 7.1 Feb 27 4.0 Sep 22 0.00b Jul 28 1940 ANNUAL SEVEN-DAY MINIMUM 7.4 Jan 1 5.0 Sep 18 0.00 Jul 28 1940 MAXIMUM PEAK FLOW 392 Jun 21 6380 May 9 1993 MAXIMUM PEAK STAGE 12.71c Mar 30 17.00 May 9 1993 INSTANTANEOUS LOW FLOW 3.2 Sep 23 0.00b Jul 28 1940 ANNUAL RUNOFF (AC-FT) 129600 52160 51220 ANNUAL RUNOFF (CFSM) 0.69 0.28 0.27 ANNUAL RUNOFF (INCHES) 9.39 3.78 3.71 10 PERCENT EXCEEDS 489 213 168 50 PERCENT EXCEEDS 21 34 13 90 PERCENT EXCEEDS 8.2 9.9 2.0 a Median of annual mean discharges is 45.0 ft3/s. b Many days, several years. c Backwater from ice. e Estimated.
O N D2001
J F M A M J J A S2002
1
2
5
1010
20
50
100100
200
500
1000
DAILY-MEAN DISCHARGE,
IN CUBIC FEET PER SECOND

206 MINNESOTA RIVER BASIN--Continued
05316500 REDWOOD RIVER NEAR REDWOOD FALLS, MN
LOCATION.--Lat 44°31’25’, long 95°10’20", in SE1⁄4NE1⁄4 sec. 9, T.112 N., R.36 W., Redwood County, Hydrologic Unit 07020006, on
right bank 4 ft upstream from highway bridge, 3 mi west of town of Redwood Falls, and 8.5 mi upstream from mouth.
DRAINAGE AREA.--629 mi2.
PERIOD OF RECORD.--July 1909 to September 1914 (no winter records except 1911-12). August 1930 to September 1935 (no winter records), October 1935 to current year.
REVISED RECORDS.--WDR MN-89-2: Drainage area.
GAGE.--Water-stage recorder. Datum of gage is 972.33 ft above sea level (NGVD of 1929). July 1909 to September 1914, nonrecording gage at bridge 20 ft downstream at datum 0.22 ft lower. August 1930 to Oct. 25, 1949, nonrecording gage, at bridge 20 ft downstream at present datum.
REMARKS.--Records good except those for estimated daily discharges, which are fair to poor. Natural discharge affected by unknown amount of interbasin flow between Yellow Medicine, Redwood, and Cottonwood River basins during extreme floods.
EXTREMES FOR CURRENT YEAR.--Peak discharges greater than base discharge of 400 ft3/s and maximum (*):
Discharge Gage height Discharge Gage height Date Time (ft3/s) (ft) Date Time (ft3/s) (ft)
Apr 1 1700 1,100a -- Jun 5 0200 855 3.89 Apr 30 1800 705 3.64 Jun 22 1400 *1,610 *5.52 May 9 1800 1,030 4.27 Jul 3 1100 1,410 5.14
Minimum discharge, 21 ft3/s, Sept. 24, 25, gage height, 1.64 ft.
DISCHARGE, CUBIC FEET PER SECOND, WATER YEAR OCTOBER 2001 TO SEPTEMBER 2002 DAILY MEAN VALUES DAY OCT NOV DEC JAN FEB MAR APR MAY JUN JUL AUG SEP 1 28 34 145 e128 e93 e73 e1110 693 281 285 59 69 2 26 33 140 e124 e91 e72 1090 624 273 253 50 65 3 26 30 e142 e120 e88 e71 1010 539 438 643 49 59 4 25 30 144 e114 e86 e70 903 465 817 429 68 55 5 25 30 150 e109 e84 e69 736 405 823 292 86 52 6 23 30 175 e106 e83 e69 667 470 691 238 74 49 7 24 31 209 e105 e85 e69 634 412 565 204 96 46 8 24 26 e208 e106 e88 e69 617 553 469 175 103 43 9 24 26 e196 e107 e92 e68 589 972 405 155 85 40 10 26 29 e189 e111 e93 e68 549 1000 366 139 84 36 11 29 29 e179 e113 e93 e69 539 994 337 141 98 36 12 27 28 e179 e114 e93 e87 607 1010 312 198 96 42 13 30 30 e179 e115 e92 e103 657 1000 293 148 91 36 14 29 33 e181 e115 e90 e101 680 982 277 120 80 35 15 33 41 e184 e113 e90 e95 671 945 261 106 71 33 16 34 34 e190 e110 e90 e90 621 869 244 94 66 31 17 34 32 e201 e108 e93 e93 572 765 231 84 75 29 18 34 33 e208 e106 e94 e91 563 682 220 77 66 28 19 34 31 e210 e105 e95 e88 562 615 208 72 61 27 20 33 30 e210 e105 e96 e85 507 556 199 69 55 26 21 32 31 e204 e105 e95 e82 447 505 529 64 233 26 22 31 33 e192 e106 e93 e79 446 466 1510 59 288 25 23 31 33 e187 e106 e85 e78 465 434 1390 56 230 24 24 32 51 e181 e104 e85 e77 474 389 1150 53 186 24 25 32 168 e173 e110 e81 e75 439 364 967 69 155 23 26 30 293 e164 e112 e76 e82 380 347 767 62 129 26 27 27 241 e156 e112 e76 e118 349 333 593 55 111 26 28 28 138 e149 e109 e75 e235 393 321 476 62 99 28 29 28 161 e143 e104 --- e436 579 312 384 115 91 31 30 30 163 e136 e99 --- e718 690 308 327 84 81 28 31 33 --- e133 e95 --- e1030 --- 293 --- 67 74 ---
TOTAL 902 1932 5437 3396 2475 4610 18546 18623 15803 4668 3190 1098 MEAN 29.1 64.4 175 110 88.4 149 618 601 527 151 103 36.6 MAX 34 293 210 128 96 1030 1110 1010 1510 643 288 69 MIN 23 26 133 95 75 68 349 293 199 53 49 23 AC-FT 1790 3830 10780 6740 4910 9140 36790 36940 31350 9260 6330 2180 CFSM 0.05 0.10 0.28 0.17 0.14 0.24 0.98 0.96 0.84 0.24 0.16 0.06 IN. 0.05 0.11 0.32 0.20 0.15 0.27 1.10 1.10 0.93 0.28 0.19 0.06

207 MINNESOTA RIVER BASIN--Continued
05316500 REDWOOD RIVER NEAR REDWOOD FALLS, MN--Continued
STATISTICS OF MONTHLY MEAN DATA FOR WATER YEARS 1909 - 2002, BY WATER YEAR (WY)
OCT NOV DEC JAN FEB MAR APR MAY JUN JUL AUG SEP
MEAN 55.8 60.9 38.8 18.9 24.5 237 466 235 264 152 78.5 50.7 MAX 509 541 245 110 167 1289 2880 1530 2724 1994 934 673 (WY) 1996 1980 1983 2002 1983 1983 1969 1993 1993 1993 1993 1986 MIN 0.84 0.96 0.46 0.19 0.20 1.54 14.6 2.75 1.01 0.44 0.51 0.31 (WY) 1937 1936 1936 1940 1937 1965 1934 1934 1934 1934 1934 1976
SUMMARY STATISTICS FOR 2001 CALENDAR YEAR FOR 2002 WATER YEAR WATER YEARS 1909 - 2002 ANNUAL TOTAL 139928 80680 ANNUAL MEAN 383 221 154b HIGHEST ANNUAL MEAN 789 1993 LOWEST ANNUAL MEAN 10.8 1959 HIGHEST DAILY MEAN 5620 Apr 25 1510 Jun 22 13200 Apr 9 1969 LOWEST DAILY MEAN 14 Jan 3 23 Oct 6, Sep 25 0.00c Jan 17 1940 ANNUAL SEVEN-DAY MINIMUM 16 Jan 1 24 Oct 3 0.01 Jan 25 1940 MAXIMUM PEAK FLOW 1610 Jun 22 19700 Jun 18 1957 MAXIMUM PEAK STAGE 8.30d Mar 31 18.01d Mar 29 1997 INSTANTANEOUS LOW FLOW 21 Sep 24 0.00c Jan 17 1940 ANNUAL RUNOFF (AC-FT) 277500 160000 111700 ANNUAL RUNOFF (CFSM) 0.61 0.35 0.25 ANNUAL RUNOFF (INCHES) 8.28 4.77 3.33 10 PERCENT EXCEEDS 1090 616 366 50 PERCENT EXCEEDS 67 105 34 90 PERCENT EXCEEDS 18 30 2.8 a Estimated daily, backwater from ice. b Median of annual mean discharges is 100 ft3/s. c Many days in 1940 and 1959. d Backwater from ice. e Estimated.
O N D2001
J F M A M J J A S2002
10
20
50
100100
200
500
10001000
2000
5000
10,000
DAILY-MEAN DISCHARGE,
IN CUBIC FEET PER SECOND

208 MINNESOTA RIVER BASIN--Continued
05316580 MINNESOTA RIVER AT MORTON, MN
LOCATION.--Lat 44°32’46’, long 94°59’46", in NE1⁄4SE1⁄4 sec. 36, T.113 N., R.35 W., Redwood County, Hydrologic Unit 07020007, on
right bank 10 ft downstream from highway bridge, 1⁄2 mi southwest of town of Morton, and 203 mi upstream from mouth.
DRAINAGE AREA.--8,970 mi2.
PERIOD OF RECORD.--October 2000 to current year.
GAGE.--Water-stage recorder.
REMARKS.--Records good except those for estimated daily discharges, which are fair to poor. Some regulation from Big Stone Lake, Marsh Lake, and Lac qui Parle.
DISCHARGE, in CFS, WATER YEAR OCTOBER 2001 TO SEPTEMBER 2002 DAILY MEAN VALUES DAY OCT NOV DEC JAN FEB MAR APR MAY JUN JUL AUG SEP 1 381 393 1030 e680 e721 e1060 e3990 4260 e2720 e3550 e1070 e1330 2 446 425 941 e640 e724 e1080 e4580 e4510 e2580 e3100 e1080 e1300 3 295 448 829 e630 e721 e1080 4910 e4360 e2580 e2730 e1070 e1200 4 304 450 788 e625 e721 e1080 5160 e4010 e2580 e1950 e1010 e1150 5 359 460 857 e620 e714 e1070 5240 e3500 e2470 e2110 e943 e1110 6 390 469 1010 e610 e717 e1050 5300 e3230 e2150 e1980 e948 e1030 7 384 469 e1050 e600 e716 e983 5480 e3120 e1940 e1700 e1040 e946 8 377 460 e1090 e600 e716 e937 5730 3240 e1860 e1560 e1260 e849 9 375 442 e1090 e580 e716 e912 5970 e3900 e1800 e1530 e1430 e814 10 380 455 e1090 e590 e723 e890 6140 e4470 e1770 e1300 e1370 e810 11 387 443 e1090 e590 e726 e886 6310 5160 e1840 e1260 e1210 e803 12 392 419 e1060 e590 e726 e884 6430 5550 e1720 e1210 e1100 e732 13 434 425 1050 e590 e723 e896 6570 e5610 e1620 e1170 e1080 e724 14 477 427 1040 e590 e723 e911 6660 e5590 e1560 e1180 e1010 e651 15 501 423 1050 e600 e723 e923 6520 e5530 e1530 e1080 e987 e628 16 499 426 1000 e600 e729 e929 6150 e5320 e1500 e1040 e1010 e601 17 495 415 1060 e610 e735 e934 5770 e5080 e1460 e1000 e1020 e594 18 552 400 1160 e608 e738 e952 5490 e4780 e1430 e960 e939 e612 19 560 394 e1120 e625 e763 e993 5270 e4440 e1360 e926 e830 e595 20 497 407 e1070 e650 e811 e999 5060 e4090 e1360 e889 e751 e552 21 488 422 e1020 e696 e889 e993 4810 e3770 e1730 e860 1030 e496 22 457 416 e919 e745 e986 e973 4640 e3510 e2470 e846 2130 e476 23 421 410 e839 e804 e1040 e951 4530 e3270 e3120 e840 e3060 e453 24 347 488 e781 e810 e1040 e930 e4330 e3020 e3800 e855 e2820 e443 25 409 657 e783 e802 e1020 e928 3940 e2810 e4490 e938 e2520 e447 26 386 893 e785 e771 e1000 e936 3570 e2720 e4980 e1100 e2320 e458 27 391 982 e781 e744 e1000 e1010 3350 e2680 5220 e1130 e2140 e468 28 416 901 e770 e747 e1010 e1200 3370 e2630 e5200 e1120 e1880 e473 29 387 1020 e750 e727 --- e1790 e3460 e2760 e4980 e1170 e1510 e478 30 366 1070 e710 e717 --- e2790 e3790 2830 e4320 e1160 e1180 e492 31 366 --- e680 e715 --- e3440 --- 2790 --- e1130 e1200 ---
TOTAL 12919 15909 29293 20506 22571 35390 152520 122540 78140 43374 42948 21715 MEAN 416.7 530.3 944.9 661.5 806.1 1142 5084 3953 2605 1399 1385 723.8 MAX 560 1070 1160 810 1040 3440 6660 5610 5220 3550 3060 1330 MIN 295 393 680 580 714 884 3350 2630 1360 840 751 443 AC-FT 25620 31560 58100 40670 44770 70200 302500 243100 155000 86030 85190 43070 CFSM 0.05 0.06 0.11 0.07 0.09 0.13 0.57 0.44 0.29 0.16 0.15 0.08 IN. 0.05 0.07 0.12 0.09 0.09 0.15 0.63 0.51 0.32 0.18 0.18 0.09

209 MINNESOTA RIVER BASIN--Continued
05316580 MINNESOTA RIVER AT MORTON, MN--Continued
STATISTICS OF MONTHLY MEAN DATA FOR WATER YEARS 2001 - 2002, BY WATER YEAR (WY)
OCT NOV DEC JAN FEB MAR APR MAY JUN JUL AUG SEP
MEAN 257.5 489.7 610.3 449.5 532.1 848.3 15900 7864 4327 2376 1179 577.2 MAX 417 530 945 661 806 1142 26720 11780 6049 3354 1385 724 (WY) 2002 2002 2002 2002 2002 2002 2001 2001 2001 2001 2002 2002 MIN 98.2 449 276 237 258 555 5084 3953 2605 1399 973 431 (WY) 2001 2001 2001 2001 2001 2001 2002 2002 2002 2002 2001 2001
SUMMARY STATISTICS FOR 2001 CALENDAR YEAR FOR 2002 WATER YEAR WATER YEARS 2001 - 2002 ANNUAL TOTAL 1585182 597825 ANNUAL MEAN 4343 1638 2945 HIGHEST ANNUAL MEAN 4252 2001 LOWEST ANNUAL MEAN 1638 2002 HIGHEST DAILY MEAN 45400 Apr 15 6660 Apr 14 45400 Apr 15 2001 LOWEST DAILY MEAN 194 Jan 1 295a Oct 3 81a Oct 6 2000 ANNUAL SEVEN-DAY MINIMUM 201 Feb 19 355 Oct 3 86 Oct 5 2000 MAXIMUM PEAK FLOW 6740 Apr 14 45400 Apr 15 2001 MAXIMUM PEAK STAGE 18.73 Apr 14 29.26b Apr 16 2001 INSTANTANEOUS LOW FLOW 271a Oct 3 80a Oct 6 2000 ANNUAL RUNOFF (AC-FT) 3144000 1186000 2134000 ANNUAL RUNOFF (CFSM) 0.48 0.18 0.33 ANNUAL RUNOFF (INCHES) 6.57 2.48 4.46 10 PERCENT EXCEEDS 13400 4480 6030 50 PERCENT EXCEEDS 665 993 830 90 PERCENT EXCEEDS 251 443 231 a Due in part to regulation. b Maximum recorded, peak stage was less than 30.0 feet. e Estimated.
O N D2001
J F M A M J J A S2002
100
200
500
10001000
2000
5000
10,000
DAILY-MEAN DISCHARGE,
IN CUBIC FEET PER SECOND

210 MINNESOTA RIVER BASIN--Continued
05317000 COTTONWOOD RIVER NEAR NEW ULM, MN
LOCATION.--Lat 44°17’29", long 94°26’24", in SW1⁄4NE1⁄4 sec. 33, T.110 N., R.30 W., Brown County, Hydrologic Unit 07020008, on
left bank 600 ft upstream from highway bridge, 1.8 mi south of New Ulm, and 3.2 mi upstream from mouth.
DRAINAGE AREA.--1,300 mi2.
PERIOD OF RECORD.--July 1909 to December 1913, March 1931 to March 1938, August 1938 to current year (winter records incomplete prior to 1936).
REVISED RECORDS.--WSP 355: 1912.
GAGE.--Water-stage recorder. Datum of gage is 796.83 ft above sea level (NGVD of 1929). July 1, 1909 to Dec. 13, 1913, nonrecording gage at site 2.7 mi upstream at different datum. Mar. 15, 1931 to Mar. 31, 1938, nonrecording gage 2.2 mi upstream at datum 11.41 ft higher. Aug. 23, 1938 to June 25, 1948, nonrecording gage at present site and datum.
REMARKS.--Records good except those for estimated daily discharges, which are fair to poor.
EXTREMES FOR CURRENT YEAR.--Peak discharges greater than base discharge of 1,100 ft3/s and maximum (*):
Discharge Gage height Discharge Gage height Date Time (ft3/s) (ft) Date Time (ft3/s) (ft)
Mar 31 (daily) e1,400 -- Jun 4 0700 *5,390 *11.95 May 9 2300 1,780 7.79 Jun 23 0900 2,830 9.36
Minimum discharge, 52 ft3/s, Oct. 7, gage height, 2.90 ft.
DISCHARGE, CUBIC FEET PER SECOND, WATER YEAR OCTOBER 2001 TO SEPTEMBER 2002 DAILY MEAN VALUES DAY OCT NOV DEC JAN FEB MAR APR MAY JUN JUL AUG SEP 1 74 61 327 e175 e173 e230 1320 956 708 878 200 209 2 69 63 324 e175 e170 e225 1200 967 706 750 174 189 3 66 60 278 e176 e170 e220 1160 898 2050 652 151 171 4 61 59 324 e178 e171 e217 998 812 5050 582 142 156 5 58 59 366 e180 e173 e213 846 743 4120 537 139 142 6 54 58 495 e182 e178 e212 739 687 3110 487 155 131 7 53 60 648 e183 e182 e212 688 671 2450 447 190 120 8 53 60 666 e183 e188 e214 680 778 1970 402 269 112 9 54 60 e555 e183 e196 e215 678 1420 1620 355 369 103 10 57 59 e550 e182 e202 e216 670 1730 1360 336 370 98 11 56 56 e470 e181 e210 e217 679 1710 1260 369 286 88 12 55 57 e440 e180 e222 e217 689 1690 1420 416 259 80 13 62 57 e420 e178 e230 e218 734 1610 1270 359 233 76 14 70 56 e405 e176 e245 e220 798 1460 1050 340 210 77 15 73 58 e360 e174 e255 e220 846 1350 951 307 190 73 16 68 57 e320 e173 e265 e221 854 1250 883 273 175 70 17 65 57 e290 e172 e275 e222 826 1130 826 245 160 68 18 65 58 e260 e171 e289 e223 765 1020 825 221 142 71 19 68 55 e235 e170 e294 e223 700 938 731 200 129 71 20 70 56 e220 e170 e297 e222 644 877 758 183 123 69 21 68 56 e210 e170 e296 e221 612 828 1040 171 186 66 22 66 58 e200 e171 e293 e221 593 778 2170 159 220 59 23 80 65 e195 e172 e288 e221 595 740 2760 147 456 56 24 81 120 e190 e173 e280 e222 624 684 2480 137 617 54 25 73 154 e187 e174 e269 e224 644 631 2540 165 577 77 26 73 353 e186 e175 e255 e230 626 588 2230 148 484 97 27 67 482 e185 e176 e247 e255 611 564 1860 129 411 89 28 64 471 e182 e178 e239 e340 618 556 1550 137 341 82 29 63 385 e178 e178 --- e560 690 531 1270 215 291 80 30 61 328 e176 e177 --- e1000 833 557 1050 278 261 81 31 61 --- e175 e176 --- e1400 --- 634 --- 241 235 ---
TOTAL 2008 3638 10017 5462 6552 9271 22960 29788 52068 10266 8145 2915 MEAN 64.8 121 323 176 234 299 765 961 1736 331 263 97.2 MAX 81 482 666 183 297 1400 1320 1730 5050 878 617 209 MIN 53 55 175 170 170 212 593 531 706 129 123 54 AC-FT 3980 7220 19870 10830 13000 18390 45540 59080 103300 20360 16160 5780 CFSM 0.05 0.09 0.25 0.14 0.18 0.23 0.59 0.74 1.34 0.25 0.20 0.07 IN. 0.06 0.10 0.29 0.16 0.19 0.27 0.66 0.85 1.49 0.29 0.23 0.08

211 MINNESOTA RIVER BASIN--Continued
05317000 COTTONWOOD RIVER NEAR NEW ULM, MN--Continued
STATISTICS OF MONTHLY MEAN DATA FOR WATER YEARS 1909 - 2002, BY WATER YEAR (WY)
OCT NOV DEC JAN FEB MAR APR MAY JUN JUL AUG SEP
MEAN 172 159 110 58.3 101 644 1083 599 634 371 191 150 MAX 3208 1099 572 282 628 3350 7075 3497 5831 3815 1791 2438 (WY) 1969 1980 1980 1992 1983 1997 1969 1993 1993 1993 1993 1986 MIN 4.57 7.97 5.77 1.61 1.47 13.9 40.0 7.57 8.58 4.37 1.05 3.28 (WY) 1934 1940 1936 1940 1940 1965 1959 1934 1911 1934 1934 1933
SUMMARY STATISTICS FOR 2001 CALENDAR YEAR FOR 2002 WATER YEAR WATER YEARS 1909 - 2002 ANNUAL TOTAL 321696 163090 ANNUAL MEAN 881 447 383a HIGHEST ANNUAL MEAN 1796 1993 LOWEST ANNUAL MEAN 41.1 1940 HIGHEST DAILY MEAN 18700 Apr 25 5050 Jun 4 27100 Apr 9 1969 LOWEST DAILY MEAN 44 Jan 20 53 Oct 7, 8 0.60 Aug 1 1934 ANNUAL SEVEN-DAY MINIMUM 44 Feb 16 55 Oct 6 0.64 Feb 1 1940 MAXIMUM PEAK FLOW 5390 Jun 4 28700 Apr 10 1969 MAXIMUM PEAK STAGE 11.95 Jun 4 20.86 Apr 8 1965 INSTANTANEOUS LOW FLOW 52 Oct 7 0.50b Nov 27 1952 ANNUAL RUNOFF (AC-FT) 638100 323500 277200 ANNUAL RUNOFF (CFSM) 0.68 0.34 0.29 ANNUAL RUNOFF (INCHES) 9.21 4.67 4.00 10 PERCENT EXCEEDS 2040 1010 920 50 PERCENT EXCEEDS 128 221 97 90 PERCENT EXCEEDS 46 63 14 a Median of annual mean discharges is 252 ft3/s. b Minimum observed. e Estimated.
O N D2001
J F M A M J J A S2002
10
20
50
100100
200
500
10001000
2000
5000
10,000
DAILY-MEAN DISCHARGE,
IN CUBIC FEET PER SECOND

212 MINNESOTA RIVER BASIN--Continued
05317000 COTTONWOOD RIVER NEAR NEW ULM, MN--Continued
WATER-QUALITY RECORDS
PERIOD OF RECORD.--1961-62, 64-68, 71-72, 74-76, 89-92, 95, 98, 2002
.
WATER-QUALITY DATA, WATER YEAR OCTOBER 2001 TO SEPTEMBER 2002 DIS- BARO- OXYGEN, PH CHARGE, METRIC DIS- WATER SPE- INST. PRES- SOLVED WHOLE CIFIC CUBIC SURE OXYGEN, (PER- FIELD CON- TEMPER- TEMPER- Sample Medium GAGE FEET (MM DIS- CENT (STAND- DUCT- ATURE ATURE Date Time type code HEIGHT PER OF SOLVED SATUR- ARD ANCE AIR WATER (FEET) SECOND HG) (MG/L) ATION) UNITS) (US/CM) (DEG C) (DEG C) (00065) (00061) (00025) (00300) (00301) (00400) (00095) (00020) (00010) MAY 30... 1350 ENVIRONMENTAL 5.05 557 734 12.1 151 8.2 1140 -- 25.0 JUN 25... 1620 ENVIRONMENTAL 9.03 2580 731 6.7 84 7.9 851 26.0 24.0

THIS PAGE IS INTENTIONALLY BLANK
213

214 MINNESOTA RIVER BASIN--Continued
05317200 LITTLE COTTONWOOD RIVER NEAR COURTLAND, MN
LOCATION.--Lat 44°14’47", long 94°20’19", in SW1⁄4NE1⁄4 sec.17, T.109 N., R.29 W., Blue Earth County, Hydrologic Unit 07020007,
on right bank 30 ft downstream from bridge on State Highway 68, 0.7 mi above mouth, 1.5 mi south of Courtland.
DRAINAGE AREA.--170 mi2.
PERIOD OF RECORD.--October 1973 to current year. September 1969 to September 1973, operated as a low-flow station only.
GAGE.--Water-stage recorder. Datum of gage is 788.25 ft above sea level (NGVD of 1929).
REMARKS.--Records good except those for estimated days, which are fair.
EXTREMES FOR CURRENT YEAR.--Peak discharges greater than base discharge of 200 ft3/s and maximum (*):
Discharge Gage height Discharge Gage height Date Time (ft3/s) (ft) Date Time (ft3/s) (ft)
Jun 4 0400 *892 *7.67 Jun 21 1800 812 7.42 Jun 18 1000 421 5.73
Minimum discharge, 4.3 ft3/s, Sept. 24, gage height, 2.64 ft.
DISCHARGE, CUBIC FEET PER SECOND, WATER YEAR OCTOBER 2001 TO SEPTEMBER 2002 DAILY MEAN VALUES DAY OCT NOV DEC JAN FEB MAR APR MAY JUN JUL AUG SEP 1 13 19 53 24 25 e24 130 103 98 115 24 27 2 13 17 51 23 26 e22 103 98 96 101 20 25 3 11 17 51 22 25 e19 77 90 283 94 20 23 4 10 17 51 22 25 e19 69 84 747 89 21 20 5 11 16 60 24 24 e19 63 79 680 78 22 18 6 9.9 17 71 25 24 e19 60 75 537 72 26 16 7 9.9 18 75 25 25 e19 60 75 485 66 35 14 8 9.7 19 76 26 26 e19 62 90 511 62 42 12 9 10 19 63 26 27 e18 65 101 534 57 40 11 10 11 19 74 26 28 e18 65 100 506 60 36 11 11 12 17 69 28 27 e18 67 98 448 59 31 9.6 12 12 17 64 30 26 e19 78 102 369 67 30 9.2 13 14 18 60 31 28 e19 89 106 291 62 27 8.9 14 15 20 45 33 28 e19 92 104 258 54 25 9.6 15 17 20 63 32 29 e20 92 100 232 48 24 8.5 16 20 20 53 32 31 e20 88 96 207 44 23 8.6 17 17 19 52 33 33 e21 85 88 181 39 22 7.8 18 16 20 50 31 34 e21 83 83 247 37 19 7.2 19 15 22 39 29 40 e22 75 77 191 37 17 6.5 20 16 19 30 28 41 e23 68 71 175 34 16 6.6 21 16 21 38 28 40 e23 66 68 430 32 33 5.9 22 16 19 45 28 39 e24 66 65 562 28 56 5.3 23 21 21 30 29 44 e24 69 65 407 23 71 5.1 24 18 34 20 29 49 e25 68 61 326 21 82 4.6 25 18 60 42 28 44 e28 64 60 290 30 82 7.2 26 19 76 35 28 31 e31 63 57 273 28 66 19 27 17 80 31 30 37 42 63 56 246 25 52 24 28 17 70 31 30 38 86 77 58 197 23 43 26 29 19 61 29 28 --- 111 95 56 157 28 37 23 30 e18 55 27 27 --- 127 104 57 134 31 33 19 31 19 --- 25 26 --- 121 --- 67 --- 28 29 ---
TOTAL 460.5 867 1503 861 894 1040 2306 2490 10098 1572 1104 398.6 MEAN 14.9 28.9 48.5 27.8 31.9 33.5 76.9 80.3 337 50.7 35.6 13.3 MAX 21 80 76 33 49 127 130 106 747 115 82 27 MIN 9.7 16 20 22 24 18 60 56 96 21 16 4.6 AC-FT 913 1720 2980 1710 1770 2060 4570 4940 20030 3120 2190 791 CFSM 0.09 0.17 0.29 0.16 0.19 0.20 0.45 0.47 1.98 0.30 0.21 0.08 IN. 0.10 0.19 0.33 0.19 0.20 0.23 0.50 0.54 2.21 0.34 0.24 0.09
215 MINNESOTA RIVER BASIN--Continued
05317200 LITTLE COTTONWOOD RIVER NEAR COURTLAND, MN--Continued
STATISTICS OF MONTHLY MEAN DATA FOR WATER YEARS 1974 - 2002, BY WATER YEAR (WY)
OCT NOV DEC JAN FEB MAR APR MAY JUN JUL AUG SEP
MEAN 38.4 44.6 27.2 14.8 22.6 120 192 124 141 89.9 51.3 38.8 MAX 163 134 118 80.1 105 392 980 418 750 553 248 262 (WY) 1987 1983 1992 1992 1983 1997 2001 1993 1993 1993 1993 1986 MIN 0.75 0.70 0.21 0.15 0.38 5.79 9.64 4.17 2.39 0.63 0.81 0.54 (WY) 1976 1977 1977 1977 1977 1975 1990 1981 1976 1988 1976 1976
SUMMARY STATISTICS FOR 2001 CALENDAR YEAR FOR 2002 WATER YEAR WATER YEARS 1974 - 2002 ANNUAL TOTAL 51742.2 23594.1 ANNUAL MEAN 142 64.6 75.4 HIGHEST ANNUAL MEAN 239 1993 LOWEST ANNUAL MEAN 9.18 1989 HIGHEST DAILY MEAN 2310 Apr 5 747 Jun 4 2850 Jun 20 1993 LOWEST DAILY MEAN 3.8 Jan 2 4.6 Sep 24 0.02 Sep 12 1977 ANNUAL SEVEN-DAY MINIMUM 4.5 Jan 1 5.9 Sep 18 0.08 Sep 11 1977 MAXIMUM PEAK FLOW 892 Jun 4 3520a Jun 20 1993 MAXIMUM PEAK STAGE 7.67 Jun 4 11.60b Apr 4 1997 INSTANTANEOUS LOW FLOW 4.3 Sep 24 0.01 Sep 17 1977 ANNUAL RUNOFF (AC-FT) 102600 46800 54620 ANNUAL RUNOFF (CFSM) 0.83 0.38 0.44 ANNUAL RUNOFF (INCHES) 11.32 5.16 6.03 10 PERCENT EXCEEDS 346 103 194 50 PERCENT EXCEEDS 23 31 27 90 PERCENT EXCEEDS 8.0 16 1.5 a Gage-height, 10.45 ft. b Backwater from the Minnesota River. e Estimated.
O N D2001
J F M A M J J A S2002
1
2
5
1010
20
50
100100
200
500
1000
DAILY-MEAN DISCHARGE,
IN CUBIC FEET PER SECOND

216 MINNESOTA RIVER BASIN--Continued
05319500 WATONWAN RIVER NEAR GARDEN CITY, MN
LOCATION.--Lat 44°02’47", long 94°11’43", in SW1⁄4NE1⁄4 sec. 28, T.107 N., R.28 W., Blue Earth County, Hydrologic Unit 07020010,
on left bank 25 ft downstream from bridge on County Highway 13, 1.5 miles west of Garden City, 7.3 mi upstream from mouth, and 9.2 mi downstream from Perch Creek.
DRAINAGE AREA.--851 mi2.
PERIOD OF RECORD.--March 1940 to September 1945, September 1976 to current year. 1953, 1960, 1961, and 1969 (one or more discharge measurements each year).
REVISED RECORDS.--WDR MN-78-2: 1977. WRIR 97-4249: Drainage area.
GAGE.--Water-stage recorder. Datum of gage is 905.05 ft above sea level (NGVD of 1929). Prior to September 30, 1945, nonrecording gage at site 200 ft upstream and at datum 0.17 ft higher.
REMARKS.--Records good except those for estimated daily discharge, which are fair to poor.
EXTREMES OUTSIDE PERIOD OF RECORD.--Flood of Apr. 7, 1965, reached a stage of 18.89 ft at datum 0.17 ft higher, from floodmarks, discharge, 19,000 ft3/s.
EXTREMES FOR CURRENT YEAR.--Peak discharges greater than base discharge of 1,200 ft3/s and maximum (*):
Discharge Gage height Discharge Gage height Date Time (ft3/s) (ft) Date Time (ft3/s) (ft)
Aug 23 1900 *920 *3.44 No other peak greater than base discharge.
Minimum discharge, 26 ft3/s, Sep. 24.
DISCHARGE, CUBIC FEET PER SECOND, WATER YEAR OCTOBER 2001 TO SEPTEMBER 2002 DAILY MEAN VALUES DAY OCT NOV DEC JAN FEB MAR APR MAY JUN JUL AUG SEP 1 36 e33 128 e50 e50 e60 371 367 365 268 47 189 2 35 e35 120 e49 e49 e58 337 359 358 231 40 157 3 36 e33 111 e49 e49 e57 265 337 459 206 39 133 4 32 e33 112 e50 e49 e57 190 312 546 186 44 113 5 29 e33 122 e52 e50 e58 212 290 692 163 58 96 6 28 e33 130 e53 e52 e60 202 268 795 145 275 83 7 28 e34 141 e54 e54 e61 186 257 711 134 467 71 8 28 e34 159 e55 e56 e62 196 253 629 121 461 62 9 29 e33 e155 e57 e58 e62 192 270 567 114 379 56 10 35 33 151 e58 e61 e62 186 282 509 114 309 51 11 31 33 150 e58 e64 e62 199 286 567 121 240 48 12 31 32 138 e58 e65 e62 261 291 686 156 199 43 13 35 34 133 e58 e67 e63 308 309 621 171 176 41 14 38 38 e120 e58 e70 e65 310 333 541 135 168 44 15 38 38 e110 e57 e74 e67 309 339 489 113 154 41 16 37 36 e105 e56 e77 e69 297 338 438 98 131 41 17 37 35 e99 e54 e80 e70 288 322 401 86 110 37 18 43 38 e90 e52 e82 e70 271 300 469 78 95 35 19 40 36 e82 e51 e86 e70 249 277 447 73 82 36 20 36 35 e74 e51 e93 e70 223 256 402 67 70 34 21 39 35 e67 e51 e98 e69 212 238 425 61 120 33 22 37 35 e59 e52 e96 e68 208 222 525 58 480 32 23 38 37 e55 e52 e93 e68 217 218 626 55 859 29 24 37 64 e54 e52 e85 e68 224 221 602 50 896 27 25 36 118 e54 e52 e76 e69 230 204 545 55 779 31 26 33 150 e54 e53 e70 e70 224 194 486 51 638 33 27 35 156 e53 e54 e65 e74 220 186 428 45 519 38 28 33 179 e53 e54 e62 e115 244 354 383 43 417 39 29 36 167 e52 e53 --- 198 316 302 344 54 347 38 30 33 142 e52 e52 --- 297 355 403 308 58 287 37 31 e33 --- e51 e51 --- 392 --- 418 --- 58 230 ---
TOTAL 1072 1772 3034 1656 1931 2753 7502 9006 15364 3368 9116 1748 MEAN 34.6 59.1 97.9 53.4 69.0 88.8 250 291 512 109 294 58.3 MAX 43 179 159 58 98 392 371 418 795 268 896 189 MIN 28 32 51 49 49 57 186 186 308 43 39 27 AC-FT 2130 3510 6020 3280 3830 5460 14880 17860 30470 6680 18080 3470 CFSM 0.04 0.07 0.12 0.06 0.08 0.10 0.29 0.34 0.60 0.13 0.35 0.07 IN. 0.05 0.08 0.13 0.07 0.08 0.12 0.33 0.39 0.67 0.15 0.40 0.08

217 MINNESOTA RIVER BASIN--Continued
05319500 WATONWAN RIVER NEAR GARDEN CITY, MN--Continued
STATISTICS OF MONTHLY MEAN DATA FOR WATER YEARS 1940 - 2002, BY WATER YEAR (WY)
OCT NOV DEC JAN FEB MAR APR MAY JUN JUL AUG SEP
MEAN 184 230 139 68.8 104 563 963 628 859 471 241 185 MAX 686 826 530 319 626 2105 4411 2025 4494 2389 1095 819 (WY) 1993 1993 1992 1992 1983 1992 2001 1993 1993 1993 1979 1993 MIN 5.37 7.69 3.76 2.70 2.39 19.3 33.7 16.1 17.3 8.27 6.56 3.63 (WY) 1990 1977 1990 1977 1977 1940 1990 1940 1989 1940 1989 1976
SUMMARY STATISTICS FOR 2001 CALENDAR YEAR FOR 2002 WATER YEAR WATER YEARS 1940 - 2002 ANNUAL TOTAL 252676 58322 ANNUAL MEAN 692 160 397 HIGHEST ANNUAL MEAN 1330 1993 LOWEST ANNUAL MEAN 43.7 1989 HIGHEST DAILY MEAN 7180 Apr 14 896 Aug 24 13400 Jun 20 1993 LOWEST DAILY MEAN 28 Oct 6 27 Sep 24 1.8 Dec 24 1989 ANNUAL SEVEN-DAY MINIMUM 30 Oct 5 30 Oct 5 1.9 Jan 20 1977 MAXIMUM PEAK FLOW 920 Aug 23 13900 Jun 20 1993 MAXIMUM PEAK STAGE 3.44 Aug 23 15.91 Jun 20 1993 INSTANTANEOUS LOW FLOW 26 Sep 24 1.8 Dec 24 1989 ANNUAL RUNOFF (AC-FT) 501200 115700 287800 ANNUAL RUNOFF (CFSM) 0.81 0.19 0.47 ANNUAL RUNOFF (INCHES) 11.05 2.55 6.34 10 PERCENT EXCEEDS 2210 396 1080 50 PERCENT EXCEEDS 59 73 141 90 PERCENT EXCEEDS 35 35 14 e Estimated.
O N D2001
J F M A M J J A S2002
10
20
50
100100
200
500
1000
DAILY-MEAN DISCHARGE,
IN CUBIC FEET PER SECOND

218 MINNESOTA RIVER BASIN--Continued
05320000 BLUE EARTH RIVER NEAR RAPIDAN, MN
LOCATION.--Lat 44°05’44", long 94°06’33", in SE1⁄4SE1⁄4 sec. 6, T.107 N., R.27 W., Blue Earth County, Hydrologic Unit 07020009,
on left bank 0.2 mi downstream from power plant (reactivated in 1984) operated by Rapidan Redevelopment Limited Partnership, 2 mi west of Rapidan, 3.5 mi downstream from Watonwan River, and 7.8 mi upstream from Le Sueur River.
DRAINAGE AREA.--2,410 mi2.
PERIOD OF RECORD.--July 1909 to November 1910 published as "at Rapidan Mills" (no winter records), October 1939 to September 1945, July 1949 to current year. Annual maximums only, 1912 to 1939.
REVISED RECORDS.-- WSP 1508: 1910.
GAGE.--Water-stage recorder. Datum of gage is 807.83 ft above sea level (NGVD of 1929). July 20, 1909 to Apr. 28, 1910, nonrecording gage at site 0.2 mi upstream at different datum. Apr. 29 to Nov. 12, 1910, nonrecording gage at site 800 ft upstream at different datum. Oct. 4 to Nov. 14, 1939, nonrecording gage at present site and datum.
REMARKS.--Records good except those for estimated daily discharges, which are fair.
DISCHARGE, in CFS, WATER YEAR OCTOBER 2001 TO SEPTEMBER 2002 DAILY MEAN VALUES DAY OCT NOV DEC JAN FEB MAR APR MAY JUN JUL AUG SEP 1 127 72 366 93 e145 193 809 1050 1600 923 876 713 2 120 71 283 95 e125 188 572 1080 1580 761 779 568 3 86 95 293 95 106 e180 639 1020 1420 700 607 495 4 63 107 287 103 114 172 433 974 1440 602 561 483 5 63 104 280 131 114 172 403 871 1500 517 661 383 6 62 103 281 128 110 163 402 828 1640 478 1520 332 7 65 96 281 117 110 150 392 787 1720 419 2140 283 8 75 83 281 117 110 139 369 804 1540 411 2580 261 9 73 77 270 117 109 e134 382 739 1330 326 2820 227 10 83 77 285 117 125 e128 400 690 1190 305 2590 221 11 88 77 336 142 138 123 399 684 1370 381 2150 194 12 86 77 330 189 130 120 460 744 2550 335 1460 172 13 86 86 270 159 124 120 626 695 2880 301 1280 180 14 95 102 249 149 124 126 786 736 2900 321 1130 176 15 104 107 251 182 125 133 737 824 2450 326 1070 170 16 104 96 271 192 130 142 902 834 2010 332 1080 168 17 107 78 272 177 156 318 850 834 1770 320 1000 159 18 103 73 272 148 167 449 783 805 1710 300 741 144 19 102 73 232 157 202 556 720 715 1840 263 664 159 20 101 85 163 156 243 660 658 666 1590 220 672 166 21 101 96 129 159 212 637 623 615 2020 196 705 149 22 100 100 161 152 198 545 633 581 2180 208 1660 118 23 98 100 200 145 239 540 650 586 2210 200 2200 107 24 141 127 113 148 228 620 637 559 2160 183 2140 140 25 127 322 115 161 182 506 555 504 1820 512 1850 191 26 88 249 256 139 147 426 723 497 1530 646 1660 215 27 81 302 167 135 219 590 636 471 1420 546 1390 175 28 78 340 151 200 246 540 699 632 1230 388 1220 153 29 78 410 166 146 --- 541 735 761 1110 467 959 153 30 78 405 142 154 --- 572 889 718 985 501 1090 179 31 78 --- 117 159 --- 737 --- 1070 --- 491 964 ---
TOTAL 2841 4190 7270 4462 4378 10620 18502 23374 52695 12879 42219 7234 MEAN 91.65 139.7 234.5 143.9 156.4 342.6 616.7 754.0 1756 415.5 1362 241.1 MAX 141 410 366 200 246 737 902 1080 2900 923 2820 713 MIN 62 71 113 93 106 120 369 471 985 183 561 107 AC-FT 5640 8310 14420 8850 8680 21060 36700 46360 104500 25550 83740 14350 CFSM 0.04 0.06 0.10 0.06 0.06 0.14 0.25 0.31 0.72 0.17 0.56 0.10 IN. 0.04 0.06 0.11 0.07 0.07 0.16 0.28 0.36 0.81 0.20 0.65 0.11
219 MINNESOTA RIVER BASIN--Continued
05320000 BLUE EARTH RIVER NEAR RAPIDAN, MN--Continued
STATISTICS OF MONTHLY MEAN DATA FOR WATER YEARS 1909 - 2002, BY WATER YEAR (WY)
OCT NOV DEC JAN FEB MAR APR MAY JUN JUL AUG SEP
MEAN 550.3 557.7 348.9 202.0 263.6 1382 2782 1796 2212 1366 689.6 505.8 MAX 5121 2878 1724 1093 1793 6277 13230 5775 11700 8540 5541 4313 (WY) 1969 1993 1992 1992 1983 1983 1965 1991 1993 1993 1979 1993 MIN 22.5 26.7 16.0 14.8 14.2 92.4 142 53.4 110 30.9 37.7 22.1 (WY) 1940 1940 1956 1977 1959 1968 1977 1940 1976 1940 1976 1976
SUMMARY STATISTICS FOR 2001 CALENDAR YEAR FOR 2002 WATER YEAR WATER YEARS 1909 - 2002 ANNUAL TOTAL 798314 190664 ANNUAL MEAN 2187 522.4 1071 HIGHEST ANNUAL MEAN 4518 1993 LOWEST ANNUAL MEAN 105 1940 HIGHEST DAILY MEAN 16800 Apr 14 2900 Jun 14 42500 Apr 9 1965 LOWEST DAILY MEAN 52 Jan 3 62 Oct 6 7.4 Oct 28 1955 ANNUAL SEVEN-DAY MINIMUM 67 Jan 1 69 Oct 4 8.1 Oct 24 1955 MAXIMUM PEAK FLOW 4010a Aug 23 43100 Apr 9 1965 MAXIMUM PEAK STAGE 5.66a Aug 23 21.36b Apr 9 1965 INSTANTANEOUS LOW FLOW 45c Dec 29 6.9 Oct 12 1955 ANNUAL RUNOFF (AC-FT) 1583000 378200 776100 ANNUAL RUNOFF (CFSM) 0.90 0.21 0.44 ANNUAL RUNOFF (INCHES) 12.22 2.92 5.99 10 PERCENT EXCEEDS 7390 1400 2890 50 PERCENT EXCEEDS 175 281 364 90 PERCENT EXCEEDS 75 96 46 a Maximum recorded, result of regulation. b From floodmark. c Minimum recorded, result of regulation. e Estimated.
O N D2001
J F M A M J J A S2002
10
20
50
100100
200
500
10001000
2000
5000
10,000
DAILY-MEAN DISCHARGE,
IN CUBIC FEET PER SECOND

220 MINNESOTA RIVER BASIN--Continued
05320270 LITTLE COBB RIVER NEAR BEAUFORD, MN
LOCATION.--Lat 43°59’48", long 93°54’30", in SE1⁄4SE1⁄4 sec. 11, T.106 N., R.26 W., Blue Earth County, Hydrologic Unit 07020011,
on left bank at downstream end of bridge on County Road No. 16, 1.6 mi upstream from mouth, 2.6 mi east of Beauford, and 5.3 mi northeast of Mapleton.
DRAINAGE AREA.--130 mi2.
PERIOD OF RECORD.--April 1996 to September 30, 1999, June 2001 to current year.
REVISED RECORDS.-- WDR MN-99-1: Drainage area.
GAGE.--Water-stage recorder. Elevation of gage is 980 ft above sea level (from topographic map).
REMARKS.--Records good except those for estimated daily discharges, which are fair to poor.
EXTREMES OUTSIDE PERIOD OF RECORD.--Maximum gage height observed, 12.17 ft, on April 5, 2001, discharge 2,220 ft3/s (from highwater mark).
DISCHARGE, in CFS, WATER YEAR OCTOBER 2001 TO SEPTEMBER 2002 DAILY MEAN VALUES DAY OCT NOV DEC JAN FEB MAR APR MAY JUN JUL AUG SEP 1 0.00 0.00 3.3 1.8 e1.4 e3.5 e20 66 26 93 3.4 15 2 0.00 0.00 3.7 1.6 e1.1 e3.3 e18 64 24 77 2.7 11 3 0.00 0.00 3.5 1.5 e0.85 e3.2 e17 63 31 66 2.7 7.7 4 0.00 0.00 3.6 1.5 e1.0 e2.9 e16 61 55 57 6.6 6.4 5 0.00 0.00 4.1 1.6 e1.4 e2.6 e15 56 89 49 8.6 4.6 6 0.00 0.00 8.7 1.6 e1.7 e2.6 e15 53 103 43 7.4 4.1 7 0.00 0.00 8.3 1.4 e2.2 e2.6 e14 49 106 39 9.8 3.7 8 0.00 0.00 6.4 1.5 e2.3 e2.5 e15 48 98 35 9.5 2.9 9 0.00 0.00 6.0 1.6 e2.4 e2.1 e15 47 89 31 7.4 2.4 10 0.00 0.00 7.9 1.9 e2.4 e2.4 e17 45 79 29 5.8 2.1 11 0.00 0.00 6.9 2.2 e2.5 e2.0 e22 42 155 28 4.9 1.6 12 0.00 0.00 6.9 2.5 e2.6 e2.2 e44 41 230 27 4.6 1.2 13 0.00 0.00 6.1 2.6 e2.7 e4.2 e59 42 233 25 5.9 1.2 14 0.00 0.00 5.5 2.5 e2.8 e5.4 65 42 250 22 4.0 2.6 15 0.00 0.00 8.5 2.5 e2.9 e6.8 68 41 260 19 3.4 2.7 16 0.00 0.00 6.3 2.5 e3.1 e8.9 68 40 245 17 3.0 1.4 17 0.00 0.00 5.8 2.5 e3.2 e12 66 38 214 14 2.5 0.84 18 0.00 0.00 5.7 2.4 e3.3 e13 62 35 181 11 2.0 0.59 19 0.00 0.00 4.9 2.2 e3.5 e14 62 33 166 8.3 2.0 0.51 20 0.00 0.00 4.8 1.9 e3.7 e18 58 32 136 6.5 1.4 0.37 21 0.00 0.00 4.5 1.9 e4.1 e20 54 30 137 5.3 13 0.28 22 0.00 0.00 4.4 2.0 e4.5 e22 53 29 230 5.2 29 0.36 23 0.00 0.00 4.1 2.1 e4.6 e24 53 28 233 3.6 43 0.22 24 0.00 0.15 4.2 1.8 e4.1 e25 52 27 238 2.8 53 0.18 25 0.00 0.51 3.6 1.7 e3.9 e27 51 26 247 3.2 50 0.40 26 0.00 0.51 3.0 2.1 e3.9 e28 49 26 235 3.2 48 0.58 27 0.00 5.0 3.0 2.5 e4.0 e32 46 25 205 3.0 39 0.83 28 0.00 6.9 3.1 2.4 e3.7 e28 53 31 169 2.9 32 0.71 29 0.00 5.3 2.8 2.3 --- e24 63 39 138 4.7 26 0.74 30 0.00 3.7 2.5 2.1 --- e22 67 32 113 3.1 22 0.86 31 0.00 --- 2.2 1.8 --- e21 --- 29 --- 4.3 19 ---
TOTAL 0.00 22.07 154.3 62.5 79.85 387.2 1277 1260 4715 738.1 471.6 78.07 MEAN 0.000 0.736 4.977 2.016 2.852 12.49 42.57 40.65 157.2 23.81 15.21 2.602 MAX 0.00 6.9 8.7 2.6 4.6 32 68 66 260 93 53 15 MIN 0.00 0.00 2.2 1.4 0.85 2.0 14 25 24 2.8 1.4 0.18 AC-FT 0.00 44 306 124 158 768 2530 2500 9350 1460 935 155 CFSM 0.00 0.01 0.04 0.02 0.02 0.10 0.33 0.31 1.21 0.18 0.12 0.02 IN. 0.00 0.01 0.04 0.02 0.02 0.11 0.37 0.36 1.35 0.21 0.13 0.02
221 MINNESOTA RIVER BASIN--Continued
05320270 LITTLE COBB RIVER NEAR BEAUFORD, MN--Continued
STATISTICS OF MONTHLY MEAN DATA FOR WATER YEARS 1996 - 2002, BY WATER YEAR (WY)
OCT NOV DEC JAN FEB MAR APR MAY JUN JUL AUG SEP
MEAN 10.33 29.09 15.44 6.243 32.98 117.2 200.3 137.6 143.0 75.10 25.18 5.548 MAX 23.2 89.7 54.0 18.2 58.2 278 410 341 217 150 58.0 17.2 (WY) 1998 1997 1997 1997 1999 1997 1999 1999 1999 1999 1999 1997 MIN 0.000 0.74 1.46 0.49 2.85 12.5 42.6 40.6 83.1 23.8 4.34 0.027 (WY) 2002 2002 2000 1999 2002 2002 2002 2002 1998 2002 1998 2001
SUMMARY STATISTICS FOR 2002 WATER YEAR WATER YEARS 1996 - 2002 ANNUAL TOTAL 9245.69 ANNUAL MEAN 25.33 72.55 HIGHEST ANNUAL MEAN 114 1999 LOWEST ANNUAL MEAN 25.3 2002 HIGHEST DAILY MEAN 260 Jun 15 811 Apr 12 1999 LOWEST DAILY MEAN 0.00 Oct 1 - Nov. 23 0.00a Sep 6 1998 ANNUAL SEVEN-DAY MINIMUM 0.00 Oct 1 0.00 Sep 12 1998 MAXIMUM PEAK FLOW 263 Jun 15 852 Apr 12 1999 MAXIMUM PEAK STAGE 7.97 Jun 15 11.38 Mar 14 1997 INSTANTANEOUS LOW FLOW 0.00 Oct 1 0.00a Sep 5 1998 ANNUAL RUNOFF (AC-FT) 18340 52560 ANNUAL RUNOFF (CFSM) 0.19 0.56 ANNUAL RUNOFF (INCHES) 2.65 7.58 10 PERCENT EXCEEDS 63 195 50 PERCENT EXCEEDS 4.2 23 90 PERCENT EXCEEDS 0.00 0.64 a Many days, several years. e Estimated.
O N D2001
J F M A M J J A S2002
0.1
0.2
0.5
11
2
5
1010
20
50
100100
200
500
1000
DAILY-MEAN DISCHARGE,
IN CUBIC FEET PER SECOND

222 MINNESOTA RIVER BASIN
05320270 LITTLE COBB RIVER NEAR BEAUFORD, MN--Continued (National Water-Quality Assessment Program)
WATER QUALITY RECORDS
PERIOD OF RECORD.--Water years 1996 to current year.
PERIOD OF DAILY RECORD:
WATER TEMPERATURES.-- April 1996 to September 1998.
SPECIFIC CONDUCTANCE.-- April 1996 to September 1998.
INSTRUMENTATION.--Water-quality monitor since April 1996, provides continuous recordings. Sensor located at gage.
WATER-QUALITY DATA, WATER YEAR OCTOBER 2001 TO SEPTEMBER 2002 DIS- BARO- OXYGEN, PH ALKA- CHARGE, METRIC DIS- WATER SPE- LINITY INST. PRES- SOLVED WHOLE CIFIC WAT DIS CUBIC SURE OXYGEN, (PER- FIELD CON- TEMPER- TEMPER- TOT IT Sample Medium GAGE FEET (MM DIS- CENT (STAND- DUCT- ATURE ATURE FIELD Date Time type code HEIGHT PER OF SOLVED SATUR- ARD ANCE AIR WATER MG/L AS (FEET) SECOND HG) (MG/L) ATION) UNITS) (US/CM) (DEG C) (DEG C) CACO3 (00065) (00061) (00025) (00300) (00301) (00400) (00095) (00020) (00010) (39086) NOV 26... 1230 ENVIRONMENTAL 4.74 .98 736 8.8 67 7.7 554 .5 3.6 231DEC 18... 1030 ENVIRONMENTAL 4.88 5.3 735 11.9 88 7.9 638 5.0 1.4 231JAN 23... 1110 ENVIRONMENTAL 4.79 2.0 741 9.6 68 7.3 903 -5.0 -.1 313FEB 26... 1030 ENVIRONMENTAL 4.89 3.9 742 13.2 92 7.8 519 -8.0 .0 195APR 17... 1200 ENVIRONMENTAL 5.68 65 736 9.8 106 8.0 584 18.9 17.5 201MAY 07... 1220 BLANK -- -- -- -- -- -- -- -- -- -- 07... 1225 ENVIRONMENTAL 5.48 40 742 -- -- 9.0 603 15.0 13.2 219JUN 06... 1310 ENVIRONMENTAL 6.08 102 738 9.1 96 7.9 635 19.0 17.0 208 27... 1045 ENVIRONMENTAL 7.31 206 738 5.8 71 7.6 632 26.0 24.0 --JUL 25... 1210 ENVIRONMENTAL 4.77 3.2 736 6.1 70 7.7 512 21.0 21.0 197 25... 1215 SPIKE -- -- -- -- -- -- -- -- -- --AUG 23... 0835 ENVIRONMENTAL 5.40 40 739 7.2 82 7.3 444 22.0 19.9 180 23... 0840 REPLICATE -- -- -- -- -- -- -- -- -- --
BICAR- CAR- NITRO- NITRO- NITRO- NITRO- ORTHO- 2,6-DI- BONATE BONATE CHLO- GEN, GEN,AM- GEN, GEN, PHOS- ETHYL ACETO- ALA- WATER WATER RIDE, SULFATE AMMONIA MONIA + NO2+NO3 NITRITE PHATE, PHOS- ANILINE CHLOR, CHLOR, DIS IT DIS IT DIS- DIS- DIS- ORGANIC DIS- DIS- DIS- PHORUS WAT FLT WATER WATER, FIELD FIELD SOLVED SOLVED SOLVED TOTAL SOLVED SOLVED SOLVED TOTAL 0.7 U FLTRD DISS, Date MG/L AS MG/L AS (MG/L (MG/L (MG/L (MG/L (MG/L (MG/L (MG/L (MG/L GF, REC REC REC, HCO3 CO3 AS CL) AS SO4) AS N) AS N) AS N) AS N) AS P) AS P) (UG/L) (UG/L) (UG/L) (00453) (00452) (00940) (00945) (00608) (00625) (00631) (00613) (00671) (00665) (82660) (49260) (46342) NOV 26... 282 0 16.3 33.1 <.04 .98 E.05 <.008 .33 .45 -- -- --DEC 18... 282 0 26.4 64.8 <.04 .99 4.66 .026 .22 .098 <.002 .023 <.002JAN 23... 382 0 42.8 116 E.03 1.1 3.64 .022 .03 .050 -- -- --FEB 26... 238 0 25.9 56.8 <.04 .64 2.49 .008 E.01 .034 <.006 .010 <.004APR 17... 245 4 18.6 53.3 <.04 1.9 7.64 .102 <.02 .184 E.003 .070 <.004MAY 07... -- -- <.30 <.1 <.04 <.10 <.05 <.008 <.02 <.004 -- -- -- 07... 255 6 17.7 47.3 <.04 1.4 8.76 .070 <.02 .117 <.006 .071 <.004JUN 06... 254 0 15.4 31.1 <.04 1.6 17.1 .084 .04 .22 <.006 .372 <.015 27... -- -- -- -- -- -- -- -- -- -- -- -- --JUL 25... 240 0 19.9 27.1 E.02 1.0 2.08 .010 .16 .23 <.006 .009 <.004 25... -- -- -- -- -- -- -- -- -- -- .091 .143 .130AUG 23... 220 0 15.8 18.8 .11 2.0 2.24 .036 .22 .39 <.006 .266 <.004 23... -- -- 15.9 18.9 .12 2.0 2.25 .035 .23 .40 -- -- --

223 MINNESOTA RIVER BASIN
05320270 LITTLE COBB RIVER NEAR BEAUFORD, MN--Continued (National Water-Quality Assessment Program)
WATER-QUALITY DATA, WATER YEAR OCTOBER 2001 TO SEPTEMBER 2002 BEN- CAR- CARBO- DEETHYL DISUL- ATRA- FLUR- BUTYL- BARYL FURAN CYANA- DCPA ATRA- FOTON ALPHA ZINE, ALIN ATE, WATER WATER CHLOR- ZINE, WATER ZINE, DI- DI- WATER BHC WATER, WAT FLD WATER, FLTRD FLTRD PYRIFOS WATER, FLTRD WATER, AZINON, ELDRIN FLTRD DIS- DISS, 0.7 U DISS, 0.7 U 0.7 U DIS- DISS, 0.7 U DISS, DIS- DIS- 0.7 U Date SOLVED REC GF, REC REC GF, REC GF, REC SOLVED REC GF, REC REC SOLVED SOLVED GF, REC (UG/L) (UG/L) (UG/L) (UG/L) (UG/L) (UG/L) (UG/L) (UG/L) (UG/L) (UG/L) (UG/L) (UG/L) (UG/L) (34253) (39632) (82673) (04028) (82680) (82674) (38933) (04041) (82682) (04040) (39572) (39381) (82677) NOV 26... -- -- -- -- -- -- -- -- -- -- -- -- --DEC 18... <.005 .032 <.010 <.002 <.041 <.020 <.005 <.018 <.003 E.010 <.005 <.005 <.02JAN 23... -- -- -- -- -- -- -- -- -- -- -- -- --FEB 26... <.005 .021 <.010 <.002 <.041 <.020 <.005 <.018 <.003 E.009 <.005 <.005 <.02APR 17... <.005 .055 <.010 <.002 <.041 <.020 <.005 <.018 <.003 E.014 <.005 <.005 <.02MAY 07... -- -- -- -- -- -- -- -- -- -- -- -- -- 07... <.005 .064 <.010 <.002 <.041 <.020 <.005 <.018 <.003 E.021 <.005 <.005 <.02JUN 06... <.005 .547 <.010 <.002 <.041 <.020 <.005 <.018 <.003 E.051 <.005 <.005 <.02 27... -- -- -- -- -- -- -- -- -- -- -- -- --JUL 25... <.005 .352 <.010 <.002 <.041 <.020 <.005 <.018 <.003 E.042 <.005 <.005 <.02 25... .107 .498 .090 .111 E.134 E.138 .106 .121 .118 E.104 .111 .125 E.05AUG 23... <.005 .232 <.010 <.002 <.041 <.020 <.005 <.018 <.003 E.060 <.005 <.005 <.02 23... -- -- -- -- -- -- -- -- -- -- -- -- --
ETHAL- ETHO- LIN- METHYL METHYL MOL- NAPROP- EPTC FLUR- PROP URON AZIN- PARA- METRI- INATE AMIDE WATER ALIN WATER FONOFOS WATER MALA- PHOS THION METO- BUZIN WATER WATER FLTRD WAT FLT FLTRD WATER LINDANE FLTRD THION, WAT FLT WAT FLT LACHLOR SENCOR FLTRD FLTRD 0.7 U 0.7 U 0.7 U DISS DIS- 0.7 U DIS- 0.7 U 0.7 U WATER WATER 0.7 U 0.7 U Date GF, REC GF, REC GF, REC REC SOLVED GF, REC SOLVED GF, REC GF, REC DISSOLV DISSOLV GF, REC GF, REC (UG/L) (UG/L) (UG/L) (UG/L) (UG/L) (UG/L) (UG/L) (UG/L) (UG/L) (UG/L) (UG/L) (UG/L) (UG/L) (82668) (82663) (82672) (04095) (39341) (82666) (39532) (82686) (82667) (39415) (82630) (82671) (82684) NOV 26... -- -- -- -- -- -- -- -- -- -- -- -- --DEC 18... <.002 <.009 <.005 <.003 <.004 <.035 <.027 <.050 <.006 .080 <.006 <.002 <.007JAN 23... -- -- -- -- -- -- -- -- -- -- -- -- --FEB 26... <.002 <.009 <.005 <.003 <.004 <.035 <.027 <.050 <.006 .055 <.006 <.002 <.007APR 17... <.002 <.009 <.005 <.003 <.004 <.035 <.027 <.050 <.006 .078 <.006 <.002 <.007MAY 07... -- -- -- -- -- -- -- -- -- -- -- -- -- 07... .013 <.009 <.005 <.003 <.004 <.035 <.027 <.050 <.006 .045 <.006 <.002 <.007JUN 06... <.002 <.009 <.005 <.003 <.004 <.035 <.027 <.050 <.006 .126 <.006 <.002 <.007 27... -- -- -- -- -- -- -- -- -- -- -- -- --JUL 25... <.002 <.009 <.005 <.003 <.004 <.035 <.027 <.050 <.006 .043 <.006 <.002 <.007 25... .100 .109 .102 .116 .117 .128 .104 E.419 .129 .157 .100 .105 .131AUG 23... <.002 <.009 <.005 <.003 <.004 <.035 <.027 <.050 <.011 .077 <.006 <.002 <.007 23... -- -- -- -- -- -- -- -- -- -- -- -- --

224 MINNESOTA RIVER BASIN
05320270 LITTLE COBB RIVER NEAR BEAUFORD, MN--Continued (National Water-Quality Assessment Program)
WATER-QUALITY DATA, WATER YEAR OCTOBER 2001 TO SEPTEMBER 2002 PEB- PENDI- PER- PRON- PRO- PRO- TEBU- ULATE METH- METHRIN PHORATE PRO- AMIDE PROPA- PANIL PARGITE SI- THIURON PARA- WATER ALIN CIS WATER METON, WATER CHLOR, WATER WATER MAZINE, WATER P,P’ THION, FILTRD WAT FLT WAT FLT FLTRD WATER, FLTRD WATER, FLTRD FLTRD WATER, FLTRD DDE DIS- 0.7 U 0.7 U 0.7 U 0.7 U DISS, 0.7 U DISS, 0.7 U 0.7 U DISS, 0.7 U Date DISSOLV SOLVED GF, REC GF, REC GF, REC GF, REC REC GF, REC REC GF, REC GF, REC REC GF, REC (UG/L) (UG/L) (UG/L) (UG/L) (UG/L) (UG/L) (UG/L) (UG/L) (UG/L) (UG/L) (UG/L) (UG/L) (UG/L) (34653) (39542) (82669) (82683) (82687) (82664) (04037) (82676) (04024) (82679) (82685) (04035) (82670) NOV 26... -- -- -- -- -- -- -- -- -- -- -- -- --DEC 18... <.003 <.007 <.002 <.010 <.006 <.011 <.01 <.004 <.010 <.011 <.02 <.011 <.02JAN 23... -- -- -- -- -- -- -- -- -- -- -- -- --FEB 26... <.003 <.010 <.004 <.022 <.006 <.011 <.01 <.004 <.010 <.011 <.02 <.005 <.02APR 17... <.003 <.010 <.004 <.022 <.006 <.011 <.01 <.004 <.010 <.011 <.02 <.005 <.02MAY 07... -- -- -- -- -- -- -- -- -- -- -- -- -- 07... <.003 <.010 <.004 <.022 <.006 <.011 <.01 <.004 <.010 <.011 <.02 <.005 <.02JUN 06... <.003 <.010 <.004 <.022 <.006 <.011 <.01 <.004 <.010 <.011 <.02 <.006 <.02 27... -- -- -- -- -- -- -- -- -- -- -- -- --JUL 25... <.003 <.010 <.004 <.022 <.006 <.011 <.01 <.004 <.010 <.011 <.02 <.005 <.02 25... .071 .125 .115 .106 .060 .051 .13 .117 .134 .138 .11 .067 .13AUG 23... <.003 <.010 <.004 <.022 <.006 <.011 E.01 <.031 <.010 <.011 <.02 <.005 <.02 23... -- -- -- -- -- -- -- -- -- -- -- -- --
TER- TER- THIO- TRIAL- TRI- BACIL BUFOS BENCARB LATE FLUR- WATER WATER WATER WATER ALIN SEDI- FLTRD FLTRD FLTRD FLTRD WAT FLT MENT, Data 0.7 U 0.7 U 0.7 U 0.7 U 0.7 U SUS- base Date GF, REC GF, REC GF, REC GF, REC GF, REC PENDED number (UG/L) (UG/L) (UG/L) (UG/L) (UG/L) (MG/L) (82665) (82675) (82681) (82678) (82661) (80154) NOV 26... -- -- -- -- -- 16 01 DEC 18... <.034 <.02 <.005 <.002 <.009 99 01 JAN 23... -- -- -- -- -- 117 01 FEB 26... <.034 <.02 <.005 <.002 <.009 61 01 APR 17... <.034 <.02 <.005 <.002 <.009 120 01 MAY 07... -- -- -- -- -- -- 77 07... <.034 <.02 <.005 <.002 <.009 97 01 JUN 06... <.034 <.02 <.005 <.002 <.009 131 01 27... -- -- -- -- -- -- 01 JUL 25... <.034 <.02 <.005 <.002 <.009 48 01 25... E.113 .08 .117 .113 .092 -- 77 AUG 23... <.034 <.02 <.005 <.002 <.009 147 01 23... -- -- -- -- -- 142 77

THIS PAGE IS INTENTIONALLY BLANK
225

226 MINNESOTA RIVER BASIN--Continued
05320500 LE SUEUR RIVER NEAR RAPIDAN, MN
LOCATION.--Lat 44°06’40", long 94°02’28", in SW1⁄4 sec. 35, T.108 N., R.27 W., Blue Earth County, Hydrologic Unit 07020011, on right bank 600 ft downstream from highway bridge, 1.8 mi northeast of Rapidan, and 2.3 mi upstream from mouth.
DRAINAGE AREA.--1,110 mi2.
PERIOD OF RECORD.--October 1939 to September 1945, July 1949 to current year.
GAGE.--Water-stage recorder. Datum of gage is 775.76 ft above sea level (NGVD of 1929). Prior to Nov. 15, 1939, nonrecording gage at same site and datum.
REMARKS.--Records good except those for estimated daily discharges, which are fair to poor.
EXTREMES FOR CURRENT YEAR.--Peak discharges greater than base discharge of 1,600 ft3/s and maximum (*):
Discharge Gage height Discharge Gage height Date Time (ft3/s) (ft) Date Time (ft3/s) (ft)
May 29 0400 2,100 4.81 Jun 23 0900 2,230 4.96 Jun 15 0200 *2,550 *5.33 Aug 24 0300 1,680 4.33
Minimum discharge, 34 ft3/s, Oct. 12, gage height, 0.96 ft.
DISCHARGE, CUBIC FEET PER SECOND, WATER YEAR OCTOBER 2001 TO SEPTEMBER 2002 DAILY MEAN VALUES DAY OCT NOV DEC JAN FEB MAR APR MAY JUN JUL AUG SEP 1 57 39 224 e54 e55 e85 244 722 701 784 176 301 2 54 40 205 e53 e55 e81 228 694 549 659 150 249 3 51 39 188 e53 e54 e78 207 640 655 587 133 205 4 47 39 173 e53 e54 e76 189 591 1030 523 197 172 5 44 42 164 e53 e56 e75 181 532 1460 446 353 148 6 42 46 159 e54 e62 e74 171 503 1520 384 1170 130 7 41 46 174 e55 e66 e77 173 467 1470 347 1250 115 8 41 45 e185 e55 e72 e82 174 477 1270 313 1220 102 9 37 45 e190 e57 e76 e86 173 463 1090 284 961 102 10 41 45 e190 e59 e83 e90 182 415 936 267 720 99 11 38 48 e185 e60 e86 e91 211 393 1280 265 517 88 12 35 48 185 e61 e91 e93 399 391 1780 255 393 78 13 46 50 e165 e61 e95 e115 696 386 2180 339 322 71 14 53 48 e141 e61 e98 e165 893 392 2480 386 296 77 15 63 48 e126 e61 e103 e330 862 395 2520 327 288 74 16 54 48 e116 e60 e108 e470 765 389 2240 273 254 76 17 49 48 e108 e59 e113 e700 686 373 1820 236 217 78 18 48 46 e100 e59 121 e910 607 361 1520 202 178 74 19 46 48 e94 e58 125 e970 539 353 1360 174 152 79 20 45 47 e87 e58 129 911 478 335 1290 155 134 67 21 45 48 e80 e58 122 668 459 315 1300 147 350 63 22 45 50 e72 e59 123 551 442 297 1940 136 1320 64 23 49 52 e65 e60 122 598 440 297 2220 117 1500 75 24 50 91 e60 e60 120 525 456 290 2120 181 1620 72 25 45 133 e58 e60 114 394 444 276 1920 291 1340 77 26 42 135 e57 e60 e105 372 436 266 1740 232 1110 83 27 42 172 e56 e60 e97 349 422 261 1780 186 852 79 28 40 221 e56 e59 e89 376 508 258 1440 165 659 103 29 40 234 e56 e59 --- 329 635 1530 1150 162 568 140 30 40 231 e56 e58 --- 282 702 939 943 148 459 167 31 40 --- e55 e57 --- 260 --- 781 --- 167 369 ---
TOTAL 1410 2272 3830 1794 2594 10263 13002 14782 45704 9138 19228 3308 MEAN 45.5 75.7 124 57.9 92.6 331 433 477 1523 295 620 110 MAX 63 234 224 61 129 970 893 1530 2520 784 1620 301 MIN 35 39 55 53 54 74 171 258 549 117 133 63 AC-FT 2800 4510 7600 3560 5150 20360 25790 29320 90650 18130 38140 6560 CFSM 0.04 0.07 0.11 0.05 0.08 0.30 0.39 0.43 1.37 0.27 0.56 0.10 IN. 0.05 0.08 0.13 0.06 0.09 0.34 0.44 0.50 1.53 0.31 0.64 0.11

227 MINNESOTA RIVER BASIN--Continued
05320500 LE SUEUR RIVER NEAR RAPIDAN, MN--Continued
STATISTICS OF MONTHLY MEAN DATA FOR WATER YEARS 1940 - 2002, BY WATER YEAR (WY)
OCT NOV DEC JAN FEB MAR APR MAY JUN JUL AUG SEP
MEAN 313 270 149 83.3 139 789 1431 973 1078 654 405 239 MAX 3300 1561 698 493 1299 3465 6563 3706 3913 2760 3656 1526 (WY) 1969 1993 1992 1992 1984 1983 1965 1960 1993 1993 1993 1993 MIN 7.41 11.1 5.04 2.96 1.68 33.0 48.3 18.8 40.4 20.6 8.20 7.55 (WY) 1990 1956 1959 1957 1959 1964 1957 1940 1950 1988 1989 1976
SUMMARY STATISTICS FOR 2001 CALENDAR YEAR FOR 2002 WATER YEAR WATER YEARS 1940 - 2002 ANNUAL TOTAL 419011 127325 ANNUAL MEAN 1148 349 545 HIGHEST ANNUAL MEAN 2035 1993 LOWEST ANNUAL MEAN 51.4 1977 HIGHEST DAILY MEAN 12800 Apr 6 2520 Jun 15 23400 Apr 8 1965 LOWEST DAILY MEAN 35 Oct 12 35 Oct 12 1.6 Feb 9 1959 ANNUAL SEVEN-DAY MINIMUM 37 Sep 13 39 Oct 6 1.6 Feb 9 1959 MAXIMUM PEAK FLOW 2550 Jun 15 24700 Apr 8 1965 MAXIMUM PEAK STAGE 5.33 Jun 15 22.72a May 22 1960 INSTANTANEOUS LOW FLOW 34 Oct 12 1.6 Feb 9 1959 ANNUAL RUNOFF (AC-FT) 831100 252500 394900 ANNUAL RUNOFF (CFSM) 1.03 0.31 0.49 ANNUAL RUNOFF (INCHES) 14.04 4.27 6.67 10 PERCENT EXCEEDS 3700 950 1510 50 PERCENT EXCEEDS 65 162 154 90 PERCENT EXCEEDS 44 48 18 a From highwater mark. e Estimated.
O N D2001
J F M A M J J A S2002
10
20
50
100100
200
500
10001000
2000
5000
10,000
DAILY-MEAN DISCHARGE,
IN CUBIC FEET PER SECOND
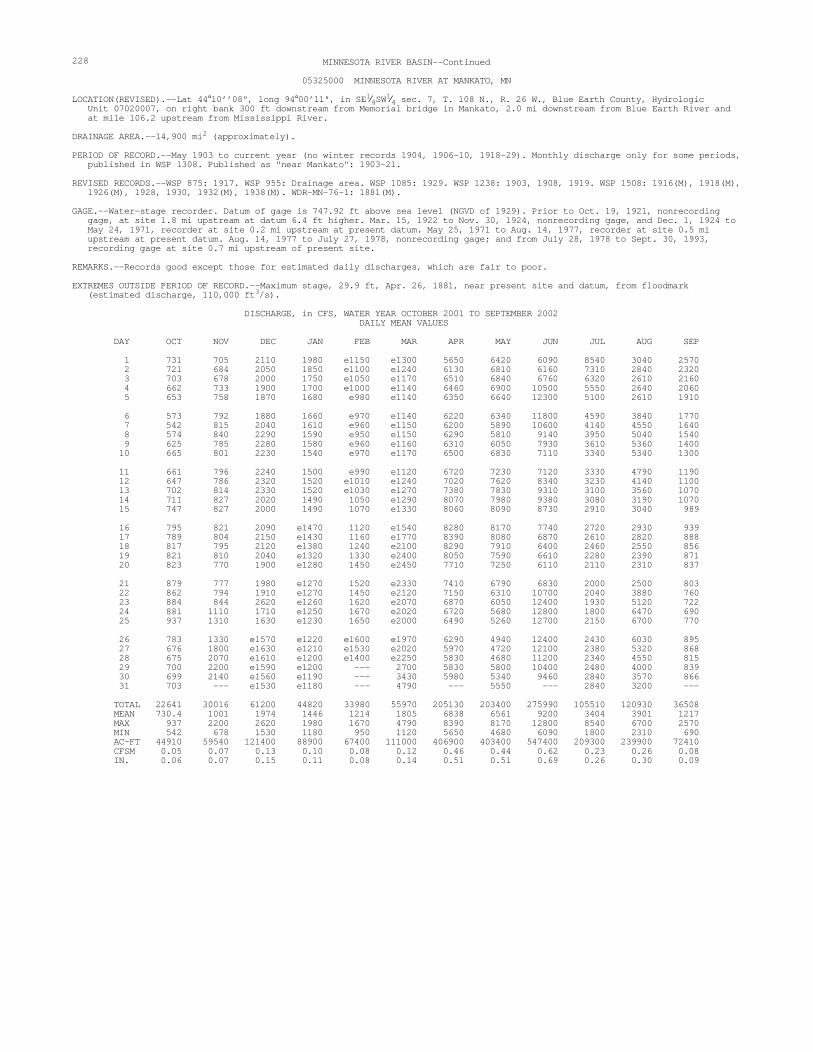
228 MINNESOTA RIVER BASIN--Continued
05325000 MINNESOTA RIVER AT MANKATO, MN
LOCATION(REVISED).--Lat 44°10’’08", long 94°00’11", in SE1⁄4SW1⁄4 sec. 7, T. 108 N., R. 26 W., Blue Earth County, Hydrologic
Unit 07020007, on right bank 300 ft downstream from Memorial bridge in Mankato, 2.0 mi downstream from Blue Earth River and at mile 106.2 upstream from Mississippi River.
DRAINAGE AREA.--14,900 mi2 (approximately).
PERIOD OF RECORD.--May 1903 to current year (no winter records 1904, 1906-10, 1918-29). Monthly discharge only for some periods, published in WSP 1308. Published as "near Mankato": 1903-21.
REVISED RECORDS.--WSP 875: 1917. WSP 955: Drainage area. WSP 1085: 1929. WSP 1238: 1903, 1908, 1919. WSP 1508: 1916(M), 1918(M), 1926(M), 1928, 1930, 1932(M), 1938(M). WDR-MN-76-1: 1881(M).
GAGE.--Water-stage recorder. Datum of gage is 747.92 ft above sea level (NGVD of 1929). Prior to Oct. 19, 1921, nonrecording gage, at site 1.8 mi upstream at datum 6.4 ft higher. Mar. 15, 1922 to Nov. 30, 1924, nonrecording gage, and Dec. 1, 1924 to May 24, 1971, recorder at site 0.2 mi upstream at present datum. May 25, 1971 to Aug. 14, 1977, recorder at site 0.5 mi upstream at present datum. Aug. 14, 1977 to July 27, 1978, nonrecording gage; and from July 28, 1978 to Sept. 30, 1993, recording gage at site 0.7 mi upstream of present site.
REMARKS.--Records good except those for estimated daily discharges, which are fair to poor.
EXTREMES OUTSIDE PERIOD OF RECORD.--Maximum stage, 29.9 ft, Apr. 26, 1881, near present site and datum, from floodmark (estimated discharge, 110,000 ft3/s).
DISCHARGE, in CFS, WATER YEAR OCTOBER 2001 TO SEPTEMBER 2002 DAILY MEAN VALUES DAY OCT NOV DEC JAN FEB MAR APR MAY JUN JUL AUG SEP 1 731 705 2110 1980 e1150 e1300 5650 6420 6090 8540 3040 2570 2 721 684 2050 1850 e1100 e1240 6130 6810 6160 7310 2840 2320 3 703 678 2000 1750 e1050 e1170 6510 6840 6760 6320 2610 2160 4 662 733 1900 1700 e1000 e1140 6460 6900 10500 5550 2640 2060 5 653 758 1870 1680 e980 e1140 6350 6640 12300 5100 2610 1910 6 573 792 1880 1660 e970 e1140 6220 6340 11800 4590 3840 1770 7 542 815 2040 1610 e960 e1150 6200 5890 10600 4140 4550 1640 8 574 840 2290 1590 e950 e1150 6290 5810 9140 3950 5040 1540 9 625 785 2280 1580 e960 e1160 6310 6050 7930 3610 5360 1400 10 665 801 2230 1540 e970 e1170 6500 6830 7110 3340 5340 1300 11 661 796 2240 1500 e990 e1120 6720 7230 7120 3330 4790 1190 12 647 786 2320 1520 e1010 e1240 7020 7620 8340 3230 4140 1100 13 702 814 2330 1520 e1030 e1270 7380 7830 9310 3100 3560 1070 14 711 827 2020 1490 1050 e1290 8070 7980 9380 3080 3190 1070 15 747 827 2000 1490 1070 e1330 8060 8090 8730 2910 3040 989 16 795 821 2090 e1470 1120 e1540 8280 8170 7740 2720 2930 939 17 789 804 2150 e1430 1160 e1770 8390 8080 6870 2610 2820 888 18 817 795 2120 e1380 1240 e2100 8290 7910 6400 2460 2550 856 19 821 810 2040 e1320 1330 e2400 8050 7590 6610 2280 2390 871 20 823 770 1900 e1280 1450 e2450 7710 7250 6110 2110 2310 837 21 879 777 1980 e1270 1520 e2330 7410 6790 6830 2000 2500 803 22 862 794 1910 e1270 1450 e2120 7150 6310 10700 2040 3880 760 23 884 844 2620 e1260 1620 e2070 6870 6050 12400 1930 5120 722 24 881 1110 1710 e1250 1670 e2020 6720 5680 12800 1800 6470 690 25 937 1310 1630 e1230 1650 e2000 6490 5260 12700 2150 6700 770 26 783 1330 e1570 e1220 e1600 e1970 6290 4940 12400 2430 6030 895 27 676 1800 e1630 e1210 e1530 e2020 5970 4720 12100 2380 5320 868 28 675 2070 e1610 e1200 e1400 e2250 5830 4680 11200 2340 4550 815 29 700 2200 e1590 e1200 --- 2700 5830 5800 10400 2480 4000 839 30 699 2140 e1560 e1190 --- 3430 5980 5340 9460 2840 3570 866 31 703 --- e1530 e1180 --- 4790 --- 5550 --- 2840 3200 ---
TOTAL 22641 30016 61200 44820 33980 55970 205130 203400 275990 105510 120930 36508 MEAN 730.4 1001 1974 1446 1214 1805 6838 6561 9200 3404 3901 1217 MAX 937 2200 2620 1980 1670 4790 8390 8170 12800 8540 6700 2570 MIN 542 678 1530 1180 950 1120 5650 4680 6090 1800 2310 690 AC-FT 44910 59540 121400 88900 67400 111000 406900 403400 547400 209300 239900 72410 CFSM 0.05 0.07 0.13 0.10 0.08 0.12 0.46 0.44 0.62 0.23 0.26 0.08 IN. 0.06 0.07 0.15 0.11 0.08 0.14 0.51 0.51 0.69 0.26 0.30 0.09

229 MINNESOTA RIVER BASIN--Continued
05325000 MINNESOTA RIVER AT MANKATO, MN--Continued
STATISTICS OF MONTHLY MEAN DATA FOR WATER YEARS 1903 - 2002, BY WATER YEAR (WY)
OCT NOV DEC JAN FEB MAR APR MAY JUN JUL AUG SEP
MEAN 1618 1570 1049 656.9 803.2 4493 9813 6045 6330 4604 2374 1630 MAX 14600 8569 4770 3009 4505 18230 52910 25740 34230 33130 23520 11070 (WY) 1969 1996 1983 1992 1983 1983 2001 2001 1993 1993 1993 1993 MIN 66.1 83.5 80.9 61.5 58.4 132 609 101 194 58.3 37.4 56.6 (WY) 1934 1934 1934 1940 1940 1934 1931 1934 1934 1934 1934 1934
SUMMARY STATISTICS FOR 2001 CALENDAR YEAR FOR 2002 WATER YEAR WATER YEARS 1903 - 2002 ANNUAL TOTAL 3356315 1196095 ANNUAL MEAN 9195 3277 3579a HIGHEST ANNUAL MEAN 14890 1993 LOWEST ANNUAL MEAN 136 1934 HIGHEST DAILY MEAN 73200 Apr 16 12800 Jun 24 92700 Apr 10 1965 LOWEST DAILY MEAN 410 Feb 25 542 Oct 7 31 Aug 3 1934 ANNUAL SEVEN-DAY MINIMUM 419 Feb 24 612 Oct 6 33 Jul 29 1934 MAXIMUM PEAK FLOW 13000 Jun 24 94100 Apr 10 1965 MAXIMUM PEAK STAGE 10.74 Jun 24 30.11 Jun 21 1993 INSTANTANEOUS LOW FLOW 531 Oct 7 26b Aug 4 1934 ANNUAL RUNOFF (AC-FT) 6657000 2372000 2593000 ANNUAL RUNOFF (CFSM) 0.62 0.22 0.24 ANNUAL RUNOFF (INCHES) 8.38 2.99 3.26 10 PERCENT EXCEEDS 32600 7480 9660 50 PERCENT EXCEEDS 1290 2020 1280 90 PERCENT EXCEEDS 481 793 180 a Median of annual mean discharges is 2,870 ft3/s. b Minimum observed. e Estimated.
O N D2001
J F M A M J J A S2002
100
200
500
10001000
2000
5000
10,00010,000
20,000
50,000
100,000
DAILY-MEAN DISCHARGE,
IN CUBIC FEET PER SECOND
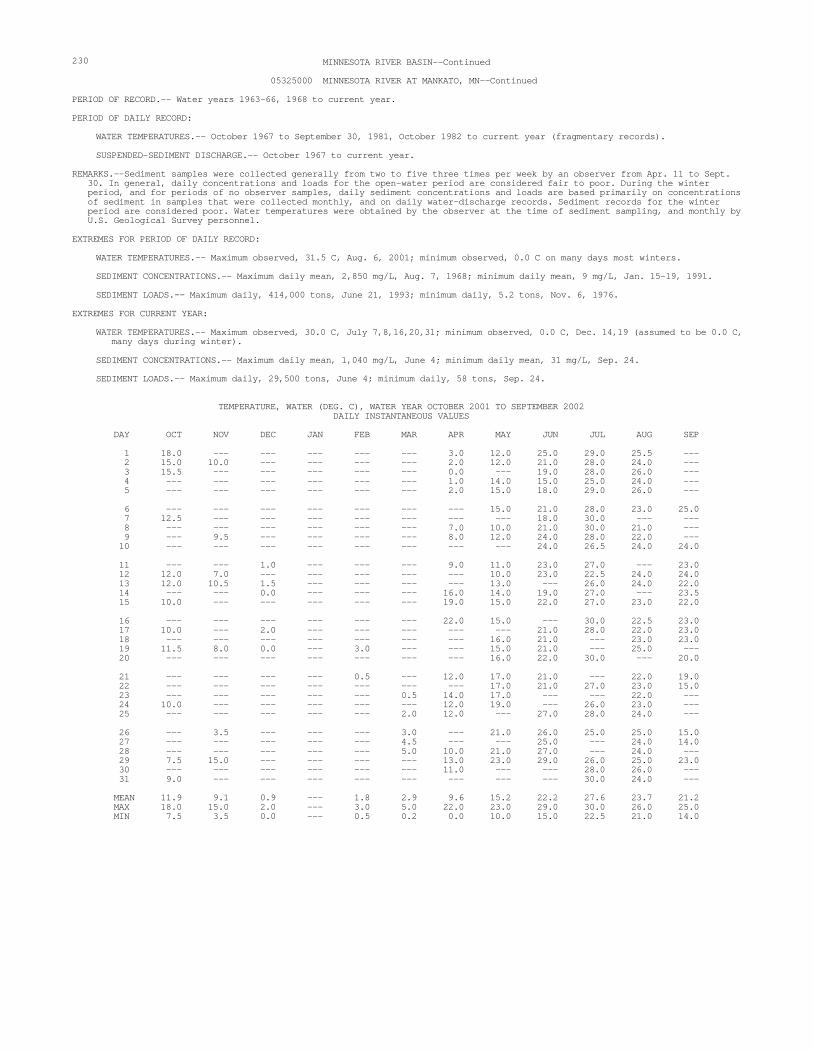
230 MINNESOTA RIVER BASIN--Continued
05325000 MINNESOTA RIVER AT MANKATO, MN--Continued
PERIOD OF RECORD.-- Water years 1963-66, 1968 to current year.
PERIOD OF DAILY RECORD:
WATER TEMPERATURES.-- October 1967 to September 30, 1981, October 1982 to current year (fragmentary records).
SUSPENDED-SEDIMENT DISCHARGE.-- October 1967 to current year.
REMARKS.--Sediment samples were collected generally from two to five three times per week by an observer from Apr. 11 to Sept. 30. In general, daily concentrations and loads for the open-water period are considered fair to poor. During the winter period, and for periods of no observer samples, daily sediment concentrations and loads are based primarily on concentrations of sediment in samples that were collected monthly, and on daily water-discharge records. Sediment records for the winter period are considered poor. Water temperatures were obtained by the observer at the time of sediment sampling, and monthly by U.S. Geological Survey personnel.
EXTREMES FOR PERIOD OF DAILY RECORD:
WATER TEMPERATURES.-- Maximum observed, 31.5 C, Aug. 6, 2001; minimum observed, 0.0 C on many days most winters.
SEDIMENT CONCENTRATIONS.-- Maximum daily mean, 2,850 mg/L, Aug. 7, 1968; minimum daily mean, 9 mg/L, Jan. 15-19, 1991.
SEDIMENT LOADS.-- Maximum daily, 414,000 tons, June 21, 1993; minimum daily, 5.2 tons, Nov. 6, 1976.
EXTREMES FOR CURRENT YEAR:
WATER TEMPERATURES.-- Maximum observed, 30.0 C, July 7,8,16,20,31; minimum observed, 0.0 C, Dec. 14,19 (assumed to be 0.0 C, many days during winter).
SEDIMENT CONCENTRATIONS.-- Maximum daily mean, 1,040 mg/L, June 4; minimum daily mean, 31 mg/L, Sep. 24.
SEDIMENT LOADS.-- Maximum daily, 29,500 tons, June 4; minimum daily, 58 tons, Sep. 24.
TEMPERATURE, WATER (DEG. C), WATER YEAR OCTOBER 2001 TO SEPTEMBER 2002 DAILY INSTANTANEOUS VALUES DAY OCT NOV DEC JAN FEB MAR APR MAY JUN JUL AUG SEP 1 18.0 --- --- --- --- --- 3.0 12.0 25.0 29.0 25.5 --- 2 15.0 10.0 --- --- --- --- 2.0 12.0 21.0 28.0 24.0 --- 3 15.5 --- --- --- --- --- 0.0 --- 19.0 28.0 26.0 --- 4 --- --- --- --- --- --- 1.0 14.0 15.0 25.0 24.0 --- 5 --- --- --- --- --- --- 2.0 15.0 18.0 29.0 26.0 --- 6 --- --- --- --- --- --- --- 15.0 21.0 28.0 23.0 25.0 7 12.5 --- --- --- --- --- --- --- 18.0 30.0 --- --- 8 --- --- --- --- --- --- 7.0 10.0 21.0 30.0 21.0 --- 9 --- 9.5 --- --- --- --- 8.0 12.0 24.0 28.0 22.0 --- 10 --- --- --- --- --- --- --- --- 24.0 26.5 24.0 24.0 11 --- --- 1.0 --- --- --- 9.0 11.0 23.0 27.0 --- 23.0 12 12.0 7.0 --- --- --- --- --- 10.0 23.0 22.5 24.0 24.0 13 12.0 10.5 1.5 --- --- --- --- 13.0 --- 26.0 24.0 22.0 14 --- --- 0.0 --- --- --- 16.0 14.0 19.0 27.0 --- 23.5 15 10.0 --- --- --- --- --- 19.0 15.0 22.0 27.0 23.0 22.0 16 --- --- --- --- --- --- 22.0 15.0 --- 30.0 22.5 23.0 17 10.0 --- 2.0 --- --- --- --- --- 21.0 28.0 22.0 23.0 18 --- --- --- --- --- --- --- 16.0 21.0 --- 23.0 23.0 19 11.5 8.0 0.0 --- 3.0 --- --- 15.0 21.0 --- 25.0 --- 20 --- --- --- --- --- --- --- 16.0 22.0 30.0 --- 20.0 21 --- --- --- --- 0.5 --- 12.0 17.0 21.0 --- 22.0 19.0 22 --- --- --- --- --- --- --- 17.0 21.0 27.0 23.0 15.0 23 --- --- --- --- --- 0.5 14.0 17.0 --- --- 22.0 --- 24 10.0 --- --- --- --- --- 12.0 19.0 --- 26.0 23.0 --- 25 --- --- --- --- --- 2.0 12.0 --- 27.0 28.0 24.0 --- 26 --- 3.5 --- --- --- 3.0 --- 21.0 26.0 25.0 25.0 15.0 27 --- --- --- --- --- 4.5 --- --- 25.0 --- 24.0 14.0 28 --- --- --- --- --- 5.0 10.0 21.0 27.0 --- 24.0 --- 29 7.5 15.0 --- --- --- --- 13.0 23.0 29.0 26.0 25.0 23.0 30 --- --- --- --- --- --- 11.0 --- --- 28.0 26.0 --- 31 9.0 --- --- --- --- --- --- --- --- 30.0 24.0 ---
MEAN 11.9 9.1 0.9 --- 1.8 2.9 9.6 15.2 22.2 27.6 23.7 21.2 MAX 18.0 15.0 2.0 --- 3.0 5.0 22.0 23.0 29.0 30.0 26.0 25.0 MIN 7.5 3.5 0.0 --- 0.5 0.2 0.0 10.0 15.0 22.5 21.0 14.0

231 MINNESOTA RIVER BASIN--Continued
05325000 MINNESOTA RIVER AT MANKATO, MN--Continued
SUSPENDED-SEDIMENT, WATER YEAR OCTOBER 2001 TO SEPTEMBER 2002 MEAN MEAN MEAN MEAN MEAN MEAN CONCEN- LOAD CONCEN- LOAD CONCEN- LOAD CONCEN- LOAD CONCEN- LOAD CONCEN- LOAD TRATION (TONS/ TRATION (TONS/ TRATION (TONS/ TRATION (TONS/ TRATION (TONS/ TRATION (TONS/ DAY (MG/L) DAY) (MG/L) DAY) (MG/L) DAY) (MG/L) DAY) (MG/L) DAY) (MG/L) DAY) OCTOBER NOVEMBER DECEMBER JANUARY FEBRUARY MARCH 1 75 148 137 261 159 906 194 770 159 494 147 615 2 74 144 136 251 158 875 193 740 155 460 144 630 3 74 140 136 249 158 853 191 707 152 431 143 660 4 74 132 136 269 158 811 191 691 149 402 141 678 5 74 130 135 276 159 803 190 667 147 389 141 697 6 73 113 134 287 159 807 189 648 145 380 140 696 7 73 107 133 293 165 909 189 623 144 373 137 673 8 73 113 133 302 172 1060 188 604 144 369 133 625 9 74 125 132 280 178 1100 188 599 143 371 126 561 10 87 156 132 285 182 1100 187 591 143 375 116 479 11 83 148 132 284 183 1110 187 596 143 382 108 426 12 81 141 138 293 185 1160 187 601 143 390 97 354 13 118 224 141 310 185 1160 187 611 144 400 86 302 14 138 265 137 306 185 1010 186 613 144 408 79 277 15 136 274 135 301 184 994 186 618 145 419 72 259 16 134 288 134 297 183 1030 186 613 148 448 69 287 17 133 283 134 291 182 1060 186 603 150 470 82 392 18 133 293 137 294 182 1040 186 593 153 512 94 533 19 132 293 136 297 181 997 186 588 157 564 95 616 20 131 291 133 277 181 929 186 583 159 622 90 595 21 131 311 133 279 180 962 186 593 160 657 85 535 22 136 317 132 283 190 980 185 619 159 622 82 469 23 155 370 165 376 226 1600 185 629 156 682 80 447 24 150 357 228 683 216 997 185 649 153 690 77 420 25 147 372 222 785 210 924 184 646 151 673 75 405 26 144 304 201 722 207 877 181 630 150 648 74 394 27 142 259 181 880 203 893 176 589 149 616 73 398 28 141 257 170 950 201 874 172 557 148 559 76 462 29 139 263 163 968 199 854 169 548 --- --- 90 656 30 138 260 160 924 197 830 165 530 --- --- 124 1150 31 137 260 --- --- 196 810 162 516 --- --- 160 2070
TOTAL --- 7138 --- 12553 --- 30315 --- 19165 --- 13806 --- 17761
MEAN MEAN MEAN MEAN MEAN MEAN CONCEN- LOAD CONCEN- LOAD CONCEN- LOAD CONCEN- LOAD CONCEN- LOAD CONCEN- LOAD TRATION (TONS/ TRATION (TONS/ TRATION (TONS/ TRATION (TONS/ TRATION (TONS/ TRATION (TONS/ DAY (MG/L) DAY) (MG/L) DAY) (MG/L) DAY) (MG/L) DAY) (MG/L) DAY) (MG/L) DAY)
APRIL MAY JUNE JULY AUGUST SEPTEMBER 1 201 3070 136 2360 177 2910 169 3900 99 813 105 729 2 259 4290 158 2910 165 2740 168 3320 93 713 103 645 3 346 6080 175 3230 308 5620 170 2900 110 775 102 595 4 343 5980 156 2910 1040 29500 172 2580 134 955 100 556 5 270 4630 130 2330 762 25300 173 2380 108 761 99 511 6 230 3860 113 1930 328 10500 168 2080 345 3580 95 454 7 206 3450 105 1670 257 7360 161 1800 305 3750 88 390 8 193 3280 101 1580 228 5630 149 1590 232 3160 83 345 9 193 3290 105 1720 203 4350 143 1390 205 2970 81 306 10 225 3950 178 3280 181 3470 198 1790 184 2650 78 274 11 223 4050 242 4720 323 6210 162 1460 169 2190 73 235 12 215 4080 233 4790 419 9440 140 1220 152 1700 69 205 13 213 4240 225 4760 414 10400 131 1100 141 1360 69 199 14 209 4550 222 4780 364 9220 123 1020 129 1110 80 231 15 201 4370 216 4720 331 7800 113 888 118 969 70 187 16 192 4290 213 4700 306 6390 107 786 110 870 64 162 17 183 4150 210 4580 282 5230 102 719 104 792 73 175 18 172 3850 207 4420 291 5030 95 631 100 688 77 178 19 157 3410 198 4060 263 4690 90 554 98 632 63 148 20 149 3100 184 3600 250 4120 84 479 97 605 51 115 21 181 3620 175 3210 422 7780 90 486 100 675 44 95.4 22 176 3400 167 2850 732 21100 90 496 315 3300 41 84.1 23 163 3020 155 2530 534 17900 83 433 320 4420 37 72.1 24 154 2790 151 2320 403 13900 132 642 275 4800 31 57.8 25 143 2510 151 2140 321 11000 99 575 231 4180 69 143 26 134 2280 178 2370 254 8500 78 512 200 3260 68 164 27 127 2050 222 2830 203 6630 76 488 177 2540 49 115 28 119 1870 276 3490 177 5350 103 651 155 1900 43 94.6 29 119 1870 339 5310 170 4770 131 877 135 1460 41 92.9 30 122 1970 224 3230 168 4290 118 905 122 1180 42 98.2 31 --- --- 199 2980 --- --- 107 820 112 968 --- --- TOTAL --- 107350 --- 102310 --- 267130 --- 39472 --- 59726 --- 7657.1
YEAR 684383.1

232 MINNESOTA RIVER BASIN--Continued
05327000 HIGH ISLAND CREEK NEAR HENDERSON, MN
LOCATION.--Lat 44°34’19", long 93°55’18", in NE1⁄4NW1⁄4 sec. 26, T.113 N., R.26 W., Sibley County, Hydrologic Unit 07020012, on
left bank 20 ft downstream from bridge on County Road 6, 1.6 mi upstream from mouth, and 3.1 mi north of Henderson.
DRAINAGE AREA.--238 mi2.
PERIOD OF RECORD.--October 1973 to current year. May 1970 to September 1973, operated as a low-flow station only.
REVISED RECORDS.--WDR-MN-80-2: 1974-75, 1977-79, WRD MN-98: 1993.
GAGE.--Water-stage recorder. Datum of gage is 728.56 ft above sea level (NGVD of 1929).
REMARKS.--Records good except those for estimated daily discharges, which are fair to poor.
DISCHARGE, CUBIC FEET PER SECOND, WATER YEAR OCTOBER 2001 TO SEPTEMBER 2002 DAILY MEAN VALUES
DAY OCT NOV DEC JAN FEB MAR APR MAY JUN JUL AUG SEP 1 1.6 2.3 3.4 e4.2 e2.9 e5.8 23 19 42 543 155 126 2 1.7 2.2 3.4 e4.1 e3.0 5.0 28 19 42 483 123 164 3 1.8 2.2 3.3 e4.0 e3.0 e4.8 25 19 494 399 111 139 4 1.7 2.4 3.4 e4.1 e3.1 e4.6 18 18 615 322 460 118 5 1.9 2.4 3.7 4.3 e3.2 4.4 20 18 322 257 536 103 6 1.9 2.4 3.9 4.4 3.1 3.9 17 25 240 201 423 96 7 2.0 2.5 4.0 e4.2 3.3 3.9 18 23 212 164 356 88 8 2.2 2.5 4.1 4.0 3.5 4.0 25 105 192 141 303 79 9 2.3 2.9 4.0 3.9 3.7 e3.9 24 91 169 126 252 72 10 2.4 2.2 4.2 3.9 3.8 e3.8 29 60 146 122 205 66 11 2.4 2.4 4.1 3.8 3.8 e3.7 33 51 243 119 170 62 12 2.6 2.4 4.1 3.6 3.8 3.6 35 60 141 113 150 58 13 3.1 2.5 3.9 3.6 3.8 4.1 37 57 120 102 133 53 14 3.0 2.7 3.8 3.6 4.1 4.9 41 50 107 94 117 51 15 2.9 2.6 3.8 3.5 4.4 e4.8 41 45 97 86 103 48 16 2.9 2.6 3.9 3.5 4.7 e4.6 40 44 87 77 95 46 17 3.0 2.6 3.9 e3.4 4.9 5.0 39 41 82 70 121 43 18 2.9 3.0 5.1 e3.4 4.3 5.8 36 38 82 68 114 41 19 2.8 2.8 4.7 e3.3 4.9 6.9 31 37 119 73 104 40 20 3.0 2.5 4.7 e3.1 5.6 7.8 27 35 132 77 95 40 21 2.9 2.7 4.7 e2.9 5.2 e7.5 25 33 850 71 267 38 22 3.0 2.7 5.2 e2.7 5.0 e7.0 22 32 969 65 416 36 23 3.1 2.9 e5.8 2.9 5.6 e6.4 20 31 668 61 328 35 24 2.8 6.9 e5.6 e2.7 6.4 5.6 18 29 626 57 299 32 25 2.6 7.2 e5.2 2.6 e6.3 e5.5 17 29 1240 55 293 35 26 2.5 5.2 e4.8 2.8 e6.2 e5.5 16 29 1010 54 280 41 27 2.4 4.8 4.8 2.9 e6.2 11 17 30 794 49 259 39 28 2.4 4.1 4.3 2.9 6.1 31 21 47 703 53 223 38 29 2.4 3.8 e4.2 2.8 --- 35 19 108 644 171 189 38 30 2.5 3.6 4.3 e2.8 --- 28 19 62 592 205 158 40 31 2.4 --- e4.2 2.9 --- 24 --- 47 --- 181 136 ---
TOTAL 77.1 94.0 132.5 106.8 123.9 261.8 781 1332 11780 4659 6974 1905 MEAN 2.49 3.13 4.27 3.45 4.42 8.45 26.0 43.0 393 150 225 63.5 MAX 3.1 7.2 5.8 4.4 6.4 35 41 108 1240 543 536 164 MIN 1.6 2.2 3.3 2.6 2.9 3.6 16 18 42 49 95 32 AC-FT 153 186 263 212 246 519 1550 2640 23370 9240 13830 3780 CFSM 0.01 0.01 0.02 0.01 0.02 0.04 0.11 0.18 1.66 0.63 0.95 0.27 IN. 0.01 0.01 0.02 0.02 0.02 0.04 0.12 0.21 1.85 0.73 1.09 0.30

233 MINNESOTA RIVER BASIN--Continued
05327000 HIGH ISLAND CREEK NEAR HENDERSON, MN--Continued
STATISTICS OF MONTHLY MEAN DATA FOR WATER YEARS 1974 - 2002, BY WATER YEAR (WY)
OCT NOV DEC JAN FEB MAR APR MAY JUN JUL AUG SEP
MEAN 67.8 57.8 32.3 14.2 22.4 155 274 158 169 125 81.1 93.2 MAX 298 219 111 72.5 121 547 1104 478 646 783 380 592 (WY) 1986 1993 1983 1992 1984 1992 2001 1993 1993 1993 1997 1991 MIN 1.51 2.11 1.37 0.98 1.28 5.33 6.69 3.32 1.58 0.80 1.16 1.18 (WY) 1990 1990 1976 1977 1989 2001 1990 1976 1976 1976 1976 1974
SUMMARY STATISTICS FOR 2001 CALENDAR YEAR FOR 2002 WATER YEAR WATER YEARS 1974 - 2002 ANNUAL TOTAL 53916.4 28232.4 ANNUAL MEAN 148 77.3 104 HIGHEST ANNUAL MEAN 293 1993 LOWEST ANNUAL MEAN 9.23 1976 HIGHEST DAILY MEAN 2400 Apr 12 1240 Jun 25 2400 Apr 12 2001 LOWEST DAILY MEAN 1.6 Oct 1 1.6 Oct 1 0.46 Oct 3 1976 ANNUAL SEVEN-DAY MINIMUM 1.7 Sep 28 1.8 Oct 1 0.59 Jul 10 1976 MAXIMUM PEAK FLOW 1660 Jun 21,25 2830a Jul 25 1997 MAXIMUM PEAK STAGE 9.48 Jun 21 9.88 Apr 23 2001 INSTANTANEOUS LOW FLOW 1.4 Oct 1 0.20b Jan 4 1981 ANNUAL RUNOFF (AC-FT) 106900 56000 75560 ANNUAL RUNOFF (CFSM) 0.62 0.33 0.44 ANNUAL RUNOFF (INCHES) 8.46 4.43 5.98 10 PERCENT EXCEEDS 514 205 297 50 PERCENT EXCEEDS 3.8 18 28 90 PERCENT EXCEEDS 2.3 2.7 2.0 a Backwater from Minnesota River. b Result of freezeup. e Estimated.
O N D2001
J F M A M J J A S2002
1
2
5
1010
20
50
100100
200
500
10001000
2000
5000
10,000
DAILY-MEAN DISCHARGE,
IN CUBIC FEET PER SECOND

234 MINNESOTA RIVER BASIN--Continued
05330000 MINNESOTA RIVER NEAR JORDAN, MN
LOCATION.--Lat 44°41’35", long 93°38’30", in NW1⁄4SW1⁄4 sec. 7, T.114 N., R.23 W., Carver County, Hydrologic Unit 07020012, on
right bank 100 ft downstream from bridge on Scott County Highway 9, 1.5 mi northwest of Jordan, and at mile 39.4 uptream from Mississippi River.
DRAINAGE AREA.--16,200 mi2 (approximately).
PERIOD OF RECORD.--September 1934 to current year. Prior to Oct. 1, 1966, published as "near Carver, Minn".
REVISED RECORDS.--WSP 955: Drainage area. WSP 1508: 1935. WDR MN-87-2: 1976 (cal. yr. summary).
GAGE.--Water-stage recorder. Datum of gage is 690.00 ft above sea level (NGVD of 1929). Prior to Oct. 1, 1966, water-stage recorder 2.8 mi downstream with auxiliary nonrecording gage at present site and present datum.
REMARKS.--Records good except those for estimated daily discharges, which are fair to poor.
DISCHARGE, CUBIC FEET PER SECOND, WATER YEAR OCTOBER 2001 TO SEPTEMBER 2002 DAILY MEAN VALUES DAY OCT NOV DEC JAN FEB MAR APR MAY JUN JUL AUG SEP 1 976 908 2200 e1650 e1380 e1500 4540 5930 5320 12200 3280 4310 2 970 901 2150 e1580 e1360 e1580 5510 e6280 5670 10700 3190 3810 3 984 882 2130 e1550 e1320 e1600 6040 6640 6810 9250 3200 3340 4 964 866 2080 e1520 e1320 e1620 6400 6730 10100 7910 4720 3020 5 930 862 2010 e1510 e1310 e1690 6500 6750 13100 6840 5220 2850 6 893 902 1910 e1590 e1300 e1780 6450 6670 14300 6090 4860 2790 7 863 940 1880 e1670 e1300 e1880 6390 6360 14100 5450 5040 2600 8 818 968 1940 e1700 e1310 e1870 6390 6280 12700 4860 5680 2420 9 796 957 2130 e1660 e1310 e1830 6440 6520 11000 4500 6000 2240 10 841 966 2270 e1630 e1300 e1750 6530 6630 e10000 4250 6120 2090 11 888 953 2240 e1620 e1300 e1690 6780 7000 e8400 4050 6000 1940 12 902 957 2240 e1580 e1300 e1680 7060 7460 7970 4050 5530 1830 13 904 975 2260 e1580 e1290 e1680 7350 7770 8520 3950 4980 1740 14 907 976 2320 e1580 e1300 e1700 7700 7960 9450 e3660 4210 1670 15 925 976 2180 e1570 e1310 1730 8220 8070 9570 e3400 3790 1610 16 924 980 2050 e1580 e1320 1880 8280 8140 9080 e3210 3490 1550 17 946 988 2080 e1580 e1340 2090 8460 8130 8180 e3130 3780 1490 18 985 982 2140 e1590 e1360 2300 8560 8040 7270 e2960 3640 1430 19 990 964 2140 e1560 e1380 2600 8470 7880 6780 e2880 3340 1390 20 1000 942 2100 e1500 e1400 2980 8240 7590 6960 2730 3000 1370 21 1010 948 1840 e1470 e1440 e3020 7980 7230 e8100 2570 3490 1330 22 1010 936 1800 e1450 e1520 e2930 7680 6820 e10900 2380 4680 1280 23 1060 943 1710 e1430 e1550 e2750 7380 6390 e13700 2290 5510 1240 24 1070 1030 1670 e1440 e1520 e2700 7100 6010 16500 2250 6570 1190 25 1070 1160 1470 e1440 e1520 e2650 6800 5670 17300 2150 7810 1180 26 1050 1290 1370 e1430 1640 e2500 6590 5280 18200 2190 8290 1250 27 1040 1460 1400 e1420 1450 2530 6390 4970 18100 2510 7690 1300 28 945 1580 1670 e1410 e1390 2550 6230 4720 17300 2560 6910 1340 29 905 1910 1790 e1400 --- 2910 6000 4840 15800 2800 5940 1310 30 893 2130 e1750 e1390 --- 3100 5940 5500 14000 2960 5270 1270 31 898 --- e1710 e1390 --- 3540 --- 5370 --- 3180 4660 ---
TOTAL 29357 32232 60630 47470 38540 68610 208400 205630 335180 133910 155890 58180 MEAN 947 1074 1956 1531 1376 2213 6947 6633 11170 4320 5029 1939 MAX 1070 2130 2320 1700 1640 3540 8560 8140 18200 12200 8290 4310 MIN 796 862 1370 1390 1290 1500 4540 4720 5320 2150 3000 1180 AC-FT 58230 63930 120300 94160 76440 136100 413400 407900 664800 265600 309200 115400 CFSM 0.06 0.07 0.12 0.09 0.08 0.14 0.43 0.41 0.69 0.27 0.31 0.12 IN. 0.07 0.07 0.14 0.11 0.09 0.16 0.48 0.47 0.77 0.31 0.36 0.13

235 MINNESOTA RIVER BASIN--Continued
05330000 MINNESOTA RIVER NEAR JORDAN, MN--Continued
STATISTICS OF MONTHLY MEAN DATA FOR WATER YEARS 1935 - 2002, BY WATER YEAR (WY)
OCT NOV DEC JAN FEB MAR APR MAY JUN JUL AUG SEP
MEAN 2174 2145 1518 934 1021 5118 12920 8318 7992 5955 3321 2239 MAX 16030 9463 5216 3344 3992 21170 59030 31480 41460 38640 25660 14460 (WY) 1969 1996 1983 1992 1983 1983 2001 2001 1993 1993 1993 1993 MIN 167 178 158 111 130 322 926 923 633 279 178 183 (WY) 1935 1935 1977 1940 1940 1940 1959 1959 1976 1936 1936 1976
SUMMARY STATISTICS FOR 2001 CALENDAR YEAR FOR 2002 WATER YEAR WATER YEARS 1935 - 2002 ANNUAL TOTAL 3854133 1374029 ANNUAL MEAN 10560 3764 4477a HIGHEST ANNUAL MEAN 16910 1993 LOWEST ANNUAL MEAN 687 1940 HIGHEST DAILY MEAN 86200 Apr 18 18200 Jun 26 112000 Apr 11 1965 LOWEST DAILY MEAN 520 Feb 27 796 Oct 9 85 Jan 21 1940 ANNUAL SEVEN-DAY MINIMUM 527 Feb 24 857 Oct 6 89 Jan 20 1940 MAXIMUM PEAK FLOW 18300 Jun 26 117000 Apr 11 1965 MAXIMUM PEAK STAGE 20.62 Jun 26 35.07 Apr 12 1965 INSTANTANEOUS LOW FLOW 791 Oct 9 79 Nov 17 1955 ANNUAL RUNOFF (AC-FT) 7645000 2725000 3243000 ANNUAL RUNOFF (CFSM) 0.65 0.23 0.28 ANNUAL RUNOFF (INCHES) 8.85 3.16 3.75 10 PERCENT EXCEEDS 33100 8050 11900 50 PERCENT EXCEEDS 1420 2150 1840 90 PERCENT EXCEEDS 650 973 326 a Median of annual mean discharges is 3,710 ft3/s. e Estimated.
O N D2001
J F M A M J J A S2002
100
200
500
10001000
2000
5000
10,00010,000
20,000
50,000
100,000
DAILY-MEAN DISCHARGE,
IN CUBIC FEET PER SECOND

236 UPPER MISSISSIPPI RIVER MAIN STEM--Continued
05331000 MISSISSIPPI RIVER AT ST. PAUL, MN
LOCATION.--Lat 44°56’01", long 93°06’20", in NE1⁄4NE1⁄4 sec.13, T. 28 N., R. 22 W., Ramsey County, Hydrologic Unit 07010206, on
left bank in St. Paul, 100 ft upstream from Smith Ave. Bridge, 4.8 mi downstream from Minnesota River, and at mile 840.5 upstream from Ohio River.
DRAINAGE AREA.--36,800 mi2 (approximately).
PERIOD OF RECORD.--Water year 1867-69, 1872-92 (annual maximums), March 1892 to current year (prior to 1901, fragmentary during some winters). Records prior to March 1892, published in the 19th Annual Report, Part 4, have been found to be unreliable and should not be used. Monthly discharge only for some periods, published in WSP 1308. Gage-height records (winter records incomplete) collected at same site since 1866 are contained in reports of U.S. Weather Bureau, War Department and Mississippi River Commission.
REVISED RECORDS.--WSP 285: 1892-96. WSP 715: Drainage area. WSP 875: 1938. WSP 895: 1939. WSP 1308: 1867(M). WSP 1508: 1897, 1898(M). 1903(M), 1917-18(M). 1928(M), 1929. WRD MN-74: 1973.
GAGE.--Water-stage recorder. Datum of gage is 683.62 ft above sea level (NGVD of 1929). Prior to Mar. 18, 1925, nonrecording gage at several sites within 300 ft of each other and 1.2 miles downstream of present site at present datum. Mar. 19, 1925 to June 24, 1999, recording gage 1.2 miles downstream of present site at present datum. Since September 1938, auxiliary water-stage recorder 5.6 mi downstream.
REMARKS.--Records good except those for estimated days, which are fair to poor. Flow-routing techniques were used from Oct. 1, 2001 to April 11, 2002, April 28 to June 24, 2002 and July 19 to Sept. 30, 2002. Routed discharges are considered fair to poor. Slight regulation, except during extreme floods, by reservoirs on headquarters and by power plants. Beginning July 20, 1939, effluent from Minneapolis and St. Paul, which formerly entered the river above station, was diverted to a wasterwater treatment plant, thence to river about 4 miles below station. Daily-mean discharge figures do not include this diversion.
COOPERATION.--Records of discharge from the Metro Plant wastewater treatment plant were provided by the Metropolitan Council - Environmental Services.
DISCHARGE, CUBIC FEET PER SECOND, WATER YEAR OCTOBER 2001 TO SEPTEMBER 2002 DAILY MEAN VALUES DAY OCT NOV DEC JAN FEB MAR APR MAY JUN JUL AUG SEP 1 4850 7370 7990 e6910 e6090 e6460 12200 20800 13600 41600 17900 18900 2 5120 6820 8540 e6890 e5970 e6240 14300 20500 13700 39800 17400 17800 3 5100 6900 9060 e6940 e6100 e6110 15400 e21200 14100 37900 17100 18500 4 4720 6610 9440 e7080 e5820 e6090 15500 20800 15100 34800 16900 18800 5 4680 6390 9810 e7170 e5890 e6160 15600 20400 18200 31200 21800 18000 6 4640 6780 9350 e7310 e5940 e6080 15400 20500 20800 28700 23300 17200 7 4680 6410 10000 e7380 e5880 e6010 16200 20000 21900 27000 23400 19900 8 4410 6580 10100 e7510 e5660 e6060 e17000 19300 21600 24600 24200 21500 9 4380 6480 10200 e7610 e5670 e5980 18000 19900 20300 23400 24700 20200 10 4830 6290 9400 e7680 e5630 e5950 18900 22600 18000 26400 24700 19100 11 5030 5750 9270 e7780 e5550 e5800 19800 22600 e17100 31200 23800 19300 12 5000 6200 9730 e7760 e5500 e6050 22600 24000 e15200 33600 22700 19100 13 5170 6290 10100 e7690 e5500 e6290 24400 25600 14700 34800 21200 18500 14 5510 6510 10200 e7650 e5500 e6370 26100 26500 15100 33300 19600 17500 15 5550 7130 9410 e7670 e5490 e6190 28600 27200 15900 32300 18400 17500 16 6200 6720 9720 e7610 e5490 e5860 30900 27900 15800 31600 17200 16600 17 6380 6300 9650 e7530 e5500 e5840 32000 28100 15200 30400 16500 15900 18 6540 6640 9570 e7150 e5500 6360 32500 27700 13900 29400 16100 15100 19 6540 6350 10300 e7050 e5670 6750 31900 27200 12600 e29400 16100 14000 20 6990 6700 10600 e6900 e5730 6910 30900 26100 12000 e27700 16100 13800 21 6670 6280 8970 e7030 e5840 7160 29800 25000 13200 e26400 15800 12500 22 6730 5980 8200 e7020 e5950 7220 28900 23400 e16400 24600 17500 11800 23 6750 6490 7920 e6870 e6010 e7160 27500 21500 e21000 22900 19200 10900 24 6630 6380 7600 e6620 e6140 e7160 26200 20300 e24300 21500 20300 10700 25 6940 6640 6610 e6540 e6330 e7350 24900 18700 31900 19500 21200 10000 26 7500 7130 e6380 e6500 e6400 e7210 23900 17400 34400 19300 22800 9850 27 6940 7230 e6320 e6290 e6360 e7130 23100 16600 37800 18100 24200 10100 28 6370 7830 e6140 e6350 e6380 e6960 22900 15700 41300 17300 22900 9600 29 6460 8090 e6170 e6380 --- 7280 22700 14700 42800 18100 21700 9380 30 7150 8080 e6230 e6320 --- 8330 21600 14000 43000 17900 20200 9610 31 7020 --- e6560 e6250 --- 9910 --- 14700 --- 17600 19600 ---
TOTAL 181480 201350 269540 219440 163490 206430 689700 670900 630900 852300 624500 461640 MEAN 5854 6712 8695 7079 5839 6659 22990 21640 21030 27490 20150 15390 MAX 7500 8090 10600 7780 6400 9910 32500 28100 43000 41600 24700 21500 MIN 4380 5750 6140 6250 5490 5800 12200 14000 12000 17300 15800 9380 AC-FT 360000 399400 534600 435300 324300 409500 1368000 1331000 1251000 1691000 1239000 915700 CFSM 0.16 0.18 0.24 0.19 0.16 0.18 0.62 0.59 0.57 0.75 0.55 0.42 IN. 0.18 0.20 0.27 0.22 0.17 0.21 0.70 0.68 0.64 0.86 0.63 0.47
+ 303 293 265 293 286 294 320 340 368 376 391 347 ‡MEAN 6160 7000 8960 7370 6160 6950 23200 22000 21400 27900 20500 15700 ‡CFSM 0.17 0.19 0.24 0.20 0.17 0.19 0.63 0.60 0.58 0.76 0.56 0.43 ‡IN 0.19 0.21 0.28 0.23 0.18 0.22 0.71 0.69 0.65 0.87 0.64 0.48

237 UPPER MISSISSIPPI RIVER MAIN STEM--Continued
05331000 MISSISSIPPI RIVER AT ST. PAUL, MN--Continued
STATISTICS OF MONTHLY MEAN DATA FOR WATER YEARS 1892 - 2002, BY WATER YEAR (WY)
OCT NOV DEC JAN FEB MAR APR MAY JUN JUL AUG SEP
MEAN 8529 7911 5759 4656 4614 11140 26600 21380 18520 14640 9023 8107 MAX 38210 27660 16080 11500 14700 43240 96590 70430 57170 73590 42550 34380 (WY) 1987 1972 1983 1983 1966 1983 2001 2001 1993 1993 1993 1986 MIN 1289 1348 1277 1097 1300 1757 3421 3085 1980 1272 864 1143 (WY) 1937 1937 1935 1935 1895 1940 1895 1934 1934 1934 1934 1934
SUMMARY STATISTICS FOR 2001 CALENDAR YEAR FOR 2002 WATER YEAR WATER YEARS 1892 - 2002 ANNUAL TOTAL 8718520 5171670 ANNUAL MEAN 23890 14170 11820 HIGHEST ANNUAL MEAN 29580 1986 LOWEST ANNUAL MEAN 1935 1934 HIGHEST DAILY MEAN 142000 Apr 18 43000 Jun 30 171000 Apr 16 1965 LOWEST DAILY MEAN 4340 Sep 30 4380 Oct 9 632 Aug 26 1934 ANNUAL SEVEN-DAY MINIMUM 4620 Oct 4 4620 Oct 4 741 Aug 26 1934 MAXIMUM PEAK FLOW 43400 Jun 29 171000 Apr 16 1965 MAXIMUM PEAK STAGE 9.52 Jun 29 26.01 Apr 16 1965 ANNUAL RUNOFF (AC-FT) 17290000 10260000 8563000 ANNUAL RUNOFF (CFSM) 0.65 0.39 0.32 ANNUAL RUNOFF (INCHES) 8.81 5.23 4.36 10 PERCENT EXCEEDS 68300 27100 27400 50 PERCENT EXCEEDS 6940 10100 7150 90 PERCENT EXCEEDS 5300 5920 2700 + Diversion, in cubic feet per second, from wastewater treatment plant. ‡ Adjusted for discharges from wastewater treatment plant. e Estimated.
O N D2001
J F M A M J J A S2002
1000
2000
5000
10,00010,000
20,000
50,000
100,000
DAILY-MEAN DISCHARGE,
IN CUBIC FEET PER SECOND

238 UPPER MISSISSIPPI RIVER MAIN STEM--Continued
05331580 MISSISSIPPI RIVER BELOW LOCK AND DAM 2, AT HASTINGS, MN
LOCATION.--Lat 44°44’48", long 92°51’08", SE1⁄4SE1⁄4 sec. 21, T.115 N., R.17 W., Dakota County, Hydrologic Unit 07010206, near
bridge on U.S. Highway 61 in Hastings, 1.2 mi downstream from Lock and Dam 2, 2.5 mi upstream from St. Croix River, and at mile 813.8 upstream from Ohio River.
DRAINAGE AREA.--37,050 mi2.
PERIOD OF RECORD.--October 1996 to current year.
REMARKS.-- Records fair to poor. Water-discharge computed on the basis of routed discharge for Mississippi River at St. Paul (station 05331000) adjusted for inflow (including metropolitan wastewater treatment plant) and travel time.
DISCHARGE, CUBIC FEET PER SECOND, WATER YEAR OCTOBER 2001 TO SEPTEMBER 2002 DAILY MEAN VALUES DAY OCT NOV DEC JAN FEB MAR APR MAY JUN JUL AUG SEP 1 5840 7560 8660 7050 6760 6900 10500 22700 15500 44900 18600 20800 2 5340 7930 8580 7440 6590 6980 12900 21800 14400 43400 18900 19900 3 5620 7330 9160 7440 6450 6750 15100 21500 14500 41500 18400 18800 4 5600 7400 9690 7490 6600 6620 16200 22200 14900 39600 18100 19500 5 5200 7130 10100 7620 6320 6600 16300 21800 16000 36300 17900 19900 6 5140 6920 10400 7720 6390 6660 16400 21500 19200 32600 23000 19000 7 5110 7310 9950 7870 6440 6580 16200 21600 21900 30000 24500 18200 8 5150 6930 10600 7940 6380 6510 17100 21100 23000 28300 24600 21000 9 4880 7110 10700 8080 6150 6570 17900 20400 22700 25800 25400 22600 10 4850 7000 10800 8190 6160 6480 18900 21000 21300 24600 25900 21300 11 5320 6800 9980 8250 6120 6450 19900 23700 19000 27800 25900 20200 12 5520 6240 9850 8350 6040 6300 20800 23800 18000 32700 25000 20400 13 5480 6720 10300 8320 5980 6580 23700 25200 16100 35100 23800 20200 14 5670 6800 10700 8250 5980 6820 25600 26800 15600 36400 22300 19400 15 6010 7030 10800 8220 5980 6880 27300 27800 15900 34800 20600 18400 16 6070 7680 9990 8260 5970 6700 29900 28500 16800 33800 19400 18400 17 6730 7250 10300 8180 5980 6360 32300 29200 16700 33100 18200 17500 18 6910 6790 10300 8100 5970 6440 33400 29400 16100 31800 17400 16900 19 7080 7170 10200 7700 6000 6900 33900 29000 14700 30800 17000 16000 20 7070 6870 10900 7590 6160 7290 33300 28500 13400 30800 17000 14900 21 7530 7230 11200 7420 6220 7450 32300 27300 12700 29000 17100 14600 22 7200 6800 9540 7570 6330 7710 31100 26200 14200 27700 16900 13200 23 7270 6460 8740 7560 6450 7770 30200 24600 17400 25800 18500 12500 24 7290 7020 8450 7400 6510 7700 28800 22600 22100 24000 20300 11600 25 7170 6960 8110 7140 6640 7700 27400 21300 25700 22600 21400 11400 26 7480 7180 7060 7060 6840 7910 26100 19600 33500 20600 22300 10600 27 8060 7700 6870 7020 6910 7760 25000 18300 35900 20300 24000 10500 28 7470 7800 6800 6800 6880 7690 24200 17500 39500 19100 25400 10800 29 6890 8420 6610 6860 --- 7520 24100 16600 43100 18300 24100 10200 30 6990 8670 6640 6890 --- 7840 23800 15500 44700 19100 22800 10000 31 7700 --- 6690 6830 --- 8920 --- 14800 --- 18900 21300 ---
TOTAL 195640 216210 288670 236610 177200 219340 710600 711800 634500 919500 656000 498700 MEAN 6311 7207 9312 7633 6329 7075 23690 22960 21150 29660 21160 16620 MAX 8060 8670 11200 8350 6910 8920 33900 29400 44700 44900 25900 22600 MIN 4850 6240 6610 6800 5970 6300 10500 14800 12700 18300 16900 10000 AC-FT 388100 428900 572600 469300 351500 435100 1409000 1412000 1259000 1824000 1301000 989200 CFSM 0.17 0.19 0.25 0.21 0.17 0.19 0.64 0.62 0.57 0.80 0.57 0.45 IN. 0.20 0.22 0.29 0.24 0.18 0.22 0.71 0.71 0.64 0.92 0.66 0.50

239 UPPER MISSISSIPPI RIVER MAIN STEM--Continued
05331580 MISSISSIPPI RIVER BELOW LOCK AND DAM 2, AT HASTINGS, MN--Continued
STATISTICS OF MONTHLY MEAN DATA FOR WATER YEARS 1996 - 2002, BY WATER YEAR (WY)
OCT NOV DEC JAN FEB MAR APR MAY JUN JUL AUG SEP
MEAN 10490 13270 10320 7784 7796 13910 49360 36440 27730 23670 13390 8992 MAX 25600 24960 13290 9657 10040 20360 95650 76140 52600 36910 23560 16620 (WY) 1996 1996 1997 1996 1998 1998 2001 2001 2001 1997 1997 2002 MIN 4661 7207 6912 6022 5588 6436 10400 14070 16100 15970 6460 4369 (WY) 2001 2002 2000 2000 2000 2001 2000 2000 1997 2000 2000 2000
SUMMARY STATISTICS FOR 2001 CALENDAR YEAR FOR 2002 WATER YEAR WATER YEARS 1996 - 2002 ANNUAL TOTAL 9135910 5464770 ANNUAL MEAN 25030 14970 18610 HIGHEST ANNUAL MEAN 25040 2001 LOWEST ANNUAL MEAN 10310 2000 HIGHEST DAILY MEAN 147000 Apr 19 44900 Jul 1 147000 Apr 19 2001 LOWEST DAILY MEAN 4850 Oct 10 4850 Oct 10 3650 Sep 25 2000 ANNUAL SEVEN-DAY MINIMUM 5090 Oct 5 5090 Oct 5 3900 Sep 23 2000 ANNUAL RUNOFF (AC-FT) 18120000 10840000 13480000 ANNUAL RUNOFF (CFSM) 0.67 0.40 0.50 ANNUAL RUNOFF (INCHES) 9.16 5.48 6.81 10 PERCENT EXCEEDS 71000 28400 38500 50 PERCENT EXCEEDS 7480 10700 11700 90 PERCENT EXCEEDS 5810 6420 5920
O N D2001
J F M A M J J A S2002
1000
2000
5000
10,00010,000
20,000
50,000
100,000
DAILY-MEAN DISCHARGE,
IN CUBIC FEET PER SECOND

240 UPPER MISSISSIPPI RIVER MAIN STEM--Continued
05331580 MISSISSIPPI RIVER AT HASTINGS, MN--Continued (National Water-Quality Assessment Program)
WATER-QUALITY RECORDS
PERIOD OF RECORD.--Water years 1936-41, 1943-1977, 1995 to current year.
NASQAN samples previously collected at Mississippi River at Ninninger (station no. 05331570), January 1977 to September 1995.
PERIOD OF DAILY RECORD:
WATER TEMPERATURES.-- 1996 to 1998 (non-winter months).
WATER-QUALITY DATA, WATER YEAR OCTOBER 2001 TO SEPTEMBER 2002 DIS- BARO- OXYGEN, PH SPE- ALKA- CHARGE, METRIC DIS- WATER CIFIC SPE- LINITY INST. PRES- SOLVED WHOLE CON- CIFIC WAT DIS CUBIC SURE OXYGEN, (PER- FIELD DUCT- CON- TEMPER- TEMPER- TOT IT Sample Medium FEET (MM DIS- CENT (STAND- ANCE DUCT- ATURE ATURE FIELD Date Time type code PER OF SOLVED SATUR- ARD LAB ANCE AIR WATER MG/L AS SECOND HG) (MG/L) ATION) UNITS) (US/CM) (US/CM) (DEG C) (DEG C) CACO3 (00061) (00025) (00300) (00301) (00400) (90095) (00095) (00020) (00010) (39086) OCT 24... 1005 ENVIRONMENTAL -- 731 11.0 107 8.4 -- 519 10.0 11.7 179NOV 20... 0935 ENVIRONMENTAL -- 750 11.4 98 8.2 -- 510 4.0 7.7 176DEC 17... 1015 ENVIRONMENTAL -- 743 14.3 106 8.2 -- 578 2.0 2.7 183JAN 22... 1100 ENVIRONMENTAL -- 738 14.2 100 7.7 -- 619 4.0 .0 210FEB 12... 1000 ENVIRONMENTAL -- 745 13.5 98 7.9 -- 621 .0 .8 263APR 24... 1055 BLANK -- 742 -- -- -- 3 -- 15.0 -- -- 24... 1100 ENVIRONMENTAL 28800 742 10.1 95 7.9 -- 481 15.0 11.5 145MAY 06... 1130 ENVIRONMENTAL -- 742 10.9 105 8.2 -- 562 18.0 12.4 170JUN 11... 1130 ENVIRONMENTAL 18700 741 7.8 91 7.9 -- 665 22.0 22.0 182 11... 1135 SPIKE 18700 741 7.8 91 7.9 -- 665 22.0 22.0 182JUL 26... 1000 ENVIRONMENTAL -- 744 7.1 86 7.7 -- 392 28.0 24.0 142AUG 14... 1045 ENVIRONMENTAL 20100 743 7.9 96 8.0 -- 465 24.0 23.5 172
BICAR- CAR- NITRO- NITRO- NITRO- NITRO- ORTHO- 2,6-DI- BONATE BONATE CHLO- GEN, GEN,AM- GEN, GEN, PHOS- ETHYL ACETO- ALA- WATER WATER RIDE, SULFATE AMMONIA MONIA + NO2+NO3 NITRITE PHATE, PHOS- ANILINE CHLOR, CHLOR, DIS IT DIS IT DIS- DIS- DIS- ORGANIC DIS- DIS- DIS- PHORUS WAT FLT WATER WATER, FIELD FIELD SOLVED SOLVED SOLVED TOTAL SOLVED SOLVED SOLVED TOTAL 0.7 U FLTRD DISS, Date MG/L AS MG/L AS (MG/L (MG/L (MG/L (MG/L (MG/L (MG/L (MG/L (MG/L GF, REC REC REC, HCO3 CO3 AS CL) AS SO4) AS N) AS N) AS N) AS N) AS P) AS P) (UG/L) (UG/L) (UG/L) (00453) (00452) (00940) (00945) (00608) (00625) (00631) (00613) (00671) (00665) (82660) (49260) (46342) OCT 24... 218 6 33.3 39.6 <.04 .76 .78 .024 .05 .190 <.002 .005 <.002NOV 20... 215 5 31.9 40.8 E.03 1.1 .96 .033 .06 .193 -- -- --DEC 17... 224 0 29.6 57.3 .05 .66 2.06 .034 .10 .161 <.002 .007 <.002JAN 22... 256 0 34.2 67.5 .08 .75 2.23 .039 .12 .165 -- -- --FEB 12... 320 0 38.0 62.2 .06 .80 1.96 .051 .11 .184 <.006 <.006 <.004APR 24... -- -- <.30 <.1 <.04 <.10 <.05 <.008 <.02 <.004 -- -- -- 24... 177 0 19.6 68.8 E.04 1.2 1.36 .027 .05 .183 <.006 .016 <.004MAY 06... 202 2 22.2 81.2 <.04 1.3 1.89 .068 <.02 .148 <.006 .044 <.011JUN 11... 222 0 26.5 81.6 .08 1.2 8.10 .087 .10 .23 <.006 .427 .016 11... 222 0 -- -- -- -- -- -- -- -- .107 .549 .134JUL 26... 173 0 19.2 24.1 .05 1.3 .85 .028 .12 .24 <.006 .011 <.004AUG 14... 210 -- 19.7 28.6 -- -- -- -- -- -- <.006 .014 <.004

241 UPPER MISSISSIPPI RIVER MAIN STEM--Continued
05331580 MISSISSIPPI RIVER AT HASTINGS, MN--Continued (National Water-Quality Assessment Program)
WATER-QUALITY DATA, WATER YEAR OCTOBER 2001 TO SEPTEMBER 2002 BEN- CAR- CARBO- DEETHYL DISUL- ATRA- FLUR- BUTYL- BARYL FURAN CYANA- DCPA ATRA- FOTON ALPHA ZINE, ALIN ATE, WATER WATER CHLOR- ZINE, WATER ZINE, DI- DI- WATER BHC WATER, WAT FLD WATER, FLTRD FLTRD PYRIFOS WATER, FLTRD WATER, AZINON, ELDRIN FLTRD DIS- DISS, 0.7 U DISS, 0.7 U 0.7 U DIS- DISS, 0.7 U DISS, DIS- DIS- 0.7 U Date SOLVED REC GF, REC REC GF, REC GF, REC SOLVED REC GF, REC REC SOLVED SOLVED GF, REC (UG/L) (UG/L) (UG/L) (UG/L) (UG/L) (UG/L) (UG/L) (UG/L) (UG/L) (UG/L) (UG/L) (UG/L) (UG/L) (34253) (39632) (82673) (04028) (82680) (82674) (38933) (04041) (82682) (04040) (39572) (39381) (82677) OCT 24... <.005 .030 <.010 <.002 <.041 <.020 <.005 <.018 <.003 E.011 E.003 <.005 <.02NOV 20... -- -- -- -- -- -- -- -- -- -- -- -- --DEC 17... <.005 .027 <.010 <.002 <.041 <.020 <.005 <.018 <.003 E.011 E.003 <.005 <.02JAN 22... -- -- -- -- -- -- -- -- -- -- -- -- --FEB 12... <.005 .027 <.010 <.002 <.041 <.020 <.005 <.018 <.003 E.014 <.005 <.005 <.02APR 24... -- -- -- -- -- -- -- -- -- -- -- -- -- 24... <.005 .040 <.010 <.002 <.041 <.020 <.005 <.018 <.003 E.007 <.005 <.005 <.02MAY 06... <.005 .043 <.010 <.002 <.041 <.020 <.005 <.018 <.003 E.009 <.005 <.005 <.02JUN 11... <.005 .957 <.010 <.002 <.041 <.020 <.005 .069 <.003 E.046 <.005 <.005 <.02 11... .098 1.11 .088 .102 E.114 E.121 .104 .181 .110 E.113 .107 .090 .07JUL 26... <.005 .230 <.010 <.002 <.041 <.020 <.005 <.018 <.003 E.028 E.003 <.005 <.02AUG 14... <.005 .196 <.010 <.002 <.041 <.020 <.005 <.018 <.003 E.048 <.005 <.005 <.02
ETHAL- ETHO- LIN- METHYL METHYL MOL- NAPROP- EPTC FLUR- PROP URON AZIN- PARA- METRI- INATE AMIDE WATER ALIN WATER FONOFOS WATER MALA- PHOS THION METO- BUZIN WATER WATER FLTRD WAT FLT FLTRD WATER LINDANE FLTRD THION, WAT FLT WAT FLT LACHLOR SENCOR FLTRD FLTRD 0.7 U 0.7 U 0.7 U DISS DIS- 0.7 U DIS- 0.7 U 0.7 U WATER WATER 0.7 U 0.7 U Date GF, REC GF, REC GF, REC REC SOLVED GF, REC SOLVED GF, REC GF, REC DISSOLV DISSOLV GF, REC GF, REC (UG/L) (UG/L) (UG/L) (UG/L) (UG/L) (UG/L) (UG/L) (UG/L) (UG/L) (UG/L) (UG/L) (UG/L) (UG/L) (82668) (82663) (82672) (04095) (39341) (82666) (39532) (82686) (82667) (39415) (82630) (82671) (82684) OCT 24... <.002 <.009 <.005 <.003 <.004 <.035 <.027 <.050 <.006 E.010 <.006 <.002 <.007NOV 20... -- -- -- -- -- -- -- -- -- -- -- -- --DEC 17... <.002 <.009 <.005 <.003 <.004 <.035 <.027 <.050 <.006 .021 <.006 <.002 <.007JAN 22... -- -- -- -- -- -- -- -- -- -- -- -- --FEB 12... <.007 <.009 <.005 <.003 <.004 <.035 <.027 <.050 <.006 E.011 <.006 <.002 <.007APR 24... -- -- -- -- -- -- -- -- -- -- -- -- -- 24... <.002 <.009 <.005 <.003 <.004 <.035 <.027 <.050 <.006 .049 <.006 <.002 <.007MAY 06... .012 <.009 <.005 <.003 <.004 <.035 <.027 <.050 <.006 .028 <.006 <.002 <.007JUN 11... .014 <.009 <.005 <.003 <.004 <.035 <.027 <.050 <.006 .227 .013 <.002 <.007 11... .100 .091 .102 .108 .105 .144 .096 E.288 .128 .360 .109 .106 .109JUL 26... <.002 <.009 <.005 <.003 <.004 <.035 <.027 <.050 <.006 .014 <.006 <.002 <.007AUG 14... <.002 <.009 <.005 <.003 <.004 <.035 <.027 <.050 <.006 .038 <.006 <.002 <.007

242 UPPER MISSISSIPPI RIVER MAIN STEM--Continued
05331580 MISSISSIPPI RIVER AT HASTINGS, MN--Continued (National Water-Quality Assessment Program)
WATER-QUALITY DATA, WATER YEAR OCTOBER 2001 TO SEPTEMBER 2002 PEB- PENDI- PER- PRON- PRO- PRO- TEBU- ULATE METH- METHRIN PHORATE PRO- AMIDE PROPA- PANIL PARGITE SI- THIURON PARA- WATER ALIN CIS WATER METON, WATER CHLOR, WATER WATER MAZINE, WATER P,P’ THION, FILTRD WAT FLT WAT FLT FLTRD WATER, FLTRD WATER, FLTRD FLTRD WATER, FLTRD DDE DIS- 0.7 U 0.7 U 0.7 U 0.7 U DISS, 0.7 U DISS, 0.7 U 0.7 U DISS, 0.7 U Date DISSOLV SOLVED GF, REC GF, REC GF, REC GF, REC REC GF, REC REC GF, REC GF, REC REC GF, REC (UG/L) (UG/L) (UG/L) (UG/L) (UG/L) (UG/L) (UG/L) (UG/L) (UG/L) (UG/L) (UG/L) (UG/L) (UG/L) (34653) (39542) (82669) (82683) (82687) (82664) (04037) (82676) (04024) (82679) (82685) (04035) (82670) OCT 24... <.003 <.007 <.002 <.010 <.006 <.011 E.01 <.004 <.010 <.011 <.02 <.011 <.02NOV 20... -- -- -- -- -- -- -- -- -- -- -- -- --DEC 17... <.003 <.007 <.002 <.010 <.006 <.011 <.01 <.004 <.010 <.011 <.02 <.011 <.02JAN 22... -- -- -- -- -- -- -- -- -- -- -- -- --FEB 12... <.003 <.010 <.004 <.022 <.006 <.011 <.01 <.004 <.010 <.011 <.02 E.002 <.02AP 24... -- -- -- -- -- -- -- -- -- -- -- -- -- 24... <.003 <.010 <.004 <.022 <.006 <.011 E.01 <.004 <.010 <.011 <.02 <.005 <.02MAY 06... .003 <.010 <.004 <.022 <.006 <.011 <.01 <.004 <.010 <.011 <.02 <.005 <.02JUN 11... <.003 <.010 <.004 <.022 <.006 <.011 E.01 <.004 <.010 <.011 <.02 <.005 <.02 11... .064 .119 .108 .112 .037 .067 .13 .109 .119 .123 .08 .078 .13JUL 26... <.003 <.010 <.004 <.022 <.006 <.011 .02 <.004 <.010 <.011 <.02 <.005 <.02AUG 14... <.003 <.010 <.004 <.022 <.006 <.011 E.01 <.004 <.010 <.011 <.02 <.005 <.02
TER- TER- THIO- TRIAL- TRI- BACIL BUFOS BENCARB LATE FLUR- WATER WATER WATER WATER ALIN SEDI- FLTRD FLTRD FLTRD FLTRD WAT FLT MENT, Data 0.7 U 0.7 U 0.7 U 0.7 U 0.7 U SUS- base Date GF, REC GF, REC GF, REC GF, REC GF, REC PENDED number (UG/L) (UG/L) (UG/L) (UG/L) (UG/L) (MG/L) (82665) (82675) (82681) (82678) (82661) (80154) OCT 24... <.034 <.02 <.005 <.002 <.009 36 01 NOV 20... -- -- -- -- -- 30 01 DEC 17... <.034 <.02 <.005 <.002 <.009 6.9 01 JAN 22... -- -- -- -- -- 3.2 01 FEB 12... <.034 <.02 <.005 <.002 <.009 10 01 APR 24... -- -- -- -- -- -- 77 24... <.034 <.02 <.005 <.002 <.009 48 01 MAY 06... <.034 <.02 <.005 <.002 <.009 25 01 JUN 11... <.034 <.02 <.005 <.002 <.009 66 01 11... E.105 .08 .106 .101 .096 -- 77 JUL 26... <.034 <.02 <.005 <.002 <.009 42 01 AUG 14... <.034 <.02 <.005 <.002 <.009 44 01

THIS PAGE IS INTENTIONALLY BLANK
243

244 ST. CROIX RIVER BASIN
05336700 KETTLE RIVER BELOW SANDSTONE, MN
LOCATION.--Lat 46°06’20", long 92°51’50", in NW1⁄4SW1⁄4 sec. 22, T.42 N., R.20 W., Pine County, Hydrologic Unit 07030003, on
Sandstone Federal Correctional Institution property, on left bank, about 1.8 mi south of Sandstone.
DRAINAGE AREA.--868 mi2.
PERIOD OF RECORD.--October 1967 to current year.
GAGE.--Water-stage recorder and crest-stage gage. Datum of gage is 931.50 ft above sea level (NGVD of 1929, Minnesota Department of Transportation benchmark).
REMARKS.--Records good except those for estimated daily discharge, which are fair.
EXTREMES OUTSIDE PERIOD OF RECORD.--Flood in April 1965 reached a stage of 12.96 ft, from flood marks, discharge, 13,400 ft3/s.
EXTREMES FOR CURRENT YEAR.--Peak discharges greater than base discharge of 3,200 ft3/s and maximum (*):
Discharge Gage height Discharge Gage height Date Time (ft3/s) (ft) Date Time (ft3/s) (ft)
Apr 12 1600 *5,620 *9.06 Jul 12 0300 3,410 7.74 May 10 0700 3,590 7.88
Minimum discharge, 104 ft3/s, Oct. 1, 2, gage height, 3.95 ft.
DISCHARGE, CUBIC FEET PER SECOND, WATER YEAR OCTOBER 2001 TO SEPTEMBER 2002 DAILY MEAN VALUES DAY OCT NOV DEC JAN FEB MAR APR MAY JUN JUL AUG SEP 1 107 184 341 e157 e129 e126 451 1180 391 596 818 446 2 108 182 316 e153 e128 e121 417 1090 356 506 748 894 3 110 176 322 e151 e128 e120 357 981 331 437 714 1150 4 110 172 325 e150 e127 e120 316 891 311 380 727 944 5 110 168 345 e149 e127 e122 280 871 295 333 644 727 6 110 165 415 e149 e127 e123 261 865 279 301 553 621 7 109 164 e390 e150 e127 e124 296 848 274 421 485 546 8 113 163 e340 e150 e127 e130 653 1500 273 1360 431 495 9 120 165 e305 e151 e127 e136 1160 3080 264 1930 394 463 10 140 165 e285 e152 e127 e142 1680 3470 269 2340 362 487 11 163 163 e260 e154 e127 e149 3980 3010 261 3120 347 512 12 176 160 e260 e155 e127 e154 5460 2750 246 3280 402 478 13 181 163 e255 e160 e128 e158 5210 2760 236 2720 553 439 14 178 163 e246 e163 e131 e158 4750 2660 238 2150 553 409 15 179 162 e239 e162 e133 e156 4330 2420 243 1760 539 374 16 178 164 e236 e160 e134 e153 3960 2220 251 1480 632 347 17 177 166 e235 e158 e138 e151 3550 1980 245 1260 1180 322 18 178 168 e233 e157 e140 151 3200 1730 237 1310 2150 300 19 176 169 e230 e152 e145 155 2990 1490 247 1240 1850 292 20 179 168 e226 e152 e150 e158 2670 1300 334 1050 1540 344 21 191 164 e221 e149 e153 e160 2320 1150 385 1070 1490 328 22 187 163 e215 e147 e156 e161 2050 1010 371 1090 1470 297 23 188 164 e210 e146 e159 e162 1880 906 376 972 1290 297 24 191 187 e202 e143 e158 e163 1720 799 556 820 1100 356 25 195 279 e192 e141 e156 e162 1570 723 1160 727 917 418 26 190 354 e183 e139 e146 e162 1410 663 1220 656 763 487 27 188 362 e178 e136 e138 e161 1280 618 1090 919 647 519 28 187 326 e173 e134 e130 169 1240 564 964 1370 561 486 29 184 359 e170 e132 --- 196 1240 516 835 1150 504 477 30 180 352 e168 e131 --- 243 1230 476 707 963 453 481 31 182 --- e162 e130 --- 390 --- 430 --- 835 413 ---
TOTAL 4965 6060 7878 4613 3823 4936 61911 44951 13245 38546 25230 14736 MEAN 160 202 254 149 137 159 2064 1450 442 1243 814 491 MAX 195 362 415 163 159 390 5460 3470 1220 3280 2150 1150 MIN 107 160 162 130 127 120 261 430 236 301 347 292 AC-FT 9850 12020 15630 9150 7580 9790 122800 89160 26270 76460 50040 29230 CFSM 0.18 0.23 0.29 0.17 0.16 0.18 2.38 1.67 0.51 1.43 0.94 0.57 IN. 0.21 0.26 0.34 0.20 0.16 0.21 2.65 1.93 0.57 1.65 1.08 0.63
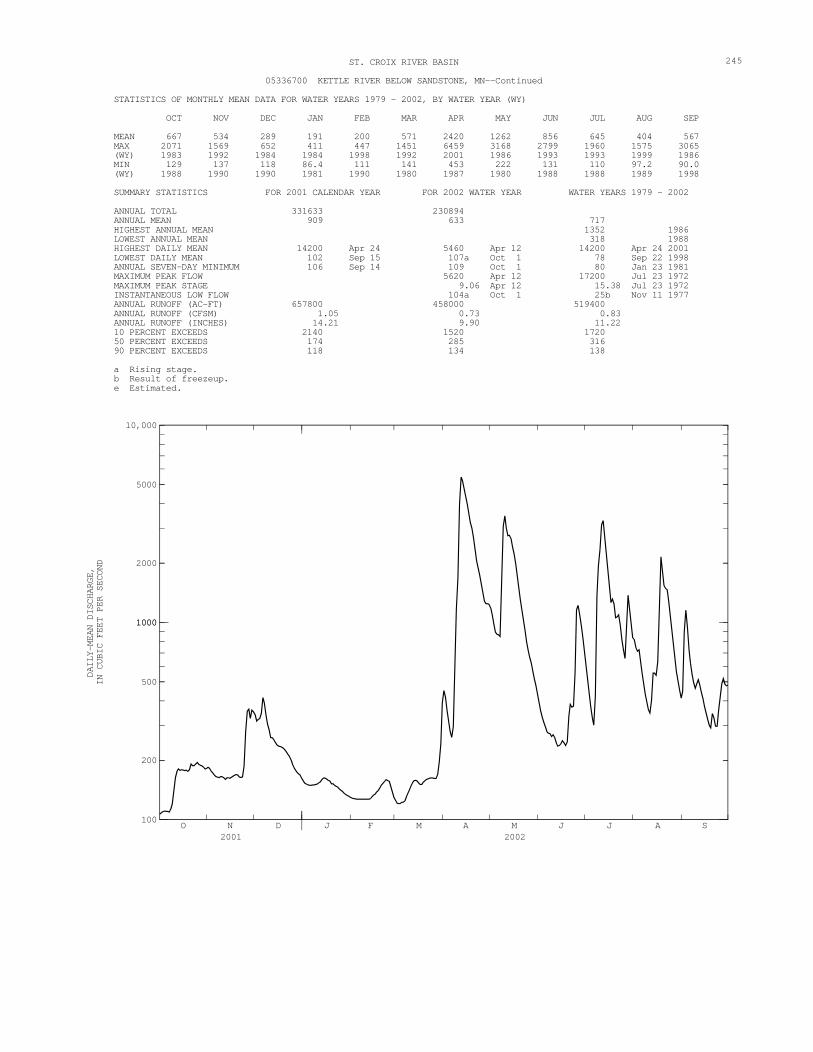
245 ST. CROIX RIVER BASIN
05336700 KETTLE RIVER BELOW SANDSTONE, MN--Continued
STATISTICS OF MONTHLY MEAN DATA FOR WATER YEARS 1979 - 2002, BY WATER YEAR (WY)
OCT NOV DEC JAN FEB MAR APR MAY JUN JUL AUG SEP
MEAN 667 534 289 191 200 571 2420 1262 856 645 404 567 MAX 2071 1569 652 411 447 1451 6459 3168 2799 1960 1575 3065 (WY) 1983 1992 1984 1984 1998 1992 2001 1986 1993 1993 1999 1986 MIN 129 137 118 86.4 111 141 453 222 131 110 97.2 90.0 (WY) 1988 1990 1990 1981 1990 1980 1987 1980 1988 1988 1989 1998
SUMMARY STATISTICS FOR 2001 CALENDAR YEAR FOR 2002 WATER YEAR WATER YEARS 1979 - 2002 ANNUAL TOTAL 331633 230894 ANNUAL MEAN 909 633 717 HIGHEST ANNUAL MEAN 1352 1986 LOWEST ANNUAL MEAN 318 1988 HIGHEST DAILY MEAN 14200 Apr 24 5460 Apr 12 14200 Apr 24 2001 LOWEST DAILY MEAN 102 Sep 15 107a Oct 1 78 Sep 22 1998 ANNUAL SEVEN-DAY MINIMUM 106 Sep 14 109 Oct 1 80 Jan 23 1981 MAXIMUM PEAK FLOW 5620 Apr 12 17200 Jul 23 1972 MAXIMUM PEAK STAGE 9.06 Apr 12 15.38 Jul 23 1972 INSTANTANEOUS LOW FLOW 104a Oct 1 25b Nov 11 1977 ANNUAL RUNOFF (AC-FT) 657800 458000 519400 ANNUAL RUNOFF (CFSM) 1.05 0.73 0.83 ANNUAL RUNOFF (INCHES) 14.21 9.90 11.22 10 PERCENT EXCEEDS 2140 1520 1720 50 PERCENT EXCEEDS 174 285 316 90 PERCENT EXCEEDS 118 134 138 a Rising stage. b Result of freezeup. e Estimated.
O N D2001
J F M A M J J A S2002
100
200
500
10001000
2000
5000
10,000
DAILY-MEAN DISCHARGE,
IN CUBIC FEET PER SECOND

246 ST. CROIX RIVER BASIN--Continued
05337400 KNIFE RIVER NEAR MORA, MN
LOCATION.--Lat 45°55’12", long 93°18’26", in SW1⁄4SW1⁄4 sec. 26, T.40 N., R.24 W., Kanabec County, Hydrologic Unit 07030004, on
left bank 400 ft upstream from bridge on County Highway 77, 1.1 mi upstream from mouth and 2.5 mi north of Mora.
DRAINAGE AREA.--102 mi2.
PERIOD OF RECORD.--Occasional low-flow measurements, water years 1969-74; July 1974 to December 2001 (discontinued).
GAGE.--Water-stage recorder. Datum of gage is 991.20 ft above sea level (NGVD of 1929, Kanabec County benchmark).
REMARKS.--Records good except those for periods of estimated daily discharges, which are fair to poor.
EXTREMES OUTSIDE PERIOD OF RECORD.--Flood of July 26, 1972, reached a stage of 14.0 ft, from information by local resident (discharge not determined). Result of dam failure and backwater from collapsed bridge.
DISCHARGE, CUBIC FEET PER SECOND, WATER YEAR OCTOBER 2001 TO SEPTEMBER 2002 DAILY MEAN VALUES DAY OCT NOV DEC JAN FEB MAR APR MAY JUN JUL AUG SEP 1 3.6 9.2 35 --- --- --- --- --- --- --- --- --- 2 4.1 8.7 e33 --- --- --- --- --- --- --- --- --- 3 6.7 8.9 e32 --- --- --- --- --- --- --- --- --- 4 4.2 8.7 e32 --- --- --- --- --- --- --- --- --- 5 3.3 8.1 e32 --- --- --- --- --- --- --- --- --- 6 2.9 8.8 e31 --- --- --- --- --- --- --- --- --- 7 2.6 9.9 e31 --- --- --- --- --- --- --- --- --- 8 2.6 10 e30 --- --- --- --- --- --- --- --- --- 9 3.7 7.5 e28 --- --- --- --- --- --- --- --- --- 10 6.8 8.8 e26 --- --- --- --- --- --- --- --- --- 11 9.3 7.9 e25 --- --- --- --- --- --- --- --- --- 12 10 8.0 e25 --- --- --- --- --- --- --- --- --- 13 12 11 e24 --- --- --- --- --- --- --- --- --- 14 13 12 e23 --- --- --- --- --- --- --- --- --- 15 13 12 e22 --- --- --- --- --- --- --- --- --- 16 12 13 e22 --- --- --- --- --- --- --- --- --- 17 10 12 e22 --- --- --- --- --- --- --- --- --- 18 10 13 e21 --- --- --- --- --- --- --- --- --- 19 9.1 13 e20 --- --- --- --- --- --- --- --- --- 20 8.9 11 e20 --- --- --- --- --- --- --- --- --- 21 8.6 11 e19 --- --- --- --- --- --- --- --- --- 22 8.8 13 e17 --- --- --- --- --- --- --- --- --- 23 9.3 12 e16 --- --- --- --- --- --- --- --- --- 24 8.3 24 e15 --- --- --- --- --- --- --- --- --- 25 9.6 30 e15 --- --- --- --- --- --- --- --- --- 26 12 37 e14 --- --- --- --- --- --- --- --- --- 27 8.6 57 e14 --- --- --- --- --- --- --- --- --- 28 8.4 46 e14 --- --- --- --- --- --- --- --- --- 29 11 40 e14 --- --- --- --- --- --- --- --- --- 30 8.9 39 e13 --- --- --- --- --- --- --- --- --- 31 9.8 --- e13 --- --- --- --- --- --- --- --- ---
TOTAL 251.1 510.5 698 --- --- --- --- --- --- --- --- --- MEAN 8.10 17.0 22.5 --- --- --- --- --- --- --- --- --- MAX 13 57 35 --- --- --- --- --- --- --- --- --- MIN 2.6 7.5 13 --- --- --- --- --- --- --- --- --- AC-FT 498 1010 1380 --- --- --- --- --- --- --- --- --- CFSM 0.08 0.17 0.22 --- --- --- --- --- --- --- --- --- IN. 0.09 0.19 0.25 --- --- --- --- --- --- --- --- ---

247 ST. CROIX RIVER BASIN--Continued
05337400 KNIFE RIVER NEAR MORA, MN--Continued
STATISTICS OF MONTHLY MEAN DATA FOR WATER YEARS 1979 - 2002, BY WATER YEAR (WY)
OCT NOV DEC JAN FEB MAR APR MAY JUN JUL AUG SEP
MEAN 47.2 36.0 22.0 13.0 15.8 69.5 243 113 75.2 44.9 33.4 35.3 MAX 242 78.4 63.6 28.8 48.9 238 802 338 394 133 218 257 (WY) 1985 1984 1984 1984 1984 1983 2001 1986 2001 1991 1995 1986 MIN 3.25 1.38 1.17 1.23 1.16 12.2 35.2 11.4 3.06 0.98 1.94 1.69 (WY) 2001 1990 1990 1990 1990 2001 1987 1998 1988 1988 1988 2000
SUMMARY STATISTICS FOR 2001 CALENDAR YEAR WATER YEARS 1979 - 2002 ANNUAL TOTAL 44415.6 ANNUAL MEAN 122 62.1 HIGHEST ANNUAL MEAN 135 1986 LOWEST ANNUAL MEAN 15.9 2002 HIGHEST DAILY MEAN 2620 Apr 23 2620 Apr 23 2001 LOWEST DAILY MEAN 2.6 Oct 7 0.76 Jul 7 1988 ANNUAL SEVEN-DAY MINIMUM 3.7 Oct 3 0.86 Jul 23 1988 MAXIMUM PEAK FLOW 3450 Apr 23 2001 MAXIMUM PEAK STAGE 7.76 Apr 23 2001 INSTANTANEOUS LOW FLOW 0.74 Jul 6 1988 ANNUAL RUNOFF (AC-FT) 88100 44960 ANNUAL RUNOFF (CFSM) 1.19 0.61 ANNUAL RUNOFF (INCHES) 16.20 8.27 10 PERCENT EXCEEDS 230 144 50 PERCENT EXCEEDS 13 22 90 PERCENT EXCEEDS 6.2 5.3 e Estimated.
O N D2001
J F M A M J J A S2002
1
2
5
1010
20
50
100
DAILY-MEAN DISCHARGE,
IN CUBIC FEET PER SECOND
Gap indicatesmissing record

248 ST. CROIX RIVER BASIN--Continued
05338500 SNAKE RIVER NEAR PINE CITY, MN
LOCATION.--Lat 45°50’30", long 92°56’00", in SE1⁄4NW1⁄4 sec. 26, T. 39 N., R. 21 W., Pine County, Hydrologic Unit 07030004, on
left bank at site of former power plant and dam, 0.5 mi downstream from Cross Lake and l.5 mi northeast of Pine City.
DRAINAGE AREA.--974 mi2.
PERIOD OF RECORD.--June 1913 to September 1917, July 1951 to Sept. 1981, Oct. 1992 to current year.
GAGE.--Water-stage recorder. Datum of gage is 919.00 ft above sea level (NGVD of 1929). June 25, 1913 to Sept. 30, 1917, nonrecording gage at site 500 ft downstream at different datum. July l to Oct. 28, 1951, nonrecording gage at present site and datum.
REMARKS.--Records good except those for estimated discharge, which are fair.
DISCHARGE, in CFS, WATER YEAR OCTOBER 2001 TO SEPTEMBER 2002 DAILY MEAN VALUES DAY OCT NOV DEC JAN FEB MAR APR MAY JUN JUL AUG SEP 1 119 169 425 157 e102 217 651 1570 416 914 1070 493 2 115 166 384 149 e100 208 829 1570 355 745 903 604 3 118 145 376 136 e100 180 923 1470 332 618 831 777 4 116 140 376 131 e99 160 960 1400 319 507 962 1090 5 114 138 417 129 100 155 962 1280 302 426 1170 1300 6 101 141 428 128 97 145 926 1180 269 384 1360 1640 7 87 133 457 124 96 146 970 1080 266 428 1430 1690 8 90 150 491 122 96 154 1210 1080 271 706 1360 1720 9 106 132 447 122 101 178 1690 1310 254 1270 1220 1700 10 132 133 463 124 107 189 2270 1490 256 2440 1050 1750 11 124 129 457 124 101 139 3230 1840 278 3900 856 1700 12 121 129 447 129 108 136 4230 2270 253 4960 752 1640 13 134 139 423 129 109 137 e5000 2550 249 5670 660 1520 14 151 142 360 133 108 144 e5820 2700 228 5950 615 1360 15 154 150 327 137 109 171 e6350 2760 217 5790 607 1160 16 148 144 353 135 110 154 6400 2710 204 5280 550 962 17 139 153 348 134 108 146 6130 2570 186 4600 572 807 18 151 161 354 132 111 146 5660 2400 169 3900 549 688 19 154 164 343 128 141 154 5090 2180 199 3290 655 610 20 149 143 282 123 173 154 4490 1940 288 2770 774 546 21 142 148 267 121 189 e152 3940 1690 352 2400 939 525 22 133 143 280 118 199 e152 3470 1450 470 2070 961 495 23 144 148 287 118 209 146 3000 1290 612 1820 1010 451 24 158 175 254 115 238 145 2650 1070 755 1740 1030 418 25 195 227 225 115 235 e144 2310 901 928 1760 971 420 26 137 208 216 115 224 140 1970 799 1110 1750 873 429 27 110 288 210 115 222 138 1730 708 1240 1690 764 441 28 118 288 198 115 217 145 1650 632 1290 1620 671 459 29 119 347 189 115 --- 177 1600 570 1230 1510 596 471 30 125 406 179 109 --- 271 1570 525 1100 1370 531 481 31 147 --- 167 108 --- 445 --- 469 --- 1220 496 ---
TOTAL 4051 5279 10430 3890 3909 5268 87681 47454 14398 73498 26788 28347 MEAN 130.7 176.0 336.5 125.5 139.6 169.9 2923 1531 479.9 2371 864.1 944.9 MAX 195 406 491 157 238 445 6400 2760 1290 5950 1430 1750 MIN 87 129 167 108 96 136 651 469 169 384 496 418 AC-FT 8040 10470 20690 7720 7750 10450 173900 94130 28560 145800 53130 56230 CFSM 0.14 0.18 0.35 0.13 0.15 0.18 3.05 1.60 0.50 2.47 0.90 0.99 IN. 0.16 0.20 0.41 0.15 0.15 0.20 3.40 1.84 0.56 2.85 1.04 1.10

249 ST. CROIX RIVER BASIN--Continued
05338500 SNAKE RIVER NEAR PINE CITY, MN--Continued
STATISTICS OF MONTHLY MEAN DATA FOR WATER YEARS 1979 - 2002, BY WATER YEAR (WY)
OCT NOV DEC JAN FEB MAR APR MAY JUN JUL AUG SEP
MEAN 307.9 395.7 225.7 145.2 156.9 579.4 2359 1122 617.2 602.4 342.7 313.8 MAX 1189 866 402 266 277 1611 5905 2726 2149 2371 1080 1030 (WY) 1982 1996 1992 1992 1998 1992 2001 1979 2001 2002 1995 1995 MIN 76.3 164 88.0 58.4 99.2 130 666 203 167 104 76.8 59.3 (WY) 2001 1979 1981 1981 1993 2001 2000 1998 1997 1980 1998 1998
SUMMARY STATISTICS FOR 2001 CALENDAR YEAR FOR 2002 WATER YEAR WATER YEARS 1979 - 2002 ANNUAL TOTAL 355332 310993 ANNUAL MEAN 973.5 852.0 591.9a HIGHEST ANNUAL MEAN 980 2001 LOWEST ANNUAL MEAN 305 1998 HIGHEST DAILY MEAN 10900 Apr 27 6400 Apr 16 10900 Apr 27 2001 LOWEST DAILY MEAN 87 Oct 7 87 Oct 7 37 Sep 22 1998 ANNUAL SEVEN-DAY MINIMUM 105 Oct 3 98 Feb 2 42 Sep 18 1998 MAXIMUM PEAK FLOW 6460 Apr 15 14300 Jul 27 1972 MAXIMUM PEAK STAGE 7.50 Apr 15 10.38 Jul 27 1972 INSTANTANEOUS LOW FLOW 80b Oct 8 5.5c Oct 1 1964 ANNUAL RUNOFF (AC-FT) 704800 616900 428800 ANNUAL RUNOFF (CFSM) 1.02 0.89 0.62 ANNUAL RUNOFF (INCHES) 13.80 12.08 8.40 10 PERCENT EXCEEDS 2930 2110 1460 50 PERCENT EXCEEDS 167 352 241 90 PERCENT EXCEEDS 114 118 106 a Median of annual mean discharges is 530 ft3/s. b Also occurred Feb. 11. c Result of dam rehabilitation. e Estimated.
O N D2001
J F M A M J J A S2002
10
20
50
100100
200
500
10001000
2000
5000
10,000
DAILY-MEAN DISCHARGE,
IN CUBIC FEET PER SECOND

250 ST. CROIX RIVER BASIN--Continued
05340500 ST. CROIX RIVER AT ST. CROIX FALLS, WI (National Water-Quality Assessment Program)
LOCATION.--Lat 45°24’25", long 92°38’49", in SW1⁄4NW1⁄4 sec. 30, T.34 N., R.18 W., Polk County, Hydrologic Unit 07030005, St.
Croix National Scenic Riverway, on left bank, 1,500 ft downstream from power plant of Northern States Power Co., in St. Croix Falls, and at mile 52.2.
DRAINAGE AREA.--6,240 mi2.
PERIOD OF RECORD.--January 1902 to current year. Prior to January 1910, monthly discharge only, published in WSP 1308. Prior to October 1939, published as "near St. Croix Falls."
REVISED RECORDS.--WSP 1115: 1929. WDR WI-82-1: Drainage area.
GAGE.--Water-stage recorder and crest-stage gage. Datum of gage is 689.94 ft above sea level. Prior to July 1905, gage heights and discharge measurements were used by Loweth and Wolff, consulting engineers of St. Paul, MN, to determine the flow. July 1905 to February 1940, records were computed from power generation at the St. Croix Falls power plant. February 1940 to Sept. 30, 1979, water-stage recorder at site 300 ft downstream at same datum.
REMARKS.--Records good except those for estimated daily discharges, which are fair. Diurnal fluctuation caused by St. Croix Falls Powerplant 1,500 ft upstream.
DISCHARGE, CUBIC FEET PER SECOND, WATER YEAR OCTOBER 2001 TO SEPTEMBER 2002 DAILY MEAN VALUES DAY OCT NOV DEC JAN FEB MAR APR MAY JUN JUL AUG SEP 1 2360 2920 4300 2700 2510 2600 5210 9910 4190 5110 5110 4050 2 2200 2790 4130 2700 2400 2600 5540 8090 3920 4610 4960 5290 3 2100 2960 4110 2660 2300 2500 5190 7720 3840 4250 4600 6900 4 2180 2660 4070 2690 2400 2460 5450 7500 3700 3820 6080 7110 5 2410 2690 4240 2820 2400 2370 4890 7220 3720 3460 7150 6790 6 2140 2520 4680 2860 2230 2590 4860 7010 3430 3220 6590 7870 7 2090 2470 5430 2700 1940 2690 5180 6820 3620 3240 5930 7490 8 2150 2730 5490 2770 2220 2510 6150 7210 3570 4080 5500 7440 9 2220 2720 4950 2650 2410 2500 7040 9570 3630 7490 5190 7170 10 2420 2820 5050 2820 2240 2200 9310 12900 3550 11000 4990 7210 11 2380 2620 4840 2940 2450 2670 15100 15900 3700 13700 4880 7320 12 2600 2590 4760 2530 2300 2660 22900 17100 3800 16400 4330 7150 13 3000 2560 4510 3020 2440 2930 28300 17200 3610 17100 4540 6680 14 2500 2580 4130 2710 2510 2800 31500 17200 3470 15500 4320 6370 15 3120 2630 3920 2610 2530 2800 32300 16800 3250 13300 4340 6260 16 2900 2820 4190 2610 2290 2700 32300 15800 3260 11700 4240 5940 17 3010 2560 4180 2600 2400 2840 31300 14400 3180 10100 4140 5310 18 3100 2590 4100 2500 2530 3070 29100 13000 3100 8940 4810 5060 19 3070 3040 3840 2300 2620 3050 26200 11400 3340 8210 6230 4690 20 3000 2390 2900 2500 2920 3040 23800 9840 3400 7460 6790 4460 21 2780 2700 2410 2290 2850 3130 21700 8850 4100 6910 6670 4710 22 2630 2740 2880 2510 3070 2880 19500 8120 4830 6460 7010 4560 23 2780 2790 3210 2480 3040 3100 17200 7570 4850 6280 6770 4530 24 3070 3010 2650 2460 3210 2610 15100 7030 5240 5300 6810 4390 25 2740 3250 2010 2460 2970 2930 13200 6650 6280 5540 6470 4460 26 3030 3610 1870 2510 2990 2820 11700 5890 6900 5570 6070 4870 27 2950 3990 2450 2640 2730 2800 10500 5500 7130 5090 5380 5140 28 2940 3970 2560 2690 2900 3170 10100 5230 6920 5370 4880 5320 29 2790 4020 2560 2430 --- 4050 9540 5100 6730 5780 4630 5210 30 2850 4330 2790 2300 --- 4970 9430 4730 5930 5900 4320 5130 31 2810 --- 2800 2470 --- 5560 --- 4320 --- 5220 4210 ---
TOTAL 82320 88070 116010 80930 71800 91600 469590 301580 130190 236110 167940 174880 MEAN 2655 2936 3742 2611 2564 2955 15650 9728 4340 7616 5417 5829 MAX 3120 4330 5490 3020 3210 5560 32300 17200 7130 17100 7150 7870 MIN 2090 2390 1870 2290 1940 2200 4860 4320 3100 3220 4140 4050 AC-FT 163300 174700 230100 160500 142400 181700 931400 598200 258200 468300 333100 346900 CFSM 0.43 0.47 0.60 0.42 0.41 0.47 2.51 1.56 0.70 1.22 0.87 0.93 IN. 0.49 0.53 0.69 0.48 0.43 0.55 2.80 1.80 0.78 1.41 1.00 1.04

251 ST. CROIX RIVER BASIN--Continued
05340500 ST. CROIX RIVER AT ST. CROIX FALLS, WI--Continued (National Water-Quality Assessment Program)
STATISTICS OF MONTHLY MEAN DATA FOR WATER YEARS 1902 - 2002, BY WATER YEAR (WY)
OCT NOV DEC JAN FEB MAR APR MAY JUN JUL AUG SEP
MEAN 3655 3499 2564 2161 2143 4240 10520 7439 5630 4162 2928 3388 MAX 14270 11910 5821 4279 6021 14420 29600 21840 19510 17260 9777 14590 (WY) 1969 1972 1984 1984 1984 1945 2001 1950 1944 1952 1955 1941 MIN 1380 1342 1287 1157 1257 1538 2212 2430 1481 1014 839 1152 (WY) 1933 1911 1911 1911 1913 1912 1902 1934 1934 1934 1934 1933
SUMMARY STATISTICS FOR 2001 CALENDAR YEAR FOR 2002 WATER YEAR WATER YEARS 1902 - 2002 ANNUAL TOTAL 2227060 2011020 ANNUAL MEAN 6102 5510 4370 HIGHEST ANNUAL MEAN 8569 1986 LOWEST ANNUAL MEAN 1754 1934 HIGHEST DAILY MEAN 59500 Apr 26 32300 Apr 15 59500 Apr 26 2001 LOWEST DAILY MEAN 1770 Aug 29 1870 Dec 26 75 Jul 17 1910 ANNUAL SEVEN-DAY MINIMUM 2070 Feb 26 2180 Oct 2 754 Jul 29 1934 MAXIMUM PEAK FLOW 32500 Apr 15 60900 Apr 25 2001 MAXIMUM PEAK STAGE 15.05 Apr 15 25.88 Apr 25 2001 ANNUAL RUNOFF (AC-FT) 4417000 3989000 3166000 ANNUAL RUNOFF (CFSM) 0.98 0.88 0.70 ANNUAL RUNOFF (INCHES) 13.28 11.99 9.52 10 PERCENT EXCEEDS 12000 9990 8960 50 PERCENT EXCEEDS 2760 3990 2790 90 PERCENT EXCEEDS 2170 2460 1580 e Estimated.
O N D2001
J F M A M J J A S2002
1000
2000
5000
10,00010,000
20,000
50,000
100,000
DAILY-MEAN DISCHARGE,
IN CUBIC FEET PER SECOND

252 UPPER MISSISSIPPI RIVER MAIN STEM
05344500 MISSISSIPPI RIVER AT PRESCOTT, WI
LOCATION.--Lat 44°44’45", long 92°48’00", in sec. 9, T.26 N., R.20 W., Pierce County, Hydrologic Unit 07040001,on left bank at Prescott, 200 ft downstream from St. Croix River, 300 ft south of Chicago, Burlington & Quincy Railroad bridge, 800 ft south of bridge on U.S. Highway 10, and at mile 811.4 upstream from Ohio River.
DRAINAGE AREA.--44,800 mi2 (approximately).
PERIOD OF RECORD.--June 1928 to current year.
REVISED RECORDS.--WSP 1508: 1941. WRD MN-74: 1973.
GAGE.--Water-stage recorder. Datum of gage is 649.50 ft above sea level (NGVD of 1929). Prior to Aug. 2, 1932, nonrecording gage at railroad bridge 300 ft upstream at following datums: June 3, 1928 to Sept. 30, 1929, 19.27 ft higher; Oct. 1, 1929 to Sept. 30, 1930, 17.68 ft higher; Oct. 1, 1930 to Aug. 1, 1932, 19.28 ft higher. Aug. 2, 1932 to Oct. 30, 1938, water-stage recorder at present site at datum 19.28 ft higher; Nov. 1, 1938 to Sept. 7, 1971, water-stage recorder at present site at datum 50.00 ft lower. Auxiliary water-stage recorder 10.7 mi downstream from base gage is used in discharge computations.
REMARKS.--Records good to fair except those for estimated daily discharges, which are fair to poor. Some regulation by reservoirs, navigation dams, and power plants at low and medium stages. Discharges below a stage of about 27 ft may be computed by routing flows from the Mississippi River at St. Paul (05331000) and St. Croix River at St. Croix Falls, WI (05340500).
DISCHARGE, CUBIC FEET PER SECOND, WATER YEAR OCTOBER 2001 TO SEPTEMBER 2002 DAILY MEAN VALUES DAY OCT NOV DEC JAN FEB MAR APR MAY JUN JUL AUG SEP 1 e8220 e10900 e13700 e10300 e9680 e10300 e17100 33500 20300 48600 27100 27300 2 e8130 e11300 e13500 e10600 e9550 e10000 e19200 33100 20200 46900 26100 26900 3 e8250 e10600 e13800 e10600 e9280 e9800 e21600 32500 20900 45200 25400 26600 4 e8120 e10900 e14400 e10600 e9320 e9520 e22300 31500 22500 42600 28900 28000 5 e7830 e10300 e14700 e10800 e9100 e9430 e22700 30800 24800 39800 31700 28500 6 e7950 e10100 e15400 e11000 e9130 e9490 e22000 31400 26300 37000 33500 e28000 7 e7640 e10200 e15300 e11200 e9130 e9670 e21700 31000 28100 34600 33600 e29500 8 e7660 e9870 e16700 e11100 e8780 e9670 e22900 30400 29000 33500 33600 e31000 9 e7400 e10200 e16900 e11300 e8810 e9560 e24700 32200 27500 31800 33300 e32600 10 e7460 e10100 e16500 e11300 e9020 e9480 e26700 34500 25800 32900 32700 32100 11 e8120 e10100 e15700 e11500 e8800 e9030 30900 36900 24500 38600 31900 30900 12 e8320 e9340 e15400 e11800 e8940 e9450 35400 40300 23300 42700 30800 30200 13 e8540 e9770 e15800 e11300 e8710 e9780 42000 42700 21400 47200 29400 29500 14 e9150 e9860 e15900 e11800 e8840 e10200 50100 44200 21200 49100 27500 28500 15 e9020 e10100 e15500 e11400 e8950 e10200 57200 44900 21600 48400 26500 27500 16 e9810 e10900 e14500 e11300 e8940 e10000 62700 45800 21300 47100 24700 26600 17 e10200 e10500 e15000 e11300 e8710 e9670 66700 45400 20700 45200 24900 24900 18 e10500 e9830 e15000 e11100 e8800 e9680 67400 44200 19000 42900 26000 23700 19 e10700 e10200 e14900 e10600 e8970 e10500 66000 42300 18300 40800 24800 22300 20 e10700 e10300 e15200 e10200 e9240 e10900 62700 40200 19200 38600 25200 20500 21 e11000 e10000 e14600 e10400 e9610 e11100 59100 37700 21400 37100 27800 19200 22 e10500 e9870 e12400 e10400 e9680 e11300 56200 35200 27000 35100 31400 18200 23 e10400 e9670 e12100 e10500 e9990 e11100 52300 33800 30200 32600 32200 16800 24 e10500 e10300 e12200 e10300 e9980 e11400 49100 32400 33400 31000 32500 16100 25 e10800 e10500 e11200 e10100 e10300 e10800 45500 29900 37100 29500 32300 16700 26 e10700 e11100 e9420 e9970 e10300 e11300 41800 28400 40000 28800 32900 17200 27 e11600 e12000 e9180 e9990 e10400 e11000 39400 26800 42400 27600 33100 17200 28 e10900 e12500 e9690 e9880 e10100 e10900 38100 24900 45600 26900 32100 16700 29 e10300 e13100 e9630 e10000 --- e11200 36400 23600 47900 28000 30700 16600 30 e10300 e13400 e9650 e9760 --- e12500 34800 21800 49100 28100 29300 16600 31 e11000 --- e9900 e9580 --- e14600 --- 20500 --- 27300 28200 ---
TOTAL 291720 317810 423770 331980 261060 323530 1214700 1062800 830000 1165500 920100 726400 MEAN 9410 10590 13670 10710 9324 10440 40490 34280 27670 37600 29680 24210 MAX 11600 13400 16900 11800 10400 14600 67400 45800 49100 49100 33600 32600 MIN 7400 9340 9180 9580 8710 9030 17100 20500 18300 26900 24700 16100 AC-FT 578600 630400 840500 658500 517800 641700 2409000 2108000 1646000 2312000 1825000 1441000 CFSM 0.21 0.24 0.31 0.24 0.21 0.23 0.90 0.77 0.62 0.84 0.66 0.54 IN. 0.24 0.26 0.35 0.28 0.22 0.27 1.01 0.88 0.69 0.97 0.76 0.60

253 UPPER MISSISSIPPI RIVER MAIN STEM
05344500 MISSISSIPPI RIVER AT PRESCOTT, WI--Continued
STATISTICS OF MONTHLY MEAN DATA FOR WATER YEARS 1928 - 2002, BY WATER YEAR (WY)
OCT NOV DEC JAN FEB MAR APR MAY JUN JUL AUG SEP
MEAN 13400 13390 10120 8379 8277 17270 42250 32840 26290 20890 13670 12920 MAX 49740 40360 21460 16060 21390 55010 122400 90100 69890 87420 48350 45950 (WY) 1987 1972 1983 1983 1966 1983 2001 1986 1993 1993 1993 1986 MIN 3526 3874 3379 3153 3519 4369 7215 6304 4185 3197 2366 3002 (WY) 1933 1977 1934 1935 1934 1934 1931 1931 1934 1934 1934 1976
SUMMARY STATISTICS FOR 2001 CALENDAR YEAR FOR 2002 WATER YEAR WATER YEARS 1928 - 2002 ANNUAL TOTAL 11365520 7869370 ANNUAL MEAN 31140 21560 18350a HIGHEST ANNUAL MEAN 38540 1986 LOWEST ANNUAL MEAN 4367 1934 HIGHEST DAILY MEAN 186000 Apr 27 67400 Apr 18 226000 Apr 18 1965 LOWEST DAILY MEAN 7400 Oct 9 7400 Oct 9 1380 Jul 13 1940 ANNUAL SEVEN-DAY MINIMUM 7720 Oct 4 7720 Oct 4 2190 Aug 11 1936 MAXIMUM PEAK FLOW 68000 Apr 18 228000 Apr 18 1965 MAXIMUM PEAK STAGE 32.91 Apr 18 43.11 Apr 18 1965 ANNUAL RUNOFF (AC-FT) 22540000 15610000 13300000 ANNUAL RUNOFF (CFSM) 0.70 0.48 0.41 ANNUAL RUNOFF (INCHES) 9.44 6.53 5.57 10 PERCENT EXCEEDS 80900 41200 39500 50 PERCENT EXCEEDS 10800 16600 12000 90 PERCENT EXCEEDS 8410 9390 5190 a Median of annual mean discharges is 18,500 ft3/s. e Estimated.
O N D2001
J F M A M J J A S2002
1000
2000
5000
10,00010,000
20,000
50,000
100,000
DAILY-MEAN DISCHARGE,
IN CUBIC FEET PER SECOND

254 UPPER MISSISSIPPI RIVER MAIN STEM--Continued
05344850 STURGEON LAKE, WEST SIDE, AT PRAIRIE ISLAND, MN
LOCATION.--Lat 44°38’18", long 92°38’38", in NE1⁄4NE1⁄4SW
1⁄4 sec. 32, T. 114 N., R. 15 W., Goodhue County, Hydrologic Unit 07040001, on west bank of Sturgeon Lake, 0.7 miles above lake outlet to Mississippi River and 7 miles northwest of Red Wing.
PERIOD OF RECORD.--July 1998 to current year.
GAGE.--Water-stage recorder. Datum of gage is sea level (NAVD of 1988).
REMARKS.--Records good. Water level affected by U.S. Army Corp of Engineers Lock and Dam 3 on the Mississippi River above Red Wing.
EXTREMES FOR PERIOD OF RECORD.--Maximum elevation, 685.90 ft, Apr. 28, 2001; maximum daily, 685.89 ft, Apr. 28, 2001; minimum elevation, 673.42 ft, Apr. 6, 2002; minimum daily, 673.49 ft, Apr. 6, 2002.
EXTREMES FOR CURRENT YEAR.--Maximum elevation, 678.13 ft, Apr. 18; maximum daily, 678.09 ft, Apr. 18; minimum elevation, 673.42 ft, Apr. 6; minimum daily, 673.49 ft, Apr. 6.
ELEVATION, FEET, WATER YEAR OCTOBER 2001 TO SEPTEMBER 2002 DAILY MEAN VALUES DAY OCT NOV DEC JAN FEB MAR APR MAY JUN JUL AUG SEP 1 674.45 674.57 674.26 674.34 674.51 674.62 674.19 673.83 673.86 675.32 673.84 673.84 2 674.32 674.57 674.27 674.33 674.49 674.56 673.98 673.79 673.83 675.17 673.86 674.03 3 674.47 674.50 674.42 674.35 674.59 674.43 673.62 673.98 673.86 674.94 673.99 673.74 4 674.49 674.52 674.41 674.40 674.57 674.34 673.55 673.78 673.73 674.65 673.95 673.88 5 674.53 674.42 674.32 674.45 674.62 674.44 673.56 673.77 673.81 674.27 674.11 673.93 6 674.59 674.46 674.26 674.51 674.59 674.50 673.49 673.86 673.85 673.84 674.07 673.97 7 674.55 674.45 674.18 674.45 674.54 674.49 673.68 673.84 673.98 673.76 674.01 673.96 8 674.48 674.44 674.17 674.42 674.45 674.52 673.79 673.89 674.03 673.93 674.02 673.99 9 674.58 674.25 674.13 674.40 674.44 674.65 673.85 673.87 673.87 673.84 673.99 673.98 10 674.51 674.32 674.17 674.44 674.54 674.52 673.86 674.06 673.75 673.88 673.92 673.97 11 674.57 674.34 674.01 674.41 674.48 674.59 673.91 674.08 673.64 673.99 673.84 673.81 12 674.50 674.37 673.91 674.37 674.64 674.51 673.91 674.19 673.73 674.23 673.89 673.80 13 674.58 674.45 673.78 674.31 674.58 674.54 674.05 674.67 673.78 674.38 673.90 673.83 14 674.62 674.47 673.87 674.39 674.60 674.52 675.02 675.00 673.81 674.76 673.81 673.79 15 674.58 674.45 673.88 674.38 674.66 674.52 676.13 675.20 673.75 674.89 673.84 673.64 16 674.49 674.45 673.94 674.33 674.68 674.36 677.13 675.27 673.61 674.84 673.94 673.67 17 674.43 674.42 673.91 674.31 674.60 674.28 677.74 675.26 673.75 674.72 674.00 673.77 18 674.58 674.49 673.92 674.28 674.55 674.36 678.09 675.14 673.75 674.45 673.99 673.72 19 674.43 674.52 673.91 674.29 674.58 674.50 678.03 674.89 673.75 674.19 673.83 673.79 20 674.40 674.45 673.90 674.32 674.52 674.52 677.82 674.57 673.94 674.02 673.79 673.77 21 674.44 674.52 674.03 674.39 674.40 674.45 677.53 674.17 673.87 674.07 673.92 673.94 22 674.46 674.50 674.26 674.41 674.32 674.34 677.18 674.05 674.03 673.93 674.05 674.03 23 674.47 674.55 674.37 674.41 674.34 674.37 676.82 673.91 674.12 673.73 674.12 674.00 24 674.42 674.64 674.45 674.32 674.44 674.42 676.37 673.84 674.13 673.71 674.14 673.95 25 674.48 674.57 674.46 674.36 674.38 674.44 675.76 673.80 674.05 673.70 674.07 673.97 26 674.38 674.49 674.47 674.43 674.35 674.39 675.31 673.75 674.15 673.77 673.93 673.98 27 674.26 674.59 674.40 674.45 674.29 674.31 675.04 673.77 674.45 673.78 673.80 673.73 28 674.38 674.44 674.45 674.48 674.51 674.44 674.70 673.73 674.84 673.80 673.76 673.74 29 674.56 674.32 674.45 674.51 --- 674.42 674.25 673.79 675.16 673.97 673.70 673.76 30 674.46 674.29 674.41 674.54 --- 674.27 673.96 673.80 675.32 673.88 673.72 673.78 31 674.48 --- 674.35 674.52 --- 674.28 --- 673.84 --- 673.91 673.85 ---
MEAN 674.48 674.46 674.18 674.40 674.51 674.45 675.21 674.17 674.01 674.20 673.92 673.86 MAX 674.62 674.64 674.47 674.54 674.68 674.65 678.09 675.27 675.32 675.32 674.14 674.03 MIN 674.26 674.25 673.78 674.28 674.29 674.27 673.49 673.73 673.61 673.70 673.70 673.64

255 UPPER MISSISSIPPI RIVER MAIN STEM--Continued
05344850 STURGEON LAKE, WEST SIDE, AT PRAIRIE ISLAND, MN--Continued
O N D2001
J F M A M J J A S2002
673
674
675
676
677
678
679
GAGE HEIGHT, IN FEET

256 UPPER MISSISSIPPI RIVER MAIN STEM--Continued
05345000 VERMILLION RIVER NEAR EMPIRE, MN
LOCATION.--Lat 44°40’00", long 93°03’17", in SW1⁄4NW1⁄4 sec. 24, T.114 N., R.19 W., Dakota County, Hydrologic Unit 07040001, on
right bank and just downstream from County Road 79, 2 mi west of Empire and 4 mi northeast of Farmington.
DRAINAGE AREA.--129 mi2.
PERIOD OF RECORD.--May 1942 to June 1945 (no record during July, August, and September 1944), September 1969 to September 1973 (discharge measurements only), October 1973 to current year. Prior to October 1975 published as "near Empire City".
GAGE.--Water-stage recorder. Datum of gage is 851.99 ft above sea level (NGVD of 1929, levels by U.S. Army Corps of Engineers). April 12, 1942 to June 30, 1944, and October 1, 1944 to July 7, 1945, nonrecording gage at same site and present datum.
REMARKS.--Records good. Some regulation at lower flows by wastewater treatment plant upstream.
EXTREMES OUTSIDE PERIOD OF RECORD.--Flood in April 1965, reached a stage of 7.5 ft, from information by local resident; discharge 6,200 ft3/s, from rating extended above 2,100 ft3/s.
DISCHARGE, CUBIC FEET PER SECOND, WATER YEAR OCTOBER 2001 TO SEPTEMBER 2002 DAILY MEAN VALUES DAY OCT NOV DEC JAN FEB MAR APR MAY JUN JUL AUG SEP 1 42 48 52 40 37 42 61 95 55 119 79 104 2 40 47 51 40 37 42 59 89 55 105 70 141 3 39 46 51 39 37 42 56 83 327 97 71 129 4 39 45 51 39 37 41 54 78 602 91 257 105 5 39 45 57 39 37 41 55 75 385 84 511 99 6 39 45 60 39 37 41 58 82 275 79 365 266 7 40 45 54 39 37 41 64 78 202 75 217 629 8 40 45 52 38 37 42 67 83 162 74 172 481 9 40 45 51 39 38 49 64 91 137 70 146 261 10 42 45 50 39 38 46 79 84 116 77 128 209 11 43 45 48 39 39 46 128 81 128 127 113 173 12 42 46 48 39 38 48 192 90 112 112 104 147 13 46 48 48 39 38 66 159 91 124 95 97 131 14 50 47 47 40 39 64 141 91 109 84 90 131 15 47 44 47 38 39 52 129 84 90 77 83 139 16 46 42 47 38 40 51 115 78 79 70 77 125 17 46 42 46 38 40 52 111 73 75 65 131 114 18 47 42 45 38 41 54 106 71 72 63 167 106 19 47 43 45 38 43 57 104 68 78 63 125 105 20 48 42 44 38 46 59 90 67 80 76 101 103 21 46 42 43 38 45 62 88 67 142 96 224 96 22 46 43 45 37 44 56 91 67 421 74 489 91 23 50 42 45 37 44 54 92 69 517 64 575 89 24 50 63 43 36 45 52 89 67 377 61 358 85 25 50 83 42 36 45 52 85 64 291 69 247 95 26 49 61 42 36 43 57 83 65 253 78 192 160 27 47 59 42 37 43 57 87 70 249 68 159 196 28 48 60 42 37 43 87 111 68 190 65 140 163 29 49 56 41 36 --- 85 112 68 158 120 128 146 30 47 54 41 36 --- 73 102 64 136 110 121 135 31 48 --- 40 37 --- 66 --- 61 --- 87 110 ---
TOTAL 1392 1460 1460 1179 1127 1677 2832 2362 5997 2595 5847 4954 MEAN 44.9 48.7 47.1 38.0 40.2 54.1 94.4 76.2 200 83.7 189 165 MAX 50 83 60 40 46 87 192 95 602 127 575 629 MIN 39 42 40 36 37 41 54 61 55 61 70 85 AC-FT 2760 2900 2900 2340 2240 3330 5620 4690 11900 5150 11600 9830 CFSM 0.35 0.38 0.37 0.29 0.31 0.42 0.73 0.59 1.55 0.65 1.46 1.28 IN. 0.40 0.42 0.42 0.34 0.32 0.48 0.82 0.68 1.73 0.75 1.69 1.43

257 UPPER MISSISSIPPI RIVER MAIN STEM--Continued
05345000 VERMILLION RIVER NEAR EMPIRE, MN--Continued
STATISTICS OF MONTHLY MEAN DATA FOR WATER YEARS 1942 - 2002, BY WATER YEAR (WY)
OCT NOV DEC JAN FEB MAR APR MAY JUN JUL AUG SEP
MEAN 55.6 51.4 40.6 32.5 38.5 98.4 116 94.0 97.1 75.8 63.2 73.4 MAX 160 133 79.5 58.6 89.8 199 337 223 290 258 234 313 (WY) 1995 1993 1993 1998 1998 1983 2001 1986 1993 1997 1997 1992 MIN 14.9 15.6 12.4 11.0 13.1 25.4 35.2 29.3 23.0 16.0 14.3 14.6 (WY) 1977 1977 1977 1977 1977 1975 1977 1977 1988 1988 1976 1976
SUMMARY STATISTICS FOR 2001 CALENDAR YEAR FOR 2002 WATER YEAR WATER YEARS 1942 - 2002 ANNUAL TOTAL 30288 32882 ANNUAL MEAN 83.0 90.1 70.0 HIGHEST ANNUAL MEAN 147 1998 LOWEST ANNUAL MEAN 23.6 1977 HIGHEST DAILY MEAN 637 Apr 8 629 Sep 7 3000 Sep 16 1992 LOWEST DAILY MEAN 30 Feb 23 36 Jan 24 8.4 Jan 15 1975 ANNUAL SEVEN-DAY MINIMUM 31 Feb 17 36 Jan 24 9.0 Jan 13 1975 MAXIMUM PEAK FLOW 795 Sep 7 6570 Sep 16 1992 MAXIMUM PEAK STAGE 7.09 Sep 7 10.00 Sep 16 1992 INSTANTANEOUS LOW FLOW 31a Feb 4 6.8a Aug 15 1992 ANNUAL RUNOFF (AC-FT) 60080 65220 50680 ANNUAL RUNOFF (CFSM) 0.64 0.70 0.54 ANNUAL RUNOFF (INCHES) 8.73 9.48 7.37 10 PERCENT EXCEEDS 179 159 133 50 PERCENT EXCEEDS 45 61 46 90 PERCENT EXCEEDS 33 39 21 a Result of regulation.
O N D2001
J F M A M J J A S2002
10
20
50
100100
200
500
1000
DAILY-MEAN DISCHARGE,
IN CUBIC FEET PER SECOND

258 UPPER MISSISSIPPI RIVER MAIN STEM--Continued
05346050 CLEAR LAKE, EAST SIDE, AT PRAIRIE ISLAND, MN
LOCATION.--Lat 43°38’11", long 92°58’26", in NE1⁄4SE1⁄4 sec. 15, T. 102 N., R. 18 W., Goodhue County, on east bank of Clear Lake
and 0.9 miles above lake output to Vermillion River.
PERIOD OF RECORD.--July 1998 to current year.
GAGE.--Water-stage recorder. Datum of gage is sea level (NAVD of 1988).
REMARKS.--Records good. Water level affected by U.S. Army Corp of Engineers Lock and Dam 3 on the Mississippi River.
EXTREMES FOR PERIOD OF RECORD.--Maximum gage height, 685.88 ft (from floodmark), Apr. 28, 2001; maximum daily, 678.93 ft, May 22, 1999 (probably higher in April 2001); minimum gage height, 668.22 ft, Oct. 26, 2002; minimum daily, 668.27 ft, Oct. 7, 2000.
EXTREMES FOR CURRENT YEAR.--Maximum gage height, 678.29 ft, April 18; maximum daily, 678.25, Apr. 18, 19; minimum gage height, 668.22 ft, Oct. 26; minimum daily, 668.28 ft, Oct. 26.
ELEVATION, FEET, WATER YEAR OCTOBER 2001 TO SEPTEMBER 2002 DAILY MEAN VALUES DAY OCT NOV DEC JAN FEB MAR APR MAY JUN JUL AUG SEP 1 668.54 668.60 669.07 669.25 668.42 668.43 669.52 674.07 669.75 676.30 671.32 671.70 2 668.54 668.55 669.03 669.04 668.46 668.46 670.05 673.71 669.70 --- 671.15 --- 3 668.48 668.54 669.00 668.95 668.48 668.51 670.22 673.49 670.71 --- 670.89 --- 4 668.45 668.51 669.05 668.96 668.51 668.51 670.28 673.28 670.74 --- 671.69 671.09 5 668.41 668.50 669.17 669.00 668.60 668.53 670.23 672.96 671.29 675.55 672.29 671.20 6 668.39 668.49 669.18 669.01 668.81 668.56 670.26 672.72 671.71 675.13 672.59 671.71 7 668.42 668.46 669.26 669.00 668.71 668.56 670.25 672.55 671.91 674.43 672.87 672.16 8 668.47 668.38 669.34 668.99 668.59 668.58 670.17 672.42 671.99 673.82 672.86 672.67 9 668.51 668.42 669.50 668.96 668.55 668.86 670.23 672.35 671.85 673.41 672.83 673.06 10 668.56 668.40 669.60 668.88 668.49 669.12 670.62 672.65 671.54 672.95 672.68 673.14 11 668.54 668.39 669.60 668.83 668.45 669.00 671.21 673.30 671.32 673.36 672.52 673.03 12 668.55 668.40 669.54 668.76 668.35 668.94 672.12 674.04 671.26 674.33 672.29 672.75 13 668.59 668.44 669.34 668.69 668.35 669.24 673.39 674.67 671.17 --- 672.00 672.32 14 668.63 668.45 669.25 668.70 668.41 669.52 674.68 675.15 670.92 --- 671.52 671.99 15 668.66 668.48 669.22 668.64 668.42 669.47 675.89 675.47 670.76 --- 671.04 671.75 16 668.65 668.49 669.17 668.63 668.42 669.30 677.45 675.63 670.60 --- 670.75 --- 17 668.64 668.52 669.00 668.60 668.47 669.14 677.91 675.70 670.48 --- 670.67 --- 18 668.63 668.46 668.93 668.54 668.56 669.25 678.25 675.67 670.37 675.92 670.59 --- 19 668.61 668.38 668.81 668.50 668.60 669.50 678.25 675.52 670.29 675.72 670.57 --- 20 668.59 668.42 668.84 668.48 668.63 669.52 678.06 675.27 670.12 --- 670.56 --- 21 668.57 668.43 668.88 668.48 668.64 669.34 677.78 674.94 670.51 --- 670.95 --- 22 668.57 668.42 668.86 668.50 668.66 669.11 677.45 674.50 671.72 --- 672.01 --- 23 668.59 668.43 668.70 668.54 668.72 668.93 677.12 673.94 672.85 673.87 672.99 --- 24 668.57 668.56 668.68 668.55 668.72 668.82 676.73 673.35 673.29 --- 673.41 --- 25 668.38 668.69 668.58 668.51 668.65 668.75 676.27 672.72 673.71 --- 673.50 --- 26 668.28 668.88 668.54 668.45 668.57 668.78 675.88 672.03 674.14 --- 673.47 --- 27 668.39 669.05 668.53 668.46 668.59 668.85 675.55 671.50 674.63 --- 673.42 669.81 28 668.43 669.14 668.56 668.46 668.49 668.88 675.24 671.02 675.07 671.50 673.23 669.81 29 668.42 669.25 668.64 668.45 --- 668.81 674.87 670.62 675.73 671.44 672.83 669.81 30 668.52 669.20 668.90 668.41 --- 668.90 674.47 670.29 676.16 671.48 672.36 669.82 31 668.61 --- 669.34 668.41 --- 669.11 --- 669.96 --- 671.52 671.96 ---
MEAN 668.52 668.58 669.04 668.70 668.55 668.94 674.01 673.40 671.88 --- 672.06 --- MAX 668.66 669.25 669.60 669.25 668.81 669.52 678.25 675.70 676.16 --- 673.50 --- MIN 668.28 668.38 668.53 668.41 668.35 668.43 669.52 669.96 669.70 --- 670.56 ---

259 UPPER MISSISSIPPI RIVER MAIN STEM--Continued
05346050 CLEAR LAKE, EAST SIDE, AT PRAIRIE ISLAND, MN--Continued
O N D2001
J F M A M J J A S2002
668
670
672
674
676
678
680
GAGE HEIGHT, IN FEET
Gap indicatesmissing record

260 UPPER MISSISSIPPI RIVER MAIN STEM--Continued
05353800 STRAIGHT RIVER NEAR FARIBAULT, MN
LOCATION.--Lat 44°15’29", long 93°13’51", in NW1⁄4SE1⁄4 sec. 9, T.109 N., R.20 W., Rice County, Hydrologic Unit 07040002, on
right bank 50 ft downstream from highway bridge, 2.8 mi upstream from Falls Creek and 3.2 mi southeast of Faribault.
DRAINAGE AREA.--435 mi2.
PERIOD OF RECORD.--October 1965 to current year.
GAGE.--Water-stage recorder. Datum of gage is 1,034.58 ft above sea level (NGVD of 1929).
REMARKS.--Records good except those for estimated daily discharges, which are fair to poor.
EXTREMES FOR CURRENT YEAR.--Peak discharges greater than base discharge of 1,500 ft3/s and maximum (*):
Discharge Gage height Discharge Gage height Date Time (ft3/s) (ft) Date Time (ft3/s) (ft)
Jun 4 1800 1,910 7.16 Jun 22 0200 *1,920 *7.24
Minimum discharge, 62 ft3/s, Feb. 27, gage height, 3.89 ft.
DISCHARGE, CUBIC FEET PER SECOND, WATER YEAR OCTOBER 2001 TO SEPTEMBER 2002 DAILY MEAN VALUES DAY OCT NOV DEC JAN FEB MAR APR MAY JUN JUL AUG SEP 1 79 75 192 e84 e93 e85 176 333 186 263 94 121 2 78 74 169 e86 e92 e78 166 310 161 241 82 110 3 74 76 154 e84 e91 e72 152 281 849 220 75 101 4 72 75 148 e83 e90 e69 145 256 1670 199 259 93 5 71 73 169 e85 e96 e68 139 240 1660 180 283 87 6 69 72 254 e87 e100 e68 134 266 1290 167 260 97 7 68 73 282 e85 e103 e69 132 251 846 154 210 87 8 69 71 253 e87 e110 e81 139 246 580 148 150 79 9 71 70 218 e88 e117 e160 143 238 453 143 122 73 10 85 69 208 e88 e120 e170 155 211 383 142 104 71 11 80 69 195 e89 e124 e180 228 204 512 158 94 69 12 80 67 187 e88 e123 e210 493 239 816 139 96 67 13 92 72 174 e87 e122 e330 596 238 726 128 105 66 14 103 71 163 e86 e122 e370 496 231 550 116 94 81 15 106 72 158 e85 e121 494 429 220 438 106 88 88 16 106 71 148 e84 e120 664 378 208 369 100 81 77 17 99 69 143 e83 e118 992 357 190 326 94 122 71 18 96 69 141 e82 e123 791 330 176 301 96 106 67 19 94 85 134 e86 e127 537 304 163 311 117 93 167 20 92 73 120 e89 e137 456 272 155 360 93 79 149 21 90 70 e110 e92 e133 377 269 148 1040 87 238 121 22 87 69 e104 e93 e112 280 272 145 1690 143 627 104 23 90 69 e100 e95 e110 e245 270 144 1280 198 917 95 24 83 128 e100 e98 e108 e225 285 132 879 151 772 89 25 82 168 e97 e99 e95 210 270 125 642 117 455 99 26 80 170 e96 e100 e82 202 248 123 494 108 325 120 27 76 207 e94 e102 e87 187 239 121 434 97 261 143 28 74 231 e90 e100 e92 188 287 267 376 88 212 156 29 73 238 e89 e98 --- 190 344 418 330 96 178 151 30 72 218 e88 e96 --- 180 353 319 295 85 155 338 31 73 --- e86 e94 --- 178 --- 237 --- 120 137 ---
TOTAL 2564 3014 4664 2783 3068 8406 8201 6835 20247 4294 6874 3237 MEAN 82.7 100 150 89.8 110 271 273 220 675 139 222 108 MAX 106 238 282 102 137 992 596 418 1690 263 917 338 MIN 68 67 86 82 82 68 132 121 161 85 75 66 AC-FT 5090 5980 9250 5520 6090 16670 16270 13560 40160 8520 13630 6420 CFSM 0.19 0.23 0.34 0.20 0.25 0.61 0.62 0.50 1.53 0.31 0.50 0.24 IN. 0.22 0.25 0.39 0.23 0.26 0.71 0.69 0.58 1.70 0.36 0.58 0.27

261 UPPER MISSISSIPPI RIVER MAIN STEM--Continued
05353800 STRAIGHT RIVER NEAR FARIBAULT, MN--Continued
STATISTICS OF MONTHLY MEAN DATA FOR WATER YEARS 1966 - 2002, BY WATER YEAR (WY)
OCT NOV DEC JAN FEB MAR APR MAY JUN JUL AUG SEP
MEAN 213 191 120 69.8 118 508 662 464 434 321 228 169 MAX 831 595 336 167 837 1270 2365 1322 1470 1027 1136 645 (WY) 1969 1971 1983 1992 1984 1973 2001 1999 2001 1993 1979 1993 MIN 17.0 15.1 11.0 11.0 12.9 26.4 70.2 58.1 45.8 26.2 16.2 16.0 (WY) 1977 1977 1977 1977 1968 1968 1977 1976 1976 1988 1976 1976
SUMMARY STATISTICS FOR 2001 CALENDAR YEAR FOR 2002 WATER YEAR WATER YEARS 1966 - 2002 ANNUAL TOTAL 179488 74187 ANNUAL MEAN 492 203 292 HIGHEST ANNUAL MEAN 754 1993 LOWEST ANNUAL MEAN 43.9 1977 HIGHEST DAILY MEAN 5340 Jun 15 1690 Jun 22 5410 May 2 1973 LOWEST DAILY MEAN 57 Feb 27 66 Sep 13 11a Feb 18 1968 ANNUAL SEVEN-DAY MINIMUM 60 Sep 13 70 Nov 8 11 Feb 18 1968 MAXIMUM PEAK FLOW 1920 Jun 22 6030 Jul 7 1990 MAXIMUM PEAK STAGE 7.24 Jun 22 12.74b Mar 5 1974 INSTANTANEOUS LOW FLOW 62 Feb 27 10 Oct 27 1976 ANNUAL RUNOFF (AC-FT) 356000 147100 211500 ANNUAL RUNOFF (CFSM) 1.11 0.46 0.66 ANNUAL RUNOFF (INCHES) 15.11 6.24 8.98 10 PERCENT EXCEEDS 1540 377 716 50 PERCENT EXCEEDS 98 123 127 90 PERCENT EXCEEDS 65 73 32 a Many days in 1968 and 1977. b Backwater from ice. e Estimated.
O N D2001
J F M A M J J A S2002
10
20
50
100100
200
500
10001000
2000
5000
10,000
DAILY-MEAN DISCHARGE,
IN CUBIC FEET PER SECOND

262 UPPER MISSISSIPPI RIVER MAIN STEM--Continued
05355200 CANNON RIVER AT WELCH, MN
LOCATION.--Lat 44°33’50", long 92°43’55", in NW1⁄4SW1⁄4 sec. 27, T. 113 N., R. 16 W., Goodhue County, on right bank 0.3 mile
downstream from highway bridge at Welch and 1.8 miles upstream from Belle Creek.
DRAINAGE AREA.--1,340 mi2.
PERIOD OF RECORD.--June 1909 to January 1914 (no winter records 1909-11), November 1930 to September 1971, October 1972 to September 1987 (annual maximum only), October 1991 to current year.
REVISED RECORDS.--WSP 1308: 1912(M). WSP 1508: 1933. WSP 1914: 1960. WRD MN-98: 1986 (M), 1997.
GAGE.--Water-stage recorder. Datum of gage is 699.16 ft above sea level (NGVD of 1929). Prior to Nov. 11, 1930, nonrecording gage on highway bridge at site 0.3 mile upstream at datum 3.00 ft lower. Nov. 11, 1930 to Oct. 11, 1938, water-stage recorder at site 0.3 mile upstream at present datum.
EXTREMES OUTSIDE PERIOD OF RECORD.--Maximum stage known, 17.1 ft, present datum, in April 1888, from floodmark at mill about 2,400 ft upstream.
REMARKS.--Records good to fair except those for estimated daily discharges, which are fair. Flow affected at lower stages by regulation from hydropower plant upstream.
DISCHARGE, in CFS, WATER YEAR OCTOBER 2001 TO SEPTEMBER 2002 DAILY MEAN VALUES DAY OCT NOV DEC JAN FEB MAR APR MAY JUN JUL AUG SEP 1 269 332 545 e300 317 298 536 713 374 1100 667 793 2 297 336 472 e295 e290 273 541 726 359 1040 656 819 3 325 337 481 e300 e270 249 549 708 622 1000 627 835 4 328 328 444 e310 e250 251 511 695 1690 899 2290 786 5 336 320 457 e320 e270 257 467 687 2490 856 1670 699 6 333 305 513 325 e305 258 451 694 2440 810 1380 911 7 312 305 520 325 313 290 441 689 2160 808 1210 925 8 305 309 517 327 311 297 446 695 1760 813 1080 853 9 315 308 543 323 312 715 464 699 1290 776 890 786 10 337 303 566 325 315 662 517 685 1160 734 868 701 11 332 301 529 325 315 700 656 659 1500 754 811 646 12 313 304 530 336 306 763 759 612 2170 744 705 582 13 375 337 520 346 315 1050 844 602 1920 717 640 535 14 417 371 488 343 315 1070 1040 592 1550 696 650 547 15 400 362 461 344 318 989 1040 558 1400 665 639 587 16 365 360 456 340 318 848 992 501 1190 614 618 594 17 326 325 441 336 318 978 987 493 1110 603 670 583 18 329 311 403 e270 330 1290 948 470 1000 611 655 537 19 329 315 411 e270 384 1440 884 430 916 627 622 526 20 338 309 410 276 411 1130 830 406 917 663 603 546 21 354 317 394 300 418 971 795 373 1920 657 1020 610 22 358 321 372 339 422 828 785 341 5530 631 3330 611 23 367 326 400 337 386 750 766 331 3910 580 3100 573 24 364 370 e350 329 365 711 765 326 2660 564 2570 535 25 345 453 e300 309 362 699 738 336 2150 589 2200 496 26 343 501 e275 322 363 688 701 337 2060 641 1900 605 27 331 507 e290 322 334 668 697 336 1840 624 1480 656 28 318 530 e310 322 310 574 701 333 1550 596 948 655 29 329 584 e320 319 --- 534 706 336 1380 750 857 655 30 326 582 e315 294 --- 538 703 371 1230 672 753 654 31 326 --- e310 304 --- 536 --- 393 --- 668 753 ---
TOTAL 10442 10969 13343 9833 9243 21305 21260 16127 52248 22502 36862 19841 MEAN 336.8 365.6 430.4 317.2 330.1 687.3 708.7 520.2 1742 725.9 1189 661.4 MAX 417 584 566 346 422 1440 1040 726 5530 1100 3330 925 MIN 269 301 275 270 250 249 441 326 359 564 603 496 AC-FT 20710 21760 26470 19500 18330 42260 42170 31990 103600 44630 73120 39350 CFSM 0.25 0.27 0.32 0.24 0.25 0.51 0.53 0.39 1.30 0.54 0.89 0.49 IN. 0.29 0.30 0.37 0.27 0.26 0.59 0.59 0.45 1.45 0.62 1.02 0.55

263 UPPER MISSISSIPPI RIVER MAIN STEM--Continued
05355200 CANNON RIVER AT WELCH, MN--Continued
STATISTICS OF MONTHLY MEAN DATA FOR WATER YEARS 1909 - 2002, BY WATER YEAR (WY)
OCT NOV DEC JAN FEB MAR APR MAY JUN JUL AUG SEP
MEAN 379.7 374.8 293.9 242.7 309.1 979.3 1431 811.5 877.1 609.7 458.3 395.7 MAX 1806 1708 1105 662 1141 2627 8240 2966 4144 3343 2951 1823 (WY) 1969 1971 1992 1992 1966 1992 1965 1944 1993 1993 1993 1993 MIN 65.5 78.8 75.0 76.9 110 149 145 84.9 80.0 71.2 78.1 72.8 (WY) 1934 1934 1938 1938 1913 1911 1911 1934 1934 1934 1936 1933
SUMMARY STATISTICS FOR 2001 CALENDAR YEAR FOR 2002 WATER YEAR WATER YEARS 1909 - 2002 ANNUAL TOTAL 441164 243975 ANNUAL MEAN 1209 668.4 619.7 HIGHEST ANNUAL MEAN 2132 1993 LOWEST ANNUAL MEAN 137 1934 HIGHEST DAILY MEAN 10800 Apr 13 5530 Jun 22 28700 Apr 8 1965 LOWEST DAILY MEAN 150 Feb 25 249 Mar 3 19a Jan 2 1950 ANNUAL SEVEN-DAY MINIMUM 160 Feb 19 268 Mar 2 42 Aug 12 1936 MAXIMUM PEAK FLOW 6120 Jun 22 36100 Apr 8 1965 MAXIMUM PEAK STAGE 9.21 Jun 22 15.05 Jun 27 1998 INSTANTANEOUS LOW FLOW 221 Feb 4 2.5a Jan 3 1950 ANNUAL RUNOFF (AC-FT) 875000 483900 448900 ANNUAL RUNOFF (CFSM) 0.90 0.50 0.46 ANNUAL RUNOFF (INCHES) 12.25 6.77 6.28 10 PERCENT EXCEEDS 3680 1120 1390 50 PERCENT EXCEEDS 370 535 306 90 PERCENT EXCEEDS 262 309 104 a Result of ice jam upstream. e Estimated.
O N D2001
J F M A M J J A S2002
100
200
500
10001000
2000
5000
10,000
DAILY-MEAN DISCHARGE,
IN CUBIC FEET PER SECOND

264 UPPER MISSISSIPPI RIVER MAIN STEM--Continued
05372995 SOUTH FORK ZUMBRO RIVER AT ROCHESTER, MN
LOCATION.--Lat 44°03’42", long 92°27’58", in NW1⁄4NE1⁄4 sec. 23, T.107 N., R.14 W., Olmsted County, Hydrologic Unit 07040004, on
left bank 50 ft downstream from 37th Street bridge, 0.2 mi upstream from wastewater treatment plant, and 2.0 mi downstream from Silver Lake Dam.
DRAINAGE AREA.--303 mi2.
PERIOD OF RECORD.--March 1981 to current year.
GAGE.--Water-stage recorder. Datum of gage is 950.00 ft above sea level (NGVD of 1929). Prior to Mar. 1981, recording gage at site 0.6 miles downstream. Record published as "near Rochester, MN" and under downstream order number 05373000. Peak flow record is considered equivalent at both sites but daily-mean streamflows are not.
REMARKS.--Records good except those for estimated daily discharges, which are fair. Some regulation at times from Silver Lake.
EXTREMES OUTSIDE PERIOD OF RECORD.--Flood of July 6, 1978, reached a stage of about 28.0 ft, on upstream side of bridge, discharge 30,500 ft3/s. This is the highest known stage since at least 1908.
EXTREMES FOR CURRENT YEAR.--Peak discharges greater than base discharge of 1,300 ft3/s and maximum (*):
Discharge Gage height Discharge Gage height Date Time (ft3/s) (ft) Date Time (ft3/s) (ft)
Jun 11 0400 2,180 7.65 Aug 17 0600 *2,400 *8.14 Jun 21 0700 2,080 7.42
Minimum discharge, 50 ft3/s, Feb. 4, gage height, 2.18 ft.
DISCHARGE, CUBIC FEET PER SECOND, WATER YEAR OCTOBER 2001 TO SEPTEMBER 2002 DAILY MEAN VALUES DAY OCT NOV DEC JAN FEB MAR APR MAY JUN JUL AUG SEP 1 91 79 133 68 72 125 113 249 e88 218 140 173 2 89 78 126 66 e69 e113 116 235 116 197 131 169 3 83 73 123 63 e67 e106 107 215 244 175 190 164 4 83 72 117 61 68 e104 102 199 636 163 390 159 5 81 71 154 65 76 e106 100 191 841 164 227 153 6 76 71 159 69 76 e112 99 203 540 179 190 166 7 73 71 157 65 79 118 98 187 368 176 174 151 8 72 69 149 69 84 152 105 195 305 172 164 146 9 93 69 149 73 98 234 106 187 256 168 157 140 10 98 68 143 77 141 169 104 174 233 e171 148 138 11 88 69 137 80 114 177 198 178 1020 e169 141 132 12 86 65 133 79 124 206 276 177 611 e162 141 131 13 149 87 131 79 94 390 263 176 483 e140 149 127 14 141 73 124 80 109 319 230 167 395 121 136 159 15 133 72 119 80 108 224 215 162 325 111 129 138 16 118 69 119 76 107 183 209 156 272 100 126 131 17 109 67 117 62 97 198 194 149 244 96 712 126 18 104 77 113 65 114 187 187 143 222 e116 325 123 19 105 81 110 73 178 182 176 137 297 e150 226 130 20 105 73 93 74 261 176 168 132 217 e169 195 129 21 98 72 91 74 221 173 179 125 1080 e208 367 124 22 105 73 130 77 180 143 176 119 940 e259 425 120 23 95 87 92 77 179 157 174 117 550 e184 344 116 24 95 139 76 75 178 159 175 115 418 e163 289 116 25 90 127 96 74 175 135 169 115 359 175 255 154 26 85 133 92 78 163 139 163 113 430 165 233 154 27 82 140 87 80 134 130 225 108 341 158 213 144 28 80 138 88 82 158 128 308 105 294 150 199 135 29 81 138 88 84 --- 125 327 105 258 153 190 136 30 80 138 78 79 --- 122 275 98 228 155 183 135 31 81 --- 72 81 --- 118 --- 91 --- 149 176 ---
TOTAL 2949 2639 3596 2285 3524 5110 5337 4823 12611 5036 7065 4219 MEAN 95.1 88.0 116 73.7 126 165 178 156 420 162 228 141 MAX 149 140 159 84 261 390 327 249 1080 259 712 173 MIN 72 65 72 61 67 104 98 91 88 96 126 116 AC-FT 5850 5230 7130 4530 6990 10140 10590 9570 25010 9990 14010 8370 CFSM 0.31 0.29 0.38 0.24 0.42 0.54 0.59 0.51 1.39 0.54 0.75 0.46

265 UPPER MISSISSIPPI RIVER MAIN STEM--Continued
05372995 SOUTH FORK ZUMBRO RIVER AT ROCHESTER, MN--Continued
STATISTICS OF MONTHLY MEAN DATA FOR WATER YEARS 1981 - 2002, BY WATER YEAR (WY)
OCT NOV DEC JAN FEB MAR APR MAY JUN JUL AUG SEP
MEAN 148 141 115 75.5 127 354 430 328 293 244 173 168 MAX 824 338 358 167 454 760 1269 735 1014 663 501 1075 (WY) 1987 1992 1992 1983 1984 1983 2001 2001 1993 1993 1990 1986 MIN 20.0 24.5 21.0 22.5 23.8 109 79.4 88.3 49.0 23.2 24.6 31.5 (WY) 1990 1990 1990 1990 1990 2001 2000 1989 1989 1988 1988 1988
SUMMARY STATISTICS FOR 2001 CALENDAR YEAR FOR 2002 WATER YEAR WATER YEARS 1981 - 2002 ANNUAL TOTAL 109051 59194 ANNUAL MEAN 299 162 218 HIGHEST ANNUAL MEAN 431 1993 LOWEST ANNUAL MEAN 87.3 1989 HIGHEST DAILY MEAN 4410 Apr 12 1080 Jun 21 7710 Sep 21 1986 LOWEST DAILY MEAN 47 Feb 23 61 Jan 4 12 Sep 12 1988 ANNUAL SEVEN-DAY MINIMUM 49 Feb 17 65 Jan 1 14 Sep 8 1988 MAXIMUM PEAK FLOW 2400 Aug 17 10000 Sep 21 1986 MAXIMUM PEAK STAGE 8.14 Aug 17 20.77 Sep 21 1986 INSTANTANEOUS LOW FLOW 50a Feb 4 10a Oct 23 1981 ANNUAL RUNOFF (AC-FT) 216300 117400 157600 ANNUAL RUNOFF (CFSM) 0.99 0.54 0.72 10 PERCENT EXCEEDS 783 258 473 50 PERCENT EXCEEDS 115 134 123 90 PERCENT EXCEEDS 59 74 49 a Due in part to regulation. e Estimated.
O N D2001
J F M A M J J A S2002
10
20
50
100100
200
500
10001000
2000
5000
10,000
DAILY-MEAN DISCHARGE,
IN CUBIC FEET PER SECOND

266 UPPER MISSISSIPPI RIVER MAIN STEM--Continued
05378500 MISSISSIPPI RIVER AT WINONA, MN
LOCATION.--Lat 44°03’21", long 91°38’16", in sec. 23, T.107 N., R.7 W., Winona County, Hydrologic Unit 07040003, on right bank at Winona pumping station in Winona, 9.5 mi upstream from Trempealeau River, and at mile 725.7 upstream from the Ohio River.
DRAINAGE AREA.--59,200 mi2 (approximately).
PERIOD OF RECORD.--June 1928 to current year. Gage-height records collected in this vicinity since 1878 are contained in reports of Mississippi River Commission.
GAGE.--Water-stage recorder. Datum of gage is 639.64 ft above sea level (NGVD of 1929). June 10,1928 to Apr. 15, 1931, nonrecording gage at site 800 ft upstream. Prior to Oct. 1, 1929, at datum 0.20 ft higher and Oct. 1, 1929 to Apr. 15, 1931, at datum 0.12 ft lower. Apr. 16, 1931 to Nov. 12, 1934, nonrecording gage at present site and datum. Since Mar. 31, 1937, auxiliary water-stage recorder 2.7 mi upstream at tailwater of navigation dam 5A.
REMARKS.-- Records for discharges above 50,000 cfs are good while records for discharge below 50,000 cfs are fair to poor. Some regulation by reservoirs, navigation dams, and power plants at low and medium stages. Daily discharges for some days were based in part on instantaneous discharges obtained from the U.S. Army Corps of Engineers for Lock and Dam 5A.
EXTREMES FOR PERIOD OF RECORD.--Minimum gage height, -3.38 ft, Aug. 31, 1934 (prior to dam construction in 1936); minimum gage height since 1938, after completion of dam, 1.95 ft, Jan. 27, 1944.
DISCHARGE, CUBIC FEET PER SECOND, WATER YEAR OCTOBER 2001 TO SEPTEMBER 2002 DAILY MEAN VALUES DAY OCT NOV DEC JAN FEB MAR APR MAY JUN JUL AUG SEP 1 15500 22100 33000 17000 18100 17400 35300 67400 41200 65800 42100 47000 2 15600 22500 31000 18000 18500 17600 38000 66200 39500 64600 41800 46700 3 15000 22100 28000 19000 17800 17900 41500 65300 40100 64700 41200 45500 4 15400 20600 30000 20000 17500 20300 40900 62700 46000 63400 43000 46300 5 15300 19100 32000 20000 16600 20800 39200 61400 47300 59900 45800 47700 6 15200 18700 33000 21000 16600 19300 38800 56600 50000 56800 46800 49300 7 14200 19200 33000 21000 16500 18300 37100 54300 51400 56300 49500 50900 8 12400 18500 34000 23000 18300 18100 38200 53000 52000 54900 50800 53200 9 12000 19200 39000 24000 19000 18400 39600 54100 52000 52500 50600 57100 10 16300 18800 40000 27000 18300 19400 40900 55200 51000 50700 49100 60800 11 18100 19300 38000 25000 18500 20600 43700 58300 50500 50800 48100 61200 12 18100 19000 37000 24000 17500 21900 50200 63600 50600 53300 47900 57600 13 18100 18700 36000 22900 18100 26100 57000 69300 49200 55100 47800 55000 14 18700 18700 33000 22200 17500 27700 66100 73400 47700 56000 45700 52900 15 19800 18600 31000 22300 17100 27700 82100 74000 47500 57400 43000 52300 16 20600 18900 31000 21900 17000 27900 101000 74100 43500 58100 41600 49100 17 21300 18700 31000 21900 17600 26700 115000 73900 42800 57400 40500 46700 18 21400 19100 30000 21000 17600 25800 121000 73000 42600 57300 40800 44600 19 20800 19600 29000 19600 19000 25200 124000 71400 41800 57100 40800 44200 20 20100 19400 27000 18900 22500 25300 122000 68600 41000 55900 40900 42100 21 19400 19400 24000 17800 23500 25600 117000 65900 42500 55700 41300 40200 22 19800 19700 22000 17800 23800 26100 111000 61700 46000 55500 47700 37500 23 20000 19500 23000 18800 24000 26500 105000 57800 52000 53200 53900 36000 24 20100 19800 24000 20100 24900 25600 99100 56800 56000 51100 56300 36000 25 19700 23300 22000 20200 24900 22700 92900 53800 57700 48900 57600 36400 26 19300 24600 16000 20100 24400 21600 84800 51700 60600 48600 58200 37100 27 18500 24300 13000 19700 22600 22100 78900 50700 64000 47500 57800 37400 28 16100 30000 13000 19600 19200 21600 76700 48400 66600 45000 55700 36900 29 15200 37000 14000 19300 --- 24000 74100 46500 66800 43400 53000 37500 30 17000 37000 17000 19100 --- 28200 69800 42600 66600 44100 51600 37000 31 20300 --- 17000 18400 --- 31400 --- 42000 --- 43900 48500 ---
TOTAL 549300 645400 861000 640600 546900 717800 2180900 1873700 1506500 1684900 1479400 1382200 MEAN 17720 21510 27770 20660 19530 23150 72700 60440 50220 54350 47720 46070 MAX 21400 37000 40000 27000 24900 31400 124000 74100 66800 65800 58200 61200 MIN 12000 18500 13000 17000 16500 17400 35300 42000 39500 43400 40500 36000 AC-FT 1090000 1280000 1708000 1271000 1085000 1424000 4326000 3716000 2988000 3342000 2934000 2742000 CFSM 0.30 0.36 0.47 0.35 0.33 0.39 1.23 1.02 0.85 0.92 0.81 0.78

267 UPPER MISSISSIPPI RIVER MAIN STEM--Continued
05378500 MISSISSIPPI RIVER AT WINONA, MN--Continued
STATISTICS OF MONTHLY MEAN DATA FOR WATER YEARS 1928 - 2002, BY WATER YEAR (WY)
OCT NOV DEC JAN FEB MAR APR MAY JUN JUL AUG SEP
MEAN 22370 23050 17870 15460 15740 30500 62660 49650 40070 32330 21990 22630 MAX 85950 50040 40440 30480 35900 86420 152600 119800 100200 118800 67560 69490 (WY) 1987 1972 1992 1983 1984 1983 1965 2001 1993 1993 1993 1986 MIN 6774 7367 6286 6742 7874 9023 12810 11930 8450 7063 5391 6790 (WY) 1934 1934 1934 1940 1977 1934 1931 1931 1934 1934 1934 1933
SUMMARY STATISTICS FOR 2001 CALENDAR YEAR FOR 2002 WATER YEAR WATER YEARS 1928 - 2002 ANNUAL TOTAL 17268900 14068600 ANNUAL MEAN 47310 38540 29560 HIGHEST ANNUAL MEAN 56850 1986 LOWEST ANNUAL MEAN 9742 1934 HIGHEST DAILY MEAN 236000 Apr 17 124000 Apr 19 264000 Apr 20 1965 LOWEST DAILY MEAN 12000 Oct 9 12000 Oct 9 2250 Dec 29 1933 ANNUAL SEVEN-DAY MINIMUM 14200 Oct 3 14200 Oct 3 3210 Dec 27 1933 MAXIMUM PEAK FLOW 124000 Apr 19 268000 Apr 19 1965 MAXIMUM PEAK STAGE 13.51 Apr 19 20.77a Apr 19 1965 INSTANTANEOUS LOW FLOW 1940b Dec 12 1980 ANNUAL RUNOFF (AC-FT) 34250000 27910000 21410000 ANNUAL RUNOFF (CFSM) 0.80 0.65 0.50 10 PERCENT EXCEEDS 106000 63800 60700 50 PERCENT EXCEEDS 23000 37000 21300 90 PERCENT EXCEEDS 17700 18000 10000 a From highwater mark. b Result of ice jam upstream.
O N D2001
J F M A M J J A S2002
10,000
20,000
50,000
100,000100,000
200,000
500,000
1,000,000
DAILY-MEAN DISCHARGE,
IN CUBIC FEET PER SECOND

268 UPPER MISSISSIPPI RIVER MAIN STEM--Continued
05457000 CEDAR RIVER NEAR AUSTIN, MN
LOCATION.--Lat 43°38’11", long 92°58’26", in NE1⁄4SE1⁄4 sec. 15, T.102 N., R.18 W., Mower County, Hydrologic Unit 07080201, on
left bank 200 ft upstream from abandoned powerhouse, 500 ft downstream from highway bridge, 1.1 mi downstream from Turtle Creek, and 1.1 mi south of Austin.
DRAINAGE AREA.--399 mi2.
PERIOD OF RECORD.--May 1909 to September 1914, October 1944 to current year.
REVISED RECORDS.--WSP 1145: 1945, 1948.
GAGE.--Water-stage recorder. Datum of gage is 1,162.10 ft above sea level (NGVD of 1929). May 1909 to April 1912, nonrecording gage in tailwater of power plant 200 ft downstream at datum 3.1 ft lower. May 1912 to September 1914, nonrecording gage on highway bridge 500 ft downstream at datum 1.1 ft lower.
REMARKS.--Records good except those for estimated daily discharges, which are fair. Some regulation at lower flows by wastewater treatment plant upstream.
EXTREMES FOR CURRENT YEAR.--Peak discharges greater than base discharge of 1,500 ft3/s and maximum (*):
Discharge Gage height Discharge Gage height Date Time (ft3/s) (ft) Date Time (ft3/s) (ft)
Jun 5 1030 *1,650 *6.44 No other peak greater than base discharge.
Minimum discharge, 56 ft3/s, Sept. 13, gage height, 2.25 ft.
DISCHARGE, in CFS, WATER YEAR OCTOBER 2001 TO SEPTEMBER 2002 DAILY MEAN VALUES DAY OCT NOV DEC JAN FEB MAR APR MAY JUN JUL AUG SEP 1 105 88 169 84 75 93 99 404 128 200 82 68 2 100 86 152 86 79 87 105 355 122 179 73 66 3 98 81 148 84 77 82 93 308 216 164 71 65 4 95 80 144 83 74 e80 95 278 925 148 188 62 5 92 80 173 85 76 77 97 253 1570 133 276 61 6 86 82 182 87 71 79 89 258 1160 123 361 67 7 84 81 189 e85 74 79 91 235 761 113 254 74 8 86 82 182 85 80 108 102 219 546 111 181 65 9 94 78 166 89 98 127 105 219 434 105 141 63 10 107 79 168 94 128 106 100 197 371 168 119 69 11 97 75 158 92 114 120 203 201 430 229 103 61 12 95 76 159 91 105 167 448 206 529 172 116 60 13 120 89 158 94 87 330 473 195 441 135 125 59 14 120 86 149 106 94 301 398 186 371 115 114 83 15 128 83 142 97 97 220 341 178 325 106 104 73 16 118 81 140 89 97 159 296 178 292 99 90 72 17 110 79 138 83 90 200 300 168 270 94 95 68 18 110 80 138 82 94 189 281 158 249 89 79 69 19 107 85 131 81 129 188 252 149 231 88 80 72 20 103 79 116 80 202 206 219 143 223 87 75 70 21 100 79 122 84 174 172 225 136 349 93 84 68 22 97 80 145 86 127 116 225 127 823 186 108 66 23 98 81 99 86 137 156 215 131 611 187 156 64 24 92 137 117 82 129 147 222 122 514 130 133 62 25 98 145 148 81 121 109 208 123 390 118 111 78 26 89 150 124 85 82 117 188 122 480 111 101 87 27 85 166 103 87 104 112 217 120 419 127 92 90 28 81 193 101 92 108 114 410 139 309 100 85 87 29 88 186 103 86 --- 118 567 199 258 105 81 89 30 86 179 88 80 --- 111 490 165 224 96 77 82 31 86 --- e86 82 --- 108 --- 141 --- 83 72 ---
TOTAL 3055 3026 4338 2688 2923 4378 7154 6013 13971 3994 3827 2120 MEAN 98.55 100.9 139.9 86.71 104.4 141.2 238.5 194.0 465.7 128.8 123.5 70.67 MAX 128 193 189 106 202 330 567 404 1570 229 361 90 MIN 81 75 86 80 71 77 89 120 122 83 71 59 AC-FT 6060 6000 8600 5330 5800 8680 14190 11930 27710 7920 7590 4210 CFSM 0.25 0.25 0.35 0.22 0.26 0.35 0.60 0.49 1.17 0.32 0.31 0.18 IN. 0.28 0.28 0.40 0.25 0.27 0.41 0.67 0.56 1.30 0.37 0.36 0.20

269 UPPER MISSISSIPPI RIVER MAIN STEM--Continued
05457000 CEDAR RIVER NEAR AUSTIN, MN--Continued
STATISTICS OF MONTHLY MEAN DATA FOR WATER YEARS 1909 - 2002, BY WATER YEAR (WY)
OCT NOV DEC JAN FEB MAR APR MAY JUN JUL AUG SEP
MEAN 163.0 160.7 107.5 75.33 109.7 468.6 542.4 334.3 328.2 276.1 185.4 145.3 MAX 884 997 431 261 701 1428 2328 1387 1624 1456 1720 734 (WY) 1974 1910 1992 1973 1984 1973 2001 1999 1993 1978 1993 1993 MIN 37.3 35.7 26.6 26.5 25.0 53.3 52.9 67.9 48.9 22.6 32.3 30.9 (WY) 1959 1959 1913 1913 1913 1968 1911 1910 1950 1911 1948 1911
SUMMARY STATISTICS FOR 2001 CALENDAR YEAR FOR 2002 WATER YEAR WATER YEARS 1909 - 2002 ANNUAL TOTAL 166723 57487 ANNUAL MEAN 456.8 157.5 242.0a HIGHEST ANNUAL MEAN 824 1993 LOWEST ANNUAL MEAN 58.1 1977 HIGHEST DAILY MEAN 7110 Apr 12 1570 Jun 5 11100 Jul 10 2000 LOWEST DAILY MEAN 71 Sep 5 59 Sep 13 0.00b Jan 15 1911 ANNUAL SEVEN-DAY MINIMUM 78 Sep 12 64 Sep 7 13 Sep 1 1912 MAXIMUM PEAK FLOW 1650 Jun 5 15300 Jul 10 2000 MAXIMUM PEAK STAGE 6.44 Jun 5 21.49c Jul 10 2000 INSTANTANEOUS LOW FLOW 56 Sep 13 0.00b Jan 15 1911 ANNUAL RUNOFF (AC-FT) 330700 114000 175300 ANNUAL RUNOFF (CFSM) 1.14 0.39 0.61 ANNUAL RUNOFF (INCHES) 15.54 5.36 8.24 10 PERCENT EXCEEDS 1100 285 502 50 PERCENT EXCEEDS 120 108 97 90 PERCENT EXCEEDS 81 77 45 a Median of annual mean discharges is 224 ft3/s. b Occurred on several days in 1911, result of regulation. c From floodmark. e Estimated.
O N D2001
J F M A M J J A S2002
10
20
50
100100
200
500
10001000
2000
5000
10,000
DAILY-MEAN DISCHARGE,
IN CUBIC FEET PER SECOND

270 UPPER MISSISSIPPI RIVER MAIN STEM--Continued
05476000 DES MOINES RIVER AT JACKSON, MN
LOCATION.--Lat 43°37’10", long 94°59’10", in SE1⁄4SW1⁄4 sec. 24, T.102 N., R.35 W., Jackson County, Hydrologic Unit 07100001, on
right bank at old dam structure in Jackson.
DRAINAGE AREA.--1,250 mi2.
PERIOD OF RECORD.--May 1909 to December 1913, August 1930 to current year (winter record incomplete prior to 1936). Published as "Des Moines River near Jackson", 1930-35, as "West Fork Des Moines River near Jackson", 1936-44, and as "West Fork Des Moines River at Jackson", 1945-69.
REVISED RECORDS.--WSP 1115: 1942. WSP 1175: Drainage area. WSP 1238: 1950. WSP 1308: 1938(M).
GAGE.--Water-stage recorder. Datum of gage is 1,287.75 ft above sea level (NGVD of 1929). May 31, 1909 to Dec. 20, 1913, nonrecording gage at site 0.6 mi downstream at datum 0.99 ft lower. Aug. 22, 1930 to Sept. 30, 1944, nonrecording gage at site 7 mi upstream at datum 17.10 ft higher. Oct. 1, 1944 to Oct. 26, 1949, nonrecording gage at site 600 ft upstream at datum 10.64 ft higher. Oct. 27, 1949 to Dec. 15, 1965, water-stage recorder 200 ft downstream at present datum.
REMARKS.--Records good except those for estimated daily discharges, which are fair to poor. Regulation at times from Yankton, Long, Shetek, and Heron Lakes.
EXTREMES FOR CURRENT YEAR.--Peak discharges greater than base discharge of 540 ft3/s and maximum (*):
Discharge Gage height Discharge Gage height Date Time (ft3/s) (ft) Date Time (ft3/s) (ft)
Apr 4 daily e568 -- May 13 0130 *706 *5.51 May 2 2230 670 5.40 Aug 22 1300 640 5.31
Minimum discharge, 4.4 ft3/s, Aug. 1, gage height, 2.35 ft.
DISCHARGE, CUBIC FEET PER SECOND, WATER YEAR OCTOBER 2001 TO SEPTEMBER 2002 DAILY MEAN VALUES DAY OCT NOV DEC JAN FEB MAR APR MAY JUN JUL AUG SEP 1 23 18 169 e69 e68 e92 e467 553 434 204 6.9 229 2 24 18 151 e67 e67 e96 e520 642 460 167 5.0 178 3 19 17 188 e67 e66 e82 e541 629 444 145 9.3 151 4 19 16 216 e69 e66 e82 e568 602 450 124 15 e130 5 19 16 213 e72 69 e81 e536 555 440 113 29 112 6 16 16 226 e73 64 e82 528 515 440 109 144 106 7 15 18 213 e74 65 e81 520 479 465 100 192 98 8 15 17 210 e75 66 e80 491 483 477 81 227 90 9 17 17 172 e76 70 e79 474 540 456 72 199 81 10 25 15 272 e79 69 e80 469 519 443 72 198 73 11 22 14 277 e80 68 80 507 526 450 68 185 66 12 21 16 278 e83 62 78 502 648 382 64 181 61 13 21 17 258 e84 71 83 502 687 349 73 169 56 14 24 20 191 e86 68 87 518 650 330 63 175 62 15 23 18 250 e86 73 89 525 639 281 53 151 57 16 21 16 264 e88 81 87 520 664 268 49 134 49 17 21 31 265 e87 89 96 556 631 259 43 115 46 18 37 69 240 e86 101 104 521 607 251 37 99 41 19 36 69 197 e82 117 e99 500 564 253 34 101 42 20 26 62 134 e79 132 e97 431 519 278 28 75 37 21 23 45 e110 e78 142 e98 481 480 264 29 186 34 22 19 46 e101 e77 154 e95 502 469 269 31 491 34 23 18 95 e92 e75 e155 e92 484 478 309 21 568 30 24 20 185 e84 e73 e140 e90 485 416 367 19 525 28 25 20 242 e82 e71 e122 e88 445 361 422 18 546 36 26 23 238 e90 e70 e98 e88 384 370 406 13 507 37 27 18 233 e93 e68 e96 e102 431 357 354 12 428 31 28 33 164 e87 e66 e98 e177 510 339 309 9.7 358 27 29 30 140 e82 e65 --- e288 519 341 274 12 303 28 30 24 189 e77 e65 --- e347 529 353 245 13 264 31 31 19 --- e72 e68 --- e410 --- 404 --- 8.9 239 ---
TOTAL 691 2077 5354 2338 2537 3610 14966 16020 10829 1885.6 6825.2 2081 MEAN 22.3 69.2 173 75.4 90.6 116 499 517 361 60.8 220 69.4 MAX 37 242 278 88 155 410 568 687 477 204 568 229 MIN 15 14 72 65 62 78 384 339 245 8.9 5.0 27 AC-FT 1370 4120 10620 4640 5030 7160 29690 31780 21480 3740 13540 4130 CFSM 0.02 0.06 0.14 0.06 0.07 0.09 0.40 0.41 0.29 0.05 0.18 0.06 IN. 0.02 0.06 0.16 0.07 0.08 0.11 0.45 0.48 0.32 0.06 0.20 0.06

271 UPPER MISSISSIPPI RIVER MAIN STEM--Continued
05476000 DES MOINES RIVER AT JACKSON, MN--Continued
STATISTICS OF MONTHLY MEAN DATA FOR WATER YEARS 1930 - 2002, BY WATER YEAR (WY)
OCT NOV DEC JAN FEB MAR APR MAY JUN JUL AUG SEP
MEAN 162 180 109 50.3 69.7 453 1104 677 636 536 230 172 MAX 1724 1833 792 298 504 2250 6045 3923 4892 6018 2192 2243 (WY) 1987 1980 1980 1980 1983 1983 1969 1993 1993 1993 1993 1942 MIN 0.000 0.000 0.000 0.000 0.000 11.8 9.37 2.59 3.76 1.04 0.13 0.000 (WY) 1956 1956 1956 1956 1936 1959 1959 1934 1931 1931 1955 1931
SUMMARY STATISTICS FOR 2001 CALENDAR YEAR FOR 2002 WATER YEAR WATER YEARS 1930 - 2002 ANNUAL TOTAL 318495 69213.8 ANNUAL MEAN 873 190 385a HIGHEST ANNUAL MEAN 2098 1993 LOWEST ANNUAL MEAN 15.1 1956 HIGHEST DAILY MEAN 6400 Apr 28 687 May 13 15500 Apr 11 1969 LOWEST DAILY MEAN 13 Feb 3 5.0 Aug 2 0.00b Jul 19 1931 ANNUAL SEVEN-DAY MINIMUM 14 Feb 1 9.3 Jul 28 0.00 Jul 19 1931 MAXIMUM PEAK FLOW 706c May 13 15700 Apr 11 1969 MAXIMUM PEAK STAGE 6.07d Apr 2 19.45 Apr 11 1969 INSTANTANEOUS LOW FLOW 4.4 Aug 1 0.00b Jul 19 1931 ANNUAL RUNOFF (AC-FT) 631700 137300 279100 ANNUAL RUNOFF (CFSM) 0.70 0.15 0.31 ANNUAL RUNOFF (INCHES) 9.48 2.06 4.19 10 PERCENT EXCEEDS 3070 507 1070 50 PERCENT EXCEEDS 82 95 95 90 PERCENT EXCEEDS 15 19 4.2 a Median of annual mean discharges is 256 ft3/s. b Many days, several years. c Gage height, 5.51 ft. d Backwater from ice. e Estimated.
O N D2001
J F M A M J J A S2002
1
2
5
1010
20
50
100100
200
500
1000
DAILY-MEAN DISCHARGE,
IN CUBIC FEET PER SECOND

THIS PAGE IS INTENTIONALLY BLANK
272

273
Discharge atHigh-Flow Partial-Record Stations,
Low-Flow Sites, andMiscellaneous Sites______________
Discharge at High-Flow Partial-Record Stations

274
Figure 7. Location of high-flow partial-record stations.
Base from U.S. Geological Survey digital data1:2,000,000, 1972, Albers Equal-Area ConicProjection, standard parallels 29°30' and 45°30',Central meridian 93°30'
94°
96°
92°
48°
46°
44°
92°
90°
EXPLANATION
Hudson Bay Basin
Great Lakes Basin
Upper MississippiRiver Basin
Missouri River Basin
Partial-record high-flowstation
0 25 50 75 MILES
0 25 50 75 KILOMETERS
MilleLacsLake
�MontevideoMontevideo
�RochesterRochester
�MankatoMankato
�St. CloudSt. Cloud
�
St. PaulSt. Paul�MinneapolisMinneapolis
�
GrandRapidsGrand
RapidsGrand
Rapids
�DuluthDuluth
�International
FallsInternational
FallsInternational
Falls
�BemidjiBemidji
UpperRed Lake
UpperRed Lake
Red LakeLower
Red LakeLower
�
Lake
Superio
r
MoorheadMoorhead
of theLake
Woodsof theLake
Woods
0533974705339747
0648300006483000
06482970064829700648302006483020
0648335306483353
0547490005474900 0531819505318195
0545777805457778
0531695005316950
0538703005387030
0538450005384500
06483350064833500660353006603530
0527893005278930
05330300053303000535502405355024
0534855005348550
0532048005320480
0545896005458960
0531784505317845
0538550005385500
0537308005373080
0538435005384350
0537400005374000
0547698905476989
0531889705318897
0529975005299750
0531830005318300
0648274506482745
0648293306482933
0648250006482500
05316570053165700531653805316538
0513700005137000
0508690005086900
0520520005205200
0513410005134100
0507570005075700
05079901050799010507770005077700
0513187805131878
05131750051317500512555005125550
0527230005272300
0520044505200445
0506385005063850
0507500005075000
05229430052294300524420005244200
0533517005335170
05336200053362000402409504024095
0504790005047900
0529337105293371
0530250005302500
052679000526790005268000052680000527015005270150
05272950052729500527812005278120
0506080005060800
0506705005067050
0506120005061200
0505070005050700
05221020052210200522945005229450
0526152005261520
0524444005244440
0401199004011990
0402048004020480
0401525004015250
0507669005076690
0530500005305000
0401053004010530
0401340004013400
0401507004015070
0401541504015415
0526100005261000
0402070004020700
0402169004021690
05311400053114000532545005325450
05380100053801000538480005384800
0531733005317330
0648291006482910
0529400005294000
0538500005385000
0504900005049000

DISCHARGE AT HIGH-FLOW PARTIAL-RECORD STATIONS 275
e
As the number of streams on which streamflow information is likely to be desired far exceeds the number of stream-gagingstations feasible to operate at one time, the Geological Survey collects limited streamflow data at sites other thanstream-gaging stations. When limited streamflow data are collected on a systematic basis over a period of years for usein hydrologic analyses, the site at which the data are collected is called a partial-record station. Data collected atthese partial-record stations are usable in low-flow or flood-flow analyses, depending on the type of data collected. Inaddition, discharge measurements are made at other sites not included in the partial-record program. These measurementsare generally made in times of drought or flood to give better areal coverage to those events. Those measurements andothers collected for some special reason are called measurements at miscellaneous sites.
Records collected at high-flow partial-record stations are presented in a table of annual maximum stage and discharge.Discharge measurements made at miscellaneous sites for both low flows and high flows are given in a second table.
The following table contains annual maximum discharges for high-flow (crest-stage) partial-record stations. A crest-stagegage is a device which will register the peak stage occurring between inspections of the gage. A stage-discharge relationfor each gage is developed from discharge measurements made by indirect measurements of peak flow or by current meter. Thedate of the maximum discharge is not always certain but is usually determined by comparison with nearby continuous-recordstations, weather records, or local inquiry. The years given in the period of record represent water years for which theannual maximum has been determined.
Annual maximum discharge at high-flow sites during water year 2002[--, data not available]
Station Name and[Station Number]
Location and[Drainage area]
Periodof
Record
Water year 2002 Maximum Period of Record Maximum
DateGage
height(feet)
Discharge(ft3/s)
DateGage
height(feet)
Discharg(ft3/s)
Reservation River near Hovland [04010530]
Lat 47o52’38”, long 89o51’45”, in SE1/4 SW
1/4 sec. 6, T.62 N., R.5 E., Cook County, Hydrologic Unit 04010101, at bridge on U.S. Highway 61, on Grand Portage Indian Reserva-tion, 1,200 feet upstream from mouth, and 5.5 miles northeast of Hovland [Drainage area: 16.5 mi2].
1991-92#,2000-
current year
11-25-01 2.63 349 04-24-01 a3.58 928
Cascade River near Grand Marais[04011990]
Lat 47°47’24”, long 90°31’35”, in SE1/4 SW
1/4 sec. 1., T.61 N., R.2 W., Cook County, Hydrologic Unit 04010101, at bridge on Forest Road 45, 6.6 miles upstream from mouth, 9.5 miles west of Grand Marais[Drainage area: 87.6 mi2].
1985- current year
04-17-02 10.49 343 04-24-01 13.36 1,810
Little Marais River near Lit-tle Marais [04013400]
Lat 47°24’58”, long 91°06’08”, in SW1/4 SW
1/4 sec. 16, T.57 N., R.6 W., Lake County, Hydrologic Unit 04010101, at bridge on U.S. Highway 61, 0.5 mile northeast of Little Marais [Drainage area:4.47 mi2].
2000- current year
04-11-02 a17.44 b30 11-07-00 a18.14 b400
Lake Superior Trib. at Split Rock State Park [04015070]
Lat 47°11’33’, long 91°23’29”, in SE1/4 NE
1/4 sec. 6, T.54 N., R.8 W., Lake County, Hydrologic Unit 04010102, at culvert on U.S. Highway 61, 1 mile northeast of Split Rock River, 1.5 mile southwest of Split Rock Lighthouse State Park entrance, and 6 miles southwest of Beaver River [Drainage area: 3.27 mi2].
2001- current year
04-13-02 a16.13 b79 11-07-00 16.68 197
Silver Creek tributary nearTwo Harbors[04015250]
Lat 47°04’40”, long 91°36’49”, in SW1/4NE
1/4 sec. 16, T.53 N.,R.10 W., Lake County, Hydrologic Unit 04010102, at culvert on County High-way 3, 1.0 mile upstream from mouth, 4.5 miles northeast of Two Harbors [Drainage area: 3.62 mi2].
1965- current year
06-23-02 c10.62 999 9-20-72 17.08 1,880
Lake Superior Trib. on W. 9th St. in Duluth [04015415]
Lat 46o45’27”, long 92o09’25”, in NE1/4 SE
1/4 sec. 6, T.49 N., R.14 W., St. Louis County, Hydrologic Unit 04010201, at culvert on West 9th St. in Duluth, 1.0 mile above mouth [Drainage area: 1.81 mi2].
2001- current year
06-24-02 8.90 64 04-23-01 9.22 122

DISCHARGE AT HIGH-FLOW PARTIAL-RECORD STATIONS--Continued
Annual maximum discharge at high-flow sites during water year 2002--Continued
276
e
North BranchWhiteface River near Fairbanks[04020480]
Lat 47°22’20", long 91°56’28", in NW1/4NW
1/4 sec. 1, T.56 N., R.13 W., St. Louis County, Hydrologic Unit 04010201, at culvert on County High-way 16, 2 miles upstream from the mouth of Jenkins Creek, 0.7 mile west of Fairbanks[Drainage area: 17.1 mi2].
1979- current year
04-16-02 11.99 102 04-23-79 13.67 660
Bug Creek atShaw[04020700]
Lat 47°06’40", long 92°21’03", in SW1/4SE
1/4 sec. 34, T.54 N., R.16 W., St. Louis County, Hydrologic Unit 04010201, at culverts on County Road 15 at Shaw, 7.5 miles upstream from mouth [Drainage area: 24.8 mi2].
1979- current year
06-23-02 17.75 1,250 07-05-99 18.00 1,350
Cloquet River near Toimi[04021690]
Lat 47°21’00", long 91°39’30", in NE1/4SW
1/4 sec. 7, T.56 N., R.10 W., Lake County, Hydrologic Unit 04010202, at bridge on County High-way 2, 5.8 miles southeast of Toimi, 23 miles north of Two Harbors [Drainage area: 40.8 mi2].
1986- current year
06-24-02 6.04 360 07-04-93 9.06 1,540
Nemadji River near Holyoke[04024095]
Lat 46°31’04", long 92°23’22", in NE1/4NE
1/4 sec. 32, T.47 N., R.16 W, Carlton County, Hydrologic Unit 04010301, at bridge on State Highway 23, 3.5 miles north of Holyoke and 7 miles south of Wrenshall [Drainage area: 127 mi2].
1972- current year
04-11-02 12.75 2,410 09-03-85 17.38 4,420
Twelvemile Creek near Dumont[05047900]
Lat 45°42’58”, long 96°20’54”, in SE1/4SW
1/4 sec. 17, T.126 N., R.45 W., Traverse County, Hydrologic Unit 09020102, at bridge on Traverse County Road 6, 3 miles east of Dumont.
1996- current year
07-11-02 d4.46 36 04-06-97 13.63 b3,720
Mustinka River above Wheaton[05049000]
Lat 45°49'15", long 96°29'25", in SW1/4 SW
1/4 sec. 8, T.127 N., R.46 W., Traverse County, Hydrologic Unit 09020102, at bridge on U.S. Highway 75, 1 mile upstream from Chicago, Milwaukee and St. Paul railroad bridge, 0.5 mile north of Wheaton, about 8 miles above Lake Traverse. Prior to 2002 WY at datum 73.77 ft lower [Drainage area: 810 mi2].
1915-24#, 1930-58#, 1985-
current year
07-11-02 83.50 1,450 04-07-97 04-09-01
e97.40e94.45
8,800 11,000
Rabbit River near Nashua[05050700]
Lat 46°04'30", long 96°18'24", in SE1/4NE
1/4 sec. 15, T.130 N., R.45 W., Wilkin County, Hydrologic Unit 09020101, at bridge on County Road 19, 2.6 miles north of Nashua, 4.8 miles upstream from mouth of South Fork Rabbit River[Drainage area: 99.2 mi2].
1979- current year
07-10-02 14.95 680 04-05-97 a15.76 b1,640
Buffalo River near Callaway[05060800]
Lat 47°01'17", long 95°54'43", in SW1/4SW
1/4 sec. 17, T.141 N., R.41 W., Becker County, Hydrologic Unit 09020106, at culvert on U.S. Highway 59, 2.7 miles north of Callaway [Drainage area: 76.4 mi2].
1960- current year
06-20-02 13.70 265 07-16-93 24.90 1,630
Station Name and[Station Number]
Location and[Drainage area]
Periodof
Record
Water year 2002 Maximum Period of Record Maximum
DateGage
height(feet)
Discharge(ft3/s)
DateGage
height(feet)
Discharg(ft3/s)

DISCHARGE AT HIGH-FLOW PARTIAL-RECORD STATIONS--Continued
Annual maximum discharge at high-flow sites during water year 2002--Continued
277
ge )
Whiskey Creek at Barnesville[05061200]
Lat 46°39’35", long 96°23’54", in SE1/4SW
1/4 sec. 20, T.137 N., R.45 W., Clay County, Hydrologic Unit 09020106, at culvert on State High-way 34, 0.7 mile upstream from Blue Eagle Lake, 1.0 mile northeast of Barnesville [Drainage area: 76.3 mi2].
1961-64, 1965-66#,
1967- current year
06-24-02 5.22 180 05-31-85 7.12 660
State Ditch 45 Tributary near Ulen[05063850]
Lat 47°06’28", long 96°25’03", in SE/4 SW
1/4 sec.17, T.142 N., R.45 W., Clay County, Hydrologic Unit 09020108, at culvert on 180th Ave. North, 7.5 miles northwest of Ulen [Drainage area: 3.26 mi2].
2002-current year
06-09-02 18.27 f376 06-09-02 18.27 f376
Marsh River Ditch near Ada[05067050]
Lat 47°17’46", long 96°26’09", in NE1/4NE
1/4 sec. 13, T.144 N., R. 46 W., Norman County, Hydrologic Unit 09020108, at bridge on County High-way 24, 3.5 miles southeast of Ada.
1985- current year
06-24-02 19.64 2,000 06-24-02 19.64 2,000
Red Lake River at High Landing near Goodridge [05075000]
Lat 48°02’34”, long 95°48’28”, in NW1/4NW
1/4 sec. 28, T.153 N., R.40 W., Pennington County, Hydrologic Unit 09020303, on left bank 50 ft upstream from County Highway 24 bridge at High Landing, 7 miles south of Goodridge and 33 miles upstream from Thief River Falls[Drainage area: 2,300 mi2].
1929-2000#, 2001-
current year
07-10-02 10.14 2,030 07-07-75 13.39 4,060
Mud River near Grygla[05075700]
Lat 48°19'31", long 95°44'35", in NE1/4NE
1/4 sec. 23, T.156 N., R.40 W., Hydrologic Unit 09020304, Mar-shall County, at bridge on State Highway 89, 6 miles west of Grygla [Drainage area: 150 mi2].
1979- current year
06-22-02 18.54 2,840 06-22-02 18.54 2,840
Clearwater River Trib. near Bagley [05076690]
Lat 47o30’34”, long 95o24’15”, in SE1/4 NE
1/4 sec. 31, T.147 N., R.37 W., Clearwater County, Hydrologic Unit 09020305, at culvert on County State Aid Highway 28, 0.5 mile south of Bagley.
2001- current year
06-23-02 c13.50 -- 06-23-02 c13.50 --
Ruffy Brook near Gonvick[05077700]
Lat 47°44'50", long 95°24’45", in SE1/4SE
1/4 sec. 5, T.149 N., R.37 W., Clearwater County, Hydrologic Unit 09020305, at culvert on County High-way 67, 4.0 miles upstream from mouth, 4.8 miles east of Gonvick [Drainage area: 46.2 mi2].
1960-78#, 1979-85, 1986#, 1987-
current year
06-20-02 5.83 407 04-19-96 5.78 455
Burnham Creek near Crookston[05079901]
Lat 47°43'59", long 96°39'52", in SE1/4SW
1/4 sec. 10, T.149 N., R.47 W., Polk County, Hydrologic Unit 09020303, at triple box culvert on U.S. Highway 75, 0.75 mile northeast of Girard, 3 miles southwest of Crookston, 7 miles above mouth[Drainage area: 134 mi2].
1986- current year
07-11-02 22.0 2,900 04-15-97 22.63 3,000
Middle River near Newfolden[05086900]
Lat 48°22'04", long 96°16'47", in NE1/4NE
1/4 sec. 3, T.156 N., R.44 W., Marshall County, Hydrologic Unit 09020309, at bridge on township road, 2.0 miles northeast of New-folden [Drainage area: 88.8 mi2].
1979- current year
06-11-02 20.12 1,700 06-11-02 05-18-96
20.1218.31
-- 2,300
Station Name and[Station Number]
Location and[Drainage area]
Periodof
Record
Water year 2002 Maximum Period of Record Maximum
DateGage
height(feet)
Discharge(ft3/s)
DateGage
height(feet)
Dischar(ft3/s

DISCHARGE AT HIGH-FLOW PARTIAL-RECORD STATIONS--Continued
Annual maximum discharge at high-flow sites during water year 2002--Continued
278
e
Stoney River near Babbitt[05125550]
Lat 47°41’36", long 91°45’38", in SW1/4SW
1/4 sec. 8, T.60 N., R.11 W., Lake County, Hydrologic Unit 09030001, in Superior National For-est, at bridge on Forest Road 424, 4.7 miles upstream from mouth, 8.5 miles southeast of Babbitt[Drainage area: 215 mi2].
1975-80#, 1986-
current year
04-23-02 5.62 688 04-19-76 8.71 2,490
Big Fork River near Bigfork[05131750]
Lat 47°44’56", long 93°46’31", in SE1/4SE
1/4 sec. 1, T.149 N., R.25 W., Itasca County, Hydrologic Unit 09030006, at bridge on State Highway 6, 5.5 miles west of Bigfork [Drainage area: 606 mi2].
1973- current year
06-24-02 14.29 1,980 04-22-79 15.48 2,830
Bowerman Brook near Craigville[05131878]
Lat 47°55’29", long 93°45’34", in NE1/4NW
1/4 sec. 26, T.63 N., R.27 W., Koochiching County, Hydrologic Unit 09030006, at culvert on State High-way 6, 2.4 miles upstream from mouth, 7.0 miles west of Craigville[Drainage area: 25.7 mi2].
1979- current year
06-23-02 15.83 937 06-23-02 15.83 937
North Branch Rapid River near Baudette[05134100]
Lat 48°31’56", long 94°38’50", in NW1/4SW
1/4 sec. 4, T.158 N., R.31 W., Lake of the Woods County, Hydrologic Unit 09030007, at bridge on County Highway 1, 12.7 miles southwest of Baudette [Drainage area: 174 mi2].
1986- current year
06-11-02 c18.34 6,380 06-11-02 c18.34 6,380
Winter Road River near Baudette[05137000]
Lat 48°42’39", long 94°41’52", in NW1/4NE
1/4 sec. 1, T.160 N., R.32 W., Lake of the Woods County, Hydrologic Unit 09030008, at bridge on State Highway 11, 4.5 miles west of Bau-dette, 1.8 miles east of Pitt, 5 miles upstream of mouth[Drainage area: 140 mi2].
1986- current year
06-11-02 cd19.35 9,900 06-11-02 cd19.35 9,900
Mississippi River at Bemidji[05200445]
Lat 47°27’04”, long 94°54’23”, in NW1/4NW
1/4 sec. 20, T.146 N., R.33 W., Beltrami County, Hydrologic Unit 07010101, at bridge on County High-way 11, 1.4 miles southwest of intersection of State Highway 197 and County Highway 7 in Bemidji[Drainage area: 358 mi2].
1973-87, 1988-89#, 1990-
current year
06-24-02 12.98 1,440 04-18-97 13.17 1,820
Boy River near Remer[05205200]
Lat 47°04’51”, long 94°05’54”, in NE1/4NE
1/4 sec. 33, T.142 N., R.27 W., Cass County, Hydrologic Unit 07010102, at bridge on County High-way 53, 1.9 miles upstream from Boy Lake and 9 miles northwest of Remer[Drainage area: 289 mi2].
1986- current year
08-29-02 d10.08 254 04-10-96 07-23-87
a11.59 11.64
b660 660
Willow River below Palisade[05221020]
Lat 46°42’36”, long 93°33’21”, in NW1/4NE
1/4 sec. 30, T.49 N., R.25 W., Aitkin County, Hydrologic Unit 07010103, at bridge on County High-way 3, 3.2 miles west of Palisade[Drainage area: 523 mi2].
1972- current year
07-08-02 d11.59 1,140 04-25-79 17.25 3,730
Hoblin Creek near Pine River [05229430]
Lat 46°41'06", long 94°30'49", in SE1/4NE
1/4 sec. 18, T.137 N., R.30 W., Cass County, Hydrologic Unit 07010105, at culvert on township road, 3.4 miles upstream from mouth, 5.6 miles southwest of Pine River.
2002-currentyear
07-08-02 8.38 -- 07-08-02 8.38 --
Station Name and[Station Number]
Location and[Drainage area]
Periodof
Record
Water year 2002 Maximum Period of Record Maximum
DateGage
height(feet)
Discharge(ft3/s)
DateGage
height(feet)
Discharg(ft3/s)

DISCHARGE AT HIGH-FLOW PARTIAL-RECORD STATIONS--Continued
Annual maximum discharge at high-flow sites during water year 2002--Continued
279
0
ge )
Pine River near Pine River[05229450]
Lat 46°41’39”, long 94°22’11”, in NE1/4SE
1/4 sec. 8, T.137 N., R.29 W., Cass County, Hydrologic Unit 07010105, at bridge on U.S. Highway 371, 2.3 miles southeast of Pine River, 4.9 miles upstream of Upper Whitefish Lake [Drainage area: 261 mi2].
1986- current year
07-10-02 4.64 748 05-14-99 5.15 1,520
Cat River near Nimrod[05244200]
Lat 46°37’49”, long 94°55’51”, in SW1/4SW
1/4 sec. 36, T.137 N., R.34 W., Wadena County, Hydrologic Unit 07010106, at bridge on State Highway 227, 2.5 miles west of Nimrod, 3.0 miles upstream from mouth[Drainage area: 57.1 mi2].
1961- current year
07-11-02 d5.62 120 10-12-73 9.43 560
Leaf River nearAldrich[05244440]
Lat 46°27’25”, long 94°50’29”, in SW1/4SW
1/4 sec. 34, T.135 N., R.33 W., Wadena County, Hydrologic Unit 07010107, at bridge on County High-way 29, 3.3 miles upstream from mouth, 7.0 miles northeast of Ald-rich[Drainage area: 870 mi2].
1972- current year
07-11-02 13.34 1,580 04-12-01 16.40 5,800
Mississippi River near Fort Ripley [05261000]
Lat 46o10'50", long 94o21'56", in SE1/4NW
1/4 sec. 27, T.43 N., R.32 W., Crow Wing County, on left bank 600 feet. upstream from Nokasippi River and 1.0 mile north of Ft. Ripley. [Drainage area 10,840 mi2].
1987-00#,2001-
current year
07-14-02 d9.66 14,700 04-08-97 14.15 32,20
Nokasippi River near Fort Ripley[05261520]
Lat 46°12’02”, long 94°19’03”, in NE1/4NE
1/4 sec. 24, T.43 N., R.32 W., Crow Wing County, Hydrologic Unit 07010104, at bridge on County High-way 2, 3 miles northeast of Fort Ripley [Drainage area: 193 mi2].
1967-70†,1974†, 1976†, 1986-
current year
05-09-02 11.12 391 06-15-01 14.83 1,110
Hillman Creek near Pierz[05267900]
Lat 45°58’27”, long 94°04’21”, in NE1/4SE
1/4 sec. 9, T.40 N., R.30 W.,Morrison County, Hydrologic Unit 07010201, at bridge on county high-way, 1.1 miles upstream from mouth, 1.5 miles east of Pierz[Drainage area: 45.0 mi2].
1964- current year
05-09-0207-08-02
d13.35g--
d321g--
04-09-69 15.48 2,960
Platte River at Royalton[05268000]
Lat 45°50’43”, long 94°17’40”, in SE1/4NW
1/4 sec. 26, T.39 N.,R.32 W., Morrison County, Hydrologic Unit 07010201, at bridge on County High-way 27, 0.6 mile north of Royalton, 6.6 miles upstream from mouth [Drainage area: 432 mi2].
1929-36, 1972-
current year
07-11-02 d10.65 972 07-26-72 -- 6,850
Ashley Creek near Sauk Centre[05270150]
Lat 45°46’46”, long 94°58’52”, in NW1/4SE
1/4 sec. 29, T.127 N., R.34 W., Todd County, Hydrologic Unit 07010202, at bridge on County High-way 11, 3 miles north of Sauk Centre [Drainage area: 119 mi2].
1963-70†,74†, 1976†,
1986-88, 1989#, 1990-
current year
06-24-02 14.88 416 04-08-01 18.00 1,020
Johnson Creek near St.Augusta[05272300]
Lat 45°27’49”, long 94°09’19”, in NW1/4SW
1/4 sec. 13, T.123 N.,R.28 W., Stearns County, Hydrologic Unit 07010203, at bridge on County High-way 7, 1.0 mile south of St. Augusta, 3.3 miles upstream from mouth [Drainage area: 45.6 mi2].
1964- current year
08-04-02 14.21 629 09-09-85 16.37 2,350
Station Name and[Station Number]
Location and[Drainage area]
Periodof
Record
Water year 2002 Maximum Period of Record Maximum
DateGage
height(feet)
Discharge(ft3/s)
DateGage
height(feet)
Dischar(ft3/s

DISCHARGE AT HIGH-FLOW PARTIAL-RECORD STATIONS--Continued
Annual maximum discharge at high-flow sites during water year 2002--Continued
280
e
Clearwater River near South Haven[05272950]
Lat 45°16’45”, long 94°15’04”, in NE1/4NW
1/4 sec. 19, T.121 N., R.28 W., Wright County, Hydrologic Unit 07010203, at culvert 3.4 miles southeast of Kimball, 0.25 mile downstream of Scott Lake Outlet, 2.0 miles southeast of South Haven [Drainage area: 78.8 mi2].
1985- current year
08-08-02 d15.89 542 09-09-85 17.11 1,040
North Fork Crow River near Kingston[05278120]
Lat 45°12’13”, long 94°23’16”, in SW1/4SE
1/4 sec. 13, T.120 N., R.30 W., Meeker County, Hydrologic Unit 07010204, at bridge on State Highway 24, 3.7 miles west of Kingston, 3.9 miles east of Forest City [Drainage area: 779 mi2].
1986- current year
06-27-02 16.92 3,970 05-01-86 17.82 4,850
Buffalo Creek near Glencoe[05278930]
Lat 44°45’50”, long 94°05’27”, in SW1/4SW
1/4 sec. 16, T.115 N., R.27 W., McLeod County, Hydrologic Unit 07010205, at bridge on County High-way 1, 2.6 miles east of Glencoe[Drainage area: 373 mi2].
1972-95, 1998-
current year
08-04-02 15.85 1,240 09-12-91 11.78 4,300
Pomme de Terre River near Elbow Lake[05293371]
Lat 45°57’47”, long 95°53’07”, in SE1/4 SW
1/4 sec. 19, T.129 N., R.41 W., Grant County, Hydrologic Unit 07020002, at bridge on County Road 47, 4 miles southeast of Elbow Lake, 2.5 miles south of the outlet of Pomme de Terre Lake[Drainage area: 340 mi2].
1986- current year
06-21-02 6.40 440 06-15-01 6.85 600
Pomme de Terre River near Appleton [05294000]
Lat 45°12’10”, long 96°01’20”, in SW1/4 NW
1/4 sec. 14, T.120 N., R.43 W., Swift County, Hydrologic Unit 07020002, on left bank 60 feet upstream from bridge on U.S. Highway 59 and State Highway 119 at Apple-ton, 8 miles upstream from mouth [Drainage area: 864 mi2].
1931-35,
1935-99#, 2000-
current year
06-23-02 d5.64 539 04-07-97 18.13 8,890
Florida Creek near Burr[05299750]
Lat 44°44’10”, long 96°25’10”, in SE1/4 SE
1/4 sec. 29, T.115 N., R.46 W., Yellow Medicine County, Hydro-logic Unit 07020003, at culvert on County Road 15, 3.0 miles west of Burr, 7.6 miles northwest of Canby [Drainage area: 77.3 mi2].
1982, 1983-84#, 1991-
current year
03-31-02 a16.62 b214 04-01-97 26.57 2,490
Little Chippewa River near Starbuck[05302500]
Lat 45°36’52”, long 95°37’12”, in NW1/4NE
1/4 sec. 30, T.125 N., R.39 W., Pope County, Hydrologic Unit 07020005, at culvert on State High-way 28, 4.4 miles west of Starbuck [Drainage area: 96.2 mi2].
1979- current year
07-10-02 12.93 213 04-08-01 14.02 980
Chippewa River near Watson [05305000]
Lat 45o01’18”, long 95o 47’25 ”, in NE1/4 NW
1/4 sec. 22, T.118 N., R.41 W., Chippewa County, Hydrologic Unit 07020005, 150 feet downstream from Chippewa County Road 13 bridge and dam, one mile north of Watson, 5.5 miles northwest of Montevideo, and 12.1 miles above confluence with Minnesota River in Montevideo [Drainage area: 2,050 mi2].
1910-17, 1931-36, 2001-
current year
06-26-02 38.83 627 04-11-01 45.41 4,600
Station Name and[Station Number]
Location and[Drainage area]
Periodof
Record
Water year 2002 Maximum Period of Record Maximum
DateGage
height(feet)
Discharge(ft3/s)
DateGage
height(feet)
Discharg(ft3/s)

DISCHARGE AT HIGH-FLOW PARTIAL-RECORD STATIONS--Continued
Annual maximum discharge at high-flow sites during water year 2002--Continued
281
e
South Branch Yel-low Medicine River nearMinneota[05311400]
Lat 44o33’50”, long 95o59’50”, in SE1/4SE
1/4, sec. 26, T.113 N., R.43 W., Lyon County, Hydrologic Unit 07020004, at bridge on State Highway 68, on northwest edge of Minneota and 6 miles upstream from mouth[Drainage area: 115 mi2].
1960-81#, 1981-87, 1998-
current year
06-09-9907-11-0004-02-02
7.336.526.98
h384h274334
04-18-69 13.41 4,430
Ramsey Creek near Redwood Falls[05316538]
Lat 44°33’08”, long 95°10’38”, in SE1/4NE
1/4 sec. 33, T.113 N., R.36 W., Redwood County, Hydrologic Unit 07020006 at bridge on township road 2.3 miles northeast of KLGR radio towers, on west side of Redwood Falls [Drainage area: 629 mi2].
1991-93, 1995 - current year
06-21-02 21.93 406 06-17-93 25.94 920
Beaver Creek atBeaver Falls[05316570]
Lat 44°35’03”, long 95°02’49”, in NE1/4NW
1/4 sec. 22, T.113 N., R.35 W., Renville County, Hydrologic Unit 07020004, at bridge on County High-way 2 in Beaver Falls, 2.2 miles upstream from mouth, 3.8 miles northwest of Morton[Drainage area: 191 mi2].
1972- current year
03-29-02 a9.21 361 04-02-97 14.73 3,300
Cottonwood River near Springfield[05316950]
Lat 44°12’12”, long 95°02’53”, in SW1/4 NW
1/4 sec. 34, T.109 N., R.35 W., Brown County, Hydrologic Unit 07020008, at bridge on County High-way 2, 1.3 miles downstream from Mound Creek, 1.0 mile upstream from Coal Mine Creek, 3.5 miles southwest of Springfield[Drainage area: 777 mi2].
1973- current year
06-04-02 18.14 1,400 06-18-93 31.40 14,500
Minnesota River Tributary at St. Hwy. 68 near Judson [05317330]
Lat 44o11’40”, long 94o12’27’, in NW1/4 NW
1/4 sec. 4, T.108 N., R.28 W., Blue Earth County, Hydrologic Unit 07020007, at culvert on State High-way 68, 0.5 mile southwest of Jud-son, 0.4 mile above mouth [Drainage area: 0.97 mi2].
2001- current year
06-22-02 8.84 -- 06-22-02 8.84 --
East Branch Blue Earth River near Walters[05317845]
Lat 43°37’58”, long 93°42’28”, in SE1/4SE
1/4 sec. 16, T.102 N., R.24 W., Faribault County, Hydrologic Unit 07020009, at culvert on State Highway 22, 2.5 miles northwest of Walters [Drainage area: 30.2 mi2].
1979- current year
07-21-02 17.68 622 08-15-93 18.73 657
Elm Creek at Co. Rd. 103 nearTrimont[05318195]
Lat 43°45’27”, long 94°50’30”, in NW1/4NW
1/4 sec. 5, T.103 N., R.33 W., Martin County, Hydrologic Unit 07020009, at bridge on County Road 103, 12.5 miles northeast of Jack-son, 5 miles west of Trimont.
1991- current year
04-02-02 i <371 06-04-91 22.92 2,000
Watonwan River near Delft[05318300]
Lat 43°59’55”, long 95°07’11”, in NE1/4SE
1/4 sec. 11, T.106 N. R.36 W., Cottonwood County, Hydrologic Unit 07020010, at culvert on U.S. Highway 71, 1.7 miles northwest of Delft[Drainage area: 13.5 mi2].
1960- current year
06-04-02 14.76 37 06-18-93 j17.70 1,000
South Fork Waton-wan River near Ormsby[05318897]
Lat 43°53’08”, long 94°41’27”, in SE1/4NW
1/4 sec.21, T.105 N., R.32 W., Watonwan County, Hydrologic Unit 07020010, at bridge on township road, 2.6 miles north of Ormsby, 5.0 miles upstream from Willow Creek[Drainage area: 107 mi2].
1979- current year
04-02-02 i <136 05-31-80 18.40 1,920
Station Name and[Station Number]
Location and[Drainage area]
Periodof
Record
Water year 2002 Maximum Period of Record Maximum
DateGage
height(feet)
Discharge(ft3/s)
DateGage
height(feet)
Discharg(ft3/s)

DISCHARGE AT HIGH-FLOW PARTIAL-RECORD STATIONS--Continued
Annual maximum discharge at high-flow sites during water year 2002--Continued
282
ge )
Maple River near Rapidan[05320480]
Lat 44°03’54”, long 94°01’32”, in SW1/4SW
1/4 sec. 13, T.107 N., R.27 W., Blue Earth County, Hydrologic Unit 07020011, at bridge on County High-way 35, 3.0 miles southeast of Rapi-dan, 3.3 miles upstream from mouth [Drainage area: 338 mi2].
1972- current year
06-15-02 9.61 1,410 04-12-01 13.79 5,540
Minnesota River Trib. below St. Peter [05325450]
Lat 44o20’13”, long 93o54’45”, in NE1/4NE
1/4 sec. 14, T.110 N., R.26 W., Le Sueur County, Hydrologic Unit 07020007, at culvert on County State Aid Highway 23, 1.8 miles east of St. Peter [Drainage area: 2.13 mi2].
2001- current year
06-22-02 6.82 -- 02-25-01 a7.20 --
Sand Creek near New Prague[05330300]
Lat 44°32’37”, long 93°32’16”, in NE1/4NW
1/4 sec. 1, T.112 N., R.23 W., Le Sueur County, Hydrologic Unit 07020012, at culvert on State High-way 13 and 19, 1.9 miles east of New Prague [Drainage area: 62.2 mi2].
1960- current year
06-22-02 10.20 206 05-21-60 14.84 1,100
Crooked Creek near Hinckley[05335170]
Lat 46°00’42”, long 92°31’45”, in NE1/4NE
1/4 sec. 30, T.41 N., R.17 W., Pine County, Hydrologic Unit 07030001, at culvert on State High-way 48, 2.7 miles upstream from mouth, 8 miles south of Duxbury, 19 miles east of Hinckley[Drainage area: 94.4 mi2].
1966-70†,74†, 76†, 79-
80†, 1986-
current year
04-11-02 d14.05 918 04-23-01 16.65 2,100
Glaisby Brook near Kettle River[05336200]
Lat 46o27’19”, long 92o51’34”, inSE1/4NW
1/4 sec. 22, T.46 N., R.20 W., Carlton County, Hydrologic Unit 07030003, at bridge on State High-ways 27 and 73, 1.0 mile upstream from mouth, 2.4 miles south of Ket-tle River [Drainage area: 27.0 mi2].
1960-70#, 1971-
current year
04-12-02 a5.24 254 07-22-72 10.18 1,370
Goose Creek at Harris[05339747]
Lat 45o35’11”, long 92o58’39”, in SW1/4SW
1/4 sec. 21, T.36 N., R.21 W., Chisago County, Hydrologic Unit 07030005, at culverts on County Highway 9, 0.15 mile west of County Highway 30 in Harris, 8 miles above mouth [Drainage area: 47.3 mi2].
1986- current year
04-15-02 d6.21 197 04-23-01 8.11 360
Cannon River below Sabre Lake near Kilkenny[05348550]
Lat 44o17’50”, long 93o37’44”, in NE1/4NE
1/4 sec. 31, T.110 N., R.23 W., Le Sueur County, Hydrologic Unit 07040002, at bridge on township road, 0.25 mile downstream of Sabre Lake, 3 miles southeast of Kilkenny [Drainage area: 87.9 mi2].
1985- current year
06-21-02 12.10 202 04-12-01 13.83 563
Cannon River at Northfield[05355024]
Lat 44o27’19”, long 93o09’46”, in NE1/4NE
1/4 sec. 1, T.111 N., R.20 W., Rice County, Hydrologic Unit 07040002, at Fifth Street bridge in Northfield [Drainage area: 929 mi2].
1980- current year
06-21-02 903.20 3,110 04-12-01 905.40 8,370
Milliken Creek near Concord[05373080]
Lat 44o07’13”, long 92o49’08”, in NW1/4NW
1/4 sec. 36, T.108 N., R.17 W., Dodge County, Hydrologic Unit 07040004, at bridge on County Road 9, 8.0 miles upstream from mouth, 2.1 miles southeast of Concord [Drainage area: 22.1 mi2].
1979- current year
08-21-02 12.01 263 06-13-01 15.80 3,470
Station Name and[Station Number]
Location and[Drainage area]
Periodof
Record
Water year 2002 Maximum Period of Record Maximum
DateGage
height(feet)
Discharge(ft3/s)
DateGage
height(feet)
Dischar(ft3/s
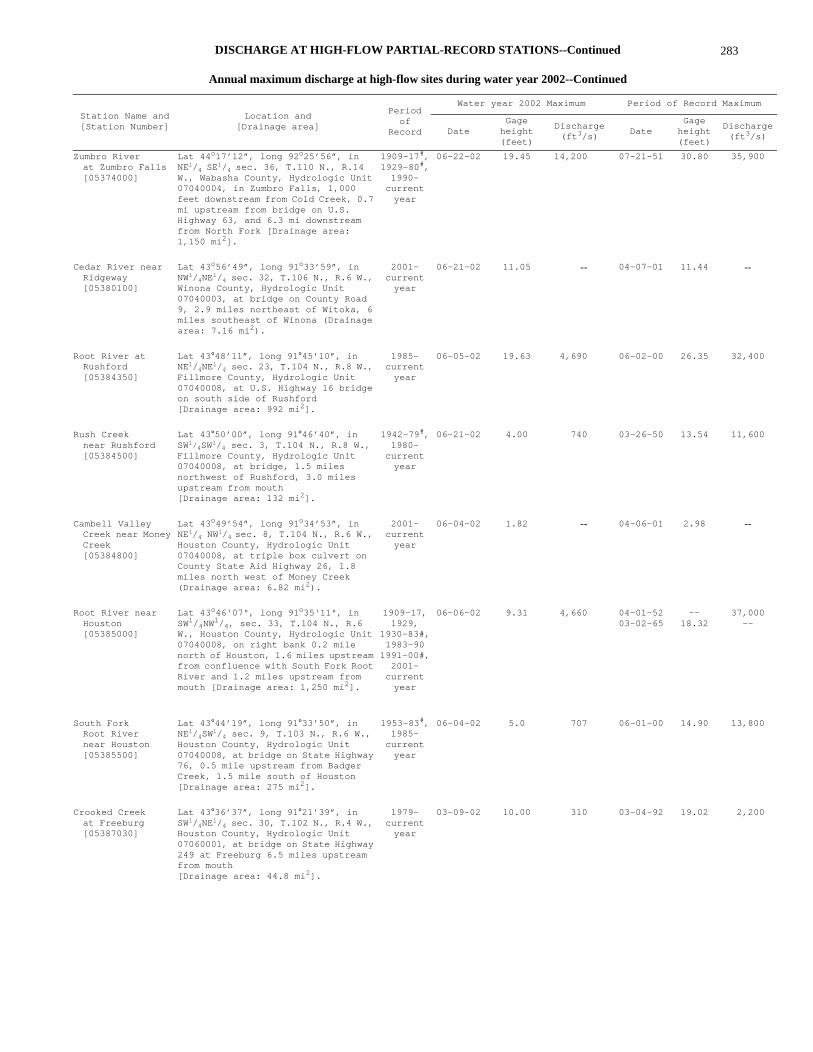
DISCHARGE AT HIGH-FLOW PARTIAL-RECORD STATIONS--Continued
Annual maximum discharge at high-flow sites during water year 2002--Continued
283
e
Zumbro River at Zumbro Falls[05374000]
Lat 44o17’12”, long 92o25’56”, in NE1/4 SE
1/4 sec. 36, T.110 N., R.14 W., Wabasha County, Hydrologic Unit 07040004, in Zumbro Falls, 1,000 feet downstream from Cold Creek, 0.7 mi upstream from bridge on U.S. Highway 63, and 6.3 mi downstream from North Fork [Drainage area: 1,150 mi2].
1909-17#, 1929-80#, 1990-
current year
06-22-02 19.45 14,200 07-21-51 30.80 35,900
Cedar River near Ridgeway [05380100]
Lat 43o56’49”, long 91o33’59”, in NW1/4NE
1/4 sec. 32, T.106 N., R.6 W., Winona County, Hydrologic Unit 07040003, at bridge on County Road 9, 2.9 miles northeast of Witoka, 6 miles southeast of Winona (Drainage area: 7.16 mi2).
2001- current year
06-21-02 11.05 -- 04-07-01 11.44 --
Root River at Rushford[05384350]
Lat 43°48’11”, long 91°45’10”, in NE1/4NE
1/4 sec. 23, T.104 N., R.8 W., Fillmore County, Hydrologic Unit 07040008, at U.S. Highway 16 bridge on south side of Rushford[Drainage area: 992 mi2].
1985- current year
06-05-02 19.63 4,690 06-02-00 26.35 32,400
Rush Creek near Rushford[05384500]
Lat 43°50’00”, long 91°46’40”, in SW1/4SW
1/4 sec. 3, T.104 N., R.8 W.,Fillmore County, Hydrologic Unit 07040008, at bridge, 1.5 miles northwest of Rushford, 3.0 miles upstream from mouth[Drainage area: 132 mi2].
1942-79#, 1980-
current year
06-21-02 4.00 740 03-26-50 13.54 11,600
Cambell Valley Creek near Money Creek [05384800]
Lat 43o49’54”, long 91o34’53”, in NE1/4 NW
1/4 sec. 8, T.104 N., R.6 W., Houston County, Hydrologic Unit 07040008, at triple box culvert on County State Aid Highway 26, 1.8 miles north west of Money Creek (Drainage area: 6.82 mi2).
2001- current year
06-04-02 1.82 -- 04-06-01 2.98 --
Root River near Houston [05385000]
Lat 43o46'07", long 91o35'11", in SW1/4NW
1/4, sec. 33, T.104 N., R.6 W., Houston County, Hydrologic Unit 07040008, on right bank 0.2 mile north of Houston, 1.6 miles upstream from confluence with South Fork Root River and 1.2 miles upstream from mouth [Drainage area: 1,250 mi2].
1909-17, 1929,
1930-83#,1983-90
1991-00#,2001-
current year
06-06-02 9.31 4,660 04-01-52 03-02-65
-- 18.32
37,000--
South Fork Root River near Houston [05385500]
Lat 43°44’19”, long 91°33’50”, in NE1/4SW
1/4 sec. 9, T.103 N., R.6 W., Houston County, Hydrologic Unit 07040008, at bridge on State Highway 76, 0.5 mile upstream from Badger Creek, 1.5 mile south of Houston [Drainage area: 275 mi2].
1953-83#, 1985-
current year
06-04-02 5.0 707 06-01-00 14.90 13,800
Crooked Creek at Freeburg[05387030]
Lat 43°36’37”, long 91°21’39”, in SW1/4NE
1/4 sec. 30, T.102 N., R.4 W., Houston County, Hydrologic Unit 07060001, at bridge on State Highway 249 at Freeburg 6.5 miles upstream from mouth [Drainage area: 44.8 mi2].
1979- current year
03-09-02 10.00 310 03-04-92 19.02 2,200
Station Name and[Station Number]
Location and[Drainage area]
Periodof
Record
Water year 2002 Maximum Period of Record Maximum
DateGage
height(feet)
Discharge(ft3/s)
DateGage
height(feet)
Discharg(ft3/s)

DISCHARGE AT HIGH-FLOW PARTIAL-RECORD STATIONS--Continued
Annual maximum discharge at high-flow sites during water year 2002--Continued
284
ge )
Little Cedar River near Johnsburg[05457778]
Lat 43°30’52”, long 92°45’19”, in NW1/4NE
1/4 sec. 33, T.101 N., R.16 W., Mower County, Hydrologic Unit 07080201, at bridge on County Road 6, 1 mile northeast of Johnsburg, 1 mile north of Minnesota-Iowa border [Drainage area: 45.8 mi2].
1986- current year
06-04-02 10.96 362 08-16-93 17.58 9,280
Bancroft Creek at Bancroft[05458960]
Lat 43°42’09”, long 93°21’23”, in SW1/4SE
1/4 sec. 21, T.103 N., R.21 W., Freeborn County, Hydrologic Unit 07080202, at bridge on County Road 14, 1.6 miles northeast of Fountain Lake, 1 mile north of Interstate 90 [Drainage area: 28.7 mi2].
1985†, 1986-
current year
07-11-02 4.40 126 06-14-01 8.81 1,070
Elk Creek near Brewster[05474900]
Lat 43o40’43”, long 95o27’10”, in NE1/4SE
1/4 sec. 36, T.102 N., R.39 W., Nobles County, Hydrologic Unit 07100001, at bridge on County High-way 1, 0.7 miles south of Brewster.
1996- current year
08-21-02 20.26 611 05-30-01 25.29 4,000
East Fork Des Moines River near Ceylon[05476989]
Lat 43°33’53”, long 94°39’15”, in NW1/4SW
1/4 sec. 11, T.101 N., R.32 W., Martin County, Hydrologic Unit 07010003, at bridge on County Road 23, 2.4 miles northwest of Ceylon[Drainage area: 128 mi2].
1986- current year
08-22-02 16.28 305 07-05-93 21.65 1,350
North Branch Pipe-stone Creek near Pipestone[06482500]
Lat 44°04’54”, long 96°18’27”, in SE1/4SE
1/4 sec. 12, T.107 N., R.46 W., Pipestone County, Hydrologic Unit 10170203, at bridge on U.S. Highway 75, 5.5 miles north of Pipe-stone. Formerly “Pipestone Creek near Pipestone” [Drainage area: 31.5 mi2].
1991- current year
03-28-02 a17.78 362 05-08-93 20.28 2,650
Beaver Creek at Valley Springs, South Dakota[06482745]
Lat 43°35’10”, long 96°28’20”, in NW1/4NW
1/4 sec. 3, T.101 N., R.47 W., Minnehaha County, South Dakota, Hydrologic Unit 10170203, at bridge on County Road 103 (Valley Drive), 1 mile west of South Dakota-Minnesota border, 2.5 miles south of Inter-state 90 [Drainage area: 104 mi2].
1986- current year
08-21-02 15.56 206 06-13-94 24.89 2,280
Rock River Trib. at Co. Hwy. 18 near Hatfield [06482910]
Lat 43o56’38”, long 96o06’13”, in SW1/4NW
1/4 sec. 35, T.106 N., R.44 W., Pipestone County, Hydrologic Unit 10170204, at culvert on County State Aid Highway 18, 1.5 miles upstream of mouth, 4 miles east of Hatfield, 5 miles north of Edgerton[Drainage area: 3.28 mi2].
2001- current year
03-28-02 a6.48 105 06-26-01 6.16 186
Chanarambi Creek near Edgerton[06482933]
Lat 43°53’59”, long 96°03’39”, in NW1/4SW
1/4 sec. 18, T.105 N., R.43 W., Murray County, Hydrologic Unit 10170204, at bridge on township road, 3.8 miles northeast of Edger-ton, 7.4 miles upstream from mouth [Drainage area: 57.3 mi2].
1979- current year
03-28-02 a12.91 260 04-23-01 05-03-01
16.79 18.14
928850
Champepadan Creek at Co. Rd. 18 near Leota[06482970]
Lat 43o47’24”, long 96o00’40”, in NW1/4NW
1/4 sec. 28, T.104 N., R. 43 W., Nobles County, Hydrologic Unit 10170204, at bridge on County Road 18, near junction with County Road 19, 3 miles south of Leota [Drainage area: --].
1996- current year
03-28-02 a13.28 205 04-23-01 17.54 895
Station Name and[Station Number]
Location and[Drainage area]
Periodof
Record
Water year 2002 Maximum Period of Record Maximum
DateGage
height(feet)
Discharge(ft3/s)
DateGage
height(feet)
Dischar(ft3/s

DISCHARGE AT HIGH-FLOW PARTIAL-RECORD STATIONS--Continued
Annual maximum discharge at high-flow sites during water year 2002--Continued
285
e
Rock River atLuverne[06483000]
Lat 43o39’15”, long 96o12’03”, in SW1/4 NE
1/4 sec. 11, T.102 N., R45 W., Rock County, Hydrologic Unit 10170204, at bridge on Main Street (County Highway 4) in Luverne[Drainage area: 419 mi2].
1911-14#, 1968-69, 1971-
current year
08-22-02 d4.55 542 05-08-93 14.23 35,400
Elk Creek near Lismore[06483020]
Lat 43o41’38”, long 96o00’46”, in NE1/4SE
1/4 sec. 29, T.103 N., R. 43 W., Nobles County, Hydrologic Unit 10170204, at bridge on County Road 19, 4.6 miles southwest of Lismore [Drainage area: 4.62 mi2].
1996- current year
08-21-02 14.02 -- 06-14-01 15.62 --
Little Rock River near Rushmore[06483350]
Lat 43°32’36”, long 95°48’58”, in NE1/4NE
1/4 sec. 24, T.101 N., R.42 W., Nobles County, Hydrologic Unit 10170204, at bridge #4967, on County Road 6, 1.5 miles west of Ransom, 5.1 miles south of Rushmore [Drainage area: 45.8 mi2].
1991- current year
08-21-02 23.04 134 07-11-93 27.04 4,290
Little Rock Creek near Rushmore[06483353]
Lat 43o32’37”, long 95o50’50”, in NE1/4NW
1/4 sec. 23, T.101 N., R.42 W., Nobles County, Hydrologic Unit 10170204, at bridge on County Road 6, 5.5 miles southwest of Rushmore [Drainage area: 32.1 mi2].
1996- current year
06-22-9604-06-9708-21-02
25.9424.6021.70
h1,810h984149
05-30-01 27.99 3,070
Little Sioux River near Spafford[06603530]
Lat 43°36’08”, long 95°15’27”, in NE1/4NE
1/4 sec. 34, T.102 N., R.37 W., Jackson County, Hydrologic Unit 10230003, at bridge on county high-way, 1.6 miles downstream from Jack-son County ditch No. 11, 5.8 miles east of Spafford[Drainage area: 40.5 mi2].
1962- current year
08-21-02 8.44 168 06-29-69 12.06 4,500
# Operated as a continuous-record gaging station.
c From high water mark. g Site discontinued not available.
† Operated as a low flow site. d Not annual maximum. h Revised.
a Backwater from ice. e Backwater from Lake Traverse. i Did not reach bottom of gage.
b Estimated. f Peak flow determined from indirect measurement.
j Stage from downstream gage.
Station Name and[Station Number]
Location and[Drainage area]
Periodof
Record
Water year 2002 Maximum Period of Record Maximum
DateGage
height(feet)
Discharge(ft3/s)
DateGage
height(feet)
Discharg(ft3/s)

286

DISCHARGE AT MISCELLANEOUS SITES--Continued 287
Discharge at Miscellaneous Sites

DISCHARGE AT MISCELLANEOUS SITES288
Discharge measurements made at miscellaneous sites during the 2002 water year are listed in the following table. Those measurements of base flow are designated by an asterisk (*) and measurements from earlier water years but not previously published by an (a). Stations previously published as Continuous Record Sites are designated by an (#), those sites published as High-Flow Partial-Record sitesare designated by an (+); estimated values designated by an(a).
Stream Name and
[Station No.]
Tributary to LocationDrainage
area(mi2)
Measuredpreviously
(wateryears)
Measurements
DateDischarge(ft3/s)
Lake Superior Basin
Brule River near Hovland(04011000)
Lake Superior Lat 47°49’06”, long 90°03’04” in SE1/4 SW1/4 sec. 27, T.62 N., R.3 E., Cook County, Hydrologic Unit 04010101, at bridge on U.S. High-way 61, 0.3 mile upstream from mouth, 4.5 miles southwest of Hovland.
a264 1912,1970-71 1974, 1976,1986
04-16-0204-22-02
568570
Popular River near Lutsen (04012500)
Lake Superior Lat 47°38’29”, long 90°42’36” in SW1/4 NE1/4 sec. 33, T.60 N., R.3 W., Cook County, Hydrologic Unit 04010101, at golf course 500 feet upstream from U.S. Hwy 61, 2 miles southwest of Lutsen (within 300 feet of old gage).
112 #1912-17,#1930-47,#1953-61,+1976-87,
2001
11-29-0104-16-0204-22-02
160295144
Sucker Creek near Palmers(04015339)
Lake Superior Lat 46°55’57”, long 91°51’29”, in NW1/4 SE1/4 sec. 4, T.5 N., R.12 W., St. Louis County, Hydrologic Unit 04010102, at culvert on County Road 290, 1 mile northwest of Palmers, 0.4 mile above U.S. Highway 61 and 0.7 mile above site 04015340.
-- 2001 04-13-0204-15-0206-24-02
247325369
Talmadge River at Co. Rd. 281 near Duluth (04015368)
Lake Superior Lat 46°53’55”, long 91°56’30”, in SE1/4 SE1/4 sec. 14, T.51 N., R.13 W., St. Louis County, Hydro-logic Unit 04010102, at bridge on County Road 281, 1.1 miles above site 04015370, 1.3 miles north-west of Clifton.
-- 2001 04-13-0206-24-0207-08-02
63.846.7
179
Amity Creek at Duluth (04015387)
Lake Superior Lat 46°50’39”, long 92°00’36”, in SE1/4 NE1/4 sec. 5, T.50 N., R.13 W., St. Louis County, Hydrologic Unit 04010102, at bridge on Park-way Road, 0.4 mile upstream from Lester River, 6 miles northeast of aerial bridge in Duluth.
16.2 1970-71,1974,1976,1980,1983,1986
04-11-0204-12-0206-24-0207-08-02
260113184302
Red River of the North Basin
Otter Tail River below Fergus Falls(05045900)
Red River of the North
Lat 46°16’32”, long 96°08’03”, in SE1/4 NW1/4 sec. 6, T.132 N., R.43 W., Otter Tail County, Hydrologic Unit 09020103, at cul-verts on road, one mile south and 2.5 miles east of Fergus Falls.
-- 2001 10-11-0111-08-0112-13-0102-14-0204-17-0205-16-0206-03-0206-26-0207-11-0207-22-0208-05-0208-19-0209-12-0209-25-02
*264*348*507*441738874700484851693656
*463622
*399
Otter Tail River near Everdell (05046270)
Red River of the North
Lat 46°13’00”, long 96°24’31”, in SE1/4 NE1/4 sec. 26, T.132 N., R.46 W., Wilkin County, Hydro-logic Unit 09020103, at bridge on county road, 8.7 miles east and 4.5 miles south of Breckenridge.
-- 2001 10-10-0111-07-0112-12-0101-16-0203-20-0204-17-0205-15-0206-05-0206-26-0207-10-0207-24-0208-07-0208-21-0209-11-0209-25-02
*384*440*577*481560768932742677
1,340706605707690
*447

DISCHARGE AT MISCELLANEOUS SITES--Continued 289
Red River of the North (continued)
Otter Tail River above Breckenridge(05046450)
Red River of the North
Lat 46°15’42”, long 96°32’45”, in SE1/4 NW1/4 sec. 11, T.132 N., R.47 W., Wilkin County, Hydro-logic Unit 09020103, at bridge on county road, 2 miles east of Breckenridge.
-- 2001 10-10-0111-07-0112-12-0102-12-0203-20-0204-17-0205-15-0206-05-0206-26-0207-10-0207-24-0208-07-0208-20-0209-11-0209-24-02
*468*411*545*488*525729910751569
1,190677604
*510667
*544
Otter Tail River on 11th St. in Breckenridge(05046502)
Red River of the North
Lat 46°16’28”, long 96°34’47”, in NE1/4 SE1/4 sec. 4, T.132 N., R.47 W., Wilkin County, Hydro-logic Unit 09020103, at bridge on 11th St., in Breckenridge.
-- 2001 10-10-0111-07-0101-16-0202-13-0203-20-0204-17-0205-15-0206-05-0206-26-0207-10-0207-24-0208-07-0208-21-0209-11-0209-25-02
533608573540607837
1,000793829
1,220754636694812477
Mustinka River below Norcross (05047010)
Red River of the North
Lat 45°53’15”, long 96°12’48”, in NE1/4 NE1/4 sec. 20, T.128 N., R.45 W., Grant County, Hydrologic Unit 09020102, at bridge on County Highway 9, 1.3 miles northwest of Norcross.
-- 1943-44,1950,2001
10-09-0111-05-0112-11-0101-15-0202-12-0203-19-0204-16-0205-14-0206-04-0206-25-0207-09-0207-23-0208-06-0208-20-0209-10-0209-24-02
*6.54*12.3*17.5*12.5*9.60
*14.037.795.625.1*7.13
22820563.230.614.5*4.41
Mustinka River above Wheaton (05049000)
Red River of the North
Lat 45°49’15”, long 96°29’25”, in SW1/4 SW1/4 sec. 8, T.127 N., R.46 W., Traverse County, Hydro-logic Unit 09020102, at bridge on U.S. Highway 75, 1 mile upstream from Chicago, Milwaukee and St. Paul Railroad bridge, 0.5 mile north of Wheaton, about 8 miles above Lake Traverse.
810 1915-24#1930-58#+1985-current year
2-12-023-19-02
*5.82*29.2
Rabbit River near Nashua (05050700)
Red River of the North
Lat 46°04’30”, long 96°18’24”, in SE1/4 NE1/4 sec. 15, T.130 N., R.45 W., Wilkin County, Hydro-logic Unit 09020101, at bridge on county road, 4.7 miles east and 2.3 miles south of Campbell.
99.2 +1979-current year
11-06-0112-11-0101-15-0202-12-0204-16-0205-14-0206-04-0207-09-0207-23-0208-06-0208-20-0209-12-02
*1.49*2.48*1.27*1.0117.830.8*3.4186.635.111.66.16
*1.78
Stream Name and
[Station No.]
Tributary to LocationDrainage
area(mi2)
Measuredpreviously
(wateryears)
Measurements
DateDischarge(ft3/s)

DISCHARGE AT MISCELLANEOUS SITES--Continued290
Red River of the North (continued)
Rabbit River at Campbell (05051000)
Red River of the North
Lat 46°05’40”, long 96°24’37”, in SE1/4 SE1/4 sec. 2, T.130 N., R.46 W., Wilkin County, Hydro-logic Unit 09020101, at bridge on County Road 4, at west edge of Campbell.
266 1942, 1952,
1964-65, 1970, 1998, 2001
04-16-0205-14-0206-04-0207-09-0207-23-0208-06-02
24.251.1*2.63
17038.1*9.43
Rabbit River near Camp-bell (05051200)
Red River of the North
Lat 46°06’43”, long 96°29’32”, in SE1/4 SE1/4 sec. 31, T.130 N., R.46 W., Wilkin County, Hydro-logic Unit 09020101, at bridge on US Highway 75, 4 miles west, and 1.2 miles north of Campbell.
-- 2001 11-06-0112-11-0101-16-0202-13-0203-19-0204-16-0205-14-0206-04-0207-10-0207-23-0208-06-0208-20-02
*7.68*3.02*2.02*0.90*6.0135.281.0*4.05
64860.716.4*1.27
Whiskey Creek below Brushvale (05051515)
Red River of the North
Lat 46°23’55”, long 96°39’08”, in SW1/4 SW1/4 sec. 19, T.134 N., R.47 W., Wilkin County, Hydro-logic Unit 09020104, at culverts on road, 2.7 miles south and 0.4 mile east of Kent.
-- 2001 04-15-0205-13-02
3.533.76
Whiskey Creek near Kent (05051520)
Red River of the North
Lat 46°24’48”, long 96°39’30”, in SE1/4 SE1/4 sec. 13, T.134 N., R.48 W., Wilkin County, Hydro-logic Unit 09020104, at culverts on County Road 20, 1.6 miles south and 1.5 miles east of Kent.
80.0 1964-66,1970-74,1976,1988,2001
11-06-0112-10-0101-14-0203-18-0204-15-0205-13-0206-24-0207-03-0207-22-0209-09-0209-23-02
4.400.300.172.11
12.08.440.235.302.131.10
a0.04
Whiskey Creek at Kent (05051521)
Red River of the North
Lat 46°26’21”, long 96°40’43”, in NE1/4 NE1/4 sec. 11, T.134 N., R.48 W., Wilkin County, Hydro-logic Unit 09020104, at bridge on upstream left bank of US Highway 75, on northeast side of Kent.
-- 2001 11-06-0112-10-0101-14-0202-11-0203-18-0204-15-0205-13-0206-03-0206-24-0207-08-0207-22-0208-05-0208-29-0209-09-0209-23-02
12.7*4.02*3.92*4.89*0.9533.048.4*4.828.21
57.69.18
*2.70*1.11*3.26*3.78
Judicial Ditch 64 near Mentor (05078470)
Badger Creek Lat 47°44’16”, long 96°12’09”, in SE1/4 NE1/4 sec. 7, T.149 N., R.43 W., Polk County, Hydrologic Unit 09020303, at culverts on township road, 0.5 mile north of U.S. Highway 2, 4.2 miles north-west of Mentor.
-- -- 06-25-0208-06-0208-29-0209-05-02
19.0*0.228.49
20.8
Cyr Creek near Mar-coux Corners(05078520)
Red Lake River Lat 47°48’13”, long 96°16’36”, in NW1/4 NE1/4 sec. 22, T.150 N., R.44 W., Red Lake County, Hydro-logic Unit 09020303, at culvert on County State Aid Highway 14, 0.5 mile west of State Highway 32, 3.0 miles north of Marcoux Corners.
-- -- 06-25-0208-06-0208-29-0208-29-0209-05-02
17.9*0.14
10810716.0
Stream Name and
[Station No.]
Tributary to LocationDrainage
area(mi2)
Measuredpreviously
(wateryears)
Measurements
DateDischarge(ft3/s)

DISCHARGE AT MISCELLANEOUS SITES--Continued 291
Red River of the North (continued)
County Ditch 140 near Benoit (05078730)
Gentilly River Lat 47°41’15”, long 96°22’22”, in NW1/4 NW1/4 sec. 36, T.149 N., R.45 W., Polk County, Hydrologic Unit 09020303, at culvert on field access road, 1.0 mile south of County State Aid Highway 45, 1.4 miles southeast of Benoit.
-- -- 06-25-0208-06-0208-29-0208-30-02
16.6*0.67*4.8222.2
Unnamed Ditch near Benoit
Gentilly River Lat 47°43’52”, long 96°22’22”, in NW1/4 NW1/4 sec. 13, T.149 N., R.45 W., Polk County, Hydrologic Unit 09020303, at culvert on township road, 1.0 mile east of County State Aid Highway 44, 2.3 miles northeast of Benoit.
-- -- 06-25-02 10.8
Judicial Ditch 66, near MarcouxCorners(05078770)
Kripple Creek Lat 47°46’36”, long 96°19’31”, in SW1/4 NW1/4 sec. 29, T.150 N., R.44 W., Red Lake County, Hydro-logic Unit 09020303, at culvert on Township Road, 1.5 miles north of U.S. Highway 2, 3.4 miles northwest of Marcoux Corners.
-- -- 08-29-0209-06-02
32.423.8
Judicial Ditch 66 on State Hwy 2 near Mar-coux Corners
Kripple Creek Lat 47°45’38”, long 96°18’45”, in SE1/4 SE1/4 sec. 32, T.150 N., R.44 W., Red Lake County, Hydro-logic Unit 09020303, at culvert on State Highway 2, 2.1 miles west of Marcoux Corners.
-- -- 06-25-0208-06-02
20.4*1.35
County Ditch 72 (Burnham Creek) near Maple Bay (05079200)
County Ditch 11 Lat 47°38’19”, long 96°16’48”, in SE1/4 NE1/4 sec. 17, T.148 N., R.44 W., Polk County, Hydrologic Unit 09020303, at culvert on State Highway 32, 2.4 miles west of Maple Bay.
-- -- 06-25-0208-05-0208-28-0209-05-02
5.25*0.574.57
23.0
County Ditch 65 near Maple Bay (05079250)
County Ditch 72 Lat 47°36’43”, long 96°16’45”, in SE1/4 NE1/4 sec. 29, T.148 N., R.44 W., Polk County, Hydrologic Unit 09020303, at culvert on State Highway 32, 3.0 miles southwest of Maple Bay.
-- -- 06-25-0208-05-0208-28-0209-04-02
11.4*0.092.31
30.7
Mississippi River Basin
Mississippi River at Franklin Ave. in Min-neapolis (05288930)
Gulf of Mexico Lat 44°57’49”, long 93°13’22”, in SE1/4 SW1/4 sec. 24, T.29 N., R.24 W., Hennepin County, Hydro-logic Unit 07010206, at Franklin Ave. Bridge, at river mile 853.2 above mouth of Ohio River, in Minneapolis.
-- 1976-821984-861990-931995-97
1999-2000
10-18-02 15,800
Minnesota River Basin
Lake Chris-tina out-let near Ashby (05293255)
Pomme de Terre River
Lat 46°04’18”, long 95°46’15”, in SE1/4 NE1/4 sec. 13, T.130 N. R.41 W., Grant County, Hydrologic Unit 07020002, at downstream side of fish gate at Lake Christina outlet, 2.4 miles southeast of Ashby.
-- -- 08-19-02 21.8
Pelican Lake near Ashby (05293280)
Pomme de Terre River
Lat 46°04’27”, long 95°48’59”, in SW1/4 NE1/4 sec. 15, T.130 N., R.41 W., Grant County, Hydrologic Unit 07020002, at culvert under County Road 10, 0.9 mile south of Ashby.
-- -- 08-19-02 17.8
Stream Name and
[Station No.]
Tributary to LocationDrainage
area(mi2)
Measuredpreviously
(wateryears)
Measurements
DateDischarge(ft3/s)

DISCHARGE AT MISCELLANEOUS SITES--Continued292
Minnesota River Basin (continued)
Chippewa River diversion at Watson Sag Wier (05304980)
Chippewa River Lat 45°01’30”, long 95°47’49”,in SE 1/4 sec. 16, T.118 N., R.41 W., Chippewa County, Hydrologic Unit 07020001, at bridge on county road, 1 mile north of Watson.
-- 1945-90,1991,2001
04-11-0110-11-0104-11-02
8,56087.7
472
North Branch Rush River at Sibley County Rd. 9, near New Rome (05326090)
Rush Creek Lat 44°30’48”, long 94°05’26”, in NE1/4 NE1/4 sec. 17, T.112 N. R.27 W., Sibley County, Hydro-logic Unit 07020012, at bridge on County Road 9, 6 miles south of Arlington, 2 miles south of New Rome.
-- -- 07-11-02 31.1
Middle Branch Rush River at Co. Rd. 13 near New Swe-den (05326105)
Rush River Lat 44°28’32”, long 94°09’00”, in NW1/4 SW1/4 sec. 25, T.112 N. R.28 W., Sibley County, Hydro-logic Unit 07020012, at bridge on County Road 13, 5 miles northeast of New Sweden.
-- -- 08-01-02 12.9
South Branch Rush River at Co. Rd. 9, near Norseland (05326190)
Rush River Lat 44°28’04”, long 94°07’12”, in NE1/4 NW1/4 sec. 31, T.112 N. R.27 W., Sibley County, Hydro-logic Unit 07020012, at bridge on County Road 9, 3.7 miles north of Norseland.
-- -- 07-09-02 15.8
Judicial Ditch 1A near Norseland (05326205)
South Branch Rush River
Lat 44°26’36”, long 94°07’12”, in SE1/4 SW1/4 sec. 6, T.111 N. R.27 W., Nicollet County, Hydrologic Unit 07020012, at bridge on County Road 3, 2.2 miles north of Norseland.
-- -- 07-11-02 23.4
Rush River near Hend-erson (05326400)
Minnesota River Lat 44°29’57”, long 93°54’18”, in NW1/4 NW1/4 sec. 24, T.112 N. R.26 W., Sibley County, Hydro-logic Unit 07020012, at bridge on State Highway 93, 0.4 mile upstream from mouth, and 2.0 miles south of Henderson.
397 1970-71,1976,
1979-80,1984-851987-92,
2000
7/9/02 109
Zumbro River Basin
Bear Creek tributary near Ches-ter (05372915)
Zumbro River Lat 44°00’43”, long 92°22’10”, in SE1/4 NE1/4 sec. 3, T.106 N., R.13 W., Olmsted County, Hydro-logic Unit 07040004, 0.25 mile north of Highway 14, 2.2 miles east of Rochester Community and Technical College and 3 miles east of Rochester.
-- -- 08-27-02 *0.42
Stream Name and
[Station No.]
Tributary to LocationDrainage
area(mi2)
Measuredpreviously
(wateryears)
Measurements
DateDischarge(ft3/s)

293
Water Quality at Miscellaneous Sites
Water quality sampling with plunge sampler, August, 2002

294 WATER QUALITY DATA
MISCELLANEOUS SITES
AMPHIBIAN RESEARCH AND MONITORING
WATER-QUALITY DATA, WATER YEAR OCTOBER 2001 TO SEPTEMBER 2002 BARO- OXYGEN, PH PH SPE- METRIC DIS- WATER WATER CIFIC SPE- PRES- SOLVED WHOLE WHOLE CON- CIFIC SAM- SURE OXYGEN, (PER- FIELD LAB DUCT- CON- TEMPER- TEMPER- Sample Medium PLING (MM DIS- CENT (STAND- (STAND- ANCE DUCT- ATURE ATURE Date Time type code DEPTH OF SOLVED SATUR- ARD ARD LAB ANCE AIR WATER (FEET) HG) (MG/L) ATION) UNITS) UNITS) (US/CM) (US/CM) (DEG C) (DEG C) (00003) (00025) (00300) (00301) (00400) (00403) (90095) (00095) (00020) (00010) 463712096154001 JWPA SITE POND NEAR PELICAN RAPIDS, MN (LAT 46 37 12N LONG 096 15 40W) OCT 2001 01... 1430 ENVIRONMENTAL 1.00 733 4.6 49 8.3 -- -- 688 -- 16.8 01... 1432 REPLICATE -- -- -- -- -- -- -- -- -- -- 01... 1530 ENVIRONMENTAL .05 733 4.9 51 8.3 -- -- 688 23.0 16.9 02... 1200 ENVIRONMENTAL .00 722 -- -- -- -- -- -- 23.5 -- 454753096303301 TRD WETLAND AT WHEATON HIGH SCHOOL IN WHEATON, MN (LAT 45 47 53N LONG 096 30 33W) OCT 2001 03... 0900 ENVIRONMENTAL 1.00 735 7.8 79 8.7 -- -- 1230 -- 14.3 03... 1000 ENVIRONMENTAL .05 735 7.8 79 8.7 -- -- 1230 -- 14.3 03... 1200 ENVIRONMENTAL .00 -- -- -- -- -- -- -- -- -- 462327093575801 UNNAMED POND NORTH OF L. NOKAY NR ESDEN, MN (CWB) (LAT 46 23 27N LONG 093 57 58W) OCT 2001 09... 0900 ENVIRONMENTAL 1.00 729 8.6 81 7.2 -- -- 41 16.5 10.8 09... 1000 ENVIRONMENTAL .05 735 7.8 79 8.7 -- -- 1230 -- 14.3 09... 1200 ENVIRONMENTAL .00 729 -- -- -- -- -- -- 16.5 -- 483152092572701 WETLAND NEAR QUILL LAKE (V6DB1) NR KABETOGAMA, MN (LAT 48 31 52N LONG 092 57 27W) JUL 2002 16... 1730 ENVIRONMENTAL -- 727 6.0 83 5.9 -- -- 24 33.0 30.0 16... 1730 BED MATERIAL -- -- -- -- -- -- -- -- -- -- 482534092482301 WETLAND AT SULLIVAN BAY (V2DF1) NR KABETOGAMA, MN (LAT 48 25 34N LONG 092 48 23W) JUL 2002 16... 1800 ENVIRONMENTAL -- 731 7.4 101 8.3 -- -- 148 33.0 29.0 16... 1800 BED MATERIAL -- -- -- -- -- -- -- -- -- -- 482513092400501 WETLAND NEAR JUNCTION BAY (V1BD1) NR KABETOGAMA,MN (LAT 48 25 13N LONG 092 40 05W) JUL 2002 18... 1430 ENVIRONMENTAL -- 738 8.7 122 6.8 -- -- 39 31.5 30.5 18... 1430 BED MATERIAL -- -- -- -- -- -- -- -- -- -- 454147092522301 WETLAND BY ST. CROIX R. NR RUSH CITY, MN (SC4DC1) (LAT 45 41 47N LONG 092 52 23W) AUG 2002 25... 1400 ENVIRONMENTAL -- 742 .3 2 6.4 7.0 156 148 23.7 21.1

295 WATER QUALITY DATA
MISCELLANEOUS SITES--Continued
AMPHIBIAN RESEARCH AND MONITORING--Continued
WATER-QUALITY DATA, WATER YEAR OCTOBER 2001 TO SEPTEMBER 2002 ALKA- BICAR- CAR- SOLIDS, NITRO- MAGNE- POTAS- LINITY BONATE BONATE CHLO- FLUO- SILICA, RESIDUE GEN, CALCIUM SIUM, SIUM, SODIUM, WAT DIS WATER WATER RIDE, RIDE, DIS- SULFATE AT 180 AMMONIA DIS- DIS- DIS- DIS- TOT IT DIS IT DIS IT DIS- DIS- SOLVED DIS- DEG. C DIS- SOLVED SOLVED SOLVED SOLVED FIELD FIELD FIELD SOLVED SOLVED (MG/L SOLVED DIS- SOLVED Date (MG/L (MG/L (MG/L (MG/L MG/L AS MG/L AS MG/L AS (MG/L (MG/L AS (MG/L SOLVED (MG/L AS CA) AS MG) AS K) AS NA) CACO3 HCO3 CO3 AS CL) AS F) SIO2) AS SO4) (MG/L) AS N) (00915) (00925) (00935) (00930) (39086) (00453) (00452) (00940) (00950) (00955) (00945) (70300) (00608) 463712096154001 JWPA SITE POND NEAR PELICAN RAPIDS, MN (LAT 46 37 12N LONG 096 15 40W) OCT 2001 01... -- -- -- -- 353 413 9 -- -- -- -- -- -- 01... -- -- -- -- -- -- -- -- -- -- -- -- -- 01... -- -- -- -- 365 418 13 -- -- -- -- -- -- 02... -- -- -- -- -- -- -- -- -- -- -- -- -- 454753096303301 TRD WETLAND AT WHEATON HIGH SCHOOL IN WHEATON, MN (LAT 45 47 53N LONG 096 30 33W) OCT 2001 03... -- -- -- -- 266 290 17 -- -- -- -- -- -- 03... -- -- -- -- 264 288 14 -- -- -- -- -- -- 03... -- -- -- -- -- -- -- -- -- -- -- -- -- 462327093575801 UNNAMED POND NORTH OF L. NOKAY NR ESDEN, MN (CWB) (LAT 46 23 27N LONG 093 57 58W) OCT 2001 09... -- -- -- -- 19 20 -- -- -- -- -- -- -- 09... -- -- -- -- 17 21 -- -- -- -- -- -- -- 09... -- -- -- -- -- -- -- -- -- -- -- -- -- 483152092572701 WETLAND NEAR QUILL LAKE (V6DB1) NR KABETOGAMA, MN (LAT 48 31 52N LONG 092 57 27W) JUL 2002 16... -- -- -- -- -- -- -- -- -- -- -- -- .04 16... -- -- -- -- -- -- -- -- -- -- -- -- -- 482534092482301 WETLAND AT SULLIVAN BAY (V2DF1) NR KABETOGAMA, MN (LAT 48 25 34N LONG 092 48 23W) JUL 2002 16... -- -- -- -- -- -- -- -- -- -- -- -- E.02 16... -- -- -- -- -- -- -- -- -- -- -- -- -- 482513092400501 WETLAND NEAR JUNCTION BAY (V1BD1) NR KABETOGAMA,MN (LAT 48 25 13N LONG 092 40 05W) JUL 2002 18... -- -- -- -- -- -- -- -- -- -- -- -- .38 18... -- -- -- -- -- -- -- -- -- -- -- -- -- 454147092522301 WETLAND BY ST. CROIX R. NR RUSH CITY, MN (SC4DC1) (LAT 45 41 47N LONG 092 52 23W) AUG 2002 25... 16.4 5.53 1.13 2.01 -- -- -- 1.94 E.1 25.7 1.9 126 1.21

296 WATER QUALITY DATA
MISCELLANEOUS SITES--Continued
AMPHIBIAN RESEARCH AND MONITORING--Continued
WATER-QUALITY DATA, WATER YEAR OCTOBER 2001 TO SEPTEMBER 2002 NITRO- NITRO- NITRO- NITRO- ORTHO- GEN,AM- GEN,AM- GEN, GEN, PHOS- PHOS- CARBON, MONIA + MONIA + NO2+NO3 NITRITE PHORUS PHATE, PHOS- ORGANIC ARSENIC CADMIUM COPPER, IRON, LEAD, ORGANIC ORGANIC DIS- DIS- DIS- DIS- PHORUS DIS- DIS- DIS- DIS- DIS- DIS- DIS. TOTAL SOLVED SOLVED SOLVED SOLVED TOTAL SOLVED SOLVED SOLVED SOLVED SOLVED SOLVED Date (MG/L (MG/L (MG/L (MG/L (MG/L (MG/L (MG/L (MG/L (UG/L (UG/L (UG/L (UG/L (UG/L AS N) AS N) AS N) AS N) AS P) AS P) AS P) AS C) AS AS) AS CD) AS CU) AS FE) AS PB) (00623) (00625) (00631) (00613) (00666) (00671) (00665) (00681) (01000) (01025) (01040) (01046) (01049) 463712096154001 JWPA SITE POND NEAR PELICAN RAPIDS, MN (LAT 46 37 12N LONG 096 15 40W) OCT 2001 01... -- -- -- -- -- -- -- -- -- -- -- -- -- 01... -- -- -- -- -- -- -- -- -- -- -- -- -- 01... -- -- -- -- -- -- -- -- -- -- -- -- -- 02... -- -- -- -- -- -- -- -- -- -- -- -- -- 454753096303301 TRD WETLAND AT WHEATON HIGH SCHOOL IN WHEATON, MN (LAT 45 47 53N LONG 096 30 33W) OCT 2001 03... -- -- -- -- -- -- -- -- -- -- -- -- -- 03... -- -- -- -- -- -- -- -- -- -- -- -- -- 03... -- -- -- -- -- -- -- -- -- -- -- -- -- 462327093575801 UNNAMED POND NORTH OF L. NOKAY NR ESDEN, MN (CWB) (LAT 46 23 27N LONG 093 57 58W) OCT 2001 09... -- -- -- -- -- -- -- -- -- -- -- -- -- 09... -- -- -- -- -- -- -- -- -- -- -- -- -- 09... -- -- -- -- -- -- -- -- -- -- -- -- -- 483152092572701 WETLAND NEAR QUILL LAKE (V6DB1) NR KABETOGAMA, MN (LAT 48 31 52N LONG 092 57 27W) JUL 2002 16... .75 1.1 E.03 <.008 .024 <.02 .083 17.0 -- -- -- -- -- 16... -- -- -- -- -- -- -- -- -- -- -- -- -- 482534092482301 WETLAND AT SULLIVAN BAY (V2DF1) NR KABETOGAMA, MN (LAT 48 25 34N LONG 092 48 23W) JUL 2002 16... .73 .93 E.03 <.008 .018 <.02 .047 17.9 -- -- -- -- -- 16... -- -- -- -- -- -- -- -- -- -- -- -- -- 482513092400501 WETLAND NEAR JUNCTION BAY (V1BD1) NR KABETOGAMA,MN (LAT 48 25 13N LONG 092 40 05W) JUL 2002 18... 1.2 1.2 .05 <.008 .036 E.01 .081 21.2 -- -- -- -- -- 18... -- -- -- -- -- -- -- -- -- -- -- -- -- 454147092522301 WETLAND BY ST. CROIX R. NR RUSH CITY, MN (SC4DC1) (LAT 45 41 47N LONG 092 52 23W) AUG 2002 25... 1.8 2.6 .14 .016 .047 .04 .80 11.1 1.6 <.04 .3 2200 <.08

297 WATER QUALITY DATA
MISCELLANEOUS SITES--Continued
AMPHIBIAN RESEARCH AND MONITORING--Continued
WATER-QUALITY DATA, WATER YEAR OCTOBER 2001 TO SEPTEMBER 2002 MANGA- NESE, ZINC, DIS- DIS- Data SOLVED SOLVED base Date (UG/L (UG/L number AS MN) AS ZN) (01056) (01090) 463712096154001 JWPA SITE POND NEAR PELICAN RAPIDS, MN (LAT 46 37 12N LONG 096 15 40W) OCT 2001 01... -- -- 01 01... -- -- 77 01... -- -- 01 02... -- -- 01 454753096303301 TRD WETLAND AT WHEATON HIGH SCHOOL IN WHEATON, MN (LAT 45 47 53N LONG 096 30 33W) OCT 2001 03... -- -- 01 03... -- -- 01 03... -- -- 01 462327093575801 UNNAMED POND NORTH OF L. NOKAY NR ESDEN, MN (CWB) (LAT 46 23 27N LONG 093 57 58W) OCT 2001 09... -- -- 01 09... -- -- 01 09... -- -- 01 483152092572701 WETLAND NEAR QUILL LAKE (V6DB1) NR KABETOGAMA, MN (LAT 48 31 52N LONG 092 57 27W) JUL 2002 16... -- -- 01 16... -- -- 01 482534092482301 WETLAND AT SULLIVAN BAY (V2DF1) NR KABETOGAMA, MN (LAT 48 25 34N LONG 092 48 23W) JUL 2002 16... -- -- 01 16... -- -- 01 482513092400501 WETLAND NEAR JUNCTION BAY (V1BD1) NR KABETOGAMA,MN (LAT 48 25 13N LONG 092 40 05W) JUL 2002 18... -- -- 01 18... -- -- 01 454147092522301 WETLAND BY ST. CROIX R. NR RUSH CITY, MN (SC4DC1) (LAT 45 41 47N LONG 092 52 23W) AUG 2002 25... 1370 <1 01

298 WATER QUALITY DATA
MISCELLANEOUS SITES--Continued
AMPHIBIAN RESEARCH AND MONITORING--Continued
WATER-QUALITY DATA, WATER YEAR OCTOBER 2001 TO SEPTEMBER 2002 BARO- OXYGEN, PH PH SPE- METRIC DIS- WATER WATER CIFIC SPE- PRES- SOLVED WHOLE WHOLE CON- CIFIC CALCIUM SURE OXYGEN, (PER- FIELD LAB DUCT- CON- TEMPER- TEMPER- DIS- Sample Medium (MM DIS- CENT (STAND- (STAND- ANCE DUCT- ATURE ATURE SOLVED Date Time type code OF SOLVED SATUR- ARD ARD LAB ANCE AIR WATER (MG/L HG) (MG/L) ATION) UNITS) UNITS) (US/CM) (US/CM) (DEG C) (DEG C) AS CA) (00025) (00300) (00301) (00400) (00403) (90095) (00095) (00020) (00010) (00915) 451714092452501 ST. CROIX RIVER WETLAND NEAR OSCEOLA, WI (SC2DD1) (LAT 45 17 14N LONG 092 45 25W) AUG 2002 28... 1000 ENVIRONMENTAL 749 .7 9 6.6 6.7 249 265 25.5 22.1 32.7 435519091153701 SLOUGH BY MISSISSIPPI R. ABOVE MIDWAY, WI (P7DA2) (LAT 43 55 19N LONG 091 15 37W) SEP 2002 03... 1500 ENVIRONMENTAL 745 2.3 26 7.2 7.7 517 534 31.0 21.5 64.6 03... 1502 ENVIRONMENTAL -- -- -- -- E7.5 519 -- -- -- 64.6 03... 1502 REPLICATE 745 2.3 24 7.2 E7.5 519 534 31.0 21.5 64.6 442342092023601 SLOUGH ON MISSISSIPPI RIVER ABV NELSON, WI (P4DA1) (LAT 44 23 42N LONG 092 02 36W) SEP 2002 03... 1000 ENVIRONMENTAL 744 .3 3 6.5 7.3 215 229 22.6 19.5 25.0 425101091043601 SLOUGH ON MISSISSIPPI R. BLW GLEN HAVEN,WI(P10DA1) (LAT 42 51 01N LONG 091 04 36W) SEP 2002 04... 1300 ENVIRONMENTAL 749 9.7 121 8.5 8.4 312 312 32.3 25.7 35.6
SOLIDS, NITRO- NITRO- NITRO- NITRO- NITRO- MAGNE- POTAS- CHLO- FLUO- SILICA, RESIDUE GEN, GEN,AM- GEN,AM- GEN, GEN, SIUM, SIUM, SODIUM, RIDE, RIDE, DIS- SULFATE AT 180 AMMONIA MONIA + MONIA + NO2+NO3 NITRITE DIS- DIS- DIS- DIS- DIS- SOLVED DIS- DEG. C DIS- ORGANIC ORGANIC DIS- DIS- SOLVED SOLVED SOLVED SOLVED SOLVED (MG/L SOLVED DIS- SOLVED DIS. TOTAL SOLVED SOLVED Date (MG/L (MG/L (MG/L (MG/L (MG/L AS (MG/L SOLVED (MG/L (MG/L (MG/L (MG/L (MG/L AS MG) AS K) AS NA) AS CL) AS F) SIO2) AS SO4) (MG/L) AS N) AS N) AS N) AS N) AS N) (00925) (00935) (00930) (00940) (00950) (00955) (00945) (70300) (00608) (00623) (00625) (00631) (00613) 451714092452501 ST. CROIX RIVER WETLAND NEAR OSCEOLA, WI (SC2DD1) (LAT 45 17 14N LONG 092 45 25W) AUG 2002 28... 11.8 .66 3.84 1.85 E.1 9.45 3.7 175 <.04 .86 1.3 <.05 <.008 435519091153701 SLOUGH BY MISSISSIPPI R. ABOVE MIDWAY, WI (P7DA2) (LAT 43 55 19N LONG 091 15 37W) SEP 2002 03... 27.2 2.78 7.32 17.8 .1 20.7 14.0 314 <.04 .32 .61 .13 E.005 03... 27.4 2.75 7.34 17.9 .1 20.8 14.1 312 <.04 .32 .45 .13 E.005 03... 27.4 2.75 7.34 17.9 .1 20.8 14.1 312 <.04 .32 .45 .13 E.005 442342092023601 SLOUGH ON MISSISSIPPI RIVER ABV NELSON, WI (P4DA1) (LAT 44 23 42N LONG 092 02 36W) SEP 2002 03... 8.93 1.93 4.23 6.09 E.1 10.0 3.0 138 .17 .63 1.1 <.05 <.008 425101091043601 SLOUGH ON MISSISSIPPI R. BLW GLEN HAVEN,WI(P10DA1) (LAT 42 51 01N LONG 091 04 36W) SEP 2002 04... 14.3 2.44 8.44 12.1 .1 6.85 15.3 195 .05 .64 .90 .35 .012

299 ORTHO- PHOS- PHOS- CARBON, MANGA- PHORUS PHATE, PHOS- ORGANIC ARSENIC CADMIUM COPPER, IRON, LEAD, NESE, ZINC, DIS- DIS- PHORUS DIS- DIS- DIS- DIS- DIS- DIS- DIS- DIS- Data SOLVED SOLVED TOTAL SOLVED SOLVED SOLVED SOLVED SOLVED SOLVED SOLVED SOLVED base Date (MG/L (MG/L (MG/L (MG/L (UG/L (UG/L (UG/L (UG/L (UG/L (UG/L (UG/L number AS P) AS P) AS P) AS C) AS AS) AS CD) AS CU) AS FE) AS PB) AS MN) AS ZN) (00666) (00671) (00665) (00681) (01000) (01025) (01040) (01046) (01049) (01056) (01090) 451714092452501 ST. CROIX RIVER WETLAND NEAR OSCEOLA, WI (SC2DD1) (LAT 45 17 14N LONG 092 45 25W) AUG 2002 28... .083 .06 .21 14.7 1.3 <.04 .5 1200 <.08 1210 2 01 435519091153701 SLOUGH BY MISSISSIPPI R. ABOVE MIDWAY, WI (P7DA2) (LAT 43 55 19N LONG 091 15 37W) SEP 2002 03... .072 .06 .28 5.4 1.0 <.04 .4 58 E.05 114 <1 01 03... .072 .06 .164 5.1 .9 <.04 .4 33 <.08 97.8 <1 01 03... .072 .06 .164 -- .9 <.04 .4 33 <.08 97.8 <1 77 442342092023601 SLOUGH ON MISSISSIPPI RIVER ABV NELSON, WI (P4DA1) (LAT 44 23 42N LONG 092 02 36W) SEP 2002 03... .009 <.02 .27 8.9 1.6 <.04 .2 1400 <.08 2550 <1 01 425101091043601 SLOUGH ON MISSISSIPPI R. BLW GLEN HAVEN,WI(P10DA1) (LAT 42 51 01N LONG 091 04 36W) SEP 2002 04... .087 .05 .136 8.2 1.6 <.04 1.3 224 .22 94.5 1 01

300
Streamflow measurement and water quality field readings
at Fridley, summer of 2002

301 WATER QUALITY DATA
MISCELLANEOUS SITES--Continued
TROPHIC STATE INDICATOR PROJECT
WATER-QUALITY DATA, WATER YEAR OCTOBER 2001 TO SEPTEMBER 2002 DEPTH DEPTH BARO- OXYGEN, PH ANC BOTTOM TO BOT. TRANS- METRIC DIS- WATER SPE- WATER AT FROM PAR- PRES- SOLVED WHOLE CIFIC UNFLTRD SAMPLE SURFACE ENCY SURE OXYGEN, (PER- FIELD CON- TEMPER- IT Sample Medium LOC- AT SAMP (SECCHI (MM DIS- CENT (STAND- DUCT- ATURE FIELD Date Time type code ATION, LOC. DISK) OF SOLVED SATUR- ARD ANCE WATER MG/L AS (FEET) METERS (M) HG) (MG/L) ATION) UNITS) (US/CM) (DEG C) CACO3 (81903) (82903) (00078) (00025) (00300) (00301) (00400) (00095) (00010) (00419) 482731092574701 KABETOGAMA LAKE NEAR GRAVE ISLAND NEAR RAY, MN (LAT 48 27 31N LONG 092 57 47W) OCT 2001 02... 1440 ENVIRONMENTAL -- -- -- -- -- -- -- -- -- -- 16... 1035 ENVIRONMENTAL -- 14.7 3.25 -- 10.2 89 7.6 65 9.6 -- 17... 1000 ENVIRONMENTAL -- -- -- -- -- -- -- -- -- -- MAY 2002 03... 1055 ENVIRONMENTAL -- -- 2.30 -- 4.9 50 8.0 91 15.1 -- 14... 1545 ENVIRONMENTAL -- -- 2.70 -- 12.8 105 7.5 109 6.8 49 30... 1055 ENVIRONMENTAL -- -- -- -- -- -- -- -- -- -- JUN 12... 1340 ENVIRONMENTAL -- -- 2.50 -- -- -- 7.4 96 14.7 -- 26... 1045 ENVIRONMENTAL -- -- 2.50 -- 8.3 89 7.7 72 18.3 -- JUL 09... 1520 ENVIRONMENTAL -- -- 2.00 -- 9.9 116 8.5 94 23.4 -- 23... 1420 ENVIRONMENTAL -- -- 2.00 -- 8.7 101 7.9 95 22.6 -- AUG 06... 1500 ENVIRONMENTAL -- -- 1.50 -- 9.4 106 8.2 92 21.5 -- 21... 1530 ENVIRONMENTAL 16.0 -- 1.70 730 10.0 109 8.1 86 19.5 -- 21... 1800 ENVIRONMENTAL -- -- -- -- -- -- -- -- -- -- SEP 05... 1019 ENVIRONMENTAL -- 15.0 1.50 -- 7.9 87 7.8 88 20.1 -- 17... 1100 ENVIRONMENTAL -- 14.6 2.25 -- 8.4 92 7.6 87 19.7 -- 30... 1520 ENVIRONMENTAL -- 14.8 2.00 -- 9.1 91 7.6 76 1500 -- 483012093035001 KABETOGAMA LAKE AT CEMETARY ISLAND NEAR RAY, MN (LAT 48 30 12N LONG 093 03 50W) OCT 2001 02... 1540 ENVIRONMENTAL -- -- -- -- -- -- -- -- -- -- 17... 0915 ENVIRONMENTAL -- -- -- -- -- -- -- -- -- -- MAY 2002 14... 1630 ENVIRONMENTAL -- -- 1.80 -- 13.3 112 8.0 102 8.0 45 30... 1010 ENVIRONMENTAL -- -- 2.20 -- 5.1 51 7.5 99 14.6 -- JUN 12... 1415 ENVIRONMENTAL -- -- 2.50 -- -- -- 7.4 100 15.8 -- 26... 1140 ENVIRONMENTAL -- -- 2.75 -- 9.0 99 7.5 76 19.9 -- JUL 09... 1550 ENVIRONMENTAL -- -- 2.00 -- 10.0 117 8.5 94 22.8 -- 23... 1515 ENVIRONMENTAL -- -- 1.50 -- 7.4 84 7.7 94 22.1 -- AUG 06... 1540 ENVIRONMENTAL -- -- 1.25 -- 11.0 124 8.9 93 21.3 -- 21... 1630 ENVIRONMENTAL 7.70 -- 1.80 731 11.1 120 8.4 86 19.4 46 SEP 05... 0945 ENVIRONMENTAL -- 7.20 1.75 -- 7.7 86 8.0 88 20.3 -- 17... 1015 ENVIRONMENTAL -- 7.60 2.50 -- 7.4 81 7.5 87 19.6 -- 30... 1440 ENVIRONMENTAL -- 7.20 2.20 -- 8.9 86 7.4 75 14.0 -- 483511093092801 RAINY LAKE AT BLACK BAY NARROWS NR INT FALLS MN (LAT 48 35 38N LONG 093 09 13W) OCT 2001 01... 1010 ENVIRONMENTAL -- -- -- -- -- -- -- -- -- -- 16... 1025 ENVIRONMENTAL -- -- -- -- -- -- -- -- -- --

302 WATER QUALITY DATA
MISCELLANEOUS SITES--Continued
TROPHIC STATE INDICATOR PROJECT--Continued
WATER-QUALITY DATA, WATER YEAR OCTOBER 2001 TO SEPTEMBER 2002 ANC ANC NITRO- NITRO- NITRO- NITRO- NITRO- ORTHO- CHLOR-A CHLOR-B BICAR- CAR- GEN, GEN,AM- GEN,AM- GEN, GEN, PHOS- PHOS- PHYTO- PHYTO- BONATE BONATE AMMONIA MONIA + MONIA + NO2+NO3 NITRITE PHORUS PHATE, PHOS- PLANK- PLANK- IT IT DIS- ORGANIC ORGANIC DIS- DIS- DIS- DIS- PHORUS TON TON Data FIELD FIELD SOLVED DIS. TOTAL SOLVED SOLVED SOLVED SOLVED TOTAL CHROMO CHROMO base Date MG/L AS MG/L AS (MG/L (MG/L (MG/L (MG/L (MG/L (MG/L (MG/L (MG/L FLUOROM FLUOROM number HCO3 CO3 AS N) AS N) AS N) AS N) AS N) AS P) AS P) AS P) (UG/L) (UG/L) (00450) (00447) (00608) (00623) (00625) (00631) (00613) (00666) (00671) (00665) (70953) (70954) 482731092574701 KABETOGAMA LAKE NEAR GRAVE ISLAND NEAR RAY, MN (LAT 48 27 31N LONG 092 57 47W) OCT 2001 02... -- -- -- -- -- -- -- -- -- .039 <.1 <.1 01 16... -- -- -- -- -- -- -- -- -- .038 -- -- 01 17... -- -- -- -- -- -- -- -- -- .044 1.9 <.1 01 MAY 2002 03... -- -- -- -- -- -- -- -- -- -- -- -- 01 14... 60 0 <.015 .43 .49 .037 <.002 .007 <.007 .025 2.2 <.1 01 30... -- -- -- -- -- -- -- -- -- -- 1.9 <.1 01 JUN 12... -- -- -- -- -- -- -- -- -- .023 -- -- 01 26... -- -- -- -- -- -- -- -- -- .015 1.5 .1 01 JUL 09... -- -- -- -- -- -- -- -- -- .022 -- -- 01 23... -- -- -- -- -- -- -- -- -- .028 -- -- 01 AUG 06... -- -- -- -- -- -- -- -- -- .060 26.5 <.1 01 21... -- -- .022 .46 .76 <.013 <.002 .020 .012 .064 7.6 <.1 01 21... -- -- -- -- -- -- -- -- -- -- -- -- 77 SEP 05... -- -- -- -- -- -- -- -- -- .082 -- -- 01 17... -- -- -- -- -- -- -- -- -- .051 -- -- 01 30... -- -- -- -- -- -- -- -- -- .080 -- -- 01 483012093035001 KABETOGAMA LAKE AT CEMETARY ISLAND NEAR RAY, MN (LAT 48 30 12N LONG 093 03 50W) OCT 2001 02... -- -- -- -- -- -- -- -- -- .063 7.0 <.1 01 17... -- -- -- -- -- -- -- -- -- .049 2.1 <.1 01 MAY 2002 14... 55 0 <.015 .38 .52 <.013 <.002 .006 <.007 .017 6.6 <.1 01 30... -- -- -- -- -- -- -- -- -- -- .7 <.1 01 JUN 12... -- -- -- -- -- -- -- -- -- .081 -- -- 01 26... -- -- -- -- -- -- -- -- -- .019 2.5 .3 01 JUL 09... -- -- -- -- -- -- -- -- -- .026 -- -- 01 23... -- -- -- -- -- -- -- -- -- .071 -- -- 01 AUG 06... -- -- -- -- -- -- -- -- -- .077 23.7 <.1 01 21... 57 0 .015 .46 .69 <.013 <.002 .024 .014 .087 4.9 <.1 01 SEP 05... -- -- -- -- -- -- -- -- -- .062 -- -- 01 17... -- -- -- -- -- -- -- -- -- .058 -- -- 01 30... -- -- -- -- -- -- -- -- -- .041 -- -- 01 483511093092801 RAINY LAKE AT BLACK BAY NARROWS NR INT FALLS MN (LAT 48 35 38N LONG 093 09 13W) OCT 2001 01... -- -- -- -- -- -- -- -- -- .042 4.8 .2 01 16... -- -- -- -- -- -- -- -- -- .053 5.5 <.1 01

303 WATER QUALITY DATA
MISCELLANEOUS SITES--Continued
TROPHIC STATE INDICATOR PROJECT--Continued
WATER-QUALITY DATA, WATER YEAR OCTOBER 2001 TO SEPTEMBER 2002 DEPTH DEPTH BARO- OXYGEN, PH ANC BOTTOM TO BOT. TRANS- METRIC DIS- WATER SPE- WATER AT FROM PAR- PRES- SOLVED WHOLE CIFIC UNFLTRD SAMPLE SURFACE ENCY SURE OXYGEN, (PER- FIELD CON- TEMPER- IT Sample Medium LOC- AT SAMP (SECCHI (MM DIS- CENT (STAND- DUCT- ATURE FIELD Date Time type code ATION, LOC. DISK) OF SOLVED SATUR- ARD ANCE WATER MG/L AS (FEET) METERS (M) HG) (MG/L) ATION) UNITS) (US/CM) (DEG C) CACO3 (81903) (82903) (00078) (00025) (00300) (00301) (00400) (00095) (00010) (00419) 483511093092801 RAINY LAKE AT BLACK BAY NARROWS NR INT FALLS MN (LAT 48 35 38N LONG 093 09 13W) MAY 2002 13... 1330 ENVIRONMENTAL -- -- .90 -- 11.9 109 7.8 103 11.3 39 28... 1010 ENVIRONMENTAL -- -- 1.20 -- 6.6 61 7.7 108 14.5 -- JUN 11... 1115 ENVIRONMENTAL -- -- 1.00 -- -- -- 7.5 66 13.9 -- 24... 1145 ENVIRONMENTAL -- -- 1.00 -- 8.3 91 8.2 81 20.5 -- JUL 08... 1108 ENVIRONMENTAL -- -- 1.50 -- 6.9 80 7.5 107 22.5 -- 22... 1015 ENVIRONMENTAL -- -- 1.00 -- 10.3 123 7.5 103 24.3 -- AUG 05... 0935 ENVIRONMENTAL -- -- .75 -- 8.9 100 8.2 93 20.7 -- 20... 1300 ENVIRONMENTAL 3.40 -- .70 -- 8.6 93 8.1 96 17.6 46 SEP 04... 1050 ENVIRONMENTAL -- 3.40 .50 -- 8.4 92 7.9 79 19.6 -- 16... 1045 ENVIRONMENTAL -- 3.10 1.00 -- 8.9 94 7.9 62 17.5 -- 483341093111501 RAINY LK AT BLACK BAY (WEST) NR INTERNATIONAL FLLS (LAT 48 32 30N LONG 093 11 15W) OCT 2001 01... 0940 ENVIRONMENTAL -- -- -- -- -- -- -- -- -- -- 16... 1000 ENVIRONMENTAL -- -- -- -- -- -- -- -- -- -- MAY 2002 13... 1120 ENVIRONMENTAL -- -- .70 -- 10.7 98 7.3 129 11.7 51 28... 0855 ENVIRONMENTAL -- -- 2.20 -- 5.5 56 7.6 113 15.6 -- JUN 11... 0950 ENVIRONMENTAL -- -- .50 -- -- -- 7.9 107 15.8 -- 24... 0915 ENVIRONMENTAL -- -- .75 -- 10.5 119 7.8 109 20.1 -- JUL 08... 1003 ENVIRONMENTAL -- -- .50 -- 6.5 7 7.4 96 21.6 -- 22... 0905 ENVIRONMENTAL -- -- .75 -- 9.3 111 7.2 102 23.6 -- AUG 05... 1007 ENVIRONMENTAL -- -- .75 -- 9.5 106 8.4 93 20.7 -- 20... 1330 ENVIRONMENTAL 2.20 -- .60 734 8.7 95 8.2 96 17.9 46 SEP 04... 0950 ENVIRONMENTAL -- 2.30 .75 -- 8.1 87 7.8 88 19.3 -- 16... 0950 ENVIRONMENTAL -- 2.20 .50 -- 9.2 96 8.1 84 17.4 -- 483304093062701 RAINY LAKE AT BLACK BAY NR INT FALLS MN (LAT 48 33 04N LONG 093 06 27W) OCT 2001 01... 0905 ENVIRONMENTAL -- -- -- -- -- -- -- -- -- -- 16... 0917 ENVIRONMENTAL -- -- -- -- -- -- -- -- -- -- MAY 2002 13... 1145 ENVIRONMENTAL -- -- .55 -- 11.6 103 7.5 104 10.3 42 28... 0925 ENVIRONMENTAL -- -- 1.30 -- 6.2 60 7.7 101 13.8 -- JUN 11... 1015 ENVIRONMENTAL -- -- 1.00 -- -- -- 7.5 98 15.4 -- 24... 1000 ENVIRONMENTAL -- -- 1.50 -- 7.7 84 8.2 42 19.7 -- JUL 08... 1030 ENVIRONMENTAL -- -- 1.75 -- 8.9 101 7.9 92 21.8 -- 22... 0930 ENVIRONMENTAL -- -- .50 -- 11.2 132 7.7 100 24.0 -- AUG 05... 1022 ENVIRONMENTAL -- -- 1.00 -- 9.2 103 8.2 93 20.9 -- 20... 1415 ENVIRONMENTAL 2.00 -- .60 731 8.9 99 8.2 95 18.7 45 SEP 04... 1020 ENVIRONMENTAL -- 2.00 .75 -- 7.8 85 7.9 89 19.4 -- 16... 1010 ENVIRONMENTAL -- 1.90 1.00 -- 8.0 83 7.9 84 17.2 --

304 WATER QUALITY DATA
MISCELLANEOUS SITES--Continued
TROPHIC STATE INDICATOR PROJECT--Continued
WATER-QUALITY DATA, WATER YEAR OCTOBER 2001 TO SEPTEMBER 2002 ANC ANC NITRO- NITRO- NITRO- NITRO- NITRO- ORTHO- CHLOR-A CHLOR-B BICAR- CAR- GEN, GEN,AM- GEN,AM- GEN, GEN, PHOS- PHOS- PHYTO- PHYTO- BONATE BONATE AMMONIA MONIA + MONIA + NO2+NO3 NITRITE PHORUS PHATE, PHOS- PLANK- PLANK- IT IT DIS- ORGANIC ORGANIC DIS- DIS- DIS- DIS- PHORUS TON TON Data FIELD FIELD SOLVED DIS. TOTAL SOLVED SOLVED SOLVED SOLVED TOTAL CHROMO CHROMO base Date MG/L AS MG/L AS (MG/L (MG/L (MG/L (MG/L (MG/L (MG/L (MG/L (MG/L FLUOROM FLUOROM number HCO3 CO3 AS N) AS N) AS N) AS N) AS N) AS P) AS P) AS P) (UG/L) (UG/L) (00450) (00447) (00608) (00623) (00625) (00631) (00613) (00666) (00671) (00665) (70953) (70954) 483511093092801 RAINY LAKE AT BLACK BAY NARROWS NR INT FALLS MN (LAT 48 35 38N LONG 093 09 13W) MAY 2002 13... 48 0 <.015 .45 .69 <.013 E.002 .010 <.007 .035 8.0 <.1 01 28... -- -- -- -- -- -- -- -- -- .034 2.0 <.1 01 JUN 11... -- -- -- -- -- -- -- -- -- .026 -- -- 01 24... -- -- -- -- -- -- -- -- -- .035 3.3 .2 01 JUL 08... -- -- -- -- -- -- -- -- -- .043 -- -- 01 22... -- -- -- -- -- -- -- -- -- .064 -- -- 01 AUG 05... -- -- -- -- -- -- -- -- -- .052 5.6 1.1 01 20... 56 0 .023 .62 .89 .060 .004 .032 .016 .078 4.3 .5 01 SEP 04... -- -- -- -- -- -- -- -- -- .051 -- -- 01 16... -- -- -- -- -- -- -- -- -- .032 -- -- 01 483341093111501 RAINY LK AT BLACK BAY (WEST) NR INTERNATIONAL FLLS (LAT 48 32 30N LONG 093 11 15W) OCT 2001 01... -- -- -- -- -- -- -- -- -- .043 5.9 .2 01 16... -- -- -- -- -- -- -- -- -- .044 5.6 E.1 01 MAY 2002 13... 62 0 <.015 .65 .87 <.013 .003 .015 <.007 .044 3.0 <.1 01 28... -- -- -- -- -- -- -- -- -- -- 1.2 <.1 01 JUN 11... -- -- -- -- -- -- -- -- -- .034 -- -- 01 24... -- -- -- -- -- -- -- -- -- .035 1.6 .1 01 JUL 08... -- -- -- -- -- -- -- -- -- .068 -- -- 01 22... -- -- -- -- -- -- -- -- -- .086 -- -- 01 AUG 05... -- -- -- -- -- -- -- -- -- .058 9.7 1.4 01 20... 57 0 E.013 .56 .72 .064 .003 .027 .013 .064 -- -- 01 SEP 04... -- -- -- -- -- -- -- -- -- .053 -- -- 01 16... -- -- -- -- -- -- -- -- -- .068 -- -- 01 483304093062701 RAINY LAKE AT BLACK BAY NR INT FALLS MN (LAT 48 33 04N LONG 093 06 27W) OCT 2001 01... -- -- -- -- -- -- -- -- -- .049 6.5 .2 01 16... -- -- -- -- -- -- -- -- -- .048 5.4 E.1 01 MAY 2002 13... 51 0 <.015 .48 .72 <.013 E.002 .011 <.007 .056 7.4 <.1 01 28... -- -- -- -- -- -- -- -- -- .035 1.5 <.1 01 JUN 11... -- -- -- -- -- -- -- -- -- .029 -- -- 01 24... -- -- -- -- -- -- -- -- -- .030 1.8 .2 01 JUL 08... -- -- -- -- -- -- -- -- -- .031 -- -- 01 22... -- -- -- -- -- -- -- -- -- .101 -- -- 01 AUG 05... -- -- -- -- -- -- -- -- -- .067 6.9 <.1 01 20... 55 0 E.009 .54 .78 .057 .003 .021 .007 .060 7.8 <.1 01 SEP 04... -- -- -- -- -- -- -- -- -- .104 -- -- 01 16... -- -- -- -- -- -- -- -- -- .075 -- -- 01

305 WATER QUALITY DATA
MISCELLANEOUS SITES--Continued
TROPHIC STATE INDICATOR PROJECT--Continued
WATER-QUALITY DATA, WATER YEAR OCTOBER 2001 TO SEPTEMBER 2002 DEPTH DEPTH BARO- OXYGEN, PH ANC BOTTOM TO BOT. TRANS- METRIC DIS- WATER SPE- WATER AT FROM PAR- PRES- SOLVED WHOLE CIFIC UNFLTRD SAMPLE SURFACE ENCY SURE OXYGEN, (PER- FIELD CON- TEMPER- IT Sample Medium LOC- AT SAMP (SECCHI (MM DIS- CENT (STAND- DUCT- ATURE FIELD Date Time type code ATION, LOC. DISK) OF SOLVED SATUR- ARD ANCE WATER MG/L AS (FEET) METERS (M) HG) (MG/L) ATION) UNITS) (US/CM) (DEG C) CACO3 (81903) (82903) (00078) (00025) (00300) (00301) (00400) (00095) (00010) (00419) 482607092511701 KABETOGAMA LK AT MOUTH OF MEADWOOD BAY NR RAY MN (LAT 48 26 07N LONG 092 51 17W) OCT 2001 02... 1345 ENVIRONMENTAL -- -- -- -- -- -- -- -- -- -- 17... 1110 ENVIRONMENTAL -- -- -- -- -- -- -- -- -- -- MAY 2002 03... 1145 ENVIRONMENTAL -- -- 2.10 -- 4.2 39 7.6 67 13.2 -- 14... 1500 ENVIRONMENTAL -- -- 1.90 -- 12.2 104 7.3 99 8.3 45 30... 1145 ENVIRONMENTAL -- -- -- -- -- -- -- -- -- -- JUN 12... 1310 ENVIRONMENTAL -- -- 1.50 -- -- -- 7.2 0 15.4 -- 26... 0925 ENVIRONMENTAL -- -- 2.50 -- 8.7 95 8.1 75 19.8 -- JUL 09... 1450 ENVIRONMENTAL -- -- 1.50 -- 9.2 109 8.1 118 23.6 -- 23... 1330 ENVIRONMENTAL -- -- 2.50 -- 9.6 113 8.2 99 24.4 -- AUG 06... 1415 ENVIRONMENTAL -- -- 1.75 -- 8.3 94 7.8 90 22.3 -- 21... 1445 ENVIRONMENTAL 11.3 -- 1.40 731 11.7 129 8.5 80 20.4 41 SEP 05... 1100 ENVIRONMENTAL -- 12.2 1.50 -- 8.3 92 7.9 79 20.0 -- 17... 1145 ENVIRONMENTAL -- 13.0 1.50 -- 9.8 109 8.3 78 20.5 -- 30... 1600 ENVIRONMENTAL -- 12.2 2.00 -- 8.9 89 7.6 59 15.5 -- 482616092372201 NAMAKAN LAKE NEAR RAY, MN (LAT 48 26 16N LONG 092 37 22W) MAY 2002 14... 0830 BLANK -- -- -- -- -- -- -- -- -- -- 14... 1345 ENVIRONMENTAL -- -- 2.10 -- 12.7 100 7.2 55 5.2 16 AUG 21... 1330 ENVIRONMENTAL 29.3 -- 2.70 731 10.1 108 7.4 37 18.9 16 482226092283301 SANDPOINT LK BL HARRISON NARROWS NR CRANE LK, MN (LAT 48 22 26N LONG 092 28 33W) MAY 2002 14... 1130 ENVIRONMENTAL -- -- 1.60 -- 11.8 92 7.4 82 4.9 23 AUG 21... 1130 ENVIRONMENTAL 43.0 -- 2.30 730 9.9 108 7.7 55 19.1 22 483622092560701 RAINY LK AT BRULE NARROWS NR INTERNTNL FALLS, MN (LAT 48 36 22N LONG 092 56 07W) MAY 2002 13... 1420 REPLICATE -- -- 2.30 -- 12.9 104 7.6 64 6.2 15 13... 1425 ENVIRONMENTAL -- -- 2.30 -- 12.9 104 7.6 64 6.2 16 AUG 20... 1030 ENVIRONMENTAL 8.20 -- 2.70 -- 8.8 94 8.2 42 17.0 15

306 WATER QUALITY DATA
MISCELLANEOUS SITES--Continued
TROPHIC STATE INDICATOR PROJECT--Continued
WATER-QUALITY DATA, WATER YEAR OCTOBER 2001 TO SEPTEMBER 2002 ANC ANC NITRO- NITRO- NITRO- NITRO- NITRO- ORTHO- CHLOR-A CHLOR-B BICAR- CAR- GEN, GEN,AM- GEN,AM- GEN, GEN, PHOS- PHOS- PHYTO- PHYTO- BONATE BONATE AMMONIA MONIA + MONIA + NO2+NO3 NITRITE PHORUS PHATE, PHOS- PLANK- PLANK- IT IT DIS- ORGANIC ORGANIC DIS- DIS- DIS- DIS- PHORUS TON TON Data FIELD FIELD SOLVED DIS. TOTAL SOLVED SOLVED SOLVED SOLVED TOTAL CHROMO CHROMO base Date MG/L AS MG/L AS (MG/L (MG/L (MG/L (MG/L (MG/L (MG/L (MG/L (MG/L FLUOROM FLUOROM number HCO3 CO3 AS N) AS N) AS N) AS N) AS N) AS P) AS P) AS P) (UG/L) (UG/L) (00450) (00447) (00608) (00623) (00625) (00631) (00613) (00666) (00671) (00665) (70953) (70954) 482607092511701 KABETOGAMA LK AT MOUTH OF MEADWOOD BAY NR RAY MN (LAT 48 26 07N LONG 092 51 17W) OCT 2001 02... -- -- -- -- -- -- -- -- -- .037 2.8 <.1 01 17... -- -- -- -- -- -- -- -- -- .046 2.8 <.1 01 MAY 2002 03... -- -- -- -- -- -- -- -- -- -- -- -- 01 14... 55 0 <.015 .37 .48 .035 E.002 .007 <.007 .025 2.7 <.1 01 30... -- -- -- -- -- -- -- -- -- -- 2.5 <.1 01 JUN 12... -- -- -- -- -- -- -- -- -- .017 -- -- 01 26... -- -- -- -- -- -- -- -- -- .018 1.5 .1 01 JUL 09... -- -- -- -- -- -- -- -- -- .028 -- -- 01 23... -- -- -- -- -- -- -- -- -- .025 -- -- 01 AUG 06... -- -- -- -- -- -- -- -- -- .033 4.9 <.1 01 21... 50 0 <.015 .44 .78 <.013 <.002 .018 .007 .053 22.1 <.1 01 SEP 05... -- -- -- -- -- -- -- -- -- .043 -- -- 01 17... -- -- -- -- -- -- -- -- -- .063 -- -- 01 30... -- -- -- -- -- -- -- -- -- .049 -- -- 01 482616092372201 NAMAKAN LAKE NEAR RAY, MN (LAT 48 26 16N LONG 092 37 22W) MAY 2002 14... -- -- <.015 <.10 <.10 <.013 <.002 <.004 <.007 <.004 -- -- 77 14... 19 0 E.014 .33 .38 .092 E.002 .005 <.007 .014 2.1 <.1 01 AUG 21... 20 0 E.009 .33 .53 .055 E.002 .005 <.007 .028 1.9 <.1 01 482226092283301 SANDPOINT LK BL HARRISON NARROWS NR CRANE LK, MN (LAT 48 22 26N LONG 092 28 33W) MAY 2002 14... 28 0 <.015 .47 .49 .143 .004 .012 <.007 .020 1.0 <.1 01 AUG 21... 27 0 E.011 .44 .50 .052 .003 .009 <.007 .012 3.0 <.1 01 483622092560701 RAINY LK AT BRULE NARROWS NR INTERNTNL FALLS, MN (LAT 48 36 22N LONG 092 56 07W) MAY 2002 13... 18 0 <.015 .29 .39 .087 <.002 .005 <.007 .012 -- -- 77 13... 19 0 <.015 .32 .37 .087 E.002 .005 <.007 .011 1.1 <.01 01 AUG 20... 19 0 <.015 .34 .37 .094 E.002 .006 <.007 .038 1.2 <.1 01

307 WATER QUALITY DATA
MISCELLANEOUS SITES--Continued
RAIN GARDENS PROJECT
WATER-QUALITY DATA, WATER YEAR OCTOBER 2001 TO SEPTEMBER 2002 BARO- OXYGEN, PH SPE- RESIDUE METRIC DIS- WATER CIFIC SPE- CHLO- TOTAL PRES- SOLVED WHOLE CON- CIFIC RIDE, AT 105 SURE OXYGEN, (PER- FIELD DUCT- CON- TEMPER- TEMPER- DIS- DEG. C, SAMPLE (MM DIS- CENT (STAND- ANCE DUCT- ATURE ATURE SOLVED SUS- Date Time TYPE OF SOLVED SATUR- ARD LAB ANCE AIR WATER (MG/L PENDED HG) (MG/L) ATION) UNITS) (US/CM) (US/CM) (DEG C) (DEG C) AS CL) (MG/L) (00025) (00300) (00301) (00400) (90095) (00095) (00020) (00010) (00940) (00530) 450943092593901 RAIN GARDEN, WELL NO.1 AT HUGO, MN (LAT 45 09 43N LONG 092 59 39W) AUG 2002 09... 1345 ENVIRONMENTAL 744 7.4 79 6.1 -- 120 24.0 17.9 3.62 -- 450943092593902 RAIN GARDEN, LYSIMETER NO.1, AT HUGO, MN (LAT 45 09 43N LONG 092 59 39W) AUG 2002 12... 1200 ENVIRONMENTAL -- -- -- -- 205 -- -- -- 3.98 -- 450943092593903 RAIN GARDEN, AUTO SAMPLER, AT HUGO, MN (LAT 45 09 43N LONG 092 59 39W) JUL 2002 27... 1600 ENVIRONMENTAL -- -- -- 7.9 -- 518 -- -- 9.82 <10 SEP 30... 1200 ENVIRONMENTAL -- -- -- -- 161 -- -- -- 2.75 13 450943092593904 RAIN GARDEN, SW GRAB, AT HUGO, MN (LAT 45 09 43N LONG 092 59 39W) JUN 2002 25... 1015 ENVIRONMENTAL 737 2.3 20 7.0 -- 104 26.5 20.7 2.39 86 450946092593901 RAIN GARDEN WELL NO. 2 AT HUGO, MN (LAT 45 09 46N LONG 092 59 39W) JUN 2002 25... 1230 ENVIRONMENTAL 737 10.0 89 6.3 -- 161 -- 13.7 10.9 -- 450946092593902 RAIN GARDEN, LYSIMETER NO. 2, AT HUGO, MN (LAT 45 09 46N LONG 092 59 39W) AUG 2002 09... 1200 ENVIRONMENTAL 743 -- -- -- 195 -- 27.0 -- 2.71 -- 443914093171801 RAIN GARDEN,WELL NO. 1, AT LAKEVILLE, MN (LAT 44 39 14N LONG 093 17 18W) SEP 2002 05... 1215 ENVIRONMENTAL -- -- -- -- 280 -- -- -- 5.08 -- 443914093171802 RAIN GARDEN,LYSIMETER NO.1,AT LAKVILLE, MN (LAT 44 39 14N LONG 093 17 18W) SEP 2002 05... 1200 ENVIRONMENTAL -- -- -- -- 416 -- -- -- 1.84 -- 443914093173602 RAIN GARDEN,LYSIMETER NO2(BKGRND) AT LAKEVILLE, MN (LAT 44 39 14N LONG 093 17 36W) SEP 2002 05... 1045 ENVIRONMENTAL -- -- -- -- 969 -- -- -- 38.0 --

308 WATER QUALITY DATA
MISCELLANEOUS SITES--Continued
RAIN GARDENS--Continued
WATER-QUALITY DATA, WATER YEAR OCTOBER 2001 TO SEPTEMBER 2002 SOLIDS, NITRO- NITRO- NITRO- NITRO- RESIDUE GEN, GEN,AM- GEN, GEN, PHOS- AT 180 AMMONIA MONIA + NO2+NO3 NITRITE PHORUS PHOS- DEG. C DIS- ORGANIC DIS- DIS- DIS- PHORUS DIS- SOLVED TOTAL SOLVED SOLVED SOLVED TOTAL Date SOLVED (MG/L (MG/L (MG/L (MG/L (MG/L (MG/L (MG/L) AS N) AS N) AS N) AS N) AS P) AS P) (70300) (00608) (00625) (00631) (00613) (00666) (00665) 450943092593901 RAIN GARDEN, WELL NO.1 AT HUGO,MN (LAT 45 09 43N LONG 092 59 39W) AUG 2002 09... -- <.04 .15 1.79 <.008 .07 .17 450943092593902 RAIN GARDEN, LYSIMETER NO.1, AT HUGO, MN (LAT 45 09 43N LONG 092 59 39W) AUG 2002 12... -- <.04 .56 .07 .035 .10 .10 450943092593903 RAIN GARDEN, AUTO SAMPLER, AT HUGO, MN (LAT 45 09 43N LONG 092 59 39W) JUL 2002 27... 330 .51 -- .18 .084 1.03 -- SEP 30... 113 .17 1.3 1.13 .074 .16 .22 450943092593904 RAIN GARDEN, SW GRAB, AT HUGO, MN (LAT 45 09 43N LONG 092 59 39W) JUN 2002 25... 73 <.04 1.1 .11 E.005 .33 .65 450946092593901 RAIN GARDEN WELL NO. 2 AT HUGO, MN (LAT 45 09 46N LONG 092 59 39W) JUN 2002 25... -- <.04 .20 .98 <.008 E.06 .15 450946092593902 RAIN GARDEN, LYSIMETER NO. 2, AT HUGO, MN (LAT 45 09 46N LONG 092 59 39W) AUG 2002 09... -- .04 .35 1.09 <.008 E.05 E.03 443914093171801 RAIN GARDEN,WELL NO. 1, AT LAKEVILLE, MN (LAT 44 39 14N LONG 093 17 18W) SEP 2002 05... -- <.04 .23 .23 .042 <.06 E.03 443914093171802 RAIN GARDEN,LYSIMETER NO.1,AT LAKVILLE, MN (LAT 44 39 14N LONG 093 17 18W) SEP 2002 05... -- <.04 .49 1.19 .012 <.06 <.06 443914093173602 RAIN GARDEN,LYSIMETER NO2(BKGRND) AT LAKEVILLE, MN (LAT 44 39 14N LONG 093 17 36W) SEP 2002 05... -- .08 .44 .69 .008 E.03 E.04

309
Ground-Water Wells by County ______________
Ground-Water Levels
Water-quality sampling of groundwater well, July, 2002.

310
Figure 8. Location of ground-water wells.
Base from U.S. Geological Survey digital data1:2,000,000, 1972, Albers Equal-Area ConicProjection, standard parallels 29°30' and 45°30',Central meridian 93°30'
Lake
Superior
EXPLANATION
Surficial Sand and Gravel
�
SSG
SSG
Observation well (with identifier)
0 25 50 75 MILES
0 25 50 75 KILOMETERS
94°
92°
48°
46°
44°
92°
90°
96°
SSG
SSG
SSG
Moorhead
Duluth
�
Montevideo
�
Rochester�
Mankato
�St. Cloud
� St.Paul
�
Minneapolis
�
Moorhead
Grand Rapids
�Duluth
�
International Falls
�Bemidji
�

GROUND WATER LEVELS 311
BELTRAMI COUNTY
473423095053301. Local number, 147N35W02CDCBDD.
LOCATION.-- Lat 47°34’23", long 95°05’33", in SW 1⁄4 SE 1⁄4 SW
1⁄4 sec.2, T.147 N., R.35 W., Hydrologic Unit 07010101, northwest of Bemidji. Owner: U.S. Geological SurveyAQUIFER.-- Surficial outwash sand and gravel of Pleistocene Age.WELL CHARACTERISTICS.-- Drilled water-table observation well, diameter 2 in., depth 34.83 ft., screened 30 to 33 ft.INSTRUMENTATION.-- Monthly measurements by USGS; continuous recordings with a data logger.DATUM.-- Land-surface datum is 1,420.49 ft above sea level. Measuring point: floor of shelter, 2.70 ft above land-surface datum.REMARKS.-- Well number 310D, at crude-oil spill site near Bemidji.PERIOD OF RECORD.-- Apr. 1983 to current year.EXTREMES FOR PERIOD OF RECORD.-- Highest water level observed, 27.59 ft. below land-surface datum Jun. 21, 2001; lowest observed, 30.69 ft. below land-surface datum, Feb. 27, 1997.EXTREMES FOR CURRENT WATER YEAR.-- Highest water level observed, 28.89 ft. below land-surface datum, Oct. 29; lowest observed, 29.54 ft. below land-surface datum, Mar 22.REVISIONS.-- Ground-water levels for water year 2001 were published in meters, those values are reported in feet below land-surface datum in the following table.
WATER LEVELS IN FEET BELOW LAND SURFACE DATUM, WATER YEAR OCTOBER 2000 TO SEPTEMBER 2001 WATER WATER WATER WATER WATER WATER DATE LEVEL DATE LEVEL DATE LEVEL DATE LEVEL DATE LEVEL DATE LEVEL OCT 23 29.38 DEC 28 29.06 FEB 19 29.33 APR 30 28.89 JUN 21 27.59 AUG 27 28.46 NOV 29 28.89 JAN 23 29.20 MAR 15 29.44 MAY 30 28.05 JUL 26 28.14 SEP 25 28.69 WATER YEAR 2001 HIGHEST 27.59 JUN 21, 2001 LOWEST 29.44 MAR 15, 2001
WATER LEVELS IN FEET BELOW LAND SURFACE DATUM, WATER YEAR OCTOBER 2001 TO SEPTEMBER 2002 WATER WATER WATER WATER WATER WATER DATE LEVEL DATE LEVEL DATE LEVEL DATE LEVEL DATE LEVEL DATE LEVEL OCT 29 28.89 DEC 19 29.07 FEB 27 29.44 APR 29 29.41 JUN 26 29.17 AUG 26 29.15 NOV 28 28.99 JAN 25 29.29 MAR 22 29.54 MAY 22 29.29 JUL 22 28.97 SEP 25 29.20 WATER YEAR 2002 HIGHEST 28.89 OCT 29, 2001 LOWEST 29.54 MAR 22, 2002
O N D2001
J F M A M J J A S2002
29.6
29.5
29.4
29.3
29.2
29.1
29
28.9
28.8
WATER LEVEL,
IN FEET BELOW LAND SURFACE
Trend line

GROUND WATER LEVELS-Continued312
MORRISON COUNTY
460444094212501. Local number, 130N29W08DCC01.
LOCATION.-- Lat 46°04’44", long 94°21’25", in SW 1⁄4 SW 1⁄4 SE
1⁄4 sec.8, T.130 N., R.29 W., Hydrologic Unit 07010104, at Camp Ripley. Owner: Minnesota Army National Guard, Camp Ripley.AQUIFER.-- Surficial outwash sand and gravel of Pleistocene Age.WELL CHARACTERISTICS.-- Drilled water-table observation well, diameter 2 in., depth 59 ft, screened 56 to 59 ft.INSTRUMENTATION.-- Monthly measurements by observer.DATUM.-- Land-surface datum is 1,149.0 ft above sea level. Measuring point: Top of casing, 2.10 ft above land-surface datum.REMARKS.-- Water levels used in monthly National Water Conditions Report.PERIOD OF RECORD.-- Apr. 1949 to current year.EXTREMES FOR PERIOD OF RECORD.-- Highest water level observed, 7.35 ft below land-surface datum, July 28, 1972; lowest observed, 19.75 ft below land-surface datum, Aug. 4, 1961.EXTREMES FOR CURRENT WATER YEAR.-- Highest water level observed, 10.06 ft below land-surface datum, Sep. 19; lowest observed, 12.36 ft below land-surface datum, Mar. 1.
WATER LEVELS IN FEET BELOW LAND SURFACE DATUM, WATER YEAR OCTOBER 2001 TO SEPTEMBER 2002 WATER WATER WATER WATER WATER DATE LEVEL DATE LEVEL DATE LEVEL DATE LEVEL DATE LEVEL NOV 07 11.09 JAN 02 11.91 FEB 01 12.05 APR 08 12.29 JUL 24 10.15 DEC 11 11.64 29 12.09 MAR 01 12.36 MAY 29 11.50 SEP 19 10.06
O N D2001
J F M A M J J A S2002
12.5
12
11.5
11
10.5
10
WATER LEVEL,
IN FEET BELOW LAND SURFACE
Trend line

GROUND WATER LEVELS--Continued 313
WATONWAN COUNTY
440037094372601. Local number, 106N32W01DDB01.
LOCATION.-- Lat 44°00’37", long 94°37’26", in NW 1⁄4 SE 1⁄4 SE
1⁄4 sec.1, T.106 N., R.32 W., Hydrologic Unit 07020010, north of St. James. Owner: U.S. Geological Survey.AQUIFER.-- Surficial outwash sand and gravel of Pleistocene Age.WELL CHARACTERISTICS.-- Drilled water-table observation well, diameter 2 in., depth 22 ft, screened 19 to 22 ft.INSTRUMENTATION.-- Monthly measurements by observer.DATUM.-- Land-surface datum is 1,056.2 ft above sea level. Measuring point: Top of casing, 4.80 ft above land-surface datum.REMARKS.-- Water levels used in monthly National Water Conditions Report.PERIOD OF RECORD.-- Nov. 1965 to current year.EXTREMES FOR PERIOD OF RECORD.-- Highest observed water level, 4.11 ft below land-surface datum, Apr. 27, 1969; lowest observed, 16.22 ft below land-surface datum, Mar. 7, 1990.EXTREMES FOR CURRENT WATER YEAR.-- Highest water level observed, 9.20 ft below land-surface datum, Jul. 30; lowest observed, 12.20 ft below land-surface datum, Sep. 30.
WATER LEVELS IN FEET BELOW LAND SURFACE DATUM, WATER YEAR OCTOBER 2001 TO SEPTEMBER 2002 WATER WATER WATER WATER WATER DATE LEVEL DATE LEVEL DATE LEVEL DATE LEVEL DATE LEVEL OCT 30 10.50 DEC 30 11.00 APR 30 11.74 JUN 30 11.70 AUG 30 10.20 NOV 30 10.66 MAR 30 11.76 MAY 30 11.80 JUL 30 9.20 SEP 30 12.20
O N D2001
J F M A M J J A S2002
12.5
12
11.5
11
10.5
10
9.5
9
WATER LEVEL,
IN FEET BELOW LAND SURFACE
Trend line

314 QUALITY OF GROUND WATER
MULTIPLE STATION ANALYSIS
WATER-QUALITY DATA, WATER YEAR OCTOBER 2001 TO SEPTEMBER 2002 TUR- BARO- OXYGEN, PH PH BID- METRIC DIS- WATER WATER Local DEPTH ITY PRES- SOLVED WHOLE WHOLE ident- OF FIELD SURE OXYGEN, (PER- FIELD LAB i- Sample WELL, WATER (MM DIS- CENT (STAND- (STAND- fier Date Time type TOTAL UNFLTRD OF SOLVED SATUR- ARD ARD (FEET) (NTU) HG) (MG/L) ATION) UNITS) UNITS) (72008) (61028) (00025) (00300) (00301) (00400) (00403) ANOKA COUNTY 031N24W08CCD 01 CR-G 07-08-02 1400 ENVIRONMENTAL 14 2.7 741 7.5 73 6.6 6.8 032N24W33BDC 01 CR-A 07-09-02 1000 ENVIRONMENTAL 20.75 .4 744 5.1 52 7.3 7.3 BELTRAMI COUNTY 146N30W34BBB 00FLUS-04 07-23-02 0920 ENVIRONMENTAL 13 .9 739 -- -- 8.2 8.0 CASS COUNTY 144N31W25BBDC 01FLUS-01 07-22-02 1430 ENVIRONMENTAL 17 2.2 731 -- -- 7.0 7.1 HENNEPIN COUNTY 118N21W01CBB 01 HN-N 07-10-02 1000 ENVIRONMENTAL 18 -- 745 .8 8 7.1 7.3 119N21W32ACB 01 HN-K 07-11-02 1000 ENVIRONMENTAL 22.5 .8 749 4.6 44 7.2 7.4 07-11-02 1005 BLANK 22.5 -- 749 -- -- -- 8.0 119N21W28DCD 01 HN-I 07-09-02 1330 ENVIRONMENTAL 18 1.0 743 .0 0 7.1 7.0 SHERBURNE COUNTY 033N28W26DCB 01ALUS-21 08-02-02 1200 ENVIRONMENTAL 35 2.3 735 9.9 94 7.1 7.5 033N27W16DCC 01ALUS-30 07-11-02 1330 ENVIRONMENTAL 9 18 747 4.6 46 7.5 7.6 07-11-02 1331 REPLICATE 9 18 747 4.6 46 7.5 7.5 07-11-02 1332 SPIKE 9 -- -- -- -- -- -- 033N28W13DCC 01ALUS-19 07-30-02 1045 ENVIRONMENTAL 24.2 3.8 736 .8 8 6.9 -- 034N29W30DDA 01ALUS-02 08-01-02 1115 ENVIRONMENTAL 20.5 1.5 736 2.6 25 7.0 7.3 034N29W14BBB 01ALUS-07 08-01-02 1400 ENVIRONMENTAL 15.5 7.8 736 7.7 72 7.5 7.7
SPE- ALKA- BICAR- CIFIC SPE- MAGNE- POTAS- LINITY BONATE Local CON- CIFIC CALCIUM SIUM, SIUM, SODIUM, WAT DIS WATER ident- DUCT- CON- TEMPER- TEMPER- DIS- DIS- DIS- DIS- TOT IT DIS IT i- ANCE DUCT- ATURE ATURE SOLVED SOLVED SOLVED SOLVED FIELD FIELD fier Date LAB ANCE AIR WATER (MG/L (MG/L (MG/L (MG/L MG/L AS MG/L AS (US/CM) (US/CM) (DEG C) (DEG C) AS CA) AS MG) AS K) AS NA) CACO3 HCO3 (90095) (00095) (00020) (00010) (00915) (00925) (00935) (00930) (39086) (00453) ANOKA COUNTY 031N24W08CCD 01 07-08-02 308 341 25.0 13.2 37.9 12.6 1.62 7.13 74 93 032N24W33BDC 01 07-09-02 428 437 25.0 16.5 64.3 13.1 1.39 4.77 175 216 BELTRAMI COUNTY 146N30W34BBB 00F 07-23-02 215 212 19.0 9.1 33.2 6.77 .36 2.08 109 132 CASS COUNTY 144N31W25BBDC 01F 07-22-02 280 212 21.5 10.5 37.6 7.60 .98 2.74 124 151 HENNEPIN COUNTY 118N21W01CBB 01 07-10-02 1670 1660 18.5 12.2 145 37.9 4.40 127 271 331 119N21W32ACB 01 07-11-02 952 992 20.0 12.0 88.9 19.7 1.78 99.9 -- -- 07-11-02 <3 -- 20.0 -- .04 <.008 <.10 E.07 -- -- 119N21W28DCD 01 07-09-02 1320 1360 29.0 12.8 123 35.8 4.39 101 326 397 SHERBURNE COUNTY 033N28W26DCB 01A 08-02-02 938 969 24.5 11.6 138 34.3 1.29 5.79 208 254 033N27W16DCC 01A 07-11-02 543 552 26.0 14.6 67.3 15.6 .85 22.4 171 209 07-11-02 549 552 26.0 14.6 67.6 15.6 .84 20.9 171 209 07-11-02 -- -- -- -- -- -- -- -- -- -- 033N28W13DCC 01A 07-30-02 -- 404 27.5 12.3 -- -- -- -- 210 257 034N29W30DDA 01A 08-01-02 754 790 27.0 11.0 115 31.7 1.89 4.86 267 326 034N29W14BBB 01A 08-01-02 359 350 26.5 10.4 45.5 14.9 16.0 2.15 180 220

315 QUALITY OF GROUND WATER
MULTIPLE STATION ANALYSIS--Continued
WATER-QUALITY DATA, WATER YEAR OCTOBER 2001 TO SEPTEMBER 2002 CAR- SOLIDS, NITRO- NITRO- NITRO- BONATE CHLO- FLUO- SILICA, RESIDUE GEN, GEN,AM- GEN, Local WATER BROMIDE RIDE, RIDE, DIS- SULFATE AT 180 AMMONIA MONIA + NO2+NO3 ident- DIS IT DIS- DIS- DIS- SOLVED DIS- DEG. C DIS- ORGANIC DIS- i- FIELD SOLVED SOLVED SOLVED (MG/L SOLVED DIS- SOLVED DIS. SOLVED fier Date MG/L AS (MG/L (MG/L (MG/L AS (MG/L SOLVED (MG/L (MG/L (MG/L CO3 AS BR) AS CL) AS F) SIO2) AS SO4) (MG/L) AS N) AS N) AS N) (00452) (71870) (00940) (00950) (00955) (00945) (70300) (00608) (00623) (00631) ANOKA COUNTY 031N24W08CCD 01 07-08-02 0 <.03 12.8 .1 20.6 25.4 246 <.04 .27 12.4 032N24W33BDC 01 07-09-02 0 <.03 7.43 E.1 18.6 7.8 250 <.04 .10 6.57 BELTRAMI COUNTY 146N30W34BBB 00F 07-23-02 0 <.03 .55 E.1 18.8 4.2 124 <.04 E.05 <.05 CASS COUNTY 144N31W25BBDC 01F 07-22-02 0 E.02 .81 E.1 19.7 8.3 151 <.04 E.06 E.03 HENNEPIN COUNTY 118N21W01CBB 01 07-10-02 0 .10 293 E.1 19.6 99.1 1010 .08 .31 4.74 119N21W32ACB 01 07-11-02 0 .06 90.8 <.1 28.8 23.5 597 <.04 .15 4.93 07-11-02 -- <.03 <.30 <.1 .15 <.1 <10 <.04 <.10 <.05 119N21W28DCD 01 07-09-02 0 .04 212 .26 21.2 44.3 790 <.04 .33 1.95 SHERBURNE COUNTY 033N28W26DCB 01A 08-02-02 0 .11 46.1 E.1 19.7 75.1 697 <.04 .11 37.9 033N27W16DCC 01A 07-11-02 0 <.03 61.3 E.1 14.8 10.9 313 <.04 .17 .48 07-11-02 -- <.03 61.8 .1 14.8 10.5 314 <.04 .14 .51 07-11-02 -- -- -- -- -- -- -- -- -- -- 033N28W13DCC 01A 07-30-02 0 -- -- -- -- -- -- <.04 E.09 1.02 034N29W30DDA 01A 08-01-02 0 .04 29.9 .1 19.0 38.0 513 <.04 .25 21.1 034N29W14BBB 01A 08-01-02 0 <.03 3.73 .2 10.0 5.5 209 <.04 .11 .64
NITRO- ORTHO- GEN, PHOS- PHOS- ALUM- ANTI- BERYL- Local NITRITE PHORUS PHATE, INUM, MONY, ARSENIC BARIUM, LIUM, BORON, CADMIUM ident- DIS- DIS- DIS- DIS- DIS- DIS- DIS- DIS- DIS- DIS- i- SOLVED SOLVED SOLVED SOLVED SOLVED SOLVED SOLVED SOLVED SOLVED SOLVED fier Date (MG/L (MG/L (MG/L (UG/L (UG/L (UG/L (UG/L (UG/L (UG/L (UG/L AS N) AS P) AS P) AS AL) AS SB) AS AS) AS BA) AS BE) AS B) AS CD) (00613) (00666) (00671) (01106) (01095) (01000) (01005) (01010) (01020) (01025) ANOKA COUNTY 031N24W08CCD 01 07-08-02 <.008 -- .03 1 .23 .3 44 <.06 15 .16 032N24W33BDC 01 07-09-02 <.008 -- E.02 1 <.05 .3 37 <.06 14 <.04 BELTRAMI COUNTY 146N30W34BBB 00F 07-23-02 <.008 -- .05 <1 .10 E.1 2 <.06 9 <.04 CASS COUNTY 144N31W25BBDC 01F 07-22-02 <.008 -- E.02 <1 .09 E.1 27 <.06 E5 E.02 HENNEPIN COUNTY 118N21W01CBB 01 07-10-02 .011 -- <.02 <1 .41 1.6 118 <.06 42 .11 119N21W32ACB 01 07-11-02 <.008 -- .08 <1 .11 2.1 110 <.06 38 <.04 07-11-02 <.008 -- <.02 <1 E.04 <.2 <1 <.06 <7 <.04 119N21W28DCD 01 07-09-02 .018 -- <.02 <1 1.54 1.5 299 <.06 49 .06 SHERBURNE COUNTY 033N28W26DCB 01A 08-02-02 <.008 .012 E.01 <1 E.04 .5 123 <.06 42 <.04 033N27W16DCC 01A 07-11-02 <.008 -- .06 2 .18 1.0 30 <.06 12 <.04 07-11-02 <.008 -- .05 2 .17 .9 30 <.06 12 <.04 07-11-02 -- -- -- -- -- -- -- -- -- -- 033N28W13DCC 01A 07-30-02 .023 -- <.02 -- -- -- -- -- -- -- 034N29W30DDA 01A 08-01-02 .054 -- .03 <1 .07 .7 47 <.06 29 <.04 034N29W14BBB 01A 08-01-02 <.008 -- <.02 <1 .10 E.1 50 <.06 23 <.04

316 QUALITY OF GROUND WATER
MULTIPLE STATION ANALYSIS--Continued
WATER-QUALITY DATA, WATER YEAR OCTOBER 2001 TO SEPTEMBER 2002 CHRO- MANGA- MOLYB- SELE- Local MIUM, COBALT, COPPER, IRON, LEAD, LITHIUM NESE, DENUM, NICKEL, NIUM, ident- DIS- DIS- DIS- DIS- DIS- DIS- DIS- DIS- DIS- DIS- i- SOLVED SOLVED SOLVED SOLVED SOLVED SOLVED SOLVED SOLVED SOLVED SOLVED fier Date (UG/L (UG/L (UG/L (UG/L (UG/L (UG/L (UG/L (UG/L (UG/L (UG/L AS CR) AS CO) AS CU) AS FE) AS PB) AS LI) AS MN) AS MO) AS NI) AS SE) (01030) (01035) (01040) (01046) (01049) (01130) (01056) (01060) (01065) (01145) ANOKA COUNTY 031N24W08CCD 01 07-08-02 E.5 .73 4.3 <10 <.08 1.6 .5 .3 3.31 .6 032N24W33BDC 01 07-09-02 1.1 .17 3.2 <10 <.08 .9 .1 E.2 .81 1.3 BELTRAMI COUNTY 146N30W34BBB 00F 07-23-02 <.8 .12 1.9 <10 E.05 .5 11.8 <.2 .40 <.3 CASS COUNTY 144N31W25BBDC 01F 07-22-02 <.8 .27 3.6 93 .38 .8 56.3 <.2 2.13 E.2 HENNEPIN COUNTY 118N21W01CBB 01 07-10-02 <.8 1.67 5.9 966 <.08 7.1 1290 .5 3.34 1.4 119N21W32ACB 01 07-11-02 E.7 .18 2.5 <10 .10 4.7 .3 E.1 .31 .4 07-11-02 <.8 <.02 3.2 <10 <.08 <.3 .1 <.2 .11 <.3 119N21W28DCD 01 07-09-02 <.8 4.19 5.1 28 <.08 6.3 1330 1.5 19.1 2.0 SHERBURNE COUNTY 033N28W26DCB 01A 08-02-02 <.8 .33 5.0 <10 <.08 2.3 E.1 E.1 2.19 E.2 033N27W16DCC 01A 07-11-02 E1.3 .17 3.8 <10 E.04 1.0 .2 1.9 .42 .6 07-11-02 <.8 .16 3.1 <10 E.04 1.0 .2 1.6 .46 .6 07-11-02 -- -- -- -- -- -- -- -- -- -- 033N28W13DCC 01A 07-30-02 -- -- -- -- -- -- -- -- -- -- 034N29W30DDA 01A 08-01-02 <.8 .29 5.6 <10 <.08 2.2 .2 <.2 2.42 .9 034N29W14BBB 01A 08-01-02 <.8 .16 5.3 <10 <.08 1.2 .9 .5 1.38 E.2
1METHYL 2,6-DI- 26DIMET 2METHYL STRON- THAL- VANA- NAPH- ETHYL NAPH- NAPH- Local SILVER, TIUM, LIUM, DIUM, ZINC, 1,4-DI- THALENE ANILINE THALENE THALENE ident- DIS- DIS- DIS- DIS- DIS- CHLORO- WATER, WAT FLT WATER, WATER, i- SOLVED SOLVED SOLVED SOLVED SOLVED BENZENE FLTERD 0.7 U FLTERD FLTERD fier Date (UG/L (UG/L (UG/L (UG/L (UG/L DISSOLV REC GF, REC REC REC AS AG) AS SR) AS TL) AS V) AS ZN) (UG/L) (UG/L) (UG/L) (UG/L) (UG/L) (01075) (01080) (01057) (01085) (01090) (34572) (62054) (82660) (62055) (62056) ANOKA COUNTY 031N24W08CCD 01 07-08-02 <1 48.8 <.04 4.5 2 -- -- <.006 -- -- 032N24W33BDC 01 07-09-02 <1 146 <.04 1.6 <1 -- -- <.006 -- -- BELTRAMI COUNTY 146N30W34BBB 00F 07-23-02 <1 42.2 <.04 1.0 121 -- -- <.006 -- -- CASS COUNTY 144N31W25BBDC 01F 07-22-02 <1 65.5 <.04 .5 3740 -- -- <.006 -- -- HENNEPIN COUNTY 118N21W01CBB 01 07-10-02 <1 173 .05 .7 2 -- -- -- -- -- 119N21W32ACB 01 07-11-02 <1 137 <.04 1.8 1 -- -- <.006 -- -- 07-11-02 <1 .09 <.04 <.2 2 -- -- <.006 -- -- 119N21W28DCD 01 07-09-02 <1 283 .12 7.9 3 -- -- <.006 -- -- SHERBURNE COUNTY 033N28W26DCB 01A 08-02-02 <1 121 <.04 1.2 1 -- -- <.006 -- -- 033N27W16DCC 01A 07-11-02 <1 68.2 <.04 1.3 <1 -- -- <.006 -- -- 07-11-02 <1 68.2 <.04 1.2 <1 -- -- -- -- -- 07-11-02 -- -- -- -- -- -- -- .101 -- -- 033N28W13DCC 01A 07-30-02 -- -- -- -- -- -- -- <.006 -- -- 034N29W30DDA 01A 08-01-02 <1 117 <.04 2.3 2 -- -- E.002 -- -- 034N29W14BBB 01A 08-01-02 <1 48.2 <.04 1.1 1 -- -- <.006 -- --

317 QUALITY OF GROUND WATER
MULTIPLE STATION ANALYSIS--Continued
WATER-QUALITY DATA, WATER YEAR OCTOBER 2001 TO SEPTEMBER 2002 3-BETA- 3METHYL 4-TERT- 5METHYL AHT COPRO- 1(H)- 3-TERT- 4-CUMYL 4-OCTYL OCTYL- 1HBENZO ACETO- ACETO- NAPH- Local STANOL, INDOLE, BHA, PHENOL, PHENOL, PHENOL, TRIAZLE CHLOR, PHENONE THALENE ident- WATER, WATER, WATER, WATER, WATER, WATER, WATER, WATER WATER, WATER, i- FLTERD FLTERD FLTERD FLTERD FLTERD FLTERD FLTERD FLTRD FLTERD FLTERD fier Date REC REC REC REC REC REC REC REC REC REC (UG/L) (UG/L) (UG/L) (UG/L) (UG/L) (UG/L) (UG/L) (UG/L) (UG/L) (UG/L) (62057) (62058) (62059) (62060) (62061) (62062) (62063) (49260) (62064) (62065) ANOKA COUNTY 031N24W08CCD 01 07-08-02 -- -- -- -- -- -- -- <.006 -- -- 032N24W33BDC 01 07-09-02 -- -- -- -- -- -- -- <.006 -- -- BELTRAMI COUNTY 146N30W34BBB 00F 07-23-02 -- -- -- -- -- -- -- <.006 -- -- CASS COUNTY 144N31W25BBDC 01F 07-22-02 -- -- -- -- -- -- -- <.006 -- -- HENNEPIN COUNTY 118N21W01CBB 01 07-10-02 -- -- -- -- -- -- -- -- -- -- 119N21W32ACB 01 07-11-02 -- -- -- -- -- -- -- <.006 -- -- 07-11-02 -- -- -- -- -- -- -- <.006 -- -- 119N21W28DCD 01 07-09-02 -- -- -- -- -- -- -- <.006 -- -- SHERBURNE COUNTY 033N28W26DCB 01A 08-02-02 -- -- -- -- -- -- -- <.006 -- -- 033N27W16DCC 01A 07-11-02 -- -- -- -- -- -- -- <.006 -- -- 07-11-02 -- -- -- -- -- -- -- -- -- -- 07-11-02 -- -- -- -- -- -- -- .118 -- -- 033N28W13DCC 01A 07-30-02 -- -- -- -- -- -- -- <.006 -- -- 034N29W30DDA 01A 08-01-02 -- -- -- -- -- -- -- <.006 -- -- 034N29W14BBB 01A 08-01-02 -- -- -- -- -- -- -- <.006 -- --
BEN- BETA- ALA- ANTHRA- ATRA- FLUR- BENZO- SITOS- BISPHE- Local CHLOR, ALPHA QUINONE ZINE, ALIN BENZO- PHENONE TEROL, NOL A, ident- WATER, BHC ANTHRA- WATER, WATER, WAT FLD A- WATER, WATER, WATER, i- DISS, DIS- CENE FLTERD DISS, 0.7 U PYRENE FLTERD FLTERD FLTERD fier Date REC, SOLVED DISSOLV REC REC GF, REC DISSOLV REC REC REC (UG/L) (UG/L) (UG/L) (UG/L) (UG/L) (UG/L) (UG/L) (UG/L) (UG/L) (UG/L) (46342) (34253) (34221) (62066) (39632) (82673) (34248) (62067) (62068) (62069) ANOKA COUNTY 031N24W08CCD 01 07-08-02 <.004 <.005 -- -- <.007 <.010 -- -- -- -- 032N24W33BDC 01 07-09-02 <.004 <.005 -- -- <.007 <.010 -- -- -- -- BELTRAMI COUNTY 146N30W34BBB 00F 07-23-02 <.004 <.005 -- -- <.007 <.010 -- -- -- -- CASS COUNTY 144N31W25BBDC 01F 07-22-02 <.004 <.005 -- -- <.007 <.010 -- -- -- -- HENNEPIN COUNTY 118N21W01CBB 01 07-10-02 -- -- -- -- -- -- -- -- -- -- 119N21W32ACB 01 07-11-02 <.004 <.005 -- -- .054 <.010 -- -- -- -- 07-11-02 <.004 <.005 -- -- <.007 <.010 -- -- -- -- 119N21W28DCD 01 07-09-02 <.004 <.005 -- -- <.007 <.010 -- -- -- -- SHERBURNE COUNTY 033N28W26DCB 01A 08-02-02 <.004 <.005 -- -- .224 <.010 -- -- -- -- 033N27W16DCC 01A 07-11-02 <.004 <.005 -- -- <.007 <.010 -- -- -- -- 07-11-02 -- -- -- -- -- -- -- -- -- -- 07-11-02 .118 .112 -- -- .125 .089 -- -- -- -- 033N28W13DCC 01A 07-30-02 <.004 <.005 -- -- .024 <.010 -- -- -- -- 034N29W30DDA 01A 08-01-02 <.004 <.005 -- -- .033 <.010 -- -- -- -- 034N29W14BBB 01A 08-01-02 <.004 <.005 -- -- E.003 <.010 -- -- -- --

318 QUALITY OF GROUND WATER
MULTIPLE STATION ANALYSIS--Continued
WATER-QUALITY DATA, WATER YEAR OCTOBER 2001 TO SEPTEMBER 2002 BISPHEN CAFFE- CAR- CARBO- OL A-D3 BRO- BUTYL- CAF- INE-C13 BARYL CARBA- FURAN Local SURRGTE MACIL, ATE, FEINE, SURRGTE CAMPHOR WATER ZOLE, WATER ident- S2033/ WATER, BROMO- WATER, WATER S2033/ WATER, FLTRD WATER, FLTRD i- 8033 DISS, FORM DISS, FLTRD 8033 FLTERD 0.7 U FLTERD 0.7 U fier Date WAT FLT REC DISSOLV REC REC WAT FLT REC GF, REC REC GF, REC PERCENT (UG/L) (UG/L) (UG/L) (UG/L) PERCENT (UG/L) (UG/L) (UG/L) (UG/L) (99583) (04029) (34288) (04028) (50305) (99584) (62070) (82680) (62071) (82674) ANOKA COUNTY 031N24W08CCD 01 07-08-02 -- -- -- <.002 -- -- -- <.041 -- <.020 032N24W33BDC 01 07-09-02 -- -- -- <.002 -- -- -- <.041 -- <.020 BELTRAMI COUNTY 146N30W34BBB 00F 07-23-02 -- -- -- <.002 -- -- -- <.041 -- <.020 CASS COUNTY 144N31W25BBDC 01F 07-22-02 -- -- -- <.002 -- -- -- <.041 -- <.020 HENNEPIN COUNTY 118N21W01CBB 01 07-10-02 -- -- -- -- -- -- -- -- -- -- 119N21W32ACB 01 07-11-02 -- -- -- <.002 -- -- -- <.041 -- <.020 07-11-02 -- -- -- <.002 -- -- -- <.041 -- <.020 119N21W28DCD 01 07-09-02 -- -- -- <.002 -- -- -- <.041 -- <.020 SHERBURNE COUNTY 033N28W26DCB 01A 08-02-02 -- -- -- <.002 -- -- -- <.041 -- <.020 033N27W16DCC 01A 07-11-02 -- -- -- <.002 -- -- -- <.041 -- <.020 07-11-02 -- -- -- -- -- -- -- -- -- -- 07-11-02 -- -- -- .110 -- -- -- E.132 -- E.121 033N28W13DCC 01A 07-30-02 -- -- -- <.002 -- -- -- <.041 -- <.020 034N29W30DDA 01A 08-01-02 -- -- -- <.002 -- -- -- <.041 -- <.020 034N29W14BBB 01A 08-01-02 -- -- -- <.002 -- -- -- <.041 -- <.020
DCFLBI- DEETHYL DIAZ- CHOLES- COT- CYANA- DCPA PHENYL, ATRA- INON Local CHLOR- TEROL, ININE, ZINE, WATER SURRGTE ZINE, D10 SRG DI- DI- ident- PYRIFOS WATER, WATER, WATER, FLTRD S2033/ WATER, WAT FLT AZINON, ELDRIN i- DIS- FLTERD FLTERD DISS, 0.7 U 8033 DISS, 0.7 U DIS- DIS- fier Date SOLVED REC REC REC GF, REC WAT FLT REC GF, REC SOLVED SOLVED (UG/L) (UG/L) (UG/L) (UG/L) (UG/L) PERCENT (UG/L) PERCENT (UG/L) (UG/L) (38933) (62072) (62005) (04041) (82682) (99585) (04040) (91063) (39572) (39381) ANOKA COUNTY 031N24W08CCD 01 07-08-02 <.005 -- -- <.018 <.003 -- <.006 117 <.005 <.005 032N24W33BDC 01 07-09-02 <.005 -- -- <.018 <.003 -- E.006 109 <.005 <.005 BELTRAMI COUNTY 146N30W34BBB 00F 07-23-02 <.005 -- -- <.018 <.003 -- <.006 100 <.005 <.005 CASS COUNTY 144N31W25BBDC 01F 07-22-02 <.005 -- -- <.018 <.003 -- <.006 96.2 <.005 <.005 HENNEPIN COUNTY 118N21W01CBB 01 07-10-02 -- -- -- -- -- -- -- -- -- -- 119N21W32ACB 01 07-11-02 <.005 -- -- <.018 <.003 -- E.025 114 <.005 <.005 07-11-02 <.005 -- -- <.018 <.003 -- <.006 102 <.005 <.005 119N21W28DCD 01 07-09-02 <.005 -- -- <.018 <.003 -- <.006 120 <.005 <.005 SHERBURNE COUNTY 033N28W26DCB 01A 08-02-02 <.005 -- -- <.018 <.003 -- E.086 113 <.005 <.005 033N27W16DCC 01A 07-11-02 <.005 -- -- <.018 <.003 -- E.007 116 <.005 <.005 07-11-02 -- -- -- -- -- -- -- -- -- -- 07-11-02 .052 -- -- .125 .121 -- E.070 114 .089 .104 033N28W13DCC 01A 07-30-02 <.005 -- -- <.018 <.003 -- E.010 106 <.005 <.005 034N29W30DDA 01A 08-01-02 <.005 -- -- <.018 <.003 -- E.113 112 <.005 <.005 034N29W14BBB 01A 08-01-02 <.005 -- -- <.018 <.003 -- E.005 111 <.005 <.005

319 QUALITY OF GROUND WATER
MULTIPLE STATION ANALYSIS--Continued
WATER-QUALITY DATA, WATER YEAR OCTOBER 2001 TO SEPTEMBER 2002 DISUL- ETHAL- ETHO- FLUORO- HCH HHHMCP- FOTON D-LIMO- EPTC FLUR- PROP ANTHENE ALPHA BENZO- Local WATER NENE, WATER ALIN WATER D10 SUR FONOFOS D6 SRG PYRAN, ident- FLTRD WATER, FLTRD WAT FLT FLTRD FLUOR- S2033/ WATER WAT FLT WATER, i- 0.7 U FLTERD 0.7 U 0.7 U 0.7 U ANTHENE 8033 DISS 0.7 U FLTERD fier Date GF, REC REC GF, REC GF, REC GF, REC DISSOLV WAT FLT REC GF, REC REC (UG/L) (UG/L) (UG/L) (UG/L) (UG/L) (UG/L) PERCENT (UG/L) PERCENT (UG/L) (82677) (62073) (82668) (82663) (82672) (34377) (99586) (04095) (91065) (62075) ANOKA COUNTY 031N24W08CCD 01 07-08-02 <.02 -- <.002 <.009 <.005 -- -- <.003 98.1 -- 032N24W33BDC 01 07-09-02 <.02 -- <.002 <.009 <.005 -- -- <.003 90.4 -- BELTRAMI COUNTY 146N30W34BBB 00F 07-23-02 <.02 -- <.002 <.009 <.005 -- -- <.003 83.8 -- CASS COUNTY 144N31W25BBDC 01F 07-22-02 <.02 -- <.002 <.009 <.005 -- -- <.003 76.8 -- HENNEPIN COUNTY 118N21W01CBB 01 07-10-02 -- -- -- -- -- -- -- -- -- -- 119N21W32ACB 01 07-11-02 <.02 -- <.002 <.009 <.005 -- -- <.003 93.5 -- 07-11-02 <.02 -- <.002 <.009 <.005 -- -- <.003 97.2 -- 119N21W28DCD 01 07-09-02 <.02 -- <.002 <.009 <.005 -- -- <.003 95.3 -- SHERBURNE COUNTY 033N28W26DCB 01A 08-02-02 <.02 -- <.002 <.009 <.005 -- -- <.003 105 -- 033N27W16DCC 01A 07-11-02 <.02 -- <.002 <.009 <.005 -- -- <.003 93.5 -- 07-11-02 -- -- -- -- -- -- -- -- -- -- 07-11-02 M -- .109 .094 .098 -- -- .036 96.3 -- 033N28W13DCC 01A 07-30-02 <.02 -- <.002 <.009 <.005 -- -- <.003 91.0 -- 034N29W30DDA 01A 08-01-02 <.02 -- <.002 <.009 <.005 -- -- <.003 106 -- 034N29W14BBB 01A 08-01-02 <.02 -- <.002 <.009 <.005 -- -- <.003 106 --
ISO- ISO- LIN- ISOBOR- PROPYL QUIN- URON METAL- Local INDOLE, NEOL, BENZENE OLINE, WATER MALA- MENTHOL AXYL ident- WATER, WATER, ISO- WATER, WATER, LINDANE FLTRD THION, WATER, WATER i- FLTERD FLTERD PHORONE FLTERD FLTERD DIS- 0.7 U DIS- FLTERD FLTRD fier Date REC REC DISSOLV REC REC SOLVED GF, REC SOLVED REC REC (UG/L) (UG/L) (UG/L) (UG/L) (UG/L) (UG/L) (UG/L) (UG/L) (UG/L) (UG/L) (62076) (62077) (34409) (62078) (62079) (39341) (82666) (39532) (62080) (50359) ANOKA COUNTY 031N24W08CCD 01 07-08-02 -- -- -- -- -- <.004 <.035 <.027 -- -- 032N24W33BDC 01 07-09-02 -- -- -- -- -- <.004 <.035 <.027 -- -- BELTRAMI COUNTY 146N30W34BBB 00F 07-23-02 -- -- -- -- -- <.004 <.035 <.027 -- -- CASS COUNTY 144N31W25BBDC 01F 07-22-02 -- -- -- -- -- <.004 <.035 <.027 -- -- HENNEPIN COUNTY 118N21W01CBB 01 07-10-02 -- -- -- -- -- -- -- -- -- -- 119N21W32ACB 01 07-11-02 -- -- -- -- -- <.004 <.035 <.027 -- -- 07-11-02 -- -- -- -- -- <.004 <.035 <.027 -- -- 119N21W28DCD 01 07-09-02 -- -- -- -- -- <.004 <.035 <.027 -- -- SHERBURNE COUNTY 033N28W26DCB 01A 08-02-02 -- -- -- -- -- <.004 <.035 <.027 -- -- 033N27W16DCC 01A 07-11-02 -- -- -- -- -- <.004 <.035 <.027 -- -- 07-11-02 -- -- -- -- -- -- -- -- -- -- 07-11-02 -- -- -- -- -- .120 .130 .112 -- -- 033N28W13DCC 01A 07-30-02 -- -- -- -- -- <.004 <.035 <.027 -- -- 034N29W30DDA 01A 08-01-02 -- -- -- -- -- <.004 <.035 <.027 -- -- 034N29W14BBB 01A 08-01-02 -- -- -- -- -- <.004 <.035 <.027 -- --

320 QUALITY OF GROUND WATER
MULTIPLE STATION ANALYSIS--Continued
WATER-QUALITY DATA, WATER YEAR OCTOBER 2001 TO SEPTEMBER 2002 METHYL METHYL METHYL MOL- NAPROP- NONYL- AZIN- PARA- SALICY- METRI- INATE AMIDE PHENOL, Local PHOS THION LATE, METO- BUZIN WATER DEET, WATER DIETHOX ident- WAT FLT WAT FLT WATER, LACHLOR SENCOR FLTRD WATER, NAPHTH- FLTRD WATER, i- 0.7 U 0.7 U FLTERD WATER WATER 0.7 U FLTERD ALENE 0.7 U FLTERD fier Date GF, REC GF, REC REC DISSOLV DISSOLV GF, REC REC DISSOLV GF, REC REC (UG/L) (UG/L) (UG/L) (UG/L) (UG/L) (UG/L) (UG/L) (UG/L) (UG/L) (UG/L) (82686) (82667) (62081) (39415) (82630) (82671) (62082) (34443) (82684) (62083) ANOKA COUNTY 031N24W08CCD 01 07-08-02 <.050 <.006 -- <.013 <.006 <.002 -- -- <.007 -- 032N24W33BDC 01 07-09-02 <.050 <.006 -- <.013 <.006 <.002 -- -- <.007 -- BELTRAMI COUNTY 146N30W34BBB 00F 07-23-02 <.050 <.006 -- <.013 <.006 <.002 -- -- <.007 -- CASS COUNTY 144N31W25BBDC 01F 07-22-02 <.050 <.006 -- <.013 <.006 <.002 -- -- <.007 -- HENNEPIN COUNTY 118N21W01CBB 01 07-10-02 -- -- -- -- -- -- -- -- -- -- 119N21W32ACB 01 07-11-02 <.050 <.006 -- <.013 <.006 <.002 -- -- <.007 -- 07-11-02 <.050 <.006 -- <.013 <.006 <.002 -- -- <.007 -- 119N21W28DCD 01 07-09-02 <.050 <.006 -- <.013 <.006 <.002 -- -- <.007 -- SHERBURNE COUNTY 033N28W26DCB 01A 08-02-02 <.050 <.006 -- .152 .025 <.002 -- -- <.007 -- 033N27W16DCC 01A 07-11-02 <.050 <.006 -- <.013 <.006 <.002 -- -- <.007 -- 07-11-02 -- -- -- -- -- -- -- -- -- -- 07-11-02 E.123 .088 -- .118 .099 .112 -- -- .107 -- 033N28W13DCC 01A 07-30-02 <.050 <.006 -- <.013 <.006 <.002 -- -- <.007 -- 034N29W30DDA 01A 08-01-02 <.050 <.006 -- <.013 <.006 <.002 -- -- <.007 -- 034N29W14BBB 01A 08-01-02 <.050 <.006 -- <.013 <.006 <.002 -- -- <.007 --
DI- MONO- PARA- PEB- PENDI- PER- ETHOXY- ETHOXY- PARA- NONYL- ULATE METH- METHRIN Local OCTYL- OCTYL- CRESOL, PHENOL, PARA- WATER ALIN PENTA- CIS ident- PHENOL PHENOL P,P’ WATER, WATER, THION, FILTRD WAT FLT CHLORO- WAT FLT i- WAT FLT WAT FLT DDE FLTERD FLTERD DIS- 0.7 U 0.7 U PHENOL 0.7 U fier Date REC REC DISSOLV REC REC SOLVED GF, REC GF, REC DISSOLV GF, REC (UG/L) (UG/L) (UG/L) (UG/L) (UG/L) (UG/L) (UG/L) (UG/L) (UG/L) (UG/L) (61705) (61706) (34653) (62084) (62085) (39542) (82669) (82683) (34459) (82687) ANOKA COUNTY 031N24W08CCD 01 07-08-02 -- -- <.003 -- -- <.010 <.004 <.022 -- <.006 032N24W33BDC 01 07-09-02 -- -- <.003 -- -- <.010 <.004 <.022 -- <.006 BELTRAMI COUNTY 146N30W34BBB 00F 07-23-02 -- -- <.003 -- -- <.010 <.004 <.022 -- <.006 CASS COUNTY 144N31W25BBDC 01F 07-22-02 -- -- <.003 -- -- <.010 <.004 <.022 -- <.006 HENNEPIN COUNTY 118N21W01CBB 01 07-10-02 -- -- -- -- -- -- -- -- -- -- 119N21W32ACB 01 07-11-02 -- -- <.004 -- -- <.010 <.004 <.022 -- <.006 07-11-02 -- -- <.003 -- -- <.010 <.004 <.022 -- <.006 119N21W28DCD 01 07-09-02 -- -- <.003 -- -- <.010 <.004 <.022 -- <.006 SHERBURNE COUNTY 033N28W26DCB 01A 08-02-02 -- -- <.003 -- -- <.010 <.004 <.022 -- <.006 033N27W16DCC 01A 07-11-02 -- -- <.003 -- -- <.010 <.004 <.022 -- <.006 07-11-02 -- -- -- -- -- -- -- -- -- -- 07-11-02 -- -- .076 -- -- .098 .109 .084 -- .063 033N28W13DCC 01A 07-30-02 -- -- <.003 -- -- <.010 <.004 <.022 -- <.006 034N29W30DDA 01A 08-01-02 -- -- <.003 -- -- <.010 <.004 <.022 -- <.006 034N29W14BBB 01A 08-01-02 -- -- <.003 -- -- <.010 <.004 <.022 -- <.006

321 QUALITY OF GROUND WATER
MULTIPLE STATION ANALYSIS--Continued
WATER-QUALITY DATA, WATER YEAR OCTOBER 2001 TO SEPTEMBER 2002 PRON- PRO- PRO- PHORATE PRO- AMIDE PROPA- PANIL PARGITE SI- Local WATER METON, WATER CHLOR, WATER WATER MAZINE, ident- PHENAN PHENOL FLTRD WATER, FLTRD WATER, FLTRD FLTRD WATER, i- - THREN WATER 0.7 U DISS, 0.7 U DISS, 0.7 U 0.7 U PYRENE DISS, fier Date EDISSOL FILTRD GF, REC REC GF, REC REC GF, REC GF, REC DISSOLV REC V(UG/L) (UG/L) (UG/L) (UG/L) (UG/L) (UG/L) (UG/L) (UG/L) (UG/L) (UG/L) (34462) (34466) (82664) (04037) (82676) (04024) (82679) (82685) (34470) (04035) ANOKA COUNTY 031N24W08CCD 01 07-08-02 -- -- <.011 <.01 <.004 <.010 <.011 <.02 -- <.005 032N24W33BDC 01 07-09-02 -- -- <.011 .05 <.004 <.010 <.011 <.02 -- <.005 BELTRAMI COUNTY 146N30W34BBB 00F 07-23-02 -- -- <.011 <.01 <.004 <.010 <.011 <.02 -- <.005 CASS COUNTY 144N31W25BBDC 01F 07-22-02 -- -- <.011 <.01 <.004 <.010 <.011 <.02 -- <.005 HENNEPIN COUNTY 118N21W01CBB 01 07-10-02 -- -- -- -- -- -- -- -- -- -- 119N21W32ACB 01 07-11-02 -- -- <.011 <.01 <.004 <.010 <.011 <.02 -- <.005 07-11-02 -- -- <.011 <.01 <.004 <.010 <.011 <.02 -- <.005 119N21W28DCD 01 07-09-02 -- -- <.011 <.01 <.004 <.010 <.011 <.02 -- <.005 SHERBURNE COUNTY 033N28W26DCB 01A 08-02-02 -- -- <.011 M <.004 <.010 <.011 <.02 -- <.005 033N27W16DCC 01A 07-11-02 -- -- <.011 E.01 <.004 <.010 <.011 <.02 -- <.005 07-11-02 -- -- -- -- -- -- -- -- -- -- 07-11-02 -- -- <.011 .12 .114 .129 .125 .09 -- .081 033N28W13DCC 01A 07-30-02 -- -- <.011 <.01 <.004 <.010 <.011 <.02 -- <.005 034N29W30DDA 01A 08-01-02 -- -- <.011 <.01 <.004 <.010 <.011 <.02 -- <.005 034N29W14BBB 01A 08-01-02 -- -- <.011 <.01 <.004 <.010 <.011 <.02 -- <.005
TEBU- TER- TER- THIO- TRIAL- TRIBUTL STIGMA- THIURON BACIL BUFOS TETRA- BENCARB FYROL FYROL LATE PHOS- Local STANOL, WATER WATER WATER CHLORO- WATER CEF, PCF, WATER PHATE, ident- WATER, FLTRD FLTRD FLTRD ETHY- FLTRD WATER, WATER, FLTRD WATER, i- FLTERD 0.7 U 0.7 U 0.7 U LENE 0.7 U FLTERD FLTERD 0.7 U FLTERD fier Date REC GF, REC GF, REC GF, REC DISSOLV GF, REC REC REC GF, REC REC (UG/L) (UG/L) (UG/L) (UG/L) (UG/L) (UG/L) (UG/L) (UG/L) (UG/L) (UG/L) (62086) (82670) (82665) (82675) (34476) (82681) (62087) (62088) (82678) (62089) ANOKA COUNTY 031N24W08CCD 01 07-08-02 -- <.02 <.034 <.02 -- <.005 -- -- <.002 -- 032N24W33BDC 01 07-09-02 -- <.02 <.034 <.02 -- <.005 -- -- <.002 -- BELTRAMI COUNTY 146N30W34BBB 00F 07-23-02 -- <.02 <.034 <.02 -- <.005 -- -- <.002 -- CASS COUNTY 144N31W25BBDC 01F 07-22-02 -- <.02 <.034 <.02 -- <.005 -- -- <.002 -- HENNEPIN COUNTY 118N21W01CBB 01 07-10-02 -- -- -- -- -- -- -- -- -- -- 119N21W32ACB 01 07-11-02 -- <.02 <.034 <.02 -- <.005 -- -- <.002 -- 07-11-02 -- <.02 <.034 <.02 -- <.005 -- -- <.002 -- 119N21W28DCD 01 07-09-02 -- <.02 <.034 <.02 -- <.005 -- -- <.002 -- SHERBURNE COUNTY 033N28W26DCB 01A 08-02-02 -- <.02 <.034 <.02 -- <.005 -- -- <.002 -- 033N27W16DCC 01A 07-11-02 -- <.02 <.034 <.02 -- <.005 -- -- <.002 -- 07-11-02 -- -- -- -- -- -- -- -- -- -- 07-11-02 -- .15 E.112 E.01 -- .113 -- -- .097 -- 033N28W13DCC 01A 07-30-02 -- <.02 <.034 <.02 -- <.005 -- -- <.002 -- 034N29W30DDA 01A 08-01-02 -- <.02 <.034 <.02 -- <.005 -- -- <.002 -- 034N29W14BBB 01A 08-01-02 -- <.02 <.034 <.02 -- <.005 -- -- <.002 --

322 QUALITY OF GROUND WATER
MULTIPLE STATION ANALYSIS--Continued
WATER-QUALITY DATA, WATER YEAR OCTOBER 2001 TO SEPTEMBER 2002 TRI- TRI- TRIPHNL TRIS(2- 1,1-DI TRICLO- ETHYL FLUR- PHOS- BUTOXE— 1,1,1- 1,1,2- 1,1-DI- CHLORO- Local SAN, CITRATE ALIN PHATE, PHOS- TRI- TRI- 1,1-DI- CHLORO- PRO- ident- WATER, WATER, WAT FLT WATER, PHATE, CHLORO- CHLORO- CHLORO- ETHYL- PENE, i- FLTERD FLTERD 0.7 U FLTERD WATER, ETHANE ETHANE ETHANE ENE WAT, WH fier Date REC REC GF, REC REC FLTERD TOTAL TOTAL TOTAL TOTAL TOTAL (UG/L) (UG/L) (UG/L) (UG/L) (UG/L) (UG/L) (UG/L) (UG/L) (UG/L) (UG/L) (62090) (62091) (82661) (62092) (62093) (34506) (34511) (34496) (34501) (77168) ANOKA COUNTY 031N24W08CCD 01 07-08-02 -- -- <.009 -- -- <.03 <.06 <.04 <.04 <.05 032N24W33BDC 01 07-09-02 -- -- <.009 -- -- -- -- -- -- -- BELTRAMI COUNTY 146N30W34BBB 00F 07-23-02 -- -- <.009 -- -- <.03 <.06 <.04 <.04 <.05 CASS COUNTY 144N31W25BBDC 01F 07-22-02 -- -- <.009 -- -- <.03 <.06 <.04 <.04 <.05 HENNEPIN COUNTY 118N21W01CBB 01 07-10-02 -- -- -- -- -- <.03 <.06 <.04 <.04 <.05 119N21W32ACB 01 07-11-02 -- -- <.009 -- -- <.03 <.06 <.04 <.04 <.05 07-11-02 -- -- <.009 -- -- <.03 <.06 <.04 <.04 <.05 119N21W28DCD 01 07-09-02 -- -- <.009 -- -- <.03 <.06 <.04 <.04 <.05 SHERBURNE COUNTY 033N28W26DCB 01A 08-02-02 -- -- <.009 -- -- <.03 <.06 <.04 <.04 <.05 033N27W16DCC 01A 07-11-02 -- -- <.009 -- -- <.03 <.06 <.04 <.04 <.05 07-11-02 -- -- -- -- -- -- -- -- -- -- 07-11-02 -- -- .093 -- -- .46 .58 .78 .47 .62 033N28W13DCC 01A 07-30-02 -- -- <.009 -- -- <.03 <.06 <.04 <.04 <.05 034N29W30DDA 01A 08-01-02 -- -- <.009 -- -- <.03 <.06 <.04 <.04 <.05 034N29W14BBB 01A 08-01-02 -- -- <.009 -- -- <.03 <.06 <.04 <.04 <.05
123-TRI 1,2- 2,2-DI 2BUTENE CHLORO- DIBROMO TRANS- CHLORO- TRANS-1 2-HEXA- Local PROPANE ETHANE 1,2-DI- 1,2-DI- 1,2-DI- PRO- 4-DI- NONE ACETONE ident- WATER WATER CHLORO- CHLORO- CHLORO- PANE CHLORO WATER WATER ACRYLO- i- WHOLE WHOLE ETHANE PROPANE ETHENE WAT, WH UNFLTRD WHOLE WHOLE NITRILE fier Date TOTAL TOTAL TOTAL TOTAL TOTAL TOTAL RECOVER TOTAL TOTAL TOTAL (UG/L) (UG/L) (UG/L) (UG/L) (UG/L) (UG/L) (UG/L) (UG/L) (UG/L) (UG/L) (77443) (77651) (32103) (34541) (34546) (77170) (73547) (77103) (81552) (34215) ANOKA COUNTY 031N24W08CCD 01 07-08-02 <.16 <.04 <.1 <.03 <.03 <.05 <.7 <.7 <7 <1 032N24W33BDC 01 07-09-02 -- -- -- -- -- -- -- -- -- -- BELTRAMI COUNTY 146N30W34BBB 00F 07-23-02 <.16 <.04 <.1 <.03 <.03 <.05 <.7 <.7 <7 <1 CASS COUNTY 144N31W25BBDC 01F 07-22-02 <.16 <.04 <.1 <.03 <.03 <.05 <.7 <.7 <7 <1 HENNEPIN COUNTY 118N21W01CBB 01 07-10-02 <.16 <.04 <.1 <.03 <.03 <.05 <.7 <.7 <7 <1 119N21W32ACB 01 07-11-02 <.16 <.04 <.1 <.03 <.03 <.05 <.7 <.7 <7 <1 07-11-02 <.16 <.04 <.1 <.03 <.03 <.05 <.7 <.7 <7 <1 119N21W28DCD 01 07-09-02 <.16 <.04 <.1 <.03 <.03 <.05 <.7 <.7 <7 <1 SHERBURNE COUNTY 033N28W26DCB 01A 08-02-02 <.16 <.04 <.1 <.03 <.03 <.05 <.7 <.7 <7 <1 033N27W16DCC 01A 07-11-02 <.16 <.04 <.1 <.03 <.03 <.05 <.7 <.7 <7 <1 07-11-02 -- -- -- -- -- -- -- -- -- -- 07-11-02 2.87 .50 2.1 .69 .48 .69 6.8 6.9 69 25 033N28W13DCC 01A 07-30-02 <.16 <.04 <.1 <.03 <.03 <.05 <.7 <.7 <7 <1 034N29W30DDA 01A 08-01-02 <.16 <.04 <.1 <.03 <.03 <.05 <.7 <.7 <7 <1 034N29W14BBB 01A 08-01-02 <.16 <.04 <.1 <.03 <.03 <.05 <.7 <.7 <7 <1

323 QUALITY OF GROUND WATER
MULTIPLE STATION ANALYSIS--Continued
WATER-QUALITY DATA, WATER YEAR OCTOBER 2001 TO SEPTEMBER 2002 1,2,3- BENZENE BENZENE BENZENE BENZENE BENZENE BENZENE ISO- TRI- 123-TRI 1,2,4- BENZENE 135-TRI 1,3-DI- 14BRFL- 1,4-DI- PROPYL- BENZENE Local CHLORO METHYL- TRI- 124-TRI METHYL CHLORO- SURROG CHLORO- BENZENE N-BUTYL ident- BENZENE WATER CHLORO- METHYL WATER WATER VOC WATER WATER WATER i- WAT, WH UNFLTRD WAT UNF UNFILT UNFLTRD UNFLTRD UNFLTRD UNFLTRD WHOLE UNFLTRD fier Date REC RECOVER REC RECOVER REC REC REC REC REC REC (UG/L) (UG/L) (UG/L) (UG/L) (UG/L) (UG/L) PERCENT (UG/L) (UG/L) (UG/L) (77613) (77221) (34551) (77222) (77226) (34566) (99834) (34571) (77223) (77342) ANOKA COUNTY 031N24W08CCD 01 07-08-02 <.3 <.1 <.1 <.06 <.04 <.03 86.6 <.05 <.06 <.2 032N24W33BDC 01 07-09-02 -- -- -- -- -- -- -- -- -- -- BELTRAMI COUNTY 146N30W34BBB 00F 07-23-02 <.3 <.1 <.1 <.06 <.04 <.03 79.3 <.05 <.06 <.2 CASS COUNTY 144N31W25BBDC 01F 07-22-02 <.3 <.1 <.1 <.06 <.04 <.03 79.4 <.05 <.06 <.2 HENNEPIN COUNTY 118N21W01CBB 01 07-10-02 <.3 <.1 <.1 <.06 <.04 <.03 85.8 <.05 <.06 <.2 119N21W32ACB 01 07-11-02 <.3 <.1 <.1 <.06 <.04 <.03 77.6 <.05 <.06 <.2 07-11-02 <.3 <.1 <.1 <.06 <.04 <.03 87.0 <.05 <.06 <.2 119N21W28DCD 01 07-09-02 <.3 <.1 <.1 <.06 <.04 <.03 88.6 <.05 <.06 <.2 SHERBURNE COUNTY 033N28W26DCB 01A 08-02-02 <.3 <.1 <.1 <.06 <.04 <.03 97.1 <.05 <.06 <.2 033N27W16DCC 01A 07-11-02 <.3 <.1 <.1 <.06 <.04 <.03 79.4 <.05 <.06 <.2 07-11-02 -- -- -- -- -- -- -- -- -- -- 07-11-02 2.7 1.1 1.7 .62 .49 .49 93.0 .47 .47 1.9 033N28W13DCC 01A 07-30-02 <.3 <.1 <.1 <.06 <.04 <.03 91.5 <.05 <.06 <.2 034N29W30DDA 01A 08-01-02 <.3 <.1 <.1 <.06 <.04 <.03 96.9 <.05 <.06 <.2 034N29W14BBB 01A 08-01-02 <.3 <.1 <.1 <.06 <.04 <.03 96.2 <.05 <.06 <.2
BENZENE BENZENE BENZENE CARBON BENZENE O-DI- SEC TERT- BROMO- BROMO- DI- CARBON Local N-PROPY CHLORO- BUTYL- BUTYL- BENZENE ETHENE SULFIDE TETRA- ident- WATER WATER WATER WATER WATER, WATER BROMO- WATER CHLO- i- UNFLTRD UNFLTRD UNFLTRD UNFLTRD BENZENE WHOLE, UNFLTRD FORM WHOLE RIDE fier Date REC REC REC REC TOTAL TOTAL RECOVER TOTAL TOTAL TOTAL (UG/L) (UG/L) (UG/L) (UG/L) (UG/L) (UG/L) (UG/L) (UG/L) (UG/L) (UG/L) (77224) (34536) (77350) (77353) (34030) (81555) (50002) (32104) (77041) (32102) ANOKA COUNTY 031N24W08CCD 01 07-08-02 <.04 <.03 <.03 <.05 <.04 <.04 <.1 <.06 <.07 <.06 032N24W33BDC 01 07-09-02 -- -- -- -- -- -- -- -- -- -- BELTRAMI COUNTY 146N30W34BBB 00F 07-23-02 <.04 <.03 <.03 <.05 <.04 <.04 <.1 <.06 <.07 <.06 CASS COUNTY 144N31W25BBDC 01F 07-22-02 <.04 <.03 <.03 <.05 <.04 <.04 <.1 <.06 <.07 <.06 HENNEPIN COUNTY 118N21W01CBB 01 07-10-02 <.04 <.03 <.03 <.05 <.04 <.04 <.1 <.06 <.07 <.06 119N21W32ACB 01 07-11-02 <.04 <.03 <.03 <.05 <.04 <.04 <.1 <.06 <.07 <.06 07-11-02 <.04 <.03 <.03 <.05 <.04 <.04 <.1 <.06 <.07 <.06 119N21W28DCD 01 07-09-02 <.04 <.03 <.03 <.05 <.04 <.04 <.1 <.06 <.07 <.06 SHERBURNE COUNTY 033N28W26DCB 01A 08-02-02 <.04 <.03 <.03 <.05 <.04 <.04 <.1 <.06 <.07 <.06 033N27W16DCC 01A 07-11-02 <.04 <.03 <.03 <.05 <.04 <.04 <.1 <.06 <.07 <.06 07-11-02 -- -- -- -- -- -- -- -- -- -- 07-11-02 .46 .49 .50 1.00 .52 .43 1.8 1.76 .61 .87 033N28W13DCC 01A 07-30-02 <.04 <.03 <.03 <.05 <.04 <.04 <.1 <.06 <.07 <.06 034N29W30DDA 01A 08-01-02 <.04 <.03 <.03 <.05 <.04 <.04 <.1 <.06 <.07 <.06 034N29W14BBB 01A 08-01-02 <.04 <.03 <.03 <.05 <.04 <.04 <.1 <.06 <.07 <.06

324 QUALITY OF GROUND WATER
MULTIPLE STATION ANALYSIS--Continued
WATER-QUALITY DATA, WATER YEAR OCTOBER 2001 TO SEPTEMBER 2002 CIS-1,2 DIBROMO DI- DI- CHLORO- -DI- CIS CHLORO- BROMO- BROMO- CHLORO- Local DI- CHLORO- 1,3-DI- PROPANE METHANE DI- DI- ident- CHLORO- BROMO- CHLORO- CHLORO- ETHENE CHLORO- WATER WATER CHLORO- FLUORO- i- BENZENE METHANE ETHANE FORM WATER PROPENE WHOLE WHOLE METHANE METHANE fier Date TOTAL TOTAL TOTAL TOTAL TOTAL TOTAL TOT.REC RECOVER TOTAL TOTAL (UG/L) (UG/L) (UG/L) (UG/L) (UG/L) (UG/L) (UG/L) (UG/L) (UG/L) (UG/L) (34301) (32105) (34311) (32106) (77093) (34704) (82625) (30217) (32101) (34668) ANOKA COUNTY 031N24W08CCD 01 07-08-02 <.03 <.2 <.1 <.02 <.04 <.09 <.5 <.05 <.05 <.18 032N24W33BDC 01 07-09-02 -- -- -- -- -- -- -- -- -- -- BELTRAMI COUNTY 146N30W34BBB 00F 07-23-02 <.03 <.2 <.1 <.02 <.04 <.09 <.5 <.05 <.05 <.18 CASS COUNTY 144N31W25BBDC 01F 07-22-02 <.03 <.2 <.1 <.02 <.04 <.09 <.5 <.05 <.05 <.18 HENNEPIN COUNTY 118N21W01CBB 01 07-10-02 <.03 <.2 <.1 <.02 .12 <.09 <.5 <.05 <.05 <.18 119N21W32ACB 01 07-11-02 <.03 <.2 <.1 <.02 <.04 <.09 <.5 <.05 <.05 <.18 07-11-02 <.03 <.2 <.1 <.02 <.04 <.09 <.5 <.05 <.05 <.18 119N21W28DCD 01 07-09-02 <.03 <.2 <.1 <.02 <.04 <.09 <.5 <.05 <.05 E.13 SHERBURNE COUNTY 033N28W26DCB 01A 08-02-02 <.03 <.2 <.1 <.02 <.04 <.09 <.5 <.05 <.05 <.18 033N27W16DCC 01A 07-11-02 <.03 <.2 <.1 <.02 <.04 <.09 <.5 <.05 <.05 <.18 07-11-02 -- -- -- -- -- -- -- -- -- -- 07-11-02 .45 1.7 1.2 .51 .46 .77 4.7 .51 .51 E4.81 033N28W13DCC 01A 07-30-02 <.03 <.2 <.1 <.02 <.04 <.09 <.5 <.05 <.05 <.18 034N29W30DDA 01A 08-01-02 <.03 <.2 <.1 <.02 <.04 <.09 <.5 <.05 <.05 <.18 034N29W14BBB 01A 08-01-02 <.03 <.2 <.1 <.02 <.04 <.09 <.5 <.05 <.05 <.18
DI-ISO- ETHANE, ETHANE, ETHANE ETHANE ETHER ETHER PROPYL- 1112- 1,1,2,2 12DICL HEXA- ETHER TERT- TERT- FREON- Local ETHER, TETRA- TETRA- SURROG CHLORO- ETHYL BUTYL PENTYL 113 ident- WATER, CHLORO- CHLORO- VOC WATER WATER ETHYL METHYL ETHYL- WATER i- UNFLTRD WAT UNF WAT UNF UNFLTRD UNFLTRD UNFLTRD UNFLTRD UNFLTRD BENZENE UNFLTRD fier Date RECOVER REC REC REC RECOVER RECOVER RECOVER RECOVER TOTAL REC (UG/L) (UG/L) (UG/L) PERCENT (UG/L) (UG/L) (UG/L) (UG/L) (UG/L) (UG/L) (81577) (77562) (34516) (99832) (34396) (81576) (50004) (50005) (34371) (77652) ANOKA COUNTY 031N24W08CCD 01 07-08-02 <.10 <.03 <.09 122 <.2 <.2 <.05 <.08 <.03 <.06 032N24W33BDC 01 07-09-02 -- -- -- -- -- -- -- -- -- -- BELTRAMI COUNTY 146N30W34BBB 00F 07-23-02 <.10 <.03 <.09 102 <.2 <.2 <.05 <.08 <.03 <.06 CASS COUNTY 144N31W25BBDC 01F 07-22-02 <.10 <.03 <.09 103 <.2 <.2 <.05 <.08 <.03 <.06 HENNEPIN COUNTY 118N21W01CBB 01 07-10-02 <.10 <.03 <.09 118 <.2 <.2 <.05 <.08 <.03 <.06 119N21W32ACB 01 07-11-02 <.10 <.03 <.09 122 <.2 <.2 <.05 <.08 <.03 <.06 07-11-02 <.10 <.03 <.09 116 <.2 <.2 <.05 <.08 <.03 <.06 119N21W28DCD 01 07-09-02 <.10 <.03 <.09 110 <.2 <.2 <.05 <.08 <.03 <.06 SHERBURNE COUNTY 033N28W26DCB 01A 08-02-02 <.10 <.03 <.09 113 <.2 <.2 <.05 <.08 <.03 <.06 033N27W16DCC 01A 07-11-02 <.10 <.03 <.09 122 <.2 <.2 <.05 <.08 <.03 <.06 07-11-02 -- -- -- -- -- -- -- -- -- -- 07-11-02 .87 .49 1.28 106 1.9 1.5 .40 .90 .47 .46 033N28W13DCC 01A 07-30-02 <.10 <.03 <.09 117 <.2 <.2 <.05 <.08 <.03 <.06 034N29W30DDA 01A 08-01-02 <.10 <.03 <.09 112 <.2 <.2 <.05 <.08 <.03 <.06 034N29W14BBB 01A 08-01-02 <.10 <.03 <.09 112 <.2 <.2 <.05 <.08 <.03 <.06

325 QUALITY OF GROUND WATER
MULTIPLE STATION ANALYSIS--Continued
WATER-QUALITY DATA, WATER YEAR OCTOBER 2001 TO SEPTEMBER 2002 FURAN, METHAC- METHAC- METH- METHANE METHYL METHYL TETRA- HEXA- ISO- RYLATE RYLATE ACRYLO- BROMO ACRY- METHYL TERT- Local HYDRO- CHLORO- DURENE ETHYL- METHYL NITRILE CHLORO- LATE IODIDE BUTYL ident- WATER BUT- WATER WATER WATER WATER WAT WATER WATER ETHER i- UNFLTRD ADIENE UNFLTRD UNFLTRD UNFLTRD UNFLTRD UNFLTRD UNFLTRD UNFLTRD WAT UNF fier Date RECOVER TOTAL RECOVER RECOVER RECOVER RECOVER REC RECOVER RECOVER REC (UG/L) (UG/L) (UG/L) (UG/L) (UG/L) (UG/L) (UG/L) (UG/L) (UG/L) (UG/L) (81607) (39702) (50000) (73570) (81597) (81593) (77297) (49991) (77424) (78032) ANOKA COUNTY 031N24W08CCD 01 07-08-02 <2 <.1 <.2 <.2 <.3 <.6 <.07 <2.0 <.25 <.2 032N24W33BDC 01 07-09-02 -- -- -- -- -- -- -- -- -- -- BELTRAMI COUNTY 146N30W34BBB 00F 07-23-02 <2 <.1 <.2 <.2 <.3 <.6 <.07 <2.0 <.25 <.2 CASS COUNTY 144N31W25BBDC 01F 07-22-02 <2 <.1 <.2 <.2 <.3 <.6 <.07 <2.0 <.25 <.2 HENNEPIN COUNTY 118N21W01CBB 01 07-10-02 <2 <.1 <.2 <.2 <.3 <.6 <.07 <2.0 <.25 <.2 119N21W32ACB 01 07-11-02 <2 <.1 <.2 <.2 <.3 <.6 <.07 <2.0 <.25 <.2 07-11-02 <2 <.1 <.2 <.2 <.3 <.6 <.07 <2.0 <.25 <.2 119N21W28DCD 01 07-09-02 <2 <.1 <.2 <.2 <.3 <.6 <.07 <2.0 <.25 <.2 SHERBURNE COUNTY 033N28W26DCB 01A 08-02-02 <2 <.1 <.2 <.2 <.3 <.6 <.07 <2.0 <.25 <.2 033N27W16DCC 01A 07-11-02 <2 <.1 <.2 <.2 <.3 <.6 <.07 <2.0 <.25 <.2 07-11-02 -- -- -- -- -- -- -- -- -- -- 07-11-02 19 1.4 2.4 2.3 5.7 9.8 1.96 22.3 E3.51 1.7 033N28W13DCC 01A 07-30-02 <2 <.1 <.2 <.2 <.3 <.6 <.07 <2.0 <.25 <.2 034N29W30DDA 01A 08-01-02 <2 <.1 <.2 <.2 <.3 <.6 <.07 <2.0 <.25 <.2 034N29W14BBB 01A 08-01-02 <2 <.1 <.2 <.2 <.3 <.6 <.07 <2.0 <.25 <.2
METHYL- METHYL META/ O- P-ISO- METHYL ETHYL- ISO- PARA- CHLORO- O- PROPYL- Local METHYL- ENE KETONE BUTYL XYLENE TOLUENE XYLENE TOLUENE ident- METHYL- CHLO- CHLO- WATER KETONE WATER NAPHTH- WATER WATER WATER i- BROMIDE RIDE RIDE WHOLE WAT.WH. UNFLTRD ALENE WHOLE WHOLE WHOLE fier Date TOTAL TOTAL TOTAL TOTAL TOTAL REC TOTAL TOTAL TOTAL REC (UG/L) (UG/L) (UG/L) (UG/L) (UG/L) (UG/L) (UG/L) (UG/L) (UG/L) (UG/L) (34413) (34418) (34423) (81595) (78133) (85795) (34696) (77275) (77135) (77356) ANOKA COUNTY 031N24W08CCD 01 07-08-02 <.3 <.2 <.2 <5.0 <.4 <.06 <.5 <.03 <.07 <.07 032N24W33BDC 01 07-09-02 -- -- -- -- -- -- -- -- -- -- BELTRAMI COUNTY 146N30W34BBB 00F 07-23-02 <.3 <.2 <.2 <5.0 <.4 <.06 <.5 <.03 <.07 <.07 CASS COUNTY 144N31W25BBDC 01F 07-22-02 <.3 <.2 <.2 <5.0 <.4 <.06 <.5 <.03 <.07 <.07 HENNEPIN COUNTY 118N21W01CBB 01 07-10-02 <.3 <.2 <.2 <5.0 <.4 <.06 <.5 <.03 <.07 <.07 119N21W32ACB 01 07-11-02 <.3 <.2 <.2 <5.0 <.4 <.06 <.5 <.03 <.07 <.07 07-11-02 <.3 <.2 <.2 <5.0 <.4 <.06 <.5 <.03 <.07 <.07 119N21W28DCD 01 07-09-02 <.3 <.2 <.2 <5.0 <.4 <.06 <.5 <.03 <.07 <.07 SHERBURNE COUNTY 033N28W26DCB 01A 08-02-02 <.3 <.2 <.2 <5.0 <.4 <.06 <.5 <.03 <.07 <.07 033N27W16DCC 01A 07-11-02 <.3 <.2 <.2 <5.0 <.4 <.06 <.5 <.03 <.07 <.07 07-11-02 -- -- -- -- -- -- -- -- -- -- 07-11-02 E3.6 E2.5 1.7 38.7 4.8 1.20 4.6 .45 .59 1.05 033N28W13DCC 01A 07-30-02 <.3 <.2 <.2 <5.0 <.4 <.06 <.5 <.03 <.07 <.07 034N29W30DDA 01A 08-01-02 <.3 <.2 <.2 <5.0 <.4 <.06 <.5 <.03 <.07 <.07 034N29W14BBB 01A 08-01-02 <.3 <.2 <.2 <5.0 <.4 <.06 <.5 <.03 <.07 <.07

326 QUALITY OF GROUND WATER
MULTIPLE STATION ANALYSIS--Continued
WATER-QUALITY DATA, WATER YEAR OCTOBER 2001 TO SEPTEMBER 2002 1234- PROPENE TOLUENE TETRA 1,3-DI- 3- TETRA- D8 TOLUENE TOLUENE TRANS- Local METHYL CHLORO- CHLORO- CHLORO- SURROG O-ETHYL P-CHLOR 1,3-DI- ident- BENZENE PROPANE WATER ETHYL- VOC WATER WATER CHLORO- i- UNFLTRD WAT. WH UNFLTRD STYRENE ENE UNFLTRD UNFLTRD UNFLTRD TOLUENE PROPENE fier Date REC TOTAL RECOVER TOTAL TOTAL REC RECOVER REC TOTAL TOTAL (UG/L) (UG/L) (UG/L) (UG/L) (UG/L) PERCENT (UG/L) (UG/L) (UG/L) (UG/L) (49999) (77173) (78109) (77128) (34475) (99833) (77220) (77277) (34010) (34699) ANOKA COUNTY 031N24W08CCD 01 07-08-02 <.2 <.1 <.07 <.04 <.03 101 <.06 <.05 <.05 <.09 032N24W33BDC 01 07-09-02 -- -- -- -- -- -- -- -- -- -- BELTRAMI COUNTY 146N30W34BBB 00F 07-23-02 <.2 <.1 <.07 <.04 <.03 93.1 <.06 <.05 <.05 <.09 CASS COUNTY 144N31W25BBDC 01F 07-22-02 <.2 <.1 <.07 <.04 <.03 92.8 <.06 <.05 <.05 <.09 HENNEPIN COUNTY 118N21W01CBB 01 07-10-02 <.2 <.1 <.07 <.04 <.03 100 <.06 <.05 <.05 <.09 119N21W32ACB 01 07-11-02 <.2 <.1 <.07 <.04 E.02 99.1 <.06 <.05 <.05 <.09 07-11-02 <.2 <.1 <.07 <.04 <.03 99.3 <.06 <.05 <.05 <.09 119N21W28DCD 01 07-09-02 <.2 <.1 <.07 <.04 <.03 96.2 <.06 <.05 <.05 <.09 SHERBURNE COUNTY 033N28W26DCB 01A 08-02-02 <.2 <.1 <.07 <.04 <.03 99.4 <.06 <.05 <.05 <.09 033N27W16DCC 01A 07-11-02 <.2 <.1 <.07 <.04 <.03 99.3 <.06 <.05 <.05 <.09 07-11-02 -- -- -- -- -- -- -- -- -- -- 07-11-02 2.2 1.2 E1.98 .42 1.02 103 .91 .54 .48 1.17 033N28W13DCC 01A 07-30-02 <.2 <.1 <.07 <.04 <.03 99.2 <.06 <.05 <.05 <.09 034N29W30DDA 01A 08-01-02 <.2 <.1 <.07 <.04 .49 98.9 <.06 <.05 <.05 <.09 034N29W14BBB 01A 08-01-02 <.2 <.1 <.07 <.04 <.03 99.8 <.06 <.05 <.05 <.09
SAMPLE TRI- TRI- DICHLOR URANIUM SAMPLE WEIGHT, Local CHLORO- CHLORO- VINYL VOS, NATURAL TICS VOLUME WASTE- ident- ETHYL- FLUORO- CHLO- WATER DIS- FROM SCHED- WATER Data i- ENE METHANE RIDE FLTRD SOLVED VOC ULE METHOD, base fier Date TOTAL TOTAL TOTAL REC (UG/L BY GCMS 2001 WAT FLT County number (UG/L) (UG/L) (UG/L) (UG/L) AS U) NUMBER (ML) (ML) (39180) (34488) (39175) (38775) (22703) (99871) (99856) (99587) ANOKA COUNTY 031N24W08CCD 01 07-08-02 <.04 <.09 <.1 -- .13 0 939 -- 003 01 032N24W33BDC 01 07-09-02 -- -- -- -- .37 -- 921 -- 003 01 BELTRAMI COUNTY 146N30W34BBB 00F 07-23-02 <.04 <.09 <.1 -- .07 0 943 -- 007 01 CASS COUNTY 144N31W25BBDC 01F 07-22-02 <.04 <.09 <.1 -- .10 0 947 -- 021 01 HENNEPIN COUNTY 118N21W01CBB 01 07-10-02 E.08 <.09 <.1 -- 12.2 0 -- -- 053 01 119N21W32ACB 01 07-11-02 <.04 <.09 <.1 -- .26 0 930 -- 053 01 07-11-02 <.04 <.09 <.1 -- <.02 0 944 -- 053 77 119N21W28DCD 01 07-09-02 <.04 <.09 <.1 -- 7.29 0 943 -- 053 01 SHERBURNE COUNTY 033N28W26DCB 01A 08-02-02 <.04 <.09 <.1 -- .24 0 939 -- 141 01 033N27W16DCC 01A 07-11-02 <.04 <.09 <.1 -- .52 0 922 -- 141 01 07-11-02 -- -- -- -- .47 -- -- -- 141 77 07-11-02 .43 1.89 1.0 -- -- 1 937 -- 141 77 033N28W13DCC 01A 07-30-02 <.04 <.09 <.1 -- -- 0 953 -- 141 01 034N29W30DDA 01A 08-01-02 <.04 <.09 <.1 -- .60 0 914 -- 141 01 034N29W14BBB 01A 08-01-02 <.04 <.09 <.1 -- 1.56 0 915 -- 141 01

327INDEX
Page Page
AAccess to USGS Water Data ....................................................13Accuracy of the Records ..........................................................10Acid neutralizing capacity, definition of ..................................13Acre-foot, definition of .............................................................14Ada, Marsh River Ditch near ..................................................277Adenosine triphosphate, definition of ......................................14Aitkin, Mississippi River at ....................................................142Aldrich, Leaf River near .........................................................279Algae, definition of ...................................................................14
Blue-green, definition of ..................................................18Fire, definition of ..............................................................18Green, definition of ..........................................................18
Algal growth potential, definition of ........................................14Alkalinity, definition of ............................................................14Amphibian research and monitoring ......................................294Annual 7-day minimum, definition of ......................................15Annual runoff, definition of .....................................................14Anoka, Mississippi River at ...................................................172Appleton, Pomme de Terre River near ...................................280Aquifer, water table, definition of ............................................21Argyle, Middle River at ............................................................90Aroclor ......................................................................................14Arrangement of Records, water quality ....................................11Artificial substrate, definition of ..............................................19Ash mass, definition of .............................................................14Ashley Creek near Sauk Centre ..............................................279Austin, Cedar River near ........................................................268
BBabbitt, Stony River near .......................................................278Bacteria, definition of ...............................................................14
Enterococcus, definition of ...............................................14Escherichia coli, definition of ...........................................14Fecal coliform, definition of .............................................14Fecal streptococcal, definition of .....................................14Total coliform, definition of .............................................14
Bagley, Clearwater River Trib. near .......................................277Bancroft Creek at Bancroft .....................................................284Bancroft, Bancroft Creek at ....................................................284Barnesville, Whiskey Creek at ...............................................277Base flow, definition of ............................................................14Basswood River near Winton .................................................108Baudette, North Branch Rapid River near ..............................278Baudette, Winter Road River near ..........................................278Beauford, Little Cobb River near ...........................................220Beaver Creek at Beaver Falls .................................................281Beaver Creek at Valley Springs, SD ......................................284Beaver Falls, Beaver Creek at ................................................281Bed load, definition of ..............................................................19Bed material, definition of ........................................................14Bed-load discharge, definition of .............................................19Beltrami County, ground-water levels ...................................311Bemidji, Mississippi River at .................................................278Bemidji, Mississippi River near .............................................136Benthic organisms, definition of ..............................................14
Big Falls, Big Fork River at ...................................................128Big Fork River at Big Falls ....................................................128Big Fork River near Bigfork ..................................................278Big Lake, Elk River near ........................................................160Big Stone City, SD, Whetstone River near ............................182Bigfork, Big Fork River near .................................................278Biochemical oxygen demand, definition of .............................14Biomass pigment ratio, definition of ........................................15Biomass, definition of ..............................................................14Blue Earth River near Rapidan ...............................................218Blue-green algae, definition of ..................................................18Bois de Sioux River,
near Doran ........................................................................46near White Rock, SD ........................................................44
Bottom material, definition of ..................................................15Bowerman Brook near Craigville ...........................................278Boy River near Remer ............................................................278Brainerd, Mississippi River at ................................................144Brewster, Elk River near ........................................................284Buffalo Creek near Glencoe ...................................................280Buffalo River near Callaway ..................................................276Buffalo River,
near Dilworth ....................................................................58near Hawley ......................................................................54
Bug Creek at Shaw .................................................................276Burnham Creek near Crookston .............................................277Burr, Florida Creek near .........................................................280
CCallaway, Buffalo River near .................................................276Campbell Valley near Money Creek ......................................283Cannon River at Northfield ....................................................282Cannon River at Welch ..........................................................262Cannon River below Sabre Lake near Kilkenny ....................282Caribou, Roseau River below State Ditch 51, near ................102Cascade River near Grand Marais ..........................................275Cat River near Nimrod ...........................................................279Cedar River near Austin .........................................................268Cedar River near Ridgeway ...................................................283Cells/volume, definition of .......................................................15Ceylon, East Fork Des Moines River at .................................284Champepadan Creek at Co. Rd. 18 near Leota........................284Champlin, Elm Creak near .....................................................168Chanarambi Creek near Edgerton ..........................................284Chemical oxygen demand, definition of ..................................15Chippewa River near Milan ...................................................198Chippewa river near Watson ..................................................280Chisholm, Sturgeon River near ..............................................118Chlorophyll, definition of .........................................................15Classification of Records ..........................................................10Clear Lake, East Side, at Prairie Island ..................................258Clearwater ..............................................................................277Clearwater River near South Haven .......................................280Clearwater River Trib. near Bagley.........................................277Clearwater River,
at Plummer .......................................................................78at Red Lake Falls ..............................................................82

328 INDEX
PagePage
Climax, Sand Hill River at .......................................................66Cloquet River near Toimi .......................................................276Colloid, definition of ................................................................15Color unit, definition of ............................................................15Concord, Milliken Creek near ................................................282Confined aquifer, definition of .................................................15Contents ......................................................................................vContents, definition of ..............................................................15Continuous-record station, definition of ...................................15Control structure, definition of .................................................15Control, definition of ................................................................15Cooperation ................................................................................1Cottonwood River near New Ulm ..........................................210Cottonwood River near Springfield ........................................281Courtland, Little Cottonwood River .......................................214Craigville, Bowerman Brook near ..........................................278Crane Lake, Vermilion River near .........................................112Crooked Creek at Freeburg ....................................................283Crooked Creek near Hinckley ................................................282Crookston, Burnham Creek near ............................................277Crookston, Red Lake River at ..................................................84Crow River at Rockford .........................................................162Crow Wing River,
at Nimrod ........................................................................148near Pillager ....................................................................152
Cubic foot per second per square mile, definition of ...............14Cubic foot per second, definition of .........................................15Cubic foot per second-day, definition of ..................................15
DDaily record station, definition of ............................................15Daily record, definition of ........................................................15Data Collection and Computation................................................7Data Collection and Computation, records of ground-water
quality ...............................................................................13Data Presentation ........................................................................8Data Presentation, records of ground-water quality .................13Data Presentation, water quality ...............................................12Datum, definition of .................................................................15Dawson, West Branch. Lac qui Parle River at .......................192Deer Creek near Holyoke .........................................................36Definition of terms ...................................................................13Delft, Watonwan River near ...................................................281Des Moines River at Jackson .................................................270Diatom, definition of ................................................................18Diel, definition of .....................................................................15Dilworth, Buffalo River near ....................................................58Discharge, definition of ............................................................15Discontinued surface-water or stage-only stations .....................xDiscontinued surface-water-quality stations ...........................xivDissolved oxygen, definition of ...............................................15Dissolved, definition of ............................................................15Dissolved-solids concentration, definition of ...........................15Diversity index, definition of ...................................................16Doran, Bois de Sioux River near ..............................................46Downstream Order System and Station Number .......................7Drainage area, definition of ......................................................16
Drainage basin, definition of ....................................................16Drayton, ND, Red River of the North at ..................................92Dry mass, definition of .............................................................14Dry weight, definition of ..........................................................16Duluth, Lake Superior Trib. on W. 9th St. in .........................275Dumont, Twelvemile Creek near ...........................................276
EEast Branch Blue Earth River near Walters ...........................281East Fork Des Moines River near Ceylon ..............................284Edgerton, Chanarambi Creek near .........................................284Elbow Lake, Pomme de Terre River near ..............................280Elizabeth, Otter Tail River near ...............................................38Elk Creek near Lismore ..........................................................285Elk River near Big Lake .........................................................160Elk River near Brewster .........................................................284Elm Creek near Champlin ......................................................168Elm Creek near Trimont .........................................................281Ely, Kawishiwi River near .....................................................104Empire, Vermillion River near ...............................................256Enterococcus bacteria, definition of .........................................14Escherichia coli (E. coli), definition of ....................................14Euglenoids, definition of ..........................................................18Explanation of the Records, definition of ..................................7
FFairbanks, North Branch Whiteface River near .....................276Fargo, ND, Red River of the North at ......................................52Faribault, Straight River near .................................................260Fecal coliform bacteria, definition of .......................................14Fecal streptococcal bacteria, definition of ................................14Fergus Falls, Otter Tail River below Orwell Dam near ...........40Fire algae, definition of ............................................................18Fisher, Red Lake River at .........................................................86Florida Creek near Burr ..........................................................280Flow (see Discharge) ................................................................15Flow-duration percentiles, definition of ...................................16Fort Frances, Ontario, Rainy Lake near .................................116Fort Ripley, Mississippi River near ........................................279Fort Ripley, Nokassippi River ................................................279Freeburg, Crooked Creek at ...................................................283
GGage datum, definition of .........................................................16Gage height, definition of .........................................................16Gaging station, definition of .....................................................16Garden City, Watonwan River near .......................................216Gas chromatography/flame ionization detector,
definition of ......................................................................16Glaisby Brook near Kettle River ............................................282Glencoe, Buffalo Creek near ..................................................280Gold Portage Outlet from Kabetogama Lake .........................114Gonvick, Ruffy Brook near ....................................................277Goose Creek at Harris ............................................................282Grand Forks, ND, Red River of the North at ...........................88Grand Marais, Cascade River near .........................................275Grand Portage, Pigeon River at Middle Falls, near ..................30

329INDEX
Page Page
Grand Rapids, Mississippi River at ........................................138Granite Falls, Yellow Medicine River near .............................202Green algae, definition of .........................................................18Ground-water level, definition of .............................................16Ground-water levels, by county
Beltrami ..........................................................................311Morrison .........................................................................312Watonwan .......................................................................313
Grygla, Mud River near ..........................................................277
HHardness, definition of .............................................................16Harris, Goose Creek at ...........................................................282Hastings, Mississippi River below Lock and Dam 2, near .....238Hatfield, Rock River Trib. at Co. Hwy 18 near ......................284Hawley, Buffalo River near ......................................................54Henderson, High Island Creek near ........................................232Hendrum, Wild Rice River at ...................................................62Hickson, ND, Red River of the North at ..................................50High Island Creek near Henderson .........................................232High tide, definition of .............................................................16High-flow partial-record stations ...........................................275High-flow partial-record stations, discharge at ......................275Hillman Creek near Pierz .......................................................279Hinckley, Crooked Creek near ...............................................282Hoblin Creek near Pine River .................................................278Holyoke, Deer Creek near ........................................................36Holyoke, Nemadji River near .................................................276Houston, Root River near .......................................................283Houston, South Fork Root River near ....................................283Hovland, Reservation River at ...............................................275Hydrologic Bench-Mark Network, definition of ........................6Hydrologic benchmark station, definition of ............................16Hydrologic unit, definition of ...................................................16
IIdentifying Estimated Daily Discharge ....................................10Instantaneous discharge, definition of ......................................15Introduction ................................................................................1Itasca County ..........................................................................312
JJackson, Des Moines River at ................................................270Johnsburg, Little Cedar River near .........................................284Johnson Creek near St. Augusta .............................................279Jordan, Minnesota River near .................................................234Judson, Minnesota River Tributary at St. Hwy. 68 near ........281
KKawishiwi River,
near Ely ...........................................................................104near Winton ....................................................................106
Kettle River below Sandstone ................................................244Kettle River, Glaisby Brook near ...........................................282Kilkenny, Cannon River below Sabre Lake near ...................282Kingston, North Fork Crow River near ..................................280Knife River near Mora ............................................................246
Knife River near Two Harbors .................................................32
LLaboratory Measurements, surface-water quality ....................11Lac la Croix, Ontario, Namakan River at ...............................110Lac qui Parle River near Lac qui Parle ...................................194Lac qui Parle River near Providence ......................................190Lac qui Parle, Lac qui Parle River near ..................................194Lac qui Parle, Minnesota River near ......................................196Lake Bronson, South Branch Two Rivers at ............................94Lake of the Woods,
at Springsteel Island near Warroad ................................134at Warroad ......................................................................132
Lake Superior Trib. at Split Rock State Park .........................275Lake Superior Trib. on W. 9th St. in Duluth ..........................275Land-surface datum, definition of ............................................16Le Sueur River near Rapidan .................................................226Leaf River near Aldrich ..........................................................279Leota, Champepadan Creek at Co. Rd. 18 near .....................284Light-attenuation coefficient, definition of ..............................16Lipid, definition of ...................................................................16Lismore, Elk Creek near .........................................................285List of counties for which ground-water water-quality
records are published .........................................................ixList of counties for which ground-water-level records are
published ...........................................................................ixLittle Cedar River near Johnsburg ..........................................284Little Chippewa River near Starbuck .....................................280Little Cobb River near Beauford ............................................220Little Cottonwood River near Courtland .................................214Little Fork River at Littlefork .................................................126Little Marais River near Little Marais ....................................275Little Marais, Little River near ...............................................275Little Minnesota River near Peever, SD .................................180Little Rock Creek near Rushmore ..........................................285Little Rock River near Rushmore ............................................285Little Sioux River near Spafford ............................................285Littlefork, Little Fork River ....................................................126Long Prairie River at Long Prairie .........................................150Long Prairie, Long Prairie River at ........................................150Lost River at Oklee ...................................................................80Low flow, 7-day 10-year, definition of ....................................19Low tide, definition of ..............................................................16Lower Red Lake at Battle River Mouth near Saum .................70Lower Red Lake, near Red Lake ..............................................72Luverne, Rock River at............................................................285
MMacrophytes, definition of .......................................................16Malung, Roseau River below South Fork near ........................96Manitou Rapids, Rainy River at .............................................130Mankato, Minnesota River at .................................................228Maple River near Rapidan ......................................................282Marsh River Ditch near Ada ..................................................277Marsh River near Shelly ...........................................................64Marshall, Redwood River near ...............................................204Mean discharge, definition of ...................................................15

330 INDEX
PagePage
Measuring point, definition of ..................................................16Membrane filter, definition of ..................................................16Metamorphic stage, definition of .............................................16Methylene blue active substances, definition of .......................16Micrograms per gram, definition of .........................................16Micrograms per kilogram, definition of ...................................17Micrograms per liter, definition of ...........................................17Microsiemens per centimeter, definition of ..............................17Middle River at Argyle .............................................................90Middle River near Newfolden ................................................277Milan, Chippewa River near ...................................................198Mille Lacs Lake at Cove Bay near Onamia ............................164Milligrams per liter, definition of .............................................17Milliken Creek near Concord .................................................282Minneapolis, Shingle Creek at Queen Ave in ........................174Minnesota River Trib. below St. Peter ...................................282Minnesota River Tributary at St. Hwy. 68 near Judson .........281Minnesota River,
at Mankato ......................................................................228at Montevideo .................................................................200at Ortonville ....................................................................184near Jordan ......................................................................234near Lac qui Parle ...........................................................196near Morton ....................................................................208
Minnesota, South Branch Yellow Medicine River near .........281Miscellaneous site, definition of ...............................................17Miscellaneous sites, discharge at ............................................288Mississippi River at Anoka ....................................................172Mississippi River at Bemidji ..................................................278Mississippi River near Fort Ripley .........................................279Mississippi River,
at Aitkin ..........................................................................142at Brainerd ......................................................................144at Grand Rapids ..............................................................138at Prescott, WI ................................................................252at St. Cloud .....................................................................158at St. Paul ........................................................................236at Winona ........................................................................266below Lock and Dam 2, at Hastings ...............................238near Bemidji ...................................................................136near Royalton ..................................................................154
Money Creek, Campbell Valley Creek near ...........................283Montevideo, Minnesota River at ............................................200Mora, Knife River near ...........................................................246Morrison County, ground-water levels ...................................312Morton, Minnesota River near ...............................................208Most probable number (MPN), definition of ...........................17Mud Lake above White Rock Dam, near White Rock, SD ......42Mud River near Grygla ...........................................................277Multiple-plate samplers, definition of ......................................17Mustinka River above Wheaton .............................................276
NNamakan River at outlet of Lac la Croix, Ontario .................110Nanograms per liter, definition of ............................................17Nashua, Rabbit River near ......................................................276National Atmospheric Deposition and Trends Nework
(NTN), definition of ...........................................................6National Geodetic Vertical Datum of 1929, definition of ........17National Stream-Quality Accounting Network, definition of ....6National Water-Quality Assessment, definition of ....................6Natural substrate, definition of .................................................19Nekton, definition of ................................................................17Nemadji River near Holyoke ..................................................276Nephelometric turbidity unit, definition of ..............................17Nett Lake at Nett Lake ...........................................................122Nett Lake River near Nett Lake .............................................124Nett Lake, Nett Lake at ..........................................................122Nett Lake, Nett Lake River near ............................................124Nett Lake, Wood Duck Creek near ........................................120New Prague, Sand Creek near 282New Ulm, Cottonwood River near .........................................210Newfolden, Middle River near ...............................................277NGVD of 1929, definition of ...................................................17Nimrod, Cat River near ..........................................................279Nimrod, Crow Wing River at .................................................148Nokasippi River near Fort Ripley ..........................................279North American Vertical Datum of 1988, definition of ...........17North Branch Rapid River near Baudette ...............................278North Branch Whiteface River near Fairbanks ......................276North Fork Crow River near Kingston ...................................280North Fork Yellow Bank River near Odessa ...........................186Northfield, Cannon River at ...................................................282Numbering System for Wells and Miscellaneous Sites .............7
OOdessa, MN, North Fork Yellow Bank River near ................186Odessa, Yellow Bank River near ...........................................188Oklee, Lost River at ..................................................................80Onamia, Mille Lacs Lake at Cove Bay near ..........................164On-site Measurement and Collection, surface-water quality ...11Open or screened interval, definition of ...................................17Organic carbon, definition of ...................................................17Organic mass, definition of ......................................................14Organism count, definition of
Area, definition of ............................................................17Total, definition ................................................................17Volume, definition of .......................................................17
Organism, definition of ............................................................17Organochlorine compounds, definition of ................................17Ormsby, South Fork Watonwan River near ...........................281Ortonville, Minnesota River at ...............................................184Orwell Dam, Otter Tail River below ........................................40Other Records Available ..........................................................10Otter Tail River,
below Orwell Dam, near Fergus Falls ..............................40near Elizabeth ...................................................................38
PPalisade, Willow River near ...................................................278Parameter Code, definition of ..................................................17Park Rapids, Straight River near ............................................146Partial-record station, definition of ..........................................17Particle size, definition of .........................................................17

331INDEX
Page Page
Particle-size classification, definition of ..................................17Peever, SD, Little Minnesota River near ................................180Percent composition, definition of ...........................................17Periodic station, definition of ...................................................17Periphyton, definition of ...........................................................17Pesticides, definition of ............................................................18pH, definition of .......................................................................18Phytoplankton, definition of .....................................................18Picocurie, definition of .............................................................18Pierz, Hillman Creek near ......................................................279Pigeon River at Middle Falls, near Grand Portage ...................30Pillager, Crow Wing River near .............................................152Pine City, Snake River near ....................................................248Pine River near Pine River.......................................................279Pine River, Hoblin Creek near ................................................278Pine River, Pine River near ....................................................279Pipestone Creek near Pipestone ..............................................284Pipestone, Pipestone Creek near .............................................284Plankton, definition of ..............................................................18Platte River at Royalton ..........................................................279Plummer, Clearwater River at ..................................................78Polychlorinated biphenyls (PCB’s), definition of ....................18Polychlorinated naphthalenes, definition of .............................18Pomme de Terre River near Appleton ....................................280Pomme de Terre River near Elbow Lake ...............................280Prairie Island, Clear Lake, East Side near ..............................258Prairie Island, Sturgeon Lake, West Side near .......................254Prairie River, near Taconite ....................................................140Prescott, WI, Mississippi River at ..........................................252Primary productivity, definition of ............................................18
Carbon method, definition of ...........................................18Oxygen method, definition of ...........................................18
Providence, Lac qui Parle River near .....................................190
RRabbit River near Nashua .......................................................276Radioisotopes, definition of ......................................................18Rain gardens project ...............................................................307Rainy Lake near Fort Frances, Ontario ..................................116Rainy River at Manitou Rapids ..............................................130Ramsey Creek near Redwood Falls ........................................281Rapidan, Blue Earth River near ..............................................218Rapidan, Le Sueur River near ................................................226Rapidan, Maple River near .....................................................282Ray, Gold Portage Outlet from Kabetogama Lake near .........114Records of Ground-Water Quality ...........................................13Records of Surface-Water Quality ...........................................10Records Stage and Water Discharge, definition of ....................7Recoverable, bottom material, definition of .............................18Recurrence interval, definition of .............................................18Red Lake Falls, Clearwater River at .........................................82Red Lake River,
at Crookston ......................................................................84at Fisher ............................................................................86near Red Lake ...................................................................74
Red Lake, Lower Red Lake near ..............................................72Red Lake, Red Lake River near ...............................................74
Red River of the North,at Drayton, ND .................................................................92at Fargo, ND .....................................................................52at Grand Forks, ND ..........................................................88at Hickson, ND .................................................................50at Wahpeton, ND ..............................................................48
Redwood Falls, Ramsey Creek near .......................................281Redwood Falls, Redwood River near .....................................206Redwood River,
near Marshall ..................................................................204near Redwood Falls ........................................................206
Remer, Boy River near ...........................................................278Replicate samples, definition of ...............................................19Reservation River near Hovland ............................................275Ridgeway, Cedar River near ..................................................283River mile, definition of ...........................................................19River mileage, definition of ......................................................19Rochester, South Fork Zumbro River at ................................264Rock River at Luverne ...........................................................285Rock River Trib. at Co. Hwy. 18 near Hatfield .....................284Rockford, Crow River at ........................................................162Root River at Rushford ...........................................................283Root River near Houston ........................................................283Roseau River,
at Ross ............................................................................100below South Fork near Malung ........................................96below State Ditch 51, near Caribou ................................102
Ross, Roseau River at .............................................................100Royalton, Mississippi River near ...........................................154Royalton, Platte River at ........................................................279Ruffy Brook near Gonvick .....................................................277Rum River near St. Francis ....................................................166Runoff, definition of .................................................................19Rush Creek near Rushford .....................................................283Rushford, Root River at ..........................................................283Rushford, Rush Creek near ....................................................283Rushmore, Little Rock Creek near .........................................285Rushmore, Little Rock River at ..............................................285
SSabin, South Branch Buffalo River at ......................................56Sand Creek near New Prague .................................................282Sand Hill River at Climax ........................................................66Sandstone, Kettle River below ...............................................244Sauk Centre, Ashley Creek near .............................................279Sauk River near St. Cloud ......................................................156Saum, Lower Red Lake at Battle River Mouth near ................70Scanlon, St. Louis River at .......................................................34Sea level, definition of ..............................................................19Sediment ...................................................................................11Sediment, definition of .............................................................19Shaw, Bug Creek at ................................................................276Shelly, Marsh River near ..........................................................64Shingle Creek at Queen Ave in Minneapolis .........................174Silver Creek tributary near Two Harbors ...............................275Snake River near Pine City ....................................................248Sodium adsorption ratio, definition of .....................................19

332 INDEX
PagePage
Solute, definition of ..................................................................19South Branch Buffalo River at Sabin .......................................56South Branch Two Rivers at Lake Bronson .............................94South Branch Yellow Medicine River near Minneota ...........281South Fork Root River near Houston .....................................283South Fork Watonwan River near Ormsby ............................281South Fork, Roseau River below ..............................................96South Haven, Clearwater River near ......................................280Spafford, Little Sioux River near ...........................................285Special Networks and Programs .................................................6Specific conductance, definition of ..........................................19Split Rock State Park, Lake Superior Trib. at ........................275Sprague Creek, near Sprague, Manitoba ..................................98Sprague, Manitoba, Sprague Creek near...................................98Springfield, Cottonwood River ..............................................281Springsteel Island, Lake of the Woods at ...............................134St. Augusta, Johnson Creek near ............................................279St. Cloud, Mississippi River at ...............................................158St. Cloud, Sauk River near .....................................................156St. Croix Falls, WI, St. Croix River at ....................................250St. Croix River at St. Croix Falls, WI .....................................250St. Francis, Rum River near ...................................................166St. Louis River at Scanlon ........................................................34St. Paul, Mississippi River at ..................................................236St. Peter, Minnesota River Trib. below ..................................282Stable isotope ratio, definition of .............................................19Stage (see gage height) .............................................................19Stage-discharge relation, definition of .....................................19Starbuck, Little Chippewa River near ....................................280State Ditch 45 Tributary near Ulen ........................................277Station Identification Numbers, definition of .............................7Stony River near Babbitt ........................................................278Straight River near Faribault ..................................................260Straight River near Park Rapids .............................................146Streamflow, definition of ..........................................................19Sturgeon Lake, West Side, at Prairie Island ...........................254Sturgeon River near Chisholm ...............................................118Substrate, artificial, definition of ..............................................19Substrate, definition of .............................................................19Substrate, natural, definition of ................................................19Summary of Hydrologic Conditions ..........................................1Surface area, definition of ........................................................19Surface-water or stage-only stations, discontinued .............. xSurface-water stations ..............................................................27Surface-water-quality stations, discontinued ...........................xivSurficial bed material, definition of ..........................................20Suspended sediment, definition of ...........................................19Suspended sediment, mean concentration, definition of ..........19Suspended, definition of ...........................................................20
Recoverable, definition of ................................................20Total, definition of ............................................................20
Suspended-sediment concentration, definition of ....................19Suspended-sediment discharge, definition of ...........................19Suspended-sediment load, definition of ...................................19Synoptic studies, definition of ..................................................20
TTable of contents ........................................................................vTaconite, Prairie River near ....................................................140Taxonomy, definition of ...........................................................20Thief River Falls, Thief River near ..........................................76Thief River near Thief River Falls ...........................................76Time-weighted average, definition of ......................................20Toimi, Cloquet River near ......................................................276Tons per acre-foot, definition of ...............................................20Tons per day, definition of .......................................................20Total coliform bacteria, definition of .......................................14Total discharge, definition of ...................................................20Total length, definition of .........................................................20Total load, definition of ............................................................20Total organism count, definition of ..........................................17Total recoverable, definition of ................................................20Total sediment discharge, definition of ....................................19Total sediment load, definition of ............................................19Total, bottom material, definition of ........................................20Total, definition of ....................................................................20Trimont, Elm Creek near ........................................................281Trophic state indicator project ................................................301Turbidity, definition of .............................................................20Twelvemile Creek near Dumont ............................................276Twin Valley, Wild Rice River at ..............................................60Two Harbors, Knife River near ................................................32Two Harbors, Silver Creek tributary near ..............................275
UUlen, State Ditch 45 Tributary near .......................................277Upper Red Lake at Waskish .....................................................68
VValley Springs, SD, Beaver Creek at .....................................284Vermilion River near Crane Lake ..........................................112Vermillion River near Empire ................................................256Volatile organic compounds, definition of ...............................20
WWest Branch Lac qui Parle River at Dawson .........................192Wahpeton, ND, Red River of the North at ...............................48Walters, East Branch Blue Earth River near ..........................281Warroad, Lake of the Woods at ..............................................132Waskish, Upper Red Lake at ....................................................68Water level, definition of ..........................................................21Water table, definition of ..........................................................21Water temperature, surface water quality .................................11Water year, definition of ..........................................................21Water-table aquifer, definition of .............................................21Watonwan County ..................................................................313Watonwan County, ground-water levels ................................313Watonwan River near Delft ....................................................281Watonwan River near Garden City ........................................216Watson, Chippewa River near ................................................280WDR, definition of ...................................................................21Weighted average, definition of ...............................................21

333INDEX
Page Page
Welch, Cannon River at .........................................................262Well, definition of ....................................................................21Wet mass, definition of .............................................................14Wet weight, definition of ..........................................................21Wheaton, Mustinka River above ............................................276Whetstone River near Big Stone City, SD .............................182Whiskey Creek at Barnesville ................................................277White Rock SD, Mud Lake above White Rock Dam near .......42White Rock, SD, Bois de Sioux River near ..............................44Wild Rice River,
at Hendrum .......................................................................62at Twin Valley ..................................................................60
Willow River below Palisade .................................................278Winona, Mississippi River at .................................................266Winter Road River near Baudette ...........................................278Winton, Basswood River near ................................................108Winton, Kawishiwi River near ...............................................106Wood Duck Creek near Nett Lake .........................................120WSP, definition of ....................................................................21
YYellow Bank River near Odessa .............................................188Yellow Medicine River near Granite Falls .............................202
ZZooplankton, definition of ........................................................18Zumbro Falls, Zumbro River at ..............................................283Zumbro River at Zumbro Falls ...............................................283Zumbro River, South Fork, at Rochester ................................264


![Journal of the House, 84th Day · 84TH˜DAY]THURSDAY,˜MARCH˜14,˜2002 7059 STATE˜OF˜MINNESOTA EIGHTY-SECOND˜SESSION˜—˜2002 _____ EIGHTY-FOURTH˜DAY SAINT˜PAUL,˜MINNESOTA,˜THURSDAY,˜MARCH˜14,˜2002](https://img.dokumen.tips/doc/110x75/5f2a484196f5680b554c8f56/journal-of-the-house-84th-day-84thoedaythursdayoemarchoe14oe2002-7059-stateoeofoeminnesota.jpg)