Embed Size (px)
Citation preview
123
ISEIS Journal of
Environmental Informatics
Journal of Environmental Informatics 31(2) 123-136 (2018)
www.iseis.org/jei
Water Quality Risk Assessment for the Laoguanhe River of China Using a Stochastic Simulation Method
J. Hu1,2, L. Sun1, C. H. Li1,*, X. Wang1,3, X. L. Jia1, Y. P. Cai3,4,*
1Key Laboratory for Water and Sediment Sciences of the Ministry of Education, School of Environment, Beijing Normal University, Beijing
100875, China 2Graduate School of Health Sciences, Hirosaki University, Hirosaki, Aomori 036-8564, Japan
3Beijing Engineering Research Center for Watershed Environmental Restoration & Integrated Ecological Regulation, School of Environment, Beijing Normal University, Beijing 100875, China
4State Key Laboratory for Water Environment Simulation, School of Environment, Beijing Normal University, Beijing 100875, China
Received 18 October 2016; revised 25 March 2017; accepted 19 April 2017; published online March 12 2018
ABSTRACT. The Laoguanhe River is a major tributary of the Danjiang River, which is the source water for the Danjiangkou Reser- voir (i.e., the source reservoir for the middle route of the South-to-North Water Diversion Project in China). This study was intended to provide scientific decision support to help manage the water environment in the Laoguanhe River and maintain high water quality levels for the water diversion project. Risk assessment based on water quality simulation was undertaken in this research. The QUAL2Kw model was used to improve the simulations of the water quality in the Laoguanhe River under sparse data conditions. Latin hypercube sampling (LHS) was used to improve flow inputs for QUAL2Kw. The model was used to calculate water quality risks under several scenarios based on a Markov stochastic process to reflect uncertainties. The simulation results indicated that water quality of the downstream sections of the Laoguanhe River could meet the basic requirements for exporting water to the Danjiangkou Reservoir. Keywords: QUAL2Kw, Latin hypercube sampling, Markov analysis, the Laoguanhe River, stochastic simulations, South-to-North Water Diversion Project, China
1. Introduction
Along with intensive agricultural activities and rapid ur-banization and industrialization, issues of poor water quality caused by uncontrolled anthropogenic activities have gradually become an obstacle preventing sustainable development for human beings. As stated by many researchers, one of the core water quality problems is that, especially in developing areas, large amounts of agricultural, municipal and industrial waste- water are being discharged into natural water bodies, resulting in the degeneration of water quality and the inability to meet the water demands of end users,such as local residents, indus- try, and the environment (Cohen et al., 2004; Cai et al., 2009, 2011a,b; Tan et al., 2011a,b; Huang and Cao, 2011; Liu et al., 2017). Currently, water quality is a serious issue, especially for drinking water source areas. Rivers suffering from the ef- fects of anthropogenic activities because of contained pollut-
* Corresponding author. Tel.: +86 10 58802928; fax: +86 10 58802928.
E-mail address: [email protected] (C.H. Li), [email protected] (Y. P. Cai).
ISSN: 1726-2135 print/1684-8799 online © 2018 ISEIS All rights reserved. doi: 10.3808/jei.201800387
ants would easily decrease their self-purification capacities (Nak- haei and Etemad-Shahidi, 2012). Because a river has a unique self-purification capacity, it is necessary to simulate the pollut- ant loads from different sources that rivers could withstand. A number of computer-aided models are thus developed and ap- plied to predict the water quality of rivers and to simulate the fate and transport of pollutants ( Li et al., 2009, 2011; Fan et al., 2011, 2015). Over the past decades, many models have been considered suitable for water quality simulation and evalua- tion of the associated risks. They could thus be used to sup- port the formulation of future water management options and the generation of national and local water pollutant discharge standards.
Previously, many models have been proposed to address the fate and transport of water pollutants in rivers, such as WASP (Water Quality Analysis Simulation Program), EFDC (Environmental Fluid Dynamics Code), and HEC-RAS (Hy- drologic Engineering Center's River Analysis System). These tools have been widely used by many researchers to develop efficient management strategies to guarantee an adequate sup- ply of high-quality water (Cox, 2003). However, these com- plex models may not be useful models as several limitations are associated with these models (Lindenschmidt, 2006). In particular, estimation, calibration, and validation of relevant

J. Hu et al. / Journal of Environmental Informatics 31(2) 123-136 (2018)
124
parameters may require abundant monitoring data. Also, a number of parameters in certain complex simulation have sel- dom been report in the literature, meaning that there is little research to compare their accuracies (Melching and Yoon, 1996; Fan et al., 2009). The QUAL series models are useful simulation tools that have been applied extensively in water qual- ity assessment, even in cases where there are not sufficient data for the establishment complex 2D or 3D models (Nakhaei and Etemad-Shahidi, 2012). For example, QUAL2E is a typi- cal computer-aided model among the QUAL series models, the QUAL2Kw model is an the expanded version by Pelletier et al. (2006) based on QUAL2K, and it is the latest version of QUAL2E. The QUAL2Kw model can be used for automatic calibration and can be operated on a Windows interface. Com- paratively, QUAL2K can be modified by introducing multiple VBA programs (Cho and Ha, 2010; Wang et al., 2018). As stated by many researchers, QUAL2Kw can provide a plat- form for simulating the water quality of rivers and streams. It can employ a genetic algorithm to facilitate the calibration of many QUAL2Kw-based models in applications for certain water bodies. A genetic algorithm is used in the model to iden- tify the combination of parameters that results in the best fit for the application (Pelletier et al., 2006). In many research studies, QUAL2Kw have been applied to measure water envi- ronmental management strategies. Thus, it is generally conluded that the model can form the basis of water quality manage- ment (Kannel et al., 2007b; Oliveira et al., 2012). In many studies, DO, BOD, nitrogen, phosphorus and COD have been used as typical indicators to model water quality variations of streams and rivers (Kannel et al., 2007a; Camargo et al., 2010; Nakhaei and Etemad-Shahidi, 2012). The latest QUAL2Kw (i.e., QUAL2Kw version 6) was integrated with non-steady, non- uniform flow using a kinematic wave flow routing approach and has the option to use repeating diel conditions, which is simi- lar to the early version but with either steady or non-steady flows (Department of Ecology of the State of Washington, 2017). There- fore, it is feasible to assess the water quality of a natural stream or river using QUAL2Kw.
Uncertainties in input and output data are an important aspect that should be investigated to obtain water quality sim-ulation results with enhanced precision. Uncertainty analysis is a useful method to depict the uncertain relationships between modeling results and parameters. Normally, uncertainties in the input data of a model occur because of changes in natural conditions, measurement limitations, and data availability (de Kort and Booij, 2007; Shen et al., 2008; Dong et al., 2014). One way to address this issue is to use random variables as the input data rather than the conventional form of fixed val-ues (Shen et al., 2008). Stratified random procedure latin hy-percube sampling (LHS) is an effective method of sampling variables from their multivariate distributions (Minasny and McBratney, 2006; Manache and Melching, 2008). It can guar- antee uniform samples for the marginal distribution of each single input and efficiently select input variables for computer models. Uncertainty also occurs in parameters. Many methods are available for the analysis of parameter uncertainty, including
sensitivity analysis, first-order error analysis (FOEA), Bayesian, and Monte Carlo simulations (Shen et al., 2008). Markov simu- lation is also an efficient technique for simulating water quality uncertainty (Gallagher and Doherty, 2007). For the Willamette River of Oregon, US, this method provided similar results to other models with simulation data (Takyi and Lence, 1995). Markov simulations in the WASP model were demonstrated to be appropriate for parameter identification and uncertainty analysis of complex models of the Miyun Reservoir (Wang et al., 2006).
The Laoguanhe River is of significant importance for Chi- na’s largest water diversion project (i.e., the South-to-North Water Diversion Project) since the river flowing into the Dan- jiangkou Reservoir is close to Taocha, which is the intake of the middle route of the water diversion project. The Danjing- kou Reservoir is the source water area of the project, and the objective of the middle route is to provide drinking water to many cities and areas in north China. Therefore, the Danjiang- kou Reservoir must maintain high water quality. The water quality of tributaries, especially the upstream tributaries, directly affects the water quality of the reservoir. Pollution from upstream tributaries is one of the most significant pollution sources of the Danjiangkou Reservoir. Analysis of the changes of water quality in these upstream tributaries is particularly important. Thus it is necessary to investigate water quality conditions in the Laoguanhe River and analyze their impacts on the Dan- jiangkou Reservoir.
In this study, comprehensive assessment of water quality risks will be undertaken to provide a basis for optimized deci-sion-making to support water environmental protection of the Laoguanhe River. The QUAL2Kw model will be employed to simulate the water quality of the Laoguanhe River. A stochas- tic Markov process will be used to calibrate the model and calculate the water quality risks. Additionally, LHS will be used to improve the input flow to QUAL2Kw. Water quality risks will be analyzed based on the simulation results. The proposed method will offer fundamental knowledge with which to assess water quality, even when monitoring data are not sufficient. This will be extremely useful for providing basic knowledge for water quality assessments even when monitoring data are in-
Figure 1. The Laoguanhe River and its drainage area.

J. Hu et al. / Journal of Environmental Informatics 31(2) 123-136 (2018)
125
sufficient.
2. Study Area
2.1. Overview of the Study Area
The Laoguanhe River (33˚05ʹ N to 33˚48ʹ N, 111˚01ʹ E to 111˚46ʹ E), which is located in the southwest part of Henan Province, is one of the most important upstream tributaries flowing into the Danjiangkou Reservoir. The Han River and Dan River are the two main streams of the reservoir. The Lao- guanhe River originates in Luanchuan County. It flows through Lushi, Xixia and Xichuan counties. The river is approximately 254 km long and has a drainage area of approximately 4219 km2 (Figure 1). Mountains dominate the upstream basin of the Laoguanhe River with a mainstream length of 116 km, which has steep banks and an approximate forest coverage index of 90%. Below this point, the Laoguanhe River flows toward Xi- chuan County and runs through the Danjiangkou Reservoir. The Danjiangkou Reservoir is vital for China because it is the source water for the middle route of the South-to-North Water Diversion Project, which provides drinking water for northern China. The Water quality of the Laoguanhe River has evident impacts on the water quality of the Taocha intake of the Dan- jiangkou Reservoir. Therefore, it is necessary to assess the wa- ter quality risk of the Laoguanhe River.
2.2. Water Quality of the Laoguanhe River
Of the first-level branches of the Dan River and Han Riv- er, the Laoguanhe River is the smallest, and the distance be- tween the Laoguanhe River and the Taocha diversion channel is the shortest. Thus, the water quality of the Laoguanhe River has a significant impact on that of the Taocha diversion chan- nel (Chen et al., 2012; Sun et al., 2017). The Laoguanhe River has multiple tributaries, and many pollutants are directly or indirectly discharged into the river. Thus, the water quality of the Laoguanhe River is relatively poor. It is usually in level IV or V as evaluated by the surface water environmental quality standard of China (i.e., GB3838-2002). According to field in- vestigations, the major source of industrial pollution into the Laoguanhe River is wastewater discharge from papermaking facilities and pharmaceutical companies. The major source of domestic pollution is household garbage, and the major agricul- tural pollution sources are the extensive application of pesti- cides and fertilizers as well as livestock and poultry farming. From this point onwards, the DO concentrations decrease and the COD and NH3-N concentrations rapidly increase, which shows that the water quality begins to deteriorate. The intense pollution and vital influence of the Laoguanhe River on the Danjiangkou Reservoir indicate that water quality simulations are required to prevent future deterioration of the water quality.
3. Modeling Formulation
3.1. Description of QUAL2Kw
According to the latest reports, QUAL2Kw is a modern- ized version of the one-dimensional water quality model QU-
AL2E and incorporates updated scientific techniques. It was developed by Tufts University and the Washington State De- partment of Ecology in 2006 based on the QUAL2K model (for details, please refer to www.ecy.wa.gov/programs/eap/mod- els.html). Compared to the original QUAL2K model, QUAL- 2Kw can simulate steady flows with repeating diel boundary conditions and with non-steady and non-uniform flows through kinematic wave flow routing. It also has an improved genetic algorithm GA-based auto-calibration module to maximize the adjustment of the simulated results based on limited field- measured data. QUAL2Kw is a multipurpose model for simu- lating water quality in rivers and streams and is widely used in North America, Asia and Europe. It can effectively simulate the transport, migration and transformation processes of many constituents (i.e., BOD, DO, NH3-N, and pH) (Pelletier et al., 2006). When using QUAL2Kw, the river must be divided into several complete reaches. Each reach is considered a research unit, and the hydrological and water quality conditions in a unit are assumed to be homogeneous.
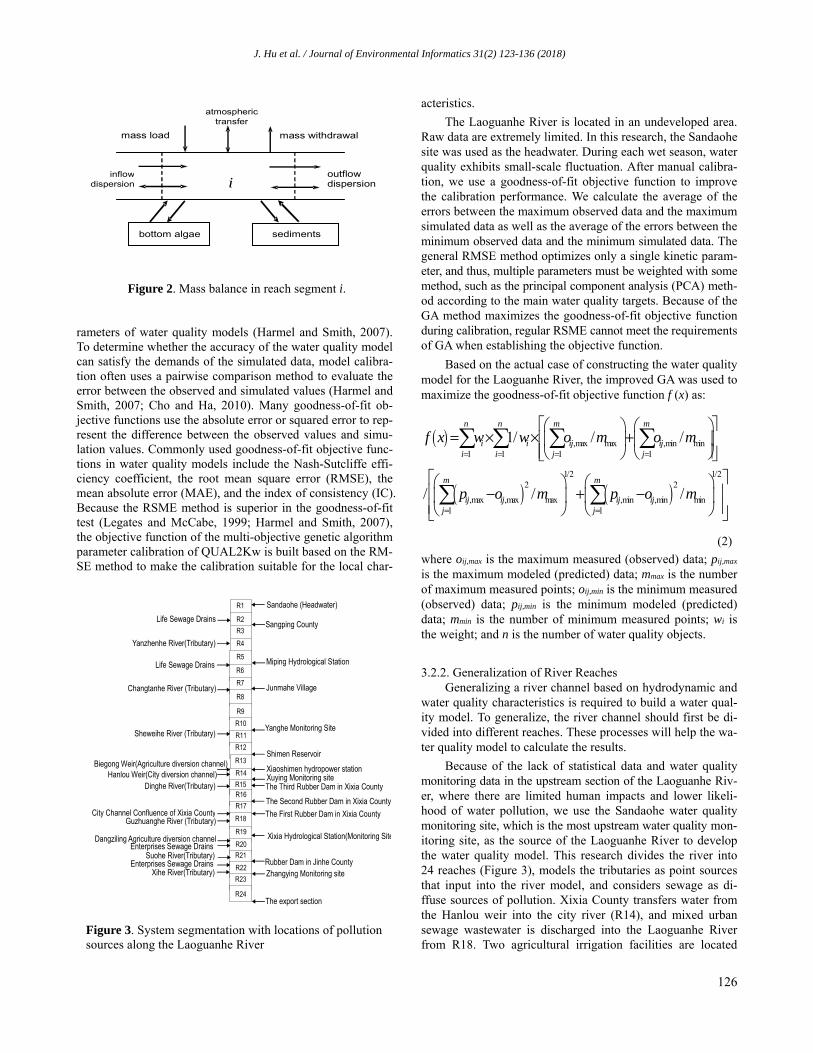
For all variables except the bottom algae, the general mass balance for a constituent (C) in an element (i) (Figure 2) can be presented as (Pelletier et al., 2006):
( )
( ) ii
iii
i
i
iii
ii
i
iouti
i
ii
i
ii
SV
Wcc
V
E
ccV
Ec
V
Qc
V
Qc
V
Q
dt
dc
++−+
−+−−=
+
−−
−−
1
'
1
'1,
11
(1)
where Qi and Qout,i are the flow and abstraction flow in reach, respectively, i (L/d), Wi is the external load of the constituent on reach i (mg/d), Vi is the volume of reach i (L), Si represents the sources and sinks of the constituent because of their reactions and mass transfer mechanisms (mg/L/d), Ei is the bulk disper- sion coefficient between the reaches (L/d), Ei-1 and Ei are the bulk dispersion coefficients between reaches i-1 and i and i+1 (L/d), ci is the concentration of the water quality constituent in reach i (mg/L), and t is the time (day).
The QUAL2Kw model consists of multiple complex dif- ferential equations; it is thus difficult to locate an analytical solution. The model uses a finite difference method to identify numerical solutions. Users can solve it based on the Euler meth- od, the Runge-Kutta method or the adaptive step algorithm ac- cording to the required calculation accuracy. Additionally, the QUAL2Kw model is complex because it includes numerous pa- rameters and the correlation relations. Therefore, GA, an auto- matic global calibration method, is used. The model uses GA to maximize the goodness-of-fit of the simulated results to the observed data. A detailed description of the automatic calibra- tion method can be found in Pelletier et al. (2006).
3.2. Model Calibration and Validation
3.2.1. Improvement of the goodness-of-fit objective function for calibration The method of comparing two evaluation errors between observed and simulated data is important in calibrating the pa-
J. Hu et al. / Journal of Environmental Informatics 31(2) 123-136 (2018)
126
rameters of water quality models (Harmel and Smith, 2007). To determine whether the accuracy of the water quality model can satisfy the demands of the simulated data, model calibra-tion often uses a pairwise comparison method to evaluate the error between the observed and simulated values (Harmel and Smith, 2007; Cho and Ha, 2010). Many goodness-of-fit ob-jective functions use the absolute error or squared error to rep- resent the difference between the observed values and simu- lation values. Commonly used goodness-of-fit objective func- tions in water quality models include the Nash-Sutcliffe effi- ciency coefficient, the root mean square error (RMSE), the mean absolute error (MAE), and the index of consistency (IC). Because the RSME method is superior in the goodness-of-fit test (Legates and McCabe, 1999; Harmel and Smith, 2007), the objective function of the multi-objective genetic algorithm parameter calibration of QUAL2Kw is built based on the RM- SE method to make the calibration suitable for the local char-
acteristics.
The Laoguanhe River is located in an undeveloped area. Raw data are extremely limited. In this research, the Sandaohe site was used as the headwater. During each wet season, water quality exhibits small-scale fluctuation. After manual calibra-tion, we use a goodness-of-fit objective function to improve the calibration performance. We calculate the average of the errors between the maximum observed data and the maximum simulated data as well as the average of the errors between the minimum observed data and the minimum simulated data. The general RMSE method optimizes only a single kinetic param- eter, and thus, multiple parameters must be weighted with some method, such as the principal component analysis (PCA) meth- od according to the main water quality targets. Because of the GA method maximizes the goodness-of-fit objective function during calibration, regular RSME cannot meet the requirements of GA when establishing the objective function.
Based on the actual case of constructing the water quality model for the Laoguanhe River, the improved GA was used to maximize the goodness-of-fit objective function f (x) as:
( )
( ) ( )
,max max ,min min1 1 1 1
1/2 1/22 2
,max ,max max ,min ,min min1 1
1/ / /
/ / /
n n m m
i i ij iji i j j
m m
ij ij ij ijj j
f x w w o m o m
p o m p o m
= = = =
= =
= × × +
− + −
(2)
where oij,max is the maximum measured (observed) data; pij,max is the maximum modeled (predicted) data; mmax is the number of maximum measured points; oij,min is the minimum measured (observed) data; pij,min is the minimum modeled (predicted) data; mmin is the number of minimum measured points; wi is the weight; and n is the number of water quality objects.
3.2.2. Generalization of River Reaches Generalizing a river channel based on hydrodynamic and
water quality characteristics is required to build a water qual- ity model. To generalize, the river channel should first be di- vided into different reaches. These processes will help the wa- ter quality model to calculate the results.
Because of the lack of statistical data and water quality monitoring data in the upstream section of the Laoguanhe Riv- er, where there are limited human impacts and lower likeli- hood of water pollution, we use the Sandaohe water quality monitoring site, which is the most upstream water quality mon- itoring site, as the source of the Laoguanhe River to develop the water quality model. This research divides the river into 24 reaches (Figure 3), models the tributaries as point sources that input into the river model, and considers sewage as di- ffuse sources of pollution. Xixia County transfers water from the Hanlou weir into the city river (R14), and mixed urban sewage wastewater is discharged into the Laoguanhe River from R18. Two agricultural irrigation facilities are located
Life Sewage Drains
Sandaohe (Headwater)
Yanzhenhe River(Tributary)
Sangping County
Life Sewage Drains
Changtanhe River (Tributary)
Sheweihe River (Tributary)
Biegong Weir(Agriculture diversion channel) Hanlou Weir(City diversion channel)
Dinghe River(Tributary)
City Channel Confluence of Xixia County Guzhuanghe River (Tributary)
Dangziling Agriculture diversion channel Enterprises Sewage Drains
Suohe River(Tributary) Enterprises Sewage Drains
Xihe River(Tributary)
Miping Hydrological Station
Junmahe Village
Yanghe Monitoring Site
Shimen Reservoir
Xiaoshimen hydropower stationXuying Monitoring site The Third Rubber Dam in Xixia County
The Second Rubber Dam in Xixia County
The First Rubber Dam in Xixia County
Xixia Hydrological Station(Monitoring Site
Rubber Dam in Jinhe CountyZhangying Monitoring site
The export section
R1
R2 R3
R4
R5
R6
R7
R8
R9
R10 R11 R12
R13
R14 R15 R16 R17
R18
R19
R20 R21
R22 R23
R24
Figure 3. System segmentation with locations of pollution sources along the Laoguanhe River
iinflow
dispersionoutflow dispersion
mass load mass withdrawal
atmospheric transfer
sediments bottom algae
Figure 2. Mass balance in reach segment i.
J. Hu et al. / Journal of Environmental Informatics 31(2) 123-136 (2018)
127
along the Laoguanhe River: the Biegong weir at R14 and the Dangziling irrigation diversion canal at R20. Four rubber dams are located along the river, including three dams in Xixia County (R15~R18) and one located downstream of the Jinhe Bridge in Xichuan County (R21). As reported, R11~R12 include a channel-type reservoir called the Shimen Reservoir. Because the reservoir has no diversion effect and is mainly used for storing water, it is set as a weir in the computation.
3.2.3. Model Calibration
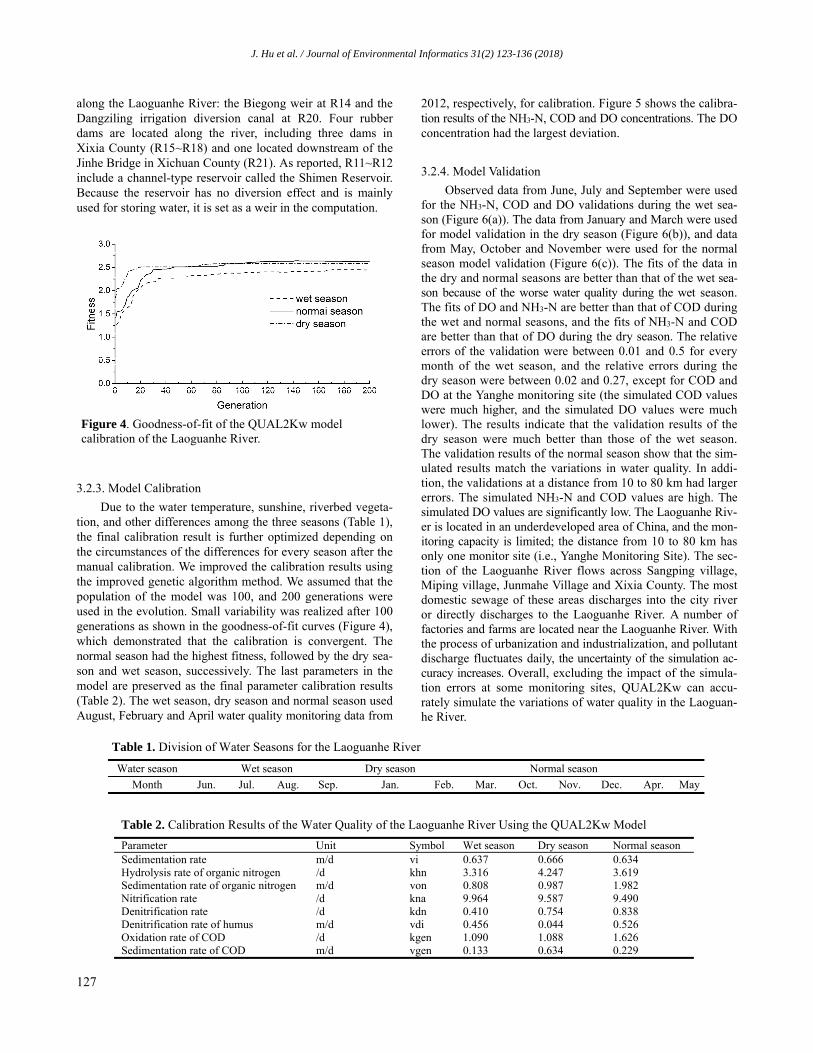
Due to the water temperature, sunshine, riverbed vegeta-tion, and other differences among the three seasons (Table 1), the final calibration result is further optimized depending on the circumstances of the differences for every season after the manual calibration. We improved the calibration results using the improved genetic algorithm method. We assumed that the population of the model was 100, and 200 generations were used in the evolution. Small variability was realized after 100 generations as shown in the goodness-of-fit curves (Figure 4), which demonstrated that the calibration is convergent. The normal season had the highest fitness, followed by the dry sea- son and wet season, successively. The last parameters in the model are preserved as the final parameter calibration results (Table 2). The wet season, dry season and normal season used August, February and April water quality monitoring data from
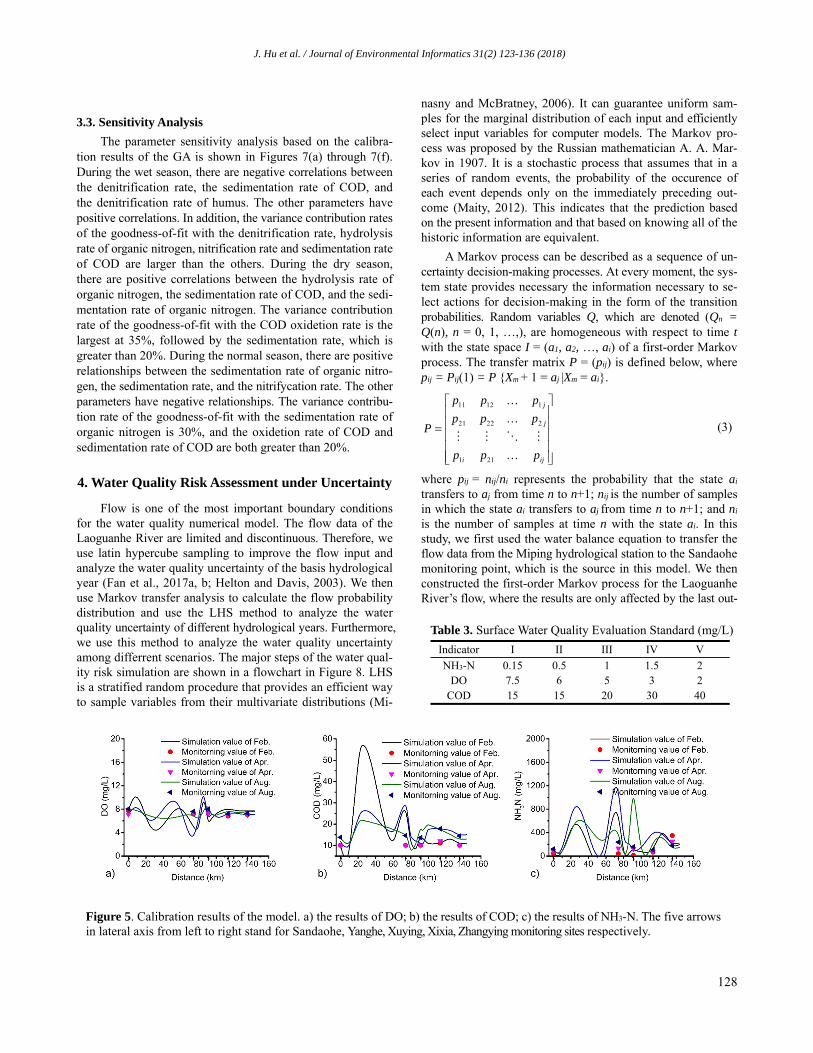
2012, respectively, for calibration. Figure 5 shows the calibra- tion results of the NH3-N, COD and DO concentrations. The DO concentration had the largest deviation.
3.2.4. Model Validation
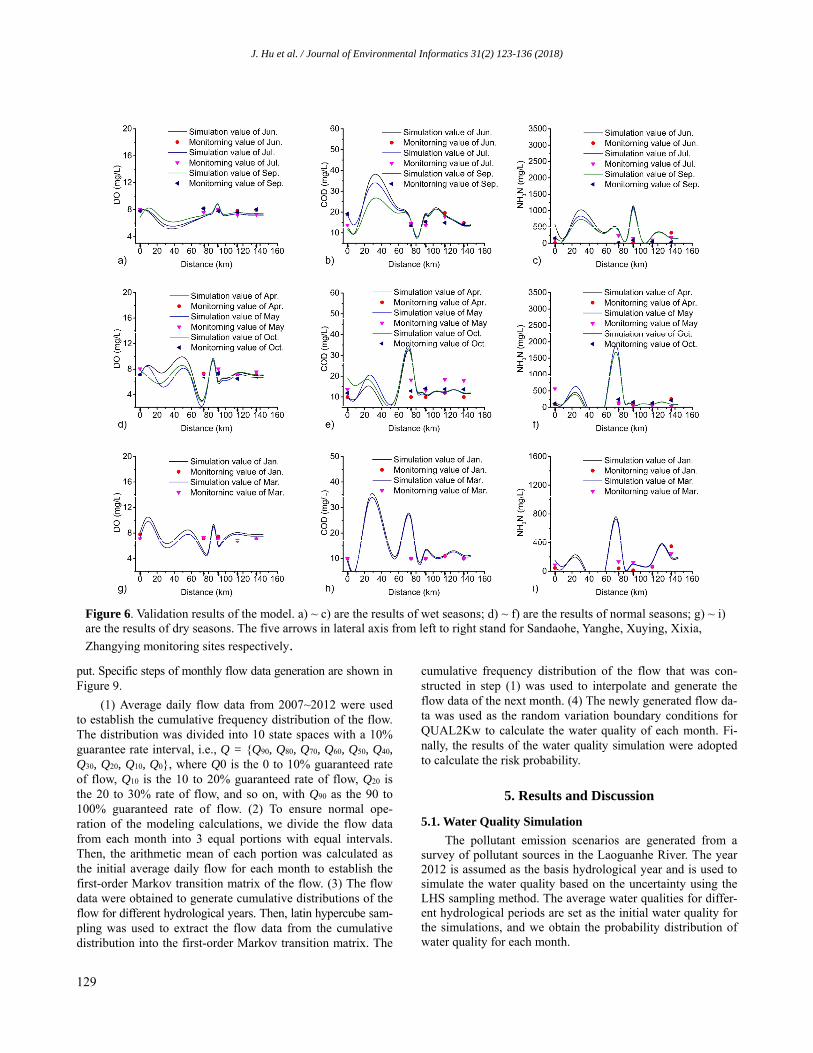
Observed data from June, July and September were used for the NH3-N, COD and DO validations during the wet sea-son (Figure 6(a)). The data from January and March were used for model validation in the dry season (Figure 6(b)), and data from May, October and November were used for the normal season model validation (Figure 6(c)). The fits of the data in the dry and normal seasons are better than that of the wet sea- son because of the worse water quality during the wet season. The fits of DO and NH3-N are better than that of COD during the wet and normal seasons, and the fits of NH3-N and COD are better than that of DO during the dry season. The relative errors of the validation were between 0.01 and 0.5 for every month of the wet season, and the relative errors during the dry season were between 0.02 and 0.27, except for COD and DO at the Yanghe monitoring site (the simulated COD values were much higher, and the simulated DO values were much lower). The results indicate that the validation results of the dry season were much better than those of the wet season. The validation results of the normal season show that the sim- ulated results match the variations in water quality. In addi- tion, the validations at a distance from 10 to 80 km had larger errors. The simulated NH3-N and COD values are high. The simulated DO values are significantly low. The Laoguanhe Riv- er is located in an underdeveloped area of China, and the mon- itoring capacity is limited; the distance from 10 to 80 km has only one monitor site (i.e., Yanghe Monitoring Site). The sec- tion of the Laoguanhe River flows across Sangping village, Miping village, Junmahe Village and Xixia County. The most domestic sewage of these areas discharges into the city river or directly discharges to the Laoguanhe River. A number of factories and farms are located near the Laoguanhe River. With the process of urbanization and industrialization, and pollutant discharge fluctuates daily, the uncertainty of the simulation ac- curacy increases. Overall, excluding the impact of the simula- tion errors at some monitoring sites, QUAL2Kw can accu- rately simulate the variations of water quality in the Laoguan- he River.
Table 1. Division of Water Seasons for the Laoguanhe River
Water season Wet season Dry season Normal season
Month Jun. Jul. Aug. Sep. Jan. Feb. Mar. Oct. Nov. Dec. Apr. May
Table 2. Calibration Results of the Water Quality of the Laoguanhe River Using the QUAL2Kw Model
Parameter Unit Symbol Wet season Dry season Normal season Sedimentation rate m/d vi 0.637 0.666 0.634 Hydrolysis rate of organic nitrogen /d khn 3.316 4.247 3.619 Sedimentation rate of organic nitrogen m/d von 0.808 0.987 1.982 Nitrification rate /d kna 9.964 9.587 9.490 Denitrification rate /d kdn 0.410 0.754 0.838 Denitrification rate of humus m/d vdi 0.456 0.044 0.526 Oxidation rate of COD /d kgen 1.090 1.088 1.626 Sedimentation rate of COD m/d vgen 0.133 0.634 0.229
Figure 4. Goodness-of-fit of the QUAL2Kw model calibration of the Laoguanhe River.
J. Hu et al. / Journal of Environmental Informatics 31(2) 123-136 (2018)
128
3.3. Sensitivity Analysis
The parameter sensitivity analysis based on the calibra-tion results of the GA is shown in Figures 7(a) through 7(f). During the wet season, there are negative correlations between the denitrification rate, the sedimentation rate of COD, and the denitrification rate of humus. The other parameters have positive correlations. In addition, the variance contribution rates of the goodness-of-fit with the denitrification rate, hydrolysis rate of organic nitrogen, nitrification rate and sedimentation rate of COD are larger than the others. During the dry season, there are positive correlations between the hydrolysis rate of organic nitrogen, the sedimentation rate of COD, and the sedi- mentation rate of organic nitrogen. The variance contribution rate of the goodness-of-fit with the COD oxidetion rate is the largest at 35%, followed by the sedimentation rate, which is greater than 20%. During the normal season, there are positive relationships between the sedimentation rate of organic nitro- gen, the sedimentation rate, and the nitrifycation rate. The other parameters have negative relationships. The variance contribu- tion rate of the goodness-of-fit with the sedimentation rate of organic nitrogen is 30%, and the oxidetion rate of COD and sedimentation rate of COD are both greater than 20%.
4. Water Quality Risk Assessment under Uncertainty
Flow is one of the most important boundary conditions for the water quality numerical model. The flow data of the Laoguanhe River are limited and discontinuous. Therefore, we use latin hypercube sampling to improve the flow input and analyze the water quality uncertainty of the basis hydrological year (Fan et al., 2017a, b; Helton and Davis, 2003). We then use Markov transfer analysis to calculate the flow probability distribution and use the LHS method to analyze the water quality uncertainty of different hydrological years. Furthermore, we use this method to analyze the water quality uncertainty among differrent scenarios. The major steps of the water qual- ity risk simulation are shown in a flowchart in Figure 8. LHS is a stratified random procedure that provides an efficient way to sample variables from their multivariate distributions (Mi-
nasny and McBratney, 2006). It can guarantee uniform sam- ples for the marginal distribution of each input and efficiently select input variables for computer models. The Markov pro- cess was proposed by the Russian mathematician A. A. Mar- kov in 1907. It is a stochastic process that assumes that in a series of random events, the probability of the occurence of each event depends only on the immediately preceding out-come (Maity, 2012). This indicates that the prediction based on the present information and that based on knowing all of the historic information are equivalent.
A Markov process can be described as a sequence of un-certainty decision-making processes. At every moment, the sys- tem state provides necessary the information necessary to se- lect actions for decision-making in the form of the transition probabilities. Random variables Q, which are denoted (Qn = Q(n), n = 0, 1, …,), are homogeneous with respect to time t with the state space I = (a1, a2, …, ai) of a first-order Markov process. The transfer matrix P = (pij) is defined below, where pij = Pij(1) = P {Xm + 1 = aj |Xm = ai}.
11 12 1
21 22 2
1 21
j
j
i ij
p p p
p p pP
p p p
=
(3)
where pij = nij/ni represents the probability that the state ai transfers to aj from time n to n+1; nij is the number of samples in which the state ai transfers to aj from time n to n+1; and ni is the number of samples at time n with the state ai. In this study, we first used the water balance equation to transfer the flow data from the Miping hydrological station to the Sandaohe monitoring point, which is the source in this model. We then constructed the first-order Markov process for the Laoguanhe River’s flow, where the results are only affected by the last out-
Figure 5. Calibration results of the model. a) the results of DO; b) the results of COD; c) the results of NH3-N. The five arrows in lateral axis from left to right stand for Sandaohe, Yanghe, Xuying, Xixia, Zhangying monitoring sites respectively.
Table 3. Surface Water Quality Evaluation Standard (mg/L) Indicator I II III IV V
NH3-N 0.15 0.5 1 1.5 2 DO 7.5 6 5 3 2
COD 15 15 20 30 40
J. Hu et al. / Journal of Environmental Informatics 31(2) 123-136 (2018)
129
put. Specific steps of monthly flow data generation are shown in Figure 9.
(1) Average daily flow data from 2007~2012 were used to establish the cumulative frequency distribution of the flow. The distribution was divided into 10 state spaces with a 10% guarantee rate interval, i.e., Q = {Q90, Q80, Q70, Q60, Q50, Q40, Q30, Q20, Q10, Q0}, where Q0 is the 0 to 10% guaranteed rate of flow, Q10 is the 10 to 20% guaranteed rate of flow, Q20 is the 20 to 30% rate of flow, and so on, with Q90 as the 90 to 100% guaranteed rate of flow. (2) To ensure normal ope- ration of the modeling calculations, we divide the flow data from each month into 3 equal portions with equal intervals. Then, the arithmetic mean of each portion was calculated as the initial average daily flow for each month to establish the first-order Markov transition matrix of the flow. (3) The flow data were obtained to generate cumulative distributions of the flow for different hydrological years. Then, latin hypercube sam- pling was used to extract the flow data from the cumulative distribution into the first-order Markov transition matrix. The
cumulative frequency distribution of the flow that was con- structed in step (1) was used to interpolate and generate the flow data of the next month. (4) The newly generated flow da- ta was used as the random variation boundary conditions for QUAL2Kw to calculate the water quality of each month. Fi- nally, the results of the water quality simulation were adopted to calculate the risk probability.
5. Results and Discussion
5.1. Water Quality Simulation
The pollutant emission scenarios are generated from a survey of pollutant sources in the Laoguanhe River. The year 2012 is assumed as the basis hydrological year and is used to simulate the water quality based on the uncertainty using the LHS sampling method. The average water qualities for differ- ent hydrological periods are set as the initial water quality for the simulations, and we obtain the probability distribution of water quality for each month.
Figure 6. Validation results of the model. a) ~ c) are the results of wet seasons; d) ~ f) are the results of normal seasons; g) ~ i) are the results of dry seasons. The five arrows in lateral axis from left to right stand for Sandaohe, Yanghe, Xuying, Xixia,
Zhangying monitoring sites respectively.

J. Hu et al. / Journal of Environmental Informatics 31(2) 123-136 (2018)
130
With the increasing frequency of extreme climates, drought and flood frequently occur in China. Under this consideration, we set three guaranteed flow rate scenarios for different hy- drological years. Based on the cumulative distribution of flow for every January from 2006 to 2012, the initial month’s flow in a flood year is based on the 0 to 25% guaranteed flow rate and that for a dry year is based on the 75 to 100% guaranteed flow rate, and that for a level year is based on the 25 to 50% guar- anteed flow rate. These data were applied to simulate water quality for the entire year. The water quality probability distributions of the wet season, dry season and normal season in each year can then be simulated. The water quality evaluation is based on the surface water quality environment standard of China (GB3838-2002) (Table 3); the water quality needs to meet the level-II standard.
5.1.1. Risk of a Basis Hydrological Year
For QUAL2Kw, the average daily flow data from Janu- ary to November 2012 are the most important inputs. The flow data are used for LHS sampling. The monitoring data for every month are used as the initial boundary conditions of water quality. The results of the water quality model are adopted to calculate the water quality risk probability and analyze the environ- mental risk (Figure 10, and the complete results can be referred to Table S1 in supplementary information).
The results show that the simulated water qualities at the Xuying, Xixia, and Zhangying monitoring sites in the basis year meet the water quality targets and that the water that is exported from the Laoguanhe River to the Danjiangkou Res- ervoir meets the level-II standard. The water quality analysis
of each season shows the following. (1) The dry season occurs in January, February, and March. The general trends of the water quality of each month during the dry season were simi- lar, and the concentration of pollution decreases gradually during this season. The NH3-N concentration was highest at the Zhang- ying site, with values between 0.30 and 0.43 mg/L, and gener- ally remained at the level-II surface water quality standard. The DO concentration decreases every month, especially at the Xi- xia hydrological station; the probability of DO non-compliance is 65%. (2) The normal season occurs in April and May and again in October and November. DO concentrations that exceed the standard are the main threat to water quality during the normal season. The probability of DO non-compliance at the Xixia hydrological station is 58% in April and nearly 100% in May. The concentration of COD at the Xixia hydrological station was also higher than at the other sites, and the proba- bility of non-compliance in November is nearly 100%. The con- centration of NH3-N at the Zhangying monitoring site is highest but still remained within the level-II standard. (3) The wet season occurs from June to September. During the wet season, the water quality was mainly threatened by COD. Agriculture is one of the most important industries in the Laoguanhe River basin, and these areas have limited domestic sewage treatment facilities; during the wet season, the domestic sew- age and chemical fertilizer have more opportunity to be rushed into the Laoguanhe River, which would increase the risk of non- compliance. The concentrations of COD at the Zhangying mon- itoring site were between 14.9 and 17.5 mg/L, and the risk of non-compliance was 96% in June and 89% in September. The concentrations of COD at the Xuying monitoring site and Xi- xia hydrological station were also relatively high; the average concentrations were 13.15 and 13.49 mg/L, respectively. The
Figure 8. Water quality risk assessment flowchart.
Figure 7. Parameter sensitivity analysis. a) parameter sensitivity analysis result in wet season; b) variance contribution rates of the parameters in wet season; c) parameter sensitivity analysis result in dry season; d) variance contribution rates of the parameters in dry season; e) parameter sensitivity analysis result in normal season; f) variance contribution rates of the parameters in normal season.
J. Hu et al. / Journal of Environmental Informatics 31(2) 123-136 (2018)
131
overall trends in July and August were the same as in June, and there was some improvement. The probability of the COD con- centration exceeding the standard at the Zhangying monitoring site decreased to 19 and 37%. However, in September, the water quality decreased, and the probability of the COD concentra-tion exceeding the standard increased to 89%. At the same time, the probability at the Xixia hydrological station was 14%.
Thus, during the dry season, the Xixia hydrological sta- tion had a relatively high probability of exceeding the stan- dards. During the normal season, the main threat was from DO exceeding the water quality standards at the Xixia hydrol- ogical station, and during the wet season, the water at the Zhang- ying monitoring site threatened to not meet the standards.
Although the simulation results at the Zhangying monitoring site did not show substandard water, it is the nearest moni- toring site to the Danjiangkou Reservoir, so it still poses some level of threat.
5.1.2. Risk of Multiple Hydrological Years
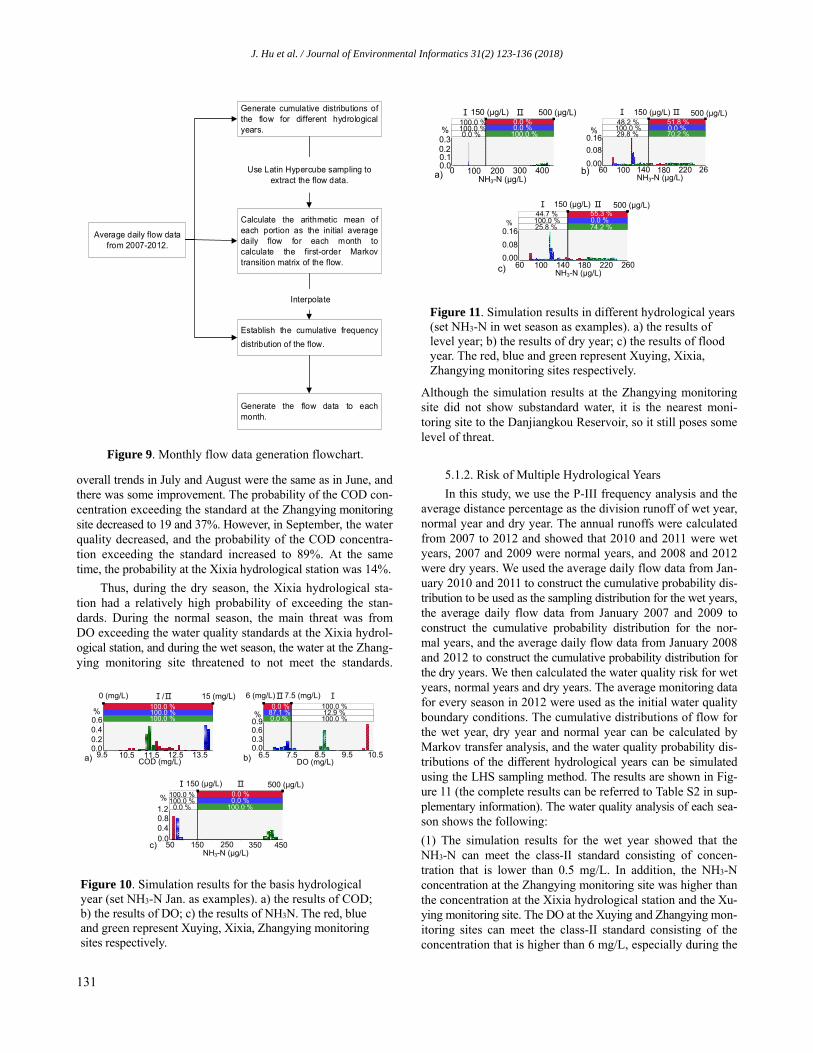
In this study, we use the P-ІІІ frequency analysis and the average distance percentage as the division runoff of wet year, normal year and dry year. The annual runoffs were calculated from 2007 to 2012 and showed that 2010 and 2011 were wet years, 2007 and 2009 were normal years, and 2008 and 2012 were dry years. We used the average daily flow data from Jan- uary 2010 and 2011 to construct the cumulative probability dis- tribution to be used as the sampling distribution for the wet years, the average daily flow data from January 2007 and 2009 to construct the cumulative probability distribution for the nor- mal years, and the average daily flow data from January 2008 and 2012 to construct the cumulative probability distribution for the dry years. We then calculated the water quality risk for wet years, normal years and dry years. The average monitoring data for every season in 2012 were used as the initial water quality boundary conditions. The cumulative distributions of flow for the wet year, dry year and normal year can be calculated by Markov transfer analysis, and the water quality probability dis- tributions of the different hydrological years can be simulated using the LHS sampling method. The results are shown in Fig- ure 11 (the complete results can be referred to Table S2 in sup- plementary information). The water quality analysis of each sea- son shows the following:
(1) The simulation results for the wet year showed that the NH3-N can meet the class-II standard consisting of concen- tration that is lower than 0.5 mg/L. In addition, the NH3-N concentration at the Zhangying monitoring site was higher than the concentration at the Xixia hydrological station and the Xu- ying monitoring site. The DO at the Xuying and Zhangying mon- itoring sites can meet the class-II standard consisting of the concentration that is higher than 6 mg/L, especially during the
Average daily flow data from 2007-2012.
Generate cumulative distributions of the flow for different hydrological years.
Calculate the arithmetic mean of each portion as the initial average daily flow for each month to calculate the first-order Markov transition matrix of the flow.
Establish the cumulative frequency
distribution of the flow.
Generate the flow data to each month.
Use Latin Hypercube sampling to extract the flow data.
Interpolate
Figure 9. Monthly flow data generation flowchart.
100.0 %
0.0 % 100.0 % 0.0 % 0.0 % 100.0 %
0 100 200 300 400
NH3-N (μg/L)
0.00.10.2
0.3
Ⅰ 150 (μg/L) Ⅱ 500 (μg/L)
%48.2 %
51.8 %
100.0 %
0.0 %29.8 % 70.2 %
60 100 140 180 220 26NH3-N (μg/L)
0.00
0.08
0.16
Ⅰ 150 (μg/L) Ⅱ 500 (μg/L)
%
44.7 % 55.3 % 100.0 % 0.0 %
25.8 % 74.2 %
60 100 140 180 220 260 NH3-N (μg/L)
0.00
0.08
0.16
Ⅰ 150 (μg/L) Ⅱ 500 (μg/L)
%
a) b)
c)
Figure 11. Simulation results in different hydrological years (set NH3-N in wet season as examples). a) the results of level year; b) the results of dry year; c) the results of flood year. The red, blue and green represent Xuying, Xixia, Zhangying monitoring sites respectively.
100.0 % 100.0 % 100.0 %
9.5 10.5 11.5 12.5 13.5
COD (mg/L)
0.00.20.40.6
0 (mg/L) Ⅰ/Ⅱ 15 (mg/L)
%
0.0 %
100.0 % 87.1 %
12.9 %
0.0 % 100.0 %
6.5 7.5 8.5 9.5 10.5DO (mg/L)
0.00.30.6 0.9
6 (mg/L) Ⅱ7.5 (mg/L)
Ⅰ
%
100.0 %
0.0 % 100.0 %
0.0 % 0.0 % 100.0 %
500 (μg/L)
50 150 250 350 450 NH3-N (μg/L)
0.00.40.81.2
%
Ⅰ150 (μg/L) Ⅱ
a) b)
c)
Figure 10. Simulation results for the basis hydrological year (set NH3-N Jan. as examples). a) the results of COD; b) the results of DO; c) the results of NH3N. The red, blue and green represent Xuying, Xixia, Zhangying monitoring sites respectively.
J. Hu et al. / Journal of Environmental Informatics 31(2) 123-136 (2018)
132
73.4 % 26.6 %
100.0 % 0.0 % 40.1 % 59.9 %
60 100 140 180 220NH3-N (μg/L)
0.0
0.1
0.2
150 (μg/L) 500 (μg/L)
%
72.9 % 27.1 %
100.0 % 0.0 %
42.2 % 57.8 %
60 100 140 180 220NH3-N (μg/L)
0.0
0.1
0.2
Ⅰ 150 (μg/L) Ⅱ 500 (μg/L)
%
73.9 % 26.1 %100.0 % 0.0 %
43.2 % 56.8 %
6 100 140
180 220NH3-N (μg/L)
0.0
0.1
0.2%
Ⅰ 150 (μg/L) Ⅱ 500 (μg/L)
a) b)
c)
Figure 12. Results for a 20% decrease of pollutants in different hydrological years (set NH3-N in wet season as examples). a) the results of level year; b) the results of dry year; c) the results of flood year. The red, blue and green represent Xuying, Xixia, Zhangying monitoring sites respectively.
dry season and normal season, when it can meet the class-I stan- dard; however, the probability of DO non-compliance at the Xi- xia hydrological station was 0.8% during the dry season and 8.2% during the normal season. The COD at the Xuying mon- itoring site and the Xixia hydrological station can meet the class-II standard; however, the Zhangying monitoring site, which is the closest monitoring site to the Danjiangkou Reservoir, had a probability of COD non-compliance of approximately 26.5% during the wet season.
(2) During the dry year, the water quality was poor at the Zhangying monitoring site and Xixia hydrological station. The probability of COD non-compliance was 25.1% at the Zhang- ying monitoring site during the wet season. At the Xixia hydrol- ogical station, the probability of DO exceeding the standard during the dry season and the normal season are 0.6 and 10.6%, re- spectively. The Zhangying monitoring site has a 0.1% proba- bility of NH3-N exceeding the standard of 500 µg/L.
(3) During the normal year, the DO concentrations were higher than 6 mg/L at the Xixia hydrological station, except
for during the wet season. The probabilities of DO non-compli- ance during the dry season and the normal season are 1.8 and 9.2%, respectively. The NH3-N can meet the class-II standard because the concentrations are less than 500 µg/L for the en- tire year. The COD concentration was high during the wet sea- son, and the probability of the concentration exceeding 15 mg/L at the Zhangying monitoring site is approximately 27.1%.
5.2. Prediction of Pollutants under Multiple Pollution Loading Conditions
With the development of urbanization and industrializa-tion, pollutant discharge fluctuates significantly. Different coun- termeasures will cause different results. In this study, water quality simulations were performed for four scenarios. We make the small decreasing, mild decreasing, small increasing and heavy increasing of pollutant emissions to present the differ- rent water pollution control levels. Accordingly, the scenarios considered pollutant emissions that decreased by 20 and 50% and increased by 20 and 50%, respectively.
(1) Scenario 1: 20% decrease in pollutant emissions
During a flood year, COD always meets the water quality requirement at the entry of the Laoguanhe River into the Dan- jiangkou Reservoir. DO is significant at the Xixia hydrological station. The probability of DO non-compliance is 0.3% during the dry season and 5.2% during the normal season at the Xixia hydrological station, and the Zhangying monitoring site has a 0.1% probability of NH3-N exceeding 500 µg/L (Figure 12, Table S3). During a dry year, NH3-N and COD meet the basic requirements of water quality at the entry of the Laoguanhe River into the Danjiangkou Reservoir. The DO is significant during the dry and normal seasons. The probability of DO non- compliance is 0.2% during the dry season and 6.7% during the normal season at the Xixia hydrological station (Table S3). During a level year, the COD emissions can meet the require- ments of the class-II water quality standard at the entry of the river into the Danjiangkou Reservoir. The water quality is poor during the normal season; the probability of DO non-compli- ance is 7% at the Xixia hydrological station, and the proba- bility of NH3-N non-compliance is 1% at the Zhangying mon- itoring station (Table S3).
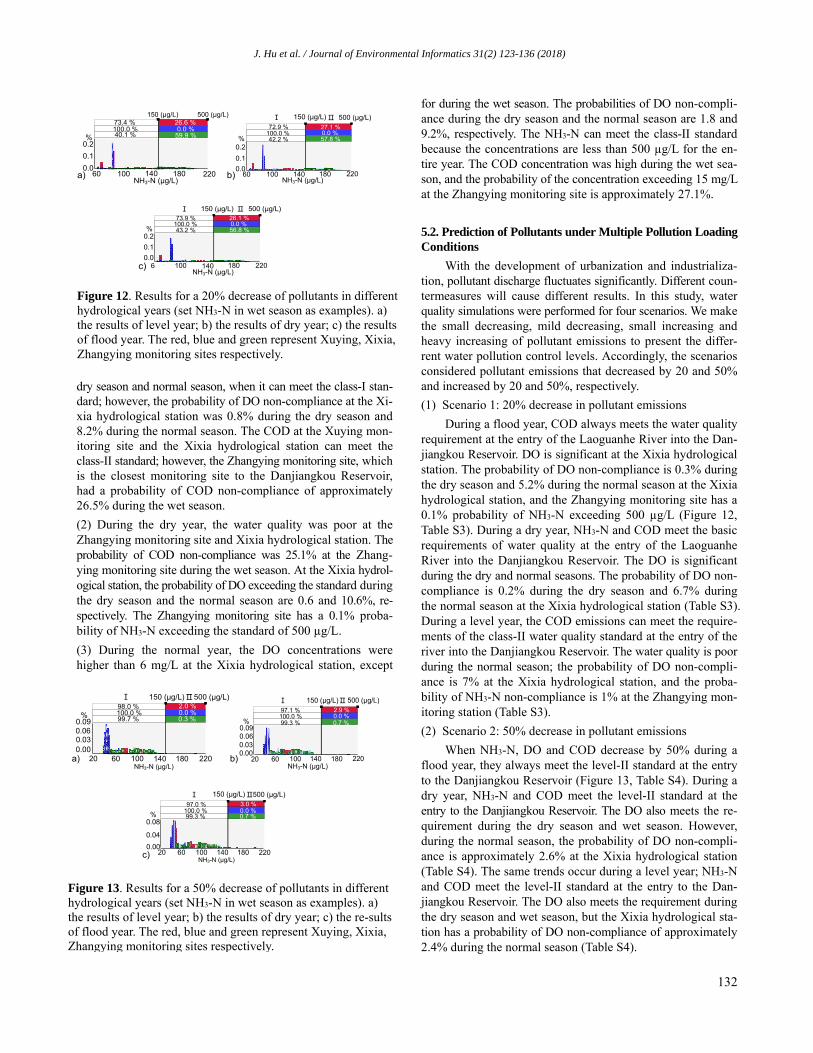
(2) Scenario 2: 50% decrease in pollutant emissions
When NH3-N, DO and COD decrease by 50% during a flood year, they always meet the level-II standard at the entry to the Danjiangkou Reservoir (Figure 13, Table S4). During a dry year, NH3-N and COD meet the level-II standard at the entry to the Danjiangkou Reservoir. The DO also meets the re- quirement during the dry season and wet season. However, during the normal season, the probability of DO non-compli- ance is approximately 2.6% at the Xixia hydrological station (Table S4). The same trends occur during a level year; NH3-N and COD meet the level-II standard at the entry to the Dan- jiangkou Reservoir. The DO also meets the requirement during the dry season and wet season, but the Xixia hydrological sta- tion has a probability of DO non-compliance of approximately 2.4% during the normal season (Table S4).
98.0 % 2.0 % 100.0 % 0.0 %
99.7 % 0.3 %
20 60 100 140 180 220 NH3-N (μg/L)
0.000.030.060.09
Ⅰ 150 (μg/L)Ⅱ
500 (μg/L)
%97.1 % 2.9 %100.0 % 0.0 %
99.3 % 0.7 %
20 60 100
140
180 220
NH3-N (μg/L)
0.000.030.060.09
Ⅰ 150 (μg/L)Ⅱ 500 (μg/L)
%
97.0 % 3.0 %
100.0 % 0.0 % 99.3 % 0.7 %
20 60 100
140
180 220
NH3-N (μg/L)
0.00
0.04
0.08
Ⅰ 150 (μg/L) Ⅱ500 (μg/L)
%
a) b)
c)
Figure 13. Results for a 50% decrease of pollutants in different hydrological years (set NH3-N in wet season as examples). a) the results of level year; b) the results of dry year; c) the re-sults of flood year. The red, blue and green represent Xuying, Xixia, Zhangying monitoring sites respectively.

J. Hu et al. / Journal of Environmental Informatics 31(2) 123-136 (2018)
133
(3) Scenario 3: 20% increase in pollutant emissions
When the pollution increases by 20% during a flood year, the class-II standard at the entry to the Danjiangkou Reservoir is only achieved by NH3-N and COD during the dry season and by DO and NH3-N during the wet season. During the normal season, all three pollutants have risks of non-compli- ance; the probability of DO non-compliance is approximately 62.9% at the Xixia hydrological station, while the probability of NH3-N non-compliance at the Zhangying monitoring site is approximately 0.1%, and the probability of COD non-compli- ance at the Xixia hydrological station is approximately 91.9%. During the wet season, the COD pollution is especially seri- ously; it exceeds the level-II standard at the three monitoring sites. The probability of NH3-N non-compliance is approximately 5% at the Xuying monitoring site, 68% at the Xixia hydro- logical station, and approximately 73.4% at the Zhangying mon- itoring site (Figure 14, Table S5). During a dry year, the NH3-N at the three monitoring sites meets the level-II standard at the entry to the Danjiangkou Reservoir. The DO meets the stan- dard only during the wet season of a dry year. During the level and dry seasons, the probabilities of DO non-compliance at the Xixia hydrological station are approximately 8.9%, and the prob- abilities of COD non-compliance at the Xixia hydrological station are both approximately 99.7%. During the wet season of a dry year, the probability of DO non-compliance is approximately 11.4% at the Xuying monitoring site, approximately 69.8% at the Xixia hydrological station and approximately 75.5% at the Zhangying monitoring site (Table S5).
When NH3-N increases by 20% during a level year, the probability of non-compliance increases significantly. The NH3-N can only reach the level-II standard at the entry to the Dan- jiangkou Reservoir during the wet season at all three sites. During the normal season, the probability of NH3-N non-compliance is approximately 84.4% at the Xixia hydrological station, approx- imately 6.5% at the Xuying monitoring site, and approximately 6.5% at the Zhangying monitoring site. The DO pollution meets the requirement at the three monitoring sites during the wet season. However, the probabilities of NH3-N non-compliance
at the Xixia hydrological station during the normal season and the dry season are approximately 63.2 and 11.7%, respectively. The COD does not meet the requirement in the three seasons. The probability of COD non-compliance at the Xixia hydrol- ogical station is approximately 92.9% during the normal season and approximately 99.7% during the dry season. The other two stations meet the requirement during the normal season and the dry season. During the wet season, however, there is a prob- ability of COD non-compliance at the three stations; the prob- ability of COD non-compliance is approximately 11.4% at the Xuying monitoring site, approximately 69.8% at the Xixia hy- drological station and approximately 75.5% at the Zhangying monitoring site (Table S4).
(4) Scenario 4: 50% increase in pollutant discharge
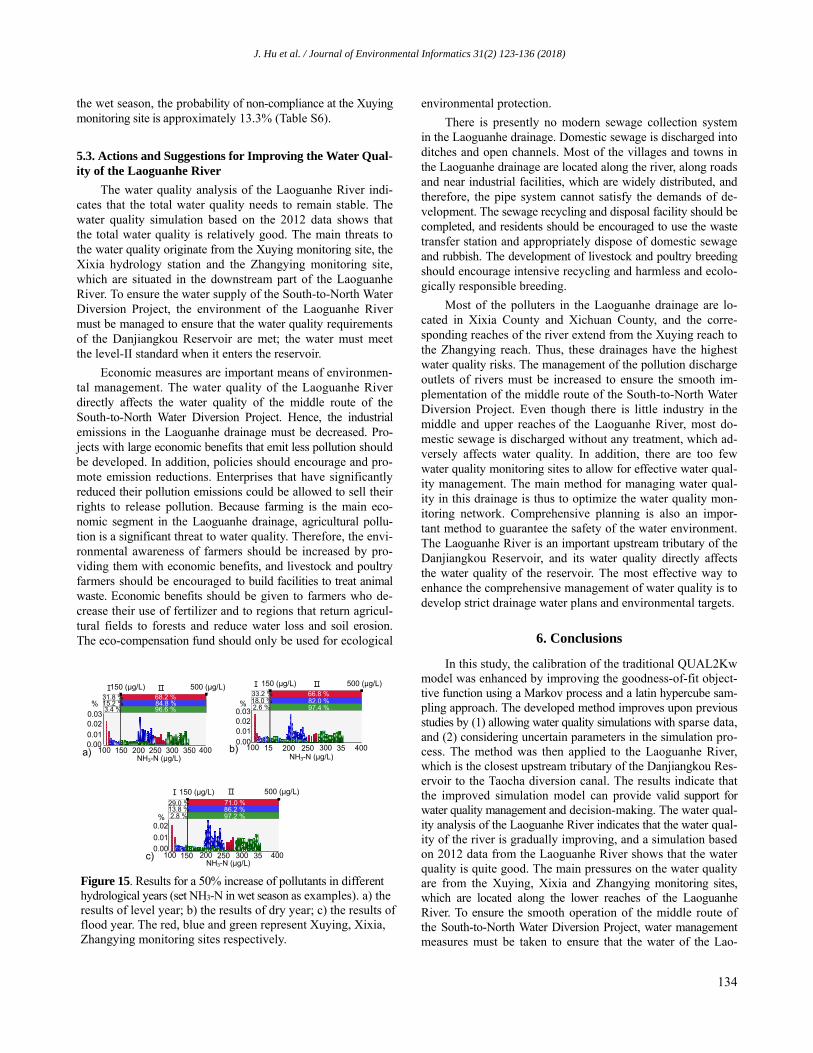
The possibility of non-compliance is especially serious when the pollutants increase by 50% during a flood year. COD ex- ceeds the standard at most of the sites for the entire year. During the normal season, the probability of COD non-compliance is approximately 98.9% at the Xixia hydrological station and approx- imately 98.9% at the Zhangying monitoring site. During the dry season, the probability of COD non-compliance is approxi- mately 1% at the Xuying monitoring site, approximately 99.7% at the Xixia hydrological station, and approximately 58.2% at the Zhangying monitoring site. During the wet season, the prob- ability of COD non-compliance is approximately 44.1% at the Xuying monitoring site, approximately 81.9% at the Xixia hy- drological station, and approximately 89% at the Zhangying mon- itoring site (Figure 15, Table S6).
When the pollution increases by 50% during a dry year, all three pollutants have the possibility of exceeding the level-II standard during the normal season. The probability of DO non- compliance at the Xixia hydrological station is approximately 25.8%. The probability of NH3-N non-compliance is approxi- mately 1.7% at the Xixia hydrological station and approximate- ly 3.3% at the Zhangying monitoring site. The probability of COD non-compliance is approximately 98.5% at the Xixia hy- drological station and approximately 98.5% at the Zhangying mon- itoring site. During the dry season, DO at the Xixia hydrolo- gical station has a probability of non-compliance of 0.6%. During the wet season, the COD may exceed the standard at all three monitoring sites; the probability of non-compliance is approxi- mately 39.6% at the Xuying monitoring site, approximately 77.7% at the Xixia hydrological station, and approximately 86.5% at the Zhangying monitoring site (Table S6).
When the pollutants increased by 50 % during a level year, only NH3-N met the water quality requirement at the entry to the Danjiangkou Reservoir for the entire year. The probability of COD non-compliance during the wet season is approxi- mately 45.4% at the Xuying monitoring site, approximately 79.6% at the Xixia hydrological station, and approximately 87.9% at the Zhangying monitoring site. DO has the possi- bility of exceeding the standard during all three hydrological seasons. During the normal season, the probability of non- compliance at the Xixia hydrological station is approximately 9.2%. During the dry season, the probability of non-compliance at the Xixia hydrological station is approximately 1.8%. During
34.4 %
65.6 % 41.8 %
58.2 %16.6 %
83.4 %
80 120 160 200 240 280
NH3-N (μg/L)
0.00
0.02
0.04
0.06
Ⅰ 150 (μg/L)
Ⅱ 500 (μg/L)
%
34.4 %
65.6 % 41.8 %
58.2 %
16.6 %
83.4 %
80 120
160
200
240 280
NH3-N (μg/L)
0.00
0.020.040.06
150 (μg/L) Ⅱ 500 (μg/L)
%
31.7 %
68.3 % 42.3 % 57.7 % 16.7 %
83.3 %
80 120 160 200 240 280
NH3-N (μg/L)
0.000.020.040.06
Ⅰ 150 (μg/L) Ⅱ 500 (μg/L)
%
a) b)
c)
Figure 14. Results for a 20% increase of pollutants in different hydrological years (set NH3-N in wet season as examples). a) the results of level year; b) the results of dry year; c) the results of flood year. The red, blue and green represent Xuying, Xixia, Zhangying monitoring sites respectively.
J. Hu et al. / Journal of Environmental Informatics 31(2) 123-136 (2018)
134
the wet season, the probability of non-compliance at the Xuying monitoring site is approximately 13.3% (Table S6).
5.3. Actions and Suggestions for Improving the Water Qual- ity of the Laoguanhe River
The water quality analysis of the Laoguanhe River indi-cates that the total water quality needs to remain stable. The water quality simulation based on the 2012 data shows that the total water quality is relatively good. The main threats to the water quality originate from the Xuying monitoring site, the Xixia hydrology station and the Zhangying monitoring site, which are situated in the downstream part of the Laoguanhe River. To ensure the water supply of the South-to-North Water Diversion Project, the environment of the Laoguanhe River must be managed to ensure that the water quality requirements of the Danjiangkou Reservoir are met; the water must meet the level-II standard when it enters the reservoir.
Economic measures are important means of environmen-tal management. The water quality of the Laoguanhe River directly affects the water quality of the middle route of the South-to-North Water Diversion Project. Hence, the industrial emissions in the Laoguanhe drainage must be decreased. Pro- jects with large economic benefits that emit less pollution should be developed. In addition, policies should encourage and pro- mote emission reductions. Enterprises that have significantly reduced their pollution emissions could be allowed to sell their rights to release pollution. Because farming is the main eco- nomic segment in the Laoguanhe drainage, agricultural pollu- tion is a significant threat to water quality. Therefore, the envi- ronmental awareness of farmers should be increased by pro- viding them with economic benefits, and livestock and poultry farmers should be encouraged to build facilities to treat animal waste. Economic benefits should be given to farmers who de- crease their use of fertilizer and to regions that return agricul- tural fields to forests and reduce water loss and soil erosion. The eco-compensation fund should only be used for ecological
environmental protection.
There is presently no modern sewage collection system in the Laoguanhe drainage. Domestic sewage is discharged into ditches and open channels. Most of the villages and towns in the Laoguanhe drainage are located along the river, along roads and near industrial facilities, which are widely distributed, and therefore, the pipe system cannot satisfy the demands of de- velopment. The sewage recycling and disposal facility should be completed, and residents should be encouraged to use the waste transfer station and appropriately dispose of domestic sewage and rubbish. The development of livestock and poultry breeding should encourage intensive recycling and harmless and ecolo- gically responsible breeding.
Most of the polluters in the Laoguanhe drainage are lo- cated in Xixia County and Xichuan County, and the corre- sponding reaches of the river extend from the Xuying reach to the Zhangying reach. Thus, these drainages have the highest water quality risks. The management of the pollution discharge outlets of rivers must be increased to ensure the smooth im- plementation of the middle route of the South-to-North Water Diversion Project. Even though there is little industry in the middle and upper reaches of the Laoguanhe River, most do- mestic sewage is discharged without any treatment, which ad- versely affects water quality. In addition, there are too few water quality monitoring sites to allow for effective water qual- ity management. The main method for managing water qual- ity in this drainage is thus to optimize the water quality mon- itoring network. Comprehensive planning is also an impor- tant method to guarantee the safety of the water environment. The Laoguanhe River is an important upstream tributary of the Danjiangkou Reservoir, and its water quality directly affects the water quality of the reservoir. The most effective way to enhance the comprehensive management of water quality is to develop strict drainage water plans and environmental targets.
6. Conclusions
In this study, the calibration of the traditional QUAL2Kw model was enhanced by improving the goodness-of-fit object- tive function using a Markov process and a latin hypercube sam- pling approach. The developed method improves upon previous studies by (1) allowing water quality simulations with sparse data, and (2) considering uncertain parameters in the simulation pro- cess. The method was then applied to the Laoguanhe River, which is the closest upstream tributary of the Danjiangkou Res- ervoir to the Taocha diversion canal. The results indicate that the improved simulation model can provide valid support for water quality management and decision-making. The water qual- ity analysis of the Laoguanhe River indicates that the water qual- ity of the river is gradually improving, and a simulation based on 2012 data from the Laoguanhe River shows that the water quality is quite good. The main pressures on the water quality are from the Xuying, Xixia and Zhangying monitoring sites, which are located along the lower reaches of the Laoguanhe River. To ensure the smooth operation of the middle route of the South-to-North Water Diversion Project, water management measures must be taken to ensure that the water of the Lao-
31.8 %
68.2 % 15.2 %
84.8 %
3.4 %
96.6 %
100 150 200 250 300 350 400 NH3-N (μg/L)
0.00
0.01
0.02
0.03
Ⅰ150 (μg/L) Ⅱ 500 (μg/L)
%
33.2 %
66.8 % 18.0 %
82.0 %
2.6 % 97.4 %
100 15 200 250 300 35 400NH3-N (μg/L)
0.00
0.010.020.03
Ⅰ 150 (μg/L) Ⅱ 500 (μg/L)
%
29.0 % 71.0 %
13.8 % 86.2 %
2.8 % 97.2 %
100 150 200 250
300 35 400
NH3-N (μg/L)
0.00
0.01
0.02
Ⅰ150 (μg/L)
Ⅱ 500 (μg/L)
%
a) b)
c)
Figure 15. Results for a 50% increase of pollutants in different hydrological years (set NH3-N in wet season as examples). a) the results of level year; b) the results of dry year; c) the results of flood year. The red, blue and green represent Xuying, Xixia, Zhangying monitoring sites respectively.
J. Hu et al. / Journal of Environmental Informatics 31(2) 123-136 (2018)
135
guanhe River meets the class-II requirements at the entry to the Danjiangkou Reservoir. However, due to the lack of data from the Laoguanhe River basin, the data ranges that were used to calibrate the parameters were based on foreign and domestic experience. Because integral water quality data can only use maximum and minimum data for model calibration, the vali- dation errors at some of the monitoring sites are large. Future research will include the uncertainty of the initial water quality in the analysis of water quality risk.
Acknowledgments. This research was supported by National Key Research and Development Program (2016YFC0401302) and the National Water Pollution Control and Treatment Science and Tech- nology Major Project (2017ZX07301-001). We would like to extend special thanks to the editor and the anonymous reviewers for their valuable comments in greatly improving the quality of this paper.
References
Cai, Y.P., Huang, G.H., Yang, Z.F., and Tan, Q. (2009a). Identifi- cation of optimal strategies for energy management systems planning under multiple uncertainties. Appl. Energy, 86(4), 480-495. https:// doi.org/10.1016/j.apenergy.2008.09.025
Cai, Y.P., Huang, G.H., Yang, Z.F., Lin, Q.G., and Tan, Q. (2009b). Community-scale renewable energy systems planning under uncer- tainty - An interval chance-constrained programming approach. Renew. Sustain. Energy Rev., 13(4), 721-735. https://doi.org/10.1016/j.rser. 2008.01.008
Cai, Y.P., Huang, G.H., Tan, Q., and Liu, L. (2011). An integrated approach for climate-change impact analysis and adaptation plan- ning under multi-level uncertainties. Part II. Case study. Renew. Sustain. Energy Rev., 15(6), 3051-3073. https://doi.or/10.1016/j.rser. 2011.03.014
Camargo, R.A., Calijuri, M.L., Santiago, A.F., Couto, E.A., and Silva, M.M. (2010). Water quality prediction using the QUAL2Kw mod- el in a small karstic watershed in Brazil. Acta Limnologica Brasi- liensia. 22(4), 486-498. https://doi.org/10.4322/ac-talb.2011.012
Chen, X.F., Jiang, S.Y., and Han, P. (2012). Environmental risk as- sessment for the Laoguanhe River using fuzzy analytic hierachy process approach (in Chinese). South-to-North Water Div. Water Sci. Technol., 10(3), 87-97.
Cho, J.H. and Ha, S.R. (2010). Parameter optimization of the QUAL- 2K model for a multiple-reach river using an influence coefficient algorithm. Sci. Total Environ., 408(8), 1985-1991. https://doi.org/10. 1016/j.scitotenv.2010.01.025
Cohen, D., Shamir, U., and Sinai, G. (2004). Water quality aspects of optimal operation of rural water distribution systems for supply of irrigation and drinking water. Irrig. Drain., 53(4), 339-361. https://doi. org/10.1002/ird.143
Cox, B.A. (2003). A review of currently available in-stream water- quality models and their applicability for simulating dissolved oxy- gen in lowland rivers. Sci. Total Environ., 314, 335-377. https://doi. org/10.1016/S0048-9697(03)00063-9
Department of Ecology of the State of Washington. (2017). Models for Total Maximum Daily Load Studies. http://www.ecy.wa.gov/pro- grams/eap/models.html
Dong, C., Tan, Q., Huang, G.H., and Cai, Y.P. (2014). A dual-inexact fuzzy stochastic model for water resources management and non- point source pollution mitigation under multiple uncertainties. Hy- drol. Earth Syst. Sci., 18(5), 1793-1803. https://doi.org/10.5194/hess- 18-1793-2014
Kort, I.T. and Booij, M.J. (2007). Decision making under uncertainty
in a decision support system for the Red River. Environ. Model. Softw., 22(2), 128-136. https://doi.org/10.1016/j.envsoft.2005.07.014
Fan, C., Ko, C.H., and Wang, W.S., (2009). An innovative modeling approach using Qual2K and HEC-RAS integration to assess the impact of tidal effect on River Water quality simulation. J. Environ. Manage., 90(5), 1824-1832. https://doi.org/10.1016/j.jenvman.2008. 11.011
Fan, F.M., Fleischmann, A.S., Collischonn, W., Ames, D.P., and Rigo, D. (2015). Large-scale analytical water quality model coupled with GIS for simulation of point sourced pollutant discharges. Environ. Model. Software, 64, 58-71. https://doi.org/10.1016/j.envsoft.2014. 11.012
Fan, Y.R. and Huang, G.H. (2012). A robust two-step method for solving interval linear programming problems within an environmental management context. J. Environ. Inf., 19(1), 1-9. https:// doi.org/10.3808/jei.201200203
Fan, Y.R., Huang, G.H., Baetz, B.W., Li, Y.P., and Huang, K. (2017a). Development of a copula-based particle filter (coppf) approach for hydrologic data assimilation under consideration of parameter inter- dependence. Water Resour. Res., 53(6). https://doi.org/10.1002/2016 WR 020144
Fan, Y. R., Huang, G.H., Baetz, B.W., Li, Y.P., Huang, K., and Chen, X., et al. (2017b). Development of integrated approaches for hydrol- ogical data assimilation through combination of ensemble kalman filter and particle filter methods. J. Hydrol., https://doi.org/10.1016/ j.jhydrol.2017.05.010
Gallagher, M. and Doherty, J. (2007). Parameter estimation and un- certainty analysis for a watershed model. Environ. Model. Software, 22(7), 1000-1020. https://doi.org/10.1016/j.envsoft.2006.06.007
Harmel, R. and Smith, P. (2007). Consideration of measurement un- certainty in the evaluation of goodness-of-fit in hydrologic and water quality modeling. J. Hydrol., 337(3-4), 326-336. https://doi.org/10. 1016/ j.jhydrol.2007.01.043
Helton, J.C. and Davis, F.J. (2003). Latin hypercube sampling and the propagation of uncertainty in analyses of complex systems. Re- liab. Eng. Syst. Saf., 81(1), 23-69. https://doi.org/10.1016/S0951-8320 (03)00058-9
Huang, G.H. and Cao, M.F. (2011). Analysis of solution methods for interval linear programming. J. Environ. Inf., 17(2), 54-64. https://doi. org/10.3808/jei.201100187
Kannel, P.R., Lee, S., Kanel, S.R., Lee, Y.S., and Ahn, K.H. (2007a). Application of QUAL2Kw for water quality modeling and dissolved oxygen control in the river Bagmati. Environ. Monit. Assess., 125 (1-3), 201-217.
Kannel, P.R., Lee, S., Lee, Y.S., Kanel, S.R., and Pelletier, G.J. (20 07b). Application of automated QUAL2Kw for water quality mod- eling and management in the Bagmati River, Nepal. Ecol. Model., 202(3-4), 503-517. https://doi.org/10.1016/j.ecolmodel.2006.12.033
Legates, D.R. and McCabe, G.J. (1999). Evaluating the use of “good- ness-of-fit” Measures in hydrologic and hydroclimatic model vali- dation. Water Resour. Res., 35(1), 233-241. https://doi.org/10.1029/ 1998WR900018
Lindenschmidt, K.E. (2006). The effect of complexity on parameter sensitivity and model uncertainty in river water quality modelling. Ecol. Model., 190(1-2), 72-86. https://doi.org/10.1016/j.ecolmo-del. 2005.04.016
Liu, J., Li, Y.P., Huang, G.H., Zhuang, X.W., and Fu, H.Y. (2017). Assessment of uncertainty effects on crop planning and irrigation water supply using a monte carlo simulation based dual-interval stochastic programming method. J. Cleaner Prod., 149, 945-967. https://doi.org/10.1016/j.jclepro.2017.0 2.100
Li, Y.P., Huang, G.H., and Chen, X. (2011). Planning regional energy system in association with greenhouse gas mitigation under uncertainty. Appl. Energy, 88(3), 599-611. https://doi.org/10.1016/

J. Hu et al. / Journal of Environmental Informatics 31(2) 123-136 (2018)
136
j.apenergy.2010.07.037 Li, Y.P., Huang, G.H., Huang, Y.F., and Zhou, H.D. (2009). A
multistage fuzzy-stochastic programming model for supporting sustainable water-resources allocation and management. Environ. Model. Software, 24(7), 786-797. https://doi.org/10.1016/j.envsoft. 2008.11.008
Maity, R. (2012). Probabilistic assessment of one-step-ahead rainfall variation by Split Markov Process. Hydrol. Process., 26(21), 3182- 3194. https://doi.org/10.1002/hyp.8245
Manache, G. and Melching, C.S. (2008). Identification of reliable regression- and correlation-based sensitivity measures for impor- tance ranking of water-quality model parameters. Environ. Model. Softw., 23(5), 549-562. https://doi.org/10.1016/j.envsoft.2007.08.001
Melching, C.S. and Yoon, C.G. (1996). Key sources of uncertainty in QUAL2E model of Passaic river. J. Water Resour. Plann. Manage., 122(2), 105-113. https://doi.org/10.1061/(ASCE)0733-9496(1996) 122:2(105)
Minasny, B. and McBratney, A.B. (2006). A conditioned Latin hy- percube method for sampling in the presence of ancillary informa- tion. Comput. Geosci., 32(9), 1378-1388. https://doi.org/10.1016/j. cageo.2005.12.009
Nakhaei, N. and Etemad-Shahidi, A. (2012). Applying Monte Carlo and classification tree sensitivity analysis to the Zayandehrood Riv- er. J. Hydroinf., 14(1), 236-250. https://doi.org/10.2166/hydro.20 11.094
Oliveira, B., Bola, J., Quinteiro, P., Nadais, H., and Arroja, L. (2012). Application of Qual2Kw model as a tool for water quality manage- ment: Cértima River as a case study. Environ. Monit. assess. 184(10), 6197-6210. https://doi.org/10.1007/s106-61011-2413-z
Pelletier, G.J., Chapra, S.C., and Tao, H. (2006). QUAL2Kw - A frame- work for modeling water quality in streams and rivers using a ge-
netic algorithm for calibration. Environ. Model. Softw., 21(3), 419- 425. https://doi.org/10.1016/j.envsoft.2005.07.002
Sun, J., Li, Y.P., Huang, G.H., and Wang, C.X. (2017). Analysis of interactive effects of DEM resolution and basin subdivision level on runoff simulation in kaidu river basin, china. Hydrol. Res., 48(4). https://doi.org/10.2166/nh.2016.332
Shen, Z.Y., Hong, Q., Yu, H., and Liu, R.M. (2008). Parameter uncer- tainty analysis of the non-point source pollution in the Daning Riv- er watershed of the Three Gorges Reservoir Region, China. Sci. To- tal Environ., 405(1-3), 195-205. https://doi.org/10.1016/j.scitotenv. 2008.06.009
Takyi, A.K., and Lence, B.J. (1995). Markov chain model for seaso- nal-water quality management. J. Water Resour. Plann. Manage., 121(2), 144-157. https://doi.org/10.1061/(ASCE)0733-9496(1995) 121:2(144)
Tan, Q., Huang, G.H., Wu, C.Z., and Cai, Y.P. (2011a). IF-EM: An in- terval-parameter fuzzy linear programming model for environment- oriented evacuation planning under uncertainty. J. Adv. Transport., 45(4), 286-303. https://doi.org/10.1002/atr.137
Tan, Q, Huang, G.H., and Cai, Y.P. (2011b). Radial interval chance- constrained programming for agricultural non-point source water pollution control under uncertainty. Agric. Water Manage., 98(10), 1595-1606. https://doi.org/10.1016/j.agwat.2011.05.013
Wang, J.P., Su, B.L., Jia, H.F., Cheng. S.T., Yang, C., Wu, D.W., and Sun, F., (2006). Integrated model of nutrients for the Miyun Reser- voir and its watershed (in Chinese). Environ. Sci., 27, 1286-1291.
Wang, L., Huang, G., Wang, X., and Zhu, H. (2018). Risk-based elec- tric power system planning for climate change mitigation through multi-stage joint-probabilistic left-hand-side chance-constrained frac- tional programming: a canadian case study. Renew. Sustain. Energy Rev., 82, 1056-1067. https://doi.org/10.1016/j.rser.2017.09.098