Embed Size (px)
Citation preview

ACT Water Quality Report 2000–2001
Environment ACT 13
WATER QUALITY CONDITION
Analysis
Current Status—Reporting Methodology
The condition of water bodies is reported using a number ofmethods. A review of the performance within the reporting year aswell as the longer term trend is presented.
When assessing sites all the data collected since flow basedsampling began in 1992 in considered. The long termperformance of indicators is analysed with reference to flow,seasonality and time (Appendix 2).
The performance of each indicator is then considered for thereporting year 2000-2001. Median values were used inconjunction with statistical dispersion to consider conditions ateach site, referencing standards. The median is seen as the mostuseful measure of the ‘average’ condition as it is less affected byextremely high or low values than is the mean. The mean isstrongly biased toward the infrequent extreme conditions that mayoccur in water bodies. Any significant variation of median fromprevious sampling years is noted.
For indicators that demonstrate a good relationship withstreamflow, an additional method of analysis has been used. Thisrelates to total phosphorus, total nitrogen, suspended solids andturbidity in rivers that all show an increase in concentration withincreasing flow.
With a flow based sampling program, samples have been takenat various levels of streamflow. From the relationship betweenflow and the indicator, we can reasonably reliably determine thepercentage of flows where an indicator may exceed the waterquality standard. For a detailed explanation of the method usedsee (Appendix 2).
Some sites have not been sampled at a sufficient range of flow.For these sites it has not been possible to determine at whatstage of flow the indicator would be exceeded.

ACT Water Quality Report 2000–2001
Environment ACT14
Water Quality Status
The condition of water quality at the monitoring sites can beassessed by comparison of actual concentrations withconcentrations listed in the water quality standards (Table 1).
The data for the various indicators has been presented on anumber of maps. Sites have been coded as good, fair or poor. Asite is classified good when it compares well within the standardsfor the particular indicator. A fair classification occurs where thevalue is on the threshold of the standards and a poorclassification occurs where a site noticeably exceeds thestandards. In line with the flow exceedance of variables listedabove, the percentile of flow at which that indicator is likely toexceed the standard is reported.
Long Term Trend
Trend analysis of data available between 1992 and 2001 hasbeen carried out for sites with sufficient data for trends to bedetected. This period corresponds with flow based monitoring ofrivers and creeks. Prior to this period, monitoring was carried outat regular intervals with no reference to flows, and it is notappropriate to compare these data.
All of the trend graphs have had a statistical test applied todetermine if trends are significant. Statistical analysis was usedon sites to determine the influence of flow as well as time on theconcentration. The trendline produced is a product of that timecomponent at the median flow. A detailed explanation of themethod used is attached (Appendix 2) and a scatterplot of allindicators at all sites (Appendix 4). For the remaining riverindicators and all lake sites, indicator concentrations have beenplotted against time.
IndicatorsBiological Monitoring
The biological component of the ACT Water Quality MonitoringProgram incorporates the macroinvertebrate monitoringundertaken using the AUSRIVAS model, involving the collectionof edge samples from ten test sites and three reference sites inthe ACT region during spring 2000 and autumn 2001. AnAUSRIVAS predictive model developed as part of the NationalRiver Health Program (NRHP) conducted under the NaturalHeritage Trust has been used to assess these sites providing ameasure of biological health.

ACT Water Quality Report 2000–2001
Environment ACT 15
The unit that is considered in this report, Overall Site Band (O/E)represents the observed (O) bugs at a site compared to theexpected (E) bugs for a site as determined by the AUSRIVASmodel. The impacts are ranked as follows:
X Above referenceA Equivalent to reference sitesB Slightly impairedC Moderately impairedD Severely impaired
The spring 2000 results are shown in (Figure 5)(Appendix 3).Various elements have been impairing the biological health at anumber of sites. Agricultural and urban runoff and excesssediment leading to habitat degradation are major causes forreduced biological diversity. Poor results are also reported wheredam releases and disturbed environmental flows occur.
There is a significant effect in Ginninderra Creek, with all sites inSpring 2000 recording impoverished (Band D) results. The willowremoval program, which has been undertaken to improve theecology of the river by improving habitat diversity, has causedsignificant disturbance to the stream bank. Also, the turbidity andsediment may be flowing down from Gungahlin Pond. The Autumn2001 results are shown in (Figure 6). The impoverishedecosystem results experienced in the previous sampling programare improved. Continued enhancement as native vegetationestablishes along the creek is expected.

ACT Water Quality Report 2000–2001
Environment ACT16
#Y
#Y
#Y%U
%U
%U
%U
%U
%U%U
%U%U%U
Test Sites%U Outside the model%U Equivalent to reference%U Below reference%U Well below reference%U Impoverished%U Above reference
Spring 2000
Figure 5: AusRIVAS Assessments of Monitoring Sites in the ACT for Spring 2000

ACT Water Quality Report 2000–2001
Environment ACT 17
#Y
#Y
#Y%U
%U
%U
%U
%U
%U%U
%U%U%U
Autumn 2001
Test Sites%U Outside the model%U Equivalent to reference%U Below reference%U Well below reference%U Impoverished%U Above reference
Figure 6: AusRIVAS Assessments of Monitoring Sites in the ACT for Autumn 2001
ACT Water Quality Report 2000–2001
Environment ACT18
Nutrient Levels
Nutrients are a natural component of all water bodies, butincreases in their supply often have undesirable effects, includingthe eutrophication of aquatic ecosystems. Eutrophication is thepresence of an abnormally high quantity of aquatic plant life andcan include toxic algal blooms. This can also produce otherunwanted side effects, for example, low dissolved oxygen levelsin the water. The two most important plant nutrients for aquaticecosystems are phosphorus and nitrogen.
In ACT waterbodies phosphorus is the nutrient that commonlydetermines the amount of algae that can occur. Total phosphorusis the measurement of dissolved and particulate phosphorus inthe water. The standard is 0.1 mg/L (Table 1). Median valuesranged from 0.02 mg/L at a number of sites to 0.1 mg/L at LakeTuggeranong near Kambah Wetland (Site 248), as shown inFigure 7. The phosphorus level at this and the main spillway atLake Tuggeranong are high. Similarly, at the outlet (Site 249) themedian of phosphorus is still high 0.09mg/L and there is a largeproportion of exceedences.
Lake sites, with the exception of Lake Tuggeranong, had goodphosphorus readings. For the river sites in which a relationshipbetween flow and concentration could be determined themaximum expected exceedance of the standard was at PaddysRiver and was 4.3%.
There is no standard for total nitrogen for the ACT. Nitrogen is notgenerally a limiting factor in algal growth in regional waters and itis non-toxic to other organisms. Total nitrogen medians rangedfrom 0.3 mg/L at a number of sites to 9.3 mg/L at Sturt Island(Site 401) on the Molonglo River as shown in (Figure 8). This isconsiderably higher that the next median of 3.5 at the NorthernBorder (Site 224).
The levels of nitrogen measured at Sturt Island and the NorthernBorder are typical of waters downstream of a sewage treatmentplant where plant discharge forms a high proportion ofstreamflow. In situations where nitrogen is limiting, researchindicates a potential for the growth of nitrogen fixing blue-green(scum and toxicant forming) algae. In these situations, thedischarge of nitrogen in sewage effluent will discourage thegrowth of nitrogen fixing blue-green algae. In addition, thedischarge of nitrogen can have a beneficial effect by restrictingthe release of phosphorus from lake or reservoir sediments.

ACT Water Quality Report 2000–2001
Environment ACT 19
In this context, management and discharge authorisationarrangements in the ACT concentrate on minimising the input ofphosphorus to waterways as a priority with nitrogen reductionencouraged as a second priority. Most sites appear to haveremained steady with respect to nitrogen and phosphorusconcentrations compared with the last few years.
Suspended Solids
All streams and rivers naturally carry some suspended materialas organic and inorganic particles of varying sizes. Most landuses and activities have the potential to increase suspendedsolids concentrations in streams. An increase in the concentrationof suspended solids can have two major impacts on aquaticecosystems. Firstly, higher concentrations of suspended solidsreduce the light penetration of water, retarding plant growth andchanging the type of algae present. Secondly, increases insuspended solids concentrations ultimately result in increasedsedimentation in streams and lakes, effecting the natural flowthrough the water body.
The standard for suspended solids ranges between 12.5 for theaquatic habitat value of mountain streams and 25 mg/L forlowland streams and Urban Lakes (Table 1). The standard of 25mg/L was applied to all river sites as they all can be categorisedas lowland streams.
Suspended solids median values ranged from 2.3 mg/L atGudgenby River (Site 901) to 30.4 mg/L at Point Hut Pond(Site 270) (Figure 7). The water quality, with respect tosuspended solids was poor in Point Hut Pond with a majority ofsamples taken comparing unfavourably with the standard. Thecause of the high results is most likely due to development in theimmediate catchment. However, median values tended to behigher than those recorded in the 1999-2000 reporting period, aneffect that may be due to an increase in rainfall and runoff in thereporting period.
Faecal Coliforms
Bacteria occur naturally in all waterbodies. The presence offaecal coliforms in a water sample may be an indication thathuman or animal faeces have contaminated the water and thatharmful, less easily detectable pathogens such asCryptosporidium and Giardia may be present. High levels offaecal coliforms are not necessarily a problem for aquaticecosystems. Faecal coliforms generally do not infect aquaticorganisms, and may serve as a food source.

ACT Water Quality Report 2000–2001
Environment ACT20
The presence of high numbers of faecal coliforms is a problem forsome human uses of water bodies, particularly water supply andrecreation involving bodily contact. This report looks at bacteriallevels in water used for primary and secondary contactrecreational use, but does not deal with the quality of drinkingwater.
Cryptosporidium and Giardia are protozoan species, which cansignificantly affect human health if present in drinking water. Theyare not easily detected, making them a poor indicator, and arenot monitored in environmental water quality programs.
Results are expressed as colony forming units (cfu) per 100 mL.The standard for water based recreation – swimming is 150cfu/100 mL and for boating and secondary contact is1000cfu/100ml (Table 1). These standards apply to individualsites depending on their classification in the Territory plan.Median values ranged from 7.5 cfu/100 mL in Point Hut pond(Site 270) to 360 cfu/100 mL at Ginninderra Creek (Site 301) asshown in Figure 9.
With the exception of Paddys River, faecal coliform levelsgenerally compared favourably with the standard designatedunder in the Territory Plan. This provides some indication thatland use planning and the quality of the ACT’s sewage systemare protecting recreational opportunities. Uriarra Crossing (Site207) had a number of exceedences of the 150 cfu/100mlstandard for that site.

ACT Water Quality Report 2000–2001
Environment ACT 21
##
# #
#
#
#
#
#
#
#
#
#
#
#
#
#
#
#
0.05
3
6
0.03
6
0.03
6
0.02
8
0.03
5
0.02
7
0.03
9
0.02
20
0.035
0.02
19
0.1
8
0.09
3
0.03
8
0.03
30
0.02
5
401Stur t
Is land
407CoppinsCrossing
1 0 1 2 3 4 Kilometers
224NorthernBorder
207Uriarr aCrossing
204HallsCrossing
769Queanbeyan
R iver
6
0.03608
Yass Road
601DairyFl at
346Gungahlin
Pond
321Lake
Ginni nderraEast
8
0.04
318LakeGinninderraWest
301Ginninderra
Creek
249Main channelSpillway
248KambahWetland
209Kambah
Pool
842PaddysRiver
0.06270Poin t Hut
Pond
213Angle
Crossing
901GudgenbyRiver
2
0.03
TP
SS
0.1
25
Poor
Total Phosphorus(mg/L)
&Suspended Solids
(mg/L)StandardSymbol
Trend
Increasing
Decreasing
Fair
Good
Figure 7: Total Phosphorus and Suspended Solids Map

ACT Water Quality Report 2000–2001
Environment ACT22
##
# #
#
#
#
#
#
#
#
#
#
#
#
#
#
#
#
1 0 1 2 3 4 5 Kilo meters
3.5224NorthernBorder
0.3207Ur iarraCrossing
204HallsCro ssing
3
0.4769
Que anbeyanRiver
608Yass Road
1.3
601Dair y
Flat
1.3
301Ginninder ra
Creek
0.4407Co ppinsCrossing
209Kambah
Pool
842Padd ysRiver
1.1
0.3
213Angle
Crossing0.3
901GudgenbyRiver
No StandardTN
Total Nitrogen(mg/L)
0.4
0.8
0.5
401Sturt
Is land9.3
Trend
Increasing
Decreasing
0.8
318LakeGinni nderraWest
321Lake
GinninderraEast
0.9
34 6Gungahlin
Pon d
0.3 248
KambahWetland 1.1
270Point Hut
Pond
249Lake Tuggera nongDam Wall
1.2
Figure 8: Total Nitrogen Map
ACT Water Quality Report 2000–2001
Environment ACT 23
Turbidity
Turbidity, or opacity of a water body is related to the suspendedsolids concentration but also includes colouration. A stream mayhave very low levels of suspended material but be stronglycoloured, for example the tannin rich streams in NamadgiNational Park. Turbidity has an important ecological effect indetermining the depth to which light penetrates the water,affecting plant growth and changing the type of algae present.
Turbidity data are reported in Nephelometric Turbidity Units(NTU). To provide a sense of scale, water with a turbidity of1 NTU is crystal clear, water at 5 NTU has a tiny trace ofdiscolouration, and water at 100 NTU is brown and opaque. Thestandard is less than 10 NTU for rural streams and rivers and lessthan 30 NTU for urban lakes and ponds (Table 1).
Median turbidity values ranged from 3.8 NTU at Angle Crossing(Site 213) to 63 NTU at Point Hut Pond (Site 270) as shown in(Figure 9). The high turbidity at this site corresponds to theelevated suspended solid levels also experienced there.
In terms of flow exceedance, turbidity is the indicator thatperformed most poorly. The exceedances ranged from between3.8% of flows at Angle Crossing to greater than 40% at HallsCrossing (Site 204), Paddys River (Site 842) and GudgenbyRiver (Site 901). Many medians are higher than the previous year,possibly as a result of higher rainfall for the corresponding period.However, they may also be representative of a more generalturbidity problem in the ACT, the major source of which is urbandevelopment and urban runoff.
pH (Acidity and Alkalinity)
The pH refers to the degree of acidity or alkalinity of a substance.A pH of 7 is neutral. A value above 7 indicates that the water ismore alkaline and a pH below 7 indicates acidic conditions.
The levels for pH at all sites are good. Very few samples fallingoutside standard values, pH 6.5–9 for rural streams and riversand pH 6–9 for urban lakes and ponds (Table 1) and all mediansfalling well within acceptable range, as shown in Figure 10. Manysites also show a decreasing trend in long term data.

ACT Water Quality Report 2000–2001
Environment ACT24
Ammonia
Ammonia concentrations are generally related to the level oforganic material in water as well as the presence of conditionsconducive to the conversion of the nitrogen present to ammonia.Levels of ammonia in streams may also be increased by directdischarges high in ammonia. The toxicity of ammonia (un-ionisedcomponent) is a function of the pH and the temperature of thewater.
Ammonia median levels are generally reduced across all sites,with median ammonia concentrations ranging from 0.003 mg/L atAngle Crossing to 0.085 mg/L in Lake Tuggeranong at the damwall as shown in Figure 10. The highest values are found in lakes,particularly Lake Tuggeranong and Point Hut Pond. The standardis calculated from a table and is dependent on the pH andtemperature of the water at the time of the sample. There is noindication that the adjusted results compared unfavourably withthe standard.
Dissolved Oxygen
Dissolved Oxygen (DO) is a measure of the oxygen in the wateravailable to aquatic organisms. It is important for the maintenanceof aquatic organisms as changes in DO can affect the speciespresent. Low levels of DO can stress fish, which can lead tofungal infections and disease or result directly in fish kills. Levelsof DO are effected by turbulence, temperature (colder water canhold more dissolved oxygen), photosynthesis (during periods ofsunlight algae and other water plants produce oxygen while indarkness they consume oxygen) and the level of biochemicaloxygen demand.
Almost all sampled sites compared favourably with the >4mg/Lstandard, which is applicable at all sites except (Site 346) and(Site 842)(Table 1). Median DO concentrations ranging from 6.7mg/L both Lake Tuggeranong sites and Lake Ginninderra East to10.2 mg/L at Riverlea on Paddys River as shown in Figure 11.

ACT Water Quality Report 2000–2001
Environment ACT 25
Chlorophyll ‘a’
Chlorophyll ‘a’ is the plant pigment that gives algae their greencolour, and is commonly used as a measure of the quantity ofalgae present (algal biomass). This measure can therefore serveas a useful indicator of the extent to which an ecosystem hasbeen affected by nutrient inputs. There is no standard for streamsand rivers in the ACT while a standard of less than 10 µg/Lapplies for urban lakes and ponds.
Chlorophyll ‘a’ is measured in micrograms per litre (µg/L). Toprovide a sense of scale, water with a chlorophyll ‘a’concentration of 1 µg/L will be clear, a concentration of 20 µg/Lwill be slightly green, and 100 µg/L very green and possibly withalgal scums on the surface.
Median Chlorophyll ‘a’ concentrations ranged from 1.2 µg/L atPaddys River to 13 µg/L at Halls Crossing on the MurrumbidgeeRiver as shown in Figure 11. Some exceedances of standardswere experienced at lake sites, with Ginninderra East and LakeTuggeranong recording fair water quality.
Increasing trends were experienced at a number of sites on theMolonglo and Queanbeyan rivers and Ginninderra Creek. Thesesites have particularly low median values for chlorophyll ‘a’ andrepresent relatively good water quality. A gradual build up ofchlorophyll ‘a’ at these sites may be related to the increase inorganic materials, suspended solids and total phosphorus in thewater. Elevated algae levels may be experienced some distancedownstream of a pollutant source as it takes some time for algalgrowth.

ACT Water Quality Report 2000–2001
Environment ACT26
##
# #
#
#
#
#
#
#
#
#
#
#
#
#
#
#
#
58
29
4
26
220
9
22
9
32
96
360
10
9
29
14
20
29
285
42
44
19
401Sturt
Island
115
5
8
63
81
Faecal Coliforms
(cfu/100mL) &
Turbidity (NTU)
150 *
Str eams < 10, Lakes < 30T
FC
Good
901GudgenbyRiver
213Angle
Crossing
270Point Hut
Pond
842Pa ddysRiver
209Kambah
Pool
248KambahWet land
249Lake TuggeranongDam Wall
407CoppinsCrossing
301Ginni nderra
Creek
318LakeGinninderraWest
321Lake
GinninderraEast
346Gung ahlin
Pond
601Dair y
Flat
608Yass Road
769Queanbeyan
River
204HallsCrossing
207Uriarr aCro ssing
224Northern
Bo rder
1 0 1 2 3 4 Kilometers
* The standard re fers to p rimary contact recreation areas. The standard for secondary contact recreation is 1000 cfu/100mL. Si tes such as 301 - Ginn inderra Creek have not been designated as fair or poor as primary contact recrea tion is not a designated use at this si te.
5
10
5
7
4.5
6.77
StandardSymbol
Trend
Increasing
Decreasing
Poor
Fair
12
Figure 9: Faecal Coliforms and Turbidity Map

ACT Water Quality Report 2000–2001
Environment ACT 27
##
# #
#
#
#
#
#
#
#
#
#
#
#
#
#
#
#
7.6
0.060
0.012
8.2
7.6
0.005
7.4
0.0067.5
0.085
0.003
7.4
0.025
8.0
0.020
7.8
7.9
0.050
7.2
0.011
7.3
0.008
7.8
0.007
7.5
0.003
7.5
0.008
401Sturt
Is land
7.3
0.005
7.5
0.005
7.9
0.050
7.6
0.008
7.6
0.010
842PaddysRiver
209Kambah
Pool
249Main chan nelSpillway
pH&
Ammonia (mg/L)
N/A
Streams 6.5 - 9, Lakes 6 - 9
NH3
pH
Good
901GudgenbyRiver 213
AngleCrossing
270Point Hut
Pond
248KambahWetland
407CoppinsCrossing
301Ginninderra
Creek
318LakeGinni nderraWest
321Lake
GinninderraEast
346Gungahlin
Pond
601Dairy
Flat
608Yass Road
769Queanbeyan
R iver
204HallsCrossing
207UriarraCrossing
224Norther nBorder
1 0 1 2 3 4 5 Kilo meters
StandardSymbol
Trend
Increasing
Decreasing
Fair
Poor
A
Figure 10: pH and Ammonia Map

ACT Water Quality Report 2000–2001
Environment ACT28
##
# #
#
#
#
#
#
#
#
#
#
#
#
#
#
#
#
1 0 1 2 3 4 5 Kilo meters
224Norther n
Border
207Uriarra
Crossing
204HallsCrossing
3.0
8.5769Queanbeyan
River
608Yass Road
3.7
9.011
7.6601Dair y
Flat
346Gungahlin
Pond3.7
7.2
6.5
6.7321Lake
GinninderraEast
318LakeGinninderraWest
6.8
6.0
301Ginninder ra
Creek
407CoppinsCrossing
249Main c hannelSpillway
248KambahWetland
209Kambah
Pool842PaddysRiver 6.3
6.7
6.5
6.7
1.2
10.2
8.3
7.7270Point Hut
Pond
213Angle
Crossing
9.9
3.4
901GudgenbyRiver1.3
9.9
> 4DO
C 'a'
13
9.8
4.6
9.1
6.0
9.8
401Stur tIs land
Streams no standard , Lakes < 10
DissolvedOxygen (mg/L)
&Chlorophyll 'a' (ug/L)
Symbol Standard
Fair
Poor
Good
Trend
Increasing
Decreasing
Figure 11: DO and Chlorophyll 'a' Map
ACT Water Quality Report 2000–2001
Environment ACT 29
Lakes
Lake Tuggeranong
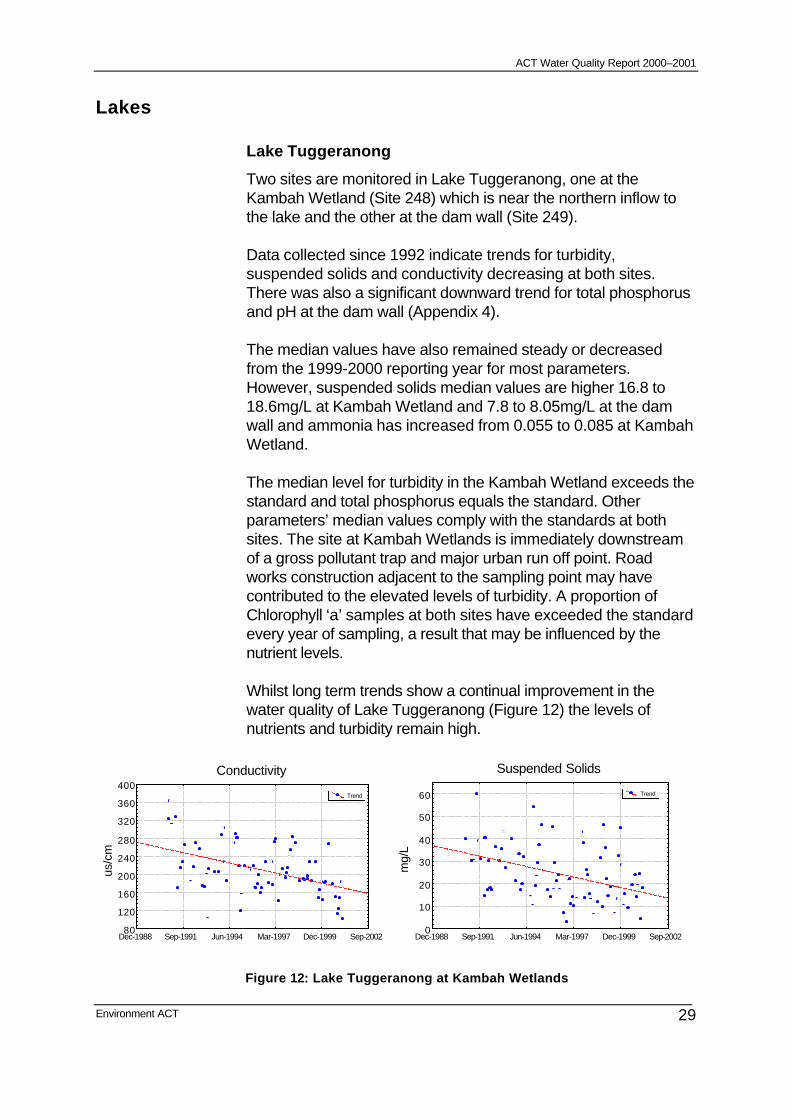
Two sites are monitored in Lake Tuggeranong, one at theKambah Wetland (Site 248) which is near the northern inflow tothe lake and the other at the dam wall (Site 249).
Data collected since 1992 indicate trends for turbidity,suspended solids and conductivity decreasing at both sites.There was also a significant downward trend for total phosphorusand pH at the dam wall (Appendix 4).
The median values have also remained steady or decreasedfrom the 1999-2000 reporting year for most parameters.However, suspended solids median values are higher 16.8 to18.6mg/L at Kambah Wetland and 7.8 to 8.05mg/L at the damwall and ammonia has increased from 0.055 to 0.085 at KambahWetland.
The median level for turbidity in the Kambah Wetland exceeds thestandard and total phosphorus equals the standard. Otherparameters’ median values comply with the standards at bothsites. The site at Kambah Wetlands is immediately downstreamof a gross pollutant trap and major urban run off point. Roadworks construction adjacent to the sampling point may havecontributed to the elevated levels of turbidity. A proportion ofChlorophyll ‘a’ samples at both sites have exceeded the standardevery year of sampling, a result that may be influenced by thenutrient levels.
Whilst long term trends show a continual improvement in thewater quality of Lake Tuggeranong (Figure 12) the levels ofnutrients and turbidity remain high.
Conductivity
us/c
m
80
120
160
200
240
280
320
360
400
Dec-1988 Sep-1991 Jun-1994 Mar-1997 Dec-1999 Sep-2002
Trend
Suspended Solids
mg/
L
0
10
20
30
40
50
60
Dec-1988 Sep-1991 Jun-1994 Mar-1997 Dec-1999 Sep-2002
Trend
Figure 12: Lake Tuggeranong at Kambah Wetlands

ACT Water Quality Report 2000–2001
Environment ACT30
Point Hut Pond (Site 270)
Water quality in Point Hut Pond is poor when compared with thestandards set for its designated uses in the Territory Plan andother lake sites in the ACT. However, the long term trendsindicate some parameters are improving with decreasing trendsfor pH, total phosphorus and ammonia (Figure 13). There is alsoa decreasing trend for the dissolved oxygen present.
Point Hut Pond had the highest median value of all sites forturbidity and suspended solids. The majority of the samples takenexceeding the standard. Suspended solids and chlorophyll ‘a’median values are higher than the 1999-2000 reporting period.
Residential development in the Lanyon Valley and particularly onthe steep land of Amber Ridge in close proximity to the pond,construction work on the Conder Wetland feeding the pond andthe new development on Eastern Valley Rise are significantcontributing factors to the poor results. Controlling run off at thesource is the most effective means to reduce the flow ofsediments into the pond. The upgrading of the Condor wetlandsmay assist in reducing pollution problems in the future.
Total Phosphrous
mg/
L
0.00
0.05
0.10
0.15
0.20
0.25
0.30
0.35
0.40
Jul-1992Mar-1994
Oct-1995Jun-1997
Feb-1999Oct-2000
May-2002
trend
Ammonia
mg/
L
0.00
0.06
0.12
0.18
0.24
0.30
Jul-1992Mar-1994
Oct-1995Jun-1997
Feb-1999Oct-2000
May-2002
Trend
Figure 13: Total Phosphorus and Ammonia in Point Hut Pond

ACT Water Quality Report 2000–2001
Environment ACT 31
Gungahlin Pond
Water quality in Gungahlin Pond (Site 346) is fair with adecreasing trend in data collected since 1992 experienced in theturbidity, total phosphorus, suspended solids, and conductivity.Median values for most indicators compared favourably with thestandards and most median values were equal or less thanprevious years (Figure 14). Chlorophyll ‘a’ and suspended solidsmedian values had increased since the 1999-2000 report.Turbidity median value of 20.8 NTU exceeds the 10 NTUstandard Figure 14.
There is still a significant level of development occurring, whichmay be adversely effecting water quality. However, the downwardtrend indicates that turbidity is improving and is expected tocontinue to do so as the catchment stabilises after the extensivedevelopment during previous years. Development controls andsediment retention ponds upstream of Gungahlin Pond alsocontribute to the improving water quality.
Turbidity
NTU
0
40
80
120
160
200
Mar-1994Apr-1995
May-1996Jun-1997
Jul-1998Aug-1999
Oct-2000Nov-2001
Trend
Conductivity
us/c
m
0
60120
180240
300360
420480
540
Mar-1994Apr-1995
May-1996Jun-1997
Jul-1998Aug-1999
Oct-2000Nov-2001
Trend
Figure 14: Turbidity and Conductivity at Gungahlin Pond

ACT Water Quality Report 2000–2001
Environment ACT32
Lake Ginninderra
Two sites are monitored in Lake Ginninderra, one near the inflowbelow the Naval Station in the East Arm (Site 321) and the otherat the outflow dam wall, or West Arm (Site 318). Water quality inthe lake was good and generally better than the other lakesmonitored. At both sites the data shows significant downwardtrends in total phosphorus, suspended solids, ammonia andconductivity. There was also an improvement in turbidity anddissolved oxygen at the West Arm, however, the dissolvedoxygen at the East Arm shows a slight decreasing trend.
All sites at the West Arm comply with standards. The east armmedian values for all the parameters have decreased since the1999-2000 report except chlorophyll ‘a’, which has increasedfrom 4 to 6, a value that continues to comply with standards. Themedian values for suspended solids and total nitrogen at the EastArm have increased since the previous reporting period. Anumber of exceedences of the standard were experienced forturbidity and chlorophyll ‘a’.
The improvement experienced between the inlet and outletindicates that Lake Ginninderra is having a significant effect intreating water flowing through Ginninderra Creek. This isdemonstrated by the suspended solids readings at both sites(Figure 15). The turbidity levels at the East Arm may be effectedby the turbidity levels in Gungahlin pond, as well as the willowremoval that has been occurring upstream of the lake. As thestream bank stabilises from these works the water quality shouldimprove.
Turbidity East Arm (Inlet)
NTU
0
20
40
60
80
100
120
May-1990 Jan-1993 Oct-1995 Jul-1998 Apr-2001
Turbidity West Arm (Outlet)
NTU
0
20
40
60
80
100
120
May-1990 Jan-1993 Oct-1995 Jul-1998 Apr-2001
Trend
Figure 15: Turbidity in Lake Ginninderra at Inlet and Outlet

ACT Water Quality Report 2000–2001
Environment ACT 33
Rivers
Ginninderra Creek
The monitoring site for Ginninderra Creek is at Parkwood (Site301) below the confluence with Gooromon Ponds Creekdownstream of the lake. The monitoring sites in the Ausrivassampling of Ginninderra Creek are Baldwin Drive bridge (Site195), Downstream of Lake Ginninderra (Site 196) and Latham(Site 64).
All three sampling sites show an overall site band belowreference (B) in the Ausrivas sampling program for spring 2001,which is an improvement from the impoverished (D) results for theautumn 2000 sampling session.
The trend analysis on the water quality parameters indicatesdownward trends for pH and a slight upward trend for Chlorophyll‘a’.
Water quality is good with median suspended solids values downfrom 13.8 mg/L to 7.7 mg/L and turbidity from 21 NTU to 9 NTU.Improvements in water quality over time in Ginninderra Creek areevident and expected to continue as the catchment stabilisesafter extensive urban development. The results also indicate thatupstream ponds are working effectively. Examination of theturbidity compared with flow showed that this site would compareunfavourably with the turbidity standard for 42% of the time. Thisis a reduction from the 55% experienced last reporting period,however, it still represents a significant water quality issue.
Paddys River (Site 842)
Paddys river catchment is a combination of rural, forestry andconservation landuses. The water quality for Paddys River is fairwith the analysis of monitored data indicating a downward trend inpH, total nitrogen and chlorophyll ‘a’. The biological monitoringsite on Paddys River is Murrays Corner (Site 10), which isconsidered a reference site. Both O/E results for the samplingperiod were equal to reference (A), indicating good water qualityand physical habitat.
ACT Water Quality Report 2000–2001
Environment ACT34
Median values remained constant or decreased for mostparameters. However, faecal coliforms median was higher whencompared to the median from the previous reporting period,220cfu/100ml exceeding the standard. This may be caused byagricultural practices in the catchment. There was also anincrease in the turbidity median, and based on the streamflowconcentration relationship the turbidity would have exceeded thestandard of 10 NTU 47% of the time. The increased level ofturbidity but not suspended solids would cause some reduction inlight penetration and associated plant and algal growth, but haveonly minor influence on macroinvertebrates. To improve waterquality the Paddys River Landcare group has undertaken aproject to limit access of stock to the river.
Gudgenby River (Site 901)
The Gudgenby drains a rural catchment dominated by nativeforest. The biological monitoring overall site band for the site atSmiths Road Crossing (20) for both sampling sessions wasequivalent to reference (A), indicating good water quality. Trendassessment was not conducted due to a limited data set.Generally indicators complied with the standards.
The turbidity median increased from the previous reportingperiod, however, continues to comply with the standard. On thestreamflow concentration relationship it would be expected toexceed 41% of the time. Suspended solids would have exceededthe standard 14% of the time and total phosphorus 2.3%.
Murrumbidgee River
The Murrumbidgee River runs through the ACT entering at AngleCrossing (213) in the south and is sampled at a number oflocations including Kambah Pool (209), Uriarra Crossing (207),the Northern Border (224) and Halls Crossing (204), which is inNSW, downstream of the ACT. The biological monitoring sites forthe Murrumbidgee are Angle Crossing (40) and Halls Crossing(53).
The overall site band for autumn and spring for both sites wasbelow reference (B). Angle Crossing is a reference site, whichmay indicate that biological conditions may be naturally lowerthan expected throughout the sampling period or that the site itselfhas been impacted.
The trend analysis undertaken on the sites showed a significantdecrease in pH along the length of the river, from data collected

ACT Water Quality Report 2000–2001
Environment ACT 35
since 1992. Ammonia trends for the three southern sites were allsignificantly downward, and conductivity is also decreasing atAngle Crossing and Kambah pool. Angle Crossing also has adecreasing trend for total phosphorus and a slight increasingtrend for chlorophyll ‘a’. Total phosphorus at the ACT border isdecreasing, while the turbidity trend at Halls Crossing isincreasing.
Most readings for parameters along the river comply with thestandard. Chlorophyll ‘a’ medians have increased since the 1999-2000 reporting year and concentrations tend to increase as theriver passes through the ACT. Median values for totalphosphorus, total nitrogen, faecal coliforms and conductivity alsoincrease from where the Murrumbidgee enters the ACT to whereit leaves.
The total nitrogen levels at (Site 224) and (Site 204) are affectedby sewage effluent discharge. The median values for these siteshave decreased, following the increase experienced in the lastreporting year. Higher conductivity may be partly due to the levelsin the Molonglo River and the additional input of treated effluent atLMWQCC.
Conductivity median values have decreased since the previousreporting period, which was effected by low rainfall and flow. ThepH readings all complied with standards and have remained in asimilar range to the previous year.
Dissolved oxygen levels are good along the length of the river.Faecal coliform levels complied with the standard, the highestmedian value was 58 cfu/100 mL recorded at Halls Crossing.
Suspended solids and turbidity median values complied withstandards. However, the suspended solids median at (Site 209)has increased from 4.4 to 7.5 and turbidity median from 4.2 to6.7. At this site the turbidity would be expected to exceed thestandard 39% of the time, at (Site 204), 46% of the time.Suspended solids at (Site 204) exceeded the standard 12.7% ofthe time.
The typically good water quality experienced in the MurrumbidgeeRiver indicates that land use and management practices, whichinclude sediment retention ponds, authorised discharges andbuilding development controls are effective in minimising theimpact the ACT has on the Murrumbidgee.
ACT Water Quality Report 2000–2001
Environment ACT36
Molonglo River
The Molonglo River is sampled at two sites above Lake BurleyGriffin (Sites 601 and 608) and two sites below the Lake (Sites407 and 401) before it enters the Murrumbidgee River. Thebiological monitoring site is at Sutton Road Bridge (Site 242).
The overall site band for the reporting period remained at belowreference (B) which indicates fair to good river health. The longterm trend since 1991 for suspended solids has been decreasingat all sites. Sites 601, 401 and 407 also show downward trend inphosphorus, with Sites 401 and 407 showing a decreasingnitrogen trend. Downward pH and ammonia trends were alsoexperienced at site 407 and also downward pH at 608. Therewas a detectable upward trend of chlorophyll ‘a’ at 608.
Overall the water quality was good. The exceedance calculatedfor (Site 407) was 6.8% for suspended solids and 1.4% for totalphosphorus. The median values all comply with the standards andthere were no significant increases in these values from previousyears.
Turbidity was not measured in the Molonglo River downstream ofthe lake, as it is not part of the data required of ACTEW under theAuthorisation for the LMWQCC. Historical data suggests that theconcentrations of turbidity at the downstream sites are notsignificantly different from the upstream sites.
Water quality in the Molonglo River downstream of the LMWQCCappears to have remained relatively unchanged over the pasteight years. No increasing trend in the amount of total dissolvedsolids is encouraging given concerns about rising salinity acrossthe Murray-Darling Basin. A standard of 1000cfu/100ml faecalcoliforms was applied to all sites on the Molonglo, as isappropriate for the designated uses of the water body. Therewere few exceedances of this standard in the reporting period,which shows an improvement from previous years where faecalcoliforms, especially at sites downstream of the lake, were acause for concern.