Embed Size (px)
Citation preview

WATER QUALITY ASSESSMENT OF PUTRAJAYA LAKE FOR ALTERNATIVE
SOURCE OF WATER SUPPLY
NUR AQILAH BINTI MOHD SABANDI
Report submitted in partial of the
requirements for the award of the degree
of
B. ENG.(HONS.)CIVIL
ENGINEERING
Faculty of Civil Engineering & Earth
Resources
UNIVERSITI MALAYSIA
PAHANG
JANUARY 2016

v
ABSTRACT
This study focused on determining water quality of Putrajaya Lake. Water Quality is an
important guideline to describe the physical, chemical, and biological properties of
water that classified them into each class with different suitable purposes. A study was
conducted on physical, chemical, and biological parameter of Putrajaya Lake in 2015
water bodies at five stations with three times sampling in the month of September,
October, and November. Physical parameters were temperature and suspended solids.
Whereas, chemical parameters were pH, dissolved oxygen (DO), biochemical oxygen
demand (BOD), chemical oxygen demand (COD), ammoniacal nitrogen, and selected
heavy metals. Biological parameter were Total Coliform and E. Coli. The water was
classified based on Water Quality Index (WQI) and National Water Quality Standard for
Malaysia (NWQS). According to WQI, the classifications of water quality were based
on each station. The most stations in Putrajaya Lake were classified into Class I and II.
Station 3 possessed the highest quality surface water sources with WQI value 95 and
belongs to Class 1. Station 4 followed by 92, continues with Station 2, Station 5, and
Station 1 with value 91,89, and 87 respectively and all of them belong to Class II. Based
on NWQS, Most of parameters are belong to Class I. However, BOD, DO, Total
Coliform, and lead presence are belongs to Class II. Station 4 chosen as most suitable
sources for alternative water supply. The large area covered is the characteristic include
in choosing Station 4 as the most suitable alternative water supply. However, in order to
provide safe water supply, the raw water sources need to undergo conventional water
treatment. According to the Raw Drinking Water Quality Standard the water in Lake
Putrajaya did not pass the standards for COD and lead. The main source of lead in the
Putrajaya Lake is due to the boating activities that became attraction of Putrajaya.
Therefore, it is important to apply new technologies and ideas to control lead
contamination. Overall, water quality determination is important to identify different
suitable purpose of water body. It is important to conserve and preserve the source of
surface water for water supply purpose to avoid water shortage in future.

vi
ABSTRAK
Kajian ini memberi tumpuan dalam menentukan kualiti air Tasik Putrajaya. Kualiti air
adalah satu garis panduan penting untuk menggambarkan ciri-ciri fizikal, kimia, dan
biologi yang diklasifikasikan ke dalam setiap kelas dengan tujuan kegunaan yang
berbeza. Kajian telah dijalankan ke atas ciri-ciri fizikal, kimia dan biologi Tasik
Putrajaya pada tahun 2015 di lima stesen dengan tiga kali persampelan pada bulan
September, Oktober dan November. Parameter fizikal yang diuji adalah suhu dan
pepejal terampai. Manakala, parameter kimia adalah pH, oksigen terlarut (DO),
keperluan oksigen biokimia (BOD), permintaan oksigen kimia (COD), nitrogen
ammonia, dan logam berat terpilih. Parameter biologi adalah E. Coli dan koliform.
Jumlah. Air itu dikelaskan berdasarkan Indeks Kualiti Air (WQI) dan Nasional Standard
Kualiti Air Malaysia (NWQS). Menurut WQI, pengelasan kualiti air adalah berdasarkan
pada setiap stesen. Semua stesen di Tasik Putrajaya telah dikelaskan kepada Kelas I dan
II. Stesen 3 memiliki sumber air permukaan yang berkualiti tinggi dengan nilai WQI 95
dan tergolong dalam kelas 1. Stesen 4 diikuti oleh 92, manakala Stesen 2, Stesen 5, dan
stesen 1 dengan nilai 91,89, dan 87 dan semua daripadanya tergolong dalam Kelas II.
Berdasarkan NWQS, kebanyakan parameter adalah milik kepada Kelas I. Walau
bagaimanapun, BOD, DO, jumlah koliform dan kehadiran plumbum adalah tergolong
dalam Kelas II. Stesen 4 telah dipilih sebagai sumber air yang paling sesuai untuk
bekalan air alternatif. Kawasan yang diliputi besar dengan kriteria pengambilan air yang
sesuai adalah dapat dilihat di stesen 4 sebagai sumber bekalan air alternatif yang paling
sesuai. Dalam usaha untuk menyediakan bekalan air bersih, sumber air mentah perlu
menjalani rawatan air konvensional. Walau bagaimanapun, menurut standard air mentah
bagi tujuan minuman, air di Tasik Putrajaya tidak melepasi standard bagi COD dan
plumbum. Sumber utama plumbum di Tasik Putrajaya adalah berpunca daripada bot-bot
yang menjadi tarikan aktiviti rekreasi di sini. Oleh itu, adalah penting untuk
mengaplikasikan teknologi dan idea baru untuk mengawal pencemaran plumbum.
Secara keseluruhan, penentuan kualiti air adalah penting untuk mengenal pasti tujuan
penggunaan air yang berbeza. Ia adalah penting untuk memelihara dan memulihara
sumber air permukaan untuk tujuan bekalan air untuk mengelakkan kekurangan air pada
masa hadapan.

vii
TABLE OF CONTENTS
PAGE
SUPERVISOR’S DECLARATION ii
STUDENT’S DECLARATION iii
ACKNOWLEDGEMENT iv
ABSTRACT v
ABSTRAK vi
TABLE OF CONTENTS vii
LIST OF TABLES x
LIST OF FIGURES xi
LIST OF SYMBOLS xiii
LIST OF ABBREVIATIONS xiv
CHAPTER 1 INTRODUCTION
1.1 Preamble 1
1.2 Problems Statement 2
1.3 Objectives 2
1.4 Scope of Study 3
1.5 Justification of Study 5
CHAPTER 2 LITERATURE REVIEW
2.1 General 6
2.2 Hydrological Cycle of Water Source
6
2.3 Water Quality Parameter 8
2.3.1 Parameter of Physical Water Quality 8
2.3.2 Parameter of Chemical Water Quality 10
2.3.3 Parameter of Biological Water Quality 16
2.4 Water Quality Standard 16
2.4.1 Water Quality Index 16
2.4.2 National Water Quality Standard (NWQS) 19

viii
2.4.3 Raw Drinking Water Quality Standard 21
2.5 Alternative Water Sources 22
2.5.1 Surface Water 23
2.5.2 Rainwater 23
2.6 Water Pollution 24
2.6.1 Definition of Water Pollution 24
2.6.2 Source of Water Pollution 24
2.6.3 Water Pollution Control 26
CHAPTER 3 METHODOLOGY
3.1 General 27
3.2 Flow Chart of the Study Methodology 27
3.3 Study Area 29
3.4 Sampling and Preservation Method 31
3.5 Experimental Procedure 34
3.5.1 Real Time In-Situ Measurements
34
3.5.2 Dissolved Oxygen (DO) and Biochemical Oxygen
Demand (BOD)
35
3.5.3 Chemical Oxygen Demand (COD) 35
3.5.4 Ammoniacal Nitrogen 36
3.5.5 Total Suspended Solids 36
3.5.6 Heavy Metals Analysis using AAS 37
3.5.7 E. Coli and Total Coliform Presence Test 37
3.6 Analysis of Data 37
3.7 WQI Calculation 39
CHAPTER 4 RESULTS & DISCUSSION
4.1 Introduction 41
4.2 Sampling and Preservation 41
4.3 In-Situ Parameters Measurement 43

ix
4.3.1 Temperature 43
4.3.2 Determination of pH Value 44
4.3.3 Dissolved Oxygen (DO) 45
4.4 Laboratory Analysis of Water Parameters 46
4.4.1 Biochemical Oxygen Demand (BOD) 46
4.4.2 Chemical Oxygen Demand (COD) 47
4.4.3 Ammoniacal Nitrogen 48
4.4.4 Total Suspended Solids (TSS) 49
4.4.5 Heavy Metal Analysis 50
4.4.6 Determination of Total Coliform and E.Coli 53
4.5 Results Comparison 55
4.5.1 Water Quality Index (WQI) 55
4.5.2 National Water Quality Standard (NWQS) 57
4.5.3 Raw Drinking Water Quality Standard 59
4.6 Putrajaya Lake as Alternative Water Supply 60
CHAPTER 5 CONCLUSION AND RECOMMENDATIONS
5.1 Introduction 62
5.2 Conclusion 62
5.3 Recommendations and Suggestions 64
5.3.1 Recommendations 64
5.3.2 Suggestions 64
5.3.3 Conventional Water Treatment Process 65
REFERENCES 68
APPENDICES
A Water Quality Standard Used 72
B Result of Experiments 78
C Experimental Procedures 88

x
LIST OF TABLES
Table No Title Page
2.1 Water Quality Index (WQI) Classes 17
2.2 General Rating Scale for the Water Quality Index (WQI) 18
2.3 National Water Quality Standards for Malaysia 19
2.4 National Water Quality Standards for Malaysia (cont.) 20
2.5 Guidelines for Raw Drinking Water Quality Standard 21
2.6 Guidelines for Raw Drinking Water Quality Standard
(cont.)
21
3.1 Catchment Area of the Putrajaya Lake 30
3.2 Location and Coordinates of Sampling Station at Putrajaya
Lake
32
3.3 Sample Hold Time 34
3.4 Statistical Methods Use to Evaluate Data 38
3.5 Water Quality Index (WQI) Classes 39
4.1 Weather During Sampling at Putrajaya Lake 42
4.2 Average WQI Value of each Station 56
4.3 Average Value of Parameters Tested for Comparison to its
Classes Based on National Water Quality Standard
Malaysia
58
4.4 Average Value of Parameters Tested for Comparison to the
Acceptable Value Based on Guidelines for Raw Drinking
Water Quality Standard
59
4.5 Average Value of Parameters Tested for Comparison to the
Acceptable Value Based on Guidelines for Raw Drinking
Water Quality Standard (cont.)
60

xi
LIST OF FIGURES
Figure No Title Page
1.1 Shape of Putrajaya Lake 4
1.2
Location of Study Area, Putrajaya Lake
4
2.1
The Hydrological Cycle Movement of Water
7
3.1
Flow Chart of The Study Methodology
28
3.2
Location of Sampling Stations
31
4.1 Observation of Temperature at Different Sampling Stations 43
4.2 pH value at Different Sampling Stations 44
4.3 Dissolved Oxygen Value at Different Sampling Stations 45
4.4 Biochemical Oxygen Demand at Different Sampling
Stations
46
4.5 Chemical Oxygen Demand at Different Sampling
Stations
47
4.6 Ammoniacal Nitrogen at Different Sampling
Stations
48
4.7 Total Suspended Solids at Different Sampling
Stations
49
4.8 Chromium Concentration at Different Sampling
Stations
50
4.9 Lead Concentration at Different Sampling Stations 51
4.10 Copper Concentration at Different Sampling Stations 52
4.11 Zinc Concentration at Different Sampling Stations 53
4.12 E.Coli Presence at Different Sampling Stations 54

xii
4.13 Total Coliform Presence at Different Sampling Stations 55
5.1 Schematic Drawing of Conventional Water Treatment
Process
65
5.2 Flowchart of Conventional Water Treatment Process 67

xiii
LIST OF SYMBOLS
oC Degree Celcius
mg/L Miligram per Liter
MPN Most Portable Number

xiv
LIST OF ABBREVIATIONS
BOD Biochemical Oxygen Demand
COD Chemical Oxygen Demand
Cr Chromium
Cu Copper
DID Department of Irrigation and Drainage Malaysia
DO Dissolved Oxygen
DOE Department of Environment Malaysia
ERL Express Rail Link
MARDI Malaysian Agricultural Research and Development
Institute
NWQS National Water Quality Standard
Pb Lead
TSS Total Suspended Solids
UMP Universiti Malaysia Pahang
UNICEF United Nations Children’s Fund
UPM Universiti Putra Malaysia
WHO World Health Organization
WQI Water Quality Index
Zn Zinc

1
CHAPTER 1
INTRODUCTION
1.1 PREAMBLE
Water is valuable natural resources to human, all living things, and healthy
environment. According to non-government organization, the fact that more than
840,000 people die each year from a water related disease and 750 million people lack
access to clean water. A healthy environment is one in which the water quality supports
a rich and varied community of organisms and protects public health. In earth, there is
only 3% of Earth’s water is fresh water and the rest of 97% of the water consist of salt
water (WHO, 2015). However, the fresh water might be decreasing due to high demand
and increasing of population around the world.
There are many types of water resources on earth. The common water resource
is from the water surface for instance stream, pond, river or freshwater wetland. These
surface water resources basic function for the agricultural use, for industrial use and for
the generation of different types of energy such as hydro electrical energy. However, it
is important to conserve the quality of surface since other resources such as
groundwater comes in limited volume and takes longer time to renew the source.
In Selangor , there were water issues that occurred because of a tanker
overturned, spilled diesel into Sungai Selangor, which led to the closing of four
treatment plants which supply water to about 10,000 consumers in Kuala Lumpur and
Selangor. About 2.67 billion liters of water daily, catering to 57% of water demands in
Kuala Lumpur, Putrajaya and Selangor were produced by the four plants (Ruban and
Habibu, 2013).

2
1.2 PROBLEM STATEMENT
The growth of population and expansion in urbanization, industrialization and
irrigated agricultural is imposing growing demand and pressure on water resource. The
existing water resources nowadays were facing the pollution because of this
phenomenon (Che-Ani et al., 2009). This evaluation is importance since Selangor and
Lembah Klang area faced shortage of water nowadays. The recent global experience of
the 1998 El Nino has caused a long drought in Malaysia. The lack of rainfall in the
catchment areas especially in the state of Selangor given result the two dams that
supply water to Kuala Lumpur and surrounding regions to almost critical levels. The
water crisis lasted from March to September 1998 and affected 1.8 million residents
(Aini et al., 2001). Water crisis has become severe problem and further study need to
be done to find the solutions.
Besides that, many rivers in Malaysia polluted due to improper chemical
disposal. This chemical disposal may cause health problem to people. The water need
to go through complex treatment before it can be consumed. According to the report by
the Department of Environment (1998) there were 25 rivers (21.4%) that were polluted
in 1997, a doubling of the figure in 1996. This is of grave concerned since rivers are the
main sources of water supply to the country. They were due to the dumping of
industrial waste, domestic effluent, agriculture and livestock production processes
(DOE, 1994). Study of lake as alternatives source of water supply is important since
water demand increase by time and populations at Selangor area due to rapid
development. Besides that, the climate changes also affect the availability of water
supply.
1.3 OBJECTIVE
The main objectives of this study are :
To determine the water quality status consisting physical, chemical, and
biological parameter based on Water Quality Index and National Water Quality
Standard Malaysia.

3
To identify whether Putrajaya Lake are suitable as water supply resources based
on Raw Drinking Water Quality Standard.
1.4 SCOPE OF STUDY
Putrajaya is located 25km away at the south Kuala Lumpur. Putrajaya plays a
role as federal administrative centre of Malaysia. The location of Putrajaya Lake
located at water crisis problem most occur in Malaysia. Shortage of water occur in
most Selangor state and Lembah Klang area which located near the boundaries of
Putrajaya Lake.
Sampling stations in this research area was located at various points according
to their different depth, current flow, and surrounding activities around the lake.
Besides that, sampling points also based on water intake criteria. Water intake criteria
consists of best available water quality, far from strong current, quantity of water
demanded can be achieved at very low water flow rate, easy accessible and possess
adequate space and facilities for maintenance. The sample from each sampling point
will be taken once since lake is not a stream flow that may show frequent changes.
The study includes physical, chemical, and biological characteristic parameters.
The physical parameter consists of temperature, conductivity and suspended solid test.
Whereas chemical parameter consists of pH test, Dissolve Oxygen (DO), Biochemical
Oxygen Demand (BOD), Chemical Oxygen Demand (COD), and test for heavy metal
presence. Biological parameter consists of Absence-Presence Test.

4
Figure 1.1 : Shape of Putrajaya Lake
Source : Perbadanan Putrajaya 2015
Figure 1.2 : Location of Study Area, Putrajaya Lake
Source : Google Maps 2015

5
1.5 JUSTIFICATION OF STUDY
The tendency of water demands in Malaysia was estimated to increase from
9,543m3/day in 1995 to 15,285 m3 /day in 2010, or the increase of 60% during 15
years, to 20,338 m3 /day in 2020, or 113% during 25 years (DOE, 2003). It is
important to study other alternative source of water supply besides the river due to this
rapid increasing of water demand.
The infrastructure has been strained by rapid urban growth and there are high
needs of improvement of amenities such as water supply, electricity, transportation,
environment and drainage (Weng, 2004). A new development of water resource like
lakes is very important to make sure that there is no water shortage in the future.

6
CHAPTER 2
LITERATURE REVIEW
2.1 GENERAL
Water is an important element to all living things. Water also plays an important
role in environmental ecosystem. Therefore, study on water quality is important
especially on fresh water that consist lake, groundwater, and river. Water quality is use
to describe the microbiological, physical and chemical properties of water that
determine its fitness for a specific use. These properties are determined by substances
where are either dissolved or suspended in the water. Water quality should be assessed
based on the characteristics of the water relative to the beneficial uses of the water.
This study purpose is to identify whether the lake is suitable as water supply source.
There are several valuable benefits expected by implementing this study. This study
will improve the living standards of human using safe water supplied from lakes which
also can be as alternative source of supply water during the dry season.
2.2 HYDROLOGICAL CYCLE OF WATER SOURCE
Ecosystem consist of plants, animals, fungi, and bacteria that interacting with
one another in the environment that plays a role as their habitat. The hydrologic cycle is
a continuous cycle of water that consists above and below the surface of the earth.
Climatic variables affect the volume of water in earth according to time. There are
several major reservoirs in earth that consist of ice, fresh water, saline water and
atmospheric water. The physical process of evaporation, condensation, infiltration,
precipitation, subsurface flow, and runoff takes place in water movement from one
reservoir to another or from ocean to atmosphere. In order to complete the cycle, the

7
water may change their physical state from liquid to solid to gas and vice versa.
Hydrological cycle links all water bodies in continents of oceans, and studies in
different scales in global extent and in local area. It is essential for scientifically
assessing available fresh water resources (Beniston, 2006).
The hydrologic cycle begins with the evaporation of water from the surface of
ocean. The air is lifted, become low in temperature and form a water vapor. The water
vapor condenses and forms the clouds. The moisture of clouds transported all over
places by wind and return to earth surface as precipitation. Once the water reaches
ground, they form two processes that consist of evaporation and penetration of water to
form groundwater. Groundwater form seeps its way into the oceans, rivers, and
streams. Some of it may release back into the atmosphere by transpiration. The
remaining water on the earth surface is runoff where move to ocean through the lakes,
rivers, and streams to allow the cycle repeats.
Figure 2.1 shows the graphic explanation regarding overall hydrological cycle
process. This process takes place continuously.
Figure 2.1 : The Hydrological Cycle Movement of Water
Source : PhysicalGeography.net

8
The combined effects of urbanization, industrialization and population growth
affect natural landscapes and the hydrological response of watersheds (Marsalek et al.,
2008). Besides that, climate change nowadays gave a great impact towards
hydrological cycle that limits the source of fresh water to living things on earth.
Observational evidence shows that many natural systems are affected by Global
Change, among which the hydrological system is predominantly influenced. Because of
the aforementioned projected large- scale patterns of precipitation and warming, it can
be postulated the Global Change will impact the hydrological cycle and the availability
of fresh water. A shortage of fresh water is expected to be the dominant water problem
of the 21 century. Water shortages coupled with reduced water quality may jeopardize
efforts to secure sustainable development (Speth et al., 2010). Therefore, it is important
to study various alternative water sources to support future water demand.
2.3 WATER QUALITY PARAMETER
Water quality is used to describe the physical, chemical, and biological
properties of water that classified them into each class with different suitable purposes.
Substance that suspended and dissolve in water body need to be analyzed in order to
identify the water quality level. The raw water source should be free from any toxic
elements and dangerous organisms that may hazardous to health. Advanced water
quality or ecologically based standards that integrate physical, chemical and biological
numeric criteria offer the potential to better understand, manage, protect, and restore
water bodies (Magner, 2006). Pesce et al. (2000) defined the quality of surface water
has become a critical issue in many countries, especially due to the concern that
freshwater will be a scarce resource in the future so a water quality monitoring program
is necessary for the protection of freshwater resources.
2.3.1 Parameter of Physical Water Quality
The parameter of physical characteristics water quality in this study consists of
temperature, conductivity and suspended solid.
9
2.3.1.1 Temperature
Temperature measurement can help detect sources of thermal pollution and
suggest the size of habitat for organism that is more sensitive to temperature variation.
The water temperature is a measure of the heat content of the water mass and
influences the growth rate and survivability of aquatic life (Department of Irrigation
and Drainage, 2009).
2.3.1.2 Conductivity
Conductivity in water is affected by the presence of inorganic dissolved solids
such as anions and cations. Conductivity is a measure of the ability of water to pass an
electrical- current. The higher concentration of charges ions in the water, the higher is
value of conductivity of the water. Conductivity and suspended solid is correlated to
each other.
2.3.1.3 Total Suspended Solis (TSS)
Water quality parameters that are used to gauge the clarity of water is
determination of suspended solid (Salleh, 2011). Suspended solid, used to measure the
total suspend solids in the water. This solid may consist of inorganic and organic
particles. Example of inorganic particles commonly found in water is clay, slit and
other constituents meanwhile for organic particles is plant fibbers and biological solids.
Low suspended solids, does not only ensure the desirable clarity of the water for supply
but also ensures maximum disinfection potency. Suspended solids also interfere with
the disinfection process as the particles can shield microbes from the chlorine
compound and even from ultraviolet (UV) sterilization (Salleh et al., 2011).
Total Suspended Solids includes all particles suspended in water where will not
pass through a filter. Suspended solids are present in sanitary wastewater and many
types of industrial wastewater. There are also non-point sources of suspended solids,
such as soil erosion from agricultural and construction sites.

10
As levels of TSS increase, a water body begins to lose its ability to support a
diversity of aquatic life. Suspended solids absorb heat from sunlight, which increases
water, temperature and subsequently decreases level of Dissolved Oxygen (DO).
Photosynthesis also decreases, since less light penetrates the water. As less oxygen is
produced by plants and algae, there is a further drop in DO levels (Government of
Michigan, 2015).
2.3.2 Parameter of Chemical Water Quality
The chemical characteristics of water quality are determination of pH value,
Biochemical Oxygen Demand (BOD), Chemical Oxygen Demand (COD), and
determination of selected heavy metals.
2.3.2.1 Determination of pH Value
pH of the pure de-ionized water contains equal numbers of H+ and OH- ions,
and has a pH of 7. It is considered neutral, neither acidic nor basic. If a water sample
has more H+ than OH- ions, it is considered acidic and has a pH less than 7. If the
sample contains more OH- ions than H- ions, it is considered basic with a pH greater
than 7. Low pH will cause compounds and toxic elements spread easily. Heavy metals
element presence increase when pH level of water low.
2.3.2.2 Biochemical Oxygen Demand (BOD)
Dissolved oxygen is essential for the maintenance of healthy lakes and rivers.
The presence of oxygen in water is a good sign. The lack of oxygen is a signal of
severe pollution. Rivers range from high to very low levels of dissolved oxygen.
Sometimes the level gets so low that there is little aquatic life. Biochemical oxygen
demand is when organic matter decomposed, it is fed upon by aerobic bacteria. In this
process, organic matter is broken down and oxidized (combined with oxygen).
BOD is a measure of the quantity of oxygen used by these microorganisms in
the aerobic oxidation of organic matter. Biochemical oxygen demand represents the
11
amount of oxygen consumed by bacteria and other microorganisms while they
decompose organic matter under aerobic conditions at a specified temperature (Delzer
et al., 2003).
When BOD levels are high, DO levels decrease because the oxygen that is
available in the water is being consumed by the bacteria. Since less dissolved oxygen is
available in the water, fish and other aquatic organisms may not survive.
BOD is usually defined as the amount of oxygen required by bacteria while
stabilizing decomposable organic matter under aerobic conditions. The term
‘decomposable’ may be interpreted as meaning that the organic matter can serve as
food for the bacteria and energy is derive from its oxidation.
In aerobic processes (O2 is present), heterotropic bacteria oxidise about 1/3 of
the colloidal and dissolved organic matter to stable end products (CO2 + H2O) and
convert the remaining 2/3 into new microbial cells that can be removed from the
wastewater by settling.
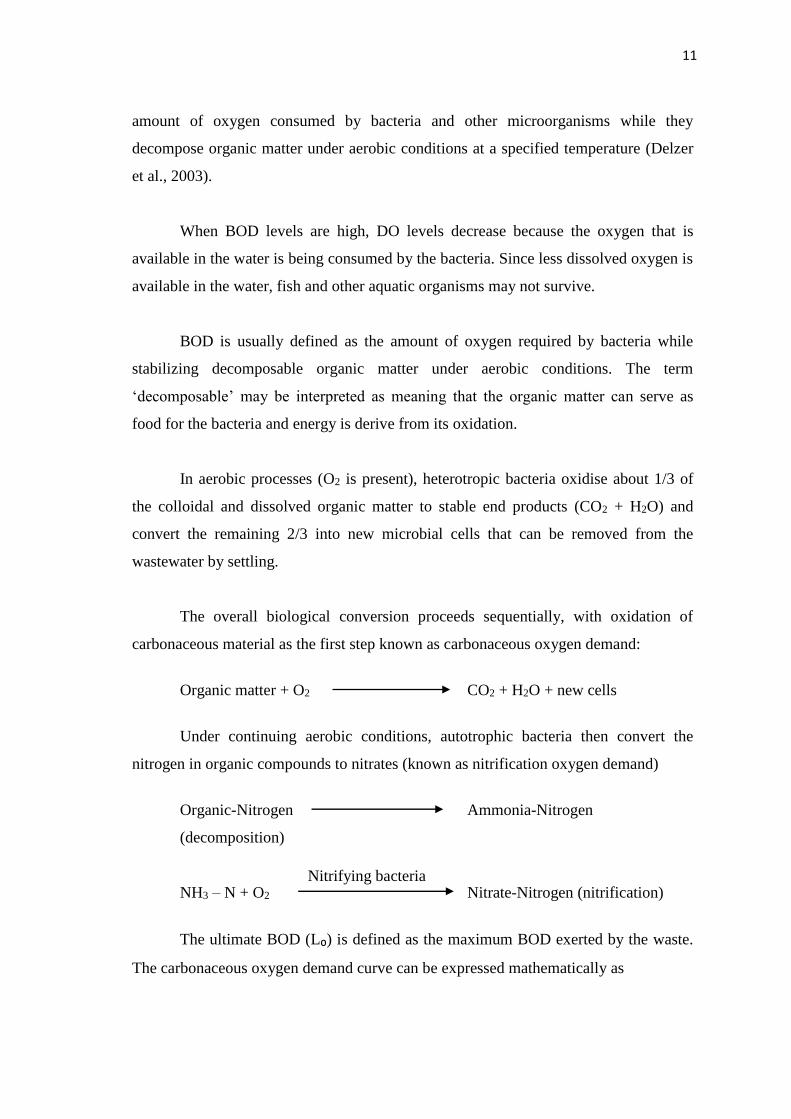
The overall biological conversion proceeds sequentially, with oxidation of
carbonaceous material as the first step known as carbonaceous oxygen demand:
Organic matter + O2 CO2 + H2O + new cells
Under continuing aerobic conditions, autotrophic bacteria then convert the
nitrogen in organic compounds to nitrates (known as nitrification oxygen demand)
Organic-Nitrogen Ammonia-Nitrogen
(decomposition)
NH3 – N + O2 Nitrate-Nitrogen (nitrification)
The ultimate BOD (L₀) is defined as the maximum BOD exerted by the waste.
The carbonaceous oxygen demand curve can be expressed mathematically as
Nitrifying bacteria

12
BODt = L0 (1-10-Kt)
Where,
BODt = Biological oxygen demand at the time t, mg/L
L0 = ultimate BOD, mg/L
t = time, days
K = reaction rate constant, day-1
Most biological processes speed up as the temperature increases and slow down
as the temperature drops. The rate of utilization is affected by temperature the
relationship for the change in the reaction rate constant (K) with temperature is
expressed as
KT = K20 × θT-20
Where,
KT = reaction rate constant at the temperature T, per day
K20 = reaction rate constant at 20°C, per day
θ = temperature coefficient = 1.047
T = temperature of biological reaction, °C
Ultimate BOD (L0),
TL0 = 20L0 [1 + 0.02(T-20)]
Where,
TL0 = ultimate BOD at the temperature T, mg/L
20L0 = ultimate BOD at 20°C, mg/L

13
2.3.2.3 Chemical Oxygen Demand (COD)
Chemical oxygen demand usually used to determine the amount of organic
pollutants in the water. The amount of oxygen in the water used to oxidize all organic
pollutants in the water. High level of COD can affect the ecosystem of the river
especially for the aquatic lives. COD does not differentiate between biologically
available and inert organic matter, and it is a measure of the total quantity of oxygen
required to oxidize all organic material into carbon dioxide and water. COD values are
always greater than BOD values, but COD measurements can be made in a few hours
while BOD measurements take five days (Environmental Protection Agency, 2008).
The COD measures the amount of organic contamination in waste water, for
example water contaminated with sewage, water from food processing plants, textile
factories or water containing organic chemicals. This test is reasonably fast but can
give erroneous results with some contaminants. For example, ethanoic acid
contamination will not be detected but the test will include cellulose. Potassium
dichromate will react with chlorine and this will give an error with water with high
levels of chlorine. The oxidation rate varies for different compounds so it is important
to adhere strictly to the reaction time specified to allow comparisons between samples.
(Chemical, Forensic, Food & Environmental Technology, 2009)
2.3.2.4 Ammoniacal Nitrogen
Ammonia nitrogen is present in variable concentrations in many surface and
ground water supplies. A product of microbiological activity, ammonia when found in
natural water is regarded as indicative of sanitary pollution. Ammonia is one of several
forms of nitrogen that exist in aquatic environments. Unlike other forms of nitrogen,
which can cause nutrient over-enrichment of a water body at elevated concentrations
and indirect effects on aquatic life, ammonia causes direct toxic effects on aquatic life.
Ammonia is produced for commercial fertilizers and other industrial applications.
Natural sources of ammonia include the decomposition or breakdown of organic waste
matter, gas exchange with the atmosphere, forest fires, animal and human waste, and
nitrogen fixation processes (Environmental Protection Agency, 2008).