Embed Size (px)
Citation preview

Water Management Section, Sacramento District, Water Management Section, Sacramento District, US Army Corps of EngineersUS Army Corps of Engineers
Climate Impacts Climate Impacts on Reservoir on Reservoir Rule CurvesRule CurvesStu TownsleyStu Townsley
Chief, Water ManagementChief, Water Management
Sacramento DistrictSacramento District

Water Management Section, Sacramento District, Water Management Section, Sacramento District, US Army Corps of EngineersUS Army Corps of Engineers
Why I did this?Why I did this?
33 CFR 208.11(10) 33 CFR 208.11(10) Revisions. The water control planand all associated documents will berevised by the Corps of Engineers asnecessary, to reflect changed
conditionsthat come to bear upon flood controland navigation, e.g., reallocationof reservoir storage space due to
sedimentationor transfer of storage spaceto a neighboring project.

Water Management Section, Sacramento District, Water Management Section, Sacramento District, US Army Corps of EngineersUS Army Corps of Engineers
Pine Flat Flood Control Pine Flat Flood Control DiagramDiagram
Typical snowmelt influenced rule curve

Water Management Section, Sacramento District, Water Management Section, Sacramento District, US Army Corps of EngineersUS Army Corps of Engineers
0
100000
200000
300000
400000
500000
600000
700000
800000
900000
1000000
Aug
Sep Oct
Nov
Dec Ja
n
Feb
Mar
Apr
May Ju
n
Jul
Rain Flood
Flood Control
Conditional Flood Space=f(snowpack, demands)
Rainflood Space
Flood Space
• Developed from historical record (look-back)• Conditional space dependent on B-120, irrigation demands• Operation based on observed data (rainfall, snow pillows)

Water Management Section, Sacramento District, Water Management Section, Sacramento District, US Army Corps of EngineersUS Army Corps of Engineers
Pine Flat OperationsPine Flat OperationsWY 2006
WY 1997WY 2004
WY 2005

Water Management Section, Sacramento District, Water Management Section, Sacramento District, US Army Corps of EngineersUS Army Corps of Engineers
Potential Flood Potential Flood ImplicationsImplications
Literature suggestsLiterature suggests Warmer regime, about the same Warmer regime, about the same
annual precipitationannual precipitation Smaller snowpack, earlier melt, Smaller snowpack, earlier melt,
flow shiftflow shift Greater storm variability/intensityGreater storm variability/intensity
Implications?Implications? Need more rainflood space?Need more rainflood space? Allow earlier fill?Allow earlier fill?

Water Management Section, Sacramento District, Water Management Section, Sacramento District, US Army Corps of EngineersUS Army Corps of Engineers
Snowmelt TrendsSnowmelt Trends
USGS Fact Sheet 2005-3018Michael DettingerU.S. Geological SurveyScripps Institution of Oceanography

Water Management Section, Sacramento District, Water Management Section, Sacramento District, US Army Corps of EngineersUS Army Corps of Engineers
Mean Snowmelt PeakMean Snowmelt PeakFull Natural FlowsFull Natural Flows
1-Feb
8-Feb
15-Feb
22-Feb
1-Mar
8-Mar
15-Mar
22-Mar
29-Mar
5-Apr
12-Apr
19-Apr
26-Apr
3-May
10-May
17-May
24-May
31-May
7-Jun
1940 1950 1960 1970 1980 1990 2000 2010
Shasta
Oroville
New Bullards
Mean Snowmelt Peak Day Shasta Oroville New Bullards
Period of Record 2-Apr 20-Apr 22-Apr
Last 20 years 3-Apr 15-Apr 16-Apr

Water Management Section, Sacramento District, Water Management Section, Sacramento District, US Army Corps of EngineersUS Army Corps of Engineers
San Joaquin ReservoirsSan Joaquin ReservoirsElevation PercentagesElevation Percentages
0%
10%
20%
30%
40%
50%
60%
70%
80%
90%
100%
0 2500 5000 7500 10000 12500 15000
Elevation (ft)
% E
leva
tio
n b
elo
w
NEW_HOGAN
FARMINGTON
NEW_MELONE
TULLOCH
DON_PEDRO
EXCHEQUER
BURNS
BEAR
OWENS
MARIPOSA
BUCHANAN
HIDDEN
FRIANT
PINE_FLAT
TERMINUS
SUCCESS
ISABELLA
LOS_BANOS
BIG_DRY
CAMANCHE
N58% below 6500’
New Melones38% below 5000’
EqualsEquals20% between20% between5000 ft and 6500 ft5000 ft and 6500 ft

Water Management Section, Sacramento District, Water Management Section, Sacramento District, US Army Corps of EngineersUS Army Corps of Engineers
ShastaShasta (purple = (purple =
5000<elev<6500)5000<elev<6500)

Water Management Section, Sacramento District, Water Management Section, Sacramento District, US Army Corps of EngineersUS Army Corps of Engineers
New BullardsNew Bullards (purple = (purple =
5000<elev<6500)5000<elev<6500)

Water Management Section, Sacramento District, Water Management Section, Sacramento District, US Army Corps of EngineersUS Army Corps of Engineers
Oroville Oroville DrainageDrainage
(purple = (purple = 5000<elev<6500)5000<elev<6500)
Water Management Section, Sacramento District, Water Management Section, Sacramento District, US Army Corps of EngineersUS Army Corps of Engineers
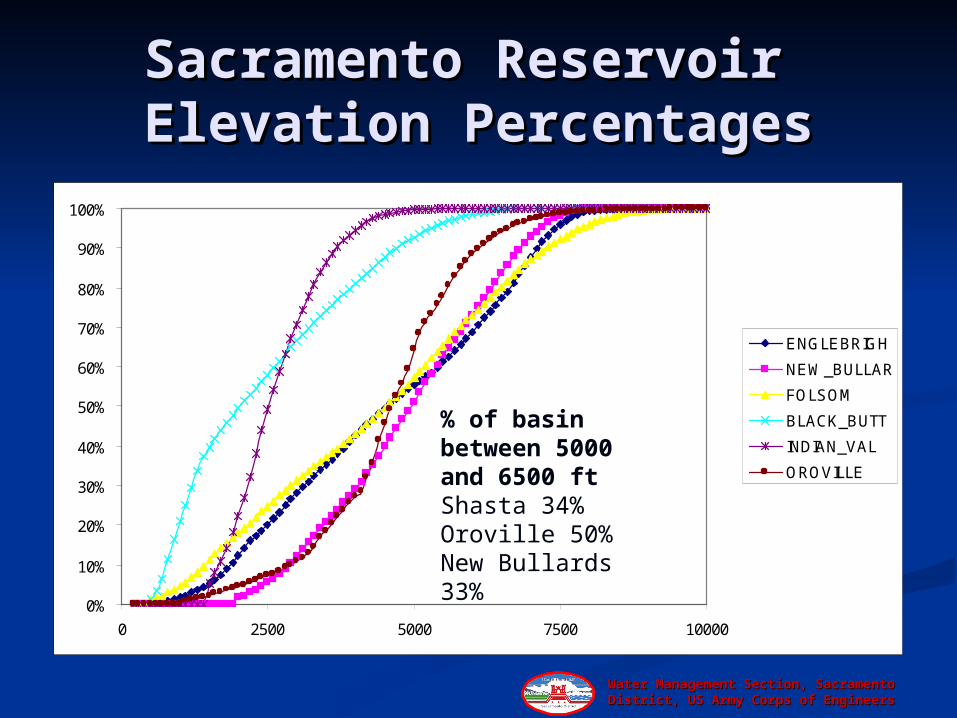
Sacramento Reservoir Sacramento Reservoir Elevation PercentagesElevation Percentages
0%
10%
20%
30%
40%
50%
60%
70%
80%
90%
100%
0 2500 5000 7500 10000
ENGLEBRIGH
NEW_BULLAR
FOLSOM
BLACK_BUTT
INDIAN_VAL
OROVILLE
% of basin between 5000 and 6500 ftShasta 34%Oroville 50%New Bullards 33%

Water Management Section, Sacramento District, Water Management Section, Sacramento District, US Army Corps of EngineersUS Army Corps of Engineers
New BullardsNew BullardsData SetData Set 1% Inflow1% Inflow
(1000 cfs)(1000 cfs)
FullFull 9595
Last 30 Last 30 yearsyears
125125
Model 07 Model 07 (T) 2011-40(T) 2011-40
150150
Model 07 Model 07 (T) 2041-70(T) 2041-70
140140
Model 07 Model 07 (T) 2071-(T) 2071-21002100
150150

Water Management Section, Sacramento District, Water Management Section, Sacramento District, US Army Corps of EngineersUS Army Corps of Engineers
OrovilleOrovilleData SetData Set 1% Inflow1% Inflow
1000 cfs1000 cfs
FullFull 300300
Last 30 Last 30 yearsyears
370370
Model 03 Model 03 (P) 2011-40(P) 2011-40
370370
Model 07 Model 07 (T) 2041-70(T) 2041-70
320320
Model 10 Model 10 (T) 2071-(T) 2071-21002100
370370

Water Management Section, Sacramento District, Water Management Section, Sacramento District, US Army Corps of EngineersUS Army Corps of Engineers
OrovilleOrovilleoperations under operations under climate adjusted climate adjusted
inflowsinflowsE
ElevationRelease

Water Management Section, Sacramento District, Water Management Section, Sacramento District, US Army Corps of EngineersUS Army Corps of Engineers
Climate adjusted Climate adjusted diagram ?diagram ?
0
100000
200000
300000
400000
500000
600000
700000
800000
900000
1000000
1-A
ug
1-S
ep
1-O
ct
1-N
ov
1-D
ec
1-J
an
1-F
eb
1-M
ar
1-A
pr
1-M
ay
1-J
un
1-J
ul
Rainflood Space
Flood Space
ConditionalSpace
Jury still out – takes studies to Jury still out – takes studies to resolve!resolve!

Water Management Section, Sacramento District, Water Management Section, Sacramento District, US Army Corps of EngineersUS Army Corps of Engineers
What next?What next?
GivenGiven Climate change (mean is changing)Climate change (mean is changing) Climate variability (variance is increasing)Climate variability (variance is increasing)
Need better climate models at Need better climate models at watershed scalewatershed scale
Increased process-based, distributed Increased process-based, distributed analysisanalysis
Less reliance on current statistical toolsLess reliance on current statistical tools Move to adaptive rule curves?Move to adaptive rule curves?
Water Management Section, Sacramento District, Water Management Section, Sacramento District, US Army Corps of EngineersUS Army Corps of Engineers
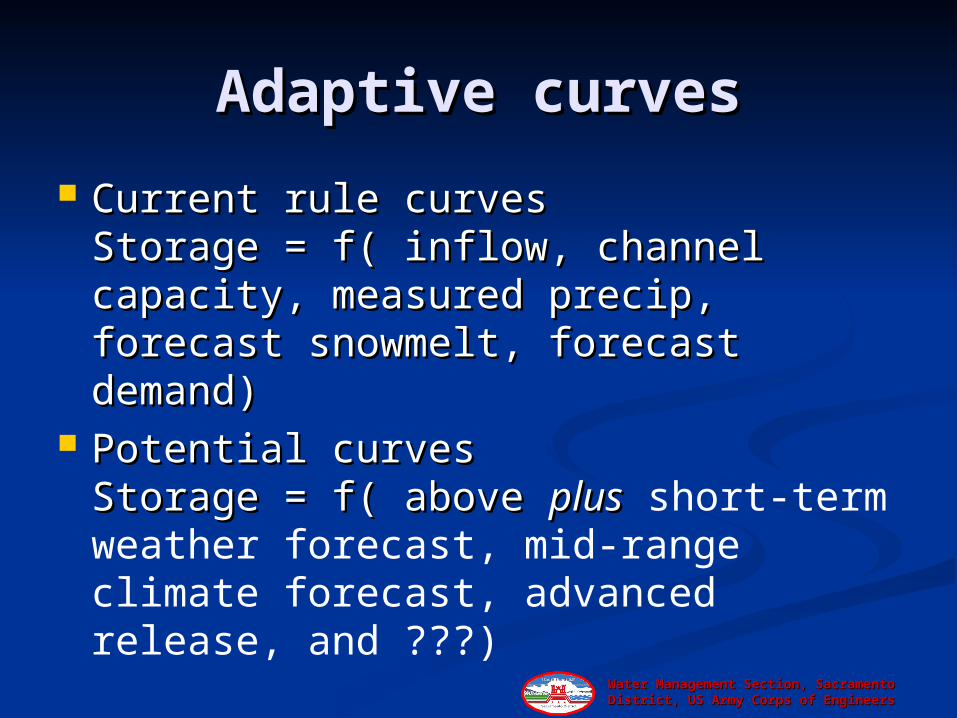
Adaptive curvesAdaptive curves
Current rule curvesCurrent rule curvesStorage = f( inflow, channel Storage = f( inflow, channel capacity, measured precip, forecast capacity, measured precip, forecast snowmelt, forecast demand)snowmelt, forecast demand)
Potential curvesPotential curvesStorage = f( above Storage = f( above plusplus short-term weather forecast, mid-range climate forecast, advanced release, and ???)

Water Management Section, Sacramento District, Water Management Section, Sacramento District, US Army Corps of EngineersUS Army Corps of Engineers
Questions?Questions?