Embed Size (px)
Citation preview

Water Indicators and StatisticsWater Indicators and Statistics
UNSDUNSD
Workshop on environment statisticsWorkshop on environment statistics(Abuja, 19(Abuja, 19--23 May 2008)23 May 2008)
2
Environmental IssuesEnvironmental Issues
•• 2.5% of world2.5% of world’’s water is fresh waters water is fresh water•• 1.1 billion people lack access to 1.1 billion people lack access to
improved water supplyimproved water supply•• 2.4 billion to improved sanitation2.4 billion to improved sanitation•• Competition for water resources in Competition for water resources in
many countriesmany countries

3
Policy and Management IssuesPolicy and Management Issues
•• Covenant on Economic and Cultural RightsCovenant on Economic and Cultural Rights•• 2003 International year of fresh water2003 International year of fresh water•• International Decade on Water for life International Decade on Water for life
20052005--20152015•• Access to basic sanitation and fresh water Access to basic sanitation and fresh water
http://http://millenniumindicators.un.org/unsd/mimillenniumindicators.un.org/unsd/mi//•• Integrated Water Resources ManagementIntegrated Water Resources Management

4
Commission of Sustainable Commission of Sustainable Development Water IndicatorsDevelopment Water Indicators
Theme: Theme: FRESH WATERFRESH WATERSubSub--theme: theme: WATER QUANTITYWATER QUANTITYIndicators: Indicators: PROPORTION OF TOTAL PROPORTION OF TOTAL
WATER RESOURCES USEDWATER RESOURCES USEDWATER USE INTENSITY BY WATER USE INTENSITY BY ECONOMIC ACTIVITYECONOMIC ACTIVITY
SubSub--theme: theme: WATER QUALITYWATER QUALITYIndicators: Indicators: Biochemical Oxygen Demand in water Biochemical Oxygen Demand in water
bodiesbodiesPRESENCE OF FAECAL COLIFORMS IN PRESENCE OF FAECAL COLIFORMS IN FRESHWATERFRESHWATERWastewater treatmentWastewater treatment
Theme: Theme: POVERTYPOVERTYSubSub--theme:theme: SANITATIONSANITATIONIndicator:Indicator: PROPORTION OF POPULATION USING IMPROVED SANITATION PROPORTION OF POPULATION USING IMPROVED SANITATION
FACILITIESFACILITIESSubSub--theme:theme: DRINKING WATERDRINKING WATERIndicator:Indicator: PROPORTION OF POPULATION USING AN IMPROVED WATER PROPORTION OF POPULATION USING AN IMPROVED WATER
SOURCESOURCE

5
MDGsMDGs
•• Proportion of total water resources used Proportion of total water resources used •• Proportion of population using an Proportion of population using an
improved drinking water sourceimproved drinking water source•• Proportion of population using an Proportion of population using an
improved sanitation facilityimproved sanitation facility

6
NEPAD/AEONEPAD/AEO--2 Indicators2 IndicatorsTo be found in chapters on To be found in chapters on •• SocioSocio--economic issues economic issues •• LandLand•• AtmosphereAtmosphere•• Fresh water Fresh water •• WetlandsWetlands•• BiodiversityBiodiversity•• Human settlement Human settlement •• Human healthHuman health
7
NEPADNEPAD•• Internal renewable water resources available per capita or per yInternal renewable water resources available per capita or per yearear•• Fresh water availability for use (household, agriculture, industFresh water availability for use (household, agriculture, industry, etc.)ry, etc.)•• Urban water supply from damsUrban water supply from dams•• Abstraction from boreholes for domestic use in rural/urban settiAbstraction from boreholes for domestic use in rural/urban settings ngs
((percapitapercapita yield)yield)•• Annual water use/consumption per capita per dayAnnual water use/consumption per capita per day•• % of population with access to safe drinking water% of population with access to safe drinking water•• Improved drinking water coverage Improved drinking water coverage -- total populationtotal population•• Number (density) of boreholes per capita unit area (rural)Number (density) of boreholes per capita unit area (rural)•• % of population connected to public water supply% of population connected to public water supply

8
NEPADNEPAD•• Annual withdrawal of ground and surface water as percentage of tAnnual withdrawal of ground and surface water as percentage of total available water otal available water •• Change in surface water dischargeChange in surface water discharge•• Improved drinking water coverage Improved drinking water coverage -- total populationtotal population•• Change in recharge ratesChange in recharge rates•• Biochemical oxygen demand (BOD5) for riversBiochemical oxygen demand (BOD5) for rivers•• Emissions of organic water pollutants (BOD) total/per workerEmissions of organic water pollutants (BOD) total/per worker•• Average annual concentrations of total phosphorus in lakes and rAverage annual concentrations of total phosphorus in lakes and riversivers•• Annual total dissolved solids/sediment flux in lakes and riversAnnual total dissolved solids/sediment flux in lakes and rivers•• Average annual concentrations of total nitrogen in lakes and rivAverage annual concentrations of total nitrogen in lakes and riversers•• Average change in oxygen levels in lakes and riversAverage change in oxygen levels in lakes and rivers•• No. of people affected by water borne diseasesNo. of people affected by water borne diseases•• Water use per capitaWater use per capita•• Improved drinking water coverage Improved drinking water coverage -- total populationtotal population•• % of (change in amount/volume) freshwater used for domestic use,% of (change in amount/volume) freshwater used for domestic use, irrigation, industryirrigation, industry•• Water use a percentage of renewable resourcesWater use a percentage of renewable resources

9
NEPADNEPAD•• No. of people affected (Incidence of) water borne diseasesNo. of people affected (Incidence of) water borne diseases•• Change in No. of water treatment plantsChange in No. of water treatment plants•• Change in sewerage/waste disposal & water supply Change in sewerage/waste disposal & water supply
infrastructureinfrastructure•• Annual internal renewable water resources per capitaAnnual internal renewable water resources per capita•• Total renewable water resources; Total renewable water resources; •• Annual internal groundwater recharge per capitaAnnual internal groundwater recharge per capita•• Annual freshwater consumption per capAnnual freshwater consumption per cap•• Change in No. of boreholes per unit (pop dependent)Change in No. of boreholes per unit (pop dependent)

10
Indicators selected for ECA listIndicators selected for ECA list
Annual groundwater recharge
Change in surface water discharge
Total annual renewable water resources per capita
Ratio of external renewable water resources to total renewable water resources
Proportion of total water resources used [MDG]Water quantity
% of population connected to public water supply
Proportion of population using an improved drinking water source [MDG]
Water accessibility

11
Indicators selected for ECA listIndicators selected for ECA listWater quality (pollution)
Emissions of organic water pollutants (BOD) total/per worker
• Biochemical oxygen demand in water bodies [CSD]
• Chemical oxygen demand in water bodies
• Average annual concentration of total phosphorus in lakes and rivers
• Average annual concentration of total dissolved solids/sediment flux in lakes and rivers
• Average annual concentration of total nitrogen in lakes and rivers
• Average annual concentration of dissolved oxygen in lakes and rivers
• Presence of faecal coliforms in freshwater [CSD]
Water usageTotal annual water use per capita
• % of (change in amount/volume) freshwater used for domestic use, irrigation, industry
• Water use intensity by economic activity [CSD]

12
Indicators selected for ECA listIndicators selected for ECA listWater borne diseases (bilharzias, river blindness, sleeping sickness, etc)
Incidence of water borne diseases
Water management issuesDeveloped national & river basin Integrated Water Resource Management plans
• Wastewater treatment [CSD]
• % of population connected to wastewater collecting system
• Volume of treated wastewater for domestic use
• Amount/volume of disposal of wastewater into wetlands
• % of treated wastewater produced from wetlands
Water availabilityUrban water supply from dams
• Abstraction from boreholes for domestic use in rural/urban settings (per capita yield)
13
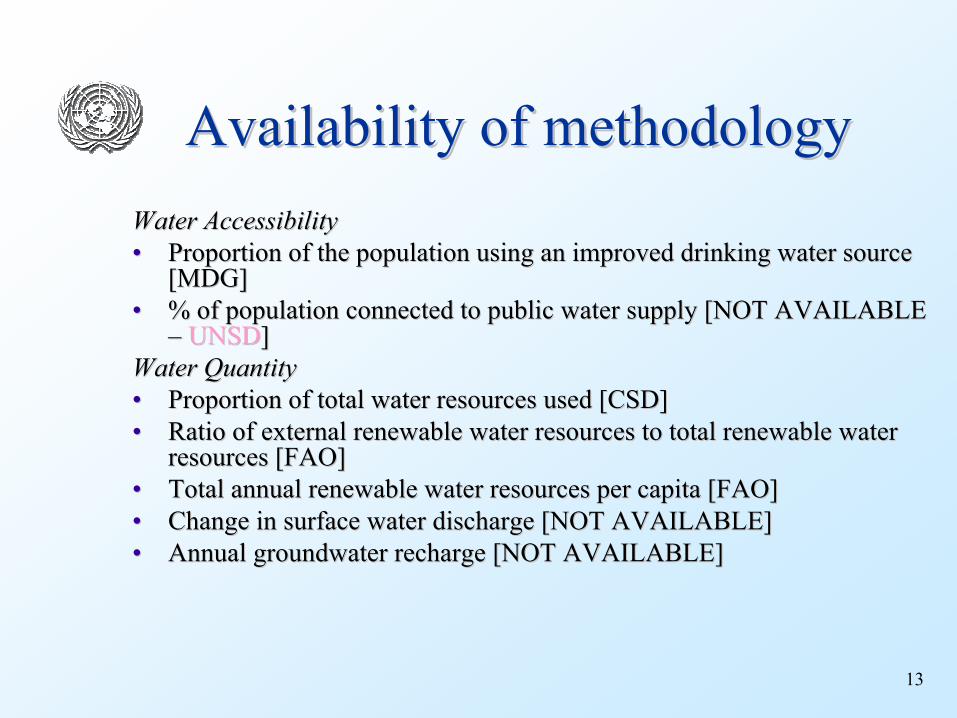
Availability of methodologyAvailability of methodologyWater AccessibilityWater Accessibility•• Proportion of the population using an improved drinking water soProportion of the population using an improved drinking water source urce
[MDG][MDG]•• % of population connected to public water supply [NOT AVAILABLE % of population connected to public water supply [NOT AVAILABLE
–– UNSDUNSD]]Water QuantityWater Quantity•• Proportion of total water resources used [CSD]Proportion of total water resources used [CSD]•• Ratio of external renewable water resources to total renewable wRatio of external renewable water resources to total renewable water ater
resources [FAO]resources [FAO]•• Total annual renewable water resources per capita [FAO] Total annual renewable water resources per capita [FAO] •• Change in surface water discharge [NOT AVAILABLE]Change in surface water discharge [NOT AVAILABLE]•• Annual groundwater recharge [NOT AVAILABLE]Annual groundwater recharge [NOT AVAILABLE]
14
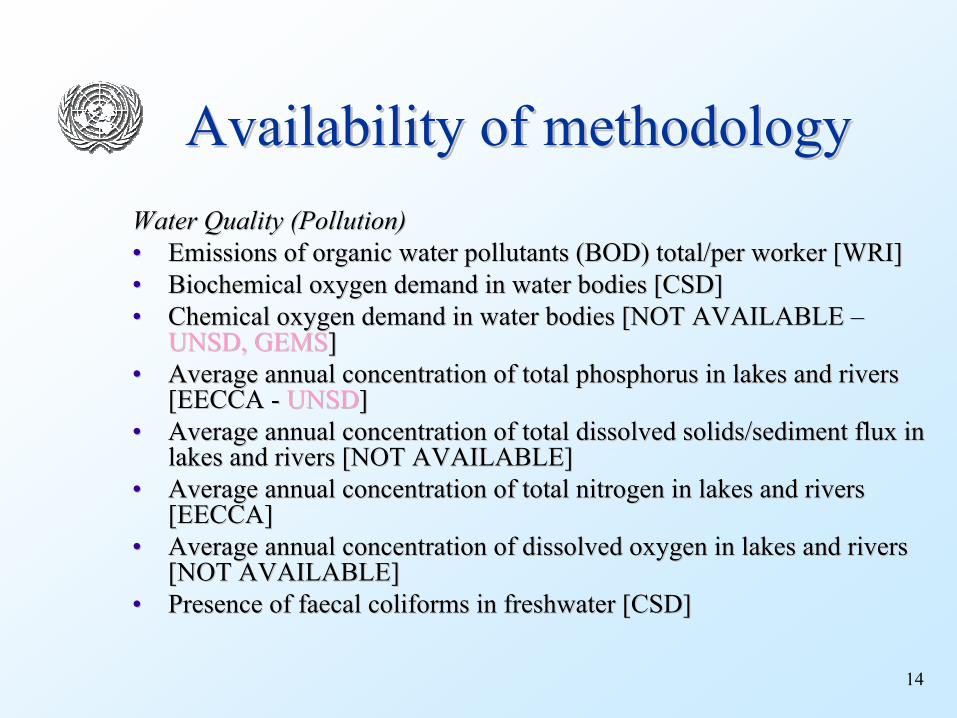
Availability of methodologyAvailability of methodologyWater Quality (Pollution)Water Quality (Pollution)•• Emissions of organic water pollutants (BOD) total/per worker [WREmissions of organic water pollutants (BOD) total/per worker [WRI]I]•• Biochemical oxygen demand in water bodies [CSD]Biochemical oxygen demand in water bodies [CSD]•• Chemical oxygen demand in water bodies [NOT AVAILABLE Chemical oxygen demand in water bodies [NOT AVAILABLE ––
UNSD, GEMSUNSD, GEMS]]•• Average annual concentration of total phosphorus in lakes and riAverage annual concentration of total phosphorus in lakes and rivers vers
[EECCA [EECCA -- UNSDUNSD] ] •• Average annual concentration of total dissolved solids/sediment Average annual concentration of total dissolved solids/sediment flux in flux in
lakes and rivers [NOT AVAILABLE]lakes and rivers [NOT AVAILABLE]•• Average annual concentration of total nitrogen in lakes and riveAverage annual concentration of total nitrogen in lakes and rivers rs
[EECCA][EECCA]•• Average annual concentration of dissolved oxygen in lakes and riAverage annual concentration of dissolved oxygen in lakes and rivers vers
[NOT AVAILABLE][NOT AVAILABLE]•• Presence of Presence of faecalfaecal coliformscoliforms in freshwater [CSD]in freshwater [CSD]
15
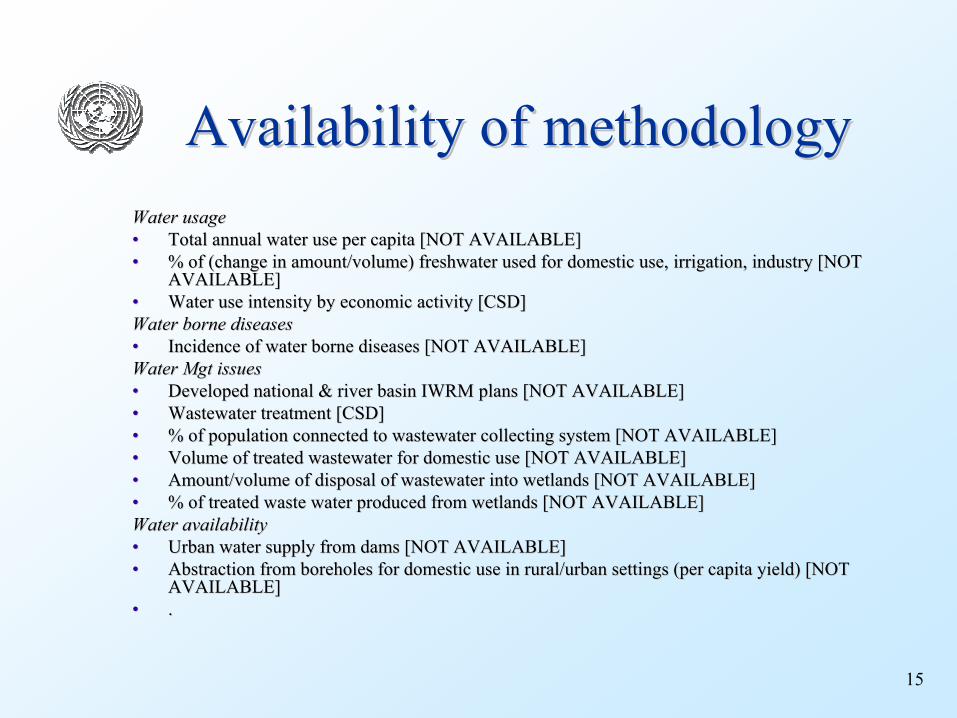
Availability of methodologyAvailability of methodologyWater usageWater usage•• Total annual water use per capita [NOT AVAILABLE]Total annual water use per capita [NOT AVAILABLE]•• % of (change in amount/volume) freshwater used for domestic use,% of (change in amount/volume) freshwater used for domestic use, irrigation, industry [NOT irrigation, industry [NOT
AVAILABLE]AVAILABLE]•• Water use intensity by economic activity [CSD]Water use intensity by economic activity [CSD]Water borne diseasesWater borne diseases•• Incidence of water borne diseases [NOT AVAILABLE]Incidence of water borne diseases [NOT AVAILABLE]Water Mgt issuesWater Mgt issues•• Developed national & river basin IWRM plans [NOT AVAILABLE]Developed national & river basin IWRM plans [NOT AVAILABLE]•• Wastewater treatment [CSD]Wastewater treatment [CSD]•• % of population connected to wastewater collecting system [NOT A% of population connected to wastewater collecting system [NOT AVAILABLE]VAILABLE]•• Volume of treated wastewater for domestic use [NOT AVAILABLE]Volume of treated wastewater for domestic use [NOT AVAILABLE]•• Amount/volume of disposal of wastewater into wetlands [NOT AVAILAmount/volume of disposal of wastewater into wetlands [NOT AVAILABLE]ABLE]•• % of treated waste water produced from wetlands [NOT AVAILABLE]% of treated waste water produced from wetlands [NOT AVAILABLE]Water availabilityWater availability•• Urban water supply from dams [NOT AVAILABLE]Urban water supply from dams [NOT AVAILABLE]•• Abstraction from boreholes for domestic use in rural/urban settiAbstraction from boreholes for domestic use in rural/urban settings (per capita yield) [NOT ngs (per capita yield) [NOT
AVAILABLE]AVAILABLE]•• ..
16
International organizations International organizations involvedinvolved
•• UNSDUNSD•• UNEP UNEP •• GEMSGEMS--WATERWATER•• FAOFAO•• HABITATHABITAT•• WHO/UNICEFWHO/UNICEF•• UNESCOUNESCO•• ……

17
Methodological SupportMethodological Support
•• System of Environmental and Economic System of Environmental and Economic Accounting for Water (SEEAW) interim Accounting for Water (SEEAW) interim statistical standardstatistical standard
•• International Recommendations for Water International Recommendations for Water Statistics (forthcoming)Statistics (forthcoming)
•• UNSD/UNEP Questionnaire GuidelinesUNSD/UNEP Questionnaire Guidelines•• CSD and MDG Methodology SheetsCSD and MDG Methodology Sheets•• FAO AQUASTATFAO AQUASTAT

18
Components of water statistics Components of water statistics
•• Water resources (stocks and flows in the Water resources (stocks and flows in the environment)environment)
•• Water abstraction / supply / use (flows from the Water abstraction / supply / use (flows from the environment to the economy and within the environment to the economy and within the economy)economy)
•• Waste water treatment and discharge, emissions Waste water treatment and discharge, emissions (flows in the economy and from the economy to (flows in the economy and from the economy to the environment)the environment)
•• Quality of ambient water bodiesQuality of ambient water bodies