Embed Size (px)
Citation preview

1unit Water in the world
SAMPLE

40 oxford big ideas geography 7: australian curriculum
Water as a resourceA resource is anything we use to satisfy a need
or a want. Resources we use from the natural
world are called environmental resources. All
life on Earth depends on these environmental
resources to survive. The water we drink, the
Sun we depend on for light and warmth, the
soil we use to grow our crops, and the trees
we rely on to produce the oxygen we breathe
are all environmental resources.
As the world’s population grows, we
continue to place more and more pressure
on these resources. The availability of many
of these environmental resources (including
oil, forests, and of course, fresh water) is
becoming increasingly uncertain.
1.1 How is water an environmental
resource?
1 Which environmental resources do we need to survive?
2 How are the people in the photograph using the
Ganges River as a resource?
1.2 How does water connect and
affect places?
1 How do you think the Ganges River connects places in
India?
2 List three ways that water from the Ganges River might
be used.
SAMPLE

41chapter 1 water as a resource
Source 1.1 Hindus in India believe that bathing in the holy waters of the Ganges River gives them spiritual blessings.
11.3 How much water do we have?
1 Water covers about 70 per cent of the Earth’s surface.
Why, then, do we have a shortage of water to drink and
to wash in?
2 Where do you think the wettest and driest places in
Australia might be found?
ch
ap
ter
SAMPLE

42 oxford big ideas geography 7: australian curriculum
1.1 How is water an environmental resource?
Environmental resources: an overview
Over thousands of years, humans have developed ways of life that depend on almost all environmental resources found on Earth. Water from rainfall, minerals from rocks, and food from the forests and oceans have allowed us to build homes, farms, cities and highways all over the world. We have found and used resources in almost every corner of the Earth. Oil is drilled from beneath polar ice caps and water is drilled from far below barren deserts. Deep in the rainforests we have found plants that can cure illnesses and we have even worked out how to generate electricity from the waters fl owing in our rivers.
Types of environmental resources
Geographers divide all of the environmental resources on Earth into three types:
• renewable resources
• non-renewable resources
• continuous resources.
The fi rst type – renewable resources – will replenish themselves naturally over time if we do not use them too quickly. The trees in a forest are a good example of a renewable resource. We can cut them down for wood, but they will grow back in time. We just need to manage them carefully. In countries such as Australia, fresh water is considered a renewable resource but it needs to be carefully managed to ensure that enough is available for everybody.
The second type – non-renewable resources – are only available in limited (fi nite) amounts. If we overuse them, they will one day run out. Minerals such as coal, oil, diamonds and uranium are good examples of non-renewable resources.
The third type – continuous resources – are available in unlimited (infi nite) amounts. No matter how much or how often we use them, they will never run out. Energy from the Sun and wind are both examples of continuous resources.
Ocean waves are resources
for surfers and holiday-
makers. They can also be
used to generate electricity
and may be a valuable natural
resource in the future.
Oil is the world’s most commonly used
source of energy. It is also used to make
many important goods, such as plastics,
petrol and fertiliser for farms.
Plants, animals and human beings
are renewable resources. Humans,
however, are unique in that our use of
the Earth’s resources is disrupting the
Earth’s natural systems.
Soil is formed when rocks break
down. We use soil to grow the
crops we eat. The animals we
farm for food also rely on the
soil for the grass they eat.
Plants are renewable resources
because they produce seeds in
order to reproduce themselves.
SAMPLE

43chapter 1 water as a resource
Remember and understand
1 What are the three main types of
resources? Give two examples of
each type.
2 Why is it important to look after
renewable resources, such as
fresh water?
3 Describe how you may have used a non-
renewable resource in the last hour.
4 What problems might societies around
the world face if people continue to rely
heavily on non-renewable resources?
Apply and analyse
5 Collect pictures of continuous resources,
non-renewable resources and renewable
resources from newspapers, magazines
or the Internet. Sort these pictures into
groups and describe how each resource
is used by humans.
Evaluate and create
6 What do you think is the most important
resource shown in Source 1.2? Give
some reasons for your answer and be
prepared to discuss this with a partner
and with the class.
Check your learning 1.1
Source 1.2 An overview of the
many types of environmental
resources.
The Sun provides the energy
for plants and animals to
grow and forms the basis
of everything we eat. It also
evaporates water, setting the
water cycle in motion.
Wind is used to power
ships and windmills and
to produce electricity.
In some parts of the world,
electricity is generated from
heat within the Earth. This is
known as geothermal energy.
Even gravity is a resource. Without
gravity, seeds from trees and plants
would never fall to the ground and
grow into plants. There would also
be no rain to help them survive.
The amount of oxygen in our
atmosphere stays about the
same because it is constantly
recycled through plants,
animals and oceans.
Fresh water is vital for
all life forms on Earth,
including plants,
animals and humans.
Forests are a renewable resource
that is under serious threat. Most of
the world’s natural forest cover has
been cleared or logged.
Most of Australia’s
electricity comes from the
burning of coal. Coal is an
important energy resource
in many countries.
Minerals are used as a resource in many
ways. Uranium is just one of thousands
of minerals mined around the world. It is
being used at this nuclear power station
to produce electricity.
Renewable resources
Non-renewable resources
Continuous resources
Types of environmental resources:
SAMPLE
44 oxford big ideas geography 7: australian curriculum
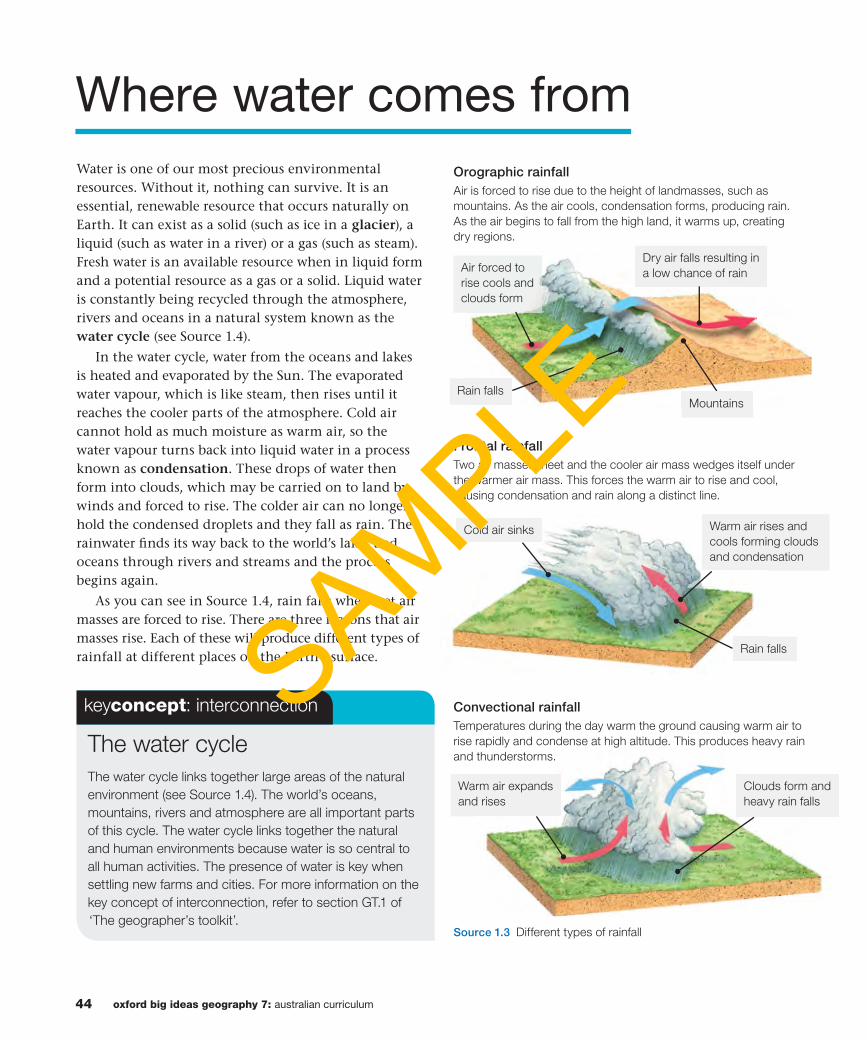
Where water comes from
Water is one of our most precious environmental resources. Without it, nothing can survive. It is an essential, renewable resource that occurs naturally on Earth. It can exist as a solid (such as ice in a glacier), a liquid (such as water in a river) or a gas (such as steam). Fresh water is an available resource when in liquid form and a potential resource as a gas or a solid. Liquid water is constantly being recycled through the atmosphere, rivers and oceans in a natural system known as the water cycle (see Source 1.4).
In the water cycle, water from the oceans and lakes is heated and evaporated by the Sun. The evaporated water vapour, which is like steam, then rises until it reaches the cooler parts of the atmosphere. Cold air cannot hold as much moisture as warm air, so the water vapour turns back into liquid water in a process known as condensation. These drops of water then form into clouds, which may be carried on to land by winds and forced to rise. The colder air can no longer hold the condensed droplets and they fall as rain. The rainwater fi nds its way back to the world’s lakes and oceans through rivers and streams and the process begins again.
As you can see in Source 1.4, rain falls when wet air masses are forced to rise. There are three reasons that air masses rise. Each of these will produce different types of rainfall at different places on the Earth’s surface.
The water cycle
The water cycle links together large areas of the natural
environment (see Source 1.4). The world’s oceans,
mountains, rivers and atmosphere are all important parts
of this cycle. The water cycle links together the natural
and human environments because water is so central to
all human activities. The presence of water is key when
settling new farms and cities. For more information on the
key concept of interconnection, refer to section GT.1 of
‘The geographer’s toolkit’.
keyconcept: interconnection
Source 1.3 Different types of rainfall
Orographic rainfallAir is forced to rise due to the height of landmasses, such as
mountains. As the air cools, condensation forms, producing rain.
As the air begins to fall from the high land, it warms up, creating
dry regions.
Frontal rainfallTwo air masses meet and the cooler air mass wedges itself under
the warmer air mass. This forces the warm air to rise and cool,
causing condensation and rain along a distinct line.
Convectional rainfallTemperatures during the day warm the ground causing warm air to
rise rapidly and condense at high altitude. This produces heavy rain
and thunderstorms.
Rain falls
Warm air expands
and rises
Clouds form and
heavy rain falls
Air forced to
rise cools and
clouds form
Rain falls
Dry air falls resulting in
a low chance of rain
Cold air sinks Warm air rises and
cools forming clouds
and condensation
Mountains
SAMPLE

45chapter 1 water as a resource
Source 1.4 The stages of the water cycle
Remember and understand
1 What is the water cycle?
2 What causes water to fall as rain?
3 List these words in the correct order within the water
cycle: precipitation, condensation and evaporation. Now
write a defi nition for each in your own words.
Apply and analyse
4 What is the difference between frontal rainfall and
orographic rainfall? How are they similar?
5 Why do you think the wettest place in Australia is near
Tully on the eastern slopes of the Great Dividing Range
in Queensland? You might like to fi nd Tully in an atlas to
help with your answer.
6 The water cycle helps us to understand how water moves
in our world but it can also help us understand how
rivers change the landscape. How do you think the rivers
shown in Source 1.4 have changed this landscape?
7 What type of rainfall do you receive most often in the
place where you live? Why will the answer differ for
students who live in other parts of Australia?
8 Salt water in oceans cannot be used to drink or water
crops. Is salt water an available or potential resource?
Evaluate and create
9 Imagine that you are a water droplet in a cloud. Describe
your journey through the water cycle in language that
a young child would fi nd interesting. Here is a start:
‘Floating along with billions of my closest friends,
I thought nothing would ever change …’
Check your learning 1.2
Condensation is water vapour in the
air that cools down and changes to tiny
drops of water. When these drops gather
together, we see them as clouds.
A cloud is a large collection of water drops
or ice crystals. The drops are so small and
light that they can fl oat in the air.
Some of the
precipitation that falls
on land returns to
the rivers, lakes and
oceans as runoff.
The Sun heats the water
in oceans, lakes and
rivers and turns it into a
gas called water vapour.
The water vapour
rises into the air. This
process is known as
evaporation.
When water on the ground soaks into
the soil (infi ltration), plants then take
it in through their roots.
When wet air is forced to rise into the
cooler parts of the atmosphere, the
tiny water drops in clouds join together
and become heavier. They then fall as
precipitation (rain, snow, hail) onto the
land or into the ocean, rivers and lakes.
The water cycle
SAMPLE

46 oxford big ideas geography 7: australian curriculum
windmill
water table saturated zone unsaturated zone
Accessing water resources
Although the surface of the Earth is covered with water, only a tiny percentage of that water is fresh and available for consumption. Typically this is found in surface water, such as lakes and rivers. Source 1.6 shows the breakdown and availability of this water. As populations grow and more water is used, people are also using groundwater locked away in underground aquifers. This water supports every man, woman, child, animal and plant on Earth. This makes water our most precious resource.
To further complicate matters, the available fresh water is not evenly distributed across the planet. Some areas of the world have much more than they need, while other areas do not have enough.
Countries with large rivers, such as the Amazon River in Brazil, and those with high rainfall, such as Indonesia and Papua New Guinea, can be thought of as being ‘water rich’. Other countries, including Australia, can be considered to be ‘water poor’.
Groundwater
When it rains, water seeps into the soil to provide moisture for plants to survive. As water passes through the spaces between soil and rock it becomes groundwater. In the saturated zone, all the spaces between soil and rock particles are fi lled with water. The top of this zone is referred to as the water table (see Source 1.5).
Groundwater is fed by surface water from rainfall and rivers and naturally comes to the surface at springs or at oases in dry areas. Groundwater is also drawn to the surface by bores drilled into the ground. Most of Perth’s water is drawn from an underground aquifer, a layer of permeable rock that stores water.
The world’s freshwater
resources
Source 1.7 is a map of the world as you have never seen it before. While each country is shown in its correct location, its size shows the proportion of the world’s freshwater resources found there. Countries that appear fat are water rich; those that appear thin are water poor. Comparing the size and shape of countries in Source 1.7 with the same countries on a standard world map (like the one provided at the back of this book) will clearly show which are water rich (larger than normal) and which are water poor (smaller than normal). Source 1.5 Groundwater from aquifers is pumped to the surface via bores
for use by humans
Total water 100%
Fresh water 2.5%
freshwater lakes 67.4%
permafrost 0.8%
wetlands 8.5%
groundwater
30.1%
oceans 97.5%
glaciers 68.7%
Surface water 0.4%
plants and
animals 0.8%
rivers 1.6%
soil
moisture
12.2%
atmosphere 9.5%
Source 1.6 Distribution of the world’s water
rainfallSAMPLE

47chapter 1 water as a resource
Africa Oceania
South America
North AmericaAsia
Europe
1001000
Available freshwater resources(cubic kilometres per year)
L E G E N D
PACIFIC
OCEAN
ATLANTIC
OCEAN
ATLANTIC
OCEAN
INDIAN
OCEAN
Using the PQE method to describe maps
The PQE method is used by geographers to identify trends and patterns
in data and draw conclusions. For more information on the PQE method
refer to section GT.2 of ‘The geographer’s toolkit’. There are three steps
to follow when using the PQE (pattern, quantify, exceptions) method to
describe maps:
Step 1 Pattern: Give a general overview of the pattern, referring to
particular places. Which areas seem to have common features?
(For example, ‘The map of the world’s freshwater resources shows
that countries throughout South America have lots of fresh water’).
Step 2 Quantify: Quantify your general overview using data for specifi c
regions or countries. (For example, ‘Brazil has more than 5000 km3
of fresh water a year.’)
Step 3 Exceptions: Point out any exceptions to the pattern you have
described. (For example, ‘Madagascar, the island off Africa, appears to
have abundant water supplies, whereas the rest of the African continent
does not.’)
Apply the skill
1 Use the PQE method to describe the world’s freshwater resources.
Be sure to describe areas that are water rich and those that are water
poor. The world map on the inside back cover will be useful.
skilldrill
Remember and understand
1 How much of the world’s water is
fresh water, available for our use?
2 Is Australia water rich or water poor?
What does this mean?
3 Study Source 1.7.
a Which countries would you
consider to be the most water
rich? Which are the most water
poor?
b Compare the freshwater resources
of Australia, New Zealand and
Papua New Guinea.
Apply and analyse
4 What can countries that are water
poor do to access more fresh water?
Brainstorm this as a class. Think fi rst
of those methods that you already
know about, perhaps those used
in your local area, and then expand
these into other possibilities.
Check your learning 1.3
WORLD: FRESHWATER RESOURCES
Source 1.7 Source: Oxford Big Ideas: Humanities 1
SAMPLE

Stored water
The water cycle is the movement of water through the Earth, but most of the fresh water on Earth is in storage. Fresh water can be stored for days or weeks in a lake or for thousands of years underground or in an ice cap, such as the one that covers much of Greenland. About 97.5 per cent of the Earth’s water is found in the oceans and is too salty to drink. Much of the remaining 2.5 per cent, which is safe for us to drink, is locked in the polar ice caps and in fl owing rivers of ice, known as glaciers.
Antarctica contains nearly 70 per cent of the world’s fresh water as ice in an ice sheet that covers large sections of bedrock (solid ground) in Antarctica. The ice sheet has an average thickness of 2500 metres and scientists have found places where the ice is thought to be twice this thickness. If this ice were to melt, sea levels around the world would rise by up to 60 metres. Because the temperature in the interior of Antarctica remains below freezing, any snow that has fallen there in the last few million years has never melted and has gradually formed into a great dome of ice. The ice is gradually moving towards the sea away from the centre of the continent. As it reaches the sea, the ice breaks off into gigantic icebergs.
Remember and understand
1 List three places where ice is stored.
2 Where is most of the world’s fresh water stored?
3 Why doesn’t the ice in Antarctica melt?
Apply and analyse
4 Look carefully at the map in Source 1.9.
a What happens to the sea surrounding Antarctica in
winter?
b What is the difference between an ice sheet and an
ice shelf?
5 Look carefully at the cross-section of Antarctica in
Source 1.9. This shows a view of Antarctica from the
side as if it had been cut along the A–B–C line on the
map.
a Over which part of Antarctica is the ice sheet the
thickest?
b Describe what Antarctica would look like without its
ice sheet.
c Why is this cross-section a better way of showing
the thickness of ice in Antarctica than the map?
6 What would happen if all the ice in Antarctica were to
melt? What conditions might cause this to happen?
Check your learning 1.4
Source 1.8 The ice of Antarctica stores most of
the world’s fresh water.
SAMPLE

49chapter 1 water as a resource
Antarctic Circle
80°W
100°W
160°W180°140°E 160°E
120°E
100°E
80°E
40°E 20°E 0° 20°W 40°W
60°W
60°E
80°S
60°S
Ross Ice
Shelf
Ronne
Ice Shelf
LarsenIce Shelf
R O S S S E A
D A V I S
S E A
AMUNDSEN SEA
HAAKON VII SEA
WEDDELL SEA
SCOTIA SEA
BELLINGSHAUSEN SEA
Lambert Glacier
S O U T H E R N OC
EA
N
S O U T H E R N O C E A N
P A C I F I CO C E A N
A T L A N T I CO C E A N
I N D I A NO C E A N
Cape Goodenough
Cape Mose
Cape Ann
Cape Norvegia
Cape HornCape Boothby
Cape Flying Fish
CHILE
ARGENTINA
AntarcticPeninsula
G r e a t e r
( E a s t e r n )
A n t a r c t i c a
L e s s e r
( W e s t e r n )
A n t a r c t i c a
P o l a r
P l a t e a u
Vinson Massif5140 m
Mt Erebus 3795 m
TR
AN
SA
NT
AR
CT
I C M
OU
NT
AI N
S
South Pole
Vostok (Russia)
South Magnetic Pole
Casey (Australia)
Scott Base(New Zealand)
Mawson (Australia)
Mountains
KEY
Ice sheet
Ice shelf
Permanent sea ice
Winter sea ice
0 500 1000
kilometres
kilometres
–2000–1000
010002000300040005000 Vinson Massif
5140 mCasey(Australia)
Scott Base (New Zealand)ice sheet ice sheet
bedrock
Height(metres) Greater Antarctica
Lesser Antarctica Antarctic Peninsula
Ross Ice ShelfSea level
TRANSANTARCTICMOUNTAINS
0 500 1000 1500 2000 2500 3000 3500 4000 4500 5000 5500 6000 6500A
A
B
B
C
C
Source 1.9 Source: Oxford University Press
ANTARCTICA: LANDFORMS
SAMPLE

50 oxford big ideas geography 7: australian curriculum
Source 1.10 One of Perth’s desalination plants. The Perth Seawater Plant removes the salt from sea water to produce fresh water.
Neerabup Wanneroo
Lexia
Mirrabooka
Mundaring
Canning
Victoria
Churchman Brook
Wungong
Serpentine
NorthDandalup
South Dandalup
Sampson Brook
Stirling
Gwelup
PerthSeawater
SouthernSeawater
Jandakot
CBD
Mandurah
BunburyCollie
Northam
N
0 20 40 km
Groundwatertreatment plant
Water reservoiror damDesalination plant
Water pipeline
Perth metropolitanarea
Town
L E G E N D
River
Area of map
Perth’s water supplyLike many Australian cities and towns, Perth faces many
challenges in supplying its population with enough fresh
water. A decline in its rainfall over the last 100 years has
meant that the people of this rapidly growing city can no
longer rely on rivers, lakes and dams to supply all their
water needs. About half of Perth’s water now comes out
of the ground. North of the city are large aquifers which
have collected rainwater for thousands of years and stored
it within sand or limestone layers. Wells are dug to access
the water which is treated, mixed with rainwater and used
by Perth residents in their homes, farms and gardens.
Up to 20 per cent of Perth’s water comes from two large
desalination plants. The city was one of the fi rst in Australia to
use desalination plants to provide fresh water. The Western
Australian state government hopes that expansion of these
plants will help to ‘drought-proof’ Perth.
1.2 bigideas: broadsheet PERTH: WATER RESOURCES
Source 1.11 Source: Oxford University PressSAMPLE

51chapter 1 water as a resource
200
100
0
300
600
400
500
To
tal a
nnua
l infl
ow
s in
to P
erth
dam
s (g
igal
itres
*)
700
800
900
1000
19
41
19
43
19
45
19
47
19
49
19
51
19
53
19
55
19
57
19
59
19
61
19
63
19
65
19
67
19
69
19
71
19
73
19
75
19
77
19
79
19
81
19
83
19
85
19
87
19
89
19
91
19
93
19
95
19
97
19
99
20
01
20
03
20
05
20
07
20
09
20
11
Year*1 gigalitre = 1 000 000 000 litres
skilldrill
Using a map legend
In order to show the features on maps clearly, various symbols
and colours are used. To help us unlock the information on the
map these symbols are explained in a legend (or key). There
are three main types of map symbols:
• point symbols – show features in one particular place
(such as a railway station or desalination plant)
• line symbols – show features that connect places
on the map (such as roads and rivers)
• area symbols – use colours or patterns to represent large
areas (such as lakes and cities).
Apply the skill
1 Study Source 1.11.
a What symbol has been used for desalination plants
on this map?
b Give an example of an area symbol used on this map.
c How many groundwater treatment plants supply water
to Perth?
d What do you notice about the location of the dams
on this map?
Source 1.12 Water fl owing in to
Perth’s dams 1941–2011
Extend your understanding
1 Look carefully at Source 1.12.
a Compare the annual fl ow of water into Perth’s dams
before and after 1975. What difference can you see?
b List the four years with the smallest annual infl ows of
water. What do you notice from this pattern?
c Why do you think the annual infl ow of water changes
so greatly between years?
2 What two other sources of water does Perth use to access
water other than dams fed by rain?
3 Do you think it is possible to drought-proof a city? Give some
reasons for your answer.
4 What do you think will happen to the water in an aquifer if
water continues to be pumped out of it for use in a city such
as Perth?
5 Why does Perth need more water now than it did 100 years
ago?
6 What are some of the strategies being tried to address water
problems in other parts of Australia?
SAMPLE

52 oxford big ideas geography 7: australian curriculum
1.2 How does water connect and affect places?
Water connects places
Because people rely on water to survive, easy access to water infl uences where people choose to live. Cities, towns and villages are often located near fresh water sources such as rivers, lakes and underground water reserves. Water sources also directly infl uence the way people live; for example, the crops they grow or the transport they use. As human settlements tend to cluster around the same types of water sources, these water sources need to be shared by the communities. Because of this, many places around the world are connected with each other through these water sources. Generally, three main factors relating to water infl uence where people settle. These factors are discussed below and shown in Source 1.13.
Historical and environmental factors
Historically, towns and cities have developed along rivers and near lakes and other fresh water sources. People will settle anywhere there is water, adapting their way of life to the local environmental features. Communities in the Hindu Kush region of the Himalayas in Pakistan and Afghanistan depend on the seasonal melting of the snow and glaciers to provide them with fresh water. This melt also feeds the great rivers in the region, the Indus River and the Ganges River, that supply water to the many cities and communities that have been established along their banks – around 1.5 billion people.
Agriculture
Communities also rely on fresh water to grow crops and farm animals. The availability of fresh water will determine the sorts of crops grown. In places where water is limited, crops that need little irrigation, such as corn, will be grown. Crops that rely heavily on water, such as rice, are grown on fl oodplains where water is plentiful. These fl oodplains and deltas, located on fl at land where rivers meet the sea, have particularly rich soil due to the deposits of silt that has travelled down the river from the mountains.
Trade and transport
Rivers move water across the Earth’s surface, carrying water great distances to the sea. Rivers, lakes and oceans also act as transport networks, allowing products and people to move easily from one place to another, connecting the communities established on their banks.
Remember and understand
1 Why does water play such an important part in where
people decide to live?
2 How does the availability of water determine how
people in different places live?
3 Name three factors relating to water that infl uence
where people choose to settle. In your own words,
describe each of these factors briefl y.
Apply and analyse
4 Describe how water fl owing along a river can connect
people living at different points along it.
5 How has the choice of crops being grown in Source
1.16 been determined by the environment? By
contrast, what types of crops do you think would be
grown in the location shown in Source 1.14?
Check your learning 1.5SAMPLE

How rivers connect people and places
53chapter 1 water as a resource
Source 1.13 The water that fl ows through the river systems around
the world connects people and places in many ways.
Source 1.15 Large cities and
towns around the world are
connected by rivers. River
waters allow people to travel
and goods to be transported
and traded. This barge on the
Rhine river is carrying coal from
the city of Cologne south to
Switzerland. Source 1.16 Farming
communities along the
Mekong Delta in Vietnam
plant their rice crops
in the rich soil of the
fl oodplains.
Source 1.14 Communities in the
Himalayas (a mountain range in
Asia) depend on annual glacial
melts to replenish their water
supplies. Once replenished,
excess water fl ows into
rivers, connecting these
communities with others
downstream.
St
R
th
Sw
SourceHima
Asi
m
s
SAMPLE

54 oxford big ideas geography 7: australian curriculum
Water affects places
As well as connecting different people and places, water can also affect them – in both positive and negative ways. On the positive side, water from the rain and rivers is used to irrigate the crops and farm the livestock that we eat. This water has a positive effect on the places in which we live. Without it, no life could exist. On the negative side, water in all its states – whether as a liquid (water), a solid (snow and ice) or a gas (fog) – can cause serious problems and damage in different places. Snow storms can shut down cities for days, heavy fog can disrupt air travel and cripple airports, and heavy rainfalls can cause widespread fl ooding.
A good way of understanding how water affects places is to look at some case studies relating to rivers. Rivers are interesting to study because if there is a problem upstream (such as a fl ood or pollution) this problem will quickly travel downstream, affecting the people who live there. Flooded rivers can affect many settlements along their banks, collecting and carrying debris, such as trees and cars, as they go. If pollution or toxic chemicals enter the water at one location on the river, they quickly affect other parts of the river downstream, as well as the people who use it.
Case study: Tisza River pollution,
2000
In 2000, a storage pond used by a gold mine in Romania burst its banks. Around 100 000 cubic metres of water containing poisonous cyanide spilt into a local river that fl owed into the Tisza River in nearby Hungary.
The cyanide spill killed much of the fi sh and plant life for several 100 kilometres downstream. Drinking water was polluted in four different countries: Romania, Hungary, Serbia and Bulgaria.
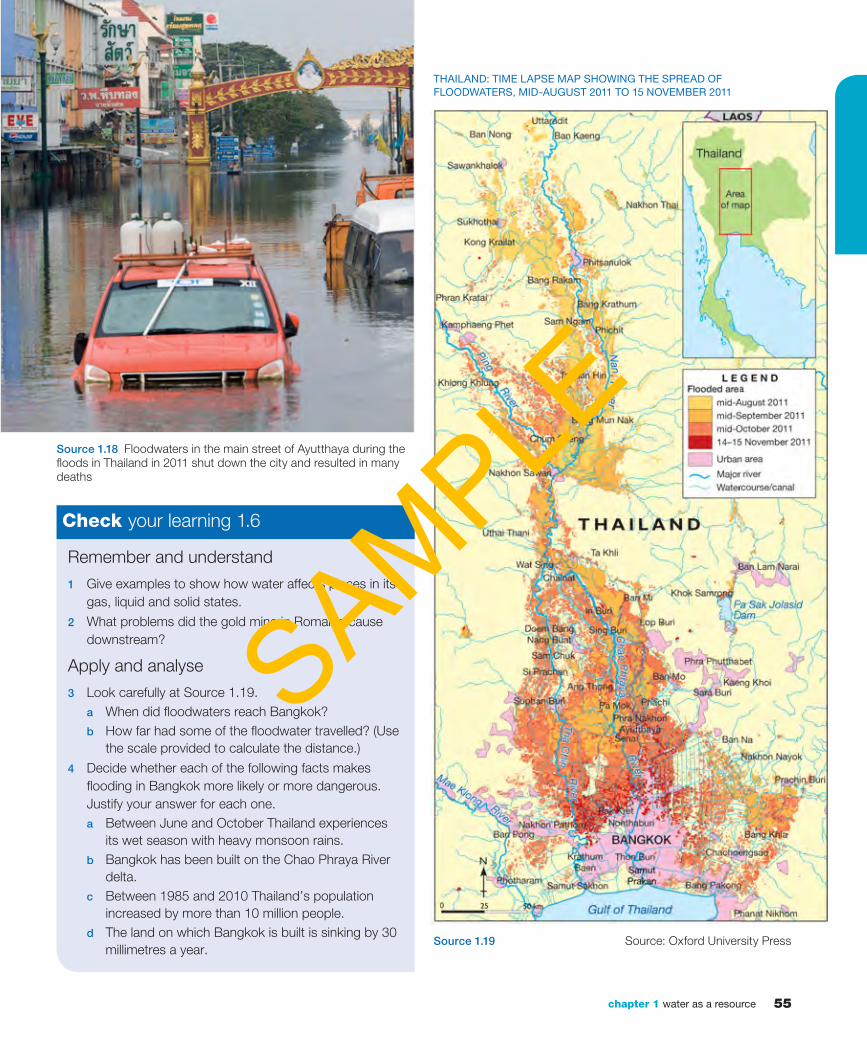
Case study: Thailand fl oods, 2011
In 2011, the people of Thailand experienced some of the worst fl ooding they had seen for decades. Areas of Thailand are prone to fl ooding as the annual monsoon brings heavy rain, particularly in the north of Thailand. In early 2011, a tropical cyclone combined with the monsoon to more than triple the amount of rain falling on northern Thailand. As heavy rains continued for several months, rivers burst their banks in the mountainous north, resulting in fl ash fl ooding and at least 13 deaths.
Flooding continued downstream in many large towns built beside rivers. Soon the country’s capital, Bangkok, became the area of greatest concern. Located on a low fl oodplain at the mouth of the Chao Phraya and Tha Chin Rivers, Bangkok is very prone to fl ooding and, despite an intricate system of fl ood walls and canals, much of the city fl ooded. By the time the fl oodwaters receded, they left more than 500 people dead and a damage bill of more than US$45 billion.
Source 1.17 A Hungarian fi sherman pulls out toxic fi sh from Lake
Tisza on the Tisza River 12 days after a serious chemical spill
upstream in Romania on 30 January 2000.
SAMPLE
55chapter 1 water as a resource
Remember and understand
1 Give examples to show how water affects places in its
gas, liquid and solid states.
2 What problems did the gold mine in Romania cause
downstream?
Apply and analyse
3 Look carefully at Source 1.19.
a When did fl oodwaters reach Bangkok?
b How far had some of the fl oodwater travelled? (Use
the scale provided to calculate the distance.)
4 Decide whether each of the following facts makes
fl ooding in Bangkok more likely or more dangerous.
Justify your answer for each one.
a Between June and October Thailand experiences
its wet season with heavy monsoon rains.
b Bangkok has been built on the Chao Phraya River
delta.
c Between 1985 and 2010 Thailand’s population
increased by more than 10 million people.
d The land on which Bangkok is built is sinking by 30
millimetres a year.
Check your learning 1.6
Source 1.18 Floodwaters in the main street of Ayutthaya during the
fl oods in Thailand in 2011 shut down the city and resulted in many
deaths
THAILAND: TIME LAPSE MAP SHOWING THE SPREAD OF
FLOODWATERS, MID-AUGUST 2011 TO 15 NOVEMBER 2011
Source 1.19 Source: Oxford University Press
SAMPLE

56 oxford big ideas geography 7: australian curriculum
Crop
Wat
er (m
egal
itres
*)
10
12
8
6
4
2
0RiceSugarCotton GrapesFruitVegetables Grains/
pasture/
livestock
*A megalitre is 1 million litres
Rice Bubbles
Rice Bubbles are
made from 89 per
cent whole white
rice, which is grown
in the Murrumbidgee
Irrigation Area (part
of the Murray–Darling
Basin). Much of
the rice industry
is centred around
Deniliquin in southern
New South Wales.
Estimated water
needed to produce
1 kilogram of rice:
1550 litres
Milk and butter
More than 60 per cent
of Australia’s milk and
milk products comes
from Victoria. Leongatha
in Victoria is home to a
huge dairy factory.
Estimated water
needed to produce
1 glass of milk:
200 litres
Estimated water
needed to produce
1 kilogram of butter:
18 070 litres
Water for food
Farmers are by far the biggest users of water in Australia. About 70 per cent of the fresh water used each year in Australia is used in agriculture. This water is used to produce an enormous range of products, many of which you consume every day (see Source 1.20).
You may not realise it, but a lot of water was needed to produce your breakfast. Many everyday products use even more water. For example, it takes up to 50 000 litres of water to produce 1 kilogram of beef, and 685 000 litres to produce enough wool to make one suit. The amount of water needed to produce an item of food, such as a steak, or a piece of clothing, such as a suit, is known as virtual water.
In Australia, many crops are grown in the Murray–Darling Basin in south-eastern Australia (see Source 1.23). While a lot of the water used in this region falls on the farms as rain, much of it is taken from the rivers. Movement and control of water has a large economic impact in this region.
In the past, the rivers in this region had a normal cycle of fl ood and drought. Farmers needed a more reliable fl ow of water and so a system of dams and weirs was built along the river. These collect water during wet times and release it gradually during dry times, thereby controlling the fl ow of the river.
Farmers are allowed to use a certain amount of water each year and are charged for the amount of water they use. Because they have to pay for their water, farmers in this region use it very carefully. Another reason for farmers to use water as effi ciently as possible is the scarcity of water in many parts of Australia. In the early years of the twenty-fi rst century, a widespread and severe drought turned the Darling River and many others into a series of pools separated by kilometres of dry river bed. Because of these factors, many farmers and farming industries have developed more water-effi cient methods of farming.
er
Raspberry jam
The main ingredient
in raspberry jam is
sugar. Virtually all of
Australia’s sugar is
grown in Queensland.
Raspberries grown in
the Goulburn Valley
make up 40 per cent
of the jam.
Estimated water
needed to produce
1 kilogram of sugar:
173 litres Estimated
amount of water
needed to produce
1 kilogram of
raspberries:
713 litres
mm
Bread
The main ingredient
in bread is wheat.
New South Wales
produces the most
wheat in Australia,
most of this in the
east of the Murray–
Darling Basin.
Estimated water
needed to produce
1 kilogram of
wheat: 750 litres
B d
Apricots
Apricots are grown
and processed in
northern Victoria
and southern New
South Wales. They
are processed
in various plants
centred around
Shepparton,
Victoria.
Estimated water
needed to produce
1 kilogram of
apricots: 1391 litres
ees
Source 1.21 Water used per hectare (10 000 square metres) to grow
selected crops
Source 1.20 Water requirements to produce typical breakfast foods
SAMPLE

57chapter 1 water as a resource
Lake Hume
High rainfall grazing
Summer rainfall grazing
Irrigation areas
Wheat/sheep belt
Rangelands
L E G E N D
River
Darlin
g Rive
r
Murray
0 200 400 km
Murray–DarlingBasin
Murray River irrigation
Lake Hume is an artifi cial lake formed by the Hume Weir near Albury–Wodonga on the Murray River. Completed in 1936, it is one of a series of dams and weirs built to control the fl ow of water in the Murray River. Its main purpose is to trap water during periods when there is a large amount of water in the Murray River and release it gradually to keep the fl ow of the river relatively constant.
A network of irrigation pipes and open channels carries the water from the Murray River hundreds of kilometres to individual farms. Open channels are generally less effi cient than pipes as water is lost to evaporation and water seeping into the soil. However, they are much cheaper to build than pipes.
When the water reaches the farms it fl ows through gravity or is pumped onto the crops or pastures. A common method of irrigation is the use of a pivot spray. A giant arm with sprayers attached moves around a central pivot point, creating distinctive circles of green.
Source 1.23 Source: Oxford Atlas
Source 1.22 An irrigation channel in the Murray–Darling Basin
Source 1.24 Pivot spray irrigation
Remember and understand
1 How much of Australia’s fresh water is used on farms?
2 How does water for irrigation of crops and pastures
reach the farms?
3 Rank the breakfast foods shown in Source 1.20 in
order from greatest water need to least water need.
Apply and analyse
4 Can farmers use as much water as they want?
5 Look at Source 1.21.
a Which crop uses the most water?
b Which crop uses the least water?
6 Why do you think it takes so much water to produce
1 kilogram of rice?
7 In what ways is the Murray–Darling Basin one of
Australia’s most important resources?
8 Look closely at the map (Source 1.23).
a What relationship do you notice between irrigation
areas and rivers?
b Explain the nature of this relationship.
Evaluate and create
9 Draw a labelled diagram to clearly show how pivot
spray irrigation works. Use Source 1.24 to help you.
Check your learning 1.7
MURRAY–DARLING BASIN: LAND USE
SAMPLE
58 oxford big ideas geography 7: australian curriculum
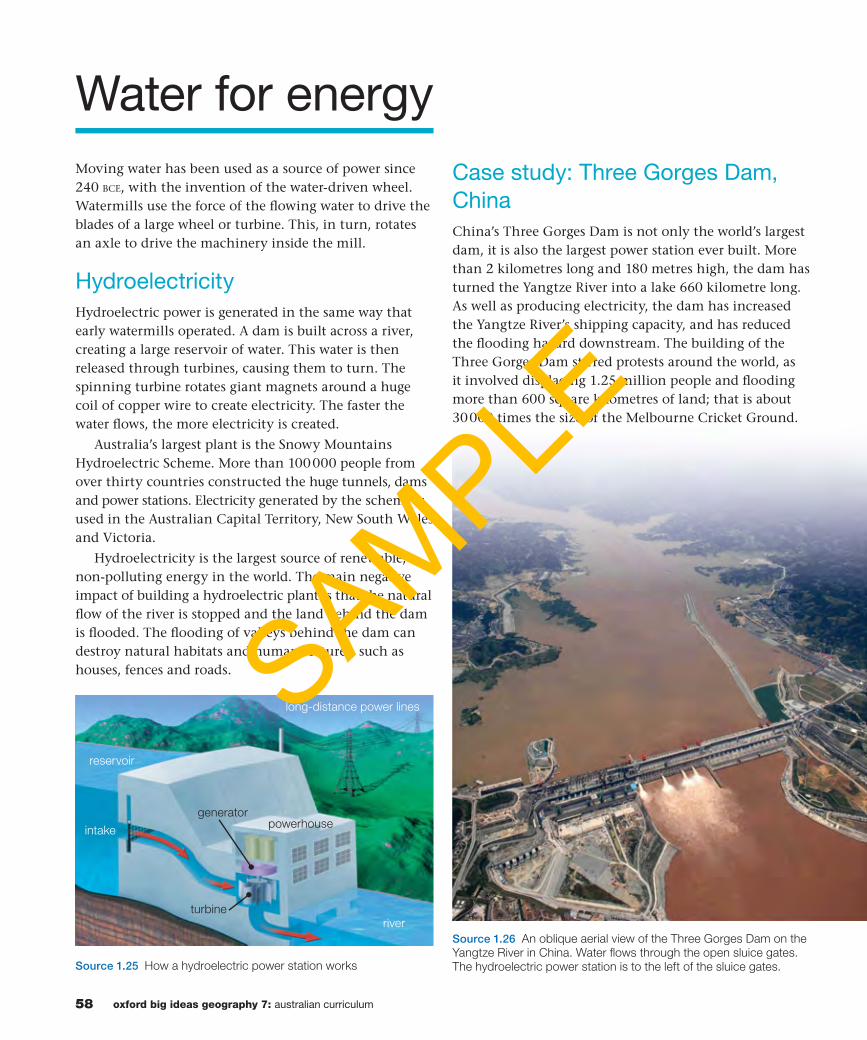
Source 1.25 How a hydroelectric power station works
intakepowerhouse
long-distance power lines
turbine
generator
reservoir
river
Water for energy
Moving water has been used as a source of power since 240 BCE, with the invention of the water-driven wheel. Watermills use the force of the fl owing water to drive the blades of a large wheel or turbine. This, in turn, rotates an axle to drive the machinery inside the mill.
Hydroelectricity
Hydroelectric power is generated in the same way that early watermills operated. A dam is built across a river, creating a large reservoir of water. This water is then released through turbines, causing them to turn. The spinning turbine rotates giant magnets around a huge coil of copper wire to create electricity. The faster the water fl ows, the more electricity is created.
Australia’s largest plant is the Snowy Mountains Hydroelectric Scheme. More than 100 000 people from over thirty countries constructed the huge tunnels, dams and power stations. Electricity generated by the scheme is used in the Australian Capital Territory, New South Wales and Victoria.
Hydroelectricity is the largest source of renewable, non-polluting energy in the world. The main negative impact of building a hydroelectric plant is that the natural fl ow of the river is stopped and the land behind the dam is fl ooded. The fl ooding of valleys behind the dam can destroy natural habitats and human features, such as houses, fences and roads.
Case study: Three Gorges Dam,
China
China’s Three Gorges Dam is not only the world’s largest dam, it is also the largest power station ever built. More than 2 kilometres long and 180 metres high, the dam has turned the Yangtze River into a lake 660 kilometre long. As well as producing electricity, the dam has increased the Yangtze River’s shipping capacity, and has reduced the fl ooding hazard downstream. The building of the Three Gorges Dam stirred protests around the world, as it involved displacing 1.25 million people and fl ooding more than 600 square kilometres of land; that is about 30 000 times the size of the Melbourne Cricket Ground.
Source 1.26 An oblique aerial view of the Three Gorges Dam on the
Yangtze River in China. Water fl ows through the open sluice gates.
The hydroelectric power station is to the left of the sluice gates.
SAMPLE

59chapter 1 water as a resource
Main road
Other road
Track
Dam wall
Watercourse
Village
Buildings
8Contour with value (interval 200 metres)
Spot height (metres)657
800
Mostly forested
Large river/reservoir
Built-up area
Open area Open areauildings
0 1 3 42 5
kilometres
Scale 1:100 000
kilometres
770 L E G E N D
800
600
600
400
400
400
400
400
200
200
200
200
200
412
731
890
438
363
206
563
Three Gorges Dam
Locks
Sandouping
Jin Gang Cheng
Pan Jia Wan
Yang Gui Dian
Bai Shi Xi
Yang Jia Wan
Li Jia Wan
Yan Zhu Yuan
Shuang Shi Ling
Sha Ping
Wu Xiang Miao
Long Tan Ping
Da Yan Tou
Ying Zi Zui
San Duo Ping
Tai Ping Xi Zhen
Bai Miao Zi
YANGTZE
RIVER
00 01 02 03 04 05 069998979606
07
08
09
10
11
12
13
14
15
16
17
18
30° 50’ N
111° E
Source 1.28 Source: Oxford University Press
CHINA: THREE GORGES DAM
hydro
63%
other 1%geothermal 3%
wind 5%
bioenergy
21%
solar 7%
Source 1.27 Energy from renewable and continuous sources. Hydroelectric power
accounts for most of the total energy produced from these sources around the world.
Remember and understand
1 How is water used to create electricity?
2 What is the main source of renewable
energy in the world?
3 What advantages and disadvantages
does the building of dams bring?
4 How can you stop a river fl owing to
enable a dam wall to be built?
Apply and analyse
5 Look carefully at Source 1.26. Oblique
aerial images are taken from an
angle and show a foreground and a
background. Is the dam wall in the
foreground or the background?
6 Draw a sketch of the oblique aerial
image (Source 1.26) and label the
following:
• Three Gorges Dam
• Yangtze River
• hydroelectricity plant
• fl ooded valley.
Mark in where you think the original
course of the river fl owed.
7 What happened to the towns, villages
and farms upstream of the Three
Gorges Dam on the Yangtze River?
Check your learning 1.8
SAMPLE

60 oxford big ideas geography 7: australian curriculum
The Ok Tedi mineThe Ok Tedi copper and gold mine is located at
the headwaters of the Ok Tedi River, a tributary
of the Fly River, in Papua New Guinea. During
mining operations large amounts of chemicals
are used to separate the precious minerals from
other rocks. These chemicals, along with the
residue of rocks and ore (known as tailings),
need to be disposed of. In order to do this, the
mine owners (BHP) built a dam known as the
tailings dam. The tailings dam allowed heavy
metals and solid waste from the mine to settle.
Cleaner water would then be released into the
river system.
Unfortunately, an earthquake in 1984
collapsed the tailings dam. BHP argued it was
too expensive to rebuild it.
1.2 bigideas: broadsheet
Source 1.29 Ok Tedi mine
Source 1.30 Satellite image of Ok Tedi mine, 5 June 1990
Ok Tedi River
Tabubil
Ok Tedi mineFly RiverSince 1984 the mine has discharged 70 million tonnes of
tailings into the river system each year. Chemicals from these
tailings destroyed wildlife, particularly fi sh, in the river, and
the materials dumped into the river changed a deep and
slow river into a shallow river with rapids. Transport up and
down the river became more diffi cult. The change in the
river bed led to frequent fl oods that spread contaminated
mud onto 1300 square kilometres of farms by the Fly River.
The discharge from the Ok Tedi mine caused great harm to
the 50 000 Indigenous people who live in the 120 villages
downstream of the mine. Millions of dollars in compensation
was paid to those affected by the misuse of the river system.
SAMPLE

61chapter 1 water as a resource
skilldrill
Source 1.31 Satellite image of Ok Tedi mine, 26 May 2004
Extend your understanding
Identifying change over time
By carefully examining photographs, satellite images or maps
from different times we can see the changes that occur at a
location. When studying the same area at two different times:
Step 1 Find a key feature, such as a river or main road, as a
reference point on both sources.
Step 2 Note the areas of the image where there has been
little or no change.
Step 3 List the differences in the later image where there has
been change.
Step 4 Look for other information on the image that shows
what might have contributed to the change.
Step 5 Describe the type of change – permanent change
or seasonal change (such as different stages of crop
production or plant growth).
Apply the skill
1 Study Sources 1.30 and 1.31.
a In what two years were the satellite images taken?
b Were the images taken at different times of the year?
c What changes to the rivers occurred between the two
years when these images were taken?
d Why did these changes occur?
e Are these changes permanent or seasonal?
f Draw a sketch map of the area in 2004, using a key
and labels to outline the changes that have occurred
since 1990.
1 What competing uses were there for the Ok Tedi and
Fly Rivers?
2 What problem did BHP have managing the polluted water
in their tailings dam?
3 What environmental impact did the tailings have on the rest
of the river?
4 What social impact did the actions of BHP at the Ok Tedi
mine have on the Indigenous users of the river?
5 Give another example where change in water use in one
part of a river has impacted on water users downstream.
Ok Tedi River
Tabubil
Ok Tedi mineFly River
SAMPLE

62 oxford big ideas geography 7: australian curriculum
Tropic of Capricorn
Brisbane
Sydney
Melbourne
Hobart
Adelaide
Perth
Darwin
Tully
Alice Springs
Canberra
Lake Eyre
Over 2400
Average annual rainfall(millimetres)
1600 to 2400
1200 to 1600
600 to 1200
200 to 600
Under 200
Great ArtesianBasin
L E G E N D
0 400 800 km
New SouthWales
Victoria
Western
Austral ia
Queensland
South
Austral ia
ACT
Tasmania
Northern
Territory
0
RainfallAverage temperature
Month
400
300
200
100
350
250
150
50
Rai
nfal
l (m
m)
Tem
per
atur
e (°
C)
40
45045
35
30
25
15
5
20
10
0J F MAM J J A S O N D
Darwin
0
RainfallAverage temperature
Month
400
300
200
100
350
250
150
50
Rai
nfal
l (m
m)
Tem
per
atur
e (°
C)
40
45045
35
30
25
15
5
20
10
0J F MAM J J A S O N D
Adelaide
0
RainfallAverage temperature
Month
400
300
200
100
350
250
150
50
Rai
nfal
l (m
m)
Tem
per
atur
e (°
C)
40
45045
35
30
25
15
5
20
10
0J F MAM J J A S O N D
Alice Springs
0
RainfallAverage temperature
Month
400
300
200
100
350
250
150
50
Rai
nfal
l (m
m)
Tem
per
atur
e (°
C)
40
45045
35
30
25
15
5
20
10
0J F MAM J J A S O N D
Sydney
1.3 How much water do we have?
Water in Australia
Rainfall distribution in Australia
Much of the Australian continent is dry. It is only the northern, eastern and south-western coastal regions that receive good annual rainfall. The climate of the eastern half of Australia is infl uenced by the Great Dividing Range. It extends 3500 kilometres from the northern tip of Cape York to southern Victoria. Moisture-rich winds from the south-east push warm, moist air over the land. Forced to rise and cool, the water droplets fall onto the east coast as rain, but as the air descends to the west, it becomes warmer and drier.
Australia has the lowest volume of water in rivers and the smallest number of permanent wetlands of any continent except Antarctica. Australia’s water supplies are not evenly distributed. The northern third of the continent lies in the tropics and receives heavy rainfall with monsoons in the summer. It is a water-rich area. By comparison, vast areas of the interior receive very little rain.
Virtually all of Australia’s large cities and towns are positioned on the coast, especially in the east and south-east. While most of these areas receive good, reliable rainfall, pressure from a large number of water users has put great strain on water resources in these areas.
Source 1.32 Source: Oxford University Press
AUSTRALIA: AVERAGE ANNUAL RAINFALL (CLIMATE GRAPHS
FOR SELECTED LOCATIONS)
SAMPLE

63chapter 1 water as a resource
Being such a large country, Australia has a great deal of variation in rainfall. It is common for one part of the country to have fl oods while another has a long drought. The wettest place in Australia is Tully, near Innisfail in north Queensland, which averages 4204 millimetres of rainfall a year. Tully receives so much rain because of its location within the tropics on the north-eastern facing slopes of the Great Dividing Range.
The driest place in Australia is on the shores of Kati Thanda (Lake Eyre) in South Australia, which receives little more than 100 millimetres per year. Kati Thanda receives so little rain because it lies far from any supply of moisture. Air masses reaching the interior of the country have generally dropped their rain on to the south-eastern corner of Western Australia, and so they are dry by the time they arrive at Kati Thanda.
Many communities in the interior of Australia rely on underground water as well as the little rain that falls. Lying beneath much of eastern Australia is the world’s largest underground water supply, the Great Artesian Basin (see Source 1.32). It is over 1.7 million square kilometres in size and covers approximately 22 per cent of Australia. The water is trapped underground in a sandstone layer covered by sedimentary rock, creating a aquifer. Farmers and communities access this water by drilling a well and pumping water to the surface with a windmill.
Australia’s river resources
Rivers are a vital source of fresh water for many people. Australia, though, has the lowest volume of water in rivers of any inhabited continent on Earth. On average, just 12 per cent of Australia’s rainfall is collected in rivers; this is referred to as the river discharge. The remaining 88 per cent of rainfall is used by plants, held in natural water storages (such as lakes, wetlands and aquifers) or returned to the atmosphere through evaporation. The Darling River, part of Australia’s largest river basin (the Murray–Darling Basin), loses enough water every year through evaporation to fi ll Sydney Harbour four times.
Source 1.33 Australia’s heaviest rainfall makes Tully the white-water
rafting capital of Australia.
Remember and understand
1 Why do many Australians live on the southern and
eastern coast?
2 Where are the wettest regions of Australia? Where are
the driest regions of Australia?
3 How do many farmers and communities in inland
Australia access more water?
4 Use the map in Source 1.32 to estimate how much
rainfall is received every year on average where you live.
Apply and analyse
5 Use the PQE method outlined on page 47 to describe
the distribution of Australia’s rainfall.
6 Four climate graphs are shown in Source 1.32. Each
of these gives us two important pieces of information
about the climate at a particular place. Rainfall
is shown as a series of blue bars while average
temperatures are shown with a red line. The trickiest
part of reading a climate graph is reading the correct
scales. Temperature is shown on the left-hand
side, rainfall is shown on the right-hand side, and
months along the bottom. For more information on
reading a climate graph refer to section GT.2 of ‘The
geographer’s toolkit’.
a Which is the most water poor of the four places
shown? Why is this?
b Which has the most even or reliable rainfall
throughout the year? Why is this?
c Which has the most seasonal rainfall?
Check your learning 1.9
SAMPLE

64 oxford big ideas geography 7: australian curriculum
Cobar
Tilpa
Louth
Bourke
0 25 50 km
Cobar
Tilpa
Louth
Bourke
0 25 50 km
Variations in Australia’s water supplyWater is particularly diffi cult to manage in Australia, the driest inhabited continent on Earth. Australia has the lowest amount of water in rivers and the smallest areas of permanent wetlands in the world. Australia’s water supplies are not evenly distributed. The northern third of the continent is water rich, while vast areas of the interior receive very little rain. Variable rainfall patterns make it quite common for one part of the country to experience major fl ooding while others experience extended periods of drought.
The Darling River
The Darling is Australia’s third-longest river, fl owing 1390 kilometres from Brewarrina until it joins the Murray River at the town of Wentworth. The Murray and Darling are the main rivers in the Murray–Darling River Basin, where 40 per cent of Australia’s food is produced.
The fl ow of water in the Darling River varies greatly
due to drought and water that is taken to supply farms for irrigation. The Darling can be a small trickle or a raging torrent – it can even dry up completely. The Darling River stopped fl owing at the town of Menindee, near Broken Hill in New South Wales, 48 times between 1885 and 1960.
Climate change
Australians have come to see drought as part of the natural cycle of rainfall patterns, but a new threat now faces us – and it is one we do not fully understand. For years scientists have been warning us about the possibility that our climate is changing. While the vast majority of the world’s scientifi c community now accepts that the planet is warming due to the effects of greenhouse gases, these experts are much less sure how this will affect specifi c places and specifi c climates. It appears that climate change will mean less water for many Australians in the future, putting even greater pressure on our current supplies.
Source 1.34 These satellite images of the Darling River show the river affected by drought in 2011 (left), and fl ooded in March 2012 (right).
These images use a photographic technique to help geographers distinguish between water and land. The colours used in the image are
blue for water, bright green for vegetation, and an earth-tone for bare ground.
SAMPLE

65chapter 1 water as a resource
Tropic of Capricorn50.0
40.0
30.0
20.0
15.0
10.0
5.0
0.0
–5.0
–10.0
–15.0
–20.0
–30.0
–40.0
–50.0
L E G E N DTrend in annualrainfall, 1970–2011(millimetres per10 years)
Hobart
Melbourne
AdelaideCanberra
Sydney
Brisbane
Darwin
Perth
0 400 800 km
Source 1.37 Source: Oxford University Press
AUSTRALIA: RAINFALL TRENDS, 1970–2011
Source 1.36 A young girl from Wentworth in New South Wales
jumps over the Darling River in 2006 (top) and swims in it during a
fl ood in 2008 (bottom).
Remember and understand
1 Which part of Australia is the most water poor?
2 Read the poem ‘My Country’ in Source 1.35.
a Decide if you think the poem accurately describes
the part of Australia you live in.
b Which line in the poem best sums up Australia’s
variable water supply?
3 Why might a warmer future lead to less water being
available in Australia?
4 Look at Source 1.34. How and why did the fl ow of
water along the Darling River change between 2011
and March 2012?
Apply and analyse
5 Look carefully at Source 1.37.
a Between 1970 and 2011, which parts of Australia
experienced signifi cant decreases in annual rainfall?
b Which capital cities have been most affected?
c How has the Murray–Darling River Basin been
affected?
Check your learning 1.10
Much of Australia’s fresh water comes from water collected in rivers, lakes and dams. This water will evaporate more quickly in the future, meaning that there will be less available for use in cities and rural areas. Source 1.37 shows the trends in annual rainfall over the last four decades. The green areas have had an increase in rainfall while the yellow and brown areas have had a decrease.
Source 1.35 Part of the poem ‘My Country’
by Dorothea Mackellar (1908)
I love a sunburnt country,A land of sweeping plains,Of ragged mountain ranges,Of droughts and fl ooding rains,I love her far horizons,I love her jewel-sea,Her beauty and her terror –The wide brown land for me! …
Core of my heart, my country!Her pitiless blue sky,When sick at heart, around us,We see the cattle die –But then the grey clouds gather,And we can bless againThe drumming of an army,The steady, soaking rain…
SAMPLE

66 oxford big ideas geography 7: australian curriculum
Water in the world
In an average year, 577 000 km3 of rain falls on Earth. Of this, 458 000 km3 fall, on the oceans and 119 000 km3
on land.
When water falls to earth as rain, most of it evaporates back into the atmosphere. Of the annual rainfall that falls on land 74 000 km3 (or 62 per cent) evaporates. In Australia, around 65 per cent of our total rainfall each year evaporates. The remaining 35 per cent runs off the land, and of this, only about 12 per cent ends up in our rivers. Only Africa has a higher
Australia andOceania
65%
35%
55%
45%
Asia
80%
20%
Africa
65%
35%
Europe
57%
43%
South America
55%
45%
North America
7 080 km3
32 200 km3
22 300 km3
8 290 km3
28 400km3
18 300 km3
LEGEND
Rainfall (km3)
Evaporation (%)
Runoff (%)
evaporation rate than Australia.
The amount of water in Australian rivers is the smallest of all inhabited continents, with South America experiencing the highest volumes of water in its rivers. For example, the Amazon River (the second-longest river in the world) carries more water than any other river on Earth with an average discharge (volume of water fl owing through it) greater than the next seven largest rivers combined. Nearly 20 per cent of all the fresh water entering the oceans comes from the Amazon River.
Source 1.38 Average volume of yearly rainfall (km3), evaporation and runoff by world region Source: FAO Aquastat
Source 1.39 Some of Australia’s driest regions are in the desert.
SAMPLE

67chapter 1 water as a resource
Remember and understand
1 Use Source 1.38 to rank the six
inhabited continents from the
continent with the most runoff to the
continent with the least.
2 Which river carries the most water and
how does it compare to other rivers?
Apply and analyse
3 Look carefully at Source 1.40.
a Which region of the world is the
wettest? Why do you think this is
the case?
b Which part of Africa experiences
the lowest rainfall? What type of
landscape would you expect to fi nd
here?
c Which part of Asia is the wettest?
What are some of the advantages
and disadvantages of high rainfall?
d Does the region north of the Arctic
Circle have low or high rainfall?
How might much of the water in
this region be stored?
Check your learning 1.11
Source 1.40 Source: Oxford Atlas
Source 1.41 South America’s high rainfall has contributed to the creation of the Igazu
Falls, which is 80 metres high and 3 kilometres wide.
WORLD: ANNUAL RAINFALL
SAMPLE

68 oxford big ideas geography 7: australian curriculum
The world’s drinking water
Source 1.43 In Chad, as in many African
countries, each day begins with a walk to the
village well.
United
Kingdom
149 litres
Mozambique
4 litres
China
86 litres
Australia
493 litres
USA
575 litres
Peru
173 litres
Source 1.42 Water use per person per day.
Mozambique has the lowest daily water use per
capita while the United States has the highest.
Source: United Nations 2006
Drinking water, sometimes called potable water, is water that is safe to drink and use for cooking and washing. In Australia, most water undergoes some form of treatment to make it safe to drink. Water treatment removes sediments, pollutants and microorganisms that can make us sick. Australians are among the world’s biggest water users, using almost 500 litres of water per person per day. This fi gure is for all water use, including water used in agriculture and industry. While this amount has declined in recent years, it still ranks among the highest in the world. Experts estimate that each Australian will need to use 12 per cent less water by 2030 in order to stay within the limits imposed by our rainfall. Some households have started to use a number of strategies to save water, while many others continue to waste large amounts.
Access to safe drinking water
In Australia, we take for granted that we have fl ush toilets, running water from taps and clean, safe drinking water. However, millions of people around the world get sick or die each year from drinking contaminated water. The United Nations estimates that half the world’s population has problems caused by lack of access to clean water. More than 1 billion people do not have access to a reliable freshwater supply, and 2.6 billion do not have basic sanitation, such as running water to clean their hands or fl ush their toilets.
It is estimated that, at any one time, almost half the people in poorer countries are suffering from health problems due to a lack of safe water. Each year, millions of people die from diseases carried in their water. Millions of women and children around the world, particularly in Africa, spend several hours a day collecting and carrying enough water to keep their families alive for another day.SAMPLE

69chapter 1 water as a resource
Arctic Circle
Equator
Tropic of Capricorn
Tropic of Cancer
ARCTIC OCEAN
PACIFIC OCEAN
ATLANTIC
OCEAN
INDIAN OCEAN
ATLANTIC
OCEAN
EUROPE ASIA
AFRICA
AUSTRALIA
NORTHAMERICA
SOUTHAMERICA
0 1500 3000 km
Percentage of populationwith access to safedrinking water
L E G E N D
100
90 to 99
70 to 89
50 to 69
Under 50
No data available
Serah’s story
Serah and her six children live in Ethiopia in Africa. The
scarcest resource in her region is water. Before dawn,
she makes her fi rst journey to the village pump. Once
there were three wells, but the 8-metre well has dried up.
The 9-metre well has a little salty water at the bottom.
The fl ow from the pump of the 25-metre well has slowed
to a painful trickle. There is just barely enough for
everyone to drink.
While it takes her 25 minutes to walk down the hill to
the pump, it will take her 40 minutes to make the return
journey with the 10-litre jar balanced on her head. She
makes this trip at least twice a day. She tends not to
drink as much as the others as she believes she should
look after her children before herself. This means that
she cannot produce enough milk for her baby, so he is
often ill. The water contains parasites that make her other
children sick, but Serah has little choice.
For more information on the key concept of
environment, refer to section GT.1 of ‘The geographer’s
toolkit’.
Source 1.44 Source: Oxford Atlas
keyconcept: environment
Remember and understand
1 What is potable water?
2 How many people in the world do not have access to a
reliable supply of fresh water?
3 Describe the differences in the drinking water available
in most Australian homes and in Serah’s village.
Apply and analyse
4 Using Source 1.44 and the world map on the inside
front cover of this book, identify two countries with
excellent access to safe water and two countries with
poor access to safe water. Which continent has the
worst access to safe water?
5 Read Serah’s story.
a How much water will Serah collect in two trips to
the pump?
b How many people depend on her trips to the pump?
c How much will each person receive?
d The average toilet in Australia uses 8 litres per fl ush.
Write a statement about the way water is used in
Australia compared to Ethiopia.
Check your learning 1.12
WORLD: ACCESS TO SAFE DRINKING WATER
SAMPLE

70 oxford big ideas geography 7: australian curriculum
1.1 bigideas: broadsheet
skilldrillsssssssssssssssssssssssssssssssssssssssssssssssssssssssssssssssssssssssssssssssssssssssssssssssssssssssssssssssssssssssssssssssssssssssssssssssssssssssssssssssssssssssssssssssssssssssssssssssssssssssssssssssssssssssssssssssssssssssssssssssssssssssssssssssssssssssssssssssssssssssssssssssssssssssssssssssssssssssssssssssssssssssssssssssssssssssssssskkkkkkkkkkkkkkkkkkkkkkkkkkkkkkkkkkkkkkkkkkkkkkkkkkkkkkkkkkkkkkkkkkkkkkkkkkkkkkkkkkkkkkkkkkkkkkkkkkkkkkkkkkkkkkkkkkkkkkkkkkkkkkkkkkkkkkkkkkkkkkkkkkkkkkkkkkkkkkkkkkkkkkkkkkkkkkkkkkkkkkkkkkkkkkkkkkkkkkkkkkkkkkkkkkkkkkkkkkkkkkkkkkkkkkkkkkkkkkkkkkkkkkkkkkkkkkkkkkkkkkkkkkkkkkkkkkkkkkkkkkkkkkkkkkkkkkkkkkkkkkkkkkkkkkkkkkkkkkkkkkkkkkkkkkkkkkkkkkkkkkkkkkkkkkkkkkkkkkkkkkkkkkkkkkkkkkkkkkkkkkkkkkkkkkkkkkkkkkkkkkkkkkkkkiiiiiiiiiiiiiiiiiiiiiiiiiiiiiiiiiiiiiiiiiiiiiiiiiiiiiiiiiiiiiiiiiiiiiiiiiiiiiiiiiiiiiiiiiiillllllllllllllllllllllllllllllllllllllllllllllllllllllllllllllllllllllllllllllllllllllllllllllllllllllllllllllllllllllllllllllllllllllllllllllllllllllllllllllllllllllllllllllllllllllllllllllllllllllllllllllllldddddddddddddddddddddddddddddddddddddddddddddddddddddddddddddddddddddddddddddddddddddddddddddddddddddddddddddddddddddddddddddddddddddddddddddddddddddddddddddddddddddddddddddddddddddddddddddddddddddddddddddddddddddddddddddddddddddddddddddddddddddddddddddddddddddrrrrrrrrrrrrrrrrrrrrrrrrrrrrrrrrrrrrrrrrrrrrrrrrrrrrrrrrrrrrrrrrrrrrrrrrrrrrrrrrrrrrrrrrrrrrrrrrrrrrrrrrrrrrrrrrrrrrrrrrrrrrrrrrrrrrrrrrriiiiiiiiiiiiiiiiiiiiiiiiiiiiiiiiiiiiiiiiiiiiiiiiiiiiiiiiiiiiiiiiiiiiiiiiiiiiiiiiiiiiiiiiiiiiiiiiiiiiiiiiiiiiiiiiiiiiiiiiiiiiiiiiiiiiiiiiiiiiiiiiiiiiiiiiilllllllllllllllllllllllllllllllllllllllllllllllllllllllllllllllllllllllllllllllllllllllllllllllllllllllllllllllllllllllllllllllllllllllllllllllllllllllllllllllllllllllllllllllllllllllllllllllllllll
Windhoek, NamibiaNamibia is the driest country in Africa south of the
Sahara Desert. Its capital, Windhoek, receives about
360 millimetres of rainfall a year and its 250 000 people
rely on three dams for most of their water. These dams,
however, are built on rivers that do not always fl ow and are
therefore unreliable for city water use.
skilldrill1.3 bigideas: broadsheet
Source 1.45 Water is a scarce and precious resource in Namibia.
Drawing climate graphs
Climate graphs combine bar graphs and line
graphs to help us interpret the climate in a
specifi c location. In order to draw a climate graph,
geographers gather climate data – the monthly
average rainfall and temperature – for the location
they are investigating.
Step 1 Look carefully at the climate data to fi nd
the lowest and highest temperature fi gures
that you will need to show on your graph. In
this example, Windhoek’s temperature varies
from 20 to 30 degrees Celsius. Decide on a
scale that shows this range of data, then place
it on the left-hand axis of your climate graph.
Step 2 Using graph paper, plot the temperature
data on your graph by placing a small, neat
dot in the centre of each month at the correct
height. Join the dots with a smooth red line
and continue the line to the edges of the
graph.
Step 3 Look carefully at the climate data to fi nd
the lowest and highest rainfall fi gures that
you will need to show on your graph. In this
example, Windhoek’s rainfall varies from 0 to
79 millimetres a month. Decide on a scale that
shows this range of data, then place it on the
right-hand axis of your climate graph.
Step 4 Plot the rainfall on your graph by drawing
a blue bar to the correct height for each
month. You may like to very lightly shade the
bars with a blue pencil.
Step 5 Complete your graph with a suitable title
and a label for each of the three axes.
Apply the skill
1 Using the steps shown above and the data in
Source 1.46 and referring to the Alice Springs
climate graph (Source 1.32), construct a
climate graph for Windhoek.Source 1.46 Climate data: Windhoek, monthly averages
Months Jan. Feb. Mar. Apr. May Jun. Jul. Aug. Sep. Oct. Nov. Dec.
Rainfall (mm) 76 74 79 41 8 0 0 0 3 10 23 48
Temperature (°C) 29 28 27 25 22 20 20 23 25 29 29 30
In 1969 the government decided to mix water from traditional sources, such
as dams and wells, with recycled water from the city’s sewage-treatment
plant in order to supplement Windhoek’s fresh water. As the city’s
population continued to grow rapidly, in the 1990s it was decided to build
another treatment plant to convert sewage into drinking water. This was
completed in 2002. Now more than one-third of Windhoek’s drinking water
comes from this unlikely source, making the city the world leader in turning
waste-water into drinking water.
SAMPLE

71chapter 1 water as a resource
Cu
bango
River
OkavangoDelta
MakgadikgadiPan
EtoshaPan
Cunene River
Cuito R
iver
Cuando R
iver
Zam
bezi R
iver
Orange Riv
er
Fis
h R
i ver
Windhoek
Rundu
Grootfontein
BOTSWANA
ZAMBIA
SOUTHAFRICA
NAMIBIA
ANGOLA
Under 100
100 to 200
200 to 300
300 to 400
400 to 500
Over 500
L E G E N DAverage annual rainfall(millimetres)
Proposed pipeline
Temporary river
Permanent river
Country border
Existing canal
0 150 300 km
Namibia
1 Describe the annual pattern of rainfall in
Windhoek.
2 Explain how this annual pattern makes
dams and reservoirs an unreliable water
resource.
3 Describe the annual pattern of temperature
and explain the impact of these
temperatures on the evaporation of water
held in dams.
4 Compare the climates of Windhoek and
Alice Springs (Source 1.32).
5 Examine the map of Namibia. Identify three
water resources on this map.
6 a What have the people of Windhoek
done to make their water supply more
sustainable and safe?
b What problems does lack of access to
safe water cause?
7 Use the information on the map (Source
1.47) to explain why a pipeline is proposed
to be built from the Cubango River to
Grootfontein.
8 Why would the people of Botswana be
concerned about this proposed pipeline?
Source 1.47 Source: Oxford University Press
Extend your understandingNAMIBIA: AVERAGE ANNUAL RAINFALL
Source 1.48 Many Namibian rivers are only temporary, meaning they are dry for most
of the year.
SAMPLE