Embed Size (px)
Citation preview

3Water Futures
3

Whether the water crisis will deepen and intensify—
or whether key trends can be bent or turned towards sustainable
use and development of water resources—depends on
many interacting trends in a complex system
Our Vision for water in the 21st century is an expression of a desirable future, based on an
exploration of alternative water futures. The alternative possible futures in this chapter form
a basis for the Vision expressed in the next chapter. Following a brief explanation of the
approach in the Vision exercise (scenarios and models), projected water use and stress in 2025
are explored.1 Given the wide range of uncertainties affecting the water futures, there is also
a wide range in possible uses and stress. This range presents the potential for influencing the
outcome through actions focused on key issues that may prove to be turning points.
Turning points in water futures
Whether the water crisis will deepen and intensify—or whether key trends can be bent or turned
towards sustainable use and development of water resources—depends on many interacting
trends in a complex system. Real solutions require an integrated approach to water resource
management. Crucial issues that may provide levers for very different futures include:2
Expanding irrigated agriculture
● Will the rate of expansion of irrigated agriculture continue as in recent decades, or will it
slow down, as appears to be indicated by reduced investments in the sector?
Increasing water productivity
● Can improvement rates in water use efficiency—or preferably, water productivity3—be
increased drastically on short notice to ease the water crisis? How can technological and insti-
tutional innovation be stimulated to improve these rates?
● Can water productivity for rainfed agriculture be accelerated?
● Will policies emphasise national food self-sufficiency or global food security (involving
governance and trade issues)?
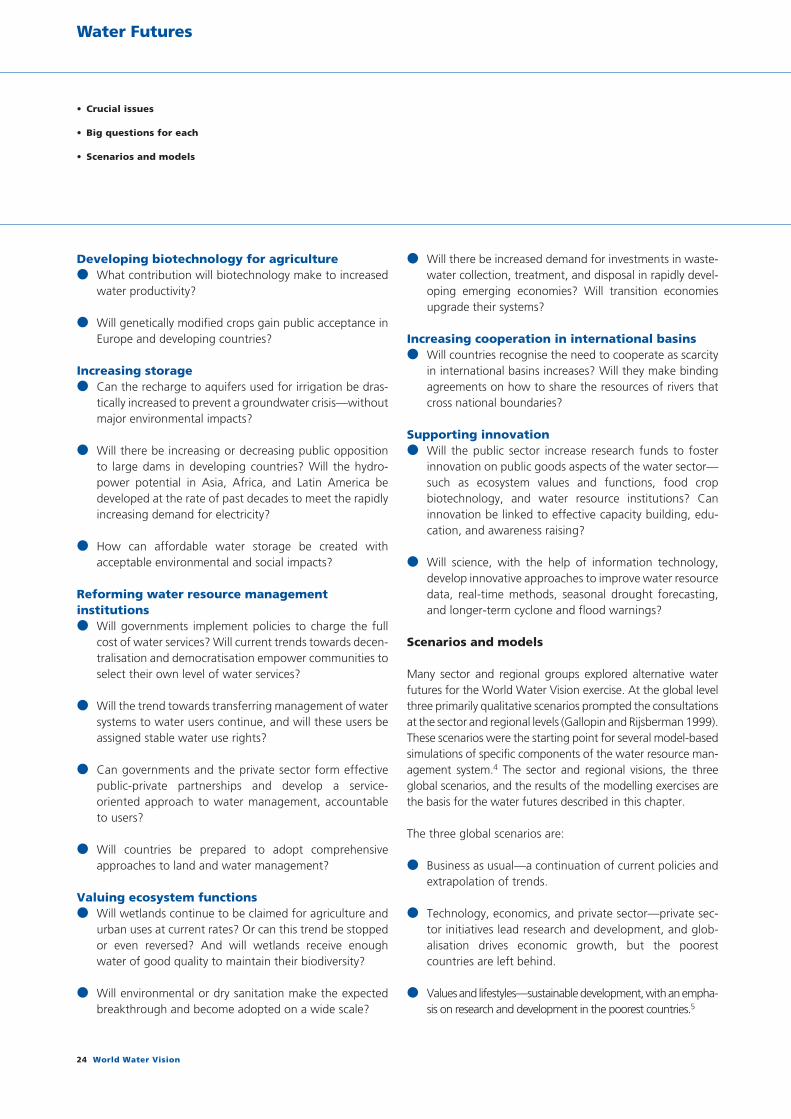
Water Futures
• Crucial issues
• Big questions for each
• Scenarios and models
Developing biotechnology for agriculture● What contribution will biotechnology make to increased
water productivity?
● Will genetically modified crops gain public acceptance inEurope and developing countries?
Increasing storage● Can the recharge to aquifers used for irrigation be dras-
tically increased to prevent a groundwater crisis—withoutmajor environmental impacts?
● Will there be increasing or decreasing public oppositionto large dams in developing countries? Will the hydro-power potential in Asia, Africa, and Latin America bedeveloped at the rate of past decades to meet the rapidlyincreasing demand for electricity?
● How can affordable water storage be created withacceptable environmental and social impacts?
Reforming water resource management institutions● Will governments implement policies to charge the full
cost of water services? Will current trends towards decen-tralisation and democratisation empower communities toselect their own level of water services?
● Will the trend towards transferring management of watersystems to water users continue, and will these users beassigned stable water use rights?
● Can governments and the private sector form effectivepublic-private partnerships and develop a service-oriented approach to water management, accountableto users?
● Will countries be prepared to adopt comprehensiveapproaches to land and water management?
Valuing ecosystem functions● Will wetlands continue to be claimed for agriculture and
urban uses at current rates? Or can this trend be stoppedor even reversed? And will wetlands receive enoughwater of good quality to maintain their biodiversity?
● Will environmental or dry sanitation make the expectedbreakthrough and become adopted on a wide scale?
● Will there be increased demand for investments in waste-water collection, treatment, and disposal in rapidly devel-oping emerging economies? Will transition economiesupgrade their systems?
Increasing cooperation in international basins● Will countries recognise the need to cooperate as scarcity
in international basins increases? Will they make bindingagreements on how to share the resources of rivers thatcross national boundaries?
Supporting innovation● Will the public sector increase research funds to foster
innovation on public goods aspects of the water sector—such as ecosystem values and functions, food cropbiotechnology, and water resource institutions? Caninnovation be linked to effective capacity building, edu-cation, and awareness raising?
● Will science, with the help of information technology,develop innovative approaches to improve water resourcedata, real-time methods, seasonal drought forecasting,and longer-term cyclone and flood warnings?
Scenarios and models
Many sector and regional groups explored alternative waterfutures for the World Water Vision exercise. At the global levelthree primarily qualitative scenarios prompted the consultationsat the sector and regional levels (Gallopin and Rijsberman 1999).These scenarios were the starting point for several model-basedsimulations of specific components of the water resource man-agement system.4 The sector and regional visions, the threeglobal scenarios, and the results of the modelling exercises arethe basis for the water futures described in this chapter.
The three global scenarios are:
● Business as usual—a continuation of current policies andextrapolation of trends.
● Technology, economics, and private sector—private sec-tor initiatives lead research and development, and glob-alisation drives economic growth, but the poorestcountries are left behind.
● Values and lifestyles—sustainable development, with an empha-sis on research and development in the poorest countries.5
24 World Water Vision

Between 2000 and 2025 the global average annual
per capita availability of renewable water resources is
projected to fall from 6,600 cubic metres to
4,800 cubic metres
These three scenarios are not the only possible water futures,and regional and sectoral Vision groups developed scenariosthat are equally valid. Many groups and organisations outsidethe Vision exercise have also developed scenarios of possibleor desirable water futures. We are not advocating any of thethree global scenarios as the most desirable future. Instead,we explore dimensions of alternative futures. Chapter 4espouses a Vision.
The approach focused on developing qualitative scenarios toallow incorporation of the many social, economic, environ-mental, and cultural factors that shape the water future butthat cannot be modelled quantitatively. The development anddiscussion of qualitative scenarios provided a platform for con-sultation among many stakeholders with different back-grounds and perspectives. Models were then used to analysethe consistency and coherence of the qualitative scenarios,explore some of the consequences, and fill in some of the gaps.The scenarios evolved in four rounds of development, discus-sion, feedback, and subsequent improvement—with interac-tions among the scenario developers, modellers, reviewers, andgroups working on visions for sectors and regions.
The main forces affecting the global water scenarios are pop-ulation growth, economic growth, demographic change,technological change, social trends, and environmental qual-ity (Gallopin and Rijsberman 1999). Environmental quality isnot a driver in the same sense as the others, because it is alsoa direct response to them. But it is included here as an impor-tant trend to be closely monitored.
Water use is influenced by trends in the drivers, but water useand development is—or can be, when well managed—a driverin its own right, with an important impact on economicgrowth, social trends, and environmental quality. Recognitionof this broad integrated framework is crucial to achieving opti-mum economic, social, and environmental security throughintegrated water resource management (annex table 3.1).
The scenarios describe the unfolding of a logical, coherent,and consistent storyline of related trends—but such trendscannot simply be extrapolated. The scenarios show how sometrends, following the internal logic of the scenario, wouldbend or break and how certain actions or policies, if imple-mented, could influence these and other trends. The scenar-ios and simulations are not described in detail in this reportbut in the companion volume (Rijsberman 2000); some of thekey results are discussed below.
Projected water use and water stress in 2025
Because of population growth, between 2000 and 2025 theglobal average annual per capita availability of renewablewater resources is projected to fall from 6,600 cubic metresto 4,800 cubic metres.6 Given the uneven distribution of theseresources, however, it is much more informative that some 3billion women and men will live in countries—wholly or partlyarid or semiarid—that have less than 1,700 cubic metres percapita, the quantity below which one suffers from waterstress (box 3.1).
WaterGAP model simulations based on the business as usualscenario indicate that by 2025 about 4 billion people—halfthe world population—will live in countries where morethan 40% of renewable resources are withdrawn for humanuses. This is another indicator of high water stress undermost conditions.
Table 3.1 shows two diverging water use projections for2025. The projections by Shiklomanov (1999) are based onthe assumption that current trends can be extrapolated—thatreservoirs will be constructed as in the past and that theworld’s irrigated area will expand by 30% from 1995 to 2025.The projections by Alcamo and others (1999), with analysisusing WaterGAP 2.0 of the World Water Vision’s business asusual scenario, assumes limited expansion of irrigated area,which, combined with rapidly increasing water use efficiency,leads to reduced agricultural use but a rapid increase inmunicipal and industrial use linked to rising income and pop-ulation (annex table 3.2). The key difference between thesetwo projections—the amount of increase in irrigated land—is the first turning point discussed in more detail later in thischapter.
Even though water use goes up significantly in both projec-tions, neither scenario is based on satisfying the world’s waterand water-related basic needs, particularly for food produc-tion and household use. Alternative futures that satisfy theseneeds are discussed later in this chapter.
In more developed parts of the world—that is, upper-middle-income and high-income countries—economic growth to2025 tends to increase water use. But this increase is offsetby more efficient water use and the saturation of waterdemands in industry and households. In addition, the amountof irrigated land stabilises, and water for irrigation is usedmore efficiently. As a result total water withdrawals decrease.
Water Futures 25
3

Water Futures
• Expanding irrigation?
• Or stable irrigation?
By contrast, higher incomes in developing countries lead togreater household water use per capita, multiplied by thegreater number of people. Meanwhile, economic growthexpands electricity demand and industrial output, leading toa large increase in water withdrawals for industry. Eventhough water is used more efficiently in households andindustry, pressures to increase water use overwhelm theseefficiency improvements.
The result is a large increase in water withdrawals in thedomestic and industrial sectors of the developing world, inresponse to rising population and industrialisation, and higherconsumption from higher incomes. In the World Water Visionbusiness as usual scenario analysed by Alcamo and others(1999), the increase in irrigated land does not keep pace withgrowing food demand. This means that the amount of water
26 World Water Vision
Box 3.1 Assessing the stress on water
Unlike the more traditional concept of water scarcity, which focuses on quan-tity alone, water stress denotes reaching the limits of water quantity as well asquality. There is no universally adopted measure of water stress, but perhapsthe most widely used is the Falkenmark indicator—renewable water resourcesper capita a year, often on a national scale. Water stress begins when there isless than 1,700 cubic metres per person a year for all major functions (domes-tic, industrial, agricultural, and natural ecosystems) and becomes severe whenthere is less than 1,000 cubic metres per capita. But the Falkenmark indicatordoes not account for the temporal variability in water availability or for actualuse. Its advantage is that the data are widely available.
An indicator that does account for (estimated) use is the criticality ratio ofwithdrawals for human use to renewable resources. This ratio is used forthe United Nations Comprehensive Freshwater Assessment and in theWaterGAP model in this Report. The value of the criticality ratio that indi-cates high water stress is based on expert judgment and experience. Itranges between 20% for basins with highly variable runoff and 60% fortemperature zone basins. This report uses a threshold of 40% to indicate“high water stress.” The advantage of the indicator is that it is easy tounderstand and based on water resources as well as use.
The criticality ratio’s disadvantage is that withdrawals are not the best esti-mate of use. Some uses are nonconsumptive and allow reuse, while oth-ers consume a smaller or larger part of the water withdrawn. Nor does theratio take into account available water infrastructure and water manage-ment capacity. For example, the ratio shows Belgium and the Netherlandsas having very high water stress. This does not mean that these countriesface severe water shortages for their projected human uses. Instead, itmeans that a very large share of their water resources are used—that is,have been developed. In such cases natural ecosystems suffer high waterstress because such a large share of the resource is diverted for human use.
A more precise (but much harder to estimate) indicator is the current basinuse factor. It relates total consumptive use to the primary water supply.When this factor is low—say, 30%—water could be saved and put to moreconsumptive use. When this factor is around 70% it is difficult and oftenundesirable to consume more water. Saving water and increasing the con-sumptive use factor require investment and management.
The potential basin use factor relates total consumptive use to the usablewater supply. The distinction between the renewable resources in a basinand the primary water supply allows distinctions between physical and eco-nomic water scarcity.
● Physical water scarcity means that even with the highest feasible effi-ciency and productivity of water use, countries will not have sufficientwater resources to meet their agricultural, domestic, industrial, andenvironmental needs in 2025. Indeed, many of these countries cannotmeet even their present needs. The only options for them are to investin expensive desalination plants—or to reduce the water used in agri-culture, transfer it to other sectors, and import more food.
● Economic water scarcity means that countries have sufficient waterresources to meet their needs but will have to increase water suppliesthrough additional storage, conveyance, and regulation systems by25% or more to meet their needs in 2025. These countries face severefinancial and capacity problems in meeting their water needs.
Source: Alcamo and others 1999; IWMI 2000.
Table 3.1 Two diverging projections for use of renewable water resources for business as usual
Projections under the business as usual scenario show diverg-ing increases in water use—even without making sure alldemands get satisfied—with the largest uncertainty beingwhether we keep expanding irrigation.
Cubic kilometresExpanding Stableirrigation irrigation
Use 1950 1995 2025a 2025b
AgricultureWithdrawal 1,100 2,500 3,200 2,300Consumption 700 1,750 2,250 1,700
IndustryWithdrawal 200 750 1,200 900Consumption 20 80 170 120
MunicipalitiesWithdrawal 90 350 600 900Consumption 15 50 75 100
Reservoirs (evaporation) 10 200 270 200c
TotalWithdrawal 1,400 3,800 5,200 4,300Consumption 750 2,100 2,800 2,100
Note: All numbers are rounded.
a. Shiklomanov projection.
b. World Water Vision business as usual scenario, Alcamo projections.
c. Alcamo and others do not calculate reservoir evaporation, but since the business as
usual scenario developed by the World Water Vision assumes that relatively few addi-
tional reservoirs will be built, Shiklomanov’s 1995 estimate is used to obtain compara-
ble total use figures.
Source: Shiklomanov 1999; Alcamo and others 1999.

The rate of expansion of irrigated land
is the most important determinant of water stress,
at least the stress related to quantity
withdrawn for irrigation decreases slightly (because of effi-ciency improvements). Even so, agriculture remains theworld’s main user of freshwater, making more than half thetotal withdrawals. Shiklomanov’s projections, assumingstrong increases in irrigation, show a large increase in waterfor agriculture. For Shiklomanov’s projections to be realised,dam construction and groundwater extraction will have tocontinue apace.
The sum of trends in all sectors: significant net growth inwater withdrawals in developing countries between 1995and 2025. Adding together the trends in developed anddeveloping countries under the business as usual scenarioresults in an increase in global water withdrawals from 3,800cubic kilometres in 1995 to 4,300–5,200 cubic kilometres in2025 (see table 3.1). The difference largely depends on howmuch irrigated agriculture does or does not expand.
Because of the increase in water withdrawals, the pressure onwater resources will grow significantly in more than 60% ofthe world (Alcamo and others 1999), including large areas ofAfrica, Asia, and Latin America. Will this lead to more fre-quent water crises? That depends on how much water is avail-able relative to withdrawals—and on countries’ ability to copewith increasing pressure on water resources. That is, itdepends on whether countries face physical or economicwater scarcity—and whether they have the resources to over-come economic water scarcity (see box 3.1).
The effect of high water stress will differ in different coun-tries. In developed countries water is often treated before itis sent to downstream users, and industry recycles its watersupply fairly intensively. For these and other reasons devel-oped countries can intensively use their water resources (asindicated by a criticality ratio greater than 40%) withoutmajor negative consequences.
Most developing countries, by contrast, do not treat waste-water, and their industries do not intensively recycle theirwater supplies. So, the projected intensive use of water herewill lead to the rapid degradation of water quality for down-stream users—and to frequent and persistent wateremergencies.
Expanding irrigated agriculture
The rate of expansion of irrigated land is the most importantdeterminant of water stress, at least the stress related to
quantity. There are two contrasting views on how the trendin irrigated agriculture expansion will continue or bend, withimportant groups of stakeholders weighing in on both sides.
The conventional wisdom in agriculture is that, based on theneed to produce food for the growing world, irrigated agri-culture will have to keep pace—and therefore expand bysome 30% in harvested area by 2025. This position, sup-ported by the Food and Agriculture Organization (FAO) andthe International Commission on Irrigation and Drainage(ICID), is also reflected in Shiklomanov’s (1999) projectionsand the International Water Management Institute’s (IWMI)first projection (Seckler and others 1998). The conclusion ofthese analyses, under optimistic assumptions on yield andefficiency improvements, is that water use for agriculture willhave to increase at least 17% from 1995.
The other perspective—supported by environmentalists andby a number of stakeholders in agriculture—holds that aslowdown in dam building and irrigation investments, com-bined with the consequences of falling groundwater tables,will limit the expansion in irrigated area to 5–10%. The con-sequences of such a scenario were analysed in the Vision’sbusiness as usual scenario (Rosegrant and Ringler 1999;Alcamo and others 1999; IWMI 2000).
Both scenarios are persuasive. The FAO’s longer-term data onthe increase in irrigated area do not show a clear decline otherthan in OECD countries. But a slowdown in agricultural invest-ment is a clear indication that the expansion in area is likelyto slow as well. According to Rosegrant and Ringler (1999),the growth in global irrigated area declined from 2.2% a yearin 1967–82 to 1.5% in 1982–93.
Analysis of the two alternatives shows that neither isattractive:
● Unattractive alternative 1. The 30% increase in irrigatedarea requires major investments in water infrastructure, aconsiderable part of which would have to be throughlarge dams. There would also be severe water scarcitiesand serious risks of major damage to ecosystems(Shiklomanov 1999; Seckler and others 1998).
● Unattractive alternative 2. A strong reduction in irrigationexpansion—under otherwise unchanged policies, or busi-ness as usual as elaborated by the Scenario DevelopmentPanel (Alcamo and others 1999; Rosegrant and Ringler
Water Futures 27
3
Water worldsWater stress
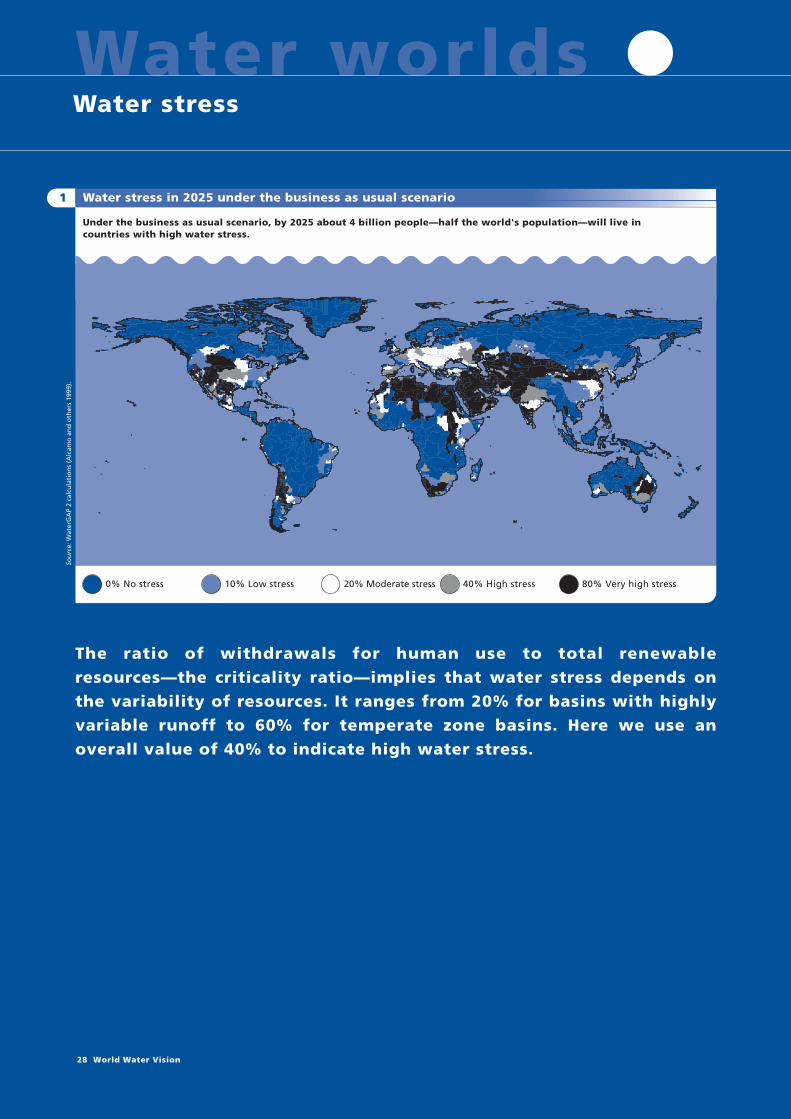
Water stress in 2025 under the business as usual scenario
Under the business as usual scenario, by 2025 about 4 billion people—half the world's population—will live in countries with high water stress.
1
0% No stress 10% Low stress 20% Moderate stress 40% High stress 80% Very high stress
The ratio of withdrawals for human use to total renewable resources—the criticality ratio—implies that water stress depends on the variability of resources. It ranges from 20% for basins with highly variable runoff to 60% for temperate zone basins. Here we use an overall value of 40% to indicate high water stress.
Sou
rce:
Wat
erG
AP
2 ca
lcu
lati
on
s (A
lcam
o a
nd
oth
ers
1999
).
28 World Water Vision

3
Large decrease Moderate decrease Small change Moderate increase Large increase
Change in water stress from 1995 to 2025 under the business as usual scenario
Many of today's developing countries will experience increasing pressure on water resources.
2
Because of the increase in water withdrawals, the pressure on water
resources will grow significantly in large areas of
Africa, Asia, and Latin America
Withdrawals are not the best estimate of use, however. A more precise (but much harder to estimate) indicator is the ratio of consumption to the total actually available. When it is low—say, 30%—more water would be consumed. When it is high—say, 70%—it is difficult and undesirable to consume more.
Sou
rce:
Wat
erG
AP
2 ca
lcu
lati
on
s (A
lcam
o a
nd
oth
ers
1999
).
Water Futures 29

Water worldsWater trends
1
3
2
Under the business as usual scenario, domestic water withdrawals in Sub-Saharan Africa increase from about 10 cubic kilometres in 1995 to 42 cubic kilometres in 2025. Why? Because higher incomes lead to higher per capita water use, even though technology tends to make water use more efficient. In West Africa in 2025 domestic water use is 34 cubic metres a person—2.1 times its 1995 value but still far below Western Europe’s 105 cubic metres a person per year. Industrial water use also increases—from about 3 to 16 cubic kilometres a year between 1995 and 2025. Because of abundant rainfall, there will likely be enough water to cover the increase in domestic and industrial water use. So, the question is whether water distribution systems can expand fast enough to fulfill the needs of growing population and industry. To cover the growth in water withdrawals, municipal water capacity must expand by 5.5% a year and industrial capacity by 7.1% a year.
In South and East Asia irrigated area under the business as usual scenario grows only slightly between 1995 and 2025, while irrigation efficiency improves. The effect is a decrease in water used for irrigation from 1,359 to 1,266 cubic kilometres a year. At the same time, strong economic growth leads to more material possessions and greater water use by households, increasing water withdrawals for domestic use from 114 to 471 cubic kilometres a year. This economic growth also requires larger quantities of water for Asian industry, increasing from 153 to 263 cubic kilometres a year. The sum of these trends is an overall increase in water withdrawals between 1995 and 2025. Thus the pressure on water resources will become even greater than was experienced in 1995, when about 6.5 million square kilometres of river basin area were under high water stress. That area increases to 7.9 million square kilometres in 2025. The number of people living in these areas also grows tremendously—from 1.1 billion to 2.4 billion.
Water withdrawals in Western Europe are growing slowly or not at all as households, industry, and agriculture become more water efficient. The per capita use of water in households goes up slightly with the economic growth of the business as usual scenario between 1995 and 2025, but the amount of water used by industry per megawatt-hour goes down because of greater recycling and other efficiency improvements. The amount of irrigated area stabilises, and new technology increases the efficiency of irrigation systems so that there is also a decline in the amount of water used per hectare. Although water withdrawals go down, the pressure on water resources continues to be high in some areas because of the density of population and industrial activity. So, some river basins remain in the high stress category with sharp competition among industrial, domestic, and some agricultural users.
Sub-Saharan Africa: Another 175 million people in areas with high water stress
Western Europe: Lower withdrawals and higher efficiency, but not much change in water stress
Southeast and East Asia: Another 1.3 billion people in areas with high water stress
Sou
rce:
Wat
erG
AP
2 ca
lcu
lati
on
s (A
lcam
o a
nd
oth
ers
1999
).So
urc
e: W
ater
GA
P 2
calc
ula
tio
ns
(Alc
amo
an
d o
ther
s 19
99).
Sou
rce:
Wat
erG
AP
2 ca
lcu
lati
on
s (A
lcam
o a
nd
oth
ers
1999
).
30 World Water Vision

3
1995
2025
1Million km2 0 3 42
1995
2025
100Million people 0 200 300
1995
2025
2Million km2 0 6 84
1995
2025
1,000Million people 0 2,000 3,000
1995
2025
0.5Million km2 0 1.5 21
1995
2025
50Million people 0 100 200150
Use
By 2025 half the world’s people will live in countries with
high water stress
1995 2025km3
120
100
80
60
40
20
0
Water withdrawals, business as usual scenario Areas with high stress on water resources
Population living in high water stress areas
1995 2025km3
2,500
2,000
1,500
1,000
500
0
Water withdrawals, business as usual scenario Areas with high stress on water resources
Population living in high water stress areas
1995 2025km3
400
350
300
250
200
200
150
100
50
250
0
Water withdrawals, business as usual scenario Areas with high stress on water resources
Agriculture Industry Domestic
Population living in high water stress areas
Water Futures 31

Water Futures
• More crop per drop
• More storage
1999; IWMI 2000)—will cause considerable food short-ages and rising food prices.
Both alternatives—unattractive and unsustainable—wouldconsiderably deepen today’s water crisis. Thus there is everymotivation to implement policies that make food productionand water resource management more sustainable.
Increasing water productivity
At the heart of the question of whether a water crisis can beaverted is whether water can be made more productive. Themore we produce with the same amount of water, the lessthe need for infrastructure development, the less the compe-tition for water, the greater the local food security, and themore water for agricultural, household, and industrial uses.And the more that remains in nature.
IWMI (2000) concludes that sustainable water managementand food production is possible but requires two majorimprovements in water resource and irrigation technologyand management:
● Greater water productivity: more crop per drop. The pro-ductivity of water use must be dramatically improved. TheIWMI base scenario relies on meeting about half theincreased demand for water in 2025 by increasing waterproductivity, taking many opportunities for improving themanagement of water. The first task is to understandwhere these opportunities exist. Recycling, althoughwidely prevalent, still holds potential for saving water.Gains are also possible by providing more reliable sup-plies—through precision technology and through feed-back systems.7 Supplemental irrigation with low-costprecision technology offers a means for poor farmers toproduce more. With competition for water on the rise,these solutions will require major changes in the institu-tions responsible for managing water.
● More storage: developing additional resources. The otherhalf of increased demand must be met by developing addi-tional water supplies, but at much lower economic, social,and environmental costs (IWMI 2000). The additionalwater storage and conveyance required by 2025 is esti-mated by the IWMI at some 400 cubic kilometres a year forexpansion of irrigated agriculture alone. Such an expansionmay be viewed as moderate by the irrigation community,but it is unlikely to be well-received by other users. Feeding
the world without this expansion, however, requires astrategy that puts more emphasis on other ways to increasefood production—such as intensifying rainfed productionand improving management of water in existing agricul-tural areas. An additional 200 cubic kilometres might berequired to replace the current unsustainable overcon-sumption of groundwater (Postel 1999). For financial, envi-ronmental, and other reasons a large part of the additionalstorage requirement should be met using a mix of ground-water recharging and aquifer drawdowns, developingalternative methods for storing water in wetlands, har-vesting rainwater, and relying on traditional technologiessuch as tanks and other small-scale alternatives, rather thanby building large-scale surface storage facilities alone.
Increasing the productivity of water is central to producingfood, to fighting poverty, to reducing competition for water,and to ensuring that there is enough water for nature.Achieving the greater productivity needed to resolve thewater crisis will not happen automatically—it will requiregreat effort. But it is possible, especially in developing coun-tries, where water productivity is far below potential. Forcereal grains, for example, the range in water productivity—in biomass produced per cubic metre of evapotranspiration—is between 0.2 and 1.5 kilograms per cubic metre. As a ruleof thumb, that value should be about 1 kilogram per cubicmetre (IWMI 2000). If a country’s demand for grains growsby 50% by 2025, one way to match the increase is to increasewater productivity by 50%.
Meeting this challenge will require a far greater effort and sig-nificant changes in how water is managed. What needs tochange? Where are improvements required? The biggestboosts to water productivity have come from better plant vari-eties and agronomic practices. Getting more crop per dropcame from introducing shorter-duration and higher-yieldingcrop varieties. Adding fertilisers also pushes up yields andwater productivity. This was the heart of the green revolution.
With a stable water supply through irrigation, agriculturalproductivity has risen dramatically in the past 50 years. Butscope for improvement remains. In many areas potential pro-ductivity is not realised—largely because of poor irrigationwater management. Without a stable supply of irrigationwater, farmers cannot achieve their production potential.
For example, wheat yields and water productivity vary greatlyin three locations with somewhat similar environments (fig-
32 World Water Vision

Increasing the productivity of water is central to producing food,
to fighting poverty, to reducing competition for water, and to ensuring
that there is enough water for nature
ure 3.1). In a desert environment India’s Bhakra irrigation sys-tem—across the border from the Pakistani Punjab—suppliesa major part of India’s breadbasket. The Imperial Valley inCalifornia is also in a desert environment. Within the PakistaniPunjab, yields vary greatly—with some farmers as productiveas those in California, and some way below the average. Eventhough production depends on environmental, market, soil,and other conditions not equal across sites, there appears tobe scope to manage resources for higher productivity.
In OECD countries industrial water productivity has increasedrapidly in the past 20 years, in response to rising prices andstricter environmental standards for industrial wastewater.With the expected increase in the cost of providing water toindustry—if users are charged the full-cost price—this trendcould accelerate.
How can productivity be improved in agriculture—the largestwater user? A precondition is that the same conditions areintroduced as elsewhere: payment for water services,accountability of managers to users, and competition amongpublic and private suppliers. Then there are a range of tech-nical and management options to improve productivity. First,through better agronomic practices (IWMI 2000):
● Crop varietal improvement. Plant breeding plays animportant role in developing varieties that yield moremass per unit of water consumed by transpiration. Forexample, by shortening the growth period while keepingthe same yield, production per unit of evapotranspirationincreases. This includes contributions from biotechnol-ogy.
● Crop substitution. Switching from a more to a less water-consuming crop or switching to a crop with higher eco-nomic or physical productivity per unit of transpiration.
● Improved cultural practices. Better soil management, fer-tilisation, and pest and weed control increase the pro-ductivity of land and often of water consumed.
And second, through better water management practices:
● Better water management. Better timing of water sup-plies can reduce stress at critical crop growth periods,increasing yields. When the water supply is more reliable,farmers tend to invest more in other agricultural inputs,leading to higher output per unit of water. Controlling
salinity through water management at the project or fieldlevel can prevent reductions in water productivity.
● Deficit, supplemental, and precision irrigation. With suf-ficient water control, it is possible to use more productiveon-farm practices. Deficit irrigation is aimed at increasingproductivity per unit of water with irrigation strategiesthat do not meet full evaporative requirements. Irrigationsupplementing rainfall can increase the productivity ofwater when a limited supply is made available to crops atcritical periods. Precision irrigation, including drip, sprin-kler, and level basins, reduces nonbeneficial evaporation,applies water uniformly to crops, and reduces stress, andso can increase water productivity (IWMI 2000).
● Reallocating water from lower- to higher-value uses.Shifting from agriculture to municipal and industrialuses—or from low-value to high-value crops—canincrease the economic productivity or value of water. As
Water Futures 33
3
Figure 3.1 Wheat yields and water productivity
Productivity is much higher in California than in India and Pakistan. In Pakistan the conditions are similar to those in India, but yields are still lower.
Tons per hectare Kilograms per cubic metreof transpiration
Source: IMWI 2000.
0
1
2
3
4
5
6
7
8
Punjab,Pakistan
Bhakra,India
Imperial Valley,California
0.0
0.5
1.0
1.5

Water worldsWater scarcity
Business as usual scenario, 2025
Limited investments in new water infrastructure reduce irrigation expansion and prevent water scarcity— but food scarcity is the result.
1
Technology, economics, and private sector scenario, 2025
Emphasis on technology and investments increases primary water supply by 24%. China and India are water short due to irrigation expansion. Many countries face economic water scarcity.
2
Absolute water scarcity
Economic water scarcity
Physical scarcity No water scarcity Not analysed
Absolute water scarcity
Economic water scarcity
Physical scarcity No water scarcity Not analysed
Sou
rce:
PO
DIU
M c
alcu
lati
on
s (I
WM
I 20
00).
In
tern
atio
nal
Wat
er M
anag
emen
t In
stit
ute
w
ww
.iw
mi.
org
. So
urc
e: P
OD
IUM
cal
cula
tio
ns
(IW
MI
2000
). I
nte
rnat
ion
al W
ater
Man
agem
ent
Inst
itu
te
ww
w.i
wm
i.o
rg.
34 World Water Vision

3
Values and lifestyles scenario, 2025
Development focuses on low-income countries that face economic water scarcity. Water and food scarcity is limited.
3
A country's ability to cope with increasing pressure on its water resources
depends on whether it faces physical or economic water scarcity
Absolute water scarcity
Economic water scarcity
Physical scarcity No water scarcity Not analysed
● Business as usual—a continuation of current policies and extrapolation of trends.● Technology, economics, and private sector—private sector initiatives lead research and development, and globalisation drives economic growth, but the poorest countries are left behind. ● Values and lifestyles—sustainable development, with an emphasis on research and development in the poorest countries.
Sou
rce:
PO
DIU
M c
alcu
lati
on
s (I
WM
I 20
00).
In
tern
atio
nal
Wat
er M
anag
emen
t In
stit
ute
w
ww
.iw
mi.
org
.
Water Futures 35

Water worldsCereal deficits or surpluses
1995
Major deficits, mostly in Africa and the Middle East.
Major deficit
1
Minor deficit Self-sufficient Minor surplus Major surplus Not analysed
Business as usual scenario, 2025
Global deficit of 200 million tons—major deficits in many countries in Africa and the Middle East—India self-sufficient.
Major deficit
2
Minor deficit Self-sufficient Minor surplus Major surplus Not analysed
Sou
rce:
PO
DIU
M c
alcu
lati
on
s (I
WM
I 20
00).
In
tern
atio
nal
Wat
er M
anag
emen
t In
stit
ute
w
ww
.iw
mi.
org
. So
urc
e: P
OD
IUM
cal
cula
tio
ns
(IW
MI
2000
). I
nte
rnat
ion
al W
ater
Man
agem
ent
Inst
itu
te
ww
w.i
wm
i.o
rg.
36 World Water Vision
3
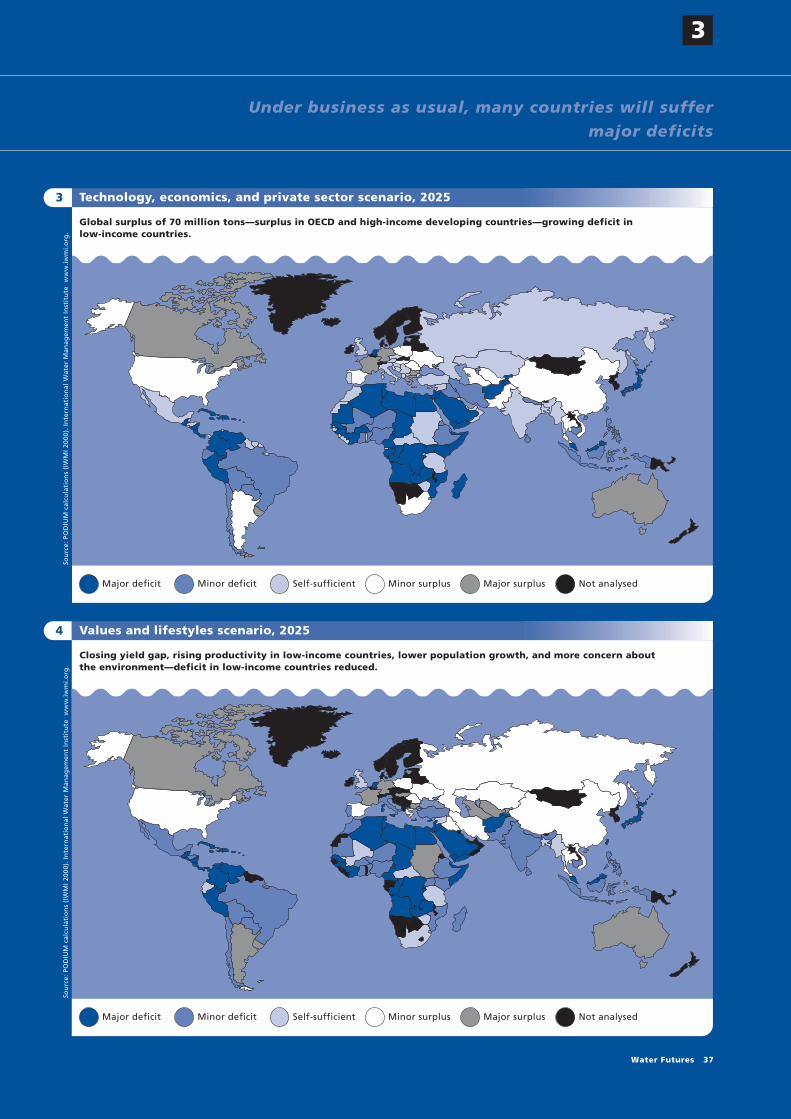
Technology, economics, and private sector scenario, 2025
Global surplus of 70 million tons—surplus in OECD and high-income developing countries—growing deficit in low-income countries.
Major deficit
3
Minor deficit Self-sufficient Minor surplus Major surplus Not analysed
Values and lifestyles scenario, 2025
Closing yield gap, rising productivity in low-income countries, lower population growth, and more concern about the environment—deficit in low-income countries reduced.
Major deficit
4
Minor deficit Self-sufficient Minor surplus Major surplus Not analysed
Under business as usual, many countries will suffer
major deficits
Sou
rce:
PO
DIU
M c
alcu
lati
on
s (I
WM
I 20
00).
In
tern
atio
nal
Wat
er M
anag
emen
t In
stit
ute
w
ww
.iw
mi.
org
. So
urc
e: P
OD
IUM
cal
cula
tio
ns
(IW
MI
2000
). I
nte
rnat
ion
al W
ater
Man
agem
ent
Inst
itu
te
ww
w.i
wm
i.o
rg.
Water Futures 37
Water Futures
• The doubly green revolution
• Adding more storage
a result of such reallocation, downstream commitmentsmay change, with serious legal, equity, and other socialconsiderations that must be addressed. One option hereis trade in virtual water.
Trade can help alleviate water scarcity (Allan and Court 1996).Countries with plentiful water should export water-intensivecrops, such as rice, to water-scarce countries. According to anearlier analysis by the International Food Policy ResearchInstitute (IFPRI) that did not take water into account as a con-straint, world trade in food will increase substantially between1995 and 2020 (Rosegrant, Agcaoili-Sombilla, and Perez1995). Trade in meat will triple, that in soybeans will double,and that in grains will rise by two-thirds. Developing countrieswill substantially increase their imports, while the exports willcome mainly from the United States, Canada, Australia, andArgentina. The analysis concluded that this increase wouldsatisfy world food demand, but not substantially reduce thenumber of undernourished people.
More food exports from industrial countries are not a solutionfor the 650 million poor and undernourished people in ruralareas. Most live where agricultural potential is low and natu-ral resources are poor (Leonard 1989). They also live in areasthat suffer from periodic or chronic shortages of water. Forthem, access to water means local production of food thatgenerates employment and income—and is sufficient anddependable enough to meet local needs throughout the year,including years unfavourable for agriculture (Conway 1999a).
A recent IFPRI analysis of the three World Water Vision sce-narios also concluded that international trade in food will riserapidly—for different reasons (Rosegrant and Ringler 1999).If agriculture does not expand rapidly, then the increasedtrade will largely come from water-constrained limits on foodproduction. Under the other two scenarios—which explore arange of measures to increase food production in projecteddeficit areas—the increased trade can only be caused byfaster economic growth in the developing world, which willlead to additional food demand, outstripping even the localincreases in production.
David Seckler has pointed out that the increase in trade willlikely be constrained by the need for foreign exchange to payfor the imports (IWMI 2000). Because of strong competition,it is unrealistic to expect all countries to move their scarceresources into the production of higher-value crops. Thus theIWMI scenario assumes that trade will remain at the current
percentage of food consumption—that is, a maximum30–40% increase in volumes traded (IWMI 2000).
Developing biotechnology for agriculture
According to Conway (1999a), the application of advances inbiotechnology—including genetic engineering, tissue culture,and marker-aided selection (which uses DNA technology todetect the transmission of a desired gene to a seedling aris-ing from a cross; box 3.2)—will be essential for:
● Raising yield ceilings.
● Reducing excessive pesticide use.
● Increasing the nutrient value of basic foods.
● Providing farmers on less favoured lands with varietiesbetter able to tolerate drought, salinity, and lack of soilnutrients.
Indeed, biotechnology should be seen as an element of whatConway (1999b) has dubbed the “the doubly green revolu-tion”. That revolution consists of ecological approaches tosustainable agriculture, greater participation by farmers inanalysis, design, and research, and the application of modernbiotechnology to the needs of the poor in developing coun-tries, particularly those in drought-prone areas.
The experts disagree on the potential of biotechnology toincrease food production. Seckler, for instance, does notexpect biotechnology to add more than 5–10% to the world’sfood production over the next 25 years (IWMI 2000). Conway(1999a), however, believes that over the next 10 years we arelikely to see much greater progress in multiple gene intro-ductions that focus on output traits or on hard to achieveinput characteristics, and that a high priority will be to engi-neer crops for drought tolerance.
He concludes that while the potential benefits of biotechnol-ogy are considerable, they are unlikely to be realised withouttaking some crucial steps. Poor rural farmers in drought-proneregions are unlikely to adopt these crops unless the seeds areprovided for free or at nominal cost. This will require heavypublic investment, by governments and donors, in theresearch and distribution of seeds and technical advice. Andthese efforts will need to focus on crops—cassava, uplandrice, African maize, sorghum, millet—that are food staples for
38 World Water Vision

Retaining flood waters until the moment needed for human use
remains an essential element of water resource management in all areas—
especially South Asia
people in drought-prone regions, who need increased yieldstability as much as increased yield.
The growth of transgenic crops, likely to be extremely vari-able in different parts of the world, has different effects ondifferent continents. In North America transgenic cropsalready dominate among some crops. In Europe a lack ofpublic acceptance may reduce food imports, causing higherfood prices and demand for water to produce food domes-tically, creating trade conflicts between Europe and NorthAmerica. In developing countries the adoption of transgeniccrops is likely to be highly variable, opening conflictsbetween governments and private companies with patentsfor numerous new varieties. The developing world needs tohave access to these technologies and to make its ownchoices (box 3.3).
Increasing storage
Increasing water storage, retaining flood waters until themoment needed for human use, remains an essential elementof water resource management in all areas—especially SouthAsia, where a huge percentage of annual flows are containedin a limited number of floods. The optimum strategy appearsto be a combination of storage in aquifers, in tanks and othertraditional microstructures, and behind small and large dams.
Building dams Many large dams—defined by the International Commissionon Large Dams (ICOLD) as those higher than 15 metres—arenot particularly controversial. The International HydropowerAssociation estimates that about 300 large dams are currentlybuilt every year, not much more than what is required toreplace the world’s capital stock of 39,000 large reservoirs,and down considerably from the number built in 1960–80.
New dams have become a lot less popular in OECD countriesover the past 10–20 years. But about 70% of the hydropowerpotential in these countries has already been developed, andthere is little incentive to increase agricultural areas, otherthen to increase food exports. Thus the need for more damsis limited. The future of dams in OECD countries is probablyas much about decommissioning dams as about buildingthem—about using dams and reservoirs for recreational and environmental purposes as well as for economicdevelopment.
Water Futures 39
3
Box 3.2 Tissue culture and marker-aided selection techniques
Most new varieties are the result of tissue culture and marker-aided selec-tion techniques. A rice variety from tissue culture—called La Fen Rockefellerby the Chinese breeder who developed it—is increasing yields by 15–25%for farmers in the Shanghai region. Scientists at the West Africa RiceDevelopment Association have used another culture to cross high-yieldingAsian rice with traditional African rice. The result: a new plant type thatlooks like African rice in its early stages of growth (it grows in dry condi-tions and can shade out weeds) but becomes more like Asian rice as itreaches maturity, resulting in higher yields with few inputs.
In another breakthrough, scientists announced recently that they haveincreased the amount of vitamin A in a new variety referred to as “goldenrice”—important for reducing vitamin A deficiency, which is a major causeof blindness.
Marker-aided selection is being used in rice to pyramid two or more genesfor resistance to the same pathogen, increasing the durability of resistance,and to accumulate several genes, contributing to drought tolerance. Forsome time to come, this is likely to be the most productive use of biotech-nology for cereals.
Source: Conway 1999a.
Box 3.3 The developing world cannot afford to forgo agricultural biotechnology
“Too little attention is paid to the effect of new agricultural technologieson the world’s poor and hungry”, says Per Pinstrup-Andersen, director gen-eral of the International Food Policy Research Institute, in an article sum-marised here. Most of these people live in developing countries, and theystand to benefit more than anyone from biotechnology. While“Frankenfood” and “terminator seeds” are buzzwords in European mediaand increasingly in the United States, small farmers in Asia, Africa, and LatinAmerica must wonder what the fuss is about. For them, the heated debateover agricultural biotechnology risks closing off a huge opportunity toimprove their lives.
Agricultural biotechnology can help farmers in developing countries pro-duce more—say, by developing new crop varieties that are tolerant ofdrought, resistant to insects and weeds, and able to capture nitrogen fromthe air. Biotechnology can also make the foods farmers produce morenutritious by increasing the vitamin A, iron, and other nutrients in the edi-ble part of the plant.
A few private corporations that focus on agriculture in industrial countries,where they expect the highest return on their investment, do most of thebiotechnology research. Governments must invest in biotechnologyresearch to help poor farmers, and the public and private sectors must workas partners. The potential of new agricultural technology is enormous, par-ticularly for the poor in developing countries. Condemning biotechnologyfor its potential risks without considering the alternative risks of prolong-ing the human misery caused by hunger, malnutrition, and child death isas unwise and unethical as blindly pursuing this technology without thenecessary biosafeguards.
Source: International Herald Tribune, 28 October 1999.

Water Futures
• Recharging groundwater
• Harvesting rainwater
• Pricing water services
• Making managers responsive to users
New large dams have also become controversial in develop-ing countries, as with the well-known Narmada project inIndia and the Three Gorges project in China, because of theimpacts on the environment and the displacement of people.It is possible to mitigate such impacts, and the dam-buildingcommunity has done extensive work on possible measures.But the experience with implementing these measures hasnot persuaded the opponents of dams. Later this year, theWorld Commission on Dams will produce guidelines on theconditions under which the overall impacts of dams may ormay not be beneficial.
Only a small part of the economically feasible hydropower inAfrica (6% of 1,000 terawatt-hours a year), Asia (20% of3,600), and Latin America (35% of 1,600) has been devel-oped (IHA 1999). Countries in these regions may decide thatthey do not want to develop their hydro potential to the samelevel as OECD countries (70%). But it is likely that they willdecide that the social optimum for hydropower is higher thantheir current levels of development.
Recharging groundwaterStoring water in aquifers is a compelling solution given theoverdrawing of groundwater in China, India, North Africa,the United States, and elsewhere. The threat that overdraw-ing poses for those who depend on water for their liveli-hood—and those who depend on the food produced (box3.4)—is ominous. New techniques and institutional mecha-nisms are urgently needed to recharge groundwater aquifers.Such mechanisms will include limiting access and providingincentives to users to limit or stop overpumping. The tworoutes open are to issue permits and control use or to recog-nise use rights and provide rights holders with incentives toconserve the resource. The second approach is generally moreeffective.
To make groundwater visible, groundwater protection zonescould be created, with special measures for recharge and forreductions on abstraction. All groups affected by the“groundwater rush”—and the ensuing water scarcity, landdegradation, water quality loss, and poor public health—need to be enlisted in initiatives to tackle the challenges. Theyinclude water user groups, local political leaders and civil soci-ety, and politicians and diplomats negotiating with riparianneighbours to reduce abstractions from common groundwa-ter. The media and general public, unaware that this invisible“water savings account” is seriously depleted and underthreat, must also be closely involved.
Harvesting rainwaterRainwater harvesting, generally a socially attractive alterna-tive to large construction, provides opportunities for decen-tralised, community-based management of water resources.But rainwater harvested upstream reduces the runoff other-wise available to others, or the environment, downstream(unless it would have run to a sink). Nor is harvesting rainwa-ter any more free of environmental costs than taking waterfrom streams for irrigation (box 3.5).
New reservoirs may produce cheap water, but they are expensivein environmental terms. Groundwater provides excellent on-demand storage, but if left unregulated it can easily be overcon-sumed, affecting other users. Thus, for every alternative, acomplete balance of benefits and disadvantages needs to bedrawn up. In most cases the best solution will be a combinationof surface and groundwater use, with a range of storage options.
40 World Water Vision
Box 3.4 Groundwater for agriculture
One of the greatest technical revolutions in irrigation has been the devel-opment of the small pump. Tens of millions of small pumps are drawingwater out of aquifers to irrigate crops. Because pump irrigation provideswater on demand, yields from pump irrigation can be two to three timesthose from canal irrigation. More than half the irrigated area in India is nowsupplied by groundwater. And since irrigation supplies about half the foodproduced in India, a third or more of that production depends on thesehumble devices and the aquifers that feed them.
Much the same is true in other arid countries. Yet almost everywhere in theworld, groundwater tables are falling at alarming rates in areas that dependon irrigation from groundwater. In many of the most pump-intensive areasof India and Pakistan, water tables are falling by 2–3 metres a year. This isnot surprising: the evaporation losses of a typical crop are around 0.5 metreof water table depth, and the yield of water in an aquifer is about 0.1 metreper metre of depth. Without recharge, groundwater tables would fall byabout 5 metres a crop. Most of these areas receive enough rainfall torecharge the aquifers, but most of the rainfall goes to runoff—not torecharge. We desperately need to change that relationship.
It is no exaggeration to say that the food security of China, India, Pakistan,and many other countries in 2025 will largely depend on how they man-age groundwater. Reducing pump irrigation is no answer, for that simplyreduces the most productive agriculture. The answer has to be in ground-water recharge, not an easy solution. Indeed, no one has devised a cost-effective way to do it on the scale required. About the only plausible ideais to encourage, through subsidies if necessary, flooded paddy (rice) culti-vation in lands above the most threatened aquifers in the wet season.Paddy irrigation, with high percolation losses, is inefficient from a tradi-tional point of view. But from the point of view of groundwater recharge,it makes sense. As it turns out, India has been doing precisely this on180,000 hectares for the past 10 years.
Source: IWMI 2000.

Rainwater harvesting provides opportunities for decentralised,
community-based management of
water resources
Reforming water resource management institutions
The biggest challenge in water resource managementremains institutional. Political will must change decisionmak-ing to include all stakeholders, especially women, so thatstakeholders have the power to manage their own resources.Public and private management of water can only beimproved through greater accountability, transparency, andrule of law.
Pricing water servicesAs described elsewhere in this report, making water availableat low cost, or for free, does not provide the right incentiveto users. Water services need to be priced at full cost for allusers, which means all costs related to operation and main-tenance and investment costs for at least domestic and indus-trial users. The basic water requirement needs to beaffordable to all, but this can be done more effectively thanby making all water available to all users at way below cost.Pricing water will provide an incentive for the private sector,large and small, domestic and international, to get involved.It has the potential to provide the dynamics—the funds forresearch and development, for instance—that the sectorlacks.
Making managers responsive to usersService-oriented management focuses on making man-agers responsive to user needs. This requires the devel-opment of a mutual dependency—such as service forpayment—that can take various forms, including serviceagreements. These provide a detailed description of servicesto be provided, payments in return for services, verificationof service provision, consequences of failing to comply withagreements for both parties, and rules for arbitration ofconflict.
The service needs and expectations of users will be influencedby the price they have to pay for those services, especially ifthey have to pay the full cost. Recognising that services canbe provided in different ways using different levels of tech-nology at different levels of cost, service-oriented manage-ment thus requires a mechanism to ensure that the servicesneeded by users are provided at the lowest possible cost.Consultation processes, clear service relationships, transpar-ent administration, and accountability mechanisms areamong other conditions that have to be put in place for effec-tive service-oriented management.
Water Futures 41
3
Box 3.5 Rainwater harvesting
Rainwater harvesting has considerable potential for meeting drinkingwater and irrigation needs in the poor regions of the developing world andfor recharging depleted groundwater aquifers. The total rainfall endow-ment of an area of one hectare in an arid environment with just 100 mil-limetres annual rainfall is as much as 1 million litres per year.
People on the Indian subcontinent have an ancient tradition of rainwaterharvesting. They depend on the monsoon, which brings large quantities ofrain in highly concentrated events. Over the years, with community partic-ipation in water management taking a backseat, this tradition went intodecline. But it is showing signs of revival in areas suffering from acutedeforestation and poor land management. These environmental changeshave upset the hydrological cycle so much that these areas have becomeintensely drought-prone.
● In the 1970s two highly ecologically degraded and economically desti-tute villages—Ralegan Siddhi in Maharashtra (where annual rainfallranges from 450 to 650 millimetres) and Sukhomajri in Haryana (withannual rainfall around 1,100 millimetres)—took to rainwater harvest-ing, the first for groundwater recharge, the second for surface storage.With more water available, these villages slowly improved and stabilisedtheir agricultural and animal husbandry outputs and are today foodexporters rather than food importers.
● In the mid-1980s Tarun Bharat Sangh, a nongovernmental organisationworking in the Alwar district of Rajasthan, encouraged the drought-prone village of Gopalpura to revive its water harvesting tradition ofcapturing surface runoff. By 1998 the success of Gopalpura had encour-aged 650 other villages in the drought-prone district to undertake sim-ilar efforts, leading to higher groundwater levels, increased and morestable agricultural incomes, and reduced distress migration.
● With 70 villages building 238 water harvesting structures in one water-shed, the 45-kilometre Arvari River—which previously flowed for just afew months during the monsoon season—now flows year round. Andthe increased groundwater recharge is making life easier for innumer-able women living along the river. Village communities along the ArvariRiver have even formed a River Parliament to regulate use of the riverand the groundwater resources of the watershed.
● Impressed by the outstanding achievement of Ralegan Siddhi, DigvijaySingh, chief minister of the state of Madhya Pradesh, replicated theeffort in 7,827 villages. Between 1995 and 1998 the project coverednearly 3.4 million hectares of land through a highly participatory water-shed developmen and rainwater harvesting programme. Village water-shed committees were created to undertake the programme and turnwater management into a people’s movement.
● Rainwater harvesting is not just for poor villages. It is being promotedin the Sumida ward of Tokyo to reduce urban floods and in the Indiancity of Chennai (formerly Madras) to recharge groundwater aquifersthat became saline because of overextraction and seawater. And thelatest terminal of Frankfurt Airport—built in 1993—captures 16,000cubic metres of rainfall from its vast roof for such low-grade waterneeds as cleaning, gardening, and flushing toilets.
Source: Agarwal 1999.

Water Futures
• Empowering communities
• Restructuring irrigation system management
• Valuing ecosystem functions
• Increasing cooperation in international basins
Empowering communities, women, and menThe essence of Vision 21—the sector Vision on water for peo-ple—is to put people’s initiative and capacity for self-reliance atthe centre of planning and action. Water and sanitation arebasic human needs—and hygiene is a prerequisite. Recognisingthese points can lead to systems that encourage genuine par-ticipation by empowered men and women, improving livingconditions for all, particularly women and children.
Vision 21, in its approach to people-centred development,takes the household as the prime catalyst for change, the firstlevel in planning and management of environmental services.Change in the household or neighbourhood leads to ripplesof cooperation and action involving communities and localauthorities—and then to actions by district, state, national,and global authorities.
A new alliance of local people, nongovernmental organisa-tions (NGOs), and water agencies can contribute much toachieving the World Water Vision. Community-level actionprograms could include:
● Watershed action programs in which local people workwith NGOs and research organisations to promote con-servation and local empowerment.
● Local councils that tackle local problems in water rehabil-itation and pollution.
● Basin-level organisations for integrated watermanagement.
● Construction of groundwater recharge wells to improvevillage water supplies and aquifer management.
● Disaster preparedness linked with community action.
● Drought relief efforts that mobilise work and foodsupplies.
● Community action in controlling waterborne disease.
● Local action for monitoring water quality, crop selection,and quality control of produce irrigated with effluent water.
Restructuring irrigation system managementRestructuring irrigation systems to provide more benefits tothe poor involves a mix of technical and institutional reforms.
Bringing the poor into the dialogue on system priorities canyield new ideas that benefit all stakeholders. New approachesthat show potential include:
● Improving design and operations. Participatory consulta-tions can reveal inequities in water distribution and pos-sible steps to improve performance. Such consultationscan be especially useful during water-scarce periods,when poor and female irrigators may have a particularlyhard time obtaining water. For example, flexible cultiva-tion rights can reallocate irrigated land during seasonalwater scarcity.
● Extending new water availability to the poor. When reha-bilitation improves the water supply, new water rights canbe given to the poor or those without irrigation. Nepaland Peru offer examples.
● Linking irrigation management transfer to serviceimprovements. Irrigation management transfer pro-grammes offer new opportunities for representation forsmall farmers and women. This participation can result innew water rotations that increase equity between thehead and tail ends of an irrigation system and that recog-nise domestic water needs as a legitimate objective of anirrigation system.
● Reforming land and water rights. Some countries haveundertaken large-scale redistribution of land and waterrights, breaking up large holdings for small farmers andlabourers. But the economic and political rationales forsuch reform are a thing of the past. What is needed is apolicy that helps the poor, particularly indigenous groupsand ethnic minorities, defend their rights in the contextof the water rights consolidation and sectoral transfersemerging from today’s economic policies. Where waterrights are (re-)distributed, they should be awarded to allusers, women and men, landowners and landlessfarmers.
Valuing ecosystem functions
Water is essential to life, development, and the environ-ment—and the three must be managed together, notsequentially. Because communities rarely understand thisinterrelationship, awareness raising is the first step. Afterthat, research on the local watershed, public education, andcommunity-led watershed and river basin management can
42 World Water Vision

Many practices adopted to improve the management of
water for human needs will also
benefit ecosystems
make sustainability possible. As part of the water planningprocess, each water community should consider how muchwater to allocate to the natural environment. National leg-islation should require this, as it does in Australia and SouthAfrica. Decision support models are available, and experi-ence with them should be observed carefully, with a view toapplying lessons from elsewhere—taking into accountindigenous knowledge and local water managementapproaches.
Much more research is needed to improve our understandingof ecosystem functioning and to value the services that thesesystems provide. Recent global assessments of the servicesprovided by freshwater ecosystems (watersheds, aquifers,and wetlands) for flood control, irrigation, industry, recre-ation, waterway transportation, and the like come up withestimates amounting to several trillion dollars annually(Costanza 1997; Postel and Carpenter 1997). Such knowl-edge will allow careful assessments of the impacts of waterresource use and development on ecosystems, particularlytropical ecosystems (box 3.6). Integration needs to emphasizethe river basin as the appropriate scale of management, fromthe forests in the upper watersheds to the coastal zonesaffected by the inflows of rivers into wetlands, lagoons, andmangrove ecosystems. The interactions between waterresources and coastal zone management are many, but areoften ignored or misunderstood (Rijsberman and Westmacott1997). In the meantime, actions for better-integrated man-agement include:
● Leaving the amount of water in ecosystems required tomaintain proper functioning.
● Protecting wetlands and floodplains to enable the bene-fits from seasonal flooding and provide storage forextreme flood flows.
● Protecting and planting forests in upper catchments,especially in mountainous areas.
● Requiring full effluent treatment by industries and munic-ipalities and applying the “polluter pays” principle.
● Protecting water resources from agricultural runoff.
● Creating groundwater protection zones.
● Rehabilitating degraded areas to recover lost ecosystemfunctions (through reforestation, wetland restoration,fish population restoration, and so on).
Many practices adopted to manage water for human needs—rules on extracting and sharing water, changes in cultivation andirrigation to save water for other purposes, returns to ancientand community-based water harvesting and storage—will alsobenefit ecosystems. Other measures include reducing nutrientsthrough farm-based manure storage, controlling silt by reducingerosion upstream, planning for joint hydropower generation anddry season irrigation, and reducing pollutants from agricultureand industry. Above all, ecosystems will be protected by inte-grated land and water resource management basin by basin—along with full cost pricing for water services and managementreforms for water delivery and wastewater disposal.
Increasing cooperation in international basins
Close to half the world is situated in close to 300 internationalriver basins—rivers that cross national boundaries and whoseresources are therefore shared. There are countless examplesin history of peoples and countries that have made agree-ments on how to share such international water resources.There are also ample cases, particularly in times of droughtsor rising scarcity, of conflicts over water. In fact, people havebeen forecasting an increase in wars over water as the ulti-mate result of such conflicts.
Experience shows, however, that shared water resources canbe made into a source of cooperation rather than conflict.
Water Futures 43
3
Box 3.6 Estimating the benefits of floodplain use in northern Nigeria
Recent estimates indicate that traditional practices provide greater bene-fits than irrigation crops on the Hadejia-Jama’are floodplain in northernNigeria. Firewood, recession agriculture, fishing, and pastoralism generate$32 per thousand cubic metres, compared with $0.15 for irrigation. Thisevaluation is important because more than half the region’s wetlands havealready been lost to drought and upstream dams. Thus a proposed increasein water diversion for large-scale irrigated agriculture is inadvisable.
Even without accounting for such services as wildlife habitat, the wetlandis more valuable in its current state than after conversion to large-scale irri-gated agriculture. The lesson? When cost-benefit analysis includes thevalue of the goods and services provided by an ecosystem, large-scaledevelopment schemes are less profitable than improving the managementof the unaltered ecosystem.
Source: Barbier and Thompson 1998.

Water Futures
• Stages of successful cooperation
• Supporting innovation
Certainly for a World Water Vision to be realised, the need forcooperation in international basins is paramount. This is noteasy, as shown by the 30 years of negotiation needed to reachagreement on the United Nations Convention on the Law ofthe Non-navigational Uses of International Watercourses.Sadly enough, even after all that time it now seems unlikelythat this convention will be ratified by enough countries toenter into force.
It appears that the best we can do is to emphasise how coun-tries get to a better understanding and eventually to deepercooperation over international waters. There is a series ofstages through which most successful cooperation appears toevolve:
● Confidence building. Countries that share internationalrivers usually start with low-level technical cooperationthat focuses on exchange of data, or jointly gathereddata. International river commissions, with regular meet-ings of national representatives and a small technical sec-retariat, often serve this purpose.
● Cooperation. As mutual trust and confidence increase,and as issues appear that concern all parties and can bemore effectively addressed through collective action, thelevel of cooperation gradually grows to a point wherecountries are willing to undertake joint action or allocatemore significant resources.
● International agreements. After years of successfulcooperation, lengthy negotiations are usually requiredto reach bilateral or regional agreements. Such agree-ments seldom address the (theoretically desired) com-prehensive integrated management of water resources,but focus on specific issues of hydropower, navigation,or environment. Where the interests of upstream anddownstream countries diverge sharply over specificissues, it is not unusual that agreement is reached in awider framework involving cross-border trade or involv-ing other issues that allow agreements in every party’sinterest.
● International law and alternative dispute resolution. Onceinternational agreements have been established, conflictscan be addressed through formal (judiciary, internationallaw) or alternative dispute resolution mechanisms (medi-ation, arbitration).
Supporting innovation
Because we have a finite amount of water resources and agrowing number of people and growing demand, the sus-tainable use of water ultimately depends on our ability toincrease its productivity at least as fast as demand grows.Increasing productivity will depend largely on innovationthroughout the sector, through both fundamental researchand the widespread dissemination and adoption of its results.
A key part of the necessary innovation will be increased aware-ness of water issues throughout the population and educationand training of people capable of bringing about the neces-sary changes—that is, capacity building in the water sector. Acrucial factor to mobilise resources for capacity building andresearch will be to give water its proper value. This requirespricing it. Once water is appropriately valued, users and pro-ducers will have incentives to conserve it and to invest in inno-vation. While pricing water is expected to be the primarymotivation to bring in the private sector, a host of public goodsaspects of water resources will continue to require public fund-ing. These range from researching staple food crops indeveloping countries to finding cures for tropical diseases—important to populations that do not make up sufficient mar-kets for privately funded research to be attractive.
Notes
1. The background for the work outlined here, the scenariosand modeling done in support of the World Water Visionexercise, is published in a companion volume, World WaterScenarios: Analysis (Rijsberman 2000).
2. For fuller treatment of these issues, see the scenarios andmodels referred to in note 1 and the three main sector Visions,on which much of the following discussion is based: “A Visionof Water for Food and Rural Development” (Hofwegen andSvendsen 1999), “Vision 21: A Shared Vision for WaterSupply, Sanitation and Hygiene and a Framework for FutureAction” (WSCC 1999), and Vision for Water and Nature:Freshwater and Related Ecosystems—The Source of Life andthe Responsibility of All (IUCN 1999).
3. Productivity is a better indicator than efficiency.Increasing efficiency at the field or farm level may not haveany benefits. And efficiency at the basin level should not nec-essarily be maximised, because it reduces the amount left
44 World Water Vision
Increasing productivity will depend largely on innovation through both
fundamental research and the widespread dissemination
and adoption of its results
over for downstream uses and the environment. Water pro-ductivity can be increased by obtaining more production withthe same amount of water or by reallocating water fromlower- to higher-value crops or from one use to anotherwhere the marginal value of water is higher. Indeed, thegreatest increases in water productivity in irrigation have notbeen from better irrigation technology or management, butfrom increased crop yields due to better seeds and fertilisers(IWMI 2000).
4. Three models were used extensively for the Vision simula-tions: WaterGAP, developed at the University of Kassel,Germany (Alcamo and others 1999); IMPACT, developed bythe International Food Policy Research Institute, Washington,D.C. (Rosegrant and Ringler 1999); and PODIUM, developedby the International Water Management Institute, Colombo,Sri Lanka (IWMI 2000). In addition, the Polestar scenario toolof the Stockholm Environment Institute was used to disag-gregate global scenario assumptions to 18 regions.
5. Data for 1995 renewable water resources and use at thecountry level are from Shiklomanov (1999).
6. The United Nations Medium Scenario, 1998 Revision, isthe base for the business as usual scenario (UN 1999). In 2025more than 80% of the world population—6.6 billion peo-ple—will live in developing countries. In addition, the worldpopulation will be older and more urban. About 84% of thepeople in developed countries and 56% in developing coun-tries will live in urban areas, many in megacities (defined ascities with more than 10 million people). The technology, eco-nomics, and private sector scenario uses the United NationsMedium Scenario minus 2%. The values and lifestyles sce-nario uses the United Nations Low scenario.
7. Feedback irrigation systems provide more or less water tofields in response to signals received from farmers concerningtheir demands, while standard irrigation systems are scheduledto provide water to fields at predetermined times and amounts.
Water Futures 45
3

Annex
Annex table 3.1 Drivers for the three World Water Vision scenarios for 1995–2025
Technology, economics, andprivate sector (relative to Values and lifestyles (relative to
Driver Business as usual business as usual) business as usual)
Demographic Population 7.8 billion (6.6 billion in About the same 7.3 billion (6.2 billion in
developing countries) developing countries)Population growth 1.2% (1.4% in developing Same or slightly lower (because of 1.05% (1.1% in developing
countries) higher mortality) countries)Urbanisation 61% urbanised (56% in About the same About the same
developing countries)Pressures for migration from High Higher (and stronger barriers) Low developing to developed countries
Technological Information technology Widely available and used to Same Widely available and used to
increase water management increase water management efficiency efficiency and effectiveness
Biotechnology Widely available and used for Widely available and used for new Widely available and used for new new crop varieties crop varieties with high water sustainable crop systems and water
use efficiency purificationWater use efficiency Higher, particularly in arid areas Dramatically higher Higher than in business as
usual but lower than in technologyeconomics, and private sector
Water pollution Lower pollution per unit Lower, mostly in developed and Lower stillemerging economies
New drought-, pest-, and salt- Moderate and controversial Massive development and Same, but combined with resistant crops dissemination of new varieties, ecotechnology and integrated in
largely solving the agricultural water new agricultural systemsproblem
Sanitation Investment in developing countries Same Investment in developing countries grows slower than population grows faster than overall economy;
ecotechnology usedDesalinisation Widely available Even cheaper Same
EconomicVolume of production $80 trillion ($40 trillion in 30% higher, but mostly in $90 trillion ($60 trillion in
developing countries) developed and emerging economies developing countries)Structure of production Gradual dematerialisation; Little dematerialisation in Rapid increase of the nonmaterial
agriculture grows in absolute terms developing countries; agriculture economygrows in absolute and relative terms in developing countries
Water infrastructure (availability Growing at same rate as the Privatised and growing faster than Growing faster than the economyand condition) economy the economyTrade Universal Some countries or regions excluded Universal and strategically regulated
from global markets
SocialLifestyles and cultural preferences Converge to today’s levels in Same preferences, but real lifestyles Convergence in developing and
developed countries diverge in developed and developing developed countries to less countries material-intensive lifestyles than in
today’s developed countriesPoverty Absolute poverty remains constant; Absolute poverty decreases, Absolute poverty eradicated
relative poverty decreases inequality increasesEconomic inequality High and increasing Very high and increasing Gradually reduced
EnvironmentalCommitted future climate change Increased variability, agroecologic Slightly less Less because of strong emission
shifting controlsWater-related disease Gradually increasing Gradually decreasing Only in small pocketsSalinisation Gradually increasing Dramatically decreasing StoppedExhaustion and pollution of surface Gradually increasing Stopped; water withdrawals Stopped; water withdrawals and groundwater reduced to sustainable levels reduced to sustainable levelsIntegrity and health of aquatic Gradually decreasing Recovering somewhat Recovering rapidlyecosystems
GovernanceInstitutions Insufficient to resolve conflict; Lack of global leadership Strong and adequate institutions
severely stressed created; shared goals; wide participation
Market dominance Universal Same Universal but regulatedPower structure (international, Asymmetrical but slowly becoming Increasingly asymmetrical Much more pluralistic national) more pluralisticConflicts Ubiquitous and increasing Same Practically absentGlobalisation Accelerating Accelerating but unequal Same
Source: Rijsberman 2000.
46 World Water Vision

Water Futures 47
3
Annex table 3.2 Assumptions for the three World Water Vision scenarios
Technology, economics, Variable Country group/region Business as usual and private sector Values and lifestylesPopulation, 2025 OECD UN Medium Scenario UN Medium Scenario UN Low Scenario
Medium income UN Medium Scenario UN Medium Scenario less 2% UN Low ScenarioLeast developed UN Medium Scenario UN Medium Scenario less 2% UN Low Scenario
Consumptive water use All Can be above 70% Less than 70% Less than 70%factor, 2025a
Degree of water resource All Not limited Not limited Less than 60%development, 2025b
Annual total Annual total Annual totalGDP growth, 1995–2000 Western Europe 2.10% 3.32% 1.53%
Eastern Europe 1.89% 1.42% 4.37%CIS 2.15% 2.13% 5.13%Aral Sea 2.17% 2.34% 4.50%North America 2.10% 3.32% 0.98%Central America 1.77% 1.12% 5.18%South America 1.95% 1.80% 4.07%North Africa 2.06% 4.07% 6.73%Southern Africa 1.69% 3.54% 5.20%East Africa 1.83% 3.77% 5.92%West Africa 1.96% 3.92% 6.11%Central Africa 1.92% 3.74% 5.18%Middle East 1.40% 1.31% 3.89%China 4.20% 4.02% 7.69%South Asia 3.49% 3.81% 6.65%Southeast Asia 2.98% 3.35% 6.01%Japan 0.96% 2.17% 0.12%Australia 2.05% 3.27% 1.21%
Growth in irrigated area, Global 1.5% 25% 5% 1995–2025 (0.22% in Brazil, India, IWMI base adjusted IWMI base adjusted
and Turkey )Growth in cereal area, Global 0.36% 0.31% 0.16%1995–2025Growth in irrigated grain OECD 0.88% 1.50% 1.50%yield, 1995–2025 Medium income 1.00% 1.80% 2.30%
Least developed 0.79% 1.00% 2.30%Growth in rainfed grain OECD 0.30% 0.60% 0.40%yield, 1995–2025 Medium income 0.30% 0.45% 0.80%
Least developed 0.30% 0.30% 1.00%Growth in irrigation OECD 10% 20% 30%efficiency Medium income 10% 20% 30%
Least developed 10% 10% 30%
a. Ratio of evaporated water to primary water supply.
b. Ratio of primary water supply to usable water resources.
Source: Rijsberman 2000.


