Embed Size (px)
Citation preview

WATER CONSERVATIONBY THE YARD:
A STATEWIDE ANALYSIS
OF OUTDOOR WATER
SAVINGS POTENTIAL
March 2018

Acknowledgements:
Water Conservation by the Yard: A StatewideAnalysis of Outdoor Water Savings Potentialis a joint publication of the Sierra Club, Lone StarChapter and National Wildlife Federation.
Water Conservation by the Yard was researchedand written by Meghan Bock and JonathanKleinman of Aiqueous in collaboration withJennifer Walker, Ruthie Redmond and Myron Hess.
This publication was produced as an activity of the Texas Living Waters Project. The Texas LivingWaters Project is a collaborative effort of theNational Wildlife Federation and the Sierra Club,Lone Star Chapter and Galveston Bay Foundation.
The goals of the Texas Living Waters Projectinclude:
1) Ensure adequate water for both people and the environment,
2) Reduce future demand for water and fosterefficient and sustainable use of current watersupplies,
3) Educate the public and decision makers aboutthe impact of wasteful water use and theopportunities for water conservation, and
4) Involve citizens in the decision-making processfor water management.
This report was funded through the generoussupport of The Cynthia and George MitchellFoundation.
Thank you to Carole Baker and the Texas WaterFoundation for your assistance in producing thisupdate and expansion to Water Conservation by the Yard.
You can learn more about theTexas Living Waters Project atwww.texaslivingwaters.org.

WATER CONSERVATION BY THE YARD | 3 |
CONTENTSExecutive Summary 4
Introduction 7
Outdoor Watering in Texas 9
Single-Family Outdoor Watering in Texas 10
Determining Single-Family Outdoor Water Use by Region 11
Approach for Computing Savings from Outdoor Watering Restrictions 13
How Much Water can be Saved? 14
The Impact of Education and Enforcement on Water Savings 15
Estimating Savings Potential 16
Projected Statewide Water Savings from Watering Ordinances 19
Savings Solely from Single-Family Residential Use 19
Savings from Total Municipal Use 19
Designing & Implementing Watering Ordinances 23
Case Studies 25
The Woodlands 25
Frisco 26
Lubbock 27
Watering Ordinance Adoption 27
Watering Ordinance Implementation 28
Ensuring Adequate Education and Outreach 28
Establishing an Appropriate Watering Schedule 29
Ensuring Effective Enforceability and Enforcement 30
Strategies for Locking In & Increasing Water Savings Alongside Outdoor Watering Restrictions 31
Native Landscaping 31
Understanding Landscape Watering Needs 32
Water Smart Landscaping 33
Limiting-Irrigated Landscapes 33
Smart Irrigation Controllers 34
Drip Irrigation 35
Conclusion 35
References 36

WATER CONSERVATION BY THE YARD | 4 | Executive Summary
EXECUTIVE SUMMARYThere is a lot of water to be saved from implementing more efficient landscape irrigationpractices. Landscape irrigation is estimated to be the single, largest component ofmunicipal water use, and municipal water use is the second largest use of water in Texas(Cabrera et al., 2013). Studies show that homeowners have a tendency to overwaterlandscapes by as much as two to three times the amount needed (Haley et al, 2007).
In 2012, the TWDB released a report on outdoorwater usage patterns in single-family householdsacross Texas (Hermitte and Mace, 2012). TWDBÕsanalysis showed that outdoor watering accountsfor about 31 percent of single-family residentialwater consumption statewide. By outdoor use, we are referring to the water used to irrigatelawns, gardens, and plants, which represents 80 to 90 percent of total outdoor water consumption(Hermitte and Mace, 2012). Single-familyhouseholds typically dedicate a greatershare of their total water usage to outdoor purposes, but othermunicipal sectors, such as multi-family residential and institutional,commercial, and industrial (ICI), also have high outdoor wateringdemands. Moreover, outdoor water can represent a much higherpercentage during our hot, drysummers. To help curb excessiveoutdoor water use, cities can for instanceencourage residents to convert turf grass tonative landscaping, introduce conservation ratestructuring, and establish limits on the number of days residents can irrigate their lawns.
The latter approach, referred to as outdoorwatering restrictions, is often the first line ofdefense for many cities during periods of droughtbecause restrictions offer an immediate solutionfor stretching existing water supplies. Althoughoutdoor watering restrictions can yield impressivesavings in times of emergency, this straight-
forward, minimal cost strategy can also drivelong-term reductions in municipal per capita waterusage on an ongoing basis if combined with robustenforcement and education efforts. Several citiesacross Texas — including Dallas, Austin, Frisco,Fort Worth, and the Woodlands — already utilizepermanent outdoor watering restrictions as a corecomponent of their water conservation efforts.
Even with outdoor watering limited to no morethan twice per week, evidence shows Texas
lawns will continue to thrive. In fact, theCity of Austin has now moved to a nomore than once per week wateringschedule on a permanent basis,which has resulted in further savingswhile still allowing landscapes to do well. In order to stretch watersupplies and protect rivers and bays, no more than twice per week
landscape watering restrictions shouldbe viewed as the maximum allowable
watering frequency, with individual utilitieslooking carefully to determine if landscapewatering should be allowed less frequently.
This approach would greatly reduce overallmunicipal water use, and by reducing peak waterdemand, reduce capital expenditures otherwiserequired for expanding water treatment capacityand transmission lines. In addition, reducing waterwithdrawals for landscape watering will leavemore water flowing in Texas rivers and into Texasbays. Adequate river flows and freshwater inflows
In addition,
reducing water
withdrawals for landscape
watering will leave more
water flowing in Texas
rivers and into
Texas bays.

WATER CONSERVATION BY THE YARD | 5 | Executive Summary
to bays are essential for maintaining good waterquality and for supporting healthy populations of fish and wildlife that are a key component ofthe natural heritage of all Texans.
To illustrate the water savings potential resultingfrom no more than twice per week wateringrestrictions, we performed a statewide analysis of residential outdoor watering and, based on that analysis, estimated a range of water savingsusing data collected from the efforts of utilities in multiple states. Our approach uses municipal-level data and extrapolates it to the regional andstatewide scale. Presenting our findings based onregional water planning areas allows us to compareregional savings to current and future municipalneeds and demands, as set forth in the 2017 StateWater Plan.
Based on regional differences in outdoor use andon varying levels of education and enforcementeffort, we identified a potential savings range of 2percent to 11 percent of total municipal water usagefor TexasÕ 16 planning regions. Total municipalusage reflects total water consumption by single-family and multi-family residential, commercial,industrial, and institutional users. If no more thantwice per week watering restrictions wereimplemented in each region with a high level ofeducation and enforcement effort, 460,000 acre-feet of water per year could be conserved relativeto the projected 2020 municipal demand levelsacross the entire state (Table 1). By 2070, withprojected population growth rates and a high levelof effort, statewide municipal water savings could
exceed 750,000 acre-feet per year. In the comingdecades, water savings from these measures alonewould be enough to satisfy a significant portion of projected municipal water needs.
There is a range of savings possible throughimplementing no more than twice per weekwatering restrictions. A higher level of effort will yield bigger savings. For example, acomprehensive education program will ensuremore customers are aware of the wateringrestrictions and offer information on how tomaintain a healthy landscape while complying with the watering restrictions. An enforcementprogram will help increase program complianceand water savings. This could be combined with a reporting mechanism that allows communitymembers to report instances of water waste. To help lock in and increase these water savings,Texas cities can complement outdoor wateringrestrictions with additional conservation measuresover the long-term. These strategies include:
G Encouraging the installation of drip irrigationand evapotranspiration-based (ET-based)irrigation controllers;
G Promoting water smart landscaping, establishingtop soil requirements in new development, andlimiting irrigated landscape area; and
G Providing tools and opportunities to educatecommunities on efficient landscaping andirrigation practices.
G Provide free or reduced-cost irrigation systemaudits or check-ups
Table 1: Summary of projected statewide water savings from twice per week outdoor watering restrictions by planning decade(2020, 2040, and 2070). The range of potential savings is based on the level of effort (low and high) exercised in educating andenforcing outdoor watering restrictions. Projected municipal demands and needs are taken from 2017 State Water Plan. Water needs refers to amount of project demand not expected to be met from current supply sources.
TABLE 1: PROJECTED MUNICIPAL SAVINGS FROM OUTDOOR WATER RESTRICTIONS BASED ON PROJECTED FUTURE MUNICIPAL DEMANDS & NEEDS
S
2020 Planning Decade 2040 Planning Decade 2070 Planning Decade
Municipal Demand(acre-feet/year)
Municipal Need(acre-feet/year)
Municipal Demand(acre-feet/year)
Municipal Need(acre-feet/year)
Municipal Demand(acre-feet/year)
Municipal Need(acre-feet/year)
5,199,942 510,750 5,791,143 1,575,086 8,432,718 3,413,130
Water Savings (acre-feet/year) Water Savings (acre-feet/year) Water Savings (acre-feet/year)
222,163 (low effort) to 464,066 (high effort)
276,471 (low effort) to 573,957 (high effort)
367,981 (low effort) to 759,069 (high effort)
STATEWIDE

WATER CONSERVATION BY THE YARD | 6 | Executive Summary
There is no doubt water conservation must play anintegral role in ensuring TexasÕ future water needsare adequately met. Over the next 50 years, the2017 State Water Plan estimates over $60 billionof investment will be required to meet the stateÕsfuture water demands. In almost all instances,water conservation represents the most cost-effective water management strategyrecommended in the Plan and the option withthe least amount of adverse environmentalimpact, especially compared to developing newgroundwater or surface water supplies. Waterconservation enables cities to stretch existingwater supplies to meet the needs of more peopleand businesses. Moreover, since that supply andthe infrastructure to deliver it has already been
developed, conserving that water is far lessexpensive than building new capital projects, such as major reservoirs or desalination plants.
As this report demonstrates, effectivelyimplemented outdoor watering restrictions cancontribute immensely to meeting statewidemunicipal water needs and can alone achievemuch of the projected conservation savingsincluded in the 2017 State Water Plan. By actingnow to recognize and capture the full potential ofoutdoor watering restrictions, Texas communitiescan achieve these long-term conservation savingsand take a major step towards meeting the stateÕsprojected municipal water needs.
As this report demonstrates, effectively implemented outdoor watering restrictions can contribute immensely to meeting statewide municipal water needs
and can alone achieve much of the projected conservation savings included in the 2017 State Water Plan. By acting now to recognize and capture
the full potential of outdoor watering restrictions, Texas communities can achievethese long-term conservation savings and take a major step towards meeting
the stateÕs projected municipal water needs.

WATER CONSERVATION BY THE YARD | 7 | Introduction
INTRODUCTIONIn 2015, the Sierra Club, Lone Star Chapter and the National Wildlife Federation jointlypublished the original Water Conservation by the Yard: Estimating Savings from Outdoor WateringRestrictions, which focused only on conservation opportunities in water planning regions C and H. The report estimated the water savings from no more than twice per weekwatering restrictions in those two regions. As the original report highlighted, outdoor water use represents a significant opportunity for water conservation because landscapesare often overwatered.
Reducing excessive outdoor water use throughthe implementation of watering ordinances offersone of the most cost-effective water supplystrategies available to municipalities. More citieshave started to recognize the value of mandatory,year-round watering restrictions as an ongoingconservation measure, even when droughtconditions have improved.
The state of Texas is certainly no stranger todrought. It was not too long ago that the statewas fully immersed in one of the most severedroughts on record. During these periods of watercrisis, limitations on outdoor watering, whichrepresents the largest category of discretionaryhousehold use, becomes a utilityÕs first line ofdefense in reducing overall water use. As droughtconditions begin to dissipate, however, cities oftenrescind outdoor restrictions even though savingsfrom these watering ordinances can be secured onan ongoing basis. The original Water Conservationby the Yard: Estimating Savings from OutdoorWatering Restrictions argued that outdoor
watering restrictions should remain in place on a full-time basis because wasteful landscapeirrigation remains a problem through periods of both drought and non-drought.
Since the original report was published, as illustrated in the maps below, Texas fullytransitioned out of a severe drought. Following the impacts of the devastating hurricane thatunleashed over 50 inches of rain and as much as 31 trillion gallons of water along the Texas GulfCoast in late summer of 2017, it can be difficult tofocus on water conservation. However, for much ofthe state, abnormally dry, and even drought-levelconditions, had already returned by the end of theyear. As the state recovers from Hurricane Harvey,it appears increasingly likely that increasing severefluctuations between intense rainfall and droughtwill be the new norm for the state. It is critical,then, for water conservation to remain on theminds of both the public and decision-makersbecause the next drought is just around the corner.
August 30, 2011 August 27, 2013 August 25, 2015 August 29, 2017
Abnormally Dry
Moderate Dry
Extreme Drought
Severe Drought
ExceptionalDrought
Regional WaterPlanning Area
Drought Intensity

WATER CONSERVATION BY THE YARD | 8 | Introduction
Proactive, ongoing water conservation measuresto ensure long-term water demand reduction willbe key to ensuring a good water future for Texas,regardless of whether we are in a drought at anyparticular time.
As demonstrated in our earlier study on savingsfrom outdoor watering restrictions in planningregions C and H, ordinances limiting the frequencyof landscape watering can produce large savings.In this report, we provide savings calculations forall 16 water planning regions. The purpose of thisexpanded study is to examine the full watersavings potential on a statewide scale and toconsider more carefully how heightened educationand enforcement can affect the savings achieved.In our analysis we focus on the water savings fromno more than twice per week watering restrictions,which we believe is the minimal standard thatTexas cities should adopt. In fact, some Texas
communities have gone further to curb excessiveoutdoor water use by limiting outdoor irrigation to no more than once per week, and their effortshave yielded compelling results.
Using no more than twice per week wateringrestrictions as a benchmark, we estimate futuremunicipal water savings according to updatedmunicipal demand projections through 2070, as set out in the 2017 State Water Plan. We then compare these estimated future municipalwater savings to projected municipal needs. We complement this quantitative analysis byalso highlighting strategies for designing andimplementing effective watering ordinances. As Texas looks ahead to the next 50 years, theresults of our analysis underscore the integral roleconservation measures should play in securing a more resilient water future.
Proactive, ongoing waterconservation measures to ensure
long-term water demand reductionwill be key to ensuring a good
water future for Texas, regardlessof whether we are in a drought
at any particular time.

WATER CONSERVATION BY THE YARD | 9 | Outdoor Watering in Texas
OUTDOOR WATERING IN TEXAS
Commercial, Industrial, & Institutional – Outdoor
Landscape irrigation is estimated to be the single, largest component of municipal wateruse, and municipal water use is the second largest use of water in Texas (Cabrera et al., 2013).
Municipal water use is comprised of three maincategories: single-family residential; multi-familyresidential; and institutional, commercial, andindustrial (ICI). Each of these municipal usecategories contributes to total outdoor wateringdemands to varying degrees. Landscape water use as a percentage of total water use is greatestamong single-family households, with less, but still substantial, percentages for multi-familyand ICI uses. Numerous factors influence outdoorwatering demands at the municipal scale,including the size of each customer class, buildingcharacteristics, size of irrigated land, density, etc.For a community with a greater mix of water user types (i.e., diversified service base), Figure 1illustrates a fairly typical distribution of municipalwater consumption by sector and end usecategory (indoor or outdoor).
Outdoor water consumption in communities with adiversified service base is more evenly distributedacross each sector — however, single-familyresidences are still the largest outdoor water users.In communities with a predominant share of single-family residential users (i.e., homogenous servicebase), outdoor water consumption by single-familyresidences accounts for an even larger share oftotal municipal usage, as shown in Figure 2.
FIGURE 1: DISTRIBUTION OF MUNICIPAL WATERCONSUMPTION BY USE CATEGORY — EXAMPLE OF A COMMUNITY WITH A DIVERSIFIED SERVICE BASE
Figure 1: Example distribution of municipal water consumptionby use category (single-family; multi-family; commercial,institutional, and industrial) and by end use category (indoor or outdoor) for a community with a mixture of single-family,multi-family, and ICI customers. This information is based onthe City of AustinÕs 2010 historical water consumption data,which is prior to the cityÕs adoption of year-round twice perweek watering restrictions (City of Austin, 2017).
Commercial,Industrial, &Institutional –Indoor
Multi-FamilyResidential –Outdoor
Multi-FamilyResidential –Indoor
Single-FamilyResidential –Outdoor
Single-FamilyResidential –Indoor

WATER CONSERVATION BY THE YARD | 10 | Outdoor Watering in Texas
To better understand statewide outdoor waterusage, we first focus on single-family householdsbecause of the high percentage of total municipaloutdoor watering demands coming from thismunicipal water use category. Moreover, availabledata on single-family household outdoor useallows us to assess usage on a more localizedlevel. Building on the analysis of single-family
Commercial, Industrial, & Institutional – Outdoor
Commercial,Industrial, &Institutional –Indoor
Multi-FamilyResidential –Outdoor
Single-FamilyResidential –Outdoor
Single-FamilyResidential –Indoor
FIGURE 2: DISTRIBUTION OF MUNICIPAL WATERCONSUMPTION BY SECTOR — EXAMPLE OF A
COMMUNITY WITH A HOMOGENEOUS SERVICE BASE
Figure 2: Example distribution of municipal water consumptionby use category (single-family; multi-family; commercial,institutional, and industrial) and by end use category (indoor or outdoor) for a community with a service base dominated by single-family homes. This information is based on municipalwater usage for the City of Frisco (TWDB, 2012 through 2015).Percent outdoor water use for single-family households wasobtained from the TWDB (Hermitte and Mace, 2012). Percentoutdoor water use for multi-family and ICI customers wasextrapolated from the City of AustinÕs historical waterconsumption data (City of Austin, 2017).
outdoor water usage, we next compute thesavings available from total municipal water usageby incorporating multi-family and ICI categoriesinto the saving estimations.
Single-Family Outdoor Watering in TexasOutdoor water use represents a substantial portionof residential water consumption in Texas, rangingfrom 21 percent in wetter areas to 41 percent indrier areas. In total, single family households inTexas currently use as much as 590,000 acre-feetof water each year for landscape irrigation.
In 2012 the TWDB prepared a report on outdoorwater usage patterns in single-family householdsacross Texas.1 The analysis showed that outdoorwatering accounts for about 31 percent of single-family residential water consumption statewide.The study also found that patterns in outdoor waterusage roughly mirrored the east-west precipitationgradient with drier areas using a larger proportionof water for outdoor purposes than wetter areas,although significant variability was noted.
Data presented in TWDBÕs report forms the basis of our analysis of statewide outdoor water useby single-family households in Texas. We start by determining total outdoor water use as apercentage of total usage for each region, and from these data, we estimate the total volume ofsingle-family outdoor water use, both in regionalwater planning areas and statewide. Outdoor wateruse can vary substantially from region to regiondepending on climate, household characteristics,landscaping preferences, etc. To better capturethese regional variations, we also calculate dailyhousehold outdoor use within each region.
Multi-FamilyResidential –Indoor
Outdoor water use represents a substantial portion of residential water consumptionin Texas, ranging from 21 percent in wetter areas to 41 percent in drier areas.
In total, single family households in Texas currently use as much as 590,000 acre-feet of water each year for landscape irrigation.
1 The study, titled The Grass is Always Greener... Outdoor Residential Water Use in Texas, focused on residential outdoor consumption for 259 Texas cities from 2004 to 2008 and 17 Texas cities from 2004 through 2011 (Hermitte and Mace, 2012)

WATER CONSERVATION BY THE YARD | 11 | Outdoor Watering in Texas
Determining Single-FamilyOutdoor Water Use by Region
MAP 1: OUTDOOR WATER USE AS A PERCENTAGE OF TOTAL HOUSEHOLD USE
Map 1: Outdoor water use as a percentage of total householduse per planning region, based on utility records from 2004 to2008 (Hermitte and Mace, 2012).
Using municipal-level data cited in TWDBÕs report,we computed a weighted percentage of outdoorwater use for each region. We began by assigningeach city from the TWDB report to its respectiveregion and then calculating the weighted averagefor the region based on the number of single-familyresidential connections. Outdoor water use isextremely prevalent in single-family households, soby weighting these percentages, we can describethe relationship between percent outdoor wateruse and the number of single-family connections in a more meaningful way. For instance, cities withhigher concentrations of single-family householdsrepresent a larger share of total outdoor waterusage region-wide, so a weighted average allowsus to better account for the relative impact ofthese cities on total outdoor water usage.
Our results show that single-family households in Region A use the largest share (41.3 percent)of their total consumption for outdoor purposes.Conversely, single-family households in Regions Hand N use the smallest share (20.7 percent and23.4 percent, respectively) for outdoor water use.
For the most part, the outdoor water usecharacteristics illustrated in Map 1 reflect the east-west precipitation gradient from wetter to drierregions of the state. However, in Regions like D and I, which are in a wetter part of the state,outdoor usage accounts for a larger share of totalusage compared to surrounding regions. Rainfall is not the only factor contributing to these usagepatterns — other factors such as land use,housing characteristics, and behavioraldifferences between urban and rural residentialusers can also influence outdoor use.
MAP 2: TOTAL ANNUAL SINGLE-FAMILY RESIDENTIAL OUTDOOR WATER USE
Map 2: Total single-family residential outdoor water use perregion, based on utility records from 2004 to 2008 (Hermitteand Mace, 2012) and utility water use estimates (TWDB, 2012through 2015).
Next, we estimated the total annual volume ofoutdoor water use for single-family residences in each region. We arrived at these estimationsby applying the percentages of outdoor use toaverage single-family household demand withinthe region from 2012 to 2015. This information wasobtained from annual water use surveys collectedby the TWDB for all Texas public water systems.We chose to average single family residentialconsumption over this four-year period to accountfor the fluctuations in demand that occur as a result of years with more or less rainfall.
Our results indicate Region C uses more wateroutdoors by far than any other region —

WATER CONSERVATION BY THE YARD | 12 | Outdoor Watering in Texas
approximately 210,000 acre-feet annually — whichaccounts for 35 percent of total single-familyoutdoor consumption statewide. Although RegionsH, G, and L round out the top four regions in termsof total outdoor water use, these regions use acombined volume of 189,000 acre-feet, which isless than Region C alone. Regions with the lowestvolumes of outdoor water use include Regions B, J, and P. Map 2 illustrates the variation in totaloutdoor consumption, by volume, across the state.
Demographic trends, rather than regional climatevariations, tend to be the primary driversinfluencing these patterns in total outdoor wateruse. More populated regions, such as C, H, G, K,and L, consume the highest volumes of outdoorwater because these regions are also thepopulation centers of Texas and therefore have alarger concentration of single-family households,which typically use more water outdoors thanother sectors such as the multi-family sector andthe institutional, commercial, and industrialsector. Region A, on the other hand, has thehighest outdoor water use as a percentage oftotal household water use, but it is less denselypopulated, so the regionÕs overall outdoor wateruse is much lower.
Statewide, average annual outdoor water use isapproximately 590,000 acre-feet. This value isequivalent to the combined annual total municipalwater usage of Regions A, B, D, E, and K. In otherwords, the amount of water we use for municipaloutdoor water use as a state could meet the fullmunicipal water use of five of the water planningregions.
Another useful metric for evaluating outdoorwater use is daily outdoor use by household,which captures both regional variations in climateas well as differences in housing characteristicsand cultural norms associated with lawns. Eventhough Regions C, G, and H have the highestoutdoor water use on a regional basis, that doesnot necessarily indicate excessive amounts ofoutdoor water use because of differences innumbers of households. To better understandthese regional differences, we calculated outdoorwater use on a per household basis. Map 3 showsthese per household usage patterns by region.
The map of daily household outdoor usagegenerally tracks the east to west precipitationgradient more clearly than percentage outdoorwater use. Regions on the eastern edge of Texasand along the Gulf Coast receive more rainfall andexperience higher humidity, which lead to lowerrates of evapotranspiration. Due to the effects of climate, for similar types of landscape plants,outdoor watering requirements are often muchlower in these regions compared to regions to the west, which receive less rainfall. Householdoutdoor water use is also highly correlated with a number of other factors, such as age of housingstock, lot size, and assessed value.
Given how much water is used in the state ofTexas for landscape irrigation, there is a significantopportunity to achieve water savings throughconservation measures. The TWDB projects the stateÕs population to nearly double by 2070,meaning outdoor water use will likely follow a similar trajectory unless action is taken now.Curbing outdoor water use through more efficientlandscape irrigation practices can yield substantialwater savings, while still maintaining healthylandscapes. In the next section, we highlight the savings potential tied to the implementationof outdoor watering restrictions.
MAP 3: DAILY OUTDOOR HOUSEHOLD USE
Map 3: Daily outdoor household use per region, based on utilityrecords from 2004 to 2008 (Hermitte and Mace, 2012) andutility water use estimates (TWDB, 2012 through 2015).

WATER CONSERVATION BY THE YARD | 13 | Savings from Outdoor Watering Restrictions
APPROACH FOR COMPUTINGSAVINGS FROM OUTDOORWATERING RESTRICTIONS
As our findings indicate, the scale of outdoor water use statewide is massive. A significantpercentage of highly treated, potable water — not to mention the expensive infrastructurerequired to deliver that water — is devoted to watering landscapes. Given the ability oflandscapes to survive and thrive with lower watering amounts and frequencies, wateringrestrictions can reduce total municipal water usage by as much as 11 percent, even withoutlarge-scale changes in the types of residential landscapes. Now more than ever, Texas citiesshould employ watering restrictions as an ongoing conservation strategy, not just as atemporary drought-management response.
The push towards permanent, outdoor wateringrestrictions also comes in line with demographicand housing trends in recent decades. Texas ishome to the fastest growing cities in the nation,and with this demographic growth comesburgeoning housing markets across many parts of the state. The abundance of new housing stockis rapidly shaping municipal water demands,especially in the single-family sector where in-ground irrigation systems and turf grass havebecome increasingly prevalent (Aquacraft, 2011b).Because these housing preferences drive higheroutdoor water usage, the need to curb excessiveoutdoor water use has become ever more salient.
Communities can implement a variety of measuresto achieve outdoor water savings, from promotingdrought-tolerant plant species, to transitioning to conservation-driven water rate structures, to adopting ordinances that reduce inefficient or inappropriate watering practices. To leveragethe greatest water savings, cities can focus theirefforts on all municipal sectors and tailor these
measures to the unique characteristics of theirservice base. When it comes to outdoor wateringrestrictions, the largest portion of these outdoorwater savings will come from single-familyhouseholds. However, the multi-family and ICIsectors represent a sizeable chunk of totalmunicipal outdoor water usage, and as such,substantial savings are also achievable throughrestrictions on outdoor watering for these sectors.
Our analysis of the potential water savings fromno more than twice per week watering restrictionsfocuses on both single-family residential savings (as a percentage of total single-familyconsumption), as well as on total municipal savings,which reflect the combined savings from single-family, multi-family, and ICI (as a percentage oftotal municipal use). These two perspectives allowus to provide useful information for understandingthe full scale of achievable municipal-wide savings,while also highlighting the critical savings availablefrom the single-family residential sector.

WATER CONSERVATION BY THE YARD | 14 | Savings from Outdoor Watering Restrictions
How Much Water can be Saved?Outdoor watering restrictions have been acomponent of drought management planning forwell over a decade. In times of drought, cities enactirrigation restrictions as an emergency response torapidly declining water supplies, but once droughtconditions subside, these restrictions are typicallywithdrawn. In periods between droughts, however, permanent, year-round outdoor wateringrestrictions can strengthen long-term water suppliesby ensuring ongoing outdoor water savings.
The state of Texas is especially susceptible todrought — since its first recorded drought in 1870,the state has experienced prolonged, severedrought at least once every decade. In fact, the most recent drought punctuated by 2011 — nowthe stateÕs worst short-term drought on record —persisted for over three years and was preceded by a series of back-to-back droughts in the early2000s (Henry, 2011). Outdoor watering restrictionswere widely implemented across the state duringthe peak of the 2011 drought, but only a handful ofcities kept the restrictions in place after the droughtdissipated, including Fort Worth, Austin, and Dallas.Even in non-drought periods, these cities continueto see reductions in outdoor water use.
In Texas and beyond, more communities havestarted to recognize the benefits of implementingwatering restrictions as a permanent conservationstrategy versus as just an emergency response towater shortages. Unfortunately, records of specific,quantified water savings projections associatedwith this measure have not been readily available,largely because the data are not routinely collected.For cities that do track their water savings, it can be difficult to tease out other factors that mayaffect outdoor water use patterns.
To gain more insight into the range of potentialsavings from watering restrictions, we performedan extensive literature review and reached outdirectly to several cities. In Table 2 (page 15), wepresent the reported watering savings from no
more than twice per week watering restrictions, as implemented under two different contexts: as a temporary mechanism for drought managementand as an ongoing conservation strategy. Thewatering day limitations are typically paired withtime-of-day restrictions (e.g., no watering between10 am and 6 pm, when evaporative loss is especiallyhigh) and prohibitions against wasting water(e.g., no runoff or no watering impervious cover).
Water utilities report a wide range of savings from watering restrictions, which, to some extent,appears to reflect their underlying service base, but also level of implementation effort. The lowerpercentage savings generally are reported byutilities serving a mixture of single-family; multi-family; institutional, commercial, and industrialsectors (data from Dallas, Fort Worth, Austin, and Tarrant Regional Water District). Alternatively,percentage savings rates in the double digits (11 to16 percent) generally come from utilities servingprimarily single-family homes (data from Ococee,Winter Park, Deland, and The Woodlands). All otherthings being equal, the difference makes sensebecause single-family residences generally use ahigher percentage of water outdoors as comparedto other municipal use categories. When outdoorusage is curtailed, the largest portion of the savingslikely will come from single-family homes, soutilities with a higher percentage of those homesare expected to see greater savings.
The level of effort that cities dedicate toimplementing a watering restriction is also a key factor. The results of our review indicatethat it is possible the persistence of thesesavings can diminish over time as droughtconditions subside, particularly for measuresinitiated in response to drought but kept in effectwithout a robust education and enforcementmechanism. For instance, the City of Fort Worthreports seeing its savings from outdoor wateringrestrictions drop from 9 percent in 2013 — when the city first implemented permanentrestrictions — to 1 percent in 2016.
Texas is home to the fastest growing cities in the nation, and with this demographic growth comes
burgeoning housing markets across many parts of the state. The abundance of new housing stock
is rapidly shaping municipal water demands, especially in the single-family sector where
in-ground irrigation systems and turf grass have become increasingly prevalent.
Because these housing preferences drive higher outdoor water usage,
the need to curb excessive outdoor water use has
become ever more salient.

WATER CONSERVATION BY THE YARD | 15 | Savings from Outdoor Watering Restrictions
Table 2: Savings from no more than twice per week watering restrictions reported by water providers across the country. Savingsare identified by type of restriction (drought-related or permanent), year(s), percent savings, and use category (total municipal useor single-family use) against which estimated savings are calculated.
The Impact of Education and Enforcement on Water Savings
Service base composition plays a factor in thebroad range of savings observed in thesecommunities, but level of implementation effort isan even stronger indicator of the captured savings.We observe this connection in data from Virginia,Los Angeles, and Sanford, FL, which reportedpercentage savings on both the lower and higherends of the spectrum (3 to 23 percent). Specifically,the study of 18 municipalities in Virginia examinedthe effectiveness of heightened education andenforcement during a 2002 drought (Halich andStephenson, 2009). The most aggressive effortsresulted in as much as 22.1 percent water savingscompared to a modest 4 percent savings whenlevels of education and enforcement were both low.
In developing our estimates of potential savings, weincluded data on savings from both permanent anddrought-related restrictions. The assumption is thatthe practice being implemented is the same foreach, which leads us to assume permanent and
drought-related restrictions should yield similarsavings opportunities. However, that is not alwaysthe case, as our review of savings estimates reveals.For outdoor watering restrictions to be effective,robust implementation mechanisms must beestablished. Drought-related restrictions see higher water savings because educational andenforcement efforts are typically more aggressiveduring drought. As the Virginia study demonstrates,heightened implementation efforts translate to a much higher savings potential. When droughtconditions recede, however, it is not uncommon for enforcement and education mechanisms to dropoff as available water supplies return to previouslevels and the sense of urgency begins to diminish.Lax education and enforcement may often result inwater users who are not mindful of the importanceof avoiding wasteful water use. Maintaining elevatedlevels of education and enforcement, consistentwith those evidenced during periods of drought,can help ensure restrictions remain just aseffective in periods of non-drought.
TABLE 2: EXAMPLES OF SAVINGS FROM OUTDOOR WATERING RESTRICTIONS
Source Type of Restriction Year(s)Annual Percent Water Savings
Category of Use
Fort WorthDrought 2011 8% Total municipal use
Permanent 2013 - 2016 1% - 9% Total municipal use
Tarrant Regional Water DistrictDrought 2011 8% Total municipal use
Permanent Projected 4% Total municipal use
Dallas Permanent 2012 7% Total municipal use
Austin Permanent 2009 7% Total municipal use
St. Johns River WaterManagement District
Permanent 2006 - 2012 11% Total municipal use
Stuart, FL Permanent 2010 15.5% Total municipal use
The Woodlands Permanent 2012 - 2013 13% Total single-family use
Ococee, FL Permanent Early 2000s 11.6% - 12.8% Total single-family use
Winter Park, FL Permanent Early 2000s 15% Total single-family use
DeLand, FL Permanent Early 2000s 11% Total single-family use
Sanford, FL Permanent Early 2000s 3% Total single-family use
Virginia (18 municipalities) Drought 2002 3.6% - 22.1% Total single-family use
Los Angeles, CA Drought 2009 4% - 23% Total single-family use

WATER CONSERVATION BY THE YARD | 16 | Savings from Outdoor Watering Restrictions
Figure 3:Water conservation savings for landscape watering restrictions, as reported by water suppliers throughout the U.S. The top 2 bars represent annual savings as a percentage of total municipal use (i.e., single-family; multi-family; commercial,institutional, and industrial) for restrictions implemented during a drought. The next 6 bars represent annual savings as apercentage of total municipal use for permanent restrictions. The following 2 bars represent annual savings as a percentage of overall use by single-family homes for restrictions implemented during a drought. The bottom 5 bars represent annual savingsas a percentage of overall use by single-family homes for permanent restrictions. When data were reported as a range of savings,the lower savings percentage is indicated in light green.
FIGURE 3: PERCENT SAVINGS FROM WATERING ORDINANCES
Total Municipal Use — Drought-Related
Fort Worth
Tarrant Regional Water District
Total Municipal Use — Permanent
Fort Worth
Tarrant Regional Water District
Dallas
Austin
St. Johns River Water Management District
Stuart, FL
Total SF Use — Drought-Related
Virginia
Los Angeles, CA
Total SF Use — Permanent
The Woodlands
Ococee, FL
Winter Park, FL
DeLand, FL
Sanford, FL
0 5 10 15 20 25
Percent Savings
� Percent Savings (High Estimate)
� Percent Savings (Low Estimate)
A broad range of savings comes as no surprise,given the unique context in which outdoor wateringrestrictions are implemented — including level ofeducation and enforcement effort, the service basecomposition, regional climate, etc. Because of thiscomplexity, savings observed in one place may notbe as easily replicable in another. The challenge ofdetermining precise savings estimations is mademore difficult by the fact that the savings reportedin Figure 3 may reflect the combined impact of multiple efforts to reduce outdoor demandssuch as rebate programs, conservation educationinitiatives, and shifts in pricing. Nonetheless,water suppliers commonly underscore watering
restrictions as the greatest contributor to thesesavings. To account for these variations, wedeveloped matrices of potential savings for single-family water use and total municipal water use.
Estimating Savings Potential In order to incorporate the effect of these factorsinto our analysis, we developed a range ofpotential savings for outdoor water restrictions,both for single-family use (i.e., the water savingsfrom single-family households alone) and for totalmunicipal use (i.e., the combined water savingsfrom all municipal sectors). We determined these

WATER CONSERVATION BY THE YARD | 17 | Savings from Outdoor Watering Restrictions
ranges using two parameters: initial level ofhousehold outdoor use (lower, medium, orhigher demand) and level of effort employed to implement the measures (low or high effort).
This format allows the flexibility to assign watersavings estimates that better align with the climateand outdoor water use behaviors characteristic ofeach region and with the implementation strategy.Using daily outdoor household demand presentedin the previous section, we categorized each regionby level of demand: lower (59 gallons or less perday per household), medium (60 to 79 gallons perday per household), and higher (80 gallons or moreper day per household). Map 4 depicts these levelsof demand by region.
MAP 4: LEVEL OF OUTDOOR HOUSEHOLD DEMAND(BASED ON DAILY OUTDOOR HOUSEHOLD USE)
Map 4: Level of Outdoor Household Demand: Low, Medium,and High. [based on utility records from 2004 to 2008(Hermitte and Mace, 2012) and utility water use estimates(TWDB, 2012 through 2015)].
We also used level of implementation effort (low orhigh) as a parameter for demonstrating the breadthof potential savings that can be achieved fromoutdoor watering restrictions. Our researchindicates that the robustness of education andenforcement efforts during implementation greatlyinfluences the effectiveness of these restrictions.
Tables 3 and 4 illustrate the estimated percentagesavings for single-family and total municipal usagebased on different combinations of levels ofoutdoor water demand and of implementationeffort: Low Demand-Low Effort, Low Demand-High Effort, Medium Demand-Low Effort, MediumDemand-High Effort, High Demand-Low Effort,and High Demand-High Effort.
Table 3: Estimated percent savings in single-family householdwater consumption by level of implementation effort (low andhigh) and household outdoor demand (low, medium, and high).
Table 4: Estimated percent savings in total municipal waterconsumption by level of implementation effort (low and high)and household outdoor demand (low, medium, and high).
TABLE 3: SAVINGS ESTIMATE MATRIX — TOTAL SINGLE-FAMILY USAGE
Outdoor HouseholdDemand
Level of Effort/Education
Low High
Low 3.5% 12.2%
Medium 5.8% 14.5%
High 12.2% 22.2%
TABLE 4: SAVINGS ESTIMATE MATRIX — TOTAL MUNICIPAL USAGE
(INCLUDES SINGLE-FAMILY, MULTI-FAMILY, ICI)
Outdoor HouseholdDemand
Level of Effort/Education
Low High
Low 2.0% 7.0%
Medium 3.5% 8.5%
High 7.0% 11.0%

WATER CONSERVATION BY THE YARD | 18 | Savings from Outdoor Watering Restrictions
We determined these savings estimates bycompiling two separate datasets of savings fromno more than twice per week landscape wateringrestrictions (single-family residential savings andtotal municipal savings) and computing the 10th,25th, 50th, 75th, and 90th percentiles of eachdataset. These percentiles were chosen becausethey reflect the range of savings potentialexpected from outdoor watering restrictions. A primary assumption, based on our review of the data, is that high levels of enforcementand education in regions with lower householdoutdoor use will generate the same amount of savings as low levels of enforcement andeducation in regions with high household use.We also assumed that the range of potentialsavings for the low, medium, and high outdoordemand classifications would overlap. Using best professional judgment, we applied thesepercentiles to the three outdoor demandcategories (low, medium, and high) in eachmatrix, starting with low level of implementationeffort (10th, 25th, 50th percentiles) followed byhigh level of implementation effort (50th, 75th,and 90th percentiles).
The underlying logic supporting these savingspercentages is that outdoor watering restrictionsyield fewer savings in areas where there is lessdemand for outdoor water. The potential to savewater increases in areas with greater outdoorwatering demands because there is greatercapacity to cut down on inefficient outdoor waterusage. A second component of our logic is thatwhen robust complementary programs are inplace to enforce watering restrictions and educateresidents about the value of conserving water and about proper landscape watering needs, these savings can be greatly improved.
In the next section, we apply these savingspercentages to each regionÕs annual single-familyand total municipal usage to determine a volumeof potential savings from no more than twice perweek watering restrictions.
Our research indicates that passing an ordinance limiting
outdoor watering should be combined with education and enforcement programs in order
to increase the effectiveness of the restrictions.

WATER CONSERVATION BY THE YARD | 19 | Projected StatewideWater Savings fromWatering Ordinances
PROJECTED STATEWIDEWATER SAVINGS FROMWATERING ORDINANCESAnticipated water savings from no more than twice per week watering restrictions across the full range of municipal use categories are 460,000 acre-feet per year statewide by 2020,with high levels of education and enforcement efforts. This volume of water is equal to thecombined annual municipal demands of Regions A, B, F, N, and O during this same time.
TABLE 5: ESTIMATED PERCENTAGE SAVINGS BASEDON CURRENT SINGLE-FAMILY RESIDENTIAL DEMAND
Region
OutdoorHouseholdDemand (low,
medium, or high)
Current Single-FamilyResidentialDemand(acre-
feet/year)
Percent Water Savings
LOWEducation/Enforcement
HIGHEducation/Enforcement
A High 35,381 12.2% 22.2%
B Low 11,735 3.5% 12.2%
C High 536,554 12.2% 22.2%
D Low 47,994 3.5% 12.2%
E Medium 66,155 5.8% 14.5%
F High 48,814 12.2% 22.2%
G Medium 164,831 5.8% 14.5%
H Low 392,373 3.5% 12.2%
I Medium 68,603 5.8% 14.5%
J Medium 8,603 5.8% 14.5%
K Medium 83,497 5.8% 14.5%
L Medium 175,898 5.8% 14.5%
M Medium 129,887 5.8% 14.5%
N Low 35,973 3.5% 12.2%
O High 36,487 12.2% 22.2%
P Low 2,722 3.5% 12.2%
TOTAL 1,845,509 AVG 7.5% AVG 16.6%
Savings Solely from Single-FamilyResidential UseWe developed savings projections by applying the savings percentages presented in the previoussection to each regionÕs current single-familyresidential demand (based on average annualdemand from 2012 and 2015). We calculated anestimated savings range of 7.5 to 16.6 percent ofaverage annual single-family residential demandacross the entire state, as shown in Table 5. Thepercentage ranges vary from region to regionbased on levels of single-family residentialdemand within the region.
Some of these potential savings, however, are already being realized as municipalities suchas Dallas, Fort Worth (including its wholesalecustomers), Frisco, The Woodlands, CollegeStation, and Lubbock have adopted ordinanceslimiting residential watering to a maximum of twodays per week year-round, while Austin has goneeven further by implementing no more than onceper week watering restrictions.
Savings from Total Municipal UseTo calculate percentage savings from totalmunicipal use from no more than twice per weekwatering restrictions, we applied our municipalsavings estimate matrix to current municipaldemand. As for single-family residential savings,we obtained municipal demand data from TWDBÕs annual water use surveys and determinedaverage municipal demand from 2012 to 2015. Wecharacterized outdoor municipal demand as low,medium, or high using the single-family household
Table 5: Estimate of water savings percentages for single-familyresidences within planning regions by level of implementationeffort in the form of education and enforcement (low or high).Current single-family residential demand reflects average usagefrom 2012 to 2015 obtained from the TWDBÕs Water Use Survey(TWDB, 2012 to 2015). The percent water savings from no morethan twice-per-week watering restrictions were identified in theprior section of this study.

WATER CONSERVATION BY THE YARD | 20 | Projected StatewideWater Savings fromWatering Ordinances
classification of each region. Our savings estimatespresented here reflect the anticipated outdoorsavings in not only the single-family residentialsector, but also the multi-family sector and theindustrial, commercial, and institutional (ICI)sector. All of these sectors use water forlandscape watering.
Based on anticipated population growth andincreasing municipal water demands over thecoming decades, we expect the potential municipalsavings from outdoor watering restrictions tofollow a similar trend. To demonstrate this, we applied the same savings percentages to theprojected municipal demand in 2020, 2040, and
TABLE 6: ESTIMATED PERCENTAGE SAVINGS BASED ON CURRENT TOTAL MUNICIPAL DEMAND
Region
OutdoorMunicipalDemand (low,
medium, or high)
Current Total
MunicipalDemand(acre-
feet/year)
Percent Water Savings
LOWEducation/Enforcement
HIGHEducation/Enforcement
A High 77,393 7.0% 11.0%
B Low 22,639 2.0% 7.0%
C High 1,221,274 7.0% 11.0%
D Low 122,209 2.0% 7.0%
E Medium 130,734 3.5% 8.5%
F High 112,773 7.0% 11.0%
G Medium 343,083 3.5% 8.5%
H Low 980,056 2.0% 7.0%
I Medium 187,938 3.5% 8.5%
J Medium 23,678 3.5% 8.5%
K Medium 234,892 3.5% 8.5%
L Medium 408,966 3.5% 8.5%
M Medium 246,359 3.5% 8.5%
N Low 88,846 2.0% 7.0%
O High 82,772 7.0% 11.0%
P Low 6,716 2.0% 7.0%
TOTAL 4,290,328 AVG 4.3% AVG 8.9%
Table 6: Estimate of water savings percentages for totalmunicipal use by level of effort in the form of education andenforcement (low or high). Current municipal demand reflectsaverage municipal demand from 2012 to 2015 obtained from theTWDBÕs Water Use Survey (TWDB, 2012 to 2015). The percentwater savings from no more than twice-per-week wateringrestrictions were identified in the prior section of this study.
2070. Our estimations show that potential savingsin 2020 could be more than 460,000 acre-feet peryear statewide, with high levels of implementationeffort. By 2070, these annual municipal savingswould increase to almost 760,000 acre-feet. Table 7 shows projected municipal savings basedon projected total municipal demands for the 2020,2040, and 2070 planning decades.
As part of the regional water planning process,planning groups estimate projected ÒMunicipalNeedsÓ (as shown in Table 8), which representsthe difference between municipal demand andavailable supply from existing water sources.Regional planning groups recommend watermanagement strategies that can be used to meet those projected water needs, and theserecommendations are presented in State WaterPlan. As shown in Table 8, a comparison of theprojected municipal needs in 2020 to the potentialsavings from outdoor watering restrictionsindicates that watering ordinances could satisfymuch of the projected municipal need in mostregions in the near-term. A similar comparisonbased on 2070 projections indicates that wateringordinances could satisfy a significant percentageof needs even for the 2070 timeframe. It is likelythat, particularly by 2070, new technologies for more efficient landscape watering and newvarieties of drought-tolerant plants can reducedemands for outdoor watering even further.
To meet these projected municipal needs, regionalwater planning groups have recommended abroad range of water management strategies andcapital infrastructure projects as part of the 2017state water planning process. Results from ouranalysis show that outdoor watering ordinancescan potentially generate enough savings to fulfillmuch of these projected municipal water needs.However, the savings from water conservationprimarily benefit the water supply of thecommunity that the savings are realized in orcommunities that use that same water supply(such as a shared reservoir) and the distribution of savings may not match the distribution of needswithin the region. Water conservation savingsare generally not transferable across regions.In Regions B and D, for instance, savings fromrestrictions only represent 28 percent and 42 percent of future municipal needs, respectively,based on 2020 projections. Meanwhile, projectedwater savings in Regions I, K, and N are large

WATER CONSERVATION BY THE YARD | 21 | Projected StatewideWater Savings fromWatering Ordinances
enough on a regional basis to satisfy 2020 regionalmunicipal needs several times over. Although the dynamics driving projected future municipaldemands, supplies, and needs must be evaluatedon an individual water supplier basis, thiscomparison of water savings and future municipalwater needs underscores the importance ofoutdoor watering restrictions.
Savings from watering restrictions will only accrueto the degree that ordinances are adopted,followed, and enforced. Education andenforcement are key to realizing these watersavings. Without effective mechanisms in place, it isdifficult to ensure that restrictions are consistentlyenforced and residents understand the importanceof reducing their outdoor water usage. Successfulwatering ordinances specify watering days byaddress or according to the garbage collection
day, providing a clear mechanism for assessingcompliance. Additionally, to strengthen adherenceto the ordinance, fines can be imposed whenresidents do not follow their watering schedules.
Above all, cities must communicate a message thatis clear, consistent, and compelling. We all knowthat old habits die hard and altering wateringbehavior requires campaigns to re-educate thepublic. Ordinances, by themselves, only set thefoundation for outdoor water savings. The greatestoutdoor water conservation savings are achievedwhen homeowners are educated not only aboutproper irrigation practices, but also on irrigationsystem maintenance and sound landscapemanagement practices. The best way to transformoutdoor water use habits is by developing robusteducational campaigns and providing easy accessto online information, resources, and tools. Public
TABLE 7: PROJECTED MUNICIPAL SAVINGS BASED ON 2017 STATE WATER PLAN MUNICIPAL DEMANDS
Region
2020 Planning Decade 2040 Planning Decade 2070 Planning Decade
Municipal Demand(acre-feet/year)
Water Savings (acre-feet/year) Municipal Demand
(acre-feet/year)
Water Savings (acre-feet/year) Municipal Demand
(acre-feet/year)
Water Savings (acre-feet/year)
LOW HIGH LOW HIGH LOW HIGH
A 91,637 6,415 10,080 98,792 7,440 11,691 133,572 9,350 14,693
B 32,563 651 2,279 32,784 656 2,296 33,827 677 2,368
C 1,481,530 103,707 162,968 1,675,385 132,631 208,419 2,594,833 181,638 285,432
D 134,310 2,686 9,402 142,631 3,051 10,678 208,132 4,163 14,569
E 141,818 4,964 12,055 156,499 5,971 14,501 215,923 7,557 18,353
F 141,454 9,902 15,560 151,070 11,229 17,646 193,585 13,551 21,294
G 403,094 14,108 34,263 450,798 17,615 42,779 693,829 24,284 58,975
H 1,257,276 25,146 88,009 1,377,892 29,838 104,432 1,893,397 37,868 132,538
I 188,646 6,603 16,035 196,302 7,145 17,353 239,607 8,386 20,367
J 25,567 895 2,173 26,874 978 2,376 31,315 1,096 2,662
K 306,560 10,730 26,058 359,194 14,412 35,000 558,949 19,563 47,511
L 469,065 16,417 39,871 526,806 20,385 49,506 754,306 26,401 64,116
M 311,591 10,906 26,485 368,997 14,966 36,347 612,127 21,424 52,031
N 112,081 2,242 7,846 117,701 2,421 8,475 128,510 2,570 8,996
O 94,753 6,633 10,423 101,434 7,575 11,903 132,718 9,290 14,599
P 7,997 160 560 7,984 159 556 8,088 162 566
TOTAL 5,199,942 222,163 464,066 5,791,143 276,471 573,957 8,432,718 367,981 759,069
Table 7: Projected annual municipal savings from outdoor watering restrictions in 2020, 2040, 2070. Estimated savings arecalculated based on projected future municipal demands, as presented in the 2017 State Water Plan (TWDB, 2017).

WATER CONSERVATION BY THE YARD | 22 | Projected StatewideWater Savings fromWatering Ordinances
awareness and education are essential toreinforcing homeownersÕ understanding of wateruse behaviors and the importance of conservingwater (Quesnel and Ajami 2017).
Reductions in outdoor usage from wateringrestrictions serve to not only extend availablewater supplies, but also drive down peak summerdemands. The system capacity required fortreating and conveying water is determined bysummer ÒpeakÓ water use, which is driven, in largepart, by outdoor watering. When water resourcesare limited or a system is nearing peak capacity,conservation measures targeting outdoor waterusage offer more than just water savings.Enhanced efficiencies can easily translate into cost savings by delaying expensive infrastructure
projects and upgrades that would otherwise beneeded to accommodate growing demand. Unlikemany supply- and demand-side managementstrategies, watering ordinances cost utilities very little to implement. Hence, these ordinancesrepresent one of the most cost-effective strategiesfor reducing outdoor water usage now andensuring municipal demands are adequately metdown the road.
The two sections that follow elaborate on keycomponents of effective watering ordinances aswell as other opportunities to promote outdoorwater savings.
TABLE 8: PROJECTED MUNICIPAL SAVINGS AS A PERCENTAGE OF 2017 STATE WATER PLAN MUNICIPAL NEEDS
Region
2020 Planning Decade 2040 Planning Decade 2070 Planning Decade
Municipal Needs(acre-feet/year)
Water Savings as a Percent of Needs Municipal Needs
(acre-feet/year)
Water Savings as a Percent of Needs Municipal Needs
(acre-feet/year)
Water Savings as a Percent of Needs
LOW HIGH LOW HIGH LOW HIGH
A 10,074 64% 100% 38,521 19% 30% 81,559 11% 18%
B 8,060 8% 28% 9,092 7% 25% 10,848 6% 22%
C 106,718 97% > 100% 539,183 25% 39% 1,227,956 15% 23%
D 22,341 12% 42% 29,850 10% 36% 51,390 8% 28%
E 5,623 88% > 100% 14,734 41% 98% 58,011 13% 32%
F 36,262 27% 43% 56,120 20% 31% 88,349 15% 24%
G 32,314 44% 106% 102,132 17% 42% 259,402 9% 23%
H 141,908 18% 62% 420,866 7% 25% 760,957 5% 17%
I 121 > 100% > 100% 1,476 > 100% > 100% 13,629 62% > 100%
J 3,462 26% 63% 3,925 25% 61% 4,228 26% 63%
K 7,881 > 100% > 100% 45,883 31% 76% 182,173 11% 26%
L 72,636 23% 55% 148,627 14% 33% 304,164 9% 21%
M 48,534 22% 55% 132,173 11% 27% 312,410 7% 17%
N 1,583 > 100% > 100% 1,567 > 100% > 100% 1,683 > 100% > 100%
O 13,233 50% 79% 30,937 24% 38% 56,371 16% 26%
P 0 - - 0 - - 0 - -
TOTAL 510,750 43% 91% 1,575,086 18% 36% 3,413,130 11% 22%
Table 8: A comparison of projected municipal needs in 2020, 2040, and 2070, as defined in the 2017 State Water Plan (TWDB, 2017)and the estimated savings from implementation of no more than twice per week watering restrictions by regional planning areas.Estimated savings are divided by projected municipal needs to demonstrate the extent to which potential savings from wateringrestrictions could satisfy these municipal needs. There are no projected municipal needs for Region P.

WATER CONSERVATION BY THE YARD | 23 | Designing & Implementing Watering Ordinances
DESIGNING & IMPLEMENTINGWATERING ORDINANCESStrong watering rules or ordinances governing outdoor water use start by limiting outdoorirrigation to either no more than one or two days per week. Again, no more than twice perweek watering restrictions represent the minimum standard Texas municipalities shouldadopt. In many parts of the state, climate conditions and landscape watering requirementscall for minimal watering during much of the year, so no more than once per week wateringrestrictions are highly recommended.
In addition to limiting the number ofdays residents can water their lawn,effective ordinances restrict thetime of day watering can occur —usually before 10:00 a.m. andafter 7:00 p.m. The purpose ofthese restrictions is to preventwatering during the hottestand windiest part of the day,when much of the water islost directly to evaporation.Watering ordinances may also restrict watering duringprecipitation or freeze events.These rules tend to prohibit waterwaste — such as leaks and excessiverunoff or watering of sidewalks or otherimpervious surfaces — and may limit thelength of time a sprinkler station can run per cycleand number of cycles per day. Some cities havedecided to differentiate the spring/summer growingseason from a fall/winter dormant season byspecifying that no more than twice per weekwatering may occur during Daylight Savings Time(from March through October) and no more thanonce per week watering may occur the rest of theyear. As discussed in the case study for the Cityof Austin, some cities limit landscape watering tono more than once per week during any season.
In order to enhance compliance with wateringrestrictions, it is important to develop requirementsthat are readily enforceable. Florida, for example,enforces watering ordinances irrespective of thesource of water (i.e., private well versus municipalwater supply), a practice different from what isoccurring in some Texas cities where homeownersare tapping private wells to circumvent watering
restrictions. An outdoor wateringordinance could include some or all of these concepts.
When designing a wateringrestriction ordinance,municipalities need toconsider the possibility ofincreasing the ÒcoincidenceÓof watering — when outdoorwatering occurs on just a fewdays rather than being spreadout across the week. Thisincrease in peak demand —
measured by either the peak dayor peak hour — can create problems
for the distribution system, loweringpressure and possibly draining storage
tanks (if supply cannot keep pace with demand).Thus, when developing a watering schedule, citiesshould carefully consider how different groups ofcustomers watering on certain days of the weekwill impact peak demand. This schedule needs tobe easily communicated to, and understood by,customers, and easily enforced by water utilitystaff or law enforcement.
Below is a sample watering ordinance thatincludes time-of-year, day-of-week, and time-of-day provisions, as well as language to addresswater runoff, maximum irrigation applicationrates, and freezing conditions.
In addition to watering ordinances, municipalitiesshould adopt requirements that irrigation systemsmust be inspected at the same time as initialbackflow preventer inspection and periodicallythereafter, and that prohibit the operation of poorlymaintained sprinkler systems that waste water.

WATER CONSERVATION BY THE YARD | 24 | Designing & Implementing Watering Ordinances
1. The use of an automatic irrigation system and hose-end sprinklers is restricted to the followingoutdoor water use schedule:
a. Residential property ending in an odd number may be irrigated on Wednesday and/orSaturday, but no other day of the week without an approved variance from the City;
b. Residential property ending in an even number may be irrigated on Thursday and/or Sunday,but no other day of the week without an approved variance from the City;
c. Non-residential property (commercial and multi-family) may be irrigated on Tuesday and/orFriday, but no other day of the week without an approved variance from the City;
d. There shall be no irrigation, except by means of a handheld hose, drip irrigation, or soakerhoses on Monday.
2. The outdoor water use schedule set forth above shall be effective year-round.
3. A person may not irrigate outdoors at a residential property or a non-residential propertybetween the hours of 10:00 a.m. and 7:00 p.m., even if the irrigation occurs on a designatedoutdoor water use day for the location.
4. No more than 1 inch of water may be applied per irrigation zone on each day that irrigationoccurs, and in no event shall irrigation occur for more than 1 hour per irrigation zone on eachday that irrigation occurs.
5. No outdoor watering of landscapes is allowed during precipitation events or whentemperatures are below 40¡F.
6. It is unlawful for any person to waste water through use that serves no practical purpose. The following types of water waste are prohibited:
a. Failure to repair a controllable leak, including but not limited to a broken sprinkler head, a broken pipe, or a leaking valve;
b. Operation of an irrigation system with a broken head; a head that is out of adjustment and the arc of the spray head is over a street, parking area, or other impervious surface; or a headthat is misting because of high water pressure;
c. Allowing water to flow during irrigation that runs, flows, or streams in a way that extends into a street, parking area, or other impervious surface for a distance of 50 feet or greater; or allows water to pond at a depth greater than 0.25 inch in a street, parking area, or on otherimpervious surfaces.
A MODEL OUTDOOR WATERING ORDINANCE
Not all public water systems in Texas have theauthority to enact watering ordinances, however.Only municipalities and utility districts currentlyhave clear regulatory authority to adopt wateringordinances, whereas investor-owned utilities andwater supply corporations may be limited in theirability to enact mandatory, year-round wateringrestrictions. In some instances, though, wholesalecustomers may be required under contractual
agreement to impose similar restrictions as theirwholesale provider.
Of the total estimated savings calculated in theprevious section, approximately 26 percent areattributable to municipalities with landscapewatering restrictions and some level ofenforcement and education already in place.However, improved implementation efforts maybe required to achieve the projected savings. The

WATER CONSERVATION BY THE YARD | 25 | Designing & Implementing Watering Ordinances
remaining savings are projected to come frompublic water systems that do not currently haverestrictions. Approximately 10 percent of theremaining water savings, however, are tied toutilities that do not currently have clear authorityto impose and enforce watering ordinances.
Case Studies
The Woodlands
¥ Population:100,073
¥ Regional WaterPlanning Group:Region H
¥ Household Outdoor Demand:68 gallons per day
¥ Water Customers:96% single-family residential, 1% multi-familyresidential, 3% commercial/industrial/institutional
Utilities with regulatoryauthority / without restrictions
Utilities currentlywith restrictionsin place
Utilities withoutregulatory authority /without restrictions
10%26%
64%
The Woodlands designed a policy to help forestalla pending water crisis in the township, as well asother parts of Montgomery County. Instituted in2013 and updated the year after, the WoodlandsJoint Powers AgencyÕs Policy Number ENF-60restricts outdoor watering for private residences,businesses, churches, and all other publicproperties to twice a week. Addresses ending in an odd number are permitted to water from8:00pm on Fridays to 6:00am on Saturdays, and from 8:00pm on Tuesdays to 6:00am on
Wednesdays. Addresses ending with an evennumber are allowed to water from 8:00pm onSaturdays to 6:00am on Sundays, and from8:00pm on Wednesdays to 6:00am on Thursdays.
The ordinance, which is enforced year-round, mayallow for variances to be granted in extenuatingcircumstances. To enforce the ordinance,inspectors with cameras patrol neighborhoods and issue notices to those who are in violation of the schedule. Time and date-stamped photosare taken to confirm the violation. If the resident or occupant is on the property at the time of theobservation, the notice will be given to them. If not,a notice will be hung on the front door, in additionto information about best practices for lawn care.An initial violation will result in the provision of a warning notice. A second violation will result in a $50 surcharge, while a third violation will resultin a $100 surcharge. A fourth and any subsequentviolations will result in a $200 surcharge. Allsurcharges will be added to a resident/occupantÕswater bill within 20 days of a violation notice,unless the resident/occupant appeals thesurcharge within 15 days of the violation notice. �
FIGURE 4: SHARE OF ESTIMATED WATER SAVINGSBY UTILITY TYPE
Figure 4: Share of estimated savings: utilities with restrictionsalready in place; utilities without restrictions in place, but withthe authority to impose them; and utilities without restrictionsin place, but without current clear authority to impose them.
Of the total estimated savingscalculated in the previous section,
approximately 26 percent are attributable to municipalities
with landscape watering restrictions and some level of enforcement and education already in place.
However, improved implementationefforts may be required to achieve
the projected savings.

WATER CONSERVATION BY THE YARD | 26 | Designing & Implementing Watering Ordinances
Effective as of May 2015, the City of FriscoÕs WaterEfficiency Plan with Best Management Practiceshas instituted year-round and seasonal restrictionsto help better manage local water resources.Throughout the year, water runoff flowing awayfrom property, watering of impervious surfacessuch as streets, parking lots, alleys, and driveways;watering during precipitation or at temperaturesbelow 40¡ F, and the use of leaking or damagedirrigation systems are prohibited.
FriscoÕs annual spring and summer wateringschedule is in effect through the duration ofDaylight Saving Time. Watering is permitting once a week on a residentÕs trash pickup day, before10:00am and after 6:00pm. These watering timeshave been adopted to reduce water waste duringthe heat of the day to evaporation and high winds.
Hand watering and watering with bubblers or dripirrigation systems for up to 2 hours on any day.Watering is allowed on a second day, with the sametime of day restrictions, only if the City determinesits weather station data indicate the need foradditional watering. First-time violations receive adoor-hanger with a $50 administrative fee includedon the next available water bill. This violation canbe waived with the completion of a free sprinklersystem checkup. A $100.00 fee will be applied forthe second violation, and a $200 fee for the thirdviolation. Further violations will include the issuanceof a citation, which could potentially mean adisconnection of the violatorÕs sprinkler system.
During the Fall and Winter, Frisco permits onceper week watering on the residential trash pickupday. Time-of-day watering restrictions are relaxedduring Central Standard Time. During this periodof time, watering is prohibited during precipitationor temperatures colder than 40¡ F in order toprevent freezing conditions on sidewalks andstreets. Over-seeding and watering cool seasongrasses are also prohibited. The financial penaltiesfor violations during fall and winter are the sameas those during spring and summer.
Year-round, violations can be submitted using the City of FriscoÕs online water waste report form, and are also observed by Public Worksemployees, who conduct random patrols throughneighborhoods. These instances are documentedby electronic photographs and filed for review. �
Frisco
¥ Population:156,957
¥ Regional Water Planning Group:Region C
¥ Household Outdoor Demand:66 gallons per day
¥ Water Customers:76% single-family residential, 15% multi-familyresidential, 9% commercial/industrial/institutional

WATER CONSERVATION BY THE YARD | 27 | Designing & Implementing Watering Ordinances
Watering Ordinance AdoptionThere are currently no state statutes that expresslyrequire Texas cities to implement outdoor wateringrestrictions. However, the Texas Water Code doesrequire that water suppliers seeking to authorize atransfer of surface from one river basin to anothermust implement the highest practicable levels of water conservation and efficiency achievable,which, under any reasonable definition, wouldinclude outdoor watering restrictions. Absent suchan interbasin transfer, Texas communities thathave already implemented no more than twice per week watering restrictions, or more stringentrequirements, have done so on their own initiativebecause they saw the value of these restrictions asmore than just a temporary response to drought.There can be no question that outdoor water userepresents a huge opportunity for water savings,and as the findings of this report indicate, asignificant share of these savings could comefrom outdoor watering restrictions, alone.
Successful adoption of watering ordinancesrequires widespread support, and the first step
in this process is to demonstrate the value ofrestrictions and the opportunities for watersavings. Garnering the support of key city decision-makers and the general public for the adoption ofno more than twice per week watering restrictionsbegins with education and awareness.
To lay the foundation for these efforts,communities can take a closer look at outdoorwater use in their service territory and determinehow much water each municipal use categoryconsumes for outdoor purposes. Conductingcustomer surveys to assess the prevalence ofautomated irrigation systems, landscapingpreferences, and irrigation scheduling can alsoprovide valuable insight into opportunities forreducing outdoor water use. Information gatheredfrom the end use analysis and customer surveyscan be reported back to city board members andthe general public as a call to action for curbingoutdoor water use. This insight can also beincorporated into educational campaigns to help broaden public awareness around efficientoutdoor watering practices.
Effective in January 2017, the City of Lubbockmade the year-round water restrictions in placefor the last 10 years permanent. The restrictionsutilize a twice-per-week watering schedule. Underthese permanent watering restrictions, propertieswith an address ending in 0, 3, 4 or 9 may wateron Monday and Thursday, properties with anaddress ending in 1, 5 or 6 may water on Tuesdayand Friday, and properties with an address endingin 2, 7 or 8 may water on Wednesday and Saturday.No landscape irrigation is allowed on Sundays,
during precipitation events, and when thetemperature is below 35¡F. Hand watering forlandscape irrigation purposes is allowed on a dailybasis regardless of the time of year and regardlessof the time during the day. There are also seasonalpermanent restrictions to be observed in thesummer and winter. Summer restrictions from Apriluntil October donÕt allow irrigation from 10 a.m.until 6 p.m. and allow only up to 1.5 inches perweek. The winter restrictions state that wateringmust be kept to under 1 inch per week. LikeCollege Station and New Braunfels, Lubbock alsouses multi-stage restriction process in the eventdemand exceeds certain amounts of the cityÕscapacity. Stage 1 drought restrictions are similar to the permanent water conservation measures,except watering is only permitted from 9:00pm to9:00am. Stage 2 drought restrictions continue theprevious stage, but limit watering to once a weekbetween 9:00pm and 9:00am. Stage 3 droughtrestrictions go further by limiting watering to onceper month and prohibit filling up pools. Stage 4emergency restrictions prohibit all landscapeirrigation and flushing fire hydrants, while callingfor reduced water system pressure. �
Lubbock
¥ Population:248,640
¥ Regional Water Planning Group:Llano Estacado Region O
¥ Household Outdoor Demand:84 gallons per day
¥ Water Customers:67% single-family residential, 26% multi-familyresidential, 7% commercial/industrial/institutional

WATER CONSERVATION BY THE YARD | 28 | Designing & Implementing Watering Ordinances
The next step is to create opportunities forengaging the public and conveying the importanceof watering restrictions to city-wide conservationobjectives. Cities can build on these efforts bydeveloping a strategic approach to the design andimplementation of watering ordinances. Dependingon local context and needs, cities will have tocarefully determine whether no more than twiceper week or no more than once per week wateringrestrictions are best for their community. Even after watering ordinances have been adopted and implemented, cities can leverage the successof these efforts to refine their approach to outdoorwater use — for instance, a city may decide later onthat its twice per week watering ordinance shouldbe replaced with once per week restrictions.Measuring the overall effectiveness of wateringrestrictions — in terms of both water savings and public compliance — is, therefore, a crucialcomponent of the implementation process. Inaddition, offering education resources on the abilityof well-adapted landscapes to flourish with limitedsupplemental watering is equally important.
Watering OrdinanceImplementationAdmittedly, there are several challenges toestablishing effective ordinances. Ensuringadequate education/outreach, establishingappropriate watering schedules, and creatingeffective enforcement mechanisms represent themost significant challenges to implementation.
Ensuring Adequate Education and Outreach
An important aspect of implementation involveseducating residents on the need for, and value of,outdoor water use restrictions and properirrigation practices. Without community-widesupport, it will be difficult to ensure ongoingcompliance with the ordinance. Wateringrestrictions alone do not guarantee residentsapply the correct amount of water at the correcttime, so educating them on proper landscapewatering requirements is critical to the successfulimplementation of these ordinances. Througheducation, outreach, and Community-Based SocialMarketing (CBSM) programs, cities can encourageresidents to adopt water-saving irrigation andlandscaping practices with the goal of drivingbehavioral change. Effective programs focus on
removing the barriers that prevent the adoption of certain behaviors and enhancing the benefits of those behaviors (Ontario Water WorksAssociation, 2008). By approaching thesechallenges from customerÕs point-of-view, theseeducational efforts can better address their needsand help them better understand the benefits ofchanging their outdoor water use patterns.
Municipalities can utilize a variety of outlets todisseminate their message and broaden theimpact of their outreach efforts. This can includepartnering with local plant nurseries and gardencenters to share information about water-efficientirrigation practices and proper landscape wateringrequirements. Homeowners typically do not viewtheir municipalities as experts in landscaping andirrigation, but they do consider plant nurseries andgarden centers trusted advisorsÕ they can look to for this information (Ontario Water WorksAssociation, 2008). Cities can also send routinewatering recommendations and tips to theircustomers. The City of Frisco, for instance, offersweekly watering advice based on data from the cityÕs weather station, which is emailed to residents every Monday as part of the cityÕsWaterWise Newsletter campaign. Many of theseeducation, outreach, and CBSM programs targetcustomers community-wide, but in some instances,these programs can be more effective if theyspecifically target residents with high outdoorirrigation demands.
A recent study on the relationship between
single-family household behavioral change
and public awareness revealed that widespread
news media coverage of water- and drought-
related issues played a key factor in
reducing household water use.
A recent study on the relationship between single-family household behavioral change and publicawareness revealed that widespread news mediacoverage of water- and drought-related issuesplayed a key factor in reducing household wateruse (Quesnel and Ajami, 2017). During times ofdrought, the publicity generated by heighted newsmedia coverage helped encourage residents tochange their short-term watering behaviors. Overthe long-term, public education programs and

WATER CONSERVATION BY THE YARD | 29 | Designing & Implementing Watering Ordinances
outreach campaigns are essential to sustainingpermanent behavioral changes. Consistentmessaging is equally important for ensuringcompliance with outdoor watering restrictions.
To help ensure ample and effective education and outreach efforts, cities can incorporate thefollowing solutions in tandem with adoptingoutdoor watering restrictions.
on proper landscape watering needs is key toovercoming this drawback and capturing greaterwater savings.
Another aspect of watering schedules cities mustconsider is the differentiation between watering byhand, by hose-sprinkler, and by automatic irrigationsystem. When developing a schedule, it is importantto clarify which methods of watering the restrictionapplies to, whether it is solely automatic irrigation or if it also includes hand-held hoses and hose-endsprinklers. For instance, the City of Austin limitsoutdoor watering by an automatic irrigation systemto one day per week, whereas the use of a hose-endsprinkler is allowed up to two days per week andthe use of a hand-held hose is allowed any day of the week. Over-watering can occur under any of these circumstances, but the leading assumptionis that households with automatic irrigation systemsuse far more water outdoors than those withoutirrigation systems, so stricter limitations shouldbe placed on this method of outdoor watering.
Establishing an effective watering schedule requirescareful consideration of outdoor water usagepatterns across all municipal water users. Becauseoutdoor water usage patterns and preferences varyby community, insight into customer behaviors canhelp cities determine the best strategy for assigningwatering days and how to go about limiting eachmethod of watering. It is also important to evaluatewhat impact, if any, the proposed watering schedulewould have on system capacity, including bothpeak hourly demand and peak daily demand.
The table below outlines specific solutions foraddressing these implementation challenges.
WATERING SCHEDULE
Issue Solutions
Establishingan
appropriatewateringschedule
¥ Assess outdoor water usage patternsacross each municipal user category
¥ Evaluate the effectiveness of differenttypes of watering schedules (e.g., odd/even addresses) based onsystem thresholds to determine anyimpact on water system operationsand peak demand
¥ Engage with the general public andkey stakeholders to solicit feedbackon the proposed watering schedule
¥ After implementation, monitor waterusage to ensure peak demand issuesdo not arise
EDUCATION & OUTREACH
Issue Solutions
Ensuringadequateeducation
andoutreach
¥ Implement Community-Based SocialMarketing Programs
¥ Quantify savings from outdoorwatering restrictions and reportinformation back to the public
¥ Provide ongoing, consistent messagingcampaigns
¥ Promote educational opportunities,both internally and externally (e.g., atlocal nurseries and garden centers)
¥ Team with educational institutions to offer information-based tools to residents
¥ Engage local media to broaden reachof the message
Establishing an Appropriate Watering Schedule
Another consideration in implementing a wateringordinance involves selecting a watering schedule.The concept of once or twice per week wateringrestrictions is supported by a widely-held standardthat watering deeply only once or twice a week is more effective in maintaining lawn healthcompared to frequent shallow watering becausedeep watering promotes deep root growth(Ontario Water Works Association, 2008).Approaches to developing watering schedules can vary, but the most common is to designatewatering days based on odd- and even-numberedaddresses. These types of watering restrictionsassign watering days to residential and commercialproperties based on whether their address is even or odd. Other types of watering schedulesdesignate watering days according to garbagepickup day or to different municipality areas/subdivisions. A disadvantage of these approaches,however, is that they can inadvertently encouragepeople to over-water on their designated day,even if conditions do not call for supplementalwatering (Dukes et al, 2017). Educating residents

WATER CONSERVATION BY THE YARD | 30 | Designing & Implementing Watering Ordinances
Ensuring Effective Enforceability and Enforcement
Without an effective enforcement mechanism in place, it can be difficult to ensure residents areproperly adhering to watering restrictions. Studieshave shown that lack of enforceability oftenhinders the effectiveness of water conservationmeasures (Whitcomb, 2006). Enforceability can be enhanced by designating specific daysresidents can water their lawn, either according to their address or to garbage pickup day. Withthis strategy, it is easier to identify properties thatare not complying with the restriction.
Communities often lack sufficient budget and staff resources to thoroughly enforce wateringrestrictions. In most instances, cities rely upontheir constituents to report watering violations.The City of Fort Worth, for example, allows itsresidents to report water waste both online via its website and on their smartphone via theMyFtWorth app. This reporting mechanism helpscities create stronger customer connections bygiving them an opportunity to both engage withresidents and to educate them on what the cityÕswatering ordinance does and does not allow.
Upon receiving a report of water waste, citiestypically issue a warning for first-time violations —however, in cities like Austin and Frisco, they canincur a fee of $25 to $50. Fines increase for eachsubsequent offense, and after the third violation,cities often reserve the right to issue a citation.Another enforcement strategy established by the City of Fort Worth is to lock out in-groundirrigation systems. With this approach, the cityphysically impedes outdoor watering by placing a locking device on either the backflow device of a single-family residential irrigation system or the irrigation meter on a commercial or multi-family property.
COMPLIANCE & ENFORCEMENT
Issue Solutions
Ensuringeffective
enforceabilityand
enforcement
¥ Establish an appropriate feeschedule for watering ordinanceviolations
¥ Provide residents with an easilyaccessible method for reportingwater violations (online form,hotline, web app)
¥ Amplify education and publicoutreach efforts to help ensureresidents are aware of outdoorwatering restrictions
To help beef up enforcement efforts, cities canalso send more staff out into the field to patrol forpotential watering violations. It is more commonfor cities to employ this strategy during times ofdrought, when there is a greater urgency to scaleback outdoor watering. In the past, the City ofDallas has enlisted its code enforcement officersto do this. This strategy primarily serves as anextension of community outreach efforts becausethe primary intent is to warn residents who maynot have been aware that their outdoor wateringpractices violated city code. Whether it is aresident not knowing that watering restrictionsexist or a resident not knowing what the properwatering requirements are for their landscape, lack of information is a key contributor to excessiveoutdoor water use. Regardless of droughtconditions, education and increased awarenessrepresent essential strategies for enhancinglimited enforcement capabilities at all times.
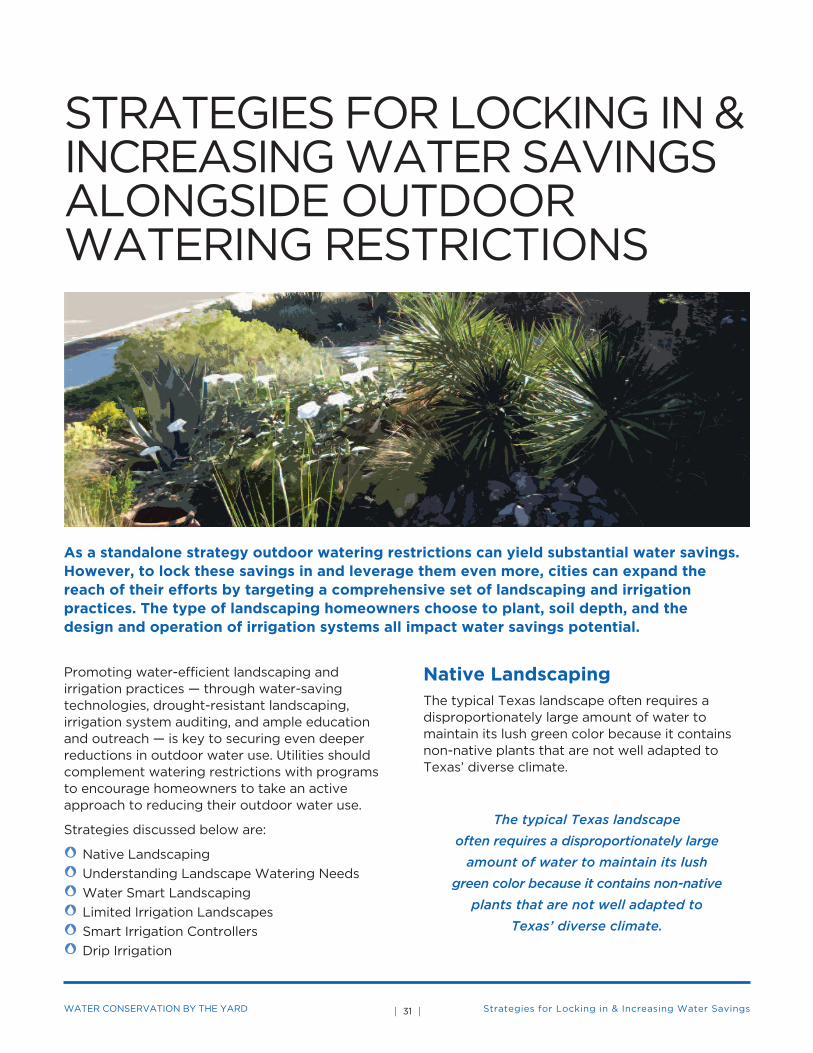
WATER CONSERVATION BY THE YARD | 31 | Strategies for Locking in & Increasing Water Savings
STRATEGIES FOR LOCKING IN &INCREASING WATER SAVINGSALONGSIDE OUTDOORWATERING RESTRICTIONS
As a standalone strategy outdoor watering restrictions can yield substantial water savings.However, to lock these savings in and leverage them even more, cities can expand thereach of their efforts by targeting a comprehensive set of landscaping and irrigationpractices. The type of landscaping homeowners choose to plant, soil depth, and the design and operation of irrigation systems all impact water savings potential.
Promoting water-efficient landscaping andirrigation practices — through water-savingtechnologies, drought-resistant landscaping,irrigation system auditing, and ample educationand outreach — is key to securing even deeperreductions in outdoor water use. Utilities shouldcomplement watering restrictions with programsto encourage homeowners to take an activeapproach to reducing their outdoor water use.
Strategies discussed below are:
G Native Landscaping
G Understanding Landscape Watering Needs
G Water Smart Landscaping
G Limited Irrigation Landscapes
G Smart Irrigation Controllers
G Drip Irrigation
Native LandscapingThe typical Texas landscape often requires adisproportionately large amount of water tomaintain its lush green color because it containsnon-native plants that are not well adapted toTexasÕ diverse climate.
The typical Texas landscape
often requires a disproportionately large
amount of water to maintain its lush
green color because it contains non-native
plants that are not well adapted to
TexasÕ diverse climate.

WATER CONSERVATION BY THE YARD | 32 | Strategies for Locking in & Increasing Water Savings
Ideally, residential landscapes would containplants well adapted to the local region, forexample, plants should be selected based on theirtolerance to local temperature ranges and naturalwater availability. For many reasons — aesthetic,cultural, lack of selection or availability, personalpreference — our planted landscapes are often ill-suited to TexasÕ regional climates. The advent of in-ground irrigation systems has made it mucheasier to use water in this unsustainable pattern,resulting in increased landscape water use. Duringtimes of average or below- average rainfall,drought, or just the heat of the Texas summer, we often supplement rainfall by irrigation systemsto keep our yards uniformly green. Non-nativeplants, especially poorly adapted turf grasses, tend to require more water to keep them lookingaesthetically pleasing during the growing seasonthan native plants. A growing body of evidencesuggests that even these poorly adaptedlandscapes could get by with a lot less waterthan is typically applied, especially if plants arewell-established in adequate soil.
If there is at least six inches of soil, once a weekwatering is sufficient to maintain a lawnÕsappearance in Texas (Finch, 2014). Twice perweek watering will replenish moisture if soil isshallower than six inches. During severe droughts,watering a lawn with St. Augustine grass on sixinches of soil once every two weeks will provideenough water for it to survive (Finch, 2014). Moredrought-tolerant turf varieties such as Bermuda,buffalo, and zoysia can go even longer withoutwater because they can enter a dormant-like state.Native flowering plants, shrubs, and trees areadapted to long stretches without water.
The City of Georgetown
In 2014, the City of Georgetown updated itscity code pertaining to residential landscaping.As part of this update, new residentialdevelopments are required to have a soildepth of at least six inches. Additionally,developers must choose new plant materials(excluding lawn/turf grasses) from a list of preferred plants provided by the city.
Understanding LandscapeWatering NeedsEven in Texas, with our hot and dry summers,landscapes only need about an inch of water per week, whether from rain or from irrigation.It is important to keep in mind, however, that the amount of water a specific landscape needsdepends on a variety of factors: plant selection,soil depth, day-to-day weather variability, and the effectiveness of different types of irrigationtechnologies. Because so many factors go intodetermining watering requirements, overwateringfrequently occurs. In Florida, a study revealed thathomeowners over-watered by as much as 2-3 timesthe amount needed by plants when compared toclimate-based estimates of recommended waterreplenishment (Hayley et al., 2007). This studyalso reported that although homeowners usedsignificantly less water in the winter months, when plant water requirements are at a minimum,they are still prone to over-irrigate. Multiplestudies show that at least some segment of the population overwaters and some of thoseover-irrigators overwater by a very large margin(e.g., De Oreo, 2011).
Even in Texas, with our hot and dry summers,
landscapes only need about an inch of water
per week, whether from rain or from irrigation.
It is important to keep in mind, however,
that the amount of water a specific landscape
needs depends on a variety of factors:
plant selection, soil depth, day-to-day weather
variability, and the effectiveness of different
types of irrigation technologies.
A study conducted by Texas A&M University inCollege Station found that replacing 70 percent of the water lost to evapotranspiration, through acombination of rainfall and supplemental watering,was sufficient to maintain landscape quality duringthe summer months (White et al., 2004). Similarconclusions have been reached in other studies(e.g. Aquacraft, 2006). It is possible to estimateirrigation needs based on knowledge of how muchwater different plants lose to the atmosphere

WATER CONSERVATION BY THE YARD | 33 | Strategies for Locking in & Increasing Water Savings
(i.e., transpiration) and how much water is lostfrom the soil surface via evaporation underdifferent climatic conditions.
Texas A&MÕs Water-My-Yard Program
Most homeowners do not have the time orexpertise to incorporate evapotranspirationdata into their daily watering schedules, so to help them, Texas A&M created the Water-My-Yard Program. Through this free program,homeowners can access an online tool thathelps them determine the exact amount ofwater needed to properly water their lawn.Once a homeowner enters their address in theportal, it only takes a few short steps to beginreceiving automated emails or text-messageswith information about how much water their landscape requires based on localweather conditions. The online portal takesotherwise inaccessible data and presents it tohomeowners in an easy to understand mannerthat can instantly translate into water savings.
The City of Frisco, Texas, uses a weather stationand rain gauges to provide residents with weeklywatering recommendations based on climateconditions. In 2010, the city advised residents thatlawns did not need any supplemental irrigation 25 weeks out of the year (TRWD, 2014). For theremainder of the year, the city only recommendedwatering more than once per week during threeweeks. Even during the record drought of year2011, the city recommended watering twice perweek during 11 weeks and once per week wateringduring eight weeks. Mother Nature providedsufficient rainfall for landscaping, without anysupplemental watering, the remaining 33 weeks.
Landscape plant growth in Texas is minimalbetween November and April (White et al., 2004)and plants need very little, if any, supplementalwater due to the combination of cool temperatures,periodic rainfall (most years), and plants beingdormant or otherwise growing very slowly. During a drought, turf might benefit from a little supplemental watering, but a monthlyapplication of one-half inch would be sufficient(ÒWinter lawn watering,Ó 2009).
Water Smart LandscapingThe greatest savings in outdoor water conservationwill likely come from landscape conversions toÒwater smart landscapingÓ (i.e., landscaping andgardening that substantially reduce or eliminate theneed for supplemental water). Such landscapingemphasizes native plants that are well adapted to the prevailing climate.
With its arid and hot climate and ever-decliningwater supply, Nevada has been very aggressive inbanning turf in new developments and subsidizingthe conversion of existing high water-demandingplantings to desert-adapted landscapes. A studyconducted by Aquacraft (2000) documented areduction of nearly 40 percent in outdoor wateruse associated with landscape conversions totypes that were suited to the Nevada climate.Follow-up research by the Southern NevadaWater Authority has shown that for every 10customers that convert turf to a Water SmartLandscape, one will have no water savings, onewill have increased water usage, and eight willsave water. Overall, they have documentedannual savings of 55 gallons per square footconverted (Bickmore and Francis, 2014). InSouthern California, a turf conversion program of the Metropolitan District yielded an 18 percentreduction in water use by participating single-family homes (Ramos, 2014).
Limiting-Irrigated LandscapesGeorgetown, Texas, adopted a comprehensivearray of irrigation measures in 2014 to reduceoutdoor usage. According to updated city code,new construction must meet the followingrequirements:
G Irrigated turf area of the lawn is limited to 2.5 times the foundation footprint area of thehouse or 10,000 square feet, whichever is less.The limit does not apply to non-irrigated spacesuch as natural areas or landscaped areas suchas flower beds that are irrigated with dripirrigation or bubblers. The limitation does notaffect the overall size of a residential yard.
G When a lot is developed, the irrigated turf areais required to have at least six inches of soil.Areas of a residential lot left in its natural stateare exempt from the soil depth requirement.

WATER CONSERVATION BY THE YARD | 34 | Strategies for Locking in & Increasing Water Savings
G Turf grass should be a variety that is dormantin the hot summer months and has less needfor water. Turf grasses, such as St. Augustine,that require more water can only be used inshady areas of a lawn.
Other elements of the ordinance includerequirements for rain sensors and soil moisturesensors on irrigation systems and the placement of irrigation spray heads at least four inches frompaved surfaces to reduce overspray. This type of proactive approach is helpful in making newdevelopment more water efficient. Many cities in Texas are growing and adding new housing at a rapid rate. Putting an ordinance in place thatprovides for efficient landscape watering from thebeginning is an important step in the right direction.
Landscape regulations for efficient irrigation thatapply to new development can be found in otherparts of the country. For example, Tampa Bay,Florida, limits turf with a permanent irrigationsystem to 50 percent of landscaped area (Hazenand Sawyer, 2005). Desert cities in Nevada, NewMexico, Arizona, and California have adoptedsimilar measures restricting the extent of irrigatedlandscaping and/or plant materials. In Texas, the City of Boerne has taken the step of limitingturf grasses planted at all new residential andcommercial development within the city limits to zoysia, buffalo, or Bermuda grasses or othergrasses approved by the city.
Smart Irrigation ControllersOur understanding of how to optimally irrigatelandscapes continues to advance. Newtechnologies such as ÒsmartÓ irrigation controllersand wireless soil-moisture sensors offer potentialefficiency improvements. Determining the leastamount of water that can be applied to maintainacceptable landscape appearance and health is the goal of a lot of current evapotranspiration (ET)research by agronomists, horticulturists, andlandscape experts. A number of studies haveemerged that demonstrate the water savings from smart irrigation controllers as this technologybecomes more popular. These studies highlight theoverall conservation savings that can be achievedas well as the reductions in peak outdoor demandsstemming from the application of smart controllers.
A 2009 study in Utah found that the majority ofoverwatering occurred at the end of the growingseason (August through October) when automatictimers on sprinkler systems had not been adjustedto lower ET requirements (Utah DNR, 2010). Evenduring the dormant season (November throughMarch) watering remains a common practice andgenerally equates to over-watering. ET-basedirrigation systems can be advantageous inmatching the quantity of water applied to a landscape to a scientifically-derived value.
G A 2016-2017 pilot program in Ohio showed thatsmart irrigation controllers can yield an averageof 12 percent in savings. Participants of the pilotwere divided into three cohorts (lower waterusers, medium water users, and higher waterusers) based on their average household use.The greatest savings potential was observed in the higher water user group, which saw asmuch as 21 percent in savings. This is becausehigh water users typically overwater theirlawns, but the smart irrigation controllers helpto ensure their landscaping receives moreappropriate amounts of water. The results of this study demonstrate the importance of targeting high water users for participation in smart irrigation controller pilot or rebateprograms. (AIQUEOUS, 2017)
G Smart irrigation controller technology hasalso been shown to be an effective strategyfor reducing demands during peak irrigationseason. As part of another pilot project, a New Jersey water supplier used centralizedremote control to shutoff the controllers of 15 participating households on days whereoutdoor demands were forecasted to peak.Results from this study revealed that smartirrigation controllers could reduce peakirrigation demands by as much as 10 milliongallons per day with 5,000 to 17,300participating households. Peak demand savingscan, in turn, translate to significant reductions in capital expenditures that would otherwise be necessary for expanding system capacity. As this study noted, the greatest barrier torealizing the depth of these savings is recruitingcustomers to participate in a large-scaledeployment of smart irrigation controllers.Targeted education and recruitment campaignscan, however, enhance participation levels.

WATER CONSERVATION BY THE YARD | 35 | Strategies for Locking in & Increasing Water Savings
Drip IrrigationDrip irrigation exceeds 90 percent efficiencycompared to conventional sprinkler systems thattypically range from 50 to 70 percent efficiency(Wilson and Bauer, 2014). Drip irrigation achieveshigher efficiency because water is delivered underlow pressure directly to plants and much moreslowly than with sprinkler irrigation. Water drippedto plants is not subject to loss from runoff, wind,and evaporation. It is ideal for sloping terrainwhere water is more likely to runoff before it can
penetrate the soil if applied via a spray system.Drip irrigation has the additional benefit of helpingto maintain a desirable balance of air and water inthe soil through its low-volume application ofwater, which facilitates even soil moisture andhealthy plant growth (Wilson and Bauer, 2014).But drip systems do not work well for lawnirrigation because of the difficulty of spreading thewater evenly. As with any irrigation system, properinstallation and maintenance are key to achievinghigh quality results, and it is possible to wastewater through over-irrigation with any system.
CONCLUSIONOverwatering of landscapes is a ubiquitousissue across the entire state, and the bestway to curb excessive outdoor water use is through more efficient landscape andirrigation practices. The bottom line: verysignificant savings could be achieved ifTexas cities adopt ordinances restrictingoutdoor watering to no more than twiceper week. Business as usual is not goodenough to meet TexasÕ long-term municipal water needs.
As our analysis of all 16 water planning regionsdemonstrates, as much as 460,000 acre-feet ofwater per year could be saved statewide throughwell-implemented no more than twice per weekwatering restrictions by 2020. The savings continueto increase as our population and water demandgrows, reaching a level of almost 760,000 acre-feetby 2070. We are confident that through robusteducation and enforcement efforts, these savingscan be realized, if not exceeded. Outdoor wateringrestrictions have always been the first line ofdefense for communities facing the short-termimpacts of drought on their local water supplies; it should be the new norm for Texas communitieswhether or not we are in drought.
Although none of us can be certain when the nextdrought will hit, we can all be certain that it will andthat water conservation will play an integral role insecuring our stateÕs future municipal water needs.As the state fluctuates along a climate spectrum of prolonged, severe droughts to intensive,
devastating rainfall events, landscape wateringrestrictions must become a permanent line of defense. Long-term measures to reducediscretionary, outdoor water usage includepermanent, year-round watering restrictions; robustpublic education efforts; use of native and droughttolerant landscapes; limitations on size of irrigatedareas; minimum top soil requirements in newdevelopment; and more. All of these measures are already being implemented by cities in Texas.The entire state can and should follow their lead.
Proactive, on-going conservation measuresrepresent the most cost-effective strategy forhelping to ensure we have adequate supplies of water to meet our growing demands in thedecades ahead. Regardless of whether the state isexperiencing drought or not, conservation will playan integral role in securing TexasÕ water future.Because savings from watering ordinances can be sustained in periods of non-drought too, it justmakes sense to make these measures permanent.

WATER CONSERVATION BY THE YARD | 36 | References
REFERENCESAIQUEOUS. 2017. A Smart Approach to SmartControllers: Plan, Do, Check, Act. Presented at AWWAFlorida Section, 2017 Fall Conference.
Aquacraft. 2000. Impacts of Xeriscape on Outdoor WaterUse: Data Logger Analysis Determining Water Usageof Maturing Xeriscape Landscapes — Phase II. Reportto Southern Nevada Water Authority. Retrieved fromhttp://www.allianceforwaterefficiency.org/WorkArea/linkit.aspx?ItemID=1246
Aquacraft. 2006. Post Drought Changes in ResidentialWater Use. Report to Denver Water.
Aquacraft. 2009. Evaluation of California Weather-based ÒSmartÓ Irrigation Controller Programs. Report to the California Department of Water Resources.Retrieved fromhttp://ucanr.edu/sites/UrbanHort/files/99641.pdf
Aquacraft. 2011a. California Single Family Water UseEfficiency Study, Volume 1. Report to CaliforniaDepartment of Water Resource. Retrieved fromhttp://www.aquacraft.com/wp-content/uploads/2015/10/Analysis-of-Water-Use-in-New-Single-Family-Homes.pdf
Aquacraft. 2011b. Analysis of Water Use in New Single-Family Homes. Report to Salt Lake City Corporation andU.S. EPA. Retrieved fromhttp://www.allianceforwaterefficiency.org/WorkArea/DownloadAsset.aspx?id=6020
Bickmore, T. and H. Francis. 2014. The Non-Savers: AnEvaluation of Turf Conversion Properties That DonÕt SaveWater. Southern Nevada Water Authority. Presentedat Water Smart Innovations 2014. Retrieved fromhttps://www.watersmartinnovations.com/documents/pdf/2014/sessions/2014-T-1408.pdf
Brandes, D. September 8, 2014. St. Johns River WaterManagement District. Personal Communication.
Cabrera, R.I., K.L. Wagner, and B. Wherley. 2013. AnEvaluation of Urban Landscape Water Use in Texas.Texas Water Journal, 4, 14-27. Retrieved fromhttps://journals.tdl.org/twj/index.php/twj/article/view/6992
City Mayors Statistics. 2014. The Fastest Growing USCities. Retrieved fromhttp://www.citymayors.com/gratis/uscities_growth.html
City of Austin. 2016. Article 2. — Water UseManagement. Retrieved fromhttps://library.municode.com/tx/austin/codes/code_of_ordinances?nodeId=TIT6ENCOCO_CH6-4WACO_ART2WAUSMA
City of Austin. 2017. Austin Integrated Water ResourcePlanning Community Task Force Meeting Packet,January 31, 2017. Retrieved fromhttp://www.austintexas.gov/edims/document.cfm?id=271105
City of Georgetown. 2014. Chapter 13.15. — Water UtilityServices. Retrieved fromhttps://library.municode.com/tx/georgetown/codes/code_of_ordinances?nodeId=COOR_TIT13PUUTSE_CH13.15WAUTSE
Dailey, R. September 10, 2014. The Woodlands, TX.Personal communication.
Davis, C. September 10, 2014. City of Dallas, TX.Personal communication.
Dukes, M.D., L.E. Trenholm, E. Gilman, C.J. Martinez,J.L. Cisar, T.H. Yeager, A. Shober, and G. Denny. 2017.Frequently Asked Questions about Landscape Irrigationfor Florida-Friendly Landscaping Ordinances.Environmental Horticulture Department, FloridaCooperative Extension Service, Institute of Food andAgricultural Sciences, University of Florida. Retrieved fromhttps://edis.ifas.ufl.edu/pdffiles/WQ/WQ14200.pdf
Finch, C.R. 2014. Analysis of Landscape Water Use andIdeas to Reduce Landscape Watering to Increase WaterAvailable for Storage in the Highland Lakes. Reportprepared for the Coastal Conservation Association.
Freese and Nichols. 2014. Water Conservation Plan: Cityof Fort Worth. Retrieved fromhttp://fortworthtexas.gov/uploadedFiles/Water/Save_FW_water/FINAL%20WATER%20CONSERVATION%20PLAN%20UPDATE%203-26-2014.pdf
Gross, D. August 13, 2014. City of Austin. PersonalCommunication.
Haley, M., M. Dukes, and G. Miller. 2007. ResidentialIrrigation Water Use in Central Florida. Journal ofIrrigation and Drainage Engineering, 133(5), 427-434.Retrieved fromhttp://citeseerx.ist.psu.edu/viewdoc/download?doi=10.1.1.919.9255&rep=rep1&type=pdf
Halich, G. and K. Stephenson. 2009. Effectiveness ofResidential Water-Use Restrictions under Varying Levelsof Municipal Effort. Land Economics, 85(4), 614-626.Retrieved from http://www.jstor.org/stable/27759705
Hazen and Sawyer. 2005. Evaluating Implementation of Multiple Irrigation and Landscape Ordinances in theTampa Bay Region. Report for Tampa Bay Water.Retrieved fromhttp://www.tampabaywater.org/documents/conservation/RegionLandscapeOrdinances.pdf

WATER CONSERVATION BY THE YARD | 37 | References
Henry, T. 2011. A History of Drought and ExtremeWeather in Texas. StateImpact Texas. Retrieved fromhttps://stateimpact.npr.org/texas/2011/11/29/a-history-of-drought-and-extreme-weather-in-texas/
Hermitte, S.M. and R.E. Mace. 2012. The Grass is AlwaysGreener Outdoor Residential Water Use in Texas. TexasWater Development Board. Retrieved fromhttp://www.twdb.texas.gov/publications/reports/technical_notes/doc/SeasonalWaterUseReport-final.pdf
Kenny, D.S., R.A. Klein, and M.P. Clark. 2004. Use andEffectiveness of Municipal Water Restrictions DuringDrought in Colorado. Journal of the American WaterResources Association, 40(1), 77-87. Retrieved fromhttp://sciencepolicy.colorado.edu/admin/publication_files/resource-296-water_restrictions_jawra.pdf
Kshatriya, T. June 28, 2017. City of Fort Worth, TX.Personal communication.
Litterski, P. 2013. Ear to the Ground. Treatment PlantOperator. Retrieved fromhttp://www.tpomag.com/editorial/2013/04/ear_to_the_ground_wso
McCormick, L. and J. Walker. 2010. Sprayed Away:Seven Ways to Reduce TexasÕ Outdoor Water Use.National Wildlife Federation, Lone Star Chapter of theSierra Club. Retrieved fromhttp://texaslivingwaters.org/wp-content/uploads/2013/03/sprayed-away_report.pdf
Mini, C., T.S. Hogue, and S. Pincetl. 2014. Estimation of Residential Outdoor Water Use in Los Angeles,California. Landscape and Urban Planning, 127, 124 135.Retrieved from http://agris.fao.org/agris-search/search.do?recordID=US201700013298
Ontario Water Works Association. 2008. OutdoorWater Use Reduction Manual. Retrieved fromhttp://www.allianceforwaterefficiency.org/uploadedFiles/Resource_Center/Library/Canada/2012_Provincial_Summaries/OWWA-Outdoor-Water-Use-Manual.pdf
Peralta, Katherine. 2014. EverythingÕs Bigger, and StillGetting Bigger, in Texas. U.S. News and World Report.Retrieved fromhttps://www.usnews.com/news/articles/2014/05/22/texas-cities-among-nations-fastest-growing-us-census-bureau-says
Quesnel, K., and N. Ajami. 2017. Changes in WaterConsumption Linked to Heavy News Media Coverage of Extreme Climatic Events. Science Advances.Retrieved fromhttp://advances.sciencemag.org/content/3/10/e1700784.full
Ramos, K. 2014. Does Turf Removal Save Water?Metropolitan Water District of Southern California.Presented at Water Smart Innovations 2014. Retrievedfromhttps://www.watersmartinnovations.com/documents/pdf/2014/sessions/2014-T-1452.pdf
Robson, D. no date. Watering Tips for the HomeGardener. University of Illinois Extension. Retrieved fromhttp://web.extension.illinois.edu/cook/downloads/9235.pdf
Ryan, M. 2013. Fort Bend Makes List of AmericaÕsFastest-Growing Counties. Houston Business Journal.Retrieved fromhttp://www.bizjournals.com/houston/morning_call/2013/10/fort-bend-makes-list-of-americas.html
Sanford, W. and D. Selnick. 2013. Estimation ofEvapotranspiration Across the Conterminous UnitedStates Using a Regression with Climate and Land-CoverData. Journal of the American Water ResourcesAssociation, 49, 217-230. Retrieved fromhttp://wedocs.unep.org/bitstream/handle/20.500.11822/18006/Sanford_et_al2013JAWRA_Journal_of_the_Americ.pdf?sequence=1&isAllowed=y
Tarrant Regional Water District. 2014. WaterConservation and Drought Contingency Plan. Retrievedfrom http://www.savetarrantwater.com/docs/default-source/default-document-library/conservation_and_drought_contingency_plan.pdf?sfvrsn=2
Texas A&M Agrilife Extension. 2018. Water-My-Yard.Retrieved from https://watermyyard.org
Texas A&M Agrilife Extension Service. 2009. WinterLawn Watering…Yea or Nay? Retrieved fromhttp://centraltexashorticulture.blogspot.com/2009/02/winter-lawn-wateringyea-or-nay.html
Texas Commission on Environmental Quality. 2012. The ÒTake Care of TexasÓ Guide to Yard Care. GI-28.Retrieved from http://www.bvcog.org/wp-content/uploads/2015/12/Take-Care-of-Texas-Guide-to-Yard-Care.pdf
Texas Water Development Board. 2012-2015. WaterUse Surveys.
Texas Water Development Board. 2013. 9.2Conservation Ordinance Planning and Development.Best Management Practices for Municipal WaterProviders. Retrieved fromhttps://www.twdb.texas.gov/conservation/BMPs/Mun/doc/9.2.pdf
Texas Water Development Board. 2017. Water forTexas 2017, State Water Plan. Retrieved fromhttp://www.twdb.texas.gov/waterplanning/swp/2017/doc/SWP17-Water-for-Texas.pdf?d=40107.340000000004

Utah Department of Natural Resources. 2010. 2009Residential Water Use. Division of Water Resources.Retrieved fromhttps://water.utah.gov/OtherReports/RWU_Study.pdf
Vickers, A. 2001. Handbook of Water Use andConservation. Amherst, MA: Waterplow Press.
Whitcomb, J. 2005. Florida Water Rates Evaluation ofSingle-Family Homes. Prepared for Southwest Florida,St Johns River, South Florida and Northwest FloridaWater Management Districts. Retrieved fromhttps://www.swfwmd.state.fl.us/documents/reports/water_rate_report.pdf
Whitcomb, J. 2006. Evaluation of Irrigation Restrictionsin East-Central Florida. St Johns River WaterManagement District Special Publication SJ2008-SP25.Retrieved fromftp://secure.sjrwmd.com/technicalreports/SP/SJ2008-SP25.pdf
White, R., R. Havalak, J. Nations, J. Thomas, D.Chalmers, and D. Dewey. 2004. How Much Water isÔEnoughÕ? Using PET to Develop Water Budgets forResidential Landscapes. Texas Water ResourcesInstitute TR-271. Retrieved fromhttp://oaktrust.library.tamu.edu/handle/1969.1/6100
Wilson, C. and M. Bauer. 2014. Drip Irrigation for HomeGardens. Fact Sheet No. 4.702. Colorado StateUniversity Extension. Retrieved fromhttp://www.ext.colostate.edu/pubs/garden/04702.pdf
www.texaslivingwaters.org