Embed Size (px)
Citation preview

Australian Water Conservation and Reuse
Research Program
Impacts on crop quality from irrigation with water reclaimed from sewage
Murray Unkovich1, Daryl Stevens3, Guang-Guo Ying2 and Jim Kelly3
(Project Leader – Daryl Stevens)
1 Soil and Land Systems, Adelaide University 2 CSIRO Land and Water 3 ARRIS Pty Ltd.
April 2004 ISBN 0 643 09177 7

Impacts on crop quality from irrigation with water
reclaimed from sewage
This report was supported by the Victorian Smart Water Fund
and prepared for the Australian Water Conservation and Reuse
Research Program
Disclaimer This review is presented “as is” without any warrantees or assurances. Whilst all reasonable efforts have been made
to ensure the information provided in this review is current and reliable, ARRIS Pty Ltd and the contributors of this
work cannot accept any responsibility for inconvenience, material loss or financial loss resulting from this review.
We do not accept any responsibility for errors or omissions in the contents, however they may arise.
ARRIS Pty Ltd and contributors may identify products by proprietary or trade names to help readers identify
particular types of products. We do not endorse or recommend the products of any manufacturer referred to in this
review. Other products may perform as well or better than those specifically referred to in this review.
i
Executive Summary Technology is available to reclaim water from sewage to meet any specific requirement. Relatively simple lagooning technology can produce water suitable for irrigation of several food crops. For countries with advanced treatment processes, and the appropriate quality assurance program, water reclaimed from sewage can be treated to such a quality that, from a pathogen perspective, it can be irrigated on any crops without restrictions on the irrigation method. Higher degrees of treatment, or restricted irrigation methods (e.g. methods that avoid water and harvestable portion contact), offer even higher levels of security, or minimisation of the associated risks even further. The plant-root-soil system also achieves relatively efficient ‘filtering’ of pathogens. If current guidelines are followed, the actual risk to consumer health from consumption of produce grown with reclaimed water, in developed countries, is generally minute. Regulatory standards and guidelines are often more conservative than absolutely necessary from a risk assessments perspective. Risks from toxicants on produce, either from uptake from soil or airborne deposition are very low, though more information on organic compounds is required. This will need to be an ongoing process as new organic compounds are manufactured or identified. In terms of crop production, the areas needing most attention from growers are salinity and nutrient management, since these usually differ from the more conventional irrigation water sources used. Careful attention must be paid to management of N and Fe to maintain turf quality relative to irrigation with potable water. In terms of toxicities to plants, Cl- is usually the most problematic. Interactions between crop choice, water quality, soils and irrigation method are complex, but drip or subsurface irrigated leaf crops are likely to have lower levels of contamination and toxic responses, than equivalent sprinkler irrigated crops. The development of a decision tree to help guide crop selection and management for efficient production and minimal risks might be useful for growers. With respect to the quality of produce (visual, taste, shelf life), reclaimed water irrigated crops appear to be equivalent to crops irrigated with other waters. Given the number of reclaimed water irrigation schemes operating successfully in the world, it is clear that such systems can be made safe in terms of pathogenic organisms and (at least) short-term human health. The industry has thus moved successfully from theory into practise. For the industry to expand, the following research areas might prove valuable: • a more thorough examination of the comparative quality of reclaimed vs other irrigation
waters; •
• •
•
•
•
better comparative risk assessments for pathogen and toxicant transfer in reclaimed vs fresh water irrigated crop systems using an approach similar to that outlined in Chang et al. (1996), or a Hazard Analysis and Critical Control Point system (Mortimore and Wallace 1998), for these to be reflected in guidelines, and perhaps even included in specifications; benchmarking of organic toxicants in reclaimed water, soils and produce; validation of the stability of the sum of cations (Garcia and Charbaji 1993) as a practical indicator of crop salinity tolerance; a more thorough examination of boron tolerance of crops, boron accumulation in produce and potential human toxicity, and the interaction between plant boron toxicity and salinity; the development of a decision tree for growers to help guide crop selection and management for efficient production with minimal risks; If reclaimed water is going to be increasingly used for water landscaped gardens, more research is required to determine the sensitivity of a range of landscape plants to the macronutrients and salinity found in reclaimed water; and
ii

• development of subsurface systems for turf irrigation The biggest challenges to ensure food and turf quality, will be balancing the salts applied with reclaimed water and ensuring new chemicals of concern, found in the future, pose no threat to food quality (and subsequent human health) and yield.
“The human approach to sanitation –
dilution of bodily waste with water and subsequent, not totally successful, efforts to purify this -
must appear absurd to the uninvolved observer”
(Van Leeuwen 1996)
iii

Table of Contents Executive Summary ___________________________________________________________ ii
Table of Contents _____________________________________________________________ iv
Figures _____________________________________________________________________vi
Tables ______________________________________________________________________vi
Abbreviations _______________________________________________________________viii
Definition __________________________________________________________________viii
1.0 Introduction ______________________________________________________________ 1
1.1 Australian water resources and irrigated agriculture_________________________________ 1
1.2 Wastewater treatment __________________________________________________________ 2
1.3 Differences between reclaimed water and other irrigation waters_______________________ 4
2.0 Food safety _______________________________________________________________ 7
2.1 Human pathogens and reclaimed water quality standards_____________________________ 7
2.2 Human pathogens on irrigated produce ___________________________________________ 11 2.2.1 Health risk in theory and practise ______________________________________________________ 13
2.3 Produce contamination and food standards________________________________________ 17 2.3.2 Metals and metalloids_______________________________________________________________ 18 2.3.3 Maximum levels of metals/metalloid contaminants in food__________________________________ 21 2.3.4 Organic contaminants_______________________________________________________________ 22 2.3.5 Maximum levels of organic contaminants in food _________________________________________ 24
3.0 Plant nutrition and crop production __________________________________________ 25
3.1 Nutrient management for maximal crop yield and quality____________________________ 26
3.2 Managing sodium, chloride and boron ____________________________________________ 29 3.2.1 Sodium and chloride effects on crops___________________________________________________ 29 3.2.2 Boron ___________________________________________________________________________ 35
4.0 Turf and landscape culture with reclaimed water _______________________________ 39
5.0 Agricultural practices______________________________________________________ 42 5.1 Irrigation scheduling ________________________________________________________________ 42 5.2 Grower management of reclaimed water. _______________________________________________ 44
6.0 Consumer perceptions as a barrier to industry development ______________ 44
iv

7.0 Conclusions ___________________________________________________________ 46
References__________________________________________________________________ 47
v

Figures
Figure 1 Principal steps in municipal wastewater treatment. Water of any quality can be produced, including potable water, depending on the treatment methods used, tertiary treatments are optional. (Figure adapted from EPA 1996)............................... 3
Figure 2 Estimated number of viral infection events from reclaimed produce in Australia compared to other events. Values are plotted on log scale/10 million of population (from Australian Bureau of Statistics and Shuval et al. 1997).................................... 17
Figure 3 Change in soil boron concentration for soils irrigated with three types of water on the Northern Adelaide Plains. Note: Soil boron concentration is a log scale. The red line indicates toxic yield threshold above which yield reduction begin to occur. ........................................................................................................................... 37
Tables Table 1 Constituents of concern in wastewater treatment and reuse in irrigation (from
Asano et al. 1985).......................................................................................................... 2
Table 2 Quality of Class A reclaimed water (CARW) and two major groundwater aquifers on the North Adelaide Plain, South Australia (from Kelly et al. 2001). ....................... 4
Table 3 Characteristics of raw wastewater, treated wastewater and control (bore) irrigation water from a study in Morocco (Hamouri et al. 1996).................................................. 4
Table 4 Some water quality data for the Murray River in South Australia 1990 – 1999 (from EPA SA 2002). Important note, Table 4 also shows a significant increase in salinity with distance downstream. ........................................................................... 5
Table 5 Mean concentrations of faecal coliforms and Enterococci in effluent and river samples at Clermont-Ferrand, France (1997)................................................................ 6
Table 6 US-EPA water quality guidelines for irrigation with reclaimed water (from Crook and Surampalli 1996) .................................................................................................... 8
Table 7 World Health Organisation recommended microbial quality guidelines for reclaimed water reuse (from WHO 1989)..................................................................... 8
Table 8 Criteria for treatment and coliform levels of reclaimed water for non potable reuse in the State of California USA (from Crook and Surampalli 1996).............................. 9
Table 9 Criteria for treatment and coliform levels of reclaimed water for non potable reuse in the State of Florida USA (from Crook and Surampalli 1996). ................................. 9
Table 10 Precis of South Australian reclaimed water reuse guidelines (from DHS and EPA SA 1999). .................................................................................................................... 10
Table 11 Numbers of bacteria on lettuce, silverbeet, broccoli and cauliflower irrigated with reclaimed water, groundwater, or taken from the supermarket in Adelaide, South Australia (from Kelly and Stevens 2002).................................................................... 12
Table 12 Steps used in a public health risk assessment from contaminated food (Chang et al. 1996)....................................................................................................................... 13
Table 13 Estimated (modelled) risk of infection from enteric viruses from tertiary or secondary treated water with and without chlorination when used for recreation, crop irrigation or groundwater recharge. Derived from study of Tanaka et al.
vi
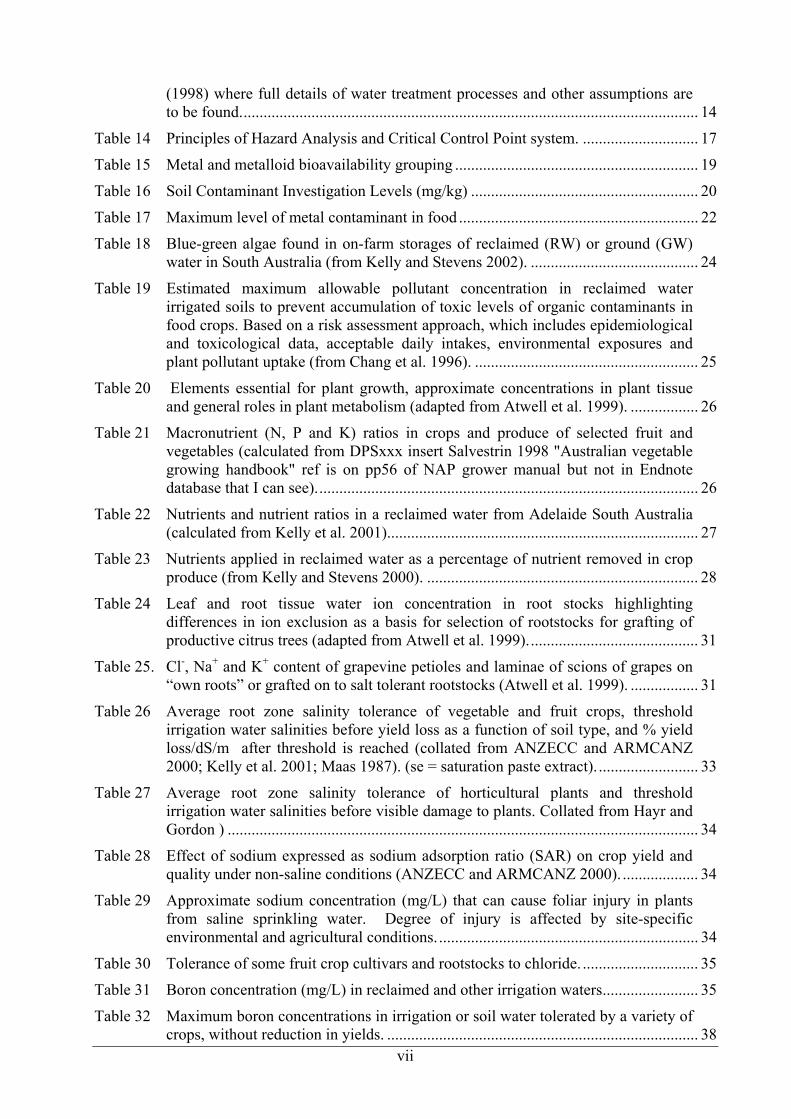
(1998) where full details of water treatment processes and other assumptions are to be found................................................................................................................... 14
Table 14 Principles of Hazard Analysis and Critical Control Point system. ............................. 17
Table 15 Metal and metalloid bioavailability grouping ............................................................. 19
Table 16 Soil Contaminant Investigation Levels (mg/kg) ......................................................... 20
Table 17 Maximum level of metal contaminant in food ............................................................ 22
Table 18 Blue-green algae found in on-farm storages of reclaimed (RW) or ground (GW) water in South Australia (from Kelly and Stevens 2002). .......................................... 24
Table 19 Estimated maximum allowable pollutant concentration in reclaimed water irrigated soils to prevent accumulation of toxic levels of organic contaminants in food crops. Based on a risk assessment approach, which includes epidemiological and toxicological data, acceptable daily intakes, environmental exposures and plant pollutant uptake (from Chang et al. 1996). ........................................................ 25
Table 20 Elements essential for plant growth, approximate concentrations in plant tissue and general roles in plant metabolism (adapted from Atwell et al. 1999). ................. 26
Table 21 Macronutrient (N, P and K) ratios in crops and produce of selected fruit and vegetables (calculated from DPSxxx insert Salvestrin 1998 "Australian vegetable growing handbook" ref is on pp56 of NAP grower manual but not in Endnote database that I can see)................................................................................................ 26
Table 22 Nutrients and nutrient ratios in a reclaimed water from Adelaide South Australia (calculated from Kelly et al. 2001).............................................................................. 27
Table 23 Nutrients applied in reclaimed water as a percentage of nutrient removed in crop produce (from Kelly and Stevens 2000). .................................................................... 28
Table 24 Leaf and root tissue water ion concentration in root stocks highlighting differences in ion exclusion as a basis for selection of rootstocks for grafting of productive citrus trees (adapted from Atwell et al. 1999)........................................... 31
Table 25. Cl-, Na+ and K+ content of grapevine petioles and laminae of scions of grapes on “own roots” or grafted on to salt tolerant rootstocks (Atwell et al. 1999). ................. 31
Table 26 Average root zone salinity tolerance of vegetable and fruit crops, threshold irrigation water salinities before yield loss as a function of soil type, and % yield loss/dS/m after threshold is reached (collated from ANZECC and ARMCANZ 2000; Kelly et al. 2001; Maas 1987). (se = saturation paste extract). ......................... 33
Table 27 Average root zone salinity tolerance of horticultural plants and threshold irrigation water salinities before visible damage to plants. Collated from Hayr and Gordon ) ...................................................................................................................... 34
Table 28 Effect of sodium expressed as sodium adsorption ratio (SAR) on crop yield and quality under non-saline conditions (ANZECC and ARMCANZ 2000). ................... 34
Table 29 Approximate sodium concentration (mg/L) that can cause foliar injury in plants from saline sprinkling water. Degree of injury is affected by site-specific environmental and agricultural conditions. ................................................................. 34
Table 30 Tolerance of some fruit crop cultivars and rootstocks to chloride. ............................. 35
Table 31 Boron concentration (mg/L) in reclaimed and other irrigation waters........................ 35
Table 32 Maximum boron concentrations in irrigation or soil water tolerated by a variety of crops, without reduction in yields. .............................................................................. 38
vii

Table 33 Relative salinity tolerance of turf grasses, where tolerance (dS/m) is maximum salinity at which grass grows or the point at which shoot growth is reduce by 50% (from Marcum 1999). .................................................................................................. 40
Table 34 Shoot weight and leaf Cl- concentration of landscape plants irrigated with fresh water or a synthetic “wastewater” containing KCl, MgCl2 and CaCl2 (from Wu et al. 1995)....................................................................................................................... 41
Table 35 Salinity and sodicity tolerance of a range of woody species (from Ansari et al. 1999)............................................................................................................................ 41
Table 36 Example of guidelines for reclaimed water use for horticultural irrigation, including crop type, water application methods and withholding periods (DHS and EPA SA 1999). ..................................................................................................... 43
Abbreviations FC = Faecal coliform NEPC = National Environmental Protection Council NEPM = National Environmental Protection Measure HBILs = health-based investigation levels (s) for contaminants in soils EILs = Environmental Investigation Levels RSCCLs = Receiving Soil Contamination Ceiling Levels
Definition Reclaimed water – water that has been derived from sewerage systems of industry processes and treated to a standard that is appropriate for its intended use (EPA Victoria 2003).
viii

1.0 Introduction
1.1 Australian water resources and irrigated agriculture
In recent years, the management of water resources has become a major focus of both public debate and government policy in recent years. The bulk of Australia’s population is concentrated on the relatively dry south eastern and south western seaboards, whereas the principal water resources are in the north of the continent (Anderson 1996). The dryness of the continent is exaggerated by large year-to-year variations in climate which necessitate water storage strategies to buffer against the drier years, and indeed Australia stores more water than any other country (National Land and Water Resources Audit 2001). This uneven distribution of precipitation and population, both spatially and temporally, is typical of Mediterranean environments which often have difficulty matching water supply with demand (Angelakis et al. 1999). In the past, water has also been used to promote rural development (King 1995; Thomas 1999) rather than treated as an economically valuable resource. In 1992-1993 irrigated agriculture, which consumed some 72% of the Australian water resource, contributed only 5% of water revenue (Thomas 1999). This resource was further eroded since some 77% of diverted water was lost to evaporation and seepage before it reached the end use (National Land and Water Resources Audit 2001). With the recognition that SE Australian water resources are near the limit of their development, some of these issues are beginning to be addressed with the trading of water to higher value enterprises. In the long-term, it is difficult to see irrigated agriculture securing such a large fraction of the available water resources, since the economic value of the products from irrigated agriculture is often less than that of products produced through industrial and urban water uses (Brown 2001). Brown also highlighted that world water consumption has tripled over the last 50 years and suggested that current consumption rates were not sustainable. Given the concentration of population and the shortage of water resources, the management or reclamation of sewage (reclaimed water) can play a critical role in the protection of fresh and near shore water resources, and contribute significant volumes of water to agriculture. Consequently, during the last 10 years governments have increased pressure on the water industry to reclaim and/or reuse wastewater. In the United States some States mandate the reuse of potable waters for irrigation (Crook and Surampalli 1996). While reclaimed urban wastewater represents an opportunity for irrigated agriculture the size of the resource needs to be kept in perspective. For example, in Australia, urban and industrial water usage currently accounts for only 18% of total water use (Anderson 1996), in the event that 50% of it were recycled it could contribute about 10% of the current demand in irrigated agriculture. Approximately 1,600 GL of water and 230,000t dry biosolids are produced annually in Australian sewage treatment works (Stevens et al. 2002; Dillon 2000). The precise amount of reclaimed water available for reuse schemes in Australia is difficult to estimate. However, Dillon (2000) indicated that by 2010, 451 GL of water could be reclaimed for irrigation. The quality of reclaimed water varies significantly between sewage treatment works and reclamation processes and the chemical and physical properties of the reclaimed water will ultimately determine the reuse options. The principal considerations for reuse are human health, water pollution, food quality, and crop and soil productivity. This review examines the human health and food quality issues related to the reuse of treated urban effluent (reclaimed water) in crop (including turf) production.
1

1.2 Wastewater treatment The primary objectives in the development and execution of domestic and industrial effluent disposal systems, whether discharged to water bodies or on to land, are public health and the prevention of water and soil pollution (Pettygrove et al. 1985). Reclaimed water typically contains elevated levels of nutrients from human and domestic wastes (particularly nitrogen and phosphorus), salts (particularly Na+, K+, Cl-), and bacteria, viruses and parasites. We reproduce here (Table 1) the table of Asano et al. (1985) which lists what are generally accepted as the major constituents of concern in the disposal and reuse of reclaimed water. The principal steps in the treatment of municipal wastewater are shown in Figure 1. Sewage inflows are often first screened to remove grit and litter prior to sedimentation, which removes much of the solid matter (Primary treatment). Most heavy metal contaminants are also precipitated in this biosolids component (Bunel et al. 1995; Pettygrove et al. 1985), although some (arsenic, lead and copper) may form metal chelates with organics (Baier and Fryer 1973) and can be found in effluent.
Table 1 Constituents of concern in wastewater treatment and reuse in irrigation (from Asano et al. 1985).
Constituent Measured parameters Reason for concern Suspended solids Suspended solids, including volatile
and fixed solids • can lead to sludge deposits and anaerobic
conditions when untreated wastewater is discharged in the aquatic environment
Biodegradable organics Biochemical Oxygen Demand (BOD) Chemical Oxygen Demand (COD)
• biological decomposition can lead to depletion of dissolved oxygen in receiving waters and the development of septic conditions
Pathogens Indicator organisms; total and faecal coliform bacteria, helminths
• disease transmission
Nutrients Nitrogen (N) Phosphorus (P) Potassium (K)
•
•
•
essential for plant growth and can enhance value of water for crop irrigation when discharged to the aquatic environment N and P can lead to algal blooms, anaerobic conditions and fish deaths pollution of groundwaters
Stable organics Specific compounds (e.g. pesticides, chlorinated hydrocarbons)
•
• •
tend to resist conventional methods of wastewater treatment some compounds environmental toxins may limit suitability for crop irrigation
Hydrogen ion activity pH • affects metal solubility Heavy metals Cadmium, Zinc, Nickel, Mercury,
Copper • accumulate in the environment and become
toxic to plants, animals, humans Dissolved inorganics TC, EC, Na, Ca, Mg, Cl, B •
• excessive salinity damages crops excess sodium may cause soil structural problems
Residual chlorine Free and combined chlorine can damage sensitive crops
In secondary treatment, suspended and dissolved organic matter is removed through biological activity (bacterial respiration) and further sedimentation. Tertiary treatment provides a plethora of options (Figure 1) for removal of specific organic and inorganic compounds depending on the end use for reclaimed water and constituents of primary concern. Although bacterial numbers are greatly reduced during primary and secondary treatment (Sheikh et al. 1999b), disinfection of secondary or tertiary treated wastewater is only achieved via: chlorination (Asano et al. 1985); UV radiation (EPA 1996); filtration (Jimenez et al. 1999; West 1991); stabilisation ponds
2

(Marecos do Momonte et al. 1996); or passage through the soil which can also act as a very effective filter for pathogens, including viruses (Castillo et al. 2001; Kouraa et al. 2002; Oron et al. 1995). Effective technology is available to remove all pathogens from effluent and provide water of the highest quality, including potable water (Haarhoff and Vandermerwe 1996; Law 1996; Yanko 1993). The issues associated with disinfection of reclaimed water are equivalent to those faced in the provision of potable water from fresh water supplies (a detailed exposé of wastewater treatment systems can be found in Asano et al. (1985)).
Figure 1 Principal steps in municipal wastewater treatment. Water of any quality can be
produced, including potable water, depending on the treatment methods used, tertiary treatments are optional. (Figure adapted from EPA 1996).
3

1.3 Differences between reclaimed water and other irrigation waters Prior to a detailed discussion about the use of reclaimed water for food production it is worthwhile examining the principal differences between reclaimed water and other irrigation waters. In doing so one must bear in mind that almost any quality of water can be produced from wastewaters, with treatment being tailored to intended use. There is also wide variation in the quality of other irrigation waters depending on source and time of extraction. In general reclaimed water tends to have an elevated salt content, nutrient load, level of toxic compounds, and possibly a higher number of human pathogens. These contaminants result from the human use of the source water. However, other irrigation waters are not free of these components, and indeed in the recent audit of Australia’s water resources (National Land and Water Resources Audit 2001) it was found that 61% of the river basins examined exceeded nutrient quality standards, 32% exceeded acceptable salinity levels, and 61% exceeded turbidity criteria. In the case of faecal coliforms (FC), an indicator of animal pathogen levels, there was insufficient data on which to make an assessment with <1% of catchments having data available. A comparison of reclaimed water and other irrigation waters was made by Kelly et al. (2001) on the North Adelaide Plains in South Australia. They found that while total N and P were invariably higher than for groundwater irrigation sources (Table 2), differences between other parameters measured were not consistent. In a similar comparison in Morocco (Table 3), where fresh surface waters are not available the levels of salt and nitrate in groundwater used for irrigation exceed that of reclaimed water (Hamouri et al 1996).
Table 2 Quality of Class A reclaimed water (CARW) and two major groundwater aquifers on the North Adelaide Plain, South Australia (from Kelly et al. 2001).
CARW T1 Aquifer T2 Aquifer Parameter Unit Average Min Max Min Max pH - 7.4 7.4 8.1 7 8.1 Total dissolved Salts (TDS) mg/L 1097 715 4033 556 2322 Electrical Conductivity (calc.) dS/m ≈1.7 1.19 6.71 0.93 3.86 Total N mg/L 10.3 0 0 0 2 Total P mg/L 1.2 0 0 0 0 E.coli /100ml 0a na na na na Sodium Absorption Ratio (SAR) - 7.95 3.8 7.7 2.9 12.6 Chloride mg/L 382 170 485 190 736
ais median value; na indicates not analysed.
Table 3 Characteristics of raw wastewater, treated wastewater and control (bore) irrigation water from a study in Morocco (Hamouri et al. 1996)
Parameter
Raw Wastewater
Treated Wastewater
Groundwater (control)
pH 7.59 8.5 7.05 Electrical Conductivity (dS/m) 3.0 2.94 5.04 P-PO4 (mg/L) 23.00 15.73 0.2 N-NH4 (mg/L) 40.30 25.2 1.02 N-NO3 (mg/L) 0.70 0.40 5.52 HCO (meq/L) 12.30 10.40 10.00 SO4 (meq/L) 7.88 2.82 17.9 Cl (meq/L) 12.87 12.6 21.7 Ca (meq/L) 7.25 5.9 14.37 Mg (meq/L) 5.35 5.97 9.38 K (meq/L) 0.45 0.63 0.49 Na (meq/L) 14.10 14.0 23.4 Sodium Absorption Ratio (SAR) 5.62 5.75 6.79
Values are mean of 48 samples.
4

While there are too many compounds in wastewaters for them all to be regularly monitored (Chang et al. 1996) the following have been shown to hold for most reclaimed waters. Heavy metals are not found in high enough concentrations in reclaimed waters to be a direct threat to human health (Bahri 1998; Chang et al. 1996), although they may accumulate in soil and crops (Kirkham 1986). Although about 50% of nitrogen (N) and 60% of phosphorus (P) are removed from sewage during treatment (Bahri 1998), N and P remains much higher in reclaimed water than most other potential irrigation waters. This is potentially an advantage for reuse in agriculture as N and P are valuable nutrients for plant growth.
While there is great variability in the quality of “fresh” irrigation waters, there is a strong tendency for reclaimed water to have a higher salinity and higher concentrations of sodium (Na) relative to other cations than other irrigation waters. The salinity in reclaimed water originating principally from sea water intrusion into leaky sewerage systems, domestic and industrial water softeners (Asano et al. 1985), and through evaporative concentration during consecutive lagoon treatments (Marecos do Momonte et al. 1996). However, quality of surface and groundwater can range from very good quality, to unacceptable quality for irrigation, encompassing reclaimed water quality. For example, reclaimed water salinity can be 1.6 -2.3 dS/m. In contrast, Walker et al. (2002) report salinity levels in groundwater used for irrigation in South and Western Australia to be 0.6 – 3.0 dS/m, and in South Australia the EPA (EPA SA 2002) reports that over a ten year period that salinity in the Murray River averaged 3.4 – 6.0 dS/m as one moved downstream (Table 4). In Spain Reboll et al. (2000) reported that while sodium, chloride, boron, and organic matter were always higher in reclaimed water than groundwater over a three year period, concentrations of nitrate in groundwater (50-115 mg/L) were always higher than for reclaimed water (13-18 mg/L). Neilsen et al. (1989a) also observed greater NO3
- concentrations in groundwater than reclaimed water. However, it must be noted that much of the organic N in reclaimed water will also mineralise to NO3
- after land application (Polglase et al. 1995).
Pathogens in reclaimed water are of concern due to their potential to spread disease. Sheikh et al. (1999b) showed data indicating that Cryptospyridium and Giardia were often higher in high quality drinking water sources than in tertiary treated effluent i.e. levels are comparable or lower than potable waters. They detected no Salmonella, Cyclospora, E. coli, Cryptospyridium or viable Giardia in tertiary treated effluent. For the Murray River in South Australia, the microbial quality of the water has been shown to decrease as one moves downstream, and from 1990-1999, averaged 13 faecal coliforms (FC)/100mL at Lock 9, 12 at Morgan, 250 at Murray Bridge, and 434 FC/100mL at Tailem Bend (Table 4). Such data indicate that “fresh” irrigation waters are not free of pathogens, although it was argued (EPA SA 2002) that as the source of the faecal coliforms was most likely dairy farms and thus the level of human pathogens risk might be lower. However, cattle and a large range of other animals are also hosts to significant human pathogens such as Cryptosporidium (Yates and Gerba 1998). Regardless of the identity of pathogens, for some areas of the river the coliform count often exceeded Australian Standards for recreational use (150 FC/100mL).
Table 4 Some water quality data for the Murray River in South Australia 1990 – 1999 (from EPA SA 2002). Important note, Table 4 also shows a significant increase in salinity with distance downstream.
Site location Mean salinity FCA/100mL % of samples Electrical
Conductivity (dS/m)
TDS (mg/L)
Mean Median >150 FCA/100mL >0 FCA/100mL
5

Lock 9 3.4 185 13 6 0 89.7 Morgan 5.7 317 12 8 0.4 93.9 Mannum 5.8 321 53 41 3.5 99.8 Murray Bridge 6.1 333 250 150 48.0 99.8 Tailem Bend 6.0 329 434 190 58.3 99.8 AFC = faecal coliform
In the study of Devaux et al. (2001) in France, coliform levels were as high in river water as in secondary or tertiary treated effluent (Table 5). A number of other studies have yielded similar results (e.g. Kouraa et al. 2002), and thus it is clear that where appropriate systems are in place, suitably reclaimed and disinfected irrigation water may have no more coliforms or pathogens than other irrigation water sources (Asano and Levine 1996), including potable water.
Table 5 Mean concentrations of faecal coliforms and Enterococci in effluent and river samples at Clermont-Ferrand, France (1997).
Faecal coliforms Enterocci Secondary effluent 5.07 ± 0.73 Tertiary effluent 1.34 ± 0.57 1.66 ± 0.55 River A 3.44 ± 0.41 2.91 ± 0.52 River B 5.13 ± 0.54 3.51 ± 0.89 River C 4.80 ± 0.49 3.38 ± 0.37
Values are mean ± s.d. of log FC/100mL (from Devaux et al. 2001. In a recent survey of potable water supplies in Scotland (Reid et al. 2003), 48% of 1750 samples failed to meet quality criteria (total coliforms, faecal coliforms or nitrate). Clearly there is a need to obtain more data on human pathogen levels in non-reclaimed irrigation water sources before reclaimed water can be put into perspective.
6

2.0 Food safety
2.1 Human pathogens and reclaimed water quality standards Water quality standards can relate to protection of public health, protection of waterways, or to suitability for crop production and soil protection. In this review, we examine the public health issues which are the main concern of regulatory authorities who focus primarily on human pathogens (bacteria, viruses and intestinal parasites i.e. protozoa and helminths), although in some countries other criteria are also used (Massoud et al. 2003). In general there is a tendency for guidelines to be used rather than regulatory standards due to uncertainties surrounding the prescription of highly specific standards, principally because local conditions (water quality, soil physical and biological properties, cultural conditions and skills) can have an enormous influence on the relevance of particular standards. There is a plethora of guidelines and standards for reclaimed water use throughout the world, primarily reflecting differences in attitudes to risk management and to resource availability (Anderson et al. 2001). Interestingly, in many countries there are no such standards for other irrigation waters (Devaux et al. 2001). However, two main schools of thought emerge with respect to microbial quality criteria for irrigation of food crops with reclaimed water. A very strict and conservative approach developed by the United States Environmental Protection Agency (US-EPA) (Crook and Surampalli 1996), and a more liberal, flexible approach based around World Health Organisation (WHO) guidelines (Hespanhol and Prost 1994). Because specific pathogens in water and wastewater are relatively few in number and difficult to isolate, the non pathogenic faecal coliform group of bacteria, which are more numerous and easily tested, are used as an indicator of the presence of enteric pathogens (Asano et al. 1985). For the US-EPA criteria (Table 6), designed to provide guidance for the drafting of State legislation, the reclaimed water coliform count for irrigation of food crops is the same as for drinking water (no detectable FC/100mL), whereas the World Health Organisation (WHO) guidelines (Table 7) indicate ≤1 intestinal helminth egg and ≤1000 FC/100mL for direct irrigation. Enteric viruses are one of the main concerns for reclaimed water use in irrigation as there is a lack of reliable routine tests that can reliably and accurately detect these at low levels. As Regli et al. (1991) pointed out “inordinate numbers of high volume samples are required to ascertain whether potable water is below the 10-4 risk level. Thus, finished water monitoring is only practical to determine whether a very high level of risk exists, not whether a supply is reasonably safe”. The US-EPA approach aims to eliminate viruses in treatment (Asano and Levine 1996) using 0 FC as a surrogate measure. In addition to the microbial standards the US-EPA guidelines also mandates the type of treatment used, monitoring frequencies and buffer distances, while the WHO guidelines do not include such detail. The WHO guidelines reflect the social and technological realities of the range of countries which use cost effective waste stabilisation ponds (Bastos and Mara 1995). On this point Shuval (2003) noted that if expensive, unattainable standards are set in developing countries, then uncontrolled, unsafe practices will likely result; “official insistence on the best prevents cities and farmers from achieving the good”. It is clear, that to be practical, standards must be guided by the social and economic milieu into which they are to be adopted.
7

Table 6 US-EPA water quality guidelines for irrigation with reclaimed water (from Crook and Surampalli 1996)
Use Reclaimed water quality Treatment Urban, irrigation of crops eaten raw, recreational impoundment’s
pH 6>9 ≤10 mg/L BOD ≤2 NTU no detectable FC/100mL ≤1 mg/L Cl2 residual
secondary filtration and disinfection
Irrigation of restricted access areas and processed food crops, aesthetic impoundments, construction uses, industrial cooling, environmental reuse
pH 6>9 ≤30 mg/L BOD ≤30mg/L SS ≤200 FC/100mL ≤1 mg/L Cl2 residual
secondary and disinfection
Groundwater recharge of non potable aquifers by spreading
site specific and use dependent site specific and use dependent, primary (minimum)
Groundwater recharge of non potable aquifers by injection
site specific and use dependent site specific and use dependent, secondary (minimum)
Groundwater recharge of potable aquifers by spreading
site specific meet drinking water standards after percolation through vadose zone
site specific, secondary and disinfection (minimum)
Groundwater recharge of potable aquifers by injection, augmentation of surface supplies
Includes the following: pH 6>8.5 ≤2 NTU no detectable FC/100mL ≤1 mg/L Cl2 residual meet drinking water standards
includes the following; secondary, filtration, disinfection, advanced wastewater treatment
BOD=biological oxygen demand, NTU= nephelometric turbidity units, SS= suspended solids. Some US States have adopted the EPA 0 FC/100mL standard (e.g. California (Table 8) and Florida (Table 9)). Interestingly the Florida guidelines do not permit use of reclaimed water for irrigation of crops not peeled or cooked prior to consumption, even though they have a zero coliform standard for reclaimed water reuse for food crop irrigation (Table 9). With 0 FC’s/100mL one might consider it safe for irrigation, and indeed it would be interesting to know how such water might compare with faecal coliform levels in other irrigation waters in Florida. This highlights the confusion amongst the various guidelines and regulations adopted throughout the world, and further illustrates the need for a rational examination of irrigation water standards and public health risk across all water sources.
Table 7 World Health Organisation recommended microbial quality guidelines for reclaimed water reuse (from WHO 1989).
Category Reuse conditions Exposed group
Intestinal nematodes
(ova l-1)
Coliform count
(100ml-1)
Recommended treatment
A
Irrigation of crops likely to be eaten uncooked, sports fields, public parks
Workers Consumers
<1 <1000 Series of stabilisation ponds
B
Irrigation of cereal crops, industrial crops, pasture and trees
Workers <1 No standard Retention in stabilisation ponds for 8-10 days
C
Localised irrigation of crops in category B if no exposure to workers or public
None No standard No standard Not less than primary sedimentation
8
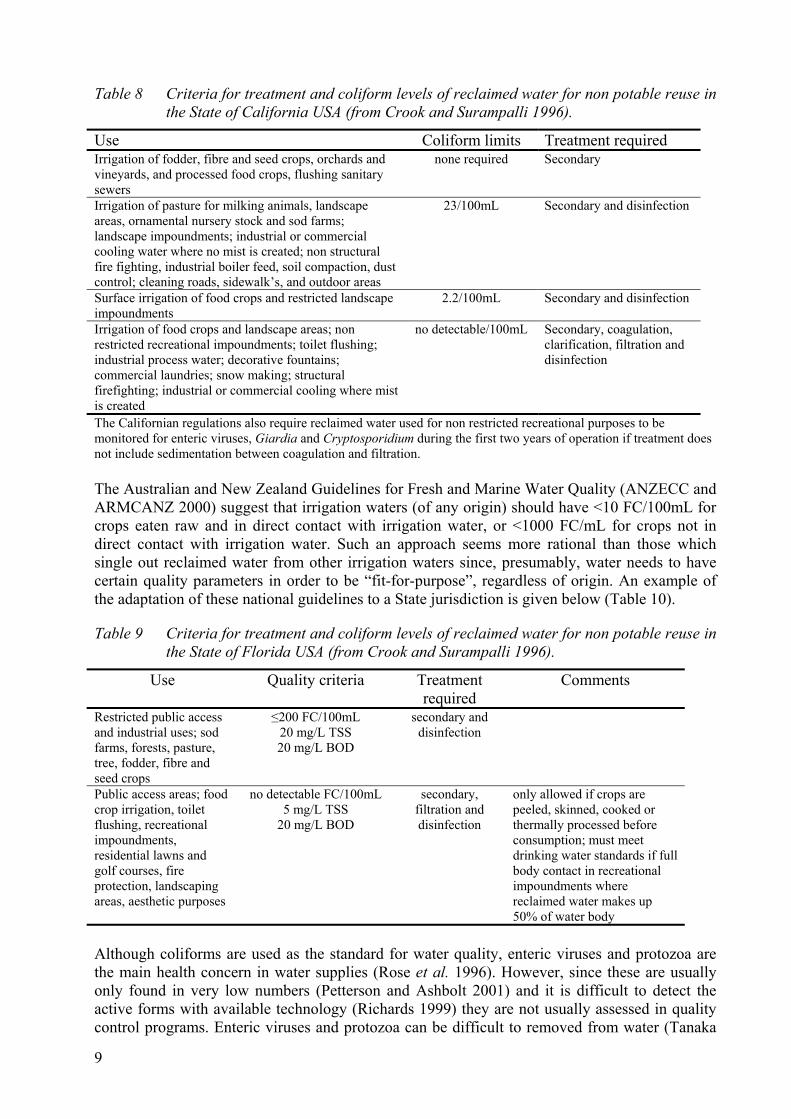
Table 8 Criteria for treatment and coliform levels of reclaimed water for non potable reuse in the State of California USA (from Crook and Surampalli 1996).
Use Coliform limits Treatment required Irrigation of fodder, fibre and seed crops, orchards and vineyards, and processed food crops, flushing sanitary sewers
none required Secondary
Irrigation of pasture for milking animals, landscape areas, ornamental nursery stock and sod farms; landscape impoundments; industrial or commercial cooling water where no mist is created; non structural fire fighting, industrial boiler feed, soil compaction, dust control; cleaning roads, sidewalk’s, and outdoor areas
23/100mL Secondary and disinfection
Surface irrigation of food crops and restricted landscape impoundments
2.2/100mL Secondary and disinfection
Irrigation of food crops and landscape areas; non restricted recreational impoundments; toilet flushing; industrial process water; decorative fountains; commercial laundries; snow making; structural firefighting; industrial or commercial cooling where mist is created
no detectable/100mL Secondary, coagulation, clarification, filtration and disinfection
The Californian regulations also require reclaimed water used for non restricted recreational purposes to be monitored for enteric viruses, Giardia and Cryptosporidium during the first two years of operation if treatment does not include sedimentation between coagulation and filtration. The Australian and New Zealand Guidelines for Fresh and Marine Water Quality (ANZECC and ARMCANZ 2000) suggest that irrigation waters (of any origin) should have <10 FC/100mL for crops eaten raw and in direct contact with irrigation water, or <1000 FC/mL for crops not in direct contact with irrigation water. Such an approach seems more rational than those which single out reclaimed water from other irrigation waters since, presumably, water needs to have certain quality parameters in order to be “fit-for-purpose”, regardless of origin. An example of the adaptation of these national guidelines to a State jurisdiction is given below (Table 10).
Table 9 Criteria for treatment and coliform levels of reclaimed water for non potable reuse in the State of Florida USA (from Crook and Surampalli 1996).
Use Quality criteria Treatment required
Comments
Restricted public access and industrial uses; sod farms, forests, pasture, tree, fodder, fibre and seed crops
≤200 FC/100mL 20 mg/L TSS 20 mg/L BOD
secondary and disinfection
Public access areas; food crop irrigation, toilet flushing, recreational impoundments, residential lawns and golf courses, fire protection, landscaping areas, aesthetic purposes
no detectable FC/100mL 5 mg/L TSS
20 mg/L BOD
secondary, filtration and disinfection
only allowed if crops are peeled, skinned, cooked or thermally processed before consumption; must meet drinking water standards if full body contact in recreational impoundments where reclaimed water makes up 50% of water body
Although coliforms are used as the standard for water quality, enteric viruses and protozoa are the main health concern in water supplies (Rose et al. 1996). However, since these are usually only found in very low numbers (Petterson and Ashbolt 2001) and it is difficult to detect the active forms with available technology (Richards 1999) they are not usually assessed in quality control programs. Enteric viruses and protozoa can be difficult to removed from water (Tanaka
9

et al. 1998) only low doses are required for infection. The use of faecal coliforms as a proxy for all pathogens is a weakness in quality assurance systems, since these are probably only really representative of bacterial pathogens (Ashbolt 1998). Thus low coliform levels do not always correlate to low levels of viruses, protozoa and helminths (Gardner et al. 1998). The Australian and New Zealand guidelines (ANZECC and ARMCANZ 2000) recognise that there is insufficient information available to set guidelines for viruses and protozoa, but suggest that while the ≤1 helminth ova/L is probably sufficient to protect crops, for consumers it may be too high for higher risk groups such as farm workers who might be better protected by a 0.5 ova/L limit. The U.S. guidelines do not include limits for viruses and protozoa. If suitable cost effective techniques were available for monitoring the specific organisms of most concern to human health, then it would be appropriate to have standards or guidelines specifically targeting these, rather than general bacterial indicators. An example of new technologies for enumeration of helminth ova, which may provide an advance in this area, is provided by de Victorica and Galvan (2003). Regardless of our ability to measure them in a timely and cost effective way, low cost technology (e.g. a stabilisation ponds) have shown to be efficacious against viruses (Smith 1982). Table 10 Precis of South Australian reclaimed water reuse guidelines (from DHS and EPA SA
1999).
Class
Uses
Microbiological criteria thermotolerant coliforms
(or E. coli.)/100ml (median)
Chemical/physical
criteria (mean)
Typical treatment process train
A
Primary contact recreation Residential non-potable -garden watering -toilet flushing -car washing -path/wall washing Municipal use with public access/adjoining premises Dust suppression with unrestricted access Unrestricted crop irrigation
<10
Specific removal of viruses, protozoa and
helminths may be required.
Turbidity
< 2 NTU
BOD < 20 mg/L
Chemical content to match use
Full secondary plus
tertiary filtration plus
disinfection
Coagulation may be required to
meet water quality requirements
B
Secondary contact recreation Ornamental ponds with public access Municipal use with restricted access Restricted crop irrigation Irrigation of pasture and fodder for grazing animals Washdown and stockwater Dust suppression with restricted access Fire fighting
< 100
Specific removal of viruses, protozoa and
helminths may be required.
BOD < 20 mg/L
SS < 30 mg/L
Chemical content to match use.
Full secondary plus disinfection
C
Passive recreation Municipal use with restricted access Restricted crop irrigation Irrigation of pasture and fodder for grazing animals
< 1000
Specific removal of viruses, protozoa and
helminths may be required for some stock.
BOD < 20 mg/L
SS < 30 mg/L
Chemical content to match use
Primary sedimentation plus
lagooning or Full secondary (Disinfection if required to meet microbiological
criteria only) D
Restricted crop irrigation Irrigation for turf production Silviculture
< 10 000 Helminths need to be considered for pasture
Chemical content to match use
Primary sedimentation plus
lagooning or
10

Non food chain aquaculture and fodder Full secondary As experience with water reclamation and reuse develops with time, there seems to be a weight of evidence accumulating that supports the WHO guidelines for irrigation with reclaimed water, suggesting that many higher quality guidelines adopted by a number of countries are leading to the over treatment of reclaimed water used for irrigation purposes. However, if this over treatment offers protection from unknown risk and allays consumer concerns then this may be money well spent.
2.2 Human pathogens on irrigated produce Microbial pathogen numbers are greatly reduced during secondary and tertiary treatment, but disinfection is required prior to exposure to the general public. The effectiveness of this process depends on the quality of the water and disinfection system used. Intestinal protozoan parasites (Giardia and Cryptosporidium) represent the highest risk due to long survival periods in the soil, low infective doses (single organisms can cause infection), practically no host immunity, and the limited possibility of concurrent infection in the home (Hespanhol and Prost 1994). To become infected by a pathogen from reclaimed water requires ingestion of the water, either directly from an irrigation source, or on fruit or vegetables irrigated with reclaimed water. Yates and Gerba (1998) reviewed the literature with respect to microbes in reclaimed water and found there was little evidence to indicate that microorganisms, including animal viruses, can be translocated into plant tissues (Oron; Sheikh et al. 1999b; Shuval et al. 1997) since both plant roots (Sheikh et al. 1999b), and soils (Pettygrove et al. 1985) effectively filter these out. Even when cucumbers and lettuces were emersed in heavily contaminated water (Shuval et al. 1997) no internal contamination of produce tissue was observed. Although Codd et al. (1999) indicated that some algae and/or their toxins may not be removed from lettuce with cursory washing, there is little evidence to indicate that toxic algae are found in high numbers in reclaimed water. Contamination of food crops with pathogens therefore requires contaminated water to remain on the surface of the crop or within a wound.
Viruses and pathogens die relatively quickly outside of their hosts in the environment (Melloul et al. 2001; Ward et al. 1981) and superficial washing in the home can remove 99.9% of remaining viral contamination (Shuval et al. 1997). Although viruses dosed on refrigerated food have survived for long periods in laboratory studies (Smith 1982), at more usual contamination levels, the risks are minimal. The greatest risks of food contamination comes from leaf crops that are sprinkler irrigated, and perhaps root crops with a high percentage of wounds since these can provide safe environments for microorganisms. In these instances vegetable contamination levels are directly related to the number of organisms in the irrigation water used (Armon et al. 1994). There have been several studies examining the abundance of human pathogens on fruit and vegetables irrigated with reclaimed or fresh water. In Australia, Kelly and Stevens (2002) reported on bacterial contamination of lettuce, silverbeet, broccoli and cauliflower irrigated with reclaimed water, groundwater, or these vegetables taken from a fruit and vegetable market. Table 11 shows that bacterial populations were on average lower on vegetables taken from fields irrigated with reclaimed water than vegetables irrigated with groundwater or sampled from the marketplace. No data was available on the FC levels from the groundwater sources but the median numbers of E. coli in the reclaimed water were 0/100mL (Table 3). Smith (1982) found that coliform numbers on produce irrigated with reclaimed water were the same as those irrigated with groundwater, and both were lower than levels found on supermarket produce. Viruses were not detected on produce, even one day after irrigation with reclaimed water. Interestingly >97% of viruses seeded on to crops died within 48 hours. However, die-off was slower in the soil.
11

Poliovirus survived for 76 days when seeded on to vegetables and stored in a refrigerator. It was concluded that the very low level of viruses detected in the reclaimed water meant that they did not present a health threat on irrigated vegetables, provided that water was stored for two weeks prior to use as was done in this study. Premier et al. (2000) found no significant differences in the microbial contamination of potatoes irrigated with fresh or reclaimed water, although both were higher than unirrigated crops where conditions for growth were less favourable.
Table 11 Numbers of bacteria on lettuce, silverbeet, broccoli and cauliflower irrigated with reclaimed water, groundwater, or taken from the supermarket in Adelaide, South Australia (from Kelly and Stevens 2002).
Source of Produce Salmonella (orgs/25g)
Coliforms (orgs/g)
Faecal Coliforms (orgs/g)
E. coli (orgs/g)
Reclaimed Water 0 106 3 1 Groundwater 0 217 101 101 Market Place 0 612 39 38
A field study in France examined coliform levels on crops irrigated with reclaimed water or non-irrigated (Bunel et al. 1995). Although thermotolerant coliform levels in the reclaimed water were above the prescribed limits at times, the levels of coliforms on reclaimed water irrigated plants were no higher than on unirrigated plants, and thus the conclusion was drawn that these coliforms were unlikely to have originated from reclaimed water. France has adopted the WHO standards for reclaimed water (≤1 intestinal helminth ova and ≤ 1,000 FC/L for direct irrigation), yet less stringent standards are used for subsurface or drip irrigation where wastewater is not put directly on to crops (Marecos do Momonte et al. 1996). Other glasshouse and field experiments in Europe on lettuce and radish, irrigated with reclaimed water (Bastos and Mara 1995), using drip and furrow methods, showed that bacterial contamination of crops in dry weather was no more than that observed on supermarket produce, even when the quality of the reclaimed water was outside the WHO guidelines. However, when rainfall occurred, Salmonella and higher numbers of coliforms (E. coli) were recovered from lettuce leaf surfaces due to soil splash. Rainfall may thus be an important factor in determining bacterial contamination of vegetables. In France, Stien and Schwartzbrod (1990) examined the changes in the number of helminth ova (Ascaris spp) after high numbers were artificially applied (application method not defined) to crops and soils. The eggs remained viable in the soil for 20 days after which numbers declined very rapidly. After 10 days, when the first measurements were taken, they found no eggs on the leaves of lettuce, radish or chives, while on the below ground fractions of the plants 17-75% of eggs were still present on roots, reducing to 3% on radish roots after 60 days but <1% for the other two crops. Oron et al. (2001) have shown that microbes die off quickly as the soil dries out (<5% moisture content) or as the salinity of the soil increases. In Morocco, Kouraa et al. (2002) examined faecal coliform and parasite egg (Helminth) contamination of potatoes and lettuce irrigated with raw wastewater, reclaimed water and potable water. There was no indication of the method of irrigation used, however they found levels of pathogens on vegetables irrigated with reclaimed water to be no different from those irrigated with potable water, and well below the WHO standard of 3 FC’s/kg and 0 helminth eggs/100g of crop. In contrast, Al-Lahham et al. (2003) working with furrow irrigated tomatoes in Jordan report FC contamination of tomato fruit skin (300 FC/100g) two orders of magnitude above the WHO limit, even though the water used (2 FC/100mL) was under the WHO limit. For tomatoes
12

irrigated with potable water no faecal coliforms were detected on tomato skins. It is not clear why tomatoes irrigated with the WHO standard water in this study had such a high level of bacterial contamination. These studies highlight the interactions between irrigation methods, climate, and crop types, which should all be considered as part of a risk minimisation strategy, and indeed are often reflected in guidelines for identifying which irrigation methods are appropriate for a particular reclaimed water grade and crop type (e.g. DHS and EPA SA 1999). This is discussed in more detail later. Although these studies provide evidence that food crops can be contaminated with pathogens they provide no evidence as to whether people will actually become infected, or more specifically, whether the rate of infection will be higher than that recorded if crops were irrigated with other waters. In many countries there are no limits set for microbial content of foods such as fresh vegetables (Behrsing and Premier 2002). Information on the actual dangers of reclaimed water irrigated foods can only be provided from detailed epidemiological studies of populations (Devaux et al. 2001).
2.2.1 Health risk in theory and practise Health standards for reclaimed water use should be derived from a thorough risk assessment. In general, epidemiological evidence on the role of reclaimed water in “outbreaks” of gastroenteritis is very much limited by opportunity and efficacy of survey methods (Hunter and Syed 2001; Petterson et al. 2001; Richards 1999) and thus there are few examples in the literature which add clarity to the issue. Those that are available typically reflect use of untreated or minimally treated wastewater (e.g. Bryan 1977). In their review of 1996, Crook and Surampalli (1996) were unable to find any documented cases of viral infections resulting from wastewater reuse. In an effort to circumvent the difficulties in gathering suitable epidemiological data, with appropriate controls, researchers have developed models to estimate potential exposure and infection rates. Such an approach typically requires steps similar to those set out in Table 12 which Chang et al. (1996) used for developing guidelines for soil concentrations of pollutants from reclaimed water to reduce toxicity risks from consuming crops irrigated with reclaimed water.
Table 12 Steps used in a public health risk assessment from contaminated food (Chang et al. 1996).
Step Tasks Hazard identification Use epidemiological and environmental toxicological data and information on
chemical composition of wastewater to identify potentially toxic pollutants that should be considered
Dose and response analysis Determine the maximum permissible pollutant intake of the exposed population in the form of acceptable daily intake
Exposure path and scenario analysis
Identify environmental exposure pathways and exposure scenarios though which the population may be exposed to the pollutants
Pollutant loading computation Based on the acceptable daily intake information, exposure pathways, and exposure scenario, quantitatively determine the amount of pollutant permitted in the soil
One of the more thorough applications of the risk modelling approach can be found in Tanaka et al. (1998) who estimated the risk of infection from enteric viruses through exposure to reclaimed water through landscape irrigation (golf course), recreational impoundments (swimming), eating salad vegetables irrigated with reclaimed water, or drinking from groundwaters that had been recharged with reclaimed water. The model included different levels of water treatment using data on virus numbers from monitoring of process plants in the US. In Table 13 we summarise
13

some of the assumptions used and estimated risks of infections from some of the scenarios modelled. In evaluating the outcomes of such an approach some decision about what constitutes an acceptable risk is required. In the US-EPA reclaimed water guidelines the risk associated with consumption of fresh food crops irrigated with reclaimed water meeting the guidelines is not stated, however, the US-EPA “surface water treatment rule” for domestic potable water supply is ≤1 infection/10,000 of population. Based on this criteria Tanaka et al. (1998) concluded that the risk of infection from the use of unchlorinated effluent was too high for all uses, excepting for groundwater recharge. Chlorinated secondary effluent was found to be safe for all uses except swimming (recreational impoundments) where there was only an 80% certainty of the risk of infection being ≤1 /10,000 swimmers/yr. The results were most sensitive to the decay rate chosen for virus die off/inactivation.
Table 13 Estimated (modelled) risk of infection from enteric viruses from tertiary or secondary treated water with and without chlorination when used for recreation, crop irrigation or groundwater recharge. Derived from study of Tanaka et al. (1998) where full details of water treatment processes and other assumptions are to be found.
Application purpose Golf course irrigation
Crop irrigation Recreational impoundment
Groundwater recharge
Model assumptions Risk group receptor Golfer Consumer Swimmer Groundwater
consumer Exposure frequency Twice/week Everyday 40 days/year,
summer only Everyday
Amount of water ingested in a single exposure (mL)
1 10 100 1000
Factors reducing virus population in the environment
Stop irrigation 1 day before playing
Stop irrigation 2 weeks before harvest and shipment, viral reduction due to exposure to sunlight
No virus reduction 3m vadose zone and 6 month retention in aquifer; virus inactivation coefficient= 0.69/day
Modelled risk of infection at 95% upper confidence limit
Full treatment, 5.2 log inactivation/removal of viruses
5.5 x 10⁻⁷ 1.5 x 10⁻⁹ 1.0 x 10⁻⁴ 4.2 x 10-60 2.1 x 10⁻¹³ for inactivation coefficient of 0.1/d
Direct chlorination of secondary effluent, 3.9 log inactivation/removal of viruses
1.1 x 10⁻⁶ 2.9 x 10⁻⁸ 2.1 x 10⁻³ 8.4 x 10-59 4.1 x 10⁻¹² for inactivation coefficient of 0.1/d
Unchlorinated secondary effluent 0 log inactivation/removal
7.3 x 10⁻² 2.3 x 10⁻⁴ 6.7 x 10⁻¹ 1.3 x 10-57 3.3 x 10⁻⁸ for inactivation coefficient of 0.1/d
Although Petterson et al. (2001) also raised concerns about the sensitivity of the assumptions to die off rates of viruses, they nevertheless similarly concluded that the risk of becoming ill from enteric viruses on lettuce irrigated with reclaimed water that met the WHO standard was low, about 0.5/10,000 per consumer. They highlighted the need for more debate on what constitutes an acceptable risk for the general public and considered that the 1/10,000 of population was probably much lower than most people generally accept.
14

In the study of Rose et al. (1996) the risk of becoming infected from viruses or protozoa following the ingestion of 100mL of tertiary treated water was 10-6 to 10-8, and even though the water did not meet the US EPA Class A reclaimed water standard, the risk of infection was well below that stipulated for drinking water (10-4). Haas (1996) examined the information available on risks associated with potable water supplies in the U.S. and suggested that the infection level might actually be as high as 1/100. The paper highlights the need for better baseline information on community health and potable water supplies; until these issues are better described it will be difficult to put risks from reclaimed water into a clear perspective. Shuval et al. (1997) used a modelling approach to estimate that the probability of infection from eating 100g cucumber or lettuce/day for 150 days/yr irrigated with WHO Category A reclaimed water (<1 helminth/L and 1000 FC/100mL) was 10-6 - 10-8, well below the US EPA potable water risk level. That is, the risk associated with the WHO guidelines for coliforms is 1-2 orders of magnitude below the risk acceptable to the US-EPA for potable water. From this one would conclude that the WHO reclaimed water guidelines provide a very acceptable level of risk, even though they contain a standard of 1000 FC/100mL compared to the US-EPA guideline of 0 FC/100mL. Although Armon et al. (1994) were somewhat critical of the WHO standards, their own data indicated that vegetables irrigated with water meeting these standards had crop FC contamination levels below the WHO standard and so we would see little reason for concern. However, when they irrigated with water outside the WHO standard crops were contaminated with FC’s to an unacceptable level. In Australia Ashbolt (1998) considered an estimated risk of infection of ≤5/10,000 from the ingestion of 100mL of reclaimed water to be acceptable. The principal threats in this modelling study were from enteric viruses and Giardia. All of these studies have used modelling approaches to estimate the probability of infections occurring. The groups at greatest risk of infection by pathogens from reclaimed water are those that are likely to ingest the greatest quantities of water. As shown in the simulations of Tanaka et al. (1998) above (Table 13), the potential risk for swimmers (67%) and people exposed to irrigated recreation areas (e.g. golfers 7%) might be above acceptable limits. Working in Australia Rose et al. (1996) considered that an estimated risk of infection from landscape irrigation (based on a single 100mL ingestion) of 1 x 10⁶ was acceptable. For farm labourers (including turf) exposed directly to reclaimed water and to crops recently irrigated the risk is also likely to be high (Blumenthal et al. 1996). What other evidence is there to support these findings, and are they apparent in exposed populations? In France, Devaux et al. (2001) examined the health of farm workers exposed to reclaimed water or to “fresh” water, and with non-farm workers not exposed to reclaimed water. Studies were conducted during irrigation cycles over a three year time frame. The incidence of diahorrea found in farmers or labourers, working with reclaimed water, was no greater than in those working with fresh water, or in the population at large. However, this was a short-term study and continuous monitoring and registry would be required to pick up epidemics within the workers. Since farm workers are at the greatest risk of exposure to pathogens from reclaimed waters it would be valuable to study the level of infection in this group since the possibility of direct ingestion of the water and probable consumption of recently irrigated and raw produce provides an indication of risk and infection under a worse case scenario. Targeting this smaller group could provide cost effective epidemiological evidence of the actual risk of infection associated with reclaimed water use. Shuval (2003) reviewed the WHO and US-EPA standards and concluded that the United States of America (US) standards are unnecessary from a public health viewpoint, and very difficult to achieve and consistently maintain without expensive technological infrastructure. He also points out that the US-EPA standard for unrestricted irrigation with surface waters is 1000 faecal
15
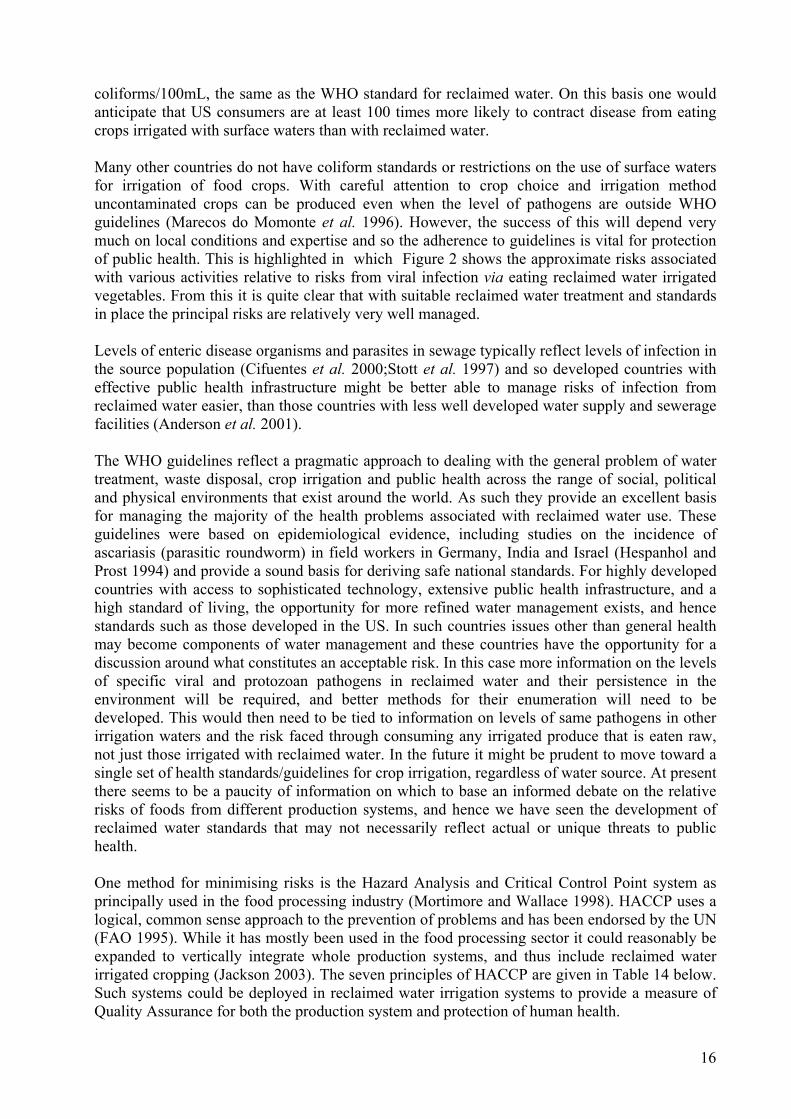
coliforms/100mL, the same as the WHO standard for reclaimed water. On this basis one would anticipate that US consumers are at least 100 times more likely to contract disease from eating crops irrigated with surface waters than with reclaimed water. Many other countries do not have coliform standards or restrictions on the use of surface waters for irrigation of food crops. With careful attention to crop choice and irrigation method uncontaminated crops can be produced even when the level of pathogens are outside WHO guidelines (Marecos do Momonte et al. 1996). However, the success of this will depend very much on local conditions and expertise and so the adherence to guidelines is vital for protection of public health. This is highlighted in which Figure 2 shows the approximate risks associated with various activities relative to risks from viral infection via eating reclaimed water irrigated vegetables. From this it is quite clear that with suitable reclaimed water treatment and standards in place the principal risks are relatively very well managed. Levels of enteric disease organisms and parasites in sewage typically reflect levels of infection in the source population (Cifuentes et al. 2000;Stott et al. 1997) and so developed countries with effective public health infrastructure might be better able to manage risks of infection from reclaimed water easier, than those countries with less well developed water supply and sewerage facilities (Anderson et al. 2001). The WHO guidelines reflect a pragmatic approach to dealing with the general problem of water treatment, waste disposal, crop irrigation and public health across the range of social, political and physical environments that exist around the world. As such they provide an excellent basis for managing the majority of the health problems associated with reclaimed water use. These guidelines were based on epidemiological evidence, including studies on the incidence of ascariasis (parasitic roundworm) in field workers in Germany, India and Israel (Hespanhol and Prost 1994) and provide a sound basis for deriving safe national standards. For highly developed countries with access to sophisticated technology, extensive public health infrastructure, and a high standard of living, the opportunity for more refined water management exists, and hence standards such as those developed in the US. In such countries issues other than general health may become components of water management and these countries have the opportunity for a discussion around what constitutes an acceptable risk. In this case more information on the levels of specific viral and protozoan pathogens in reclaimed water and their persistence in the environment will be required, and better methods for their enumeration will need to be developed. This would then need to be tied to information on levels of same pathogens in other irrigation waters and the risk faced through consuming any irrigated produce that is eaten raw, not just those irrigated with reclaimed water. In the future it might be prudent to move toward a single set of health standards/guidelines for crop irrigation, regardless of water source. At present there seems to be a paucity of information on which to base an informed debate on the relative risks of foods from different production systems, and hence we have seen the development of reclaimed water standards that may not necessarily reflect actual or unique threats to public health. One method for minimising risks is the Hazard Analysis and Critical Control Point system as principally used in the food processing industry (Mortimore and Wallace 1998). HACCP uses a logical, common sense approach to the prevention of problems and has been endorsed by the UN (FAO 1995). While it has mostly been used in the food processing sector it could reasonably be expanded to vertically integrate whole production systems, and thus include reclaimed water irrigated cropping (Jackson 2003). The seven principles of HACCP are given in Table 14 below. Such systems could be deployed in reclaimed water irrigation systems to provide a measure of Quality Assurance for both the production system and protection of human health.
16

Table 14 Principles of Hazard Analysis and Critical Control Point system. Principle Practise
1 Conduct hazard analysis Identify steps in process (construct flow chart), possible hazards and control measures
2 Determine critical control points Identify where control is critical to ensure safety 3 Establish critical limits Describe measureable quantities for quality/safety parameters 4 Establish system to monitor critical
control points Document monitoring frequency, responsibilities, and actions to be taken when results obtained
5 Establish corrective actions Procedures to ensure quality is restored and hazards removed 6 Establish procedures to verify system is
working Quality Assurance in place for HACCP process
7 Documentation Documentation of process, monitoring results, actions taken, deviations form critical limits
adapted from Mortimore and Wallace (1998)
1.6
671
1628
15299
60947
226684
1111111
1
1 10 100 1,000 10,000 100,000 1,000,000
Virus from reclaimed water produce
Contracting leprosy
Dying of skin cancer
Contracting Ross River Virus
Contracting Hepatitis
Having a stroke
Having diabetes
Having asthma
Cases/10 million people
Figure 2 Estimated number of viral infection events from reclaimed produce in Australia
compared to other events. Values are plotted on log scale/10 million of population (from Australian Bureau of Statistics and Shuval et al. 1997).
2.3 Produce contamination and food standards As discussed previously, to become infected with a pathogen from reclaimed water initially requires ingestion of that water. However, what other contaminants are there in reclaimed water that might pose a health concern? In terms of direct or acute threats to human health, given the small amount of reclaimed water (treated to appropriate standards) ingested when eating a plant grown with it, the acute risk to human health is insignificant. However, one area that not enough is known about is stable trace-organic substances in reclaimed water. The environmental risks are probably not greater than for other sources of water (Pettygrove et al. 1985), however others have highlighted that not enough is known of algal toxins (Cooper et al. 1996), hormone steroids (Ying et al. 2002a) and other trace organic substances (Kookana et al. 2003; Ying et al. 2002b), which may accumulate in the environment and in the food chain.
17

There are many other compounds that need to be considered due to their accumulation in the soil and possible transfer to humans via the food chain. While irrigation water moves quickly through the soil and back to the atmosphere via evaporation or plant transpiration, or to groundwaters through recharge, the contaminants that are carried in the irrigation water are deposited in the soil or taken up by plants through their roots in the transpiration stream. A few highly mobile compounds may move with recharge water. It is imperative that compounds taken up in the transpiration stream and deposited in plant tissues do not reach levels toxic to consumers. Whether this happens depends on the concentration of the compounds in the irrigation water, the capacity of the receiving soil to accumulate and hold them in a form available to plants, and the ability of particular crop plants to accumulate high levels in the edible portion. The capacity of a given soil to accumulate high concentrations of plant available compounds depends on complex soil chemical interactions between the soil solid phase, soil pH, soil water, and the suite of ions present in soil and irrigation water. 2.3.1 Nitrogen and Phosphorous Nitrogen and phosphorus in reclaimed water used for irrigation of crops do not usually cause problems for humans. However, high concentrations of nitrate nitrogen (NO3
--N) can cause problems for human health in drinking waters as NO3
- is converted to NO2- in the digestive tract
and this combines with haemoglobin in the blood, reducing O2 carrying capacity which can lead to brain damage. Nitrate is not normally accumulated in high enough concentrations in food crops, considering their daily into, to be a problem for human health (Broadbent and Reisenauer 1985). Leaf crops typically accumulate the highest levels of NO3
- (Bergman 1992), if it’s available in the soil. However, consumers do not often eat sufficient amounts for problems to occur. High NO3
- concentrations in plants are much more likely to be a problem for grazing ruminants than humans (Harris and Rhodes 1969). The exception to this may be spinach which can accumulate as much as 3.8% of its dry weight as NO3
- (Marschner 1995) if grown in high NO3
- environments and high quantities are consumed. Phosphorus in reclaimed water is mostly immobilised in the soil and, as plants do not generally accumulate P, the amounts taken up by plants do not cause problems for humans. The chemicals of most concern, with respect to produce quality and food standards, are heavy metals such as lead, cadmium and arsenic, and possibly trace organic compounds (Chang et al. 1996). These chemicals are discussed in more detail in the following sections.
2.3.2 Metals and metalloids The loading of metals or metalloids applied to the soil through irrigation with reclaimed water is directly related to the concentration of them in the reclaimed water, and ultimately dependent on the inflow into the sewage treatment plant and the treatment processes used. Simple loading calculations can be used to calculate the maximum potential for accumulation of metals in soils (e.g. (metal concentration x water volume/ha x years of irrigation)/weight of top soil/ha). More detailed modelling should consider crop removal and possible leaching of heavy metals through the soil profile.
Heavy metals are predominantly adsorbed to the solid phase (biosolid) of the treatment process (Bunel et al. 1995; Pettygrove et al. 1985). Concentrations for metal and metalloids in reclaimed water are generally within or below ANZECC long-term trigger values and are usually below ANZECC short-term trigger values (ANZECC and ARMCANZ 2000; Smith et al. 1996; Stevens et al. 2000). Even though heavy metals are generally not found in high enough concentration in reclaimed waters to be a direct threat to human health they do have potentially harmful effects and should be monitored (Bahri 1998; Chang et al. 1996). Similarly, effects from long-term accumulation of heavy metals on plant growth should not be ignored as this could affect the
18

long-term sustainability of a reclaimed water irrigation scheme (Smith et al. 1996; Stevens et al. 2003a).
Metal and metalloid mobility and bioavailability in soil varies significantly with soil properties for similar total soil concentrations. Some metals pose little hazard to food chain contamination due to their strong phytotoxic effects (i.e. increasing metal concentrations cause mortality before transfer to the next trophic level has an opportunity to occur). This has been termed the “soil-plant barrier” and metals can fall into four groups based on their retention in soil and translocation within the plant (Table 15). Cadmium has been identified as the major heavy metal of concern in sewage as it is, relative to most other metals, more available to plants and is found at concentrations in harvestable portions of the crops that could be harmful to humans, but show now toxic signs to the plant.
Appropriate thresholds for inorganic contaminants in agricultural soils have not yet been derived in Australia (McLaughlin et al. 2000). The National Environmental Protection Council (NEPC) in 2000 released the National Environmental Protection Measure (NEPM), which included suggested health-based investigation levels (HBILs) for contaminants in soils. These were developed principally for urban or residential areas and are not appropriate for application to agricultural areas (unless these are being developed for residential use). A second series of investigation levels, Interim Urban Environmental Investigation Levels (EILs), were developed based on environmental thresholds, with plant phytotoxicity being used as the critical risk pathway. There are several shortcomings in using these EILs to assess contaminant risks in agricultural soils (McLaughlin et al. 2000), including lack of consideration of soil microbial risk pathways (i.e. risk of contaminants to soil health), poor inclusion of soil background concentrations and the drawbacks associated with using total contaminant concentrations to assess risk (i.e. a lack of appreciation of contaminant bioavailability).
Nevertheless, the NEPM EILs are forming the basis for the draft National Guidelines for Sewerage Systems - Biosolids Management, which are used for agricultural soils. In Victoria, the Draft Environmental Guidelines for Biosolids Management are still under review by the Victorian EPA, but the last draft of the guidelines (February 2000) proposed Receiving Soil Contamination Ceiling Levels (RSCCLs) very similar to the NEPM EILs, except that Cd has a RSCCL of 1 mg/kg instead of 3 mg/kg in the NEPM EIL (Table 16); Note also that the NEPM specifies EILs for phosphorus of 2000 mg/kg, sulfur 600 mg/kg and sulfate 2000 mg/kg). Other states have defined similar soil limit values for sludge application to agricultural soils (McLaughlin et al. 2000). Queensland have adopted NSW guidelines as an interim measure until they can finalise their guidelines.
Table 15 Metal and metalloid bioavailability grouping Group Metal Soil adsorption Phytotoxicity Food chain risk 1 Ag, Cr, Sn, Ti,
Y and Zr Low solubility and strong retention in soil
Low Little risk because they are not taken up to any extent by plants
2 As, Hg and Pb Strongly sorbed by soil colloids
Plant roots may adsorb them but not translate to shoots or generally not phytotoxic except at very high concentrations
Pose minimal risks to the human food chain
3 B, Cu, Mn, Mo, Ni and Zn,
Less strongly sorbed by soil than group 1& 2.
Readily taken up by plants, and are phytotoxic at concentrations that pose little risk to human health.
Conceptually, the “soil-plant barrier” protects the food chain for these elements
4 Cd, Co, Mo and Se,
Least of all metals Pose human or animal health risks at plant tissue concentrations which are not generally phytotoxic.
Bioaccumulation through the soil-plant-animal food chain.
Source (Chaney 1980)
19

Table 16 Soil Contaminant Investigation Levels (mg/kg)
SUBSTANCES Health Investigation Levels (HILs)1 EILs10 Background A D E F Interim 5 Ranges6 METALS/METALLOIDS Urban
Arsenic(total) 100 400 200 500 20 1 to 50 Barium 300 300 100 - 300 Beryllium 20 80 40 100 Cadmium 20 80 40 100 3 1 Chromium(III) 12% 48% 24% 60% 400 Chromium(IV) 100 400 200 500 1 Chromium(Total)*7 5-1000 Cobalt 100 400 200 500 1 to 40 Copper 1000 4000 2000 5000 100 2-100 Lead 300 1200 600 1500 600 2-200 Manganese 1500 6000 3000 7500 500 850 Methyl mercury 10 40 20 Mercury (inorganic) 15 60 30 1 0.03 Nickel 600 2400 600 3000 60 5-500 Vanadium 50 20 - 500 50 20-500 Zinc 7000 28000 14000 35000 200 10-300 OTHER Boron 3000 12000 6000 15000 Cyanides(Complexe 500 2000 1000 2500 Cyanides(free) 250 1000 500 1250 Phosphorus 2000 Sulfur 600 Sulfate9 2000 Source (Victorian_EPA 2000) 1Human exposure settings based on land use have been established for HILs (see Taylor and Langley 1998). These are: A. 'Standard' residential with garden/accessible soil (home-grown produce contributing less than 10% of vegetable and fruit intake; no poultry): this category includes children’s day-care centres, kindergartens, preschools and primary schools. D. Residential with minimal opportunities for soil access: includes dwellings with fully and permanently paved yard space such as high-rise apartments and flats. E. Parks, recreational open space and playing fields: includes secondary schools. F. Commercial/Industrial: includes premises such as shops and offices as well as factories and industrial sites. (For details on derivation of HILs for human exposure settings based on land use see Schedule B(7A). 2 Site and contaminant specific: on site sampling is the preferred approach for estimating poultry and plant uptake. Exposure estimates may then be compared to the relevant ADIs, PTWIs and GDs. 3 Site and contaminant specific: on site sampling is the preferred approach for estimating plant uptake. . Exposure estimates may then be compared to the relevant ADIs, PTWIs and GDs. 4 These will be developed for regional areas by jurisdictions as required. 5 Interim EILs for the urban setting are based on considerations of phytotoxicity, ANZECC B levels, and soil survey data from urban residential properties in four Australian capital cities. 6 Background ranges, where HILs or EILs are set, are taken from the Field Geologist’s Manual, compiled by D A Berkman, Third Edition 1989. Publisher – The Australasian Institute of Mining & Metallurgy. This publication contains information on a more extensive list of soil elements than is included in this Table. Another source of information is Contaminated Sites Monograph No. 4: Trace Element Concentrations in Soils from Rural & Urban Areas of Australia, 1995. South Australian Health Commission. 7 Valence state not distinguished – expected as Cr (III). 8 The carbon number is an ‘equivalent carbon number’ based on a method that standardises according to boiling point. It is a method used by some analytical laboratories to report carbon numbers for chemicals evaluated on a boiling point GC column. 9 For protection of built structures. 10Ecological Investigation Levels (EILs)
20

2.3.3 Maximum levels of metals/metalloid contaminants in food
Heavy metal uptake by plants varies greatly between plant species and part. For example, the fruiting organ generally contains the least Cd and the leaves higher concentrations. These concentrations can vary from <0.5 to 15 mg Cd/kg dry matter, depending on the species (Davis 1984). Therefore, any crop that has a leaf as the edible part has a much greater risk of containing high levels of Cd in a given situation. The potential risk of cadmium uptake is higher for root and tuber vegetables, leafy vegetables and peanuts (AFFA 2001). However, many factors influence the phytoavailability of metals in soil. Some of the major factors are soil pH, clay content, organic matter, salinity of irrigation water, and plant species and cultivars.
Arsenic, cadmium, mercury and lead are the main inorganic contaminants likely to be scrutinised in relation to food quality (Table 17). Lead is rarely an issue in terms of crop uptake, as the metal is strongly sorbed by soil and if taken up by roots, is rarely translocated to edible plant parts. Where lead contamination has been identified, this is usually due to aerial contamination of the produce, either through dust contamination, or uptake of atmospheric lead derived from automobile or industrial sources. Similarly, arsenic is strongly retained by soil and is generally not regarded as a high risk for food chain contamination.
It is unlikely that either chromium or nickel pose great risks as these elements are often strongly adsorbed or precipitated in soils. For chromium, elemental speciation is critical in assessing risks, as the Cr(III) form is non toxic and precipitated in soil, while Cr(IV) is highly toxic and mobile. It has been known for some time that after addition of soluble metals to soil, availability of the metal decreases with time. This decrease is initially associated with adsorption of metals to soil surfaces, but in the longer-term, slower “fixation” reactions appear to proceed which continue to reduce metal bio- and phyto- availability. Metal adsorption needs to be distinguished from metal fixation – the former leads to a reversible binding of metal to the soil solid phase, while the latter leads to an irreversible (or less reversible) binding of metal to soil. The heavy metals added with reclaimed water are usually added slowly over a long period of time, assisting slower fixation and lower phytoavailability in the long-term.
21

Table 17 Maximum level of metal contaminant in food
Contaminant and food Contaminant mg/kg as consumed Arsenic (total)
Cereals 1 Arsenic (inorganic) Crustacea 2 Fish 2 Molluscs 1 Seaweed (edible kelp) 1
Cadmium Chocolate and cocoa products 0.5 Kidney of cattle, sheep and pig 2.5 Leafy vegetables (as specified in Schedule 4 to Standard 1.4.2) 0.1 Liver of cattle, sheep and pig 1.25 Meat of cattle, sheep and pig (excluding offal) 0.05 Molluscs (excluding dredge/bluff oysters and queen scallops) 2 Peanuts 0.1 Rice 0.1 Root and tuber vegetables (as specified in Schedule 4 to Standard 1.4.2) 0.1 Wheat 0.1
Lead Brassicas 0.3 Cereals, Pulses and Legumes 0.2 Edible offal of cattle, sheep, pig and poultry 0.5 Fish 0.5 Fruit 0.1 Infant formulae 0.02 Meat of cattle, sheep, pig and poultry (excluding offal) 0.1 Molluscs 2 Vegetables (except brassicas) 0. 1
Mercury Crustacea mean level of 0.5* Fish (as specified in Schedule 4 to Standard 1.4.2) and fish products, excluding gemfish, billfish (including marlin), southern bluefin tuna, barramundi, ling, orange roughy, rays and all species of shark 0.5* Gemfish, billfish (including marlin), southern bluefin tuna, barramundi, ling, orange roughy, rays and all species of shark 1* Fish for which insufficient samples 1 Molluscs 0.5*
Tin All canned foods 250 Source (ANZFA 2001. * mean level of.
In the case of cadmium, while insignificant amounts of Cd are added to the soil in reclaimed water, changes in soil salinity and chloride concentrations due to reclaimed water use has the potential to increase phytotoxicity of Cd already present in the soil (McLaughlin et al. 1994). In summary, heavy metals in reclaimed water are generally insignificant, however potentially an issue if guideline values are exceeded and thus should be monitored. Loading rates of heavy metals in irrigation water can be easily calculated and potential issues identified with readily available guidelines.
2.3.4 Organic contaminants In addition to pathogens, viruses, heavy metals and nutrients, reclaimed water may also contain organic compounds (Abdulraheem 1989; Chang et al. 1996; Gallegos et al. 1999). The levels and compositions of these compounds in reclaimed water depend on the waste input and
22

treatment technology. Organics in raw wastewater include humic substances, faecal matter, kitchen wastes, detergents, oils, drugs and industrial wastes. Although wastewater treatment, in general significantly reduces organic matter in reclaimed water, there may still be some toxic organic compounds that remain. The toxic organics in reclaimed water are highly heterogeneous, containing molecules of various weights, ranging from simple compounds to very complex polymers (e.g. Paxeus 1996; Ternes et al. 1999). Those that may pose risks to food quality and human health include disinfection byproducts (DBPs), pesticides, organohalogens (PCBs and dioxins), hydrocarbons, phthalates and flame-retardants, surfactants, hormones (naturally excreted by animals and humans, or synthesized as drugs), pharmaceuticals and personal care products, as well as algal toxins. Unfortunately little information is available on the potential impact of these organic compounds in reclaimed water on food quality. Food quality could be affected through various mechanisms: uptake by plants, toxicity to soil microorganisms and plants. Chemical residues in harvested crops are the main concern in terms of food quality and human health. The organic compounds in reclaimed wastewater used in agriculture may be taken up by plants via four main pathways (Polder et al. 1995; Topp et al. 1986) viz.
(a) root uptake followed by translocation in the plant’s transpiration stream (i.e. liquid phase transfer);
(b) absorption by roots or shoots of volatilized organics from the surrounding air (i.e. vapour phase transfer);
(c) uptake by external contamination of the above-ground parts of plants by wastewater, soil and dust, followed by retention in the cuticle or penetration through it; and
(d) uptake and transport in oil channels which are found in some oil-containing plants such as carrots.
One of the best examples on uptake by plants is that of phthalates. Di-n-butyl phthalate (DBP) is a compound used widely in plastics manufacture and is found throughout man-made environments. Although it can be broken down in the soil by bacteria, concentrations of DBP in fruit, shoot and root of capsicum fruit were observed to increase with the increase of soil-applied DBP (Yin et al. 2003). Vitamin C and capsaicin contents in fruit were found negatively correlated to DBP concentration in the fruit, which suggest that DBP uptake by plants might impact on fruit quality. Although DBP has a relatively low toxicity, this work also highlights the pathways for the potential transfer of organic contaminants to humans through the food chain. Their presence in food have been implicated in a number of human effects (e.g. declining sperm count, Shaw and McCully 2002). Some organic compounds in reclaimed wastewater such as natural hormones and contraceptive drugs, and surfactant degradation products (nonylphenols and octylphenols) are endocrine disrupting chemicals (EDCs). These may interfere with the normal functioning of endocrine systems, thus affecting reproduction and development in wildlife and human beings (Jobling et al. 1998; Ying and Kookana 2002), usually through more direct contact/ingestion than via a plant mediated pathway. Hormone steroids in the environment may affect not only wildlife and humans but also plants (Lim et al. 2000; Shore et al. 1995). Alfalfa irrigated with sewage effluent, which contained hormone steroids, has been observed to have elevated levels of phytoestrogens (Shore et al. 1995). To-date, there is little evidence to suggest a high risk to human health through changes in crops quality, when grown with reclaimed water. However, there is also a scarcity of data.
23

Toxic blue-green algae blooms (cyanobacteria) in storage facilities and transfer of toxins to vegetables irrigated with this water is also possible (Codd et al. 1999; Cooper et al. 1996). Research assessing this is limited. Endotoxins may occur in drinking waters, even after treatment. Rapala et al. (2002) measured 3-15 endotoxin units in treated drinking waters and were unable to unequivocally assign their origin to cyanobacteria that were present in the water. One study in South Australia (Kelly and Stevens 2002; Table 18) found potentially toxic species of algae in both reclaimed and ground water storages. Only one species (Microcystis flos-aquae) was found in significant numbers, in reclaimed waters. However, algae are not obligate toxin producers and toxin production varies both spatially and temporally, depending on the particular strain of the species that is dominant and/or the prevailing environmental conditions. Thus it is not always possible to predict when toxic compounds are present. One of the key determinants of algal population size is the rate of water turnover, whether it be in rivers (CSIRO 1996) or tanks and dams. Tanks have a higher rate of water turnover due to their relatively lower storage volume, which may limit algae growth. Consequently when there is high demand, turnover is short and there is generally insufficient time for the development of algal blooms and an increase in turbulence in storage due to receiving and removal of water (Kelly and Stevens 2002).
Table 18 Blue-green algae found in on-farm storages of reclaimed (RW) or ground (GW) water in South Australia (from Kelly and Stevens 2002).
Taxa Maximum count (cells/mL)
Water source
Anaebaena 19,300 GW, dam Anabaenopsis 9,800 GW, dam Aphanizomenon <1 GW, dam Arthrospira 42 RW, dam Microcystis 178,000 RW, dam and tank Lyngbya <1 RW, tank Oscillatoria 1 GW, dam Phormidium 40 GW & RW, dam and tank Planktothrix 872 GW & RW, dam and tank Pseudanabaena 400 GW & RW, dam and tank
2.3.5 Maximum levels of organic contaminants in food Due to the potential adverse effects of organics in reclaimed water on the environment and food quality, some countries have set out irrigation water quality criteria for selected organics (Chang et al. 1996). Food Standards Australia New Zealand has regulations on the maximum levels of specified non-metal contaminants and natural toxins in nominated foods (FSANZ 2003) although these regulations are not set for organic contaminants in irrigation water. Because of the large number of compounds and their potential impact on food quality, and the limited amount of scientific information available, it is impractical to establish maximum permissible levels for the hundreds of organic compounds that may be present in reclaimed water and thus the Australian guidelines (ANZECC and ARMCANZ 2000) do not include safe levels of organic compounds for protection of human health. In the U.S. Chang et al. (1996) have listed what they consider acceptable levels in the soil of a range of organic chemicals and residues based on a risk assessment approach, which included epidemiological and toxicological data, acceptable daily intakes, environmental exposures and plant pollutant uptake (Table 19). Such an approach might usefully be developed in Australia if data was collected on the concentrations of these compounds in soils irrigated with reclaimed and other irrigation waters.
24

Table 19 Estimated maximum allowable pollutant concentration in reclaimed water irrigated soils to prevent accumulation of toxic levels of organic contaminants in food crops. Based on a risk assessment approach, which includes epidemiological and toxicological data, acceptable daily intakes, environmental exposures and plant pollutant uptake (from Chang et al. 1996).
Constituent
Maximum concentration
in soil (mg/kg DW)
Constituent
Maximum concentration
in soil (mg/kg DW)
Aldrin 0.2 Hexachloroethane 2 Benzene 0.03 Pyrene 480 Benzo(a)pyrene 3 Lindane 0.6 Chlorodane 0.3 Methoxychlor 20 Chlorobenzene ID Pentachlorophenol 320 Chloroform 2 PCB’s 30 Dichlorophenols ID Tetrachloroethane 4 2,4-D 10 Tetrachloroethylene 250 DDT ID Toluene 50 Dieldrin 0.03 Toxaphene 9 Heptachlor 1 2,4,5-T ID Henachlorobenzene 40 2,3,7,8, TCDD 30 ID = insufficient data for computation
In discussing the issue of blue-green algae toxins in irrigation water the Australian and New Zealand Guidelines for Fresh and Marine Water Quality guidelines (ANZECC and ARMCANZ 2000) conclude that “No trigger values for cyanobacteria in irrigation waters are recommended at this time”. In summary, reclaimed water contains a cocktail of organic chemicals, belonging to different structural classes and having different adverse effects on organisms. Although the concentrations of these organics in reclaimed wastewater may be relatively low, the use of reclaimed water to irrigate crops may still pose risks to the environment, food quality and human health. Continued monitoring of organics in reclaimed water used for irrigation, and in soils, is needed to build sufficient data to further assess the potential risks to environmental and human health. While it is accepted that there will be some difficulties in identification and measurement of organic compounds in reclaimed water, some new and novel technologies could develop in the future. For example, Ono et al. (1996) used an assay of error-prone repair dependent DNA in Salmonella typhimurium as indicator of toxicity of organic compounds from reclaimed water. Such approaches are worthy of investigation since they may give an initial indication of potential problems, without knowing what toxic compounds might be present. If necessary, this could then be followed by identification of the active compounds.
3.0 Plant nutrition and crop production In terms of crop nutrition, the unique characteristics of reclaimed water compared to other water sources are principally a high nutrient content (N, P, K, Ca) and, to a lesser extent, high salt and boron (B) content. The N, P, K and Ca can be beneficial if carefully managed, whereas other salts and B tend to be detrimental, although in some cases the extra B may alleviate B deficiency (Smith 1982). For growers that are able to successfully balance these attributes reclaimed water may provide an attractive alternative to other, less fertile, water sources. The challenge is to manage the crop demands for water and nutrients (Table 20) in a single package as opposed to managing them more independently; as occurs with other irrigation waters. In general terms,
25

since reclaimed water crops are irrigated, plant growth is not usually water limited and therefore crop nutrient demand/uptake would be near maximal where systems are well managed. In the following section we assume that the amount of reclaimed water applied to crops matches crop demand.
3.1 Nutrient management for maximal crop yield and quality Crops vary enormously in their nutritive demands, requiring macronutrients (N, K, Mg, P, Ca and S) in greater amounts than micronutrients (Na, Cl, Fe, Mn, Cu, Zn, Mo). The ratio of these nutrients in plants varies, but approximates 7N:1P:10K, tending higher in N for leaf crops, higher in P for root crops, and higher in K for many fruits.
Table 21 gives an indication of the ratios of N:P:K in a range of horticultural crops and produce. Nutrient management strategies usually aim to provide elements in similar ratios to those required by the crop to be fertilised, balancing these requirements with nutrients already available in the soil.
Table 20 Elements essential for plant growth, approximate concentrations in plant tissue and general roles in plant metabolism (adapted from Atwell et al. 1999).
Element Symbol Approximate concentration
Mobility Roles
Macronutrients (% dry matter) Nitrogen N 2.5 mobile •
•
•
• •
•
basis of proteins Potassium K 1.0 mobile remain in ionic form, osmotic adjustment,
enzyme activation Magnesium Mg 0.2 variable remain in ionic form, osmotic adjustment,
enzyme activation Phosphorus P 0.2 mobile lipids, cell membranes, nucleic acids Calcium Ca 0.2 immobile remain in ionic form, osmotic adjustment,
enzyme activation Sulphur S 0.1 variable basis of proteins
Micronutrients (mg/kg dry matter) Sodium Na 500 mobile •
•
• • • •
remain in ionic form, osmotic adjustment, enzyme activation
Chlorine Cl 100 mobile remain in ionic form, osmotic adjustment, enzyme activation
Iron Fe 100 immobile Boron B 12 immobile cell wall maintenance, unknown Manganese Mn 20 immobile Zinc Zn 20 variable Copper Cu 3 variable Nickel Ni 0.1 mobile
components of some proteins, coenzymes
Molybdenum Mo 0.1 variable
Table 21 Macronutrient (N, P and K) ratios in crops and produce of selected fruit and vegetables (calculated from Sceswell and Huett 1998).
Crop Part N P K Cabbage Whole 6 1 6 Lettuce Whole 6 1 10 Curd 22 1 36 Cauliflower Leaf 11 1 14 Whole 5 1 6 Celery Whole 12 1 18 Capsicum Whole 10 1 17
26

Fruit 6 1 8 Cucumber Leaf and stem 6 1 9 Whole 5 1 11 Leaf and stem 2 1 3 Tomato Fruit 2 1 4 Whole 2 1 4 Root 3 1 7 Carrots Leaf 6 1 10 Whole 7 1 6 Tuber 9 1 12 Potato Leaf and stem 17 1 16 Whole 11 1 13
How do nutrient ratios in reclaimed water compare with crop nutrient demands? The N to P ratio (ca 9:1) provides an adequate base for a fertiliser application regime, while the cations (K, Ca and Mg) are in relative abundance (Table 22). In studies comparing growth and yield of crops irrigated with reclaimed or “fresh” water, reclaimed water irrigated crops have often yielded higher in both the absence (Kouraa et al. 2002) and presence (Maurer et al. ) of additional fertilisers. In terms of nutrient ratios, reclaimed waters also tend to have a higher proportion of sodium relative to other cations (K, Ca, Mg). This is discussed further in the effects of salinity section.
Table 22 Nutrients and nutrient ratios in a reclaimed water from Adelaide South Australia (calculated from Kelly et al. 2001).
N P K Ca Mg Na Cl B
Element (mg/L) 10.3 1.2 47 40 31 275 382 0.36
Ratio N:P:K 9 1 39 Ratio N:P:K:Ca:Mg 9 1 39 33 26
Nutrient ratios are only the first step in a nutrient management regime since the quantities of nutrient required must be calculated from estimates of crop demand (yield). In the case of reclaimed water irrigation, nutrients are applied when water is used to meet crop water demands, not necessarily when plant nutrient demand is highest. Consequently if water and nutrient demands are not matched over fertilisation may result, depending on the nutrient concentrations in the reclaimed water. Under fertilisation in not an issue as this can be easily corrected through the application of fertilisers. If reclaimed water is the only source of water, the amount of nutrient applied in the irrigation water is determined by the irrigation demand of the crop. Kelly and Stevens (2000) estimated the percentage of crop nutrient requirement provided in a reclaimed water scheme in South Australia. From this (Table 23) it can be seen that for most of the crops investigated, <50% of the plant’s N and P needs could have been met from the reclaimed water, while 150 -1200 % of the amount of K in harvested produce was provided in the reclaimed water. It should be noted that not all of the nutrients applied as fertiliser or in reclaimed water will be available for plant uptake since plants typically take up no more than 50% of applied N (Bacon 1994) or P (Ryden and Pratt 1980). In other experiments in Australia Kaddous and Stubbs (1983) found that reclaimed water contributed means of 60% (N), 33% (P), and 40% (K) of the requirements of a range of crops. This was 35% saving in fertiliser costs at their irrigation rates. Similarly, Smith (1982) found that across crops and seasons, irrigation with reclaimed water saved up to 75% of fertiliser costs, and between 0.64 and 5.6 ML/ha of groundwater/crop, and there was no significant accumulation of heavy metals in soils or crops. They also found that crop yields were higher when irrigated with reclaimed water and had supplementary fertiliser
27

than when irrigated with groundwater and supplementary fertiliser. This difference was attributed to a more regular fertiliser addition via the reclaimed irrigation water which better matched crop growth, than for groundwater irrigated crops which had fertiliser applied prior to sowing or as a side dressing. Where the “normal” fertiliser regime was used in conjunction with reclaimed water, crops (lettuce, carrots, cabbage, celery, spinach, tomatoes) suffered delayed maturity and a higher percentage of non-marketable produce.
Table 23 Nutrients applied in reclaimed water as a percentage of nutrient removed in crop produce (from Kelly and Stevens 2000).
Nutrient applied in reclaimed water as a percentage of nutrient removed
in crop (%) Crop Yield (t/ha) N P K Cabbage 50 35 25 160 Capsicum 20 126 150 341 Carrots 44 25 32 87 Cauliflower 50 43 26 175 Celery 190 17 8 34 Cucumber 18 416 271 1180 Lettuce 50 62 40 157 Potato 40 55 56 183 Tomato 194 53 27 143
The importance of interactions between water and N in crop production has been well studied (Pier and Doerge 1995) and it is not necessary to discuss them here as they are not unique to reclaimed water irrigation. For reclaimed water irrigated crops, matching water and N supply can be difficult since growers lose some control over the timing of fertiliser application (Baier and Fryer 1973). If periods of peak crop water demand do not match peak N demand then N supply may be in excess of crop requirements. This may cause produce quality or yield decline, depending on the crop being grown or environmental problems off site. These problems are complicated and need to be addressed on a site by site basis, as nitrogen is probably the most variable component of reclaimed water (Westcot and Ayers 1984). Sams (1999) summarised the effects of fertility on produce texture, indicating that N, P and K can reduce fruit firmness. Excessive K, relative to Ca, can increase fruit textural disorders. Calcium was highlighted as being the element most critical to fruit quality as it contributes more to the maintenance of firmness than any other element, and may be more significant than storage conditions for some fruits such as apples. Thus the relatively high cation content (particularly Ca2+) of reclaimed water might contribute to improved firmness and textural quality of fruits.
Baier and Fryer (1973) reviewed the principal concerns that relate to over-fertilisation of horticultural crops with N. A precis of the major issues is as follows. If too much N is applied yield can be reduced, particularly for perennial crops. The date of maturation of crops may also change (but not yield), or fruit size can decrease (e.g. peaches). Grape varieties respond differently to excess N, Malbec is very sensitive and Pinot Noir one of the least sensitive. The principal problem for grapevines is caused by pre-flower bud shatter when tissue nitrate-N reaches 1%. Problems may persist for more than one year if cane wood quality declines and impacts on next year’s growth and yield. Grapes can also accumulate phytotoxic levels of NO3
-. In potatoes and sugar beets too much N results in excessive vegetative growth and thus fewer and smaller tubers. Navel and Valencia oranges - when fertilised during the summer with excessive N (>17g/m2) produce grainy, pulpy oranges with less juice, and over-fertilised Valencia’s can also re-green when ripe. Lemons are rarely affected by over-fertilisation. Most
28

stone fruit suffer a delay in maturation from over-fertilisation rather than a direct decrease in quality, this is because high N levels keep the plants vegetative for longer and this uses up carbohydrates which are normally stored in the fruit. With melons and squash the excessive vegetative growth may keep moisture content high around fruit and provide conditions conducive to development of rots. It is unlikely that over-fertilisation with P will occur from reclaimed water irrigation, since most of the P will be immobilised in the soil and not be readily available to plants (Ryden and Pratt 1980). Where N applied in the irrigation water exceeds the demand of annual crops, perennial crops can be grown as a management tool as these may have higher capacity for N uptake (Pettygrove et al. 1985). The above provides an example of what can happen with over-fertilisation with N, whether reclaimed water or any water source that contain elevated concentrations of nitrogen. Zekri and Koo (1994) examined citrus fruit quality and production at some 32 sites irrigated with reclaimed or groundwater and concluded that over the 6 year period that any differences in fruit yield and quality were due to differences in total water applied (reclaimed water sites had more water applied) and not due to constituents of the water. Although there were higher levels of some ions in the leaves of reclaimed water irrigated plants the fruit quality remained well within acceptable standards. In studies with vines trickle irrigated with reclaimed water or well water (Neilsen et al. 1989a), yields of reclaimed water irrigated vines were higher than well water irrigated vines, despite application of >34g N/vine/yr for vines irrigated with well water. They concluded that the additional P and K applied in the reclaimed water contributed to the increased yield. Although this obviously reflects poor crop nutrition rather than beneficial effects of the reclaimed water per se, it does serve to illustrate the economic value of the contributions to crop production afforded by reclaimed water. These authors found similar results from parallel studies on apples (Neilsen et al. 1989b) and cherries (Neilsen et al. 1989c). For potatoes in Australia, Premier et al. (2000) found that the use of reclaimed water (effectively only secondarily treated) for irrigation achieved very similar yields, potato size, disease levels, post harvest storage life, colour, and cooking characteristics, to freshwater irrigated crops. Heavy metal concentrations were also similar in both sets of potatoes, being well below risk levels. They concluded that potatoes grown with reclaimed water were of an equivalent quality to freshwater irrigated crops. In general reclaimed water provides an excellent nutrient source for food crop production that can reduce grower fertiliser costs, provided that careful attention is paid to nutrient budgeting. There is little evidence to suggest that reclaimed water irrigated crops, managed appropriately, produce food of lower quality or shelf life than crops irrigated with other waters, and in some cases, such as tomato, crops may have enhanced flavour when irrigated with reclaimed water.
3.2 Managing sodium, chloride and boron
3.2.1 Sodium and chloride effects on crops Managing nutrient inputs is only one issue for reclaimed water irrigation that is different to other water sources, another more difficult issue, is managing salts, particularly sodium (Na+) and Chloride (Cl-). In terms of suitability for irrigation of crops, this is probably the factor of greatest concern (Westcot and Ayers 1984). The effect of salinity may be osmotic, which impacts on energy expenditure and water uptake, or it may be due to specific ion toxicities, particularly Na+ or Cl- in leaves where they are left behind from the transpiration stream (hence toxic symptoms often first appear in tips or margins of older leaves). Since plants typically have a relatively low requirement for Cl-, generally no more than that provided in rainfall, the amounts presented in reclaimed water will potentially accumulate to toxic levels for many crops. Similarly for Na+, in the field situation deficiency has never been observed, even though some crops such as the beets
29

(Beta spp.) have a relatively high requirement for Na+, which under normal conditions contributes substantially to osmotic adjustment (Mengal and Kirkby 1978). As plants typically retain <2% of the water they take up, the concentration of salt in the plant will be >50 times that of the soil solution, unless it is excluded at the root. If sprinkler irrigation is used, direct absorption into leaves may also occur and toxicity symptoms may manifest at relatively low irrigation water salinities (Westcot and Ayers 1984). Plants which exhibit salinity tolerance usually have an ability to exclude or control Na+ and Cl- uptake (Storey and Walker 1999), but since the mechanisms for Na+ and Cl- exclusion are different, good Cl- excluders are not always effective Na+ excluders and vice versa (Atwell et al. 1999). Another way in which salinity may affect crop growth is reportedly through interference with nutrition of other elements. Garcia and Charbaji (1993) demonstrated that most plants maintain a constant sum of cations (in milli equivalents/L, not including Na+) and where Na+ displaces other cations (e.g. K+) an imbalance occurs. Thus plants that have salinity tolerance should be able to maintain cationic quantity and balance. They propose that a measure of the stability of the sum of cations for plants grown under saline conditions is an excellent indicator of salinity tolerance. This would appear to be a relatively simple, but effective, way of examining differences in plant varieties’ and species’ salinity tolerance and further validation of this is warranted. As a means of reducing the impact of cation imbalance on crops irrigated with reclaimed water Wu et al. (1995) has suggested, where water softeners contribute significantly to sewage Na loading, the substitution of KCl for NaCl in water softeners. There is a voluminous literature on the effects of salinity on crops since it is a widespread problem relating to many irrigation waters (i.e. not just reclaimed water) and to dryland agriculture (see Maas and Hoffman 1977; Shannon and Grieve 1999). In this section we will review the principal issues that relate to irrigation with saline waters, regardless of origin. There is some confusion in the literature in relation to plant responses to salinity and its amelioration, much of which may relate to the variety of experimental conditions used. For example, where plants are grown in nutrient deficient conditions at a range of salinities, they may respond to increased nutrition (Grattan and Grieve 1999b). This gives the impression that improved nutrition can overcome effects of salinity, when in fact the response is to nutrients and there is no interaction with salinity. Improved nutrition thus increases crop growth and productivity under saline conditions only when nutrition is more limiting than salinity (Feigin et al. 1991). Secondly the types of salts used in experiments are also important and can influence the interpretation of results. Most controlled experiments utilise NaCl as the only salt, whereas in many irrigation waters Ca++ is also an important contributor to salinity, particularly at lower salinity levels. During evaporative concentration Ca++ tends to precipitate out and so the Na+:Ca++ ratio would be expected to increase with lagooning of reclaimed waters. Nevertheless the response of plants to Ca++ and Na+ are different. Similarly the anion composition is important with SO4
2- and HCO3
- making up considerable fractions of the ionic mix in saline waters (e.g. Table 3), but most often neglected in pot studies. The actual combination of salts/ions in the soil is important since the ratios of these ions dictate both the chemical and physical properties of the soil and their suitability for crop growth (Rengasamy and Bourne 1998). Furthermore the soil water content at which experiments are done may also influence results (Shannon and Grieve 1999) as the concentration of salt in the soil water increases as the soil dries out. The ability of plants to withstand the varied osmotic and toxicity effects of saline waters and soils also depends on characteristics of the plants’ and other soil factors. It is thus not always possible to state categorically at what concentrations, of which salts, problems will arise for particular crops. However, crops can be ranked in general terms to their sensitivity to saline irrigation waters and soils. The important points to note are that: (a) vegetable crops are generally more sensitive to salinity than field crops; (b) although many woody fruit crops are
30

very sensitive to salinity, saline tolerant root stocks are available and are often used for increasing the salinity tolerance of crops; (c) sensitivity to salinity increases with soil clay content; and (d) for some species, sensitivity increases with leaf exposure to sprinkler irrigation with saline water. The effects of salinity on horticultural crops were well reviewed in 1999 for vegetable (Shannon and Grieve 1999), citrus (Storey and Walker 1999) and tomato (Cuartero and Fernandez-Munoz 1999) crops, as was the interaction between salinity and mineral nutrition (Grattan and Grieve 1999b). We summarise the key findings of these reviews below. For citrus, which are probably the most sensitive group, Cl- toxicity in leaves, which causes leaf burn, is the principal problem. The major pathway to alleviate this is through the use of rootstocks that are able to greatly reduce the uptake of Cl-. In the case of Na+ there is little evidence for marked differences in ability to exclude salt at the root, but evidence that Na+ may be remobilised around the plant that can reduce leaf toxicity. The Chloride concentration in leaves ranges at least 10 fold between salt excluding and salt sensitive rootstocks, while Na+ concentration varies by no more than 6 fold. An example of the importance of rootstock in determining uptake and accumulation of ions under saline conditions is illustrated in Table 24. From this it can be seen that salt “tolerance” in citrus comes mostly from salt exclusion at the root rather than through tolerance to high ion concentration in leaves. In general, yield of citrus declines by about 13% for each 1 dS/m (saturated soil extract) above 1.4 dS/m in the soil. For three year old Navel orange trees in Spain, Reboll et al. (2000) found no decline in fruit quality or yield when flood irrigated with reclaimed water for three years. They did not indicate whether the plants were own-rooted or whether root stocks were used. Soil Cl- levels at the site were relatively low, but it is likely that in time the salinity level of the soil will increase and this could cause problems in a longer time frame than considered in their study. Clearly, when growing citrus trees with saline waters, trees should be grafted on to salt excluding rootstock to minimise yield losses. However, this may have little impact on specific ion toxicity (Na+ and Cl-) if sprinkler irrigation is used and saline water is deposited directly on to the foliage of the scions that are not able to exclude salt. The interaction between irrigation method and crop production from reclaimed waters is discussed later.
Table 24 Leaf and root tissue water ion concentration in root stocks highlighting differences in ion exclusion as a basis for selection of rootstocks for grafting of productive citrus trees (adapted from Atwell et al. 1999).
K+ Na+ Cl- Rootstock sensitivity to salt Leaves Roots Leaves Roots Leaves Roots
High 192 107 60 96 50 89 Low 320 138 25 109 140 106
Grapevines are similar to citrus with respect to the impact of rootstock on salinity tolerance of scions, and thus changing the rootstock can eliminate leaf burn and maintain grape yields (Walker et al. 2002). Cass et al. (1995) highlighted that most vines in Australia would be suffering substantial yield penalties due to salinity of normal irrigation waters and soils if not grafted on to salt tolerant rootstocks. Table 25 demonstrates the control of Cl- uptake and Na+/K+ balance as a function of grapevine rootstock.
Table 25. Cl-, Na+ and K+ content of grapevine petioles and laminae of scions of grapes on “own roots” or grafted on to salt tolerant rootstocks (Atwell et al. 1999).
Ion content (%DM) Petioles Cl- Na+ K+ Own roots 1.64 0.57 0.74
31

Rootstock 1 0.29 0.07 3.08 Rootstock 2 0.15 0.09 3.83 Laminae Own roots 0.248 0.113 0.69 Rootstock 1 0.039 0.038 0.72 Rootstock 2 0.028 0.036 0.76
Vines that are sprinkler irrigated may be more sensitive to Na+ and Cl- than vines not sprinkler irrigated since the salts are readily absorbed by the leaves without the benefit of the salt excluding rootstocks. In this case, Francois and Clark (1979) found that the presence of counter-ions (Ca++ or SO4
=) did not reduce Na+ or Cl- absorption. It has been shown that high sodium, chloride and potassium may reduce (McCarthy and Downton 1981) or increase (Walker et al. 2002) wine quality, and that this can be managed to some extent by choice of rootstock (Cass et al. 1995; Walker et al. 2002). However, the European Economic Community requires wines to have <1g/L NaCl and so to maintain wine quality and export markets it is important that the levels of these ions in grapes and wines be kept down (Lee 1990), and thus for wine grape production from saline irrigation waters, efforts need to be focussed on reducing ion concentrations in the fruit, especially Cl-, through careful selection of rootstocks and irrigation management (timing and leaching fraction, Stevens et al. 1999; Stevens and Walker 2002). This is made difficult by further interactions with other soil properties such as salinity and waterlogging (Stevens and Walker 2002), and so very careful research and planning will be required if suitable grapes are to be produced from saline reclaimed water. Cuartero and Fernandez-Munoz (1999) summarised research on salinity and tomatoes. The key points were:
(a) Germination and early growth is sensitive to salinity, but this can be minimised by “priming” the seeds or seedlings with low-moderate concentrations of saline water prior to planting out;
(b) Salinity tends not to affect the dry matter distribution between fruit, shoot and root; (c) Fruit weight, but not fruit dry matter, declines with increasing salinity, thus the effect of
saline irrigation water is probably osmotic rather than a specific ion toxicity. Irrigation with 5-6 dS/m water results in a 10% yield reduction (fruit size), and with 8 dS/m a 30% reduction in fruit size/yield;
(d) Since fruit size is reduced by salinity it might be prudent to use smaller fruited varieties and cherry tomatoes under saline conditions;
(e) Fruit development and maturation is faster under saline conditions; (f) Blossom end rot, caused by a local Ca++ deficiency at the distal placental fruit tissue, can
increase under saline conditions due to reduced Ca++ uptake, but can be reduced to some extent with varietal selection, particularly for smaller fruited varieties;
(g) Salinity enhances tomato fruit taste by increasing both sugars and acids, but tends to produce more acid fruit as salinity increases from 2 – 9 dS/m;
(h) Shelf-life of fruit is not reduced for long shelf-life varieties, although fruit produced from saline irrigated crops is more susceptible to handling damage due to higher CO2 and ethylene production on injury; and
(i) Crop nutrition needs to be optimised to minimise effects of salinity wherever possible, since crops may be more sensitive to high or low P, or N availability due to interactive effects. Similarly attention should be paid to maintaining high Ca++ nutrition that can help reduce Na+ uptake and increase both Ca++ and K+ uptake, which are generally depressed under saline conditions.
Overall, tomatoes provide an attractive option for irrigation with reclaimed water, for although they are considered moderately sensitive to salinity, fruit size (and thus yield) does
32

not decrease until irrigation water salinities rise above 2.5 – 3.0 dS/m and saline waters enhance the flavour. Table 26 to 30 collate data on the sensitivity of a range of crops to saline irrigation water, and saline soils, the data are derived from a number of sources (principally ANZECC and ARMCANZ 2000; Kelly et al. 2001; Maas 1987).
Table 26 Average root zone salinity tolerance of vegetable and fruit crops, threshold irrigation water salinities before yield loss as a function of soil type, and % yield loss/dS/m after threshold is reached (collated from ANZECC and ARMCANZ 2000; Kelly et al. 2001; Maas 1987). (se = saturation paste extract).
Maximum irrigation water salinity before yield loss
Common name Scientific name
Average root salinity
tolerance (ECse dS/m)
sandy soil
dS/m loamy
soil clay soil
% Yield loss
/dS ECse Beet sugar Beta vulgaris 7.0 11.0 6.3 3.7 9.0 Kale Brassica campestris 6.5 3.3 4.7 2.7 Zucchini Cucurbita pepo melopepo 4.7 7.3 4.2 2.4 9.4 Rosemary Rosmarinus lockwoodii 4.5 5.7 3.3 1.9 Asparagus Asparagus officinalis 4.1 5.2 3.0 1.7 2.0 Beet, garden Beta vulgaris 4.0 6.5 3.7 2.1 Olive Olea europaea 4.0 5.1 2.9 1.7 Peach Prunus persica 3.2 4.7 2.7 1.6 21.0 Squash, scallop Cucurbita pepo melopepo 3.2 4.8 2.7 1.6 16.0 Broccoli Brassica oleracee 2.8 3.3 2.8 1.6 9.2 Cauliflower Brassica oleracea 2.5 3.3 1.8 1.1 Cucumber Cucumis sativus 2.5 3.3 2.4 1.4 13.0 Pea Pisum sativum L. 2.5 3.3 1.8 1.1 10.6 Squash Cucurbita maxima 2.5 3.2 1.8 1.1 Tomato Lycopersicon esculentum 2.3 3.5 2.0 1.2 9.9 Rockrnelon Cucumis melo 2.2 4.6 2.6 1.5 8.4 Spinach Spinacia oleracea 2.0 4.2 2.4 1.4 7.6 Cabbage Brassica oleracea (var. Capitata) 1.8 3.5 2.0 1.2 9.7 Celery Apium graveolens 1.8 3.3 2.5 1.4 6.2 Grapefruit Citrus paradisi 1.8 3.3 1.7 1.0 13.5 Orange Citrus sinensis 1.7 3.3 1.7 1.0 13.1 Potato Solanum tuberosum 1.7 3.2 1.8 1.1 12.0 Pumpkin Cucurbita pepo pepo 1.7 Sweet corn Zea mays 1.7 3.3 1.8 1.1 12.0 Broad bean Vicia faba 1.6 3.3 1.9 1.1 Almond Prunus dulcis 1.5 2.7 1.5 0.9 19.0 Grape Vitis S pp. 1.5 3.3 1.9 1.1 9.6 Pepper Capsicum annum 1.5 3.3 1.6 0.9 14.0 Plum Prunus domestica 1.5 2.5 1.4 0.8 31.0 Sweet potato Ipomoea batatas 1.5 3.0 1.7 1.0 Avocado Persea Americana 1.3 2.3 1.3 0.8 Avocado Persea americana 1.3 2.3 1.3 0.8 Lettuce Lactuca sativa 1.3 3.3 1.5 0.9 13.0 Onion Allium cepa 1.2 3.3 0.8 16.0 Radish Raphanus sativus 1.2 1.5 0.9 0.5 13.0 Eggplant Solanum melongena 1.1 3.2 1.8 1.1 6.9 Apple Malus sylvestris 1.0 2.0 1.2 0.7 Bean Phaseolus vulgaris 1.0 1.9 1.1 0.6 19.0 Carrot Daucus carota 1.0 3.3 1.2 0.7 14.0 Lemon Citrus limon 1.0 1.3 0.7 0.4 12.8 Pear Pyrus spp. 1.0 1.3 0.7 0.4 Strawberry Fragaria spp 1.0 1.6 0.9 0.5 33.0 Turnip Brassica rapus 0.9 2.5 1.4 0.8
1.3
33

Table 27 Average root zone salinity tolerance of horticultural plants and threshold irrigation water salinities before visible damage to plants. Collated from Hayr and Gordon )
Maximum irrigation water salinity before yield loss
Common name Scientific name
Average root salinity
tolerance (ECse dS/m)
sandy soil
EC dS/m loamy
soil clay soil
Algerian ivy Hodera camationsis 1.0 1.3 0.7 0.4 Chinese holly Ilex comuta 1.0 1.3 0.7 0.4 Dodonea Dodonea viscosa 1.0 2.9 1.7 1.0 Viburnum Viburnum spp. 1.4 2.8 1.6 0.9 Bambatsi Panicum coloratum 1.5 5.8 3.3 1.9 Bottlebrush Callistemon viminalis 1.5 1.9 1.1 0.6 Juniper Juniperus chinensis 1.5 3.3 1.9 1.1 Xylosma Xylosma senticosa 1.5 2.9 1.7 1.0 Star jasmine Trachelosperumum jasmincides 1.6 2.0 1.2 0.7 Boxwood Buxus microphylia var. Japonica 1.7 3.3 1.9 1.1 Lantana Lantana camera 1.8 3.3 1.3 0.8 Privet Ligustrum lucidum 2.0 3.9 2.2 1.3 Pyracantha Pyracantha braperi 2.0 3.9 2.2 1.3 Aborvitae Thuja orientalus 4.0 6.5 3.7 2.1 Dracaena Dracaena andivisa 4.0 6.5 3.7 2.1 Euonymus Euonymus japonica var.grandiflora 7.0 8.9 5.1 2.9 Bougainvillea Bougainvillea spectabilis 8.5 10.8 6.1 3.6
Table 28 Effect of sodium expressed as sodium adsorption ratio (SAR) on crop yield and quality under non-saline conditions (ANZECC and ARMCANZ 2000).
SAR tolerance and range Crop Growth response under field conditions Extremely sensitive SAR = 2–8
Avocado, deciduous fruits, nuts, citrus
Leaf tip burn, leaf scorch
Sensitive SAR = 8–18
Beans Stunted growth
Medium SAR = 18–46
Clover, oats, tall fescue, rice, dallis grass
Stunted growth, possible sodium toxicity, possible calcium or magnesium deficiency
High SAR = 46–102
Wheat, cotton, lucerne, barley, beets, rhodes grass
Stunted growth, soil structural problems
Table 29 Approximate sodium concentration (mg/L) that can cause foliar injury in plants from saline sprinkling water. Degree of injury is affected by site-specific environmental and agricultural conditions.
Sensitive <115
Moderately sensitive115–230
Moderately tolerant230–460
Tolerant >460
Almond Pepper Barley Cauliflower Apricot Potato Maize Cotton Citrus Tomato Cucumber Sugar beet Plum Lucerne Sunflower Grape Safflower
Sesame Sorghum Source (ANZECC and ARMCANZ 2000)
34

Table 30 Tolerance of some fruit crop cultivars and rootstocks to chloride.
Crop Rootstock or cultivar Max. Cl- in soil water without leaf injury
Rootstock (mg/L) West Indian 535 Guatemalan 425 Avocado Mexican 355 Sunki mandarin, grapefruit, Cleopatra mandarin, Rangapur lemon 1,775 Sampson tangelo, rough lemon, sour orange, Ponkan mandarin 1,065 Citrus Citrumelo 4475, trifoliate orange, Cuban shaddock, Calamondin, sweet orange, Savage citrange, Rusk citrange, Troyer citrange 710
Salt Creek, 1613-3 2,840 Grape Dog ridge 2,130 Marianna 1,775 Lovell, Shalil 710 Stone fruit Yunnan 355
Cultivar Boysenberry 710 Olallie blackberry 710 Berries Indian Summer raspberry 355 Thompson seedless, Perlette 1,420 Grape Cardinal, Black rose 710 Lassen 535 Strawberry Shasta 355
Modified from: Maas 1986
3.2.2 Boron Boron (B) is a micro-nutrient that is required by plants in small amounts (<500g/ha) but nevertheless B deficiency is a widespread problem across much of the world (Shorrocks 1997). Although B concentrations are not often reported, reclaimed water may have higher levels of B than other irrigation waters (Table 31). One possible source of B in reclaimed water is from water softeners. Some soils also have naturally elevated levels of boron, particularly in the sub-soil (Nuttall et al. 2003; Ryan et al. 1998), and relatively low concentrations of B added to these soils can lead to a toxic response presenting itself in sensitive crops in reclaimed water irrigation systems. While crops may suffer toxicity, the concentrations found in crops, typically 12 mg/kg (Atwell et al. 1999), generally do not pose a threat to human health and no recommended dietary intake for humans has been set. However, Ferreyra et al. (1997) reported B concentrations, when irrigated with high boron river water (<17 mg/L), as high as 864 mg/kg for potato, 1000 mg/kg for maize and 1880 mg/kg for squash were reported by. These values were much higher than reported elsewhere in the literature and are above what would normally be considered phytotoxic. However, they argued that since this irrigation had been practised for hundreds of years, that local selection had favoured development of crop species tolerant to abnormally high B levels. Human toxicity, even under such high B fertility, has not yet been reported.
Table 31 Boron concentration (mg/L) in reclaimed and other irrigation waters Country Reclaimed water Ground (G), Well (W)
or River (R) water Source
Spain 1.0 0.16 (G) (Reboll et al. 2000) Chile 7.5 – 17.2 (R) (Ferreyra et al. 1997) FL, USA 0.14 0.02 (W) (Zekri and Koo 1994) Canada 2.6 not measured (Neilsen et al. 1989c) CA, USA 0.6 – 1.3 (Asano et al. 1985) Australia 0.36 0.16 (G) (Kelly et al. 2001) Italy 1.91 0.64 (Meli et al. 2002)
35

Special care is needed in the management of boron because there is only a small concentration range between plant deficiency and toxicity. Excess boron can accumulate in the root zone if it is not leached down through soil, leading to toxicity problems. Boron toxicity typically appears first in older leaves and includes a yellowing and brown speckling pattern found between the veins and near the edge of the leaf, followed by the edges gradually turning brown and dying (necrotic tissue). Other symptoms include yellowing (chlorosis), tip burn, cupping of the leaves, reduced size, premature leaf drop and the development of a red, pink, purple or bluish band surrounding the edge of a chlorotic leaf (anthocyanins). Yield reductions are likely to occur before visible symptoms of boron toxicity occur, so tissue analysis is an important tool to assess any potential for yield reduction resulting from boron toxicity. Boron can be leached from soil by rainfall or irrigation leaching fractions. However, leaching of boron can be difficult because the rate of removal can be much slower for boron than for other salts, as boron can be attracted to or absorbed by soil particles. In many cases, leaching is unlikely to provide a permanent solution because more boron will be resupplied through breakdown of naturally occurring boron-containing minerals in the soil (Keren and Bingham 1985) and from further irrigation water additions. Kelly et al. (2001) studied B in irrigation waters and soil in a reclaimed water system in South Australia. Reclaimed water from the scheme had a higher concentration of boron (average of 0.36 mg/L) than local groundwater (0.15 - 0.17 mg/L) (see Stevens et al. 2003b also). Comparisons were made of the boron levels between three, differentially managed, soils in the region: 1. soil irrigated with groundwater; 2. soil irrigated with reclaimed water previously available from the Bolivar outfall channel
(lower quality than the current Class A water); and 3. virgin, unirrigated soil.
At the soil surface, reclaimed water irrigated soils had higher average boron concentrations than virgin and groundwater irrigated soils (Figure 3). Even though the average surface soil boron concentration increased with the use of reclaimed water, it remained below the toxic threshold value. However, there were large variations in the data recorded for the soils, as was also reported by Ryan et al. (1998), so growers need to verify their own soil boron concentrations. In the subsoil, irrigation with reclaimed water led to decreases in boron concentration compared with virgin soil while irrigation with local groundwater reduced the concentration of boron all the way through the soil profile (Figure 3). These decreases probably occurred as a result of leaching of boron down through the soil. Because of the variation in tolerance between different crop varieties, one method of management is to grow more tolerant plant species or varieties in areas with high boron levels in irrigation water or soil. Table 32 shows the concentration of boron in irrigation and soil water tolerated by various agricultural crops without reduction in yield or vegetative growth. These values provide a guide only, as the rate of uptake of boron by plants and therefore their tolerance will depend on other factors such as soil texture. Generally, higher uptake rates are seen in sandy soils and lower rates in clayey soils. Uptake rate is also much lower at soil pH of 7.5 - 9.5 and plants can tolerate higher soil boron levels at these soil pHs.
36

37
Figure 3 Change in soil boron concentration for soils irrigated with three types of water on the Northern Adelaide Plains. Note: Soil boron concentration is a log scale. The red line indicates toxic yield threshold above which yield reduction begin to occur. Source (Stevens et al. 2003b)
Saturation paste extract B (mg/kg soil)
0.2 0.3 0.5 0.8 1.3 2.5 4.9
Soil
dept
h in
terv
al (c
m)
90-100
80-90
70-80
60-70
50-60
40-50
30-40
20-30
10-20
0-10
| |
BoreReclaimed waterVirginMaximum standard error| |
Toxic threshold value
There is some confusion in the literature with respect to the tolerance of different cops to boron in irrigation waters. For example Westcot and Ayers (1984) and ANZECC and ARMCANZ (2000) cite asparagus as being tolerant of 6 - 16 mg/L boron, yet Keren and Bingham (1985) quotes a value of 2 - 4 mg/L and for tomato 1 – 2 (Keren and Bingham 1985) vs 4 – 6 mg/L (ANZECC and ARMCANZ 2000; Westcot and Ayers 1984). Clearly more work needs be done to better define some of these trigger values. Differences between values may be a result of culture conditions, and interactions with other ions. For example, Ferreyra et al. (1997) provide convincing data indicating that plants grown under saline conditions may have lower boron uptake then expected, and the effects may thus not be additive. Working in different environments and with other crop cultivars, some other authors have observed this (eg El-Motaium et al. 1994) and some not (Grattan and Grieve 1999a). Environment and cultivar may thus impact substantially on the ability of crop systems to tolerant boron and salt. The relationship between these four factors (salt, boron, cultivar and climate) illustrates the complexity of the issues for both researchers and growers. Further work in this arena is warranted, or at least a decision tree developed to highlight when further investigation or attention is required. Researchers studying the response of a number of crops to excess boron found that onion was relatively tolerant to B, with yield not declining until B reached 9 mg/L in the culture solution (Francois 1992, 1984, 1988, 1991). In contrast, garlic bulb size and yield was reduced from 4 mg/L B. For celery receiving >10 mg/L B, produce was bitter tasting and not of marketable quality, whereas for lettuce leaf damage was only on the outer wrapper leaves which could easily be removed. Fruit size, and thus yield, of tomato was reduced at B concentrations above 6 mg/L. For zucchini and squash fruit number and not fruit size were reduced at B concentrations above 1 mg/L.

The tolerance of Prunus rootstocks to boron and salinity were studied by El-Motaium et al. (1994). They found that there was large variation in B tolerance of different rootstocks, which the B toxicity was manifest in Prunus stems and not leaves, and that increasing salinity reduced B uptake. They recommended that for scions on Prunus rootstocks B toxicity be assessed on stems and not leaves. Table 32 Maximum boron concentrations in irrigation or soil water tolerated by a variety of
crops, without reduction in yields. Tolerance Concentration of boron in
irrigation or soil water (mg/L)
Crop
Very sensitive < 0.5 Blackberry, lemon, avocado, grapefruit Sensitive 0.5-1.0 Peach, cherry, plum, grape, onion, garlic, sweet potato,
wheat, sunflower, mung bean, sesame, lupin, strawberry, Jerusalem artichoke, kidney bean, lima bean, snap bean, peanut
Moderately sensitive
1.0-2.0 Broccoli, capsicum, pea, carrot, radish, potato, cucumber, lettuce, olive, pumpkin, radish,
Moderately tolerant 2.0-4.0 Cabbage, turnip, bluegrass, oat, corn, artichoke, tobacco, mustard, sweet clover, squash, musk melon, barley, cowpea, cauliflower
Tolerant 4.0-6.0 Tomato, alfalfa, purple vetch, parsley, red beet, sugar-beet Very tolerant 6.0-15.0 Asparagus, celery, sorghum, cotton
Source (ANZECC and ARMCANZ 2000; Keren and Bingham 1985) There is a narrow window between plant B deficiency and toxicity, and although soils in many regions of the world suffer from B deficiency, B toxicity may be a problem in reclaimed water irrigation systems, since reclaimed water contains a higher concentration of B than most other irrigation waters. In a very few regions of the world, such as low-rainfall south eastern Australia, soils may have naturally toxic concentrations of B, providing a greater challenge for reclaimed water systems. Crop and varietal selection affords the greatest opportunity for managing yield loss and crop quality, but more work is needed to clarify the relative tolerance of crops and cultivars, and the interaction with salinity and climate.
38

4.0 Turf and landscape culture with reclaimed water Turf grasses are well suited to the nutrients applied in reclaimed water since, effectively being a leaf crop, they have a relatively high N requirement and are often tolerant of salt and flooding (George et al. 1984), and mowing removes toxic ions as they accumulate in leaves. Furthermore maximal production is not usually required, as they are for cash crops, and so growth reduction due to salinity may not be a major drawback. The principal problem with turf irrigation is protecting workers and the public from direct water ingestion if the pathogen levels are high enough to present a significant risk. One way to reduce the likelihood of water ingestion is to use subsurface irrigation, and indeed in the U.S. one university has had buried drip lines operating under turf for >20 years (George et al. 1984). Such an approach would afford the greatest level of health protection. Mujeriego et al. (1996) described a reclaimed water system for irrigation of a golf course in Portugal. In the system described by this author the reclaimed water was chlorinated in the pipe on way from the treatment plant to the golf course where it was stored in a reservoir. With respect to risks from pathogens the chlorination kept FC’s well below acceptable limits. Although some microbial regrowth was observed in the storage ponds, the species present were not determined, though they were not Salmonella. Mosquitoes in the storage ponds were controlled by the introduction of pathogenic fungal inoculants and regular trimming of emergent vegetation around, and in, the storage ponds. The chlorination was originally the responsibility of the golf course. However, this was not effective and consequently the responsibility for disinfection became the water supplier again. Initially the salinity of the reclaimed water was too high due to incursions of seawater to a local aquifer in dry years, which increased the salinity of the municipal water supply (Mujeriego et al. 1996). This problem was overcome when another freshwater supply was used to augment the domestic water supply system. In wetter years this problem was not apparent. After 8 years of golf course irrigation the salinity of the water has not been a problem, excepting for two greens that have poor drainage. The study found that the nutrient content of the reclaimed water varied considerably, resulting in over-fertilisation in summer and under-fertilisation in winter. To circumvent this problem two storage ponds were used to produce different quality waters to manage nutrient inputs. In cases where excessive N was applied in summer, the turf was observed to suffer from fungal infections (Puccinia, Fusarium, Sclerotinia) in the following autumn. Low Fe compared to N and P meant that some Fe deficiency was observed in the turf. Iron chelate application overcame this deficiency. Nevertheless substantial savings were achieved in fertiliser applications through using the reclaimed water. All heavy metals were below the limits recommended for continuous irrigation with reclaimed water. Overall the study provides a very positive example of effectively managed solutions to the problems that arise with reclaimed water irrigation of public amenity turf.
39

Table 33 Relative salinity tolerance of turf grasses, where tolerance (dS/m) is maximum salinity at which grass grows or the point at which shoot growth is reduce by 50% (from Marcum 1999).
C3 – cool season grasses Salinity tolerance
C4 – warm season grasses
Common name Scientific name (dS/m) Common name Scientific name 40+ Disticlis spp. Saltgrass
Sporobolus virginicus Nuttall alkaligrass Weeping alkaligrass Lemon alkaligrass
Puccinellia airoides P. distans P. lemmoni
30 Paspalum vaginatum Zoysia tenuifolia Z. matrella
Seashore paspalum Mascarenegrass Manilagrass
22 Stenotaphrum secundatum St Augustinegrass 18 Zoysia spp.
Cynodon spp. Hybrid zoysiagrass Bermudagrass
15 Z. japonica Japanese lawngrass Creeping bentgrass Tall fescue
Agrostris stolonifera Festuca arundinaceae
12
Creeping red fescue
F. rubra 10
Perennial ryegrass Redtop
Lolium perenne A. alba
8 Buchloe dactyloides Buffalograss Gamma grasses
Rough bluegrass Kentucky bluegrass Chewings fescue Hard fescue Sheep fescue Meadow fescue Annual ryegrass
Poa trivialis Poa pratensis F. rubra commutata F. longifolia F. ovina F. elatior L. multiflorum
4 Ermochloa ophiuroides Axonopus spp
Centipedegrass Carpetgrass
Annual bluegrass Colonial bentgrass Velvet bentgrass
A. tenuis A.s canina
3 Paspalum notatum Bahiagrass
In the U.S secondary treated effluent is used for turf production (Hayes et al. 1992a; Hayes et al. 1992b; Mancino and Pepper 1992). The work of these researchers also highlighted that careful attention must be paid to management of N and Fe to maintain turf quality relative to irrigation with potable water, but that significant savings in fertilisers can be obtained. The high levels of P in the reclaimed water obviated the need for P fertiliser, but reduced Fe availability, which was corrected with a foliar spray of ferrous sulphate. Nitrogen fertiliser was only required on the reclaimed water plots during times of low water application (ie autumn/winter). They noted that on heavy clay and high traffic soils additional applications of gypsum may be required to maintain an adequate leaching fraction, although this is soil and water dependent. In terms of pathogens, total aerobic bacteria in soils were equivalent in potable and reclaimed water irrigated soils. Also in the U.S. Wu et al. (1996) studied growth and ion uptake by a mixture of five turf grass species irrigated with simulated wastewater with varying concentrations of ions but with no nutrient (N, P, S) enrichment. The turf was fertilised every second month during the study. Growth rates of the five species were not influenced significantly by the ionic concentrations of the irrigation water (0.57 – 6.05 dS/m). The study showed that at lower ion concentrations (2.3 dS/m) >60% of the added Cl- was removed in grass herbage clippings. They concluded that turf grass could be very effectively irrigated with reclaimed water. Table 33 ranks the tolerance of turf grasses to salinity (review by Marcum 1999). Information on the effects of reclaimed water irrigation water on landscape plants are less well known. Wu et al. (1995) conducted some studies on nine species of landscape plants sprinkler
40

irrigated with fresh water or a synthetic wastewater containing KCl, MgCl2 and CaCl2. They found that after 12 weeks of irrigation, plants that took up less chloride grew better than those that accumulated chloride (Table 34). Leaf Mg, Ca and K concentration were up slightly in some species but down in others. They concluded that Cl- accumulation in the leaves was the most important factor limiting the use of the wastewater for irrigation of sensitive species. In the case of Australian native plants used in landscape plantings, reclaimed water may carry an additional risk of phosphorus “poisoning” (Wajon et al. 1999). Most of these plants evolved in very low P environments and suffer from P excess at low available P levels (Pate et al. 2001).
Table 34 Shoot weight and leaf Cl- concentration of landscape plants irrigated with fresh water or a synthetic “wastewater” containing KCl, MgCl2 and CaCl2 (from Wu et al. 1995).
Shoot dry weight (g/plant)
Leaf Cl- (mg/kg)
Landscape plant Control “wastewater” Control “wastewater” Azalea 23.1 21.5 0.83 12.4 Japanese boxwood 39.2 40.3 0.84 11.1 Hydrangea 52.0 51.8 1.14 31.7 Lace fern 58.2 0.5 0.58 36.0 Nadina 27.3 6.8 0.61 12.2 Pittosporum 36.8 25.8 0.75 7.6 Hedge rose 88.2 51.2 1.15 19.7 Rhaphiolepis 32.63 38.8 0.62 1.5 Jasmine 38.8 44.7 0.58 2.6
Although Ansari et al. (1999) ranked some woody species according to their salinity and sodicity tolerance (
Table 35) they used pH as a surrogate for sodicity. This is somewhat unreliable and in general there is a dearth of data available on the suitability of landscape plants to irrigation with reclaimed water, and there is probably a need to identify those species used in Australia that are most tolerant of the several stresses imposed by irrigation with reclaimed water. If this is a significant use or market for reclaimed water, clearly more research is required to determine the sensitivity of a range of landscape plants to the macronutrients and other ions found in reclaimed water.
Table 35 Salinity and sodicity tolerance of a range of woody species (from Ansari et al. 1999).
Salinity tolerance
Woody species Salinity and sodicity
tolerance
Woody species
Moderate ECe 4-8 dS/m
Acacia auriculiformis, A. nilotica, A. saligna, Casuarina cunninghamiana, C. equisetifolia, Eucalyptus camaldulensis, E. coolabah, E. robusta, E. tereticornis, Melaleuca arcana, M. bracteata, Sesbania formosa, Leucaena lucocephala, Populus euphratica
Moderate and pH>9
Acacia auriculiformis, A. saligna, Casuarina glauca, Eucalyptus occidentalis, Melaleuca bracteata, M. halmaturorum, Tamarix aphylla
High ECe 8-16 dS/m
Acacia salicina, Casuarina glauca, C. obesa, Conocarpus lancifolius,
High and pH 9-10
Acacia nilotica, Casuarina equisetifolia, C. obesa, Eucalyptus
41

Eucalyptus occidentalis, E. rudis, Melaleuca leucadendra
camaldulensis, E. coolabah, E. tereticornis, Prosopis juliflora
Extremely high ECe >16 dS/m
Acacia ampliceps, A. machonochieana, A. stenophylla, Melaleuca halmaturorum, Prosopis juliflora, Tamarix aphylla, Tamarix articulata
Extremely high and pH >10
Acacia ampliceps, A. machonochieana, A. stenophylla, Tamarix articulata
5.0 Agricultural practices As indicated earlier there are strong interactions between agricultural practices and the efficacy of microbial quality standards for reclaimed water use. Thus many reclaimed water guidelines include recommendations on ways to reduce risks through managing interactions between reclaimed water and produce, crop selection, and harvest and post harvest techniques. Some of these are reflected in the South Australian guidelines for reclaimed water irrigation (Table 36). In general, methods that provide a physical barrier, or gap, between the reclaimed water and edible portions of crop can use lower quality water. Withholding periods can also offer a safety margin for a variety of agricultural practices.
5.1 Irrigation scheduling The first row of Table 36 illustrates the interactions between crop type, irrigation application method and water quality. It recognises that:
(a) where crops have a capacity to trap water which contains pathogens in the edible fraction, and the crop is eaten raw, the risk of consumer infection from consumption of the produce is higher;
(b) this risk can be reduced by irrigating in such a way that reclaimed water is not sprayed directly on to the crop, or the water treated to the highest standard (e.g. Class A); and
(c) if no significant amounts of reclaimed water are put on to the harvestable part of the crop then water of lower quality can be used. In moving from Class A (<10 FC/100mL) through Class B (<100 FC/100mL) to Class C (<1000 FC/100mL) these guidelines recognise orders of magnitude differences in the likelihood of significant contamination of crops that are dependent purely on method of application (spray, drip, subsurface) of irrigation water. A further order of magnitude protection is afforded where non-leaf crops are not in contact with the ground and sub-surface irrigation is used and thus reclaimed water with <10,000 FC/100mL (Class D) can even be used to produce safe crops.
In addition to affecting crop contamination with human pathogens, irrigation scheduling and application technology also affects crop health and nutrition through its effects on soil and root zone salinity, leaf scorch and ion toxicity, and nutrient acquisition. In terms of soil salinity, the concentration of salts in the soil solution increases as the soil dries out, and thus plants exposed to drying soils are faced with increasing salinity levels. Maintaining relatively constant soil moisture should thus reduce sharp transient increases in salinity. The timing of irrigation applications is also important in determining the impact of saline irrigation water on crops. For example, for grapes it has been shown (Stevens et al. 1999) that saline water (3.5 dS/m) applied at berry development caused a yield reduction (7%/dS/m) three times greater than saline water applied during berry ripening (2%/dS/m). It was thus concluded that grape yield and quality could be maintained if saline water was used during the pre-flowering and post harvest periods, but that fresh irrigation water should be used during berry development if yields were to be consistently maintained. Furthermore, both the frequency and method of application of irrigation are also important. For species that are sensitive to Cl- and
42

Na+, sprinkler irrigation with saline water greatly increases leaf absorption of these ions, which become concentrated at the leaf surface by evaporation. Where frequent sprinkler irrigations are used, plants may be seriously affected in a very short period of time. Gornat et al. (1973) found that the concentration of Cl- ions was 3.5 times greater in sprinkler irrigated tomato stems than in those trickle irrigated with the same water (3.6 dS/m), and yield was less than half. Where water of low salinity was used (0.6 dS/m) there were no differences in crop yield as a function of irrigation application method.
Table 36 Example of guidelines for reclaimed water use for horticultural irrigation, including crop type, water application methods and withholding periods (DHS and EPA SA 1999).
Type of crop
Application method
Harvesting controls
Reclaimed Water Class
1
Large surface area grown on or near the ground and consumed raw (e.g. broccoli, cabbage, cauliflower, celery, lettuce)
Spray, flood Drip, furrow Subsurface
None None None
Class A Class B Class C
2
Root crops consumed raw (e.g. carrots, onions)
Spray, drip, flood, furrow Subsurface
None Crop surface dry at harvest
Class A
Class B 3
Crops without ground contact (e.g. tomatoes, peas, beans, capsicums, non-citrus orchard fruit, non-wine grapes)
Spray Flood Drip, furrow Subsurface
None Dropped produce not to be harvested Dropped produce not to be harvested None
Class A Class B
Class C
Class D
4
Crops without ground contact and skin that is removed before consumption (e.g. citrus, nuts)
Spray Flood Drip, furrow, subsurface
Produce should not be wet from irrigation with reclaimed water when harvested Dropped citrus not to be harvested None
Class B
Class C
Class D
5
Crops with ground contact and skin that is removed before consumption (e.g. melons)
Spray Drip, flood, furrow Subsurface
Produce should not be wet from irrigation with reclaimed water when harvested Produce should not be wet from irrigation with reclaimed water when harvested None
Class B
Class C
Class D 6
Root crops processed before consumption (e.g. potatoes and beetroot)
Spray, drip, flood, furrow, subsurface
None Class C
7
Surface crops processed before consumption (e.g. brussel sprouts, pumpkins, cereals, grapes for wine making)
Spray, drip, flood, furrow Subsurface
None None
Class C
Class D 8
Crops not for human consumption Silviculture, turf growing
Any Withholding period of 4 hours or until ground dry before public access
Class D
9
Irrigation of pasture and fodder for dairy animals
Any Withholding period of 4 hours before pasture used for dairy animals; alternatively dry or ensile fodder before use. Withholding period of 5 days before pasture used for dairy animals; alternatively dry or
Class B
Class C
43

ensile fodder before use. 10
Irrigation of pasture and fodder for non-dairy animals
Any Withholding period of 4 hours before pasture used for non-dairy animals; alternatively dry or ensile fodder before use.
Class C
5.2 Grower management of reclaimed water. The differences between reclaimed water and more traditional sources of irrigation require a higher level of producer knowledge and skills, and some modification of conventional farming practices. For example, control of weeds may be more difficult under reclaimed water irrigation if nutrients are applied in a greater quantity than with other waters since weed growth may be enhanced under these conditions (e.g. Maurer and Davies 1993; Zekri and Koo 1994). However, with careful attention to crop nutritive demands, weed management problems should not be any greater than for other irrigation systems. In addition to weeds and fertilisers, growers will need to be able to assess risks of salinity and toxic boron to crop growth and crop quality attributes, and the health risks to workers and consumers from irrigation waters and contaminated produce. Provided that such information is communicated to growers in a clear and simple way, these issues should not be too difficult to manage. They are no more complex than issues dealt with by farmers in a range farming activites where managers must deal with complexities of crop and cultivar choice, chemical and fertiliser inputs, marketing and quality assurance. Farming today is a complex business, regardless of the enterprise. The challenge is to ensure that farmers are aware of the issues and are provided with cost effective avenues for seeking out available solutions.
6.0 Consumer perceptions as a barrier to industry development To-date we are unaware of any incident in the world where the reclaimed water guidelines discussed above have been followed and produce grown with reclaimed water has been ingested and impacted on human health. However, the use of reclaimed water for growing food crops can be received with suspicion by wholesalers and consumers. If they believe food quality, or their health, will be compromised by ingestion of produce grown with reclaimed water, the potential impacts on the sale of produce are enormous. With reclaimed water use, generally the public’s initial preferred options favour grey or wastewater reuse on parks and gardens (Nancarrow et al. 2003; Market Equity 2003; NWCA 2001). There are few published studies of trader and consumer attitudes to reclaimed water irrigated produce. A study of the Monterey reclaimed water reuse system in the U.S. (Sheikh et al. 1999a) found that buyers, shippers and other intermediaries accepted the produce if it was sanctioned by the regulatory authorities, and preferred no additional labelling. It was considered that any potential negative consumer perceptions could easily be overcome through the provision of factual information. Similarly, in Australia, Kracman et al. (2001) reported that providing factual information to buyers prior to the introduction of a reclaimed water irrigation scheme meant that the produce was readily accepted by wholesalers. Simpson (1999) indicated that, in time, potable reuse of wastewater will become palatable to consumers, and on this basis one would anticipate that any resistance to reclaimed water irrigated produce would be minimal. In fact, given the quality assurance associated with reclaimed water (DHS and EPA SA 1999), it is likely that reclaimed water is at an advantage compared with the absence of quality assurance of other irrigation waters is considered. Haarhoff and Vandermerwe (1996) described a potable reuse system that has been in operation for more than 25 years in Namibia, and indicates that consumer acceptance should not be a problem where consumers are well informed.
44

As water becomes an increasingly scarce and expensive resource opportunities for reclaimed water use will increase. In addition to expansion of agricultural irrigation systems there may be other opportunities for reuse for wildlife refuge and management (Greenway and Simpson 1996), in aquifer recharge or storage/retrieval (Dillon et al. 1999; Kanarek and Michail 1996; Wilson et al. 1995), and probably an expansion in turf/landscape/amenity irrigation. The biggest challenges to ensure food and turf quality, will be balancing the salts applied with reclaimed water and ensuring new chemicals of concern, found in the future, pose no threat to food quality (and subsequent human health) and yield.
45
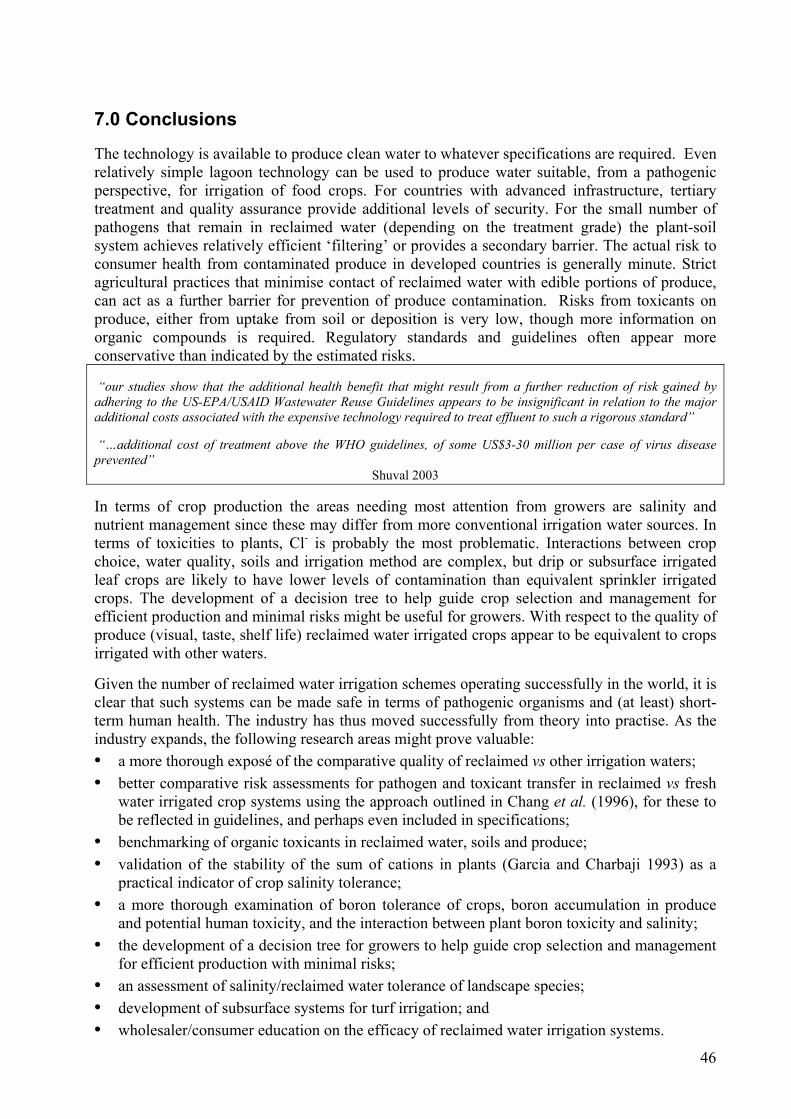
7.0 Conclusions
The technology is available to produce clean water to whatever specifications are required. Even relatively simple lagoon technology can be used to produce water suitable, from a pathogenic perspective, for irrigation of food crops. For countries with advanced infrastructure, tertiary treatment and quality assurance provide additional levels of security. For the small number of pathogens that remain in reclaimed water (depending on the treatment grade) the plant-soil system achieves relatively efficient ‘filtering’ or provides a secondary barrier. The actual risk to consumer health from contaminated produce in developed countries is generally minute. Strict agricultural practices that minimise contact of reclaimed water with edible portions of produce, can act as a further barrier for prevention of produce contamination. Risks from toxicants on produce, either from uptake from soil or deposition is very low, though more information on organic compounds is required. Regulatory standards and guidelines often appear more conservative than indicated by the estimated risks. “our studies show that the additional health benefit that might result from a further reduction of risk gained by adhering to the US-EPA/USAID Wastewater Reuse Guidelines appears to be insignificant in relation to the major additional costs associated with the expensive technology required to treat effluent to such a rigorous standard” “…additional cost of treatment above the WHO guidelines, of some US$3-30 million per case of virus disease prevented”
Shuval 2003 In terms of crop production the areas needing most attention from growers are salinity and nutrient management since these may differ from more conventional irrigation water sources. In terms of toxicities to plants, Cl- is probably the most problematic. Interactions between crop choice, water quality, soils and irrigation method are complex, but drip or subsurface irrigated leaf crops are likely to have lower levels of contamination than equivalent sprinkler irrigated crops. The development of a decision tree to help guide crop selection and management for efficient production and minimal risks might be useful for growers. With respect to the quality of produce (visual, taste, shelf life) reclaimed water irrigated crops appear to be equivalent to crops irrigated with other waters. Given the number of reclaimed water irrigation schemes operating successfully in the world, it is clear that such systems can be made safe in terms of pathogenic organisms and (at least) short-term human health. The industry has thus moved successfully from theory into practise. As the industry expands, the following research areas might prove valuable: • •
• •
•
•
• • •
a more thorough exposé of the comparative quality of reclaimed vs other irrigation waters; better comparative risk assessments for pathogen and toxicant transfer in reclaimed vs fresh water irrigated crop systems using the approach outlined in Chang et al. (1996), for these to be reflected in guidelines, and perhaps even included in specifications; benchmarking of organic toxicants in reclaimed water, soils and produce; validation of the stability of the sum of cations in plants (Garcia and Charbaji 1993) as a practical indicator of crop salinity tolerance; a more thorough examination of boron tolerance of crops, boron accumulation in produce and potential human toxicity, and the interaction between plant boron toxicity and salinity; the development of a decision tree for growers to help guide crop selection and management for efficient production with minimal risks; an assessment of salinity/reclaimed water tolerance of landscape species; development of subsurface systems for turf irrigation; and wholesaler/consumer education on the efficacy of reclaimed water irrigation systems.
46

References Abdulraheem, M. Y. (1989). Health considerations in using treated industrial and municipal effluents for irrigation.
Desalination 72, 81-113. AFFA (2001). "Guidelines for on-farm food safety for fresh produce," Department of Agriculture Fisheries and
Forestry Australia. Al-Lahham, O., El Assi, N. M., and Fayyad, M. (2003). Impact of treated wastewater irrigation on quality attributes
and contamination of tomato fruit. Agricultural Water Management 61, 51-62. Anderson, J., Adin, A., Crook, J., Davis, C., Hultquist, R., Jiminez-Cisneros, B., Kennedy, W., Sheikh, B., and van
der Merwe, B. (2001). Climbing the ladder: a step by step approach to international guidelines for water recycling. Water Science & Technology 43, 1-8.
Anderson, J. M. (1996). Current water recycling initiatives in australia - scenarios for the 21st century. Water Science & Technology 33, 37-43.
Angelakis, A. N., Do Monte, M., Bontoux, L., and Asano, T. (1999). The status of wastewater reuse practice in the Mediterranean basin: Need for guidelines. Water Research. 33, 2201-2217.
Ansari, R., Manzoor, S., and Naqvi, S. (1999). Response of woody species to salinity. In "Handbook of plant and crop stress" (M. Pessarakli, ed.), pp. 931-946. Marcel Dekker, New York.
ANZECC, and ARMCANZ, eds. (2000). "Australian and New Zealand Guidelines for Fresh and Marine Water Quality," Vol. National Water Quality Management Strategy 4. Australian and New Zealand Environment and Conservation Council, Agriculture and Resource Management Council of Australia and New Zealand.
ANZFA (2001). "Genetically modified foods." Australian and New Zealand Food Authority. Armon, R., Dosoretz, C. G., Azov, Y., and Shelef, G. (1994). Residual contamination of crops irrigated with effluent
of different qualities - a field study. Water Science & Technology 30, 239-248. Asano, T., and Levine, A. (1996). Wastewater reclamation, recycling and reuse - past, present, and future. Water
Science & Technology 33, 1-14. Asano, T., Smith, R., and Tchobanoglous, G. (1985). Municipal wastewater: treatment and reclaimed water
characteristics. In "Irrigation with Reclaimed Municipal Wastewater - A Guidance Manual." (G. S. Pettygrove and T. Asano, eds.), pp. 2.1 - 2.26. Lewis Publishers, Chelsea, Mich.
Ashbolt, N. (1998). Methodologies for quantifying and managing microbial risks with reclaimed waters. In "WaterTECH", Vol. Session 1, pp. 1-9. Australian Water & Wastewater Association, Brisbane.
Atwell, B., Kriedemann, P., and Turnbull, C., eds. (1999). "Plants in action : adaptation in nature, performance in cultivation," pp. 1-664. MacMillan Education Australia, South Yarra.
Bacon, P. E., ed. (1994). "Nitrogen Fertilization and the Environment." Marcel Dekker Inc., New York. Bahri, A. (1998). Fertilizing Value and Polluting Load of Reclaimed Water in Tunisia. Water Research 32, 3484-
3489. Baier, D. C., and Fryer, W. B. (1973). Undesirable plant responses with sewage irrigation. J. Irrig. and Drain. Div.
99, 133-142. Bastos, R. K. X., and Mara, D. D. (1995). The bacterial quality of salad crops drip and furrow irrigated with waste
stabilization pond effluent - an evaluation of the who guidelines. Water Science & Technology 31, 425-430. Behrsing, J., and Premier, R. (2002). "Safe Vegetable Production. A microbial food safety guide for the Australian
Vegetable Industry." Horticulture Australia Limited, Sydney. Bergman, W. (1992). "Nutritional disorders of Plants - Develpment, Visual and analytical Diagnosis," VCH
Publishers, Florida. Blumenthal, U. J., Mara, D. D., Ayres, R. M., Cifuentes, E., Peasey, A., Stott, R., Lee, D. L., and Ruizpalacios, G.
(1996). Evaluation of the who nematode egg guidelines for restricted and unrestricted irrigation. Water Science & Technology 33, 277-283.
Broadbent, F. E., and Reisenauer, H. M. (1985). Fate of wastewater constituents in soil and groundwater: Nitrogen and Phosphorus. In "Irrigation with reclaimed municipal wastewater- A guidance manual." (G. S. Pettygrove and T. Asano, eds.), pp. 12.1 - 12.16. Lewis Publishers Inc., Chelsea, MI.
Brown, P. (2001). How water scarcity will shape the new century. Water Science & Technology 43, 17-22. Bryan, F. (1977). Diseases transmitted by foods contaminated by wastewater. Journal of Food Protection 40, 45. Bunel, F., Carre, J., Legeas, M., and Etienne, M. (1995). The possible reuse of wastewater treated by lagooning for
the irrigation of field crops. Water Science & Technology 31, 409-416. Cass, A., Walker, R. R., and Fitzpatrick, R. W. (1995). Vineyard soil degradation by salt accumulation and the
effect on the performance of the vine. In "9th Australian Wine Industry Technical Conference", pp. 153-160, Adelaide, Australia.
Castillo, G., Mena, M. P., Dibarrart, F., and Honeyman, G. (2001). Water quality improvement of treated wastewater by intermittent soil percolation. Water Science & Technology 43, 187 - 190.
47

Chaney, R. L. (1980). Health risks associated with toxic metals in municipal sludge. In "Sludge - Health risks of land application." (G. Bitton, D. L. Damro, G. T. Davidson and J. M. Davidson, eds.), pp. 59-83. Ann Arbor Sci.
Chang, A. C., Page, A. L., Asano, T., and Hespanhol, I. (1996). Developing human health-related chemical guidelines for reclaimed wastewater irrigation. Water Science & Technology 33, 463-472.
Cifuentes, E., Gomez, M., Blumenthal, U., Tellez-Rojo, M., Romieu, I., Ruiz-Palacios, G., and Ruiz-Velazco, S. (2000). Risk factors for Giardia intestinalis infection in agricultural villages practicing wastewater irrigation in Mexico. American-Journal-of-Tropical-Medicine-and-Hygiene. 62, 388-392.
Codd, G. A., Metcalf, J. S., and Beattie, K. A. (1999). Retention of Microcystis aeruginosa and microcystin by salad lettuce (lactuca sativa). Toxicon 37, 1181-1185.
Cooper, B., Jones, G., Burch, M., and Davis, R. (1996). Agricultural chemicals and algal toxins: emerging water quality issues. In "Managing Australia’s Inland Waters". Department of Industry, Science and Tourism, Canberra., Canberra, ACT.
Crook, J., and Surampalli, R. Y. (1996). Water reclamation and reuse criteria in the US. Water Science & Technology 33, 451-462.
CSIRO (1996). "Control strategies for cyanobacterial blooms in weir pools," Rep. No. 119. CEM, Canberra. Cuartero, J., and Fernandez-Munoz, R. (1999). Tomato and salinity. Scientia Horticulturae 78, 83-125. Davis, R. D. (1984). Cadmium - a complex environmental problem. Part II Cadmium in sludges used as fertiliser.
Experientia 40, 117-234. de Victorica, J., and Galvan, M. (2003). Preliminary testing of a rapid coupled methodology for
quantitation/viability determination of helminth eggs in raw and treated wastewater. Water Research 37, 1278-1287.
Devaux, I., Gerbaud, L., Planchon, C., Bontoux, J., and Glanddier, P. Y. (2001). Infectious risk associated with wastewater reuse: an epidemiological approach applied to the case of Clermont-Ferrand, France. Water Science & Technology 43, 53 - 60.
DHS and EPA SA (1999). "South Australian Reclaimed Water Guidelines." Department of Human Services and Environment Protection Agency, Government of South Australia, Adelaide, South Australia.
Dillon, P. (2000). Water reuse in Australia: Current status, projections and research. Water Journal 28, 18-21. Dillon, P., Toze, S., Pavelic, P., Ragusa, S., Wright, M., Peter, P., Martin, R., Gerges, N., and Rinck-Pfeiffer, S.
(1999). Storing recycled water in an aquifer. Benefits and risks. Water September/October, 21-29. El-Motaium, R., Hu, H., and Brown, P. (1994). The relative tolerance of six Prunus rootstocks to boron and salinity.
Journal of the American Society for Horticultural Science 119, 1169-1175. EPA SA (2002). "Ambient water quality monitoring of the River Murray 1990-1999," Rep. No. 1. Environment
Protection Agency South Australia, Adelaide. EPA, V. (1996). "Guidelines for wastewater reuse," Rep. No. 464. Environmental Protection Authority, Melbourne,
Victoria. EPA Victoria (2003). "Guidelines for environmental management. Use of reclaimed water.." EPA Victoria,
Southbank, Victoria 3006, AUSTRALIA. FAO (1995). "The use of hazard analysis critical control point (HACCP) in food control," Rep. No. 58. UN, Rome. Feigin, A., Pressman, E., Imas, P., and Miltau, O. (1991). Combined effects of KNO3 and salinity on yield and
chemical composition of lettuce and chinese cabbage. Irrigation Science 12, 223-230. Ferreyra, R., Aljaro, A., Ruiz, R., Rojas, L., and Oster, J. (1997). Behaviour of 42 crop species grown in saline soils
with high boron concentrations. Agricultural Water Management 34, 111-124. Francois, L. (1984). Effect of excess boron on tomato yield, fruit size and vegetative growth. Journal of the
American Society for Horticultural Science 109, 322-324. Francois, L. (1988). Yield and quality responses of celery and crisphead lettuce to excess boron. Journal of the
American Society for Horticultural Science 113, 538-542. Francois, L. (1991). Yield and quality responses of garlic and onion to excess boron. HortScience 26, 547-549. Francois, L. (1992). Effect of excess boron on summer and winter squash. Plant & Soil 147, 163-170. Francois, L., and Clark, R. (1979). Accumulation of sodium and chloride in leaves of sprinkler-irrigated grapes.
Journal of American Horticulture Science 104, 11-13. FSANZ (2003). "Australia New Zealand Food Standards Code," Anstat Pty Ltd and Commonwealth of Australia. Gallegos, E., Warren, A., Robles, E., Campoy, E., Calderon, A., Guadalupe Sainz, M., Bonilla, P., and Escolero, O.
(1999). The effects of wastewater irrigation on groundwater quality in Mexico. Water Science and Technology 40, 45-52.
Garcia, M., and Charbaji, T. (1993). Effect of sodium chloride salinity on cation equilibria in grapevine. J. Plant Nutr. 16, 2225-2237.
Gardner, T., Barry, G., Rao, A., Viertiz, A., Chinivasagam, N., Blackall, P., Thomas, R., Klieve, A., Blaney, B., Green, P., and Rynne, F. (1998). Quantifying the health risk of spray irrigating treated sewage effluent. In "WaterTECH", Vol. Session 4G, pp. 1-18. Australian Water and Wastewater Association, Brisbane.
48

George, M., Pettygrove, G., and Davis, W. (1984). Crop selection and management. In "Irrigation with reclaimed wastewater: A guidance manual" (G. S. Pettygrove and T. Asano, eds.), pp. 6.1 - 6.19. California State Water Resource Control Board, California.
Gornat, B., Goldberg, D., Rimon, D., and Ben-Asher, J. (1973). The physiological effect of water quality and method of allpication on tomato, cucumber, and pepper. Journal of American Horticulture Science 88, 202-205.
Grattan, S. R., and Grieve, C. (1999a). Mineral nutrient acquisition and response by plants in saline environments. In "Hanbook of plant and crop stress" (M. Pessarakli, ed.), pp. 203-229. Marcel Dekker, New York.
Grattan, S. R., and Grieve, C. M. (1999b). Salinity-mineral nutrition relations in horticultural crops. Scientia Horticulturae 78, 127-157.
Greenway, M., and Simpson, J. S. (1996). Artificial wetlands for wastewater treatment, water reuse and wildlife in queensland, australia. Water Science & Technology 33, 221-229.
Haarhoff, J., and Vandermerwe, B. (1996). Twenty-five years of wastewater reclamation in windhoek, namibia. Water Science & Technology 33, 25-35.
Haas, C. (1996). Viewpoint: Acceptable microbial risk. Journal American Water Works Association 88, 8. Hamouri, B., Handouf, A., Mekrane, M., Touzani, M., Khana, A., Kallayoune, K., and Benchokroun, T. (1996). Use
of wastewater for crop production under arid and saline conditions: yield and hygenic quality of the crop and soil contaminations. Water Science & Technology 33, 327-334.
Harris, D. J., and Rhodes, H. A. (1969). Nitrate and nitrite poisoning in cattle in Victoria. Australian Veterinary Journal 45, 590-591.
Hayes, A., Mancino, C., Forden, W., Kopec, D., and Pepper, I. (1992a). Irrigation of turfgrass with secondary sewage effluent: II. Turf quality. Agronomy Journal 82, 943-946.
Hayes, A., Mancino, C., and Pepper, I. (1992b). Irrigation of turfgrass with secondary sewage effluent: I. soil and leachate water quality. Agronomy Journal 82, 939-943.
Hayr, D., and Gordon, I. (2003). "Irrigation water quality; salinity and soil structure stability." Qld Department of Natural Resources and Mines, NRM Facts W55., Queensland, Australia.
Hespanhol, I., and Prost, A. M. E. (1994). Who guidelines and national standards for reuse and water quality. Water Research 28, 119-124.
Hunter, P., and Syed, Q. (2001). Community surveys of self-reported diahorrea can drammatically overestimate the size of outbreaks of waterborne cryptosporidiosis. Water Science & Technology 43, 27-30.
Jackson, G. (2003). "(Draft) Queensland Guidelines for the Safe Use of Recycled Water." Queensland Environmental Protection Agency, Brisbane.
Jimenez, B., Chavez, A., and Hernandez, C. (1999). Alternative treatment for wastewater destined for agricultural use. Water Science & Technology. 40, 355-362.
Jobling, S., Nolan, M., Tyler, C., Brighty, G., and Sumpter, J. (1998). Widespread sexual disruption in wild fish2506. Environmental Science & Technology 32, 2498-2506.
Kaddous, F. A., and Stubbs, K. J. (1983). "Growth of vegetables irrigated with reclaimed water," Rep. No. 1983. 82/0353. Melbourne Vic., Ministry of Water Resources and Water Supply,.
Kanarek, A., and Michail, M. (1996). Groundwater recharge with municipal effluent - Dan region reclamation project, Israel. Water Science & Technology 11, 227-233.
Kelly, J., and Stevens, D. P. (2000). From Problem to Profit. Sewage Effluent Reclamation and Reuse on the Northern Adelaide Plains. Journal Australian Water Association 27, 37-41.
Kelly, J., and Stevens, D. P. (2002). "Increasing acceptance and use of reclaimed water. A comparison of algae in bore and reclaimed water storage dams, and microbial contamination of vegetables irrigated with these water sources.." For Northern Adelaide Hill Catchment Water Management Board by the University of Adelaide and CSIRO Land and Water., Adelaide.
Kelly, J., van dar Wielen, M., and Stevens, D. P. (2001). "Sustainable use of reclaimed water on the Northern Adelaide Plains. Growers Manual," PIRSA Rural Solutions, Adelaide, South Australia.
Keren, R., and Bingham, F. T. (1985). Boron in Water, Soils and Plants. In "Advances in Soil Science", Vol. 1, pp. 229-276. Springer-Verlag Inc., New York.
King, J. (1995). Appropriate irrigation technology applications in southwestern United States. In "Proceedings of the International Symposium on Sustainable Water Management in Arid and Semi-Arid Regions." pp. 23-29.
Kirkham, M. B. (1986). Problems of using wastewater on vegetable crops. HortScience, 24-27. Kookana, R., Ying, G., Kumar, A., and Dillon, P. (2003). Endocrine Disrupting Chemicals (EDCs): Potential
Sources and Impacts on the Australian Riverine Environment. In " AWA/IWA Conference: Chemicals of Concern in Water, June 4-5, 2003. Sydney NSW."
Kouraa, A., Fethi, F., Fahde, A., Lahlou, A., and Ouazzani, N. (2002). Reuse of urban wastewater treated by a combined stabilisation pond system in Benslimane (Morocco). Urban Water 4, 373-378.
Kracman, B., Martin, R., and Sztajnbok, P. ( 2001). The Virginia pipeline: Australia's largest water recycling project. Water Science & Technology 43, 35 - 42.
Law, I. B. (1996). Rouse hill - australias first full scale domestic non-potable reuse application. Water Science & Technology 33, 71-78.
49

Lee, T. H. (1990). Chloride and sodium ions in Australian wines. Technical Reviews. The Australian Wine Research Institute 68, 2-7.
Lim, R., Gale, S., and Doyle, C. (2000). Endocrine disrupting compounds in sewage treatment plant (STP) effluent reused in agriculture - is there a concern? In "Water Recycling Australia" (P. Dillon, ed.), pp. 23-28. CSIRO &AWA.
Maas, E. V. (1986). Salt tolerance of plants. Applied Agricultural Research 1, 12-25. Maas, E. V. (1987). Salt tolerance of plants. In "CRC handbook of plant science in agriculture" (B. R. Christie, ed.),
Vol. II, pp. 57-75. CRC Press inc, Boca Raton, Florida. Maas, E. V., and Hoffman, G. J. (1977). Crop salt tolerance - Current assessment. J. Irri. Drain. Div. Proc. Am. Soc.
Civil Eng. 103, 115-134. Mancino, C., and Pepper, I. (1992). Irrigation of turfgrass with secondary sewage effluent: soil quality. Agronomy
Journal 84, 650-654. Marcum, K. (1999). Salinity tolerance of turfgrasses. In "Handbook of plant and crop stress" (M. Pessarakli, ed.),
pp. 891-905. Marcel Dekker, New York. Marecos do Momonte, M., Angelakis, A. N., and Asano, T. (1996). Necessity and basis for establishment of
European guidelines for reclaimed wastewater in the mediterranean region. Water Science & Technology 33, 303-316.
Market Equity (2003). "Community Attitudes & Acceptance of Water Re-use in Perth." A Report prepared for the Water Corporation June 2003, Perth.
Marschner, H. (1995). "Mineral nutrition of higher plants," Academic Press, New York. Massoud, M., Scrimshaw, M., and Lester, J. N. (2003). Qualitative assessment of the effectiveness of the
Mediterranean action plan: wastewater management in the Mediterranean region. Ocean and Coastal Management in press.
Maurer, M. A., and Davies, F. S. (1993). Microsprinkler irrigation of young redblush grapefruit trees using reclaimed water. Hortscience 28, 1157-1161.
Maurer, M. A., Davies, F. S., and Graetz, D. A. Reclaimed wastewater irrigation and fertilization of mature redblush grapefruit trees on spodosols in florida. Journal of the American Society for Horticultural Science 1995 May;120(3):394-402.
McCarthy, M. G., and Downton, W. J. S. (1981). Irrigation of grapevines with sewage effluent. II. Effects on wine composition and quality. Am. J. Enol. Vitic. 32, 197-99.
McLaughlin, M., Hamon, R. E., McLaren, R. G., Speir, T. W., and Rogers, S. L. (2000). Review: A Bioavailability-based rationale for controlling metal and metalloid contamination of agricultural land in Australia and New Zealand. Aust. J. Soil Res. 38, 1037-86.
McLaughlin, M. J., Palmer, L. T., Tiller, K. G., Beech, T. A., and Smart, M. K. (1994). Increased soil salinity causes elevated cadmium concentrations in field-grown potato tubers. J. Environ. Qual. 23, 1013-1018.
Meli, S., Porto, M., Belligno, A., Bufo, S. A., Mazzatura, A., and Scopa, A. (2002). Influence of irrigation with lagooned urban wastewater on chemical and microbiological soil parameters in a citrus orchard under Mediterranean condition. The Science of The Total Environment 285, 69-77.
Melloul, A. A., Hassani, L., and Rafouk, L. (2001). Salmonella contamination of vegetables irrigated with untreated wastewater. World Journal of Microbiology Biotechnology 17, 207 - 209.
Mengal, K., and Kirkby, E. A. (1978). "Principles of Plant Nutrition," International Potash Institute, Worblaufen-Bern.
Mortimore, S., and Wallace, S. (1998). "HACCP: A practical approach," 2/Ed. Aspen Publishers Inc, Gaithersburg MD.
Mujeriego, R., Sala, L., Carbo, M., and Turet, J. (1996). Agronomic and public health assessment of reclaimed water quality for landscape irrigation. Water Science & Technology 33, 335-344.
Nancarrow, B. E., Kaercher, J., Po, M., and Symes, G. J. (2003). "Social values and impact study south west Yarragadee Blackwood groundwater area.." CSIRO. Australian Research Centre for Water in Society, Perth.
National Land and Water Resources Audit (2001). "Australian Water Resources Assessment 2000; surface water and groundwater - availability and quality." National Land and Water Resources Audit, Canberra.
Neilsen, G., Stevenson, D., and Fitzpatrick, J. (1989a). The effect of municpial wastewater irrigation and rate of N fertilisation on petiole composition, yield and quality of Okangan Riesling grapes. Canadian Journal of Plant Science 69, 1285-1294.
Neilsen, G., Stevenson, D., Fitzpatrick, J., and Brownlee (1989b). The effect of municpial wastewater irrigation and rate of N fertilisation on petiole composition, yield and quality of Okangan Riesling grapes. Journal of American Horticulture Science 114, 377-383.
Neilsen, G., Stevenson, D., Fitzpatrick, J., and Brownlee (1989c). Soil and sweet cherry responses to irrigation with wastewater. Canadian Journal of Soil Science 71, 31-41.
Nuttall, J., Armstrong, R., Connor, D., and Matassa, V. (2003). Interrelationships between edaphic factors potentially limiting cereal growth on alkaline soils in north-western Victoria. Australian Journal of Soil Research 41, 277-292.
50

NWCA (2001). "Customer Preferences on Water Resource Issues – A Research Report." Newton, Wayman, Chong and Associates,, Melbourne?
Ono, Y., Somiya, I., Kawaguchi, T., and Mohri, S. Evaluation of toxic substances in effluents from a wastewater treatment plant. Desalination 1996 Aug;106(1-3):255-261.
Oron, G. Soil as a complementary treatment component for simultaneous wastewater disposal and reuse. Water Science & Technology 1996;34(11):243-252.
Oron, G., Armon, R., Mandelbaum, R., Manor, Y., Campos, C., Gillerman, L., Salgot, M., Gerba, C., Klein, I., and Enriquez, C. (2001). Secondary wastewater disposal for crop irrigation with minimal risks. Water Science & Technology 43, 139 - 146.
Oron, G., Goemans, M., Manor, Y., and Feyen, J. (1995). Poliovirus distribution in the soil-plant system under reuse of secondary wastewater. Water Research 29, 1069-1078.
Pate, J. S., Verboom, W. H., and Galloway, P. (2001). Turner Review No. 4. Co-occurrence of Proteaceae, laterite and related oligotrophic soils: coincidental associations or causative inter-relationships? Australian Journal Botany 49, 529-560.
Paxeus, N. (1996). Organic pollutants in the effluents of large wastewater treatment plants in Sweden. Water Research 30, 1115-1122.
Petterson, S. R., and Ashbolt, N. J. (2001). Viral risks associated with wastewater reuse: modelling virus persistence on wastewater irrigated salad crops. Water Science & Technology 43, 23-26.
Petterson, S. R., Ashbolt, N. J., and Sharma, A. (2001). Microbial risks from wastewater irrigation of salad crops: A screening-level risk assessment. Water Environment Research 72, 667-672.
Pettygrove, G., Davenport, D., and Asano, T. (1985). Introduction: California's reclaimed municipal wastewater resource. In "Irrigation with Reclaimed Municipal Wastewater - A Guidance Manual" (G. Pettygrove and T. Asano, eds.), pp. 1.1 - 1.14. Lewis Publishers, Chelsea, Mich.
Pier, J. W., and Doerge, T. A. (1995). Nitrogen and water interactions in trickle-irrigated watermelon. Soil Science Society of America Journal 59, 145-150.
Polder, M., Hulzebos, E., and Jager, D. (1995). Validation of models on uptake of organic chemicals by plant roots. Enviromental Toxicolgy and Chemistry 14, 1615-1623.
Polglase, P. J., Tompkins, D., Stewart, L. G., and Falkiner, R. A. (1995). Mineralization and leaching of nitrogen in an effluent-irrigated pine plantation. Journal of Environmental Quality 24, 911-920.
Premier, R., Behrsing, J., Morgan, W., and Fry, B. (2000). "The use of reclaimed water from Barwon Water's Black Rock sewage treatment plant in the local potato industry," Rep. No. November 2000. Agriculture Victoria, Institute for Horticultural Development, Knoxfield, Victoria., Melbourne.
Rapala, J., Lahti, K., Rasanen, L., Esala, A.-L., Niemela, S., and Sivonen, K. (2002). Endotoxins associated with cyanobacteria and their removal during drinking water treatment. Water Research 36, 2627-2635.
Reboll, V., Cerezo, M., Roig, A., Flors, V., Lapena, L., and Garcia-Agustin, P. (2000). Influence of wastewater vs groundwater on young Citrus trees. J. Environ Biol 80, 1441-1446.
Regli, S., Rose, J., Haas, C., and Gerba, C. (1991). Modelling the risk from Giardia and viruses in drinking water. Journal of the American Water Works Association 83, 76.
Reid, D., Edwards, A., Cooper, D., Wilson, E., and McGaw, B. (2003). The quality of drinking water from private water supplies in Aberdeenshire, UK. Water Research 37, 245-254.
Rengasamy, P., and Bourne, J. (1998). "Managing Sodic, Acidic and Saline Soils." Cooperative Research Centre for Soil & Land Management, Glen Osmond, SA.
Richards, G. (1999). Limitations of molecular biological techniques for assessing the virological safety of foods. Journal of Food Protection 62, 691-197.
Rose, J. B., Dickson, L. J., Farrah, S. R., and Carnahan, R. P. (1996). Removal of pathogenic and indicator microorganisms by a full-scale water reclamation facility. Water Research 30, 2785-2797.
Ryan, J., Singh, M., and Yau, S. (1998). Spatial variability of soluble boron in Syrian soils. Soil and Tillage Research 45, 407-417.
Ryden, J., and Pratt, P. (1980). Phosphorus removal from wastewater applied to land. Hilgardia 48, 1-36. Sams, C. (1999). Preharcest factors affecting postharvest texture. Postharvest Biology and Technology 15, 249-254. Sceswell, G., and Huett, D. (1998). Plant Nutrition. In "Australian Vegetable Growing Handbook" (J. Salvestrin,
ed.), pp. 89-105. Scope Publishing Pty Ltd, Frankston, Victoria, Australia. Shannon, M. C., and Grieve, C. M. (1999). Tolerance of vegetable crops to salinity. Scientia Horticulturae 78, 5-38. Shaw, I., and McCully, S. (2002). A review of the potential impact of dietary endocrine disrupters on the consumer.
International Journal of Food Science and Technology 37, 471-476. Sheikh, A. K., Cort, R., Cooper, R., and St Jaques, R. (1999a). Tertiary-treated reclaimed water for irrigation of raw-
eaten vegetables. In "Watewater reclamation and reuse" (T. Asano, ed.), pp. 779-826. Technomic Publishing Co., Lancaster PA.
Sheikh, B., Cooper, R. C., and Israel, K. E. (1999b). Hygienic evaluation of reclaimed water used to irrigate food crops - A case study. Water Science & Technology. 40, 261-267.
51

Shore, L., Kapulnik, Y., Gurevich, M., Wininger, S., Badamy, H., and Shemesh, M. (1995). Induction of phytoestrogen production in Medicago sativa leaves by irrigation with sewage water. Environmental-and-Experimental-Botany 33, 363-369.
Shorrocks, V. (1997). The occurrence and correction of boron deficiency. Plant & Soil 193, 121-148. Shuval, H. (2003). Overcoming health risks in water recycling and reuse. In "Water Recycling Australia, 2nd
National Conference" (E. Gardner and D. McGarry, eds.), pp. 30-40. Australian Water Association, Brisbane.
Shuval, H., Lampert, Y., and Fattal, B. (1997). Development of a risk assessment approach for evaluating wastewater reuse standards for agriculture. Water Science & Technology 35, 15-20.
Simpson, J. M. (1999). Changing community attitudes to potable re-use in south-east Queensland. Wat. Sci. Tech. 40, 59-66.
Smith, C. J., Hopmans, P., and Cook, F. J. (1996). Accumulation of Cr, Pb, Cu, Ni, Zn and Cd in soil following irrigation with treated urban effluent in Australia. Environmental Pollution 94, 317-323.
Smith, M. A. (1982). Retention of bacteria, viruses and heavy metals on crops irrigated with reclaimed water. Canberra ACT, Australian Government Publishing Service, 1982. 308 p. Technical Paper - Australian Water Resources Council; no. 74;.
Stevens, D., Kelly, J., Biswas, T., and Ying, G. G. (2003a). Assessing the sustainability of schemes that reclaim water and nutrients from effluent for irrigation in Australia. In "Water recycling Australia. 2nd National Conference" (A. W. Asssociation, ed.), pp. Compact Disk. Australian Water Association, Brisbane.
Stevens, D., Kelly, J., Liston, C., and Oemcke, D. (2002). Biosolid Management in England and France. Water 29, 56-61.
Stevens, D. P., McLaughin, M. J., and Smart, M. (2003b). Effects of long-term irrigation with reclaimed water on soils of the Northern Adelaide Plains, SA. Australian Journal of Soil Research 41, 933-948.
Stevens, D. P., McLaughlin, M. J., Owens, G., Kelly, J., and Maier, N. (2000). Agronomic issues when using reclaimed water: The Northern Adelaide Plains Experience. In "Water Recycle Australia 2000" (P. Dillon, ed.). CSIRO Land and Water. Dickson, ACT, Australia., Adelaide Australia, October 19 and 20.
Stevens, R., Harvey, G., Partlington, D., and Coombe, B. (1999). Irrigation of grapevines with saline water at different growth stages I. effects on soil, vegetative growth, and yield. Australian Journal of Agricultural Research 50, 343-355.
Stevens, R., and Walker, R. (2002). Response of grapevines to irrigation-induced saline-sodic conditions. Australian Journal of Experimental Agriculture 42, 323-331.
Stien, J., and Schwartzbrod, J. (1990). Experimental contamination of vegetables with helminth eggs. Water Science & Technology 22.
Storey, R., and Walker, R. R. (1999). Citrus and salinity. Scientia Horticulturae 78, 39-81. Stott, R., Jenkins, T., Shabana, M., and May, E. (1997). A survey of the microbial quality of waste waters in
Ismailia, Egypt and the implications for wastewater reuse. Water Science & Technology 35, 211-217. Tanaka, H., Asano, T., Schroeder, E. D., and Tchobanoglous, G. (1998). Estimating the Safety of Wastewater
Reclamation and Reuse Using Enteric Virus Monitoring Data. Water Environment Research 70, 39-51. Ternes, T., Stumpf, M., Mueller, J., Haberer, K., Wilken, R., and Servos, M. (1999). Behaviour and occurrence of
estrogens in municipal sewage treatment plants - I. Investigations in Germany, Canada and Brazil. Science of the Total Environment 225, 81-90.
Thomas, J. F. (1999). "Water and the Australian Economy." Australian Academy of Technological Sciences and Engineering, Carlton South, Australia.
Topp, E., Scheunert, I., Attar, A., and Korte, F. (1986). Factors affecting the uptake of 14C-labelled organic chemicals by plants from soil. Ecotoxicology and Environment Saf 11, 219-228.
Van Leeuwen, J. H. (1996). Reclaimed water - an untapped resource. Desalination 106, 233-240. Victorian_EPA (2000). "Environmental Guidelines For The Use of Reclaimed Water," Publication 464(a)/Ed. EPA
Customer Information Centre. Government of Victoria, Melbourne. Wajon, E. J., Kenway, S., and Maus, A. (1999). Wastewater reuse. Journal Australain Water and Wastewater
Association July/August, 35-38. Walker, R., Blackmore, D., Clingeleffer, P., Godden, P., Francis, L., Valente, P., and Robinson, E. (2002). The
Effects of Salinity on vines and wines. Australian Viticulture July - August, 11-21. Ward, B. K., Irving, L. G., and Smith, M. A. (1981). Use of reclaimed water for irrigation of vegetables. In "Federal
Convention, 9th, Apr 1981, Technical papers." Australian Water and Wastewater Association, Perth. West, P. (1991). Human pathogenic viruses and parasites: emerging pathogens in the water cycle. Journal of
Applied Bacteriology Symposium Supplement 70, 107S-114S. Westcot, D. W., and Ayers, R. S. (1984). "Irrigation water quality criteria. In Irrigation with reclaimed wastewater:
A guidance manual," Rep. No. 81-1 WR. California State Water Resource Control Board, California. WHO (1989). "Health guidelines for the use of wastewater in agriculture and aquaculture." World Health
Organisation, Geneva. Wilson, L. G., Amy, G. L., Gerba, C. P., Gordon, H., Johnson, B., and Miller, J. (1995). Water quality changes
during soil aquifer treatment of tertiary effluent. Water Environment Research 67, 371-376.
52

Wu, L., Chen, J., van Mantgem, P., and Harivandi, M. (1996). Regenerant wastewater irrigation and ion uptake in five turfgrass species. Journal of Plant Nutrition 19, 1511-1530.
Wu, L., Chen, J. Q., Lin, H., Mantgem, P. v., Harivandi, M. A., Harding, J. A., and Van Mantgem, P. (1995). Effects of regenerant wastewater irrigation on growth and ion uptake of landscape plants. Journal-of-Environmental-Horticulture.. 13, 92-96.
Yanko, W. A. (1993). Analysis of 10 years of virus monitoring data from Los Angeles County treatment plants meeting California wastewater reclamation criteria. Water Environ. Research 65.
Yates, M., and Gerba, C. (1998). Microbial considerations in wastewater reclamation and reuse. In "Wastewater reclamation and reuse" (T. Asano, ed.), pp. 437-488. Technomic Publishing Co., Lancaster, PA.
Yin, R., Lin, X., Wang, S., and Zhang, H. (2003). Effect of DBP/DEHP in vegetable planted soil on the quality of capsicum fruit. Chemosphere 50, 801-805.
Ying, G. G., and Kookana, R. S. (2002). Endocrine disruption: an Australian perspective. AWA Journal Water 29, 53-57.
Ying, G.-G., Kookana, R. S., and Ru, Y.-J. (2002a). Occurrence and fate of hormone steroids in the environment. Environment International 28, 545 – 551.
Ying, G.-G., Williams, B., and Kookana, R. (2002b). Environmental fate of alkylphenols and alkylphenol ethoxylates — a review. Environmental International 28, 215 – 226.
Zekri, M., and Koo, R. C. J. (1994). Treated municipal wastewater for citrus irrigation. Journal of Plant Nutrition 17, 693-708.
53