Embed Size (px)
Citation preview

Water budget monitoring of irrigated perimeters in
semi-arid areas using high resolution NDVI image
time series.
Application for the assessment of groundwater
extraction
SPOT4-Take5 Users workshop, Toulouse Nov. 2014
Simonneaux V., Saadi S., Boulet G., Lili Chabaane Z., Mougenot B., Zribi M.

• Land cover
• Vegetation development
Climate
Irrigation
Evapotranspiration
Infiltration /
pumping
Precipitations
Water budget monitoring of crops using high
resolution NDVI satellite image time series
Objective
Quantification of water fluxes for a
better management
Estimating crop consumption
and irrigation volumes.
Estimating fluxes between
surface and aquifer (recharge /
extraction).
Working steps
1- Calibrating an
evapotranspiration (ET) model
using ground measurements (ET
flux data)
2- Spatialize ET and irrigation
using SPOT HR NDVI time series
3- Validate using irrigation data at
perimeter scale
Satellite

Planners : multi-annual scenarios
1 year time
Farmer (plot scale): daily
Current Date
Managers (perimeter scale): whole season Water needs
Major satellite
input
=> SAMIR tool
Irrigation: 3 types of End Users with specific information requirements
Ex of planning : Pre-allocation before season

ET = ( Kcb*Ks + Ke ) * ET0
Ke = f(top-soil moisture
and bare soil fraction)
Kcb = f(vegetation
development)
Ks = f(root-soil
moisture)
« climatic »
evaporative
demand
Transpiration
Evaporation
Evapotranspiration using the FAO method
dual coefficient approach
Satellite : Kcb = a*NDVI + b
Sentinel-2
time series

Crop development is monitored using Image Time series
NDVI time profiles of pixels

ENVI (©RSI) software extension
The SAMIR tool “Satellite Monitoring of Irrigation”

The Kairouan plain study site
Lower part of the Merguellil watershed
Semi arid climate with limited water resources
- Average temperature : 19.2 °C
- Precipitation 300mm/year with high spatial and temporal variability
Surexploitation de la nappe de
Kairouan due à l’irrigation (-0,5 m/an).

SPOT4-Take5 experiment Kairouan site (Merguellil, Tunisia) green bars = SPOT5 acquisitions (ISIS)
3 Feb 8 Feb 13 Feb 18 Feb
10 Mars 15 Mars 20 Mars 25 Mars 30 Mars 4 April 9 April
14 April 19 April 4 May 9 May 14 May
19 May 24 May 3 June 8 June 13 June 18 June

Image acquisition
SPOT4-Take5 experiment
SPOT4-Take5 experiment

Images preprocessing
Phase 1 – geometric and radiometric processing
• SPOT4-Take5 ready to use !
• SPOT5 1A ordered through ISIS (CNES)
1- Orthorectification ENVI + SRTM 90m
2- Radiometric correction using 6S model
+ on site photometer measurements
+ web data for missing dates (H20, O3 only…)
Phase 2 – Time series consistency analysis using pseudo
invariant features
In arid areas pseudo-invariant areas can be easily found.
30 sites were delineated using two methods:
A- Areas of lower standard deviation computed on the time series of soil
reflectance images.
B- Visual detection in comparing two color composite at very different dates.

Radiometric check of SPOT4-Take5
Ok !
Slight bias, but
significant
impact on NDVI
Linear
correction
applied
Haze
=> Elimination
of the date
y = 1.301x - 0.0915R² = 0.7998
0
0.1
0.2
0.3
0.4
0.5
0.6
0 0.2 0.4 0.6
Imag
e M
oy
Image 3
y = 0.8173x + 0.0414R² = 0.9894
0
0.1
0.2
0.3
0.4
0.5
0.6
0 0.2 0.4 0.6
Imag
e M
oy
Image 13
y = 1.0336x - 0.0109R² = 0.9816
0
0.1
0.2
0.3
0.4
0.5
0.6
0 0.2 0.4 0.6
Imag
e M
oy
Image 10
XS2 band

Radiometric check of SPOT5
Higher bias
=> Linear correction
XS2 band

Comparison between SPOT5 and SPOT4-Take5 series
Discrepency between the two data sets
Strong impact on maximum NDVI values:
SPOT4-Take5 0.9 (ok)
SPOT5 0.7 (underestimated)
Correction of the SPOT5 series (biased) to match SPOT4-Take5 radiometry
y = 0.7318x + 0.054
0
0.1
0.2
0.3
0.4
0.5
0 0.1 0.2 0.3 0.4 0.5
SPO
T5 a
vera
ge 1
3 d
ate
s
SPOT4-Take5 average 13 dates
y = 0.7237x + 0.0688
0
0.1
0.2
0.3
0.4
0.5
0.6
0 0.2 0.4 0.6
SPO
T5 a
vera
ge
SPOT4-Take5 average
XS2 XS3

Irrigated barley 2012 Irrigated wheat 2013
Meteo (ET0)
Ground data
Evapotranspiration flux measurements (ETR)

Calibration of the SAMIR model
using the two flux plots
Barley plot 2011-2012
Wheat plot 2012-2013
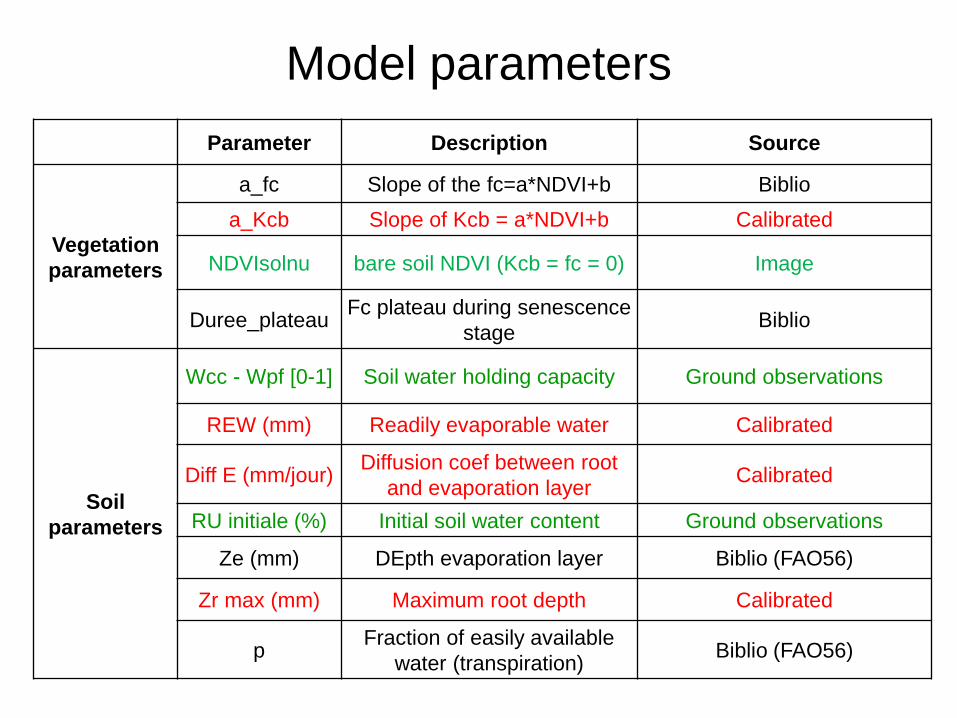
Model parameters
Parameter Description Source
Vegetation
parameters
a_fc Slope of the fc=a*NDVI+b Biblio
a_Kcb Slope of Kcb = a*NDVI+b Calibrated
NDVIsolnu bare soil NDVI (Kcb = fc = 0) Image
Duree_plateau Fc plateau during senescence
stage Biblio
Soil
parameters
Wcc - Wpf [0-1] Soil water holding capacity Ground observations
REW (mm) Readily evaporable water Calibrated
Diff E (mm/jour) Diffusion coef between root
and evaporation layer Calibrated
RU initiale (%) Initial soil water content Ground observations
Ze (mm) DEpth evaporation layer Biblio (FAO56)
Zr max (mm) Maximum root depth Calibrated
p Fraction of easily available
water (transpiration) Biblio (FAO56)

Landcover map - Trees (Olive trees) irrigated / rainfed
- Winter cereals (wheat) irrigated / rainfed
- Vegetales (from march to october) irrigated

Irrigations Actual irrigations at plot level cannot be obtained, they are simulated
Objective: to reproduce the average practices of farmers.
Irrigation rules Vegetables Cereals Trees
Fraction of wetted soil (%) 25 100 100
Level of readily available water (RAW) to
trigger irrigation (%) RAW < 75 RAW=0 RAW=0
Rate of filling of available water (%) 100 100 100
Threshold of Kcb to start irrigation (to avoid
irrigating weeds) 0.05 0.05 0.05
Threshold to stop irrigation after vegetation
peak (% of max Kcb reached) 75 95 0
Seasonal constrains
Min depth for each irrigation event (mm) 0 20 0
Max depth for each irrigation event (mm) 0 50 100
Min days between two successive irrigations 0 7 7

Results - 2008/2009 season
0
20
40
60
80
100
120
1400
20
40
60
80
100
120
140
déc-08 janv-09 févr-09 mars-09 avr-09 mai-09 juin-09 juil-09
GDA Ben Salem II
Irrigation simulée (mm)
Evapotranspiration simulée (mm)
Irrigation observée (mm)
Pluie (mm)
0
20
40
60
80
100
120
1400
20
40
60
80
100
120
140
déc-08 janv-09 févr-09 mars-09 avr-09 mai-09 juin-09 juil-09
GDA Mlelsa
Irrigation simulée (mm)
Evapotranspiration simulée (mm)
Irrigation observée (mm)
Pluie (mm)
- Pb of
vegetables
irrigation

0
10
20
30
40
50
60
700
10
20
30
40
50
60
70
GDA Ben Salem II
Irrigation Simulée(mm)
Evapotranspirationsimulée (mm)
Irrigation Observée(mm)
Pluie (mm)
0
10
20
30
40
50
60
700
10
20
30
40
50
60
70
GDA Mlelsa
Irrigation simulée(mm)
Evapotranspirationsimulée (mm)
Irrigation Observée(mm)
Pluie (mm)
0
10
20
30
40
50
60
700
10
20
30
40
50
60
70
GDA Karma II
Irrigation simulée (mm)
Evapotranspiration simulée(mm)Irrigation observée (mm)
Results - 2011/2012 season
- End of previous crop
(should not be irrigated)
- Pb of soil water content
initialisation

Results - 2012/2013 season
-10
10
30
50
70-10
10
30
50
70
nov.-12 déc.-12 janv.-13 févr.-13 mars-13 avr.-13 mai-13 juin-13 juil.-13 août-13 sept.-13 oct.-13
GDA Ben Salem II
Irrigation Simulée (mm)
Evapotranspiration (mm)
Irrigation observée (mm)
Pluie (mm)
-10
10
30
50
70-10
10
30
50
70
nov.-12 déc.-12 janv.-13 févr.-13 mars-13 avr.-13 mai-13 juin-13 juil.-13 août-13 sept.-13 oct.-13
GDA Mlelsa
Irrigation Simulée(mm)
Evapotranspiration(mm)
-10
10
30
50
70
90-10,0
10,0
30,0
50,0
70,0
90,0
nov.-12 déc.-12 janv.-13 févr.-13 mars-13 avr.-13 mai-13 juin-13 juil.-13 août-13 sept.-13 oct.-13
GDA Karma II
Irrigation simulée (mm)
Evapotranspiration simulée (mm)
Irrigation Observée (mm)
Pluie (mm)
- Pb of trees irrigation
Pb of crop changes over one year not accounted
by annual scale landuse map !

0.0
50.0
100.0
150.0
200.0
250.0
300.0
350.0
Ben Salem II 0809
Mlelssa -0809
Ben Salem II 1112
Mlelssa -1112
Karma II -1112
Ben Salem II 1213
Mlelssa -1213
Karma II -1213
Irrigation simulée (mm)
Irrigation observée (mm)
Average for the 8 “perimeter - year”
Simulated 155 mm
Observed 163 mm
Results – Seasonal scale

Comparaison between irrigation estimates and official volumes.
Detection of groundwater extraction
Difference between estimates and official
irrigation depths are linked with wells
locations
Groundwater
R3 irrigated sector
Haouz plain, Morocco
2005-2006 season

FIN