Embed Size (px)
Citation preview

WATER AUDIT REPORTJUNE 2016
Rowley, Massachusetts


FINAL Water Audit Report - Rowley, Massachusetts
Page i
TABLE OF CONTENTS Letter of Transmittal
Section - Description Page
SECTION 1 - EXECUTIVE SUMMARY ....................................................................... 1
1.1 General .................................................................................................................... 1
1.2 Purpose of Water Audit........................................................................................... 1
1.3 American Water Works Association – Water Audit ............................................... 1
1.4 Results and Recommendations ............................................................................... 3
SECTION 2 – SYSTEM DESCRIPTION AND OPERATIONS .................................... 4
2.1 System Description ................................................................................................. 4
2.2 System Operations .................................................................................................. 4
SECTION 3 – WATER SUPPLIED TO DISTRIBUTION SYSTEM ............................. 7
3.1 Sources .................................................................................................................... 7
3.2 Master Meters ......................................................................................................... 7
3.3 SCADA ................................................................................................................. 10
SECTION 4 – METERED CONSUMPTION ................................................................ 11
4.1 Service Meters and Billing .................................................................................... 11
SECTION 5 – UNMETERED UNBILLED AUTHORIZED CONSUMPTION........... 13
5.1 General .................................................................................................................. 13
SECTION 6 – SYSTEM LOSSES .................................................................................. 14
6.1 Apparent Losses .................................................................................................... 14
6.3 Real Losses ........................................................................................................... 17
SECTION 7 – COST OF LOSSES ................................................................................. 18
7.1 System Operating Costs ........................................................................................ 18
7.2 Apparent Losses .................................................................................................... 18
7.3 Real Losses ........................................................................................................... 19
SECTION 8 – KEY PERFORMANCE INDICATORS ................................................. 20
8.1 Financial Indicators ............................................................................................... 20
8.2 Operational Indicators ........................................................................................... 21
SECTION 9 – WATER AUDIT RESULTS ................................................................... 22
9.1 AWWA Audit Results .......................................................................................... 22
SECTION 10 – RECOMMENDATIONS ...................................................................... 26
10.1 Recommendations ............................................................................................... 26
FINAL Water Audit Report - Rowley, Massachusetts
Page ii
TABLE OF CONTENTS (continued)
LIST OF TABLES
LIST OF FIGURES Figure - Description Figure 3-1 2014 Water Production…………………………………….……………….9
LIST OF APPENDICES
Appendix Description
A AWWA M36 Audit Form
Table - Description Page
Table No. 3-1 Approved Source Withdrawal Volumes .................................................... 7
Table No. 3-2 2014 Total Water Supply ........................................................................... 8
Table No. 4-1 Total of Metered Water............................................................................ 11
Table No. 6-1 Potential Data Handling Errors ................................................................ 16
Table No. 7-1 Pumping and Treating Costs 2014 ........................................................... 18
Table No. 8-1 Performance Indicators ............................................................................ 20
Table No. 9-1 Performance Indicator Results ................................................................. 22
Table No. 9-2 Data Validity Scores ................................................................................ 24
SECTION
1
Section 1
FINAL Water Audit Report - Rowley, Massachusetts
Page 1
SECTION 1 - EXECUTIVE SUMMARY
1.1 General Tata & Howard, Inc. was retained by the Town of Rowley Water Department (Town) to complete a water audit of the water distribution system. The project included assessing the amount of lost water using the American Water Works Association water audit methods. The report estimates the volume of lost water in terms of non-revenue water, identifies potential sources of lost water, and estimates system performance indicators including the Infrastructure Leakage Index.
1.2 Purpose of Water Audit
The purpose of a water audit is to quantify the amount of water that is being produced or supplied by a water system, but that is not being delivered or billed to customers. By examining in detail the areas water is being used in a system, sources of lost water can be identified, and an action plan can be developed to control or reduce water losses. Sources of lost water may include:
• Inaccurate Master Meters – This can lead a community to believe more water is being pumped than actual.
• Inaccurate Customer Meters – It is important that all service meters are properly sized and installed. A meter that is too large may not register low flows, and a meter that is too small may produce excessive drops in pressure, causing it to wear out in a short period of time.
• Unmetered Authorized Uses – These include water used for new water and sewer main testing or flushing, firefighting, firefighting training, bleeders, and backwash waters.
• Unauthorized Uses – These include unauthorized connections and theft.
• Leakage – Underground leakage is principally caused by soil movement or corrosive soil conditions in the ground around a water main. Leakage also tends to occur more in the older pipes in the system. The volume of underground leakage is usually determined by a leak detection survey.
During the preparation of this water audit, it was necessary to review and analyze the volume of water pumped from each source and total finished water supplied to the distribution system, master meter error/calibration, billed and unbilled consumption, and unauthorized consumption. To analyze this data, the American Water Works Association method was used in this Water Audit.
1.3 American Water Works Association – Water Audit The American Water Works Association’s (AWWA) Water Audits and Loss Control
Programs, Manual of Water Supply Practices - M36, Third Edition, published in 2009,

FINAL Water Audit Report - Rowley, Massachusetts
Page 2
was used to complete the audit. The AWWA M36 worksheets were completed using Town data from 2014, and are included as Appendix A. The AWWA water audit method allows for a comprehensive quantification of both consumption and losses within the distribution system. The AWWA audit assigns a monetary value to each component of loss. The AWWA audit also determines a validity score for the data used in the audit. Besides determining the volume and cost of lost water, the AWWA audit standardizes water accounting definitions and produces a number of performance indicators, including Current Annual Real Losses (CARL), Unavoidable Annual Real Losses (UARL), and the Infrastructure Leakage Index (ILI), allowing a utility to compare its water loss performance with utilities across the nation. This approach helps to identify system components that may require further investigation and validation in future audits. Properly performing the AWWA water audit and executing the recommended loss control programs provides benefits in four key areas: water resource management, financial performance, operational performance and system integrity by reducing the potential for contamination within the system. Improvements in these areas help reduce unnecessary or wasteful water withdrawals, optimize revenue recovery, reduce system interruptions, increase efficiency, increase the reliability of the system data, and reduce the potential for contamination within the distribution system. The AWWA water audit uses a water balance calculation summarizing system inputs, consumption, and losses. There is no unaccounted-for water component with this approach. All water is considered either revenue or nonrevenue water. Revenue water is that which is billed to a customer. Nonrevenue water is the water supplied that is not billed, does not create revenue and includes unbilled metered water, unbilled unmetered water and both apparent and real water losses. Apparent losses are losses associated with the distribution system that occur when water is successfully delivered to the customer but is not measured or recorded accurately. These losses have two major impacts for the utility. First, by under billing a customer, the utility does not collect all the revenue it is entitled to, and second, by under recording the amount of customer consumption, the utility is not able to properly make decisions regarding the appropriate capacity of its water supply infrastructure and evaluate conservation practices. There are three components of apparent losses: customer meter inaccuracy, consumption data handling errors, and unauthorized consumption. These components are further discussed in Section 6. Real losses are physical losses of water from the distribution system and occur because of breaks and leaks in water mains, service connection pipes, joints and fittings. Additionally, real losses can also occur because of leaks or overflows at storage facilities. Real losses have two major impacts on the utility. The first is the additional cost to treat and deliver water throughout the distribution system that does not provide any benefit to the utility or its customers. The second is the additional cost to build and maintain additional or larger capacity treatment facilities, storage facilities and pumping facilities designed and constructed to accommodate the water that will be lost. Real losses are further discussed in Section 6.

FINAL Water Audit Report - Rowley, Massachusetts
Page 3
The audit process produces a number of performance indicators including an estimate of Infrastructure Leakage Index (ILI), a dimensionless indicator that tracks aspects of the management of a water utility and takes into consideration both real and apparent losses. The ILI allows water utilities to benchmark and compare their water loss control performance to other utilities, both locally and nationally.
1.4 Results and Recommendations
The AWWA water audit results (Appendix A) find that the Town’s non-revenue water by volume is approximately 33.0 percent for 2014, and the associated annual cost of water lost is approximately $138,290. The annual cost is the sum of the costs associated with real losses and the apparent losses. It should be noted that the Town recently completed efforts to improve un-accounted for water (UAW) through leak detection and remediation, and has therefore, reported an UAW volume of 9.2 percent in the 2015 Annual Statistical Report (ASR). The Town intends to continue annual leak detection to further reduce UAW. The system ILI is 1.75. The Data Validity Score is 60 out of 100 giving the Town a Data Validity Level of III. The Data Validity Score is a confidence factor for how accurate the water audit is and does not have a direct effect on the ILI. Based on the low data validity score produced by the AWWA water audit, it is recommended that water loss control efforts be focused on improving data accuracy. In particular, the master meters should be volumetrically flow tested on an annual basis and a program should be instituted for random testing of customer meters. Unbilled and unmetered water use should continue to be documented with the use of meters whenever possible, and a program should be established with the Rowley Fire Department to track any use associated with fire flows. Billing records were compared with raw meter readings for 50 customer accounts provided by the Town. Currently, the Town reports annual usage based on the consumption billed for a particular year. Consumption billed is based on meter read dates, which may be short of a full calendar year. The Town should report annual usage based on raw meter readings for the calendar year. It was determined that raw meter readings for calendar year 2014 were approximately 1.9 percent higher than what was reported. It should be noted that no revenue was lost and that all consumption is billed to customers. Water losses are more accurate if annual usage is reported based on raw meter readings for the calendar year than consumption billed. Recommendations are further discussed in Section 10 of this report. These recommendations are intended to improve record keeping and increase the validity score for the data as shown in the AWWA water audit.

SECTION
2
Section 2

FINAL Water Audit Report - Rowley, Massachusetts
Page 4
SECTION 2 – SYSTEM DESCRIPTION AND OPERATIONS
2.1 System Description The Town’s water distribution system services approximately 6,000 residents with approximately 1,800 service connections, which accounts for approximately 68 percent of the Town’s total population. The remaining 32 percent of the population maintain private wells. Customer service is 100 percent metered. The current system includes approximately 43 miles of water main ranging in diameter from four inches to sixteen inches. The distribution system pipe materials include cast iron (CI), ductile iron (DI), and asbestos cement (AC). The Town’s water supply sources include three active groundwater sources: Haverhill Street Well, Boxford Road Well, and Pingree Farm Wellfield, and one inactive groundwater source: Girl Scouts of Western Massachusetts Well. The Town also has four interconnections with three surrounding water systems that can be used in an emergency. These include interconnections with Georgetown (in two locations), Byfield Water District, and Ipswich. The Georgetown interconnections are located on Haverhill Street and on Farnham Road, the Byfield Water District interconnection is located on Glen Street, and the Ipswich interconnection is located on Main Street. The distribution system also includes 391 fire hydrants, and one water storage tank.
2.2 System Operations The Boxford Road Well No. 3 and Pingree Farm Road Wellfield No. 5 are pumped to the Pingree Farm Water Treatment Plant (WTP) where raw water is treated with aluminum chlorohydrate for particulate removal, potassium permanganate for manganese removal, sodium polyphosphates for corrosion control, sodium hydroxide for pH adjustment, and sodium hypochlorite for disinfection. The WTP began full operation in August 2014. The Town utilizes a Supervisory Control and Data Acquisition (SCADA) system to monitor and control the water distribution system infrastructure.
Boxford Road Well The Boxford Road Well is located at 129 Boxford Road in Rowley. The well is a 45 foot deep gravel packed well with a 5 foot screen, and includes a 450 gallons per minute (gpm) well pump that generally pumps approximately 420 gpm. There is no emergency back-up power at this well.
Pingree Farm Wellfield The Pingree Farm Wellfield is located at 64 Pingree Farm Road in Rowley. The Wellfield includes six 12-inch wells with submersible pumps. The wells are 40 feet deep with 5 feet of screen. Each well has a pumping capacity of 70 gpm, and the wellfield has a combined capacity of 420 gpm. The station has a liquid propane gas powered generator for emergency back-up power.

FINAL Water Audit Report - Rowley, Massachusetts
Page 5
Haverhill Street Well No. 2 The Haverhill Street Well is located at 435 Haverhill Street (Route 133) in Rowley. The well is a 35 foot deep gravel packed well with a 4 foot screen. The well has a 600 gpm vertical turbine pump, installed in 2014, and generally pumps approximately 490 gpm. There is no emergency back-up power at this well. Raw water is treated with chlorine for disinfection and sodium hydroxide for pH adjustment and corrosion control. Phosphate is also added for the sequestration of iron. The treated water is pumped directly into the distribution system.
Water Storage Facility
The Town’s water distribution system includes one water storage tank. The Prospect Hill Tank is a 1.2 million gallon (mg) pre-stressed concrete storage tank constructed in 1982, and is located off Haverhill Street. The overflow elevation of the tank is 277 feet.
Water Conservation Efforts The Town is committed to promoting water conservation and educating consumers. Water conservation tips are readily available on the Town’s Water Department website. Water Conservation tips include, but are not necessarily limited to:
• Run your clothes washer and dishwater only when they are full. You can save up to 1,000 gallons a month.
• Upgrade older toilets with water efficient models.
• Put food coloring in your toilet tank. If it seeps into the toilet bowl without flushing, you have a leak. Fixing it can save up to 1,000 gallons a month.
• Use a water-efficient shower head. They’re inexpensive, easy to install, and can save you up to 750 gallons a month.
• Winterize outdoor spigots when temperatures dip below freezing to prevent pipes from leaking or bursting.
The Town’s water use restriction by-laws are also available on the Town’s Water Department website. In accordance with the Town’s Water Management Act (WMA) Permit, the Town is required to enforce mandatory nonessential outdoor water use restrictions by calendar trigger, from May 1st through September 30th. In addition, the Town is responsible for monitoring stream flow from the USGS Parker River stream gauge from May 1st through September 30th. If the stream flow threshold set by the Massachusetts Department of Environmental Protection (MassDEP) is triggered, the Town is required to enforce mandatory nonessential outdoor water use restrictions. All nonessential outdoor water use restrictions are limited between the hours of 9am to 5pm, and include:
• Irrigation of lawns via sprinklers or automatic irrigation systems;
• Washing of vehicles, except in a commercial car wash or as necessary for operator safety, and;
• Washing of exterior building surfaces, parking lots, driveways or sidewalks, except as necessary to apply surface treatments such as paint, preservatives, stucco, pavement, or cement.

FINAL Water Audit Report - Rowley, Massachusetts
Page 6
These restrictions apply if the Town meets the performance standard of 65 residential gallons per capita per day (rgpcd) water use. The Town has met this performance standard for the past three years. Additional nonessential outdoor water use restrictions apply as required by the Town’s WMA Permit, should the Town exceed this threshold. The Town is currently standardizing the existing water meters to one-inch meters as an additional water conservation effort.

SECTION
3
Section 3

FINAL Water Audit Report - Rowley, Massachusetts
Page 7
SECTION 3 – WATER SUPPLIED TO DISTRIBUTION SYSTEM
3.1 Sources According to the Town’s Water Management Act Permit, the Town is currently registered to withdraw 0.36 million gallons per day (mgd) and permitted to withdraw an additional 0.19 mgd, resulting in a total of 0.55 mgd. The total Maximum Authorized Annual Average Withdrawal Volume (maximum volume that can be safely withdrawn from the aquifer at the source) of all active sources is 1.82 mgd. A summary of the maximum authorized annual average withdrawal volume for each source is presented in Table No. 3-1.
Table No. 3-1
Approved Source Withdrawal Volumes
Source Name Maximum Authorized Annual Average Withdrawal Volume (mgd)
Haverhill Street Well 0.60
Boxford Road Well 0.60
Pingree Farm Wellfield 0.62
Total: 1.82
3.2 Master Meters A master meter was installed at the WTP during construction to measure and record the volume of water supplied to the distribution system. Master meters are a potential source of errors due to the high volume of water the meter registers each day. The WTP is equipped with a ten-inch Siemens magnetic flow meter to monitor high service flow. The MassDEP recommends that master meters be calibrated once a year. The WTP master meter was first tested in 2015, at the end of the first full year of WTP operation. Therefore, the master meter testing results from 2015 are the only information available. According to the Town, the master meter is within an acceptable tolerance of five percent as no issues were found during the calibration process. Due to the recent construction of the WTP, it is assumed that meter testing results from 2015 are similar to the operation of the meter in 2014. A comparison of annual historical total water supply cannot be completed at this time. Based on review of the revised 2014 ASR, the Town supplied approximately 142 mg of water to the distribution system in 2014, with an average day demand (ADD) of 0.39 mgd. The total volume of water supplied each month was provided by the Town, and is shown in Table No. 3-2.

FINAL Water Audit Report - Rowley, Massachusetts
Page 8
Table No. 3-2
2014 Total Water Supply
Month Finished Water Supplied (mg)
January 9.90
February 7.23
March 10.22
April 10.24
May 12.30
June 16.93
July 15.30
August 10.08
September 13.27
October 11.49
November 11.43
December 13.38
Total 141.77
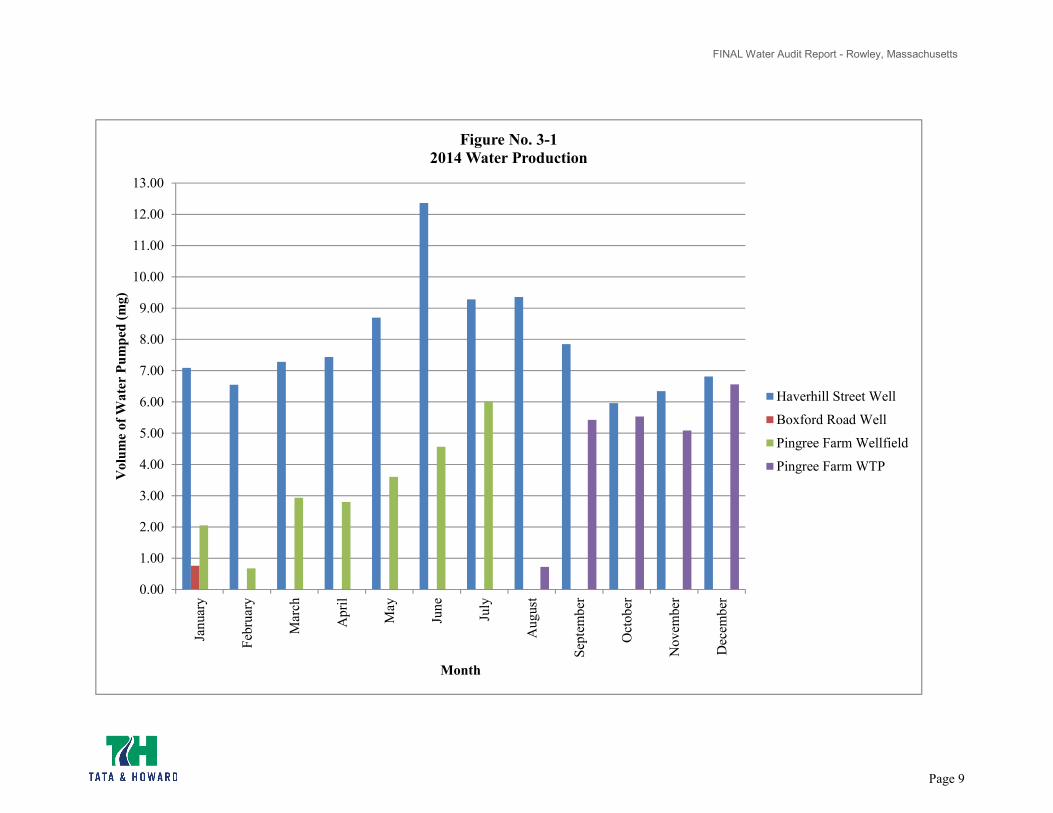
The annual fluctuation in demand and volumes pumped from each source by month are shown in Figure No. 3-1. The volume pumped is measured and recorded by each source’s individual master meter. In 2014, the Haverhill Street Well operated for the entire year, while the Boxford Road Well only pumped in January. As shown in Figure No. 3-1, the Boxford Road Well and Pingree Farm Wellfield began pumping to the WTP in August.
FINAL Water Audit Report - Rowley, Massachusetts
Page 9
0.00
1.00
2.00
3.00
4.00
5.00
6.00
7.00
8.00
9.00
10.00
11.00
12.00
13.00
Januar
y
Feb
ruar
y
Mar
ch
Ap
ril
May
June
July
August
Sep
tem
ber
Oct
ob
er
Novem
ber
Dec
emb
er
Volu
me
of
Wate
r P
um
ped
(m
g)
Month
Figure No. 3-1
2014 Water Production
Haverhill Street Well
Boxford Road Well
Pingree Farm Wellfield
Pingree Farm WTP
FINAL Water Audit Report - Rowley, Massachusetts
Page 10
3.3 SCADA The Town utilizes a SCADA system to monitor and control the water distribution system infrastructure. The Main Control Unit and computer are located at the Water Department office which provides local monitoring of the well pumps and ancillary equipment. The SCADA system communicates to remote stations and the tank via telephone lines. There are several anomalies that can occur from SCADA. Below is a list of these potential anomalies:
• Negative values for items like tank levels,
• Zero values for items like tank levels which are not empty,
• Missing time periods,
• Tank levels reading higher than the tank overflow level,
• Repeat values,
• Duplicate dates and times,
• Impossible values,
• Missing data or data not recorded,
• Values in tables not matching those shown on the SCADA screen,
• Multiple flow descriptions,
• Minor variations between data recorded by redundant programmable logic controllers (PLC),
• Values, such as flow rate, remaining constant,
• Averaging errors.
Evaluation of the Town’s SCADA system for anomalies was not included as part of this water audit report. Review of the SCADA system should be completed annually to identify and correct any inconsistencies.

SECTION
4
Section 4

FINAL Water Audit Report - Rowley, Massachusetts
Page 11
SECTION 4 – METERED CONSUMPTION
4.1 Service Meters and Billing According to the Town, 100 percent of customers served by the distribution system are metered, including all publicly owned buildings. The Town supplies water to a diverse community of residential, commercial, industrial, and agricultural water users. Residential meters range from 5/8-inch to one inch in diameter. In 2014, the Town replaced all water meters with meters that are compatible with the Town’s remote meter reading system. The Town utilizes a radio meter read system, called Neptune E-Coder 900i. The remote meter reading system allows the Town to bill all customers on a monthly basis. The Town employs the billing consultant Pennichuck Corporation (Pennichuck) to read meters, generate account usage reports, and bill customers directly. Pennichuck is also responsible for addressing water bills disputed by customers. The Town offers a one-time abatement, during any 5-year period, for half of the excess water consumption above normal consumption, due to an accidental unpreventable water release, such as a leak. The customer must also prove that the deficiency responsible for the leak has been repaired. The service meter records and billing information for 2014 was obtained from the revised 2014 ASR, and are summarized in Table No. 4-1. The residential gallons per capita daily consumption for the Town in 2014 was approximately 38.52 rgpcd. This is calculated by dividing the metered volume of water used by residential customers by the population as reported in revised pumping volumes provided by the Town. In general, MassDEP in conjunction with the Department of Conservation and Recreation (DCR), require communities to keep their residential per capita consumption at or below 65 rgpcd. Currently, the Town is below the recommended per capita consumption, and has been for the past three years.
Table No. 4-1
Total of Metered Water
2014
Service Type
Total Volume (mgy)
No. of Service Connections
Residential 85.25 1,661
Commercial 0.12 127
Industrial 0.64 9
Agricultural * 6
Municipal/Institutional 8.92 20
Other 0 0
Total: 94.93 1,823
Updated based on revised pumping volumes provided by the Town. *Volume of water omitted from 2014 ASR.

FINAL Water Audit Report - Rowley, Massachusetts
Page 12
The Town bills all customers at the same rate regardless of account type and utilizes a tiered rate structure. During the time period the water audit (2014) is based upon, the first tier included a charge of $14.91 per thousand gallons for up to 4,000 gallons of water, $17.91 per thousand gallons for 4,001 – 36,000 gallons of water, and $19.91 per thousand gallons for any usage greater than 36,001 gallons. No base charge was implemented. It should be noted that the Town has since implemented a new tiered rate structure and associated rates effective July 1, 2015. The first tier includes a charge of $20.13 per thousand gallons for up to 3,000 gallons of water, $24.18 per thousand gallons for 3,001 – 30,000 gallons of water, and $26.88 per thousand gallons for any usage greater than 30,001 gallons. The Town currently bills all customers at the same rate regardless of account type and does not currently implement a base charge.

SECTION
5
Section 5
FINAL Water Audit Report - Rowley, Massachusetts
Page 13
SECTION 5 – UNMETERED UNBILLED AUTHORIZED CONSUMPTION
5.1 General There are numerous unmetered unbilled but authorized uses of water in a public water system including water for periodic maintenance of hydrants, flow tests, and water main flushing programs. The construction of new water mains uses unmetered water for testing and disinfection purposes. In 2014, the Town’s volume of unmetered authorized water use was approximately 0.80 mg. This represents approximately 0.56 percent of the total volume of water supplied in 2014, and is based on information provided in the Town’s 2014 ASR. The Town reported that this water use was related to hydrant/water main flushing. The Town performs system wide hydrant and water main flushing on a bi-annual basis. Flushing is part of an on-going effort to remove any sediment or organics that have deposited into the system. The system wide flushing lasts approximately two weeks, and heavily populated areas are flushed at night to reduce disturbance to customers. The volume of unmetered unbilled authorized water use is calculated on Reporting Worksheet 1, under Authorized Consumption, Appendix A.

SECTION
6
Section 6

FINAL Water Audit Report - Rowley, Massachusetts
Page 14
SECTION 6 – SYSTEM LOSSES
6.1 Apparent Losses The AWWA method classifies unmetered system water losses in two major categories: apparent losses and real losses. Apparent losses are losses associated with the distribution system that occur when water is successfully delivered to the customer but not measured, recorded or processed accurately. The following discusses the three major components of apparent losses. Real losses are further discussed in Section 6.2.
Customer Meter Inaccuracy Customer meters have the potential to be a major source of apparent losses. Meters that record an inaccurate volume of water delivered may result in lost water revenues. In addition to providing information used for billing purposes, data from customer meters can be used to evaluate consumption trends, which can be used for long term planning and to evaluate loss control and conservation programs. The three main components of meter accuracy are physical accuracy, appropriate meter size, and meter type. The physical accuracy relates to a meter functioning properly. Past practices attributed meter inaccuracies to the age of the meters. A study titled, “Accuracy of In-Service Water Meters at Low and High Flow Rates,” was published in 2011 and was sponsored by the Water Research Foundation and the U.S. Environmental Protection Agency (EPA). The study identifies inaccuracies based on meter type and rate of flow. Additionally, inaccuracies in service meters are reportedly due to type and size of the meter, water quality, and low flow conditions. Meters should be periodically tested and repaired or replaced, if necessary, to maximize accuracy. All customer meters were replaced with Neptune E-Coder 9000i meters and coders in 2014. Pennichuck utilizes this radio read system to read meters and generate bills. Pennichuck is responsible for this equipment and the Town does not regularly test or replace service meters. Meter size should be based on the most common flow rate for each customer. Many utilities determine meter size based on AWWA Manual M22, Sizing of Water Service
Lines and Meters. This methodology is based on the flow requirements of all fixtures installed in a building. This may lead to meters being oversized as meters that accurately register the larger flows may not be as accurate during lower more common flows at a customer location. The Town uses 5/8-inch and one-inch water meters for residential accounts. The Town is in the process of standardizing all meters with one-inch services. The appropriate meter type is another factor in determining the accuracy of a customer meter. Different meters are designed for different flow rates and flow patterns. Turbine meters are accurate at high flows but much less accurate at measuring lower flows. Compound meters are capable of measuring both high and low flows accurately. Another example of the need for proper meter type is having a separate meter for fire connections. Fire service connections will be seldom used, but will have a very high flow rate when in

FINAL Water Audit Report - Rowley, Massachusetts
Page 15
use. Smaller meters also operate over a wide range of flows but need to be able to measure very low flow rates, including leakage inside of customer’s homes. The above mentioned study by the Water Research Foundation also noted that nutating disc meters appear to be able to register very low flows, which may be caused by small leaks at a customer location, at a much higher accuracy than other types of meters. During meter readings, Pennichuck is able to determine if a reading is abnormally higher or lower than previous billing cycles. If a potential error is detected, the Water Department will then set up a data logger to test the water meter. If the meter is found to be reading higher than actual water delivered, the Water Department will adjust the meter. If the meter is found to be reading lower than actual water delivered, the customer is liable for paying the entire bill. Customer meters were not tested as part of the audit. Customer meter inaccuracies were estimated to be approximately two percent of the total amount metered. The estimate is based on the accuracy of similar sized meters in other distribution systems. The apparent losses due to customer meter inaccuracy are estimated to be approximately 2.83 mg per year, as calculated on Reporting Worksheet 1, under Apparent Losses, Appendix A.
Systematic Data Handling Errors
Data handling errors are those that occur during the data transfer, billing or archival processes and result in an incorrect accounting of the customer consumption. System wide data handling errors can result in large discrepancies for the distribution system. Table No. 6-1 illustrates typical ways customer consumption data may be compromised.

FINAL Water Audit Report - Rowley, Massachusetts
Page 16
Table No. 6-1
Potential Data Handling Errors
Data Transfer Errors
Manual meter reading errors.
AMR or AMI equipment failure.
Procedural/data entry errors during meter change-outs.
Data Analysis Errors
Poorly estimating volumes in place of meter readings.
Customer billing adjustments given by altering actual metered consumption data.
Poor customer account management. Accounts not activated, lost or transferred incorrectly.
Policy and Procedure Shortcomings
Some customers left unmeasured or unread.
Customer accounts allowed to be made non-billed.
Adjustment policies that allow manipulation of actual customer data.
Bureaucratic regulations or performance lapses that cause delays in permitting, metering or billing operations.
Organizational divisions that prevent data to be accessed by all appropriate personnel.
Currently, the Town utilizes Pennichuck to read customer meters and generate bills. During meter reading, Pennichuck will alert the Water Department of any abnormal reads, if found. The Water Department will then inspect these meters and make adjustments as necessary. To assist with estimating the systematic data handling error, detailed billing records were compared to raw meter readings from 2014 for 50 random customer accounts provided by Pennichuck. Due to the date meter readings occur, billed consumption reported for 2014 was not a full calendar year. A comparison of the two determined that the raw meter readings are approximately 1.9 percent higher than billed consumption for the customer accounts evaluated. To account for a full calendar year of consumption data, the percentage increase was applied to the total consumption reported for 2014. Therefore, the systematic data handling error is an increase of 1.85 mg. This is included on Reporting Worksheet 1, under Apparent Losses, Appendix A.

FINAL Water Audit Report - Rowley, Massachusetts
Page 17
Unauthorized Consumption Unauthorized consumption usually occurs when customers or other persons deliberately take water without paying for it and is common in virtually all drinking water systems. Unauthorized consumption can occur in many ways, including:
• Illegal connections,
• Open bypasses,
• Buried or obscured meters,
• Misuse of fire hydrants and fire-fighting systems (unmetered fire lines),
• Meter tampering,
• Illegally opening intentionally closed valves or curb stops at customer service locations that have been shut off or discontinued for nonpayment,
• Illegally opening intentionally closed valves to neighboring water distribution systems designed for emergency or special use,
• Failing to notify the utility to activate a billing account after water use has been initiated.
Reportedly, the Town does not have any recorded or known history of unauthorized water consumption. Therefore, AWWA suggests a default value of 0.25 percent, or approximately 0.35 mg, of the total water supplied as included in Reporting Worksheet 1, under Apparent Losses, Appendix A.
6.3 Real Losses Real losses are defined as physical losses in the distribution system due to water main breaks and leaks from pipes in the distribution network. These losses occur underground and are not seen until the water either becomes visible on the surface or causes damage that can be seen at the ground surface. Leakage can be categorized into three basic types: surfacing leaks, non-surfacing leaks, and background leakage. Background leakage occurs at very low rates of flow and is usually not considered economically worth fixing individually compared with the larger surfacing and non-surfacing leaks. Pressure reduction is a means of reducing background leakage when possible. Leakage within the distribution system can be caused by several factors including inferior or defective materials, pipe breaks due to poor craftsmanship or materials, operational errors, corrosion (both external and internal), seasonal stresses, poor quality of repair work, poorly aligned fittings and appurtenances, and accidental or deliberate damage to the distribution system. The total real losses for 2014 are estimated to be 40.92 mg as calculated on Reporting Worksheet 1, under Real Losses, Appendix A. A leak detection survey was not completed during the audit period but was completed in 2015. It should be noted that Town records regarding leak detection, water main breaks, etc. are not included in the AWWA’s calculation for real losses. Real losses are calculated by subtracting apparent losses from the total water loss.

SECTION
7
Section 7

FINAL Water Audit Report - Rowley, Massachusetts
Page 18
SECTION 7 – COST OF LOSSES To properly assess the impact that water losses have on the Town system, a value or cost must be applied to both real losses and apparent losses. The value associated with lost water demonstrates the cost to the utility for real losses and the lost revenue for apparent losses.
7.1 System Operating Costs In general, there are two components that make up the costs to supply customers with water. The first component includes the costs associated with providing a public water service including personnel salaries, water system operation and maintenance, capital costs for system improvements, technical services, supplies, and equipment. The second component includes the costs associated with pumping and treating the water supplies and the purchase of water. Based upon review of the Town’s water expenditures, this component includes yearly costs for chemicals, fuel, electricity, supplies, maintenance and equipment. The costs associated with pumping and treating water in 2014 were reviewed and are summarized in Table No. 7-1. Based on the Town’s records, the annual cost to pump and treat water in 2014 was approximately $109,241. The average cost to supply water was $0.62 per 1,000 gallons.
Table No. 7-1
Pumping and Treating Costs 2014
Item 2014 Expenditures Chemical $19,137
Fuel $31,480
Electrical $58,624
Total: $109,241
The total cost of operating the water system in 2014, including all non-production costs on the audit form, is approximately $1,097,649, as included on Reporting Worksheet 1, under Cost Data, Appendix A. Non-production costs include costs for operations and maintenance. Typical costs include employee salaries and benefits, materials, equipment, insurance, fees, administrative costs and all other costs that exist to sustain the drinking water supply. These costs also include interest on debt the department has from system upgrades. These costs do not include any costs to operate wastewater, biosolids, or other systems outside of drinking water.
7.2 Apparent Losses Apparent losses are valued at the retail rate charged to customers, as these losses represent water that reached the customer, but was not billed to the customer. Service

FINAL Water Audit Report - Rowley, Massachusetts
Page 19
charges, connection fees, and other fees are disregarded since they are not dependent on the volume of water a customer uses. Apparent losses within the distribution system for the audit period are estimated to be approximately 5.03 mg. The apparent losses are calculated on Reporting Worksheet 1, under Water Losses, Appendix A. The associated annual cost of apparent losses, as calculated on Reporting Worksheet 1, under Financial Indicators, Appendix A, is approximately $112,922.
7.3 Real Losses Real losses are valued at the production costs. Production costs include the variable costs to pump, treat, purchase, and deliver water to the customer. Since labor costs are not dependent on the volume of water produced, they are not factored into the value of real losses. The volume of real losses including unavoidable background losses is estimated to be approximately 40.92 mg for the audit period and valued at approximately $25,368, as calculated on Reporting Worksheet 1, under Financial Indicators, Appendix A.

SECTION
8
Section 8

FINAL Water Audit Report - Rowley, Massachusetts
Page 20
SECTION 8 – KEY PERFORMANCE INDICATORS The AWWA recommends two types of performance indicators, financial and operational, to assess the performance of the water system. Table No. 8-1 provides a list of the performance indicators (PIs) evaluated in the audit. The AWWA divides the performance indicators into three levels: Levels 1 (Basic), 2 (Intermediate), and 3 (Detailed). The performance indicators should be used as a benchmark to allow the Town to track performance and help determine the effectiveness of any improvements made to the water system.
Table No. 8-1
Performance Indicators
Performance Indicator
Level Description
Financial
Nonrevenue Water by Volume
1 Volume of nonrevenue water as a percentage of water system input volume.
Nonrevenue Water by Cost
3 Value of nonrevenue water as a percentage of annual cost of running the water system.
Operational
Apparent Losses 1 Gallons per service connection per day.
Real Losses 2 Gallons per service connection per day.
Unavoidable Annual Real Losses (UARL)
3 The technical low limit of leakage that can be achieved if all current technology is successfully applied (mg/year).
Infrastructure Leakage Index (ILI)
3 Ratio of Current Annual Real Losses to Unavoidable Annual Real Losses.
8.1 Financial Indicators The two financial indicators which are useful in assessing the fiscal cost of the nonrevenue water use in the Town’s system include Nonrevenue Water by Volume and Nonrevenue Water by Cost. Nonrevenue Water by Volume allows the Town to track the volume of water produced that does not generate revenue. Nonrevenue water includes bleeder usage, construction projects, system maintenance, hydrant usage, water used by the Town at its municipal wells and other facilities, and real and apparent losses. The Nonrevenue Water by Cost performance indicator assigns a monetary value to the nonrevenue water and is expressed as a percentage of the annual cost of operating the water system. This indicator provides insight into the real cost of water used for nonrevenue purposes. Many of these uses are necessary to operate the water system; however, these indicators can be used to help determine if the water can be used more efficiently.

FINAL Water Audit Report - Rowley, Massachusetts
Page 21
8.2 Operational Indicators The operational performance indicators examine losses, both apparent and real, that occur throughout the water system. The Town’s losses are measured in gallons lost per service connection per day. In addition, the indicator can be multiplied by the billing rate to identify the revenue not being earned by the Town on water delivered to the customer that is not accounted for properly. The Real Loss indicator measures the volume of real losses per service connection per day. This indicator can be multiplied by the production cost of the water to indicate costs for the Town to produce water that is not reaching its customers. The UARL is the theoretical value that represents the technical low limit of leakage for a system that can be achieved if all current technology is successfully applied. The UARL equation was developed by the International Water Association’s Water Loss Task Force and published in 2000. The calculation is based on leakage data gathered from well-maintained and well-managed systems. The UARL is calculated on Reporting Worksheet 1, under Operation Efficiency Indicators, Appendix A. The equation is as follows: UARL (gal) = (5.41Lm + 0.15Nc + 7.5Lc) x P:
Lm = length of water mains (miles) Nc = number of service connections Lc = total length of private pipe (miles) = Nc x average distance from curb stop to customer meter, Lp P = average system pressure (psi)
The ILI is a dimensionless indicator used as a benchmarking tool to compare leakage among different utilities. It is a ratio of the Current Annual Real Losses (CARL) to the UARL and quantifies how well a water system is managed for leakage control. The UARL for the Town’s system is estimated to be approximately 23.4 mg. The UARL was calculated using the length of mains and number of service connections listed in the 2014 ASR, the estimated length of each service connection, and the hydraulic model to estimate the average system pressure. The ILI for the Town’s system is estimated to be 1.75. The ILI is calculated on Reporting Worksheet 1, under Operation Efficiency Indicators, Appendix A. In a study published by the AWWA in 2013, audit data from 26 systems from North America was validated to establish reliable industry benchmarks. Of the systems compared, eleven had an ILI under 2.0, eleven had an ILI between 2.0 and 4.0 and the remaining four had an ILI between 4.0 and 10.8. There are two primary potential causes of error in the Town’s data; system input volume reported through the master meters, and general lack of historical data. Further investigation of the cause of the low ILI is recommended.

SECTION
9
Section 9

FINAL Water Audit Report - Rowley, Massachusetts
Page 22
SECTION 9 – WATER AUDIT RESULTS
9.1 AWWA Audit Results The AWWA Audit Software summarizing the audit findings and the data validity score are provided in Appendix A. The findings include the validity grades given to the data and the performance indicators (PIs) of the water system. During 2014, the Town supplied approximately 142 mg from its own sources to the distribution system. Approximately 46.84 mg of this water is classified as non-revenue water, as calculated on Reporting Worksheet 1, under Non-Revenue Water, Appendix A. The results of the PIs from the audit form are summarized in Table No. 9-1.
Table No. 9-1
Performance Indicator Results
Performance Indicator
Result Description
Financial
Nonrevenue Water by Volume
33.0% Volume of nonrevenue water as a percentage of water system input volume.
Nonrevenue Water by Cost
12.6% Value of nonrevenue water as a percentage of annual cost of running the water system.
Operational
Apparent Losses 7.57 Gallons per service connection per day.
Real Losses 61.49 Gallons per service connection per day.
Unavoidable Annual Real Losses (UARL)
23.39 The technical low limit of leakage that can be achieved if all current technology is successfully applied (mg/year).
Infrastructure Leakage Index
1.75 Ratio of Current Annual Real Losses to Unavoidable Annual Real Losses.
Data Validity The data from each category is given a validity score. Table No. 9-2 summarizes the grade for each category. The grading matrix, which explains in general how the validity score for each category is arrived at, can be found under Grading Matrix, Appendix A. For example, the category ‘volume from own sources’ received a score of five because although all treated water production sources are metered, and meter calibration tests are completed on a biannual basis, the Town does not maintain records of recent calibration results. Annual testing of the master meters and making adjustments to any meters not accurately reading flows will increase this score.

FINAL Water Audit Report - Rowley, Massachusetts
Page 23
The Data Validity Score on the audit form is 60 out of 100 giving the Town a Data Validity Level of III. An increase of 10 points in the data validity score will increase the Data Validity Level to IV. Both the Data Validly Score and Data Validity Level do not have a direct effect on the ILI. The Data Validity Score is a confidence factor for how accurate the water audit is. The Data Validity Level provides a guideline for water loss control planning. The Water Loss Control Planning Guide, which includes the Data Validity Level, is included in Appendix A.

FINAL Water Audit Report - Rowley, Massachusetts
Page 24
Table No. 9-2
Data Validity Scores
Category Score Reason for Score Recommendation to Improve Score
Volume From Own Source
5 All of the Town’s sources currently in use have master meters, and meter testing is performed biannually, but the Town does not maintain records of the results.
Conduct volumetric master meter testing annually.
Master Meter Error Adjustment
5 Master meter testing and/or calibration completed after the audit period (2015), but no documentation of the results was provided.
Conduct master meter testing annually over multiple flows to confirm accuracy of all flows, and document results. Set procedure to review data daily and detect input errors.
Water Imported N/A
Water Exported N/A
Billed Metered 7 All customers’ meters have been replaced, and are metered on a volume-based reading system that produces reliable customer meter records.
Continue to utilize a billing consultant and begin annual customer meter testing.
Billed Unmetered N/A
Unbilled metered 8 Meters are read monthly to determine consumption. Complete annual audits on the unbilled, but metered accounts.
Unbilled unmetered
6 Most unbilled and unmetered water use is documented and estimated.
Continue to keep record of all unbilled unmetered uses, record of how usage was calculated, and add meters whenever possible to document usage.
Unauthorized Consumption
5 The Town has no record of unauthorized consumption. Continue to be aware of any potential unauthorized consumption and keep record of any incidents.
Customer Metering Inaccuracies
5 The Town replaced all meters in 2014, but regular meter testing is not completed.
Conduct regular customer meter testing.

FINAL Water Audit Report - Rowley, Massachusetts
Page 25
Table No. 9-2
Data Validity Scores
Category Score Reason for Score Recommendation to Improve Score
Systematic Data Handling Error
5 Pennichuck uses a robust computer system to provide high functionality and reporting capabilities.
Continue to utilize Pennichuck and keep records of billing data.
Length of Mains 8 Accurate data kept in GIS database. Continue to utilize GIS to record data and update as necessary.
Number of Active and Inactive Service Connections
8 Electronic system is utilized to manage system service information.
Continue working with Pennichuck to ensure an electronic database of service connections.
Average Length of Customer Service Line
3 Policy exists that the curb stop acts as a boundary and average length is based on limited knowledge.
Keep record drawings of each customer service. Field survey sample of customers to better estimate length. Update records as necessary.
Average Operating Pressure
4 Pressure data is gathered from gauges at fire hydrants and average operating pressure is calculated.
Create a hydraulic model with defined pressure zones.
Total Annual Cost of Operating Water System
5 Electronic system used to track and record all pertinent water costs, but data is not audited by a third party.
Continue to track all costs and conduct an internal audit or have an audit completed by a third-party certified public accountant.
Customer Retail Unit Cost
9 Water rates were last updated in July 2015 based upon a third party recommendation.
Conduct periodic third party audits of rate structure to confirm rates are appropriate to fund the system and future improvements.
Variable Production Cost
6 Data has not been audited by a third party. Perform financial audit on annual basis so data can be verified, and conduct a third-party audit.

SECTION
10
Section 10

FINAL Water Audit Report - Rowley, Massachusetts
Page 26
SECTION 10 – RECOMMENDATIONS
10.1 Recommendations
The following recommendations are a result of this water audit report. These recommendations will improve record keeping and increase the validity score for the data as shown in the AWWA Water Audit, Appendix A. These recommendations will also assist in lowering the Town’s unaccounted-for-water. Based on this audit, the following actions are currently implemented by the Town, and are recommended to continue.
1. Continue to perform monthly meter readings.
2. Continue to conduct annual leak detection and document leaks found during
everyday operation. Leak records should include the location, date, time, approximate size of leak, the type of leak, and an estimate of approximate period of time the leak occurred. Leaks should be repaired when identified.
3. The Town should continue to utilize GIS to accurately store information such as water mains, materials, lengths, curb stops, and length of service connections, and consider utilizing a water system hydraulic model.
4. The Town should continue to track all costs associated with operating the water
distribution system and conduct internal audits or have an audit completed by a third party to confirm accuracy on an annual basis. The estimated cost to complete an audit by a third party is $21,500.
5. Continue to conduct third party audits of the rate structure to confirm rates are appropriate to fund the system and future improvements. Rate structure audits should be conducted every three years, minimum. The estimated cost to complete a third party audit of the rate structure is $12,500.
The following recommendations are suggested for the Town to start:
1. The Town should report annual usage based on raw meter readings for a calendar year. Water losses are more accurate if annual usage is reported based on raw meter readings for the calendar year than consumption billed.
2. The Town should begin to volumetrically test the source master meters and the WTP master meter annually over multiple flow rates to confirm accuracy of all flows, and document results. The estimated cost to annually volumetrically test the meters is approximately $3,000.
3. The Town should review the SCADA system annually to identify and correct any inconsistencies.

FINAL Water Audit Report - Rowley, Massachusetts
Page 27
4. The Town should use meters whenever possible to document all unbilled and
unmetered use, and establish a program with the Rowley Fire Department to track the location and length of time a hydrant is flowed, and the estimated flow rate. This will provide the Town with the ability to estimate the quantity for water used each year for fire protection and training.
5. Create a policy to monitor unauthorized consumption, enforce penalties, and
document any incidents.
6. A random selection of in-service customer meters should be tested for accuracy each year. The results from these tests can be used to create a database to help determine customer meter accuracy and approximately how long meters should be left in service before being replaced. Any meters found to be underperforming during the test should be replaced immediately.

APPENDIX A
Appendix A

4.2
THE FOLLOWING KEY APPLIES THROUGHOUT: Value can be entered by user
Value calculated based on input data
These cells contain recommended default values
Please begin by providing the following information , then proceed through each sheet in the workbook:
NAME OF CITY OR UTILITY: COUNTRY:
REPORTING YEAR: 2014 START DATE(MM/YYYY): 01/2014 END DATE(MM/YYYY): 12/2014
NAME OF CONTACT PERSON: E-MAIL:Ext.
PLEASE SELECT PREFERRED REPORTING UNITS FOR WATER VOLUME:
Click to advance to sheet… Click here: for help about units and conversions
Comments:
If you have questions or comments regarding the sof tware please contact us at: [email protected]
Rowley Water Department
AWWA Water Loss Control Committee (WLCC) Free Water Audit Software v4.2
USE: The spreadsheet contains several separate worksheets. She ets can be accessed using the tabs towards the bottom of the sc reen,or by clicking the buttons on the left below. Descr iptions of each sheet are also given below.
PURPOSE: This spreadsheet-based water audit tool is designe d to help quantify and track water losses associate d with water distribution systems and identify areas for improve d efficiency and cost recovery. It provides a "top- down" summary water audit
format, and is not meant to take the place of a ful l-scale, comprehensive water audit format.
USA
The current sheet
TELEPHONE:
Million gallons (US)
Enter the required data on this worksheet to calcul ate the water balance
Depending on the confidence of audit inputs, a grad ing is assigned to the audit score
Use this sheet to understand terms used in the audi t process
Use this sheet to interpret the results of the audi t validity score and performance indicators
Diagrams depicting possible customer service connec tion configurations
The values entered in the Reporting Worksheet are u sed to populate the water balance
Instructions
Reporting Worksheet
Loss Control Planning
Water Balance
Definitions
Copyright © 2010, American Water Works Association. All Rights Reserved. WAS v4.2
?
Grading Matrix
Add comments here to track additional
supporting information, sources or names of
participants
Service Connections
AWWA Water Loss Control Committee Instructions 1

Water Audit Report for: Rowley Water Department
Reporting Year:
All volumes to be entered as: MILLION GALLONS (US) PER YEAR
WATER SUPPLIED
Volume from own sources: 5 141.770 Million gallons (US)/yr (MG/Yr)
Master meter error adjustment (enter positive value) : 5 0.000
Water imported: n/a 0.000 MG/Yr
Water exported: n/a 0.000 MG/Yr
WATER SUPPLIED: 141.770 MG/Yr.
AUTHORIZED CONSUMPTIONBilled metered: 7 94.930 MG/Yr
Billed unmetered: n/a 0.000 MG/Yr
Unbilled metered: 8 0.090 MG/Yr Pcnt: Value:
Unbilled unmetered: 6 0.800 MG/Yr 1.25% 24061
AUTHORIZED CONSUMPTION: 95.820 MG/Yr
WATER LOSSES (Water Supplied - Authorized Consumpti on) 45.950 MG/Yr
Apparent Losses Pcnt: Value:
Unauthorized consumption: 5 0.354 MG/Yr 0.25%
Customer metering inaccuracies: 5 2.830 MG/Yr 2.00%
Systematic data handling errors: 5 1.850 MG/Yr
Apparent Losses: 5.034
Real Losses (Current Annual Real Losses or CARL)
Real Losses = Water Losses - Apparent Losses: 40.916 MG/Yr
WATER LOSSES: 45.950 MG/Yr
NON-REVENUE WATER
NON-REVENUE WATER: 46.840 MG/Yr
= Total Water Loss + Unbilled Metered + Unbilled Un metered
SYSTEM DATA
Length of mains: 8 43.0 miles
Number of active AND inactive service connections: 8 1,823
Connection density: 42 conn./mile main
Average length of customer service line: 3 52.0 ft
Average operating pressure: 4 100.0 psi
COST DATA
Total annual cost of operating water system: 5 $1,097,649 $/Year
Customer retail unit cost (applied to Apparent Losses): 9 $22.43Variable production cost (applied to Real Losses) : 6 $620.00 $/Million gallons
PERFORMANCE INDICATORS
Financial Indicators
Non-revenue water as percent by volume of Water Sup plied: 33.0%
Non-revenue water as percent by cost of operating s ystem: 12.6%
Annual cost of Apparent Losses: $112,922
Annual cost of Real Losses: $25,368
Operational Efficiency Indicators
Apparent Losses per service connection per day: 7.57 gallons/connection/day
Real Losses per service connection per day*: 61.49 gallons/connection/day
Real Losses per length of main per day*: N/A
Real Losses per service connection per day per psi pressure: 0.61 gallons/connection/day/psi
Unavoidable Annual Real Losses (UARL): 23.39 million gallons/year
From Above, Real Losses = Current Annual Real Losse s (CARL): 40.92 million gallons/year
1.75
* only the most applicable of these two indicators will be calculated
WATER AUDIT DATA VALIDITY SCORE:
PRIORITY AREAS FOR ATTENTION:
1: Volume from own sources
2: Customer metering inaccuracies
3: Total annual cost of operating water system
0.800
AWWA WLCC Free Water Audit Software: Reporting Wor ksheet
2014
over-registered
1/2014 - 12/2014
<< Enter grading in column 'E'
MG/Yr
2.830
Choose this option to
enter a percentage of
billed metered
consumption. This is
NOT a default value
0.250
Based on the information provided, audit accuracy can be improved by addressing the following compone nts:
*** YOUR SCORE IS: 60 out of 100 ***
Infrastructure Leakage Index (ILI) [CARL/UARL]:
Default option selected for unautho rized consumption - a grading of 5 is applied but n ot displayed
$/1000 gallons (US)
A weighted scale for the components of consumption and water loss is included in the calculation of th e Water Audit Data Validity Score
?
?
?
?
?
? Click to access definition
?
?
?
?
?
?
Back to Instructions
Please enter data in the white cells below. Where available, metered values should be used; if metered values are unavailable please estimate a value. Indicate your confidence in the accuracy of the input data by grading each component (1-10) using the drop-down list to the left of the input cell. Hover the mouse over the cell to obtain a description of the grades
?
?
?
?
?
?
?
?
?
(pipe length between curbstop and customer meter or property boundary)
Use buttons to selectpercentage of water supplied
ORvalue
?Click here:
for help using option buttons below
For more information, click here to see the Grading Matrix worksheet
?
Copyright © 2010, American Water Works Association. All Rights Reserved.
?
?
?
?
WAS v4.2
AWWA Water Loss Control Committee Reporting Worksheet 2

Water Audit Report For: Report Yr:
Rowley Water Department 2014
Water Exported
0.000Billed Metered Consumption (inc. water exported)
Revenue Water
94.930
Own SourcesAuthorized
Consumption 94.930 Billed Unmetered Consumption 94.9300.000
95.820 Unbilled Metered Consumption
0.090
141.770 0.890 Unbilled Unmetered Consumption
0.800
Water Supplied Unauthorized Consumption 46.840Apparent Losses 0.354
141.770 5.034 Customer Metering Inaccuracies
2.830
Systematic Data Handling Errors
Water Losses 1.850
Water Imported 45.950 Leakage on Transmission and/or Distribution Mains
Real Losses Not broken down
0.000 40.916 Leakage and Overflows at Utility's Storage Tanks
Not broken downLeakage on Service Connections
Not broken down
Non-Revenue Water (NRW)
AWWA WLCC Free Water Audit Software: Water Balance
Billed Authorized Consumption
Unbilled Authorized Consumption
(Adjusted for known errors)
Billed Water Exported
Copyright © 2010, American Water Works Association. All Rights Reserved. WAS v4.2
AWWA Water Loss Control Committee Water Balance 3

n/a 1 2 3 4 5 6 7 8 9 10
Volume from own sources:
Select this grading
only if the water
utility
purchases/imports
all of its water
resources (i.e. has
no sources of its
own)
Less than 25% of water
production sources are
metered, remaining sources are
estimated. No regular meter
accuracy testing.
25% - 50% of treated water
production sources are metered;
other sources estimated. No
regular meter accuracy testing.
Conditions
between
2 and 4
50% - 75% of treated water
production sources are metered,
other sources estimated.
Occasional meter accuracy testing
Conditions
between
4 and 6
At least 75% of treated water
production sources are metered, or
at least 90% of the source flow is
derived from metered sources.
Meter accuracy testing and/or
electronic calibration conducted
annually. Less than 25% of tested
meters are found outside of +/- 6%
accuracy.
Conditions
between
6 and 8
100% of treated water production
sources are metered, meter
accuracy testing and electronic
calibration conducted annually, less
than 10% of meters are found
outside of +/- 6% accuracy
Conditions
between
8 and 10
100% of treated water production
sources are metered, meter
accuracy testing and electronic
calibration conducted semi-
annually, with less than 10% found
outside of +/- 3% accuracy.
Improvements to attain higher
data grading for "Volume from
own Sources" component:
to qualify for 2:
Organize efforts to begin to
collect data for determining
volume from own sources
to maintain 10:
Standardize meter accuracy test
frequency to semi-annual, or more
frequent, for all meters. Repair or
replace meters outside of +/- 3%
accuracy. Continually
investigate/pilot improving metering
technology.
Master meter error adjustment:
Select n/a only if the
water utility fails to
have meters on its
sources of supply,
either its own
source, and/or
imported
(purchased) water
sources
Inventory information on meters
and paper records of measured
volumes in crude condition; data
error cannot be determined
No automatic datalogging of
production volumes; daily readings
are scribed on paper records.
Tank/storage elevation changes
are not employed in calculating
"Volume from own sources"
component. Data is adjusted only
when grossly evident data error
occurs.
Conditions
between
2 and 4
Production meter data is logged
automatically in electronic format
and reviewed at least on a monthly
basis. "Volume from own sources"
tabulations include estimate of daily
changes in tanks/storage facilities.
Meter data is adjusted when gross
data errors occur, or occasional
meter testing deems this
necessary.
Conditions
between
4 and 6
Hourly production meter data
logged automatically & reviewed on
at least a weekly basis. Data
adjusted to correct gross error
from equipment malfunction and
error confirmed by meter accuracy
testing. Tank/storage facility
elevation changes are
automatically used in calculating a
balanced "Volume from own
sources" component.
Conditions
between
6 and 8
Continuous production meter data
logged automatically & reviewed
daily. Data adjusted to correct
gross error from equipment
malfunction & results of meter
accuracy testing. Tank/storage
facility elevation changes are
automatically used in "Volume from
own sources" tabulations.
Conditions
between
8 and 10
Computerized system (SCADA or
similar) automatically balances
flows from all sources and
storages; results reviewed daily.
Mass balance technique compares
production meter data to raw
(untreated) water and treatment
volumes to detect anomalies.
Regular calibrations between
SCADA and sources meters
ensures minimal data transfer
error.
Improvements to attain higher
data grading for "Master meter
error adjustment" component:
to qualify for 2:
Develop plan to restructure
recordkeeping system to
capture all flow data; set
procedure to review data daily
to detect input errors
to maintain 10:
Monitor meter innovations for
development of more accurate and
less expensive flowmeters.
Continue to replace or repair
meters as they perform outside of
desired accuracy limits.
Water Imported:
Select n/a if the
water utility's supply
is exclusively from
its own water
resources (no bulk
purchased/ imported
water)
Less than 25% of imported
water sources are metered,
remaining sources are
estimated. No regular meter
accuracy testing.
25% - 50% of imported water
sources are metered; other
sources estimated. No regular
meter accuracy testing.
Conditions
between
2 and 4
50% - 75% of imported water
sources are metered, other
sources estimated. Occasional
meter accuracy testing
Conditions
between
4 and 6
At least 75% of imported water
sources are metered, meter
accuracy testing and/or electronic
calibration conducted annually.
Less than 25% of tested meters
are found outside of +/- 6%
accuracy.
Conditions
between
6 and 8
100% of imported water sources
are metered, meter accuracy
testing and/or electronic calibration
conducted annually, less than 10%
of meters are found outside of +/-
6% accuracy
Conditions
between
8 and 10
100% of imported water sources
are metered, meter accuracy
testing and/or electronic calibration
conducted semi-annually, with less
than 10% found outside of +/- 3%
accuracy.
Improvements to attain higher
data grading for "Water
Imported Volume" component:
to qualify for 2:
Review bulk water purchase
agreements with partner
suppliers; confirm requirements
for use and maintenance of
accurate metering. Identify
needs for new or replacement
meters with goal to meter all
imported water sources.
to maintain 10:
Standardize meter accuracy test
frequency to semi-annual, or more
frequent, for all meters. Repair or
replace meters outside of +/- 3%
accuracy. Continually
investigate/pilot improving metering
technology.
Water Exported:
Select n/a if the
water utility sells no
bulk water to
neighboring water
utilities (no exported
water sales)
Less than 25% of exported
water sources are metered,
remaining sources are
estimated. No regular meter
accuracy testing.
25% - 50% of exported water
sources are metered; other
sources estimated. No regular
meter accuracy testing.
Conditions
between
2 and 4
50% - 75% of exported water
sources are metered, other
sources estimated. Occasional
meter accuracy testing
Conditions
between
4 and 6
At least 75% of exported water
sources are metered, meter
accuracy testing and/or electronic
calibration conducted annually.
Less than 25% of tested meters
are found outside of +/- 6%
accuracy.
Conditions
between
6 and 8
100% of exported water sources
are metered, meter accuracy
testing and/or electronic calibration
conducted annually, less than 10%
of meters are found outside of +/-
6% accuracy
Conditions
between
8 and 10
100% of exported water sources
are metered, meter accuracy
testing and/or electronic calibration
conducted semi-annually, with less
than 10% found outside of +/- 3%
accuracy.
To qualify for 4:
Locate all imported water sources on maps and
in field, launch meter accuracy testing for existing
meters, begin to install meters on unmetered
imported water interconnections and replace
obsolete/defective meters
to qualify for 6:
Formalize annual meter accuracy testing for all
imported water meters. Continue installation of
meters on unmetered exported water
interconnections and replacement of
obsolete/defective meters.
to qualify for 8:
Complete project to install new, or replace
defective, meters on all imported water
interconnections. Maintain annual meter
accuracy testing for all imported water meters.
Repair or replace meters outside of +/- 6%
accuracy.
to qualify for 10:
Maintain annual meter accuracy testing for all
meters. Repair or replace meters outside of +/-
6% accuracy. Investigate new meter technology;
pilot one or more replacements with innovative
meters in attempt to improve meter accuracy.
to qualify for 4:
Locate all water production sources on maps and
in field, launch meter accuracy testing for existing
meters, begin to install meters on unmetered
water production sources and replace any
obsolete/defective meters
to qualify for 6:
Formalize annual meter accuracy testing for all
source meters. Complete installation of meters
on unmetered water production sources and
complete replacement of all obsolete/defective
meters.
to qualify for 8:
Conduct annual meter accuracy testing on all
meters. Complete project to install new, or
replace defective existing, meters so that entire
production meter population is metered. Repair
or replace meters outside of +/- 6% accuracy.
to qualify for 10:
Link all production and tank/storage facility
elevation change data to a Supervisory Control &
Data Acquisition (SCADA) System, or similar
computerized monitoring/control system, and
establish automatic flow balancing algorithm and
regularly calibrate between SCADA and source
meters.
to qualify for 4:
Install automatic datalogging equipment on
production meters. Identify tanks/storage
facilities and include estimated daily volume of
water added to, or subtracted from, "Water
Supplied" volume based upon changes in
storage
AWWA WLCC Free Water Audit Software: Grading Matri x
In the Reporting Worksheet, grades were assigned to each component of the audit to describe the confid ence and accuracy of the input data. The grading as signed to each audit component and the corresponding recommended improvements and acti ons are highlighted in yellow. Audit accuracy is li kely to be improved by prioritizing those items sho wn in red
Grading
to qualify for 6:
Review hourly production meter data for gross
error on, at least, a weekly basis. Begin to install
instrumentation on tanks/storage facilities to
record elevation changes. Use daily net storage
change to balance flows in calculating "Water
Supplied" volume.
to qualify for 8:
Complete installation of elevation instrumentation
on all tanks/storage facilities. Continue to use
daily net storage change in calculating balanced
"Volume from own sources" component. Adjust
production meter data for gross error and
inaccuracy confirmed by testing.
to qualify for 10:
Maintain annual meter accuracy testing for all
meters. Repair or replace meters outside of +/-
6% accuracy. Investigate new meter technology;
pilot one or more replacements with innovative
meters in attempt to improve meter accuracy.
Back to InstructionsCopyright © 2010, American Water Works Association. All Rights Reserved. WASv 4.2
Back to Instructions
AWWA Water Loss Control Committee Grading Matrix 4

n/a 1 2 3 4 5 6 7 8 9 10
Grading
Improvements to attain higher
data grading for "Water
Exported Volume" component:
to qualify for 2:
Review bulk water sales
agreements with partner
suppliers; confirm requirements
for use & upkeep of accurate
metering. Identify needs to
install new, or replace defective
meters as needed.
to maintain 10:
Standardize meter accuracy test
frequency to semi-annual, or more
frequent, for all meters. Repair or
replace meters outside of +/- 3%
accuracy. Continually
investigate/pilot improving metering
technology.
Billed metered:
n/a (not applicable).
Select n/a only if the
entire customer
population is not
metered and is
billed for water
service on a flat or
fixed rate basis. In
such a case the
volume entered
must be zero.
Less than 50% of customers
with volume-based billings from
meter readings; flat or fixed rate
billed for the majority of the
customer population
At least 50% of customers with
volume-based billing from meter
reads; flat rate billed for others.
Manual meter reading, under 50%
read success rate, remainder
estimated. Limited meter records,
no regular meter testing or
replacement. Billing data
maintained on paper records, with
no auditing.
Conditions
between
2 and 4
At least 75% of customers with
volume-based billing from meter
reads; flat or fixed rate billed for
remainder. Manual meter reading
used, at least 50% meter read
success rate, failed reads are
estimated. Purchase records
verify age of customer meters; only
very limited meter accuracy testing
is conducted. Customer meters
replaced only upon complete
failure. Computerized billing
records, but only periodic internal
auditing conducted.
Conditions
between
4 and 6
At least 90% of customers with
volume-based billing from meter
reads; remaining accounts are
estimated. Manual customer
meter reading gives at least 80%
customer meter reading success
rate, failed reads are estimated.
Good customer meter records,
limited meter accuracy testing,
regular replacement of oldest
meters. Computerized billing
records with routine auditing of
global statistics.
Conditions
between
6 and 8
At least 97% of customers with
volume-based billing from meter
reads. At least 90% customer
meter read success rate; or
minimum 80% read success rate
with planning and budgeting for
trials of Automatic Metering
Reading (AMR) in one or more pilot
areas. Good customer meter
records. Regular meter accuracy
testing guides replacement of
statistically significant number of
meters each year. Routine
auditing of computerized billing
records for global and detailed
statistics; verified periodically by
third party.
Conditions
between
8 and 10
At least 99% of customers with
volume-based billing from meter
reads. At least 95% customer
meter reading success rate; or
minimum 80% meter reading
success rate, with Automatic Meter
Reading (AMR) trials underway.
Statistically significant customer
meter testing and replacement
program in place. Computerized
billing with routine, detailed
auditing, including field investigation
of representative sample of
accounts. Annual audit verification
by third party.
Improvements to attain higher
data grading for "Billed
Metered Consumption"
component:
If n/a is selected
because the
customer meter
population is
unmetered, consider
establishing a new
policy to meter the
customer population
and employ water
rates based upon
metered volumes.
to qualify for 2:
Conduct investigations or trials
of customer meters to select
appropriate meter models.
Budget funding for meter
installations. Investigate volume
based water rate structures.
to maintain 10:
Regular internal and third party
auditing, and meter accuracy
testing ensures that accurate
customer meter readings are
obtained and entered as the basis
for volume based billing. Stay
abreast of improvements in
Advanced Metering Infrastructure
(AMI) and information
management. Plan and budget for
justified upgrades in metering,
meter reading and billing data
management.
Billed unmetered:
Select n/a if it is the
policy of the water
utility to meter all
customer
connections and it
has been confirmed
by detailed auditing
that all customers
do indeed have a
water meter; i.e. no
unmetered accounts
exist
Water utility policy does not
require customer metering; flat
or fixed fee billed. No data
collected on customer
consumption. Only estimates
available are derived from data
estimation methods using
average fixture count multiplied
by number of connections, or
similar approach.
Water utility policy does not require
customer metering; flat or fixed fee
billed. Some metered accounts
exist in parts of the system (pilot
areas or District Metered Areas)
with consumption recorded on
portable dataloggers. Data from
these sample meters are used to
infer consumption for the total
customer population. Site specific
estimation methods are used for
unusual buildings/water uses.
Conditions
between
2 and 4
Water utility policy does require
metering and volume based billing
but lacks written procedures and
employs casual oversight, resulting
in up to 20% of billed accounts
believed to be unmetered. A rough
estimate of the annual
consumption for all unmetered
accounts is included in the annual
water audit, with no inspection of
individual unmetered accounts.
Conditions
between
4 and 6
Water utility policy does require
metering and volume based billing
but exemption exist for a portion of
accounts such as municipal
buildings. As many as 15% of
billed accounts are unmetered due
to this exemption or meter
installation difficulties. Only a
group estimate of annual
consumption for all unmetered
accounts is included in the annual
water audit, with no inspection of
individual unmetered accounts.
Conditions
between
6 and 8
Water utility policy requires
metering and volume based billing
for all customer accounts.
However, less than 5% of billed
accounts remain unmetered
because because installation is
hindered by unusual
circumstances. The goal is to
minimize the number of unmetered
accounts. Reliable estimates of
consumption are obtained for
unmetered accounts via site
specific estimation methods.
Conditions
between
8 and 10
Water utility policy requires
metering and volume based billing
for all customer accounts. Less
than 2% of billed accounts are
unmetered and exist because
meter installation is hindered by
unusual circumstances. The goal
exists to minimize the number of
unmetered accounts to the extent
that is economical. Reliable
estimates of consumption are
obtained at these accounts via site
specific estimation methods.
Improvements to attain higher
data grading for "Billed
Unmetered Consumption"
component:
to qualify for 2:
Investigate a new water utility
policy to require metering of the
customer population, and a
reduction of unmetered
accounts. Conduct pilot
metering project by installing
water meters in small sample of
customer accounts and
datalogging the water
consumption.
to maintain 10:
Continue to refine estimation
methods for unmetered
consumption and explore means to
establish metering, for as many
billed unmetered accounts as is
economically feasible.
to qualify for 4:
Implement a new water utility policy requiring
customer metering. Expand pilot metering study
to include several different meter types, which will
provide data for economic assessment of full
scale metering options. Assess sites with
access difficulties to devise means to obtain
water consumption volumes.
to qualify for 6:
Budget for staff resources to review billing
records to identify unmetered properties. Specify
metering needs and funding requirements to
install sufficient meters to significant reduce the
number of unmetered accounts
to qualify for 8:
Install customer meters on a full scale basis.
Refine metering policy and procedures to ensure
that all accounts, including municipal properties,
are designated for meters. Implement
procedures to obtain reliable consumption
estimate for unmetered accounts awaiting meter
installation.
to qualify for 10:
Continue customer meter installation throughout
the service area, with a goal to minimize
unmetered accounts. Sustain the effort to
investigate accounts with access difficulties to
devise means to install water meters or
otherwise measure water consumption.
to qualify for 4:
Purchase and install meters on unmetered
accounts. Implement policies to improve meter
reading success. Catalog meter information
during meter read visits to identify age/model of
existing meters. Test a minimal number of
meters for accuracy. Install computerized billing
system.
to qualify for 6:
Purchase and install meters on unmetered
accounts. Eliminate flat fee billing and establish
appropriate water rate structure based upon
measured consumption. Continue to achieve
verifiable success in removing manual meter
reading barriers. Expand meter accuracy testing.
Launch regular meter replacement program.
Conduct routine audit of global statistics.
to qualify for 8:
Purchase and install meters on unmetered
accounts. Assess cost-effectiveness of
Automatic Meter Reading (AMR) system for
portion or entire system; or achieve ongoing
improvements in manual meter reading success
rate. Refine meter accuracy testing program.
Set meter replacement goals based upon
accuracy test results. Refine routine auditing
procedures based upon third party guidance.
to qualify for 10:
Purchase and install meters on unmetered
accounts. Launch Automatic Meter Reading
(AMR) system trials if manual meter reading
success rate of at least 95% is not achieved
within a five-year program. Continue meter
accuracy testing program. Conduct planning and
budgeting for large scale meter replacement
based upon meter life cycle analysis using
cumulative flow target. Continue routine auditing
and require annual third party review.
To qualify for 4:
Locate all exported water sources on maps and
in field, launch meter accuracy testing for existing
meters, begin to install meters on unmetered
exported water interconnections and replace
obsolete/defective meters
to qualify for 6:
Formalize annual meter accuracy testing for all
exported water meters. Continue installation of
meters on unmetered exported water
interconnections and replacement of
obsolete/defective meters.
to qualify for 8:
Complete project to install new, or replace
defective, meters on all exported water
interconnections. Maintain annual meter
accuracy testing for all imported water meters.
Repair or replace meters outside of +/- 6%
accuracy.
to qualify for 10:
Maintain annual meter accuracy testing for all
meters. Repair or replace meters outside of +/-
6% accuracy. Investigate new meter technology;
pilot one or more replacements with innovative
meters in attempt to improve meter accuracy.
AUTHORIZED CONSUMPTION
AWWA Water Loss Control Committee Grading Matrix 5

n/a 1 2 3 4 5 6 7 8 9 10
Grading
Unbilled metered:
select n/a if all billing-
exempt
consumption is
unmetered.
Billing practices exempt certain
accounts, such as municipal
buildings, but written policies do
not exist; and a reliable count of
unbilled metered accounts is
unavailable. Meter upkeep and
meter reading on these
accounts is rare and not
considered a priority. Due to
poor recordkeeping and lack of
auditing, water consumption for
all such accounts is purely
guesstimated.
Billing practices exempt certain
accounts, such as municipal
buildings, but only scattered, dated
written directives exist to justify this
practice. A reliable count of
unbilled metered accounts is
unavailable. Sporadic meter
replacement and meter reading
occurs on an as-needed basis.
The total annual water
consumption for all unbilled,
metered accounts is estimated
based upon approximating the
number of accounts and assigning
consumption from actively billed
accounts of same meter size.
Conditions
between
2 and 4
Dated written procedures permit
billing exemption for specific
accounts, such as municipal
properties, but are unclear
regarding certain other types of
accounts. Meter reading is given
low priority and is sporadic.
Consumption is quantified from
meter readings where available.
The total number of unbilled,
unmetered accounts must be
estimated along with consumption
volumes.
Conditions
between
4 and 6
Written policies regarding billing
exemptions exist but adherence in
practice is questionable. Metering
and meter reading for municipal
buildings is reliable but sporadic for
other unbilled metered accounts.
Periodic auditing of such accounts
is conducted. Water consumption
is quantified directly from meter
readings where available, but the
majority of the consumption is
estimated.
Conditions
between
6 and 8
Written policy identifies the types of
accounts granted a billing
exemption. Customer meter
management and meter reading
are considered secondary
priorities, but meter reading is
conducted at least annually to
obtain consumption volumes for
the annual water audit. High level
auditing of billing records ensures
that a reliable census of such
accounts exists.
Conditions
between
8 and 10
Clearly written policy identifies the
types of accounts given a billing
exemption, with emphasis on
keeping such accounts to a
minimum. Customer meter
management and meter reading
for these accounts is given proper
priority and is reliably conducted.
Regular auditing confirms this.
Total water consumption for these
accounts is taken from reliable
readings from accurate meters.
Improvements to attain higher
data grading for "Unbilled
metered Consumption"
component:
to qualify for 2:
Reassess the water utility's
policy allowing certain accounts
to be granted a billing
exemption. Draft an outline of a
new written policy for billing
exemptions, with clear
justification as to why any
accounts should be exempt
from billing, and with the
intention to keep the number of
such accounts to a minimum.
to maintain 10:
Reassess philosophy in allowing
any water uses to go "unbilled". It
is possible to meter and bill all
accounts, even if the fee charged
for water consumption is
discounted or waived. Metering
and billing all accounts ensures that
water consumption is tracked and
water waste from plumbing leaks is
detected and minimized.
Unbilled unmetered:
Extent of unbilled, unmetered
consumption is unknown due to
unclear policies and poor
recordkeeping. Total
consumption is quantified based
upon a purely subjective
estimate.
Clear extent of unbilled, unmetered
consumption is unknown, but a
number of events are randomly
documented each year, confirming
existence of such consumption, but
without sufficient documentation to
quantify an accurate estimate of
the annual volume consumed.
Conditions
between
2 and 4
Extent of unbilled, unmetered
consumption is partially known, and
procedures exist to document
certain events such as
miscellaneous fire hydrant uses.
Formulae is used to quantify the
consumption from such events
(time running x typical flowrate x
number of events).
Default value
of 1.25% of
system input
volume is
employed
Coherent policies exist for some
forms of unbilled, unmetered
consumption but others await
closer evaluation. Reasonable
recordkeeping for the managed
uses exists and allows for annual
volumes to be quantified by
inference, but unsupervised uses
are guesstimated.
Conditions
between
6 and 8
Clear policies and good
recordkeeping exist for some uses
(ex: unmetered fire connections
registering consumption), but other
uses (ex: miscellaneous uses of
fire hydrants) have limited
oversight. Total consumption is a
mix of well quantified use such as
from formulae (time x typical flow)
or temporary meters, and relatively
subjective estimates of less
regulated use.
Conditions
between
8 and 10
Clear policies exist to identify
permitted use of water in unbilled,
unmetered fashion, with the
intention of minimizing this type of
consumption. Good records
document each occurrence and
consumption is quantified via
formulae (time x typical flow) or use
of temporary meters.
Improvements to attain higher
data grading for "Unbilled
Unmetered Consumption"
component:
to qualify for 5:
Utilize accepted default value of
1.25% of system input volume
as an expedient means to gain
a reasonable quantification of
this use.
to qualify for 2:
Establish a policy regarding
what water uses should be
allowed as unbilled and
unmetered. Consider tracking a
small sample of one such use
(ex: fire hydrant flushings).
to qualify for 5:
Utilize accepted default value of
1.25% of system input volume as
expedient means to gain a
reasonable quantification of all
such use. This is particularly
appropriate for water utilities who
are in the early stages of the water
auditing process.
to qualify for
6 or greater:
Finalize
policy and
do field
checks.
Proceed if
top-down
audit exists
and/or a
great
volume of
such use is
suspected.
to maintain 10:
Continue to refine policy and
procedures with intention of
reducing the number of allowable
uses of water in unbilled and
unmetered fashion. Any uses that
can feasibly become billed and
metered should be converted
eventually.
Unauthorized consumption:
Extent of unauthorized
consumption is unknown due to
unclear policies and poor
recordkeeping. Total
unauthorized consumption is
guesstimated.
Unauthorized consumption is a
known occurrence, but its extent is
a mystery. There are no
requirements to document
observed events, but periodic field
reports capture some of these
occurrences. Total unauthorized
consumption is approximated from
this limited data.
conditions
between 2
and 4
Procedures exist to document
some unauthorized consumption
such as observed unauthorized fire
hydrant openings. Use formulae to
quantify this consumption (time
running x typical flowrate x number
of events).
Default value
of 0.25% of
system input
volume is
employed
Coherent policies exist for some
forms of unauthorized consumption
but others await closer evaluation.
Reasonable surveillance and
recordkeeping exist for
occurrences that fall under the
policy. Volumes quantified by
inference from these records.
Unsupervised uses are
guesstimated.
Conditions
between
6 and 8
Clear policies and good
recordkeeping exist for certain
events (ex: tampering with water
meters); other occurrences have
limited oversight. Total
consumption is a combination of
volumes from formulae (time x
typical flow) and subjective
estimates of unconfirmed
consumption.
Conditions
between
8 and 10
Clear policies exist to identify all
known unauthorized uses of water.
Staff and procedures exist to
provide enforcement of policies
and detect violations. Each
occurrence is quantified via
formulae (time x typical flow) or
similar methods.
to qualify for 4:
Review historic written directives and policy
documents allowing certain accounts to be billing-
exempt. Draft an outline of a written policy for
billing exemptions, identify criteria that grants an
exemption, with a goal of keeping this number of
accounts to a minimum.
to qualify for 6:
Draft a new written policy regarding billing
exemptions based upon consensus criteria
allowing this occurrence. Assign resources to
audit meter records and billing records to obtain
census of unbilled metered accounts.
to qualify for 8:
Communicate billing exemption policy throughout
the organization and implement procedures that
ensure proper account management. Conduct
inspections of accounts confirmed in unbilled
metered status and verify that accurate meters
exist and are scheduled for routine meter
readings.
to qualify for 10:
Ensure that meter management (meter accuracy
testing, meter replacement) and meter reading
activities are accorded the same priority as billed
accounts. Establish ongoing annual auditing
process to ensure that water consumption is
reliably collected and provided to the annual
water audit process.
APPARENT LOSSES
to qualify for 5:
Utilize accepted default value of 1.25% of system
input volume as an expedient means to gain a
reasonable quantification of this use.
to qualify for 4:
Evaluate the documentation of events that have
been observed. Meet with user groups (ex: for
fire hydrants - fire departments, contractors to
ascertain their need for water from fire hydrants).
to qualify for 8:
Assess water utility policy and procedures to
ensure that fire hydrant permits are issued for
use by persons outside of the utility. Create
written procedures for use and documentation of
fire hydrants by water utility personnel.
to qualify for 10:
Refine written procedures to ensure that all uses
of unbilled, unmetered water are overseen by a
structured permitting process managed by water
utility personnel. Reassess policy to determine if
some of these uses have value in being
converted to billed and/or metered status.
AWWA Water Loss Control Committee Grading Matrix 6

n/a 1 2 3 4 5 6 7 8 9 10
Grading
Improvements to attain higher
data grading for "Unauthorized
Consumption" component:
to qualify for 5:
Use accepted default of 0.25%
of system input volume.
to qualify for 2:
Review utility policy regarding
what water uses are considered
unauthorized, and consider
tracking a small sample of one
such occurrence (ex:
unauthorized fire hydrant
openings)
to qualify for 5:
Utilize accepted default value of
0.25% of system input volume as
expedient means to gain a
reasonable quantification of all
such use. This is particularly
appropriate for water utilities who
are in the early stages of the water
auditing process.
to qualify for
6 or greater:
Finalize
policy and
do field
checks.
Proceed if
top-down
audit exists
and/or a
great
volume of
such use is
suspected.
to maintain 10:
Continue to refine policy and
procedures to eliminate any
loopholes that allow or tacitly
encourage unauthorized
consumption. Continue to be
vigilant in documentation and
enforcement efforts.
Customer metering
inaccuracies:
select n/a only if the
entire customer
population is
unmetered. In such
a case the volume
entered must be
zero.
Customer meters exist, but with
unorganized paper records on
meters; no meter accuracy
testing or meter replacement
program. Workflow is driven
chaotically by customer
complaints with no proactive
management. Loss volume
due to aggregate meter
inaccuracy is guesstimated.
Poor recordkeeping and meter
oversight is recognized by water
utility management who has
allotted staff and funding resources
to organize improved
recordkeeping and start meter
accuracy testing. Existing paper
records gathered and organized to
provide cursory disposition of
meter population.
Conditions
between
2 and 4
Reliable recordkeeping exists;
meter information is improving as
meters are replaced. Meter
accuracy testing is conducted
annually for a small number of
meters. Limited number of oldest
meters replaced each year.
Inaccuracy volume is largely an
estimate, but refined based upon
limited testing data.
Conditions
between
4 and 6
A reliable electronic recordkeeping
system for meters exists.
Population includes a mix of new
high performing meters and dated
meters with suspect accuracy.
Routine, but limited, meter
accuracy testing and meter
replacement occur. Inaccuracy
volume is quantified using a mix of
reliable and less certain data.
Conditions
between
6 and 8
Ongoing meter replacement and
accuracy testing result in highly
accurate customer meter
population. Testing is conducted
on samples of meters at varying
lifespans to determine optimum
replacement time for various types
of meters.
Conditions
between
8 and 10
Good records of number, type and
size of customer meters; ongoing
meter replacement occurs.
Regular meter accuracy testing
gives reliable measure of
composite inaccuracy volume for
the system. New metering
technology is embraced to keep
overall accuracy improving.
Improvements to attain higher
data grading for "Customer
meter inaccuracy volume"
component:
If n/a is selected
because the
customer meter
population is
unmetered, consider
establishing a new
policy to meter the
customer population
and employ water
rates based upon
metered volumes.
to qualify for 2:
Gather available meter
purchase records. Conduct
testing on a small number of
meters believed to be the most
inaccurate. Review staffing
needs of metering group and
budget for necessary resources
to better organize meter
management.
to maintain 10:
Increase the number of meters
tested and replaced as justified by
meter accuracy test data.
Continually monitor development of
new technology in Advanced
Metering Infrastructure (AMI) to
grasp opportunities for greater
accuracy in metering and customer
consumption data.
Systematic Data Handling
Error:
Note: all water
utilities incur some
amount of this error.
Even in water
utilities with
unmetered
customer
populations and
fixed rate billing,
errors occur in
annual billing
tabulations. Enter a
positive value for the
volume and select a
grading.
Vague policy for permitting
(creating new customer
accounts) and billing. Billing
data maintained on paper
records which are in disarray.
No audits conducted to confirm
billing data handling efficiency.
Unknown number of customers
escape routine billing due to
lack of billing process oversight.
Policy for permitting and billing
exists but needs refinement. Billing
data maintained on paper records
or insufficiently capable electronic
database. Only periodic
unstructured auditing work
conducted to confirm billing data
handling efficiency. Volume of
unbilled water due to billing lapses
is a guess.
Conditions
between
2 and 4
Policy and procedures for
permitting and billing exist but
needs refinement. Computerized
billing system exists, but is dated or
lacks needed functionality.
Periodic, limited internal audits
conducted and confirm with
approximate accuracy the
consumption volumes lost to billing
lapses.
Conditions
between
4 and 6
Policy for permitting and billing is
adequate and reviewed
periodically. Computerized billing
system in use with basic reporting
available. Any effect of billing
adjustments on measured
consumption volumes is well
understood. Internal checks of
billing data error conducted
annually. Reasonably accurate
quantification of consumption
volume lost to billing lapses is
obtained.
Conditions
between
6 and 8
Permitting and billing policy
reviewed at least biannually.
Computerized billing system
includes an array of reports to
confirm billing data and system
functionality. Annual internal
checks conducted with periodic
third party audit. Accountability
checks flag billing lapses.
Consumption lost to billing lapses
is well quantified and reducing year-
by-year.
Conditions
between
8 and 10
Sound policy exists for permitting of
all customer billing accounts.
Robust computerized billing system
gives high functionality and
reporting capabilities. Assessment
of policy and data handling errors
conducted internally and audited by
third party annually, ensuring
consumption lost to billing lapses is
minimized and detected as it
occurs.
Improvements to attain higher
data grading for "Systematic
Data Handling Error volume"
component:
to qualify for 2:
Draft written policy for permitting
and billing. Investigate and
budget for computerized
customer billing system.
Conduct initial audit of billing
records by flow-charting the
basic business processes of the
customer account/billing
function.
to maintain 10:
Stay abreast of customer
information management
developments and innovations.
Monitor developments of Advanced
Metering Infrastructure (AMI) and
integrate technology to ensure that
customer endpoint information is
well-monitored and errors/lapses
are at an economic minimum.
Length of mains:
Poorly assembled and
maintained paper as-built
records of existing water main
installations makes accurate
determination of system pipe
length impossible. Length of
mains is guesstimated.
Paper records in poor condition (no
annual tracking of installations &
abandonments). Poor procedures
to ensure that new water mains
installed by developers are
accurately documented.
Conditions
between
2 and 4
Sound policy and procedures for
permitting and documenting new
water main installations, but gaps
in management result in a
uncertain degree of error in
tabulation of mains length.
Conditions
between
4 and 6
Sound policy and procedures exist
for permitting and commissioning
new water mains. Highly accurate
paper records with regular field
validation; or electronic records
and asset management system in
good condition. Includes system
backup.
Conditions
between
6 and 8
Sound policy and procedures exist
for permitting and commissioning
new water mains. Electronic
recordkeeping and asset
management system are used to
store and manage data.
Conditions
between
8 and 10
Sound policy exists for managing
water mains extensions and
replacements. Geographic
Information System (GIS) data and
asset management database
agree and random field validation
proves truth of databases.
to qualify for 8:
Formalize regular review of permitting and billing
practices. Enhance reporting capability of
computerized billing system. Formalize regular
auditing process to reveal scope of data handling
error.
to qualify for 10:
Close policy/procedure loopholes that allow
some customer accounts to go unbilled, or data
handling errors to exist. Ensure that internal and
third party audits are conducted annually.
to qualify for 4:
Implement a reliable record keeping system for
customer meter histories, preferably using
electronic methods typically linked to, or part of,
the Customer Billing System or Customer
Information System. Expand meter accuracy
testing to a larger group of meters.
to qualify for 6:
Standardize procedures for meter recordkeeping
with the electronic information system.
Accelerate meter accuracy testing and meter
replacements guided by testing results.
to qualify for 8:
Expand annual meter accuracy testing to
evaluate a statistically significant number of
meter makes/models. Expand meter
replacement program to replace statistically
significant number of poor performing meters
each year.
to qualify for 10:
Continue efforts to manage meter population with
reliable recordkeeping, meter testing and
replacement. Evaluate new meter types and
install one or more types in 5-10 customer
accounts each year in order to pilot improving
metering technology.
to qualify for 5:
Use accepted default of 0.25% of system input
volume
to qualify for 4:
Review utility policy regarding what water uses
are considered unauthorized, and consider
tracking a small sample of one such occurrence
(ex: unauthorized fire hydrant openings)
to quality for 8:
Assess water utility policies to ensure that all
known occurrences of unauthorized consumption
are outlawed, and that appropriate penalties are
prescribed. Create written procedures for use
and documentation of various occurrences of
unauthorized consumption as they are
uncovered.
to qualify for 10:
Refine written procedures and assign staff to
seek out likely occurrences of unauthorized
consumption. Explore new locking devices,
monitors and other technologies designed to
detect and thwart unauthorized consumption.
SYSTEM DATA
to qualify for 4:
Finalize written policy for permitting and billing.
Implement a computerized customer billing
system. Conduct initial audit of billing records as
part of this process.
to qualify for 6:
Refine permitting and billing procedures and
ensure consistency with the utility policy
regarding billing, and minimize opportunity for
missed billings. Upgrade or replace customer
billing system for needed functionality - ensure
that billing adjustments don't corrupt the value of
consumption volumes. Procedurize internal
annual audit process.
AWWA Water Loss Control Committee Grading Matrix 7

n/a 1 2 3 4 5 6 7 8 9 10
Grading
Improvements to attain higher
data grading for "Length of
Water Mains" component:
to qualify for 2:
Assign personnel to inventory
current as-built records and
compare with customer billing
system records and highway
plans. Assemble policy
documents regarding permitting
and documentation of water
main installations by the utility
and building developers; identify
gaps in procedure that result in
poor documentation.
to maintain 10:
Continue with standardization and
random field validation to improve
knowledge of system.
Number of active AND inactive
service connections:
Vague permitting (of new
service connections) policy and
poor paper recordkeeping of
customer connections/billings
result in suspect determination
of the number of service
connections, which may be 10-
15% in error from actual count.
General permitting policy exists but
paper records, procedural gaps,
and weak oversight result in
questionable total for number of
connections, which may vary 5-
10% of actual count.
Conditions
between
2 and 4
Permitting policy and procedures
exist, but with some gaps in
performance and oversight.
Computerized information
management system is being
brought online to replace dated
paper recordkeeping system.
Reasonably accurate tracking of
service connection installations &
abandonments; but count can be
up to 5% in error from actual total.
Conditions
between
4 and 6
Permitting policy and procedures
are adequate and reviewed
periodically. Computerized
information management system is
in use with annual installations &
abandonments totaled. Very
limited field verifications and audits.
Error in count of number of service
connections is believed to be no
more that 3%.
Conditions
between
6 and 8
Permitting policy and procedures
reviewed at least biannually. Well-
managed computerized
information management system
and routine, periodic field checks
and internal system audits allows
counts of connections that is no
more than 2% in error.
Conditions
between
8 and 10
Sound permitting policy and well
managed and audited procedures
ensure reliable management of
service connection population.
Computerized information
management system and
Geographic Information System
(GIS) information agree; field
validation proves truth of
databases. Count of connections
believed to be in error by less than
1%.
Improvements to attain higher
data grading for "Number of
Active and Inactive customer
service connections"
component:
to qualify for 2:
Draft new policy and
procedures for permitting and
billing. Research and collect
paper records of installations &
abandonments for several
years prior to audit year.
to maintain 10:
Continue with standardization and
random field validation to improve
knowledge of system.
Vague policy exists to define the
delineation of water utility
ownership and customer
ownership of the service
connection piping. Curbstops
are perceived as the breakpoint
but these have not been well-
maintained or documented.
Most are buried or obscured.
Their location varies widely from
site-to-site, and estimating this
distance is arbitrary due to the
unknown location of many
curbstops.
Policy requires that the curbstop
serves as the delineation point
between water utility ownership and
customer ownership of the service
connection piping. The piping from
the water main to the curbstop is
the property of the water utility; and
the piping from the curbstop to the
customer building is owned by the
customer. Curbstop locations are
not well documented and the
average distance is based upon a
limited number of locations
measured in the field.
Conditions
between
2 and 4
Good policy requires that the
curbstop serves as the delineation
point between water utility
ownership and customer ownership
of the service connection piping.
Curbstops are generally installed
as needed and are reasonably
documented. Their location varies
widely from site-to-site, and an
estimate of this distance is
hindered by the availability of paper
records.
Conditions
between
4 and 6
Clear policy exists to define
utility/customer responsibility for
service connection piping.
Accurate, well-maintained paper or
basic electronic recordkeeping
system exists. Periodic field
checks confirm piping lengths for a
sample of customer properties.
Conditions
between
6 and 8
Clearly worded policy standardizes
the location of curbstops and
meters, which are inspected upon
installation. Accurate and well
maintained electronic records exist
with periodic field checks to confirm
locations of service lines, curbstops
and customer meter pits. An
accurate number of customer
properties from the customer billing
system allows for reliable
averaging of this length.
Conditions
between
8 and 10
Improvements to attain higher
data grading for "Average
Length of Customer Service
Line" component:
to qualify for 2:
Research and collect paper
records of service line
installations. Inspect several
sites in the field using pipe
locators to locate curbstops.
Obtain the length of this small
sample of connections in this
manner.
to maintain 10:
Continue with standardization and
random field validation to improve
knowledge of system.
Average length of customer
service line:
Note: if customer
water meters are
located outside of
the customer
building next to the
curbstop or
boundary separating
utility/customer
responsibility, follow
the grading
description for
10(a). Also see the
Service Connection
Diagram worksheet.
to qualify for 4:
Formalize and communicate policy delineating
utility/customer responsibilities for service
connection piping. Assess accuracy of paper
records by field inspection of a small sample of
service connections using pipe locators as
needed. Research the potential migration to a
computerized information management system
to store service connection data.
to qualify for 6:
Establish coherent procedures to ensure that
policy for curbstop, meter installation and
documentation is followed. Gain consensus
within the water utility for the establishment of a
computerized information management system.
to qualify for 8:
Implement an electronic means of
recordkeeping, typically via a customer
information system or customer billing system.
Standardize the process to conduct field checks
of limited number of locations.
to qualify for 10:
Link customer information management system
and Geographic Information System (GIS),
standardize process for field verification of data.
Either of two conditions can be met
to obtain a grading of 10:
a) The customer water meter is
located outside of the customer
building adjacent to the curbstop or
boundary separating
utility/customer responsibility for the
service connection piping. In this
case enter a value of zero in the
Reporting Worksheet with a
grading of 10.
b). Customer water meters are
located inside customer buildings,
or the properties are unmetered.
In either case the distance is highly
reliable since data is drawn from a
Geographic Information System
(GIS) and confirmed by routine
field checks.
Gradings 1-9 apply if customer properties are unmetered, if customer meters exist and are located inside the customer building premises, or if the water utility owns and is responsible for the entire service connection
piping from the water main to the customer building. In any of these cases the average distance between the curbstop or boundary separating utility/customer responsibility for service connection piping, and the typical first point
of use (ex: faucet) or the customer meter must be quantified. Gradings of 1-9 are used to grade the validity of the means to quantify this value.
(See the "Service Connection Diagram" worksheet)
to qualify for 4:
Refine policy and procedures for permitting and
billing. Research computerized recordkeeping
system (Customer Information System or
Customer Billing System) to improve
documentation format for service connections.
to qualify for 6:
Refine procedures to ensure consistency with
permitting policy to establish new service
connections or decommission existing
connections. Improve process to include all
totals for at least five years prior to audit year.
to qualify for 8:
Formalize regular review of permitting policy and
procedures. Launch random field checks of
limited number of locations. Develop reports and
auditing mechanisms for computerized
information management system.
to qualify for 10:
Close any procedural loopholes that allow
installations to go undocumented. Link
computerized information management system
with Geographic Information System (GIS) and
formalize field inspection and information system
auditing processes. Documentation of new or
decommissioned service connections encounters
several levels of checks and balances.
to qualify for 4:
Complete inventory of paper records of water
main installations & abandonments for a number
of years prior to audit year. Review policy and
procedures for commissioning and documenting
new water main installation and abandonments.
to qualify for 6:
Finalize updates/improvements to policy and
procedures for permitting/commissioning new
main installations. Confirm inventory of records
for five years prior to audit year; correct any
errors or omissions.
to qualify for 8:
Launch random field checks of limited number of
locations. Convert to electronic databases with
backup as justified.
to qualify for 10:
Link Geographic Information System (GIS) and
asset management databases, conduct field
verification of data.
AWWA Water Loss Control Committee Grading Matrix 8

n/a 1 2 3 4 5 6 7 8 9 10
Grading
Average operating pressure:
Available records are poorly
assembled and maintained
paper records of supply pump
characteristics and water
distribution system operating
conditions. Average pressure is
guesstimated based upon this
information and ground
elevations from crude
topographical maps. Widely
varying distribution system
pressures due to undulating
terrain, high system head loss
and weak/erratic pressure
controls further compromise the
validity of the average pressure
calculation.
Limited telemetry monitoring of
scattered sites provides some
static pressure data, which is
recorded in handwritten logbooks.
Pressure data is gathered at
individual sites only when low
pressure complaints arise.
Average pressure is determined by
averaging relatively crude data,
and is affected by significant
variation in ground elevations,
system head loss and gaps in
pressure controls in the distribution
system.
Conditions
between
2 and 4
Effective pressure controls
separate different pressure zones;
moderate pressure variation
across the system, occasional
open boundary valves are
discovered that breech pressure
zones. Basic telemetry monitoring
of the distribution system logs
pressure data electronically.
Pressure data gathered by gauges
or dataloggers at fire hydrants or
buildings when low pressure
complaints arise, and during fire
flow tests and system flushing.
Reliable topographical data exists.
Average pressure is calculated
using this mix of data.
Conditions
between
4 and 6
Reliable pressure controls
separate distinct pressure zones;
only very occasional open
boundary valves are encountered
that breech pressure zones. Well-
covered telemetry monitoring of the
distribution system logs extensive
pressure data electronically.
Pressure gathered by
gauges/dataloggers at fire hydrants
and buildings when low pressure
complaints arise, and during fire
flow tests and system flushing.
Average pressure is determined by
using this mix of reliable data.
Conditions
between
6 and 8
Well-managed, discrete pressure
zones exist with generally
predictable pressure fluctuations.
A current full-scale SCADA System
exists to monitor the water
distribution system and collect
data, including real time pressure
readings at representative sites
across the system. The average
system pressure is determined
from reliable SCADA System data.
Conditions
between
8 and 10
Well-managed pressure
districts/zones, SCADA System
and hydraulic model exist to give
very precise pressure data across
the water distribution system.
Average system pressure is
reliably calculated from extensive,
reliable, and cross-checked data.
AWWA Water Loss Control Committee Grading Matrix 9

n/a 1 2 3 4 5 6 7 8 9 10
Grading
Improvements to attain higher
data grading for "Average
Operating Pressure"
component:
to qualify for 2:
Employ pressure gauging
and/or datalogging equipment
to obtain pressure
measurements from fire
hydrants. Locate accurate
topographical maps of service
area in order to confirm ground
elevations. Research pump
data sheets to find pump
pressure/flow characteristics
to maintain 10:
Continue to refine the hydraulic
model of the distribution system
and consider linking it with SCADA
System for real-time pressure data
calibration, and averaging.
Total annual cost of
operating water system:
Incomplete paper records and
lack of documentation on many
operating functions making
calculation of water system
operating costs a pure
guesstimate
Reasonably maintained, but
incomplete, paper or electronic
accounting provides data to
estimate the major portion of water
system operating costs.
Conditions
between
2 and 4
Electronic, industry-standard cost
accounting system in place. Gaps
in data known to exist, periodic
internal reviews conducted but not
a structured audit.
Conditions
between
4 and 6
Reliable electronic, industry-
standard cost accounting system in
place, with all pertinent water
system operating costs tracked.
Data audited periodically by utility
personnel, not a Certified Public
Accountant (CPA).
Conditions
between
6 and 8
Reliable electronic, industry-
standard cost accounting system in
place, with all pertinent water
system operating costs tracked.
Data audited at least annually by
utility personnel, and periodically by
third-party CPA.
Conditions
between
8 and 10
Reliable electronic, industry-
standard cost accounting system in
place, with all pertinent water
system operating costs tracked.
Data audited annually by utility
personnel and by third-party CPA.
Improvements to attain higher
data grading for "Total Annual
Cost of Operating the Water
System" component:
to qualify for 2:
Gather available records,
institute new procedures to
regularly collect and audit basic
cost data of most important
operations functions.
to maintain 10:
Maintain program, stay abreast of
expenses subject to erratic cost
changes and budget/track costs
proactively
Customer retail unit cost
(applied to Apparent Losses):
Antiquated, cumbersome water
rate structure is use, with
periodic historic amendments
that were poorly documented
and implemented; resulting in
classes of customers being
billed inconsistent charges. The
actual composite billing rate
likely differs significantly from
the published water rate
structure, but a lack of auditing
leaves the degree of error
indeterminate.
Dated, cumbersome water rate
structure, not always employed
consistently in actual billing
operations. The actual composite
billing rate is known to differ from
the published water rate structure,
and a reasonably accurate
estimate of the degree of error is
determined, allowing a composite
billing rate to be quantified.
Conditions
between
2 and 4
Straight-forward water rate
structure in use, but not updated in
several years. Billing operations
reliably employ the rate structure.
The composite billing rate is
derived from a single customer
class such as residential customer
accounts, neglecting the effect of
different rates from varying
customer classes.
Customer
population
unmetered.
Fixed fee
charged;
single
composite
number
derived from
multiple
customer
classes.
Clearly written, up-to-date water
rate structure is in force and is
applied reliably in billing operations.
Composite customer rate is
determined using a weighted
average residential rate using
volumes of water in each rate
block.
Conditions
between
6 and 8
Effective water rate structure is in
force and is applied reliably in
billing operations. Composite
customer rate is determined using
a weighted average composite
consumption rate, including
residential, commercial, industrial
and any other customer classes
within the water rate structure.
Conditions
between
8 and 10
Third party reviewed weighted
average composite consumption
rate (includes residential,
commercial, industrial, etc.)
Improvements to attain higher
data grading for "Customer
Retail Unit Cost" component:
to qualify for 2:
Formalize the process to
implement water rates, including
a secure documentation
procedure. Create a current,
formal water rate document and
gain approval from all
stakeholders.
to qualify for 6:
Evaluate volume of water used in
each usage block by residential
users. Multiply volumes by full rate
structure.
Meter
customers
and charge
rates based
upon water
volumes
to maintain 10:
Keep water rate structure current in
addressing the water utility's
revenue needs. Update the
calculation of the customer unit
rate as new rate components,
customer classes, or other
components are modified.
Variable production cost
(applied to Real Losses):
Note: if the water
utility
purchases/imports
its entire water
supply, then enter
the unit purchase
cost of the bulk
water supply in the
Reporting
Worksheet with a
grading of 10
Incomplete paper records and
lack of documentation on
primary operating functions
(electric power and treatment
costs most importantly) makes
calculation of variable
production costs a pure
guesstimate
Reasonably maintained, but
incomplete, paper or electronic
accounting provides data to roughly
estimate the basic operations costs
(pumping power costs and
treatment costs) and calculate a
unit variable production cost.
Conditions
between
2 and 4
Electronic, industry-standard cost
accounting system in place.
Electric power and treatment costs
are reliably tracked and allow
accurate calculation of unit variable
production costs based on these
two inputs only. All costs are
audited internally on a periodic
basis.
Conditions
between
4 and 6
Reliable electronic, industry-
standard cost accounting system in
place, with all pertinent water
system operating costs tracked.
Pertinent additional costs beyond
power and treatment (ex: liability,
residuals management, etc.) are
included in the unit variable
production cost. Data audited at
least annually by utility personnel.
Conditions
between
6 and 8
Reliable electronic, industry-
standard cost accounting system in
place, with all pertinent variable
production costs tracked. Data
audited at least annually by utility
personnel, and periodically by third-
party.
Conditions
between
8 and 10
Either of two conditions can be met
to obtain a grading of 10:
1) Third party CPA audit of all
primary and secondary cost
components on an annual basis.
or:
2) Water supply is entirely
purchased as bulk imported water,
and unit purchase cost serves as
the variable production cost.
Improvements to attain higher
data grading for "Variable
Production Cost" component:
to qualify for 2:
Gather available records,
institute new procedures to
regularly collect and audit basic
cost data and most important
operations functions.
to maintain 10:
Maintain program, stay abreast of
expenses subject to erratic cost
changes and budget/track costs
proactively
COST DATA
to qualify for 4:
Implement an electronic cost accounting system,
structured according to accounting standards for
water utilities
to qualify for 4:
Formalize a procedure to use pressure
gauging/datalogging equipment to gather
pressure data during various system events such
as low pressure complaints, or operational
testing. Gather pump pressure and flow data at
different flow regimes. Identify faulty pressure
controls (pressure reducing valves, altitude
valves, partially open boundary valves) and plan
to properly configure pressure zones. Make all
pressure data from these efforts available to
generate system-wide average pressure.
to qualify for 6:
Expand the use of pressure gauging/datalogging
equipment to gather scattered pressure data at a
representative set of sites, based upon pressure
zones or areas. Utilize pump pressure and flow
data to determine supply head entering each
pressure zone or district. Correct any faulty
pressure controls (pressure reducing valves,
altitude valves, partially open boundary valves) to
ensure properly configured pressure zones. Use
expanded pressure dataset from these activities
to generate system-wide average pressure.
to qualify for 8:
Install a Supervisory Control and Data Acquisition
(SCADA) System to monitor system parameters
and control operations. Set regular calibration
schedule for instrumentation to insure data
accuracy. Obtain accurate topographical data
and utilize pressure data gathered from field
surveys to provide extensive, reliable data for
pressure averaging.
to qualify for 10:
Obtain average pressure data from hydraulic
model of the distribution system that has been
calibrated via field measurements in the water
distribution system and confirmed in
comparisons with SCADA System data.
to qualify for 6:
Establish process for periodic internal audit of
water system operating costs; identify cost data
gaps and institute procedures for tracking these
outstanding costs.
to qualify for 8:
Standardize the process to conduct routine
financial audit on an annual basis.
to qualify for 10:
Standardize the process to conduct a third-party
financial audit by a CPA on an annual basis.
to qualify for 4:
Implement an electronic cost accounting system,
structured according to accounting standards for
water utilities
to qualify for 6:
Formalize process for regular internal audits of
production costs. Assess whether additional
costs (liability, residuals management, etc.)
should be included to calculate a more accurate
variable production cost.
to qualify for 8:
Formalize the accounting process to include
primary cost components (power, treatment) as
well as secondary components (liability, residuals
management, etc.) Conduct periodic third-party
audits.
to qualify for 10:
Standardize the process to conduct a third-party
financial audit by a CPA on an annual basis.
to qualify for 4:
Review the water rate structure and
update/formalize as needed. Assess billing
operations to ensure that actual billing operations
incorporate the established water rate structure.
to qualify for 8:
Evaluate volume of water used in each usage
block by all classifications of users. Multiply
volumes by full rate structure.
to qualify for 10:
Conduct a periodic third-party audit of water used
in each usage block by all classifications of
users. Multiply volumes by full rate structure.
AWWA Water Loss Control Committee Grading Matrix 10

AWWA WLCC Free Water Audit Software: Customer Serv ice Line Diagrams
Copyright © 2010, American Water Works Association. All Rights Reserved. WAS v4.2Back to Instructions
Average Length of Customer Service Line
The three figures shown on this worksheet display the assignment of the Average Length of Customer Service Line, Lp, for the three most common piping configurations.
Figure 1 shows the configuration of the water meter outside of the customer building next to the curbstop valve. In this configuration Lp = 0 since the distance between the curbstop and the customer metering point is essentially zero.
Figure 2 shows the configuration of the customer water meter located inside the customer building, where Lp is the distance from the curbstop to the water meter.
Figure 3 shows the configuration of an unmetered customer building , where Lp is the distance from the curbstop to the first point of customer water consumption, or, more simply, the building line.
In any water system the Lp will vary notably in a community of different structures, therefore the average Lp value is used and this should be approximated or calculated if a sample of service line measurements has been gathered.
Return to Reporting Worksheet
Figure 1
Figure 2
Figure 3
Click for more information
AWWA Water Loss Control Committee Service Connection Diagram 11

Item Name
Apparent Losses
AUTHORIZED CONSUMPTION
Average length of customer service line
Average operating pressure
Billed Authorized Consumption
Billed metered consumption
Billed unmetered consumption
Connection density
= billed metered + billed unmetered + unbilled mete red + unbilled unmetered
The volume of metered and/or unmetered water taken by registered customers, the water supplier and others who are implicitly or explicitl y authorized to do so by the water supplier, for residential, commercial and industria l purposes. This does NOT include water sold to neighboring utilities (water exported ).Authorized consumption may include items such as fi re fighting and training, flushing of mains and sewers, street cleaning, watering of muni cipal gardens, public fountains, frost protection, building water, etc. These may be bill ed or unbilled, metered or unmetered.
AWWA WLCC Free Water Audit Software: Definitions
Description
= unauthorized consumption + meter under-registrati on + data handling errors
Includes all types of inaccuracies associated with customer metering as well as data handling errors (meter reading and billing), plus u nauthorized consumption (theft or illegal use).NOTE: Over-registration of customer meters, leads t o under-estimation of Real Losses. Under-registration of customer meters, leads to ove r-estimation of Real Losses.
All consumption that is billed and authorized by th e utility. This may include both metered and unmetered consumption. See "Authorized Consumption" for more information.
All billed consumption which is calculated based on estimates or norms but is not metered. This might be a very small component in fu lly metered systems (for example billing based on estimates for the period a custome r meter is out of order) but can be the key consumption component in systems without un iversal metering. It does NOT include water sold to neighboring utilities (water exported ) which is unmetered but billed.
All metered consumption which is billed. This incl udes all groups of customers such as domestic, commercial, industrial or institutional. It does NOT include water sold to neighboring utilities (water exported) which is met ered and billed. The metered consumption data can be taken directly from billing records for the water audit period. The accuracy of yearly metered consumption data can be refined by including an adjustment to account for customer meter reading lagtime, howe ver additional analysis is necessary to determine the adjustment value, which may or may not be significant.
=number of connections / length of mains
The average pressure may be approximated when compi ling the preliminary water audit. Once routine water auditing has been established, a more accurate assessment of average pressure should be pursued. If the water utility i nfrastructure is recorded in a Geographical Information System (GIS) the average p ressure at many locations in the distribution system can be readily obtained. If a GIS does not exist, a weighted average of pressure data can be calculated from water press ure measured at various fire hydrants scattered across the water distribution system.
Find
Back to InstructionsCopyright © 2010, American Water Works Association. All Rights Reserved. WAS v4.2
Find
Find
Find
Find
Find
Click to see Service Connection Diagram
This is entered for unmetered services and in cold or other areas where meters are installed inside homes and buildings. It is the le ngth of customer service line either between the utility's service connection (often at the curbstop) and the meter, or to the building line (first point of customer consumpt ion) if customers are unmetered. Note that the length of service connection between the main and customer service line is owned by the utility and its length and potential l eakage is accounted for in the UARL formula by the number of service connections.
What role does the "Average Length of Customer Serv ice Line" parameter serve in the Water Audit?In many water distribution systems the water utilit y has maintenance responsibility for a portion of the customer service piping from its c onnection point at the water main to the curbstop valve located midway to the customer b uilding. The customer is responsible to maintain the customer service piping from the cu rbstop to the building premises. When leaks arise on customer service piping, water utilities respond faster to repair leaks than customers when the leak is on piping und er their responsibility. Leak durations are longer on the customer-maintained pip ing than the utility-maintained piping. The total length of pipe maintained by cust omers is one of the components of the Unavoidable Annual Real Loss (UARL) equation and is determined by multiplying the average length of customer maintained pipe, Lp by t he number of customer service connections. Therefore this parameter is important to the calculation of the UARL and the Infrastructure leakage Index (ILI).
AWWA Water Loss Control Committee Definitions 12

Item Name Description
Customer metering inaccuracies
Customer retail unit cost
Infrastructure Leakage Index (ILI)
Length of mains
Master meter error adjustment
NON-REVENUE WATER
Number of active AND inactive service connections
Real Losses
Revenue Water
Systematic data handling errors
Total annual cost of operating the water system
These costs include those for operations, maintenan ce and any annually incurred costs for long-term upkeep of the system, such as repayment o f capital bonds for infrastructure expansion or improvement. Typical costs include em ployee salaries and benefits, materials, equipment, insurance, fees, administrati ve costs and all other costs that exist to sustain the drinking water supply. These costs should not include any costs to operate wastewater, biosolids or other systems outs ide of drinking water.
= Apparent Losses + Real Losses + Unbilled Metered + Unbilled UnmeteredWater which does not provide any revenue to the uti lity
Physical water losses from the pressurized system a nd the utility’s storage tanks, up to the point of customer consumption. In metered syste ms this is the customer meter, in unmetered situations this is the first point of con sumption (stop tap/tap) within the property.The annual volume lost through all types of leaks, breaks and overflows depends on frequencies, flow rates, and average duration of in dividual leaks, breaks and overflows.
The Customer Retail Unit Cost represents the charge that customers pay for water service. This unit cost is applied to the components of appa rent loss, since these losses represent water reaching customers but not (fully) paid for. It is important to compile these costs per the same unit cost basis as the vol ume measure included in the water audit. For example, if all water volumes are measu red in million gallons, then the unit cost should be dollars per million gallon ($/mil ga l). The software allows the user to select the units that are charged to customers (eit her $/1,000 gallons, $/hundred cubic feet or $/1,000 litres) and automatically converts these units to the units that appear in the "WATER SUPPLIED" box. Since most water util ities have a rate structure that includes a variety of different costs based upon cl ass of customer, a weighted average of individual costs and number of customer accounts in each class can be calculated to determine a single composite cost that should be en tered into this cell. Finally, the weighted average cost should also include additiona l charges for sewer, stormwater or biosolids processing, if these charges are based upon the volume of potable water consumed.
Apparent water losses caused by the collective unde r-registration of customer water meters. Many customer water meters will wear as lar ge cumulative volumes of water are passed through them over time. This causes the met ers to under-register. The auditor has two options for entering data for this componen t of the audit. The auditor can enter a percentage under-registration (typically an estim ated value), this will apply the selected percentage to the two categories of metere d consumption to determine the volume of water not recorded due to customer meter inaccur acy. Alternatively, if the auditor has substantial data from meter testing to arrive at th eir own volumes of such losses, this volume may be entered directly. Note that a value o f zero will be accepted but an alert will appear asking if the customer population is un metered. Since all metered systems have some degree of inaccuracy, then a positive val ue should be entered. A value of zero in this component is valid only if the water utilit y does not meter its customer population.
Apparent water losses caused by systematic data han dling errors in the meter reading and billing system.
Length of all pipelines (except service connections ) in the system starting from the point of system input metering (for example at the outlet of the treatment plant). It is also recommended to include in this measure the tot al length of fire hydrant lead pipe. Hydrant lead pipe is the pipe branching from the wa ter main to the fire hydrant. Fire hydrant leads are typically of a sufficiently large size that is more representative of a pipeline than a service connection. The average le ngth of hydrant leads across the entire system can be assumed if not known, and mult iplied by the number of fire hydrants in the system, which can also be assumed if not kno wn. This value can then be added to the total pipeline length. Total length of mains c an therefore be calculated as:
Length of Mains, miles = (total pipeline length, mi les) + [ {(average fire hydrant lead length, ft) x (number of fire hydrants)} / 5,280 ft /mile ] orLength of Mains, kilometres = (total pipeline lengt h, kilometres) + [ {(average fire hydrant lead length, metres) x (number of fire hydr ants)} / 1,000 metres/kilometre ]
Water which is charged to customers to provide reve nue to the utility.
The ratio of the Current Annual Real Losses (Real L osses) to the Unavoidable Annual Real Losses (UARL). The ILI is a highly effective perfo rmance indicator for comparing (benchmarking) the performance of utilities in oper ational management of real losses.
Number of service connections, main to curb stop. P lease note that this includes the actual number of distinct piping connections includ ing fire connections whether active or inactive. This may differ substantially from the nu mber of Customers (or number of accounts)
An estimate or measure of the degree of any inaccur acy that exists in the master meters measuring the Volume from own sources. Please also indicate if this adjustment is because the master meters under-registered (did not capture all the flow) or over-registered (overstated the actual flow). All systems encounter some degree of error in their Master Meter data. Please enter a positive value.
Find
Find
Find
Find
Find
Find
Find
Find
Find
Find
AWWA Water Loss Control Committee Definitions 13
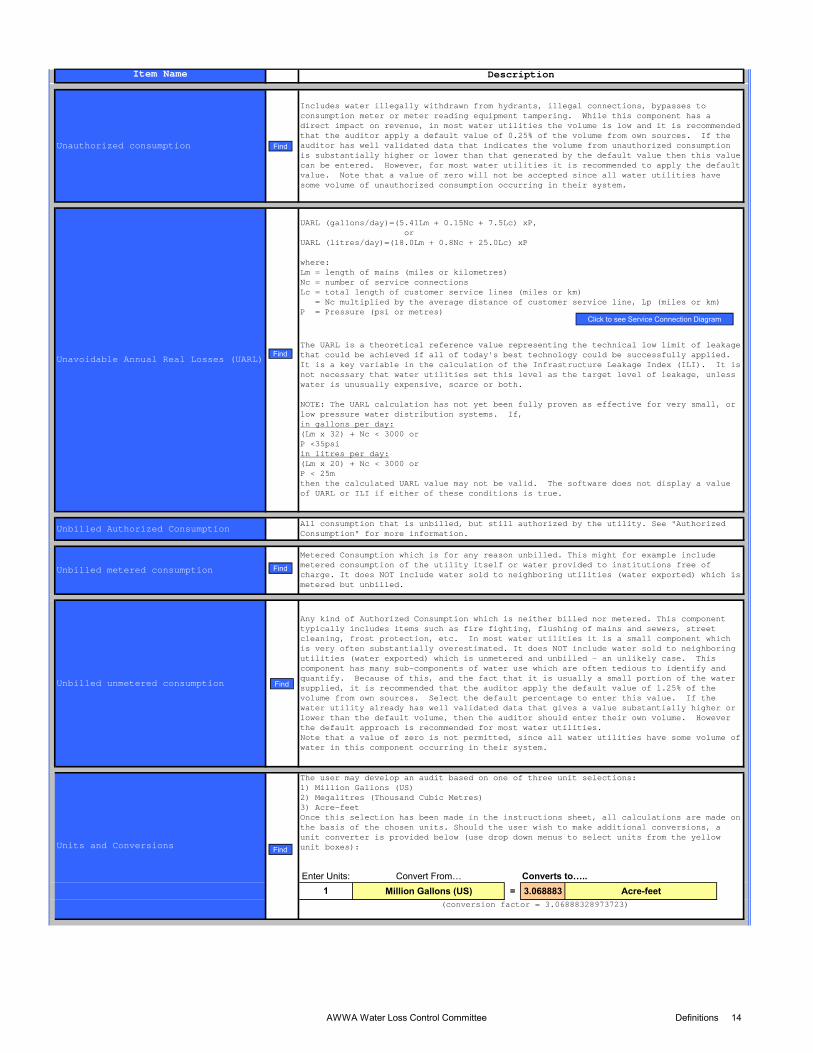
Item Name Description
Unauthorized consumption
Unbilled Authorized Consumption
Unbilled metered consumption
Unbilled unmetered consumption
Convert FromL
Million Gallons (US) = 3.068883 Acre-feet1
UARL (gallons/day)=(5.41Lm + 0.15Nc + 7.5Lc) xP, orUARL (litres/day)=(18.0Lm + 0.8Nc + 25.0Lc) xP
where:Lm = length of mains (miles or kilometres) Nc = number of service connections Lc = total length of customer service lines (miles or km) = Nc multiplied by the average distance of custo mer service line, Lp (miles or km)P = Pressure (psi or metres)
Includes water illegally withdrawn from hydrants, i llegal connections, bypasses to consumption meter or meter reading equipment tamper ing. While this component has a direct impact on revenue, in most water utilities t he volume is low and it is recommended that the auditor apply a default value of 0.25% of the volume from own sources. If the auditor has well validated data that indicates the volume from unauthorized consumption is substantially higher or lower than that generate d by the default value then this value can be entered. However, for most water utilities it is recommended to apply the default value. Note that a value of zero will not be accep ted since all water utilities have some volume of unauthorized consumption occurring i n their system.
Any kind of Authorized Consumption which is neither billed nor metered. This component typically includes items such as fire fighting, flu shing of mains and sewers, street cleaning, frost protection, etc. In most water uti lities it is a small component which is very often substantially overestimated. It does NOT include water sold to neighboring utilities (water exported) which is unmetered and u nbilled – an unlikely case. This component has many sub-components of water use whic h are often tedious to identify and quantify. Because of this, and the fact that it is usually a small portion of the water supplied, it is recommended that the auditor apply the default value of 1.25% of the volume from own sources. Select the default percen tage to enter this value. If the water utility already has well validated data that gives a value substantially higher or lower than the default volume, then the auditor sho uld enter their own volume. However the default approach is recommended for most water utilities. Note that a value of zero is not permitted, since a ll water utilities have some volume of water in this component occurring in their system.
Metered Consumption which is for any reason unbille d. This might for example include metered consumption of the utility itself or water provided to institutions free of charge. It does NOT include water sold to neighbori ng utilities (water exported) which is metered but unbilled.
Enter Units:
The user may develop an audit based on one of three unit selections: 1) Million Gallons (US)2) Megalitres (Thousand Cubic Metres)3) Acre-feetOnce this selection has been made in the instructio ns sheet, all calculations are made on the basis of the chosen units. Should the user wish to make additional conversions, a unit converter is provided below (use drop down men us to select units from the yellow unit boxes):
(conversion factor = 3.06888328973723)
Units and Conversions
Converts to=..
The UARL is a theoretical reference value represent ing the technical low limit of leakage that could be achieved if all of today's best techn ology could be successfully applied. It is a key variable in the calculation of the Infr astructure Leakage Index (ILI). It is not necessary that water utilities set this level a s the target level of leakage, unless water is unusually expensive, scarce or both.
NOTE: The UARL calculation has not yet been fully p roven as effective for very small, or low pressure water distribution systems. If,in gallons per day:(Lm x 32) + Nc < 3000 orP <35psiin litres per day:(Lm x 20) + Nc < 3000 orP < 25mthen the calculated UARL value may not be valid. T he software does not display a value of UARL or ILI if either of these conditions is tru e.
All consumption that is unbilled, but still authori zed by the utility. See "Authorized Consumption" for more information.
Unavoidable Annual Real Losses (UARL)
Find
Find
Find
Find
Find
Click to see Service Connection Diagram
AWWA Water Loss Control Committee Definitions 14

Item Name Description
Use of Option Buttons
Variable production cost (applied to Real Losses)
Volume from own sources
Water exported
Water imported
WATER LOSSES
Bulk water purchased to become part of the water su pplied. Typically this is water purchased from a neighboring water utility or regio nal water authority. Be sure to account for any import meter inaccuracy in reportin g this volume
= apparent losses + real losses
The difference between System Input and Authorized Consumption. Water losses can be considered as a total volume for the whole system, or for partial systems such as transmission or distribution systems, or individual zones. Water Losses consist of Real Losses and Apparent Losses.
Bulk water sold and conveyed out of the water distr ibution system. Typically this is water sold to a neighboring water utility. Be sure to account for any export meter inaccuracy in reporting this volume
The volume of treated water input to system from ow n production facilities
The cost to produce and supply the next unit of wat er. (E.g., $/million gallons) This cost is determined by calculating the summed unit c osts for ground and surface water treatment and all power used for pumping from the s ource to the customer. It should also include the unit cost of bulk water purchased as an import if applicable.
Find
Find
Find
Find
Find
To use the percent value choose this button
To enter a value choose this button and enter the value in the cell to the right
NOTE: For unbilled unmetered consumption and unauthorized consumption, a recommended default value can be applied by selecting the Perce nt option. The default values are based on fixed percentages of water supplied and ar e recommended for use in this audit unless the auditor has well validated data for thei r system. Default values are shown by purple cells, as shown in the example above.
If a default value is selected, the user does not n eed to grade the item; a grading value of 3 is automatically applied (however, this grade will not be displayed).
Find
AWWA Water Loss Control Committee Definitions 15

Functional Focus
Area
Audit Data Collection
Short-term loss control
Long-term loss control
Target-setting
Benchmarking
Preliminary Comparisons - can
begin to rely upon the
Infrastructure Leakage Index
(ILI) for performance
comparisons for real losses (see
below table)
Performance Benchmarking - ILI
is meaningful in comparing real
loss standing
Identify Best Practices/ Best in
class - the ILI is very reliable as
a real loss performance indicator
for best in class service
For validity scores of 50 or below, the shaded blocks should not be focus areas until better data validity is achieved.
Water Audit Data Validity Level / Score
Level I (0-25)
Launch auditing and loss control
team; address production
metering deficiencies
Research information on leak
detection programs. Begin
flowcharting analysis of
customer billing system
Level II (26-50) Level V (91-100)
Analyze business process for
customer metering and billing
functions and water supply
operations. Identify data gaps.
Stay abreast of improvements in
metering, meter reading, billing,
leakage management and
infrastructure rehabilitation
Evaluate and refine loss control
goals on a yearly basis
Begin to assess long-term
needs requiring large
expenditure: customer meter
replacement, water main
replacement program, new
customer billing system or
Automatic Meter Reading
(AMR) system.
Begin to assemble economic
business case for long-term
needs based upon improved
data becoming available through
the water audit process.
Conduct detailed planning,
budgeting and launch of
comprehensive improvements
for metering, billing or
infrastructure management
Continue incremental
improvements in short-term and
long-term loss control
interventions
Establish long-term apparent
and real loss reduction goals
(+10 year horizon)
Establish mid-range (5 year
horizon) apparent and real loss
reduction goals
AWWA WLCC Free Water Audit Software: Determining W ater Loss Standing
Conduct loss assessment
investigations on a sample
portion of the system: customer
meter testing, leak survey,
unauthorized consumption, etc.
Establish ongoing mechanisms
for customer meter accuracy
testing, active leakage control
and infrastructure monitoring
Refine, enhance or expand
ongoing programs based upon
economic justification
Water Loss Control Planning Guide
Establish/revise policies and
procedures for data collection
Refine data collection practices
and establish as routine
business process
Annual water audit is a reliable
gauge of year-to-year water
efficiency standing
Level III (51-70) Level IV (71-90)
Back to InstructionsCopyright © 2010, American Water Works Association. All Rights Reserved. WAS v4.2
AWWA Water Loss Control Committee Loss Control Planning 16

Target ILI Range
1.0 - 3.0
1
>3.0 -5.0
0
>5.0 - 8.0
0
Greater than 8.0
0
Less than 1.0
0
Water resources are believed to be sufficient to meet long-term needs, but demand management interventions (leakage management, water conservation) are included in the long-term planning.
Water resources are plentiful, reliable, and easily extracted.
Although operational and financial considerations m ay allow a long-term ILI greater than 8.0, such a l evel of leakage is not an effective utilization of water as a resource. Setting a target level greater than 8 .0 - other than as an incremental goal to a smaller long -term target - is discouraged.
If the calculated Infrastructure Leakage Index (ILI ) value for your system is 1.0 or less, two possibi lities exist. a) you are maintaining your leakage at low levels in a class with the top worldwide performer s in leakage control. b) A portion of your data may be flawed, causing your losses to be greatly understat ed. This is likely if you calculate a low ILI value but do not employ extensive leakage control practices in your operations. In such cases it is beneficial to vali date the data by performing field measurements to c onfirm the accuracy of production and customer meters, or to identify any other potential sources of error in the data.
Water resources can be developed or purchased at reasonable expense; periodic water rate increases can be feasibly imposed and are tolerated by the customer population.
Cost to purchase or obtain/treat water is low, as are rates charged to customers.
Existing water supply infrastructure capability is sufficient to meet long-term demand as long as reasonable leakage management controls are in place.
Superior reliability, capacity and integrity of the water supply infrastructure make it relatively immune to supply shortages.
Financial Considerations
Water resources are costly to develop or purchase; ability to increase revenues via water rates is greatly limited because of regulation or low ratepayer affordability.
Water Resources Considerations
Available resources are greatly limited and are very difficult and/or environmentally unsound to develop.
Operational Considerations
Operating with system leakage above this level would require expansion of existing infrastructure and/or additional water resources to meet the demand.
General Guidelines for Setting a Target ILI (without doing a full economic analysis of leakage control options)
Once data has been entered into the Reporting Works heet, the performance indicators are automatically calculated. How does a water utility operator know how well his or her system is performing? The AWWA Water Loss Control Committee provided the following table to assist wa ter utilities is gauging an approximate Infrastruct ure Leakage Index (ILI) that is appropriate for their water sys tem and local conditions. The lower the amount of leakage and real losses that exist in the system, then the lowe r the ILI value will be. Note: this table offers an approximate guideline for lea kage reduction target-setting. The best means of s etting such targets include performing an economic assessm ent of various loss control methods. However, this table is useful if such an assessment is not possible.
AWWA Water Loss Control Committee Loss Control Planning 17


OFFICE LOCATIONS:MA | NH | CT | ME | VT | AZ
800-366-5760www.tataandhoward.com