Embed Size (px)
Citation preview
Water at the Surfaces of Aligned Phospholipid MultibilayerModel Membranes Probed with Ultrafast Vibrational
Spectroscopy
Wei Zhao,† David E. Moilanen, Emily E. Fenn, and Michael D. Fayer*
Department of Chemistry, Stanford UniVersity, Stanford, California 94305
Received May 7, 2008; E-mail: *[email protected]
Abstract: The dynamics of water at the surface of artificial membranes composed of aligned multibilayersof the phospholipid dilauroyl phosphatidylcholine (DLPC) are probed with ultrafast polarization selectivevibrational pump-probe spectroscopy. The experiments are performed at various hydration levels, x ) 2- 16 water molecules per lipid at 37 °C. The water molecules are ∼1 nm above or below the membranesurface. The experiments are conducted on the OD stretching mode of dilute HOD in H2O to eliminatevibrational excitation transfer. The FT-IR absorption spectra of the OD stretch in the DLPC bilayer systemat low hydration levels shows a red-shift in frequency relative to bulk water, which is in contrast to theblue-shift often observed in systems such as water nanopools in reverse micelles. The spectra for x ) 4- 16 can be reproduced by a superposition of the spectra for x ) 2 and bulk water. IR Pump-probemeasurements reveal that the vibrational population decays (lifetimes) become longer as the hydrationlevel is decreased. The population decays are fit well by biexponential functions. The population decays,measured as a function of the OD stretch frequency, suggest the existence of two major types of watermolecules in the interfacial region of the lipid bilayers. One component may be a clathrate-like water clusternear the hydrophobic choline group and the other may be related to the hydration water molecules mainlyassociated with the phosphate group. As the hydration level increases, the vibrational lifetimes of thesetwo components decrease, suggesting a continuous evolution of the hydration structures in the twocomponents associated with the swelling of the bilayers. The agreement of the magnitudes of the twocomponents obtained from IR spectra with those from vibrational lifetime measurements further supportsthe two-component model. The vibrational population decay fitting also gives an estimation of the numberof phosphate-associated water molecules and choline-associated water molecules, which range from 1 to4 and 1 to 12, respectively, as x increases from 2 to 16. Time-dependent anisotropy measurements yieldthe rate of orientational relaxation as a function of x. The anisotropy decay is biexponential. The fastcomponent is almost independent of x, and is interpreted as small orientational fluctuations that occurwithout hydrogen-bond rearrangement. The slower component becomes very long as the hydration leveldecreases. This component is a measure of the rate of complete orientational randomization, which requiresH-bond rearrangement and is discussed in terms of a jump reorientation model.
1. Introduction
The boundary between a living cell and its surroundings isthe plasma membrane with a thickness ranging from 7-10 nm.1
This nanoscale structure is primarily composed of phospholipidsand embedded proteins. The membrane controls the flow ofmaterials into and out of a cell, and it senses and controls theresponse of cells to hormones and other external signals.Biological membranes have a basic bilayer structure where thenonpolar chains of the phospholipids form the interior of amolecular bilayer.1 The organization of phospholipid bilayersand water is important because lipid-water interactions play akey role in native membrane functioning, stability of bilayers,water permeation, and fusion-related repulsive forces betweenbilayers.2
Numerous studies have been carried out in order to understandthe hydration of lipid membranes.3-6 Experiments and simula-tions have found that water molecules penetrate the interfacialregion (phospholipid head groups) of bilayers, but water has alow probability of being found in the hydrophobic core.2,7-9
Fully hydrated liquid crystal phase (LR) phosphatidylcholinelipids such as dipalmitoyl phosphatidylcholine (DPPC) can takeup a maximum of ∼30 water molecules per lipid, distributed
† Permanent address: Department of Chemistry, University of Arkansas,Little Rock, AR 72204.(1) Metzler, D. E. Biochemistry: The Chemical Reactions of LiVing Cells;
2nd ed.; Harcourt/Academic Press: San Diego, 2001.
(2) Gawrisch, K.; Gaede, H. C.; Mihailescu, M.; White, S. H. Euro.Biophys. J. Biophys. Lett 2007, 36, 281–291.
(3) Nagle, J. F.; Tristram-Nagle, S. Biochim. Biophys. Acta-ReV. Biomem-br. 2000, 1469, 159–195.
(4) Tristram-Nagle, S.; Nagle, J. F. Chem. Phys. Lipids 2004, 127, 3–14.(5) Milhaud, J. Biochim. Biophys. Acta 2004, 1663, 19–51.(6) Hubner, W.; Blume, A. Chem. Phys. Lipids 1998, 96, 99–123.(7) Lopez, C. F.; Nielsen, S. O.; Klein, M. L.; Moore, P. B. J. Phys. Chem.
B 2004, 108, 6603–6610.(8) Khandelia, H.; Kaznessis, Y. N. Biochim. Biophys. Acta 2007, 1768,
509–520.(9) Damodaran, K. V.; Merz, J. K. M. Langmuir 1993, 9, 1179–1183.
Published on Web 09/30/2008
10.1021/ja803252y CCC: $40.75 2008 American Chemical Society J. AM. CHEM. SOC. 2008, 130, 13927–13937 9 13927

in the interfacial water region and the water layer between thetwo headgroup regions of adjacent bilayers.3 However, theamount of water that can hydrate the membrane is dependenton the membrane’s structure. In the more structurally orderedgel phase, only ∼13 water molecules per DPPC are absorbed.3
The number of water molecules in the interfacial water regionalso changes from ∼4 per DPPC in gel phase to ∼9 per DPPCin the liquid crystalline phase.3 There have been various reportson how the head groups associate with water molecules inbilayers. A variety of techniques including IR, NMR, neutronscattering, and electrical conductivity measurements have beenemployed in studies on water-headgroup interactions.3-6 Inspite of this, a clear picture is still lacking for lipid bilayers atvarious hydration levels. Molecular dynamics (MD) simulationson dimyristoyl phosphatidylcholine (DMPC) bilayers suggestthat the presence of the hydrophobic choline group in the lipidis responsible for the formation of a “clathrate like” shell at thesurface of the lipid bilayer.9 Lopez et al. have conducted MDsimulations on the hydrogen-bonding structure of water at thefully hydrated bilayer surface of DMPC.7 In addition to theformation of a hydration shell around the choline group wherethe water molecules are able to form hydrogen bonds with eachother by creating a clathrate structure, they also found that thedouble bonded oxygen atoms of the phosphate group have a74% probability of forming hydrogen bonds with two watermolecules. The importance of the choline group in hydrationhas also been revealed by electrical conductivity measurementswhich indicate that the choline group is as important as thephosphate group for absorbing water.10 Using NMR measure-ments, Hsieh and Wu studied the structure and dynamics ofthe hydration shell of DMPC bilayers at temperatures below 0°C and suggested that the hydration shell of the headgroupconsists of two distinct regions, a clathrate-like water clusternear the hydrophobic choline group and hydration watermolecules associated with the phosphate group.11 About 1-2water molecules are associated with the phosphate group andare frozen, whereas about 5-6 waters near the choline groupbehave as a water cluster and remain unfrozen at temperaturesas low as -70 °C.11
Lipid bilayer systems have a unique nanoscale polar inter-facial structure where most of the lipid-water interactionsoccur.1-6 Water-saturated multilamellar arrays of phospholipidsin the LR fluid phase, such as dilauroyl phosphatidylcholine(DLPC, Figure 1), have a bilayer repeat spacing, D, of 6.1 nm.12
The water layer between the two headgroup regions of adjacentbilayers is 3.8 nm thick, and the interfacial water region isconsidered to be ∼0.9 nm thick.12
Because of the nanoscale confinement, the dynamics of waterin the interbilayer region are expected to be very different fromthose of bulk water in analogy to the substantial deviations from
bulk water dynamics observed in other nanoscopic watersystems. Ultrafast vibrational spectroscopy has recently emergedas a powerful tool to study the dynamics of water in nanoscopicenvironments.13-18 Experiments probing the OD stretchingmode of dilute HOD in H2O in the water nanopool of reversemicelles13,14,19 or the hydrophilic channels of Nafion mem-branes14,15 have shown that the vibrational population relaxation(vibrational lifetime) and the orientational relaxation of waterboth slow as the amount of water in the system decreases. InAOT reverse micelles, a core-shell model can be used toquantitatively explain the size-dependent infrared (IR) absorptionspectra and population relaxation times.13 The water dynamicsare subdivided into two contributions, a “shell” region consistingof water closely associated with the head groups and a “core”region with bulk-like properties consisting of water moleculesaway from the head groups. In Nafion membranes,15 the ODstretch IR absorption spectra can be fit using a two-environmentmodel consisting of bulk water and headgroup water. Thespectrum of the headgroup waters was obtained from measure-ments on almost dry Nafion. At a given hydration level, whichdetermines the size of the water channels and the amount ofwater in the channel, the vibrational population relaxation couldbe well described in terms of two populations. The populationdecays were biexponential, with the amplitudes of the twocomponents varying systematically with the detection wave-length within the OD absorption band. However, in contrast toAOT reverse micelles, as the hydration level is changed, thelifetimes of the two components change. This result wasinterpreted as being caused by changes in the interfacial structureand morphology of the channels with changing hydration level.Recent IR pump-probe measurements on dimyristoyl phos-phatidylcholine (DMPC) phospholipids that are weakly hydratedwith D2O suggest that water loses most of its bulk propertiesand has a high degree of structural heterogeneity.17,18
Here we utilize ultrafast vibrational spectroscopy and IRabsorption spectroscopy to probe the nature of water at and nearthe surface of DLPC phospholipid model membranes. DLPCwas chosen on the basis of the stability of its aligned, opticallytransparent multibilayers for a range of relatively low hydrationlevels. By using aligned multibilayers, it is possible to examinewater molecules at the headgroup interface without contributionsfrom bulk water and still have a sufficient number of watermolecules to perform IR pump-probe experiments. The mea-surements are made on the OD stretch of dilute HOD in H2O.The use of dilute HOD as opposed to pure H2O or D2O isimportant to eliminate vibrational excitation transfer.20-22
Vibrational excitation transfer causes the decay of the transitiondipole anisotropy, which interferes with measurements oforientational relaxation. It also changes the location of theexcitation, which impedes the use of the vibrational lifetime asa probe of the local environment. MD simulations of bulk water
(10) Jendrasiak, G. L.; Smith, R. L. Chem. Phys. Lipids 2004, 131, 183–195.
(11) Hsieh, C. H.; Wu, W. G. Biophys. J. 1996, 71, 3278–3287.(12) Kucerka, N.; Liu, Y. F.; Chu, N. J.; Petrache, H. I.; Tristram-Nagle,
S. T.; Nagle, J. F. Biophys. J. 2005, 88, 2626–2637.
(13) Piletic, I. R.; Moilanen, D. E.; Spry, D. B.; Levinger, N. E.; Fayer,M. D. J. Phys. Chem. A 2006, 110, 4985–4999.
(14) Moilanen, D. E.; Piletic, I. R.; Fayer, M. D. J. Phys. Chem. A 2006,110, 9084–9088.
(15) Moilanen, D. E.; Piletic, I. R.; Fayer, M. D. J. Phys. Chem. C 2007,111, 8884–8891.
(16) Tan, H.-S.; Piletic, I. R.; Fayer, M. D. J. Chem. Phys. 2005, 122,174501–174509.
(17) Volkov, V. V.; Palmer, D. J.; Righini, R. J. Phys. Chem. B 2007,111, 1377–1383.
(18) Volkov, V. V.; Palmer, D. J.; Righini, R. Phys. ReV. Lett. 2007, 99,078302.
(19) Moilanen, D. E.; Spry, D. B.; Levinger, N. E.; Fayer, M. D. J. Am.Chem. Soc. 2007, 129, 14311–14318.
Figure 1. Chemical structure of the phospholipid dilauroyl phosphatidyl-choline (DLPC).
13928 J. AM. CHEM. SOC. 9 VOL. 130, NO. 42, 2008
A R T I C L E S Zhao et al.
have shown that dilute HOD in H2O does not change thebehavior of water and that observations of the OD hydroxylstretch report on the dynamics and local environment of water.23
The aligned multibilayers are studied for various hydrationlevels, x, at 37 °C over the range of 2 to 16 water moleculesper lipid (x ) moles H2O per mole DLPC). The alignment ofthe multibilayers can be maintained at 37 °C for several days,a period of time long enough for the optical measurements tobe made. DLPC bilayers can absorb up to about 31 waters perlipid with ∼8 water molecules in the headgroup region in fullyhydrated DLPC bilayers.12 The FT-IR spectra of the OD stretchof HOD in DLPC bilayers at low hydration levels show thatthe frequency is red-shifted compared to the spectrum of bulkwater. The red-shift in the absorption spectrum is opposite tothe blue-shift observed in reverse micelles13,19 and Nafionmembranes.15
Ultrafast IR polarization selective pump-probe experimentson the OD stretch are used to measure vibrational populationrelaxation as a function of the number of water molecules perlipid, x, and the detection wavelength. In addition, orientationalrelaxation is measured as a function of x. The populationrelaxation is best fit with a biexponential decay. The vibrationallifetimes become longer when the hydration level decreases,similar to the results for water confined in reverse micelles andNafion membranes. The results demonstrate that there are twodistinct environments for the water molecules. The changes inthe lifetimes with x indicate that the structure of the bilayersurface changes with hydration level. The relatively mildvariation of the lifetimes with detection wavelength suggeststhat each environment has some degree of inhomogeneity. Thetime-dependent anisotropies, which are a measure of water’sorientational dynamics, change dramatically with hydrationlevel. As x decreases, the orientation relaxation becomesincreasingly slow. However, the anisotropy decays are not singleexponential. A relatively small, fast component occurs at alllevels of hydration. In other systems, this type of fast decayhas been interpreted by using a wobbling-in-a-cone model, inwhich the orientation of the water molecule undergoes fastfluctuations with the original H-bonding network intact. Atlonger times, H-bond rearrangement results in complete orien-tational randomization.
2. Experimental Procedures
Synthetic DLPC, 1,2-dilauroyl-sn-glycero-3-phosphocholine, withpurity >99%, was purchased from Avanti Polar Lipids, Inc.(Alabaster, AL) and used as received. The sample contained 2.2wt % residual water (∼0.8 H2O/DLPC) as determined by coulo-metric Karl Fischer titration. Deuterium oxide (99.9 atom% D) wasobtained from Sigma-Aldrich. Deionized ultrafiltered water wasobtained from Fisher Scientific.
The aligned multibilayer DLPC lipids DLPC · xH2O with varioushydration levels were prepared for the measurements. Differentstarting ratios x ) 2, 5, 7, 10, and 20 were selected for preparation.The final water to lipid ratios of the samples after the preparationprocedure were determined to be x ≈ 2, 4, 6, 8, and 16 bycoulometric Karl Fischer titration. For preparation, a series ofsamples each containing about 65 mg of DLPC were weighed insmall glass vials. By taking the 2.2 wt % residual water in the DLPC
samples into account, calculated volumes of water containing5.5-8.6 wt % HOD were added to the samples, so that the finalHOD concentration was 5 mol % in the water contained in thelipid samples. This concentration is low enough to preventvibrational excitation transfer. The vials containing the mixtureswere tightly sealed to prevent evaporation. The samples were heatedin an oven so that the mixture became fluid-like. Periodically thesamples were taken out of the oven and shaken to ensure that thelipid was homogeneously hydrated. An oven temperature of ∼85°C was used for x ) 2, ∼55 °C for x ) 4 and 6, and ∼45 °C forx ) 8 and 16. The samples with x g 8 can also be mixed uniformlyat room temperature if they are allowed to equilibrate overnight.When the DLPC lipid samples became homogeneously hydratedafter mixing for 2-4 h, they were transferred to specially designedheated IR sample cells with two 3 mm thick CaF2 windows. Teflonspacers with different thicknesses, 45 µm (x ) 16), 100 µm (x )8), 190 µm (x ) 4 and 6), and 220 µm (x ) 2) were used so thatthe absorbance of the OD stretch at ∼2500 cm-1 in the sampleswas in the range of 0.2-0.7.
To make aligned, optically transparent monodomain DLPCmultibilayers, a mechanical alignment method, modified fromrefs19-22 was used. The IR cells with the samples of differentwater concentrations were heated to the temperatures required toobtain homogeneous hydration as discussed above. The cellsconsisted of two copper plates that compressed the CaF2 windowsand the spacer. The tension on one metal plate was varied by setscrews. Flow from one part of the sample to another was observedby gently alternating between compressing and releasing thewindows. The alignment was monitored by placing the sample onthe stage of a polarizing microscope where the aligned regionsappeared uniformly black between crossed polarizers since theoptical axis of the homeotropically aligned lipid bilayers is normalto the window surfaces.24-27 A dark cross pattern was observedusing a conoscopic microscope, which demonstrates that the sampleis macroscopically aligned. Macroscopic alignment of DLPC for x) 2-8 water molecules was achieved for a variety of temperatures,including 37 °C. However, the sample containing x ) 16 watermolecules (32 wt % water) could not be macroscopically aligned,in agreement with the literature.24,25 This sample is still microscopi-cally aligned as the lamellar repeat distance and bilayer thicknesschange linearly from x ) 8 to x ) 16 even at 25 °C.28 Once thesample was aligned at elevated temperature, the cell was sealed,and the temperature was gradually lowered to the experimentaltemperature of 37 °C. After the pump-probe measurements, eachsample was reexamined by FT-IR and with the polarizing cono-scopic microscope. No changes were observed in either thealignment or the spectrum. The consistency of the spectrum showsthat the samples did not lose water during the measurement.
The pump-probe measurements were conducted using a lasersystem described previously.14,15 Briefly, a home-built Ti:Sapphireoscillator and regenerative amplifier operating at 1 kHz were usedto pump an OPA and difference frequency stage to produce ∼70fs, ∼4 µm IR pulses. The pulses were split into pump and probepulses with the probe’s polarization set to ∼45° relative to the pump.Just prior to the monochromator, the components of the probe withpolarization parallel and perpendicular to the pump were selectedto avoid depolarization effects due to optics in the beam path. Theperpendicular component was then rotated back to parallel by ahalf-wave plate to ensure both components experienced the samediffraction efficiency from the monochromator grating. The spec-trally resolved pump-probe signals I| and I⊥ were detected by an
(20) Woutersen, S.; Bakker, H. J. Nature 1999, 402, 507–509.(21) Gaffney, K. J.; Piletic, I. R.; Fayer, M. D. J. Chem. Phys. 2003, 118,
2270–2278.(22) Gochanour, C. R.; Fayer, M. D. J. Phys. Chem. 1981, 85, 1989–1994.(23) Corcelli, S.; Lawrence, C. P.; Skinner, J. L. J. Chem. Phys. 2004,
120, 8107.
(24) Asher, S. A.; Pershan, P. S. Biophys. J. 1979, 27, 393–422.(25) Powers, L.; Pershan, P. S. Biophys. J. 1977, 20, 137–152.(26) Powers, L.; Clark, N. A. Proc. Natl. Acad. Sci. U.S.A. 1975, 72, 840–
843.(27) El-Sayed, M. Y.; Guion, T. A.; Fayer, M. D. Biochemistry 1986, 25,
4825–4832.(28) Lis, L. J.; Mcalister, M.; Fuller, N.; Rand, R. P.; Parsegian, V. A.
Biophys. J. 1982, 37, 657–665.
J. AM. CHEM. SOC. 9 VOL. 130, NO. 42, 2008 13929
Water at Surfaces of Multibilayer Model Membranes A R T I C L E S
IR array detector. To test the reproducibility, a second set ofmultibilayer samples was also prepared. The measured data fromthe two sets of samples agreed.
With accurate measurements of the signal parallel, I|(t), andperpendicular, I⊥ (t), to the pump polarization, vibrational excited-state population decay, P(t) is obtained using,
P(t)) I|(t)+ 2I⊥ (t) (1)
and the orientational relaxation, r(t) (anisotropy decay) is givenby,
r(t))I|(t)- I⊥ (t)
I|(t)+ 2I⊥ (t)) 0.4C2(t) (2)
where C2(t) is the second Legendre polynomial orientationalcorrelation function.
3. Results and Discussion
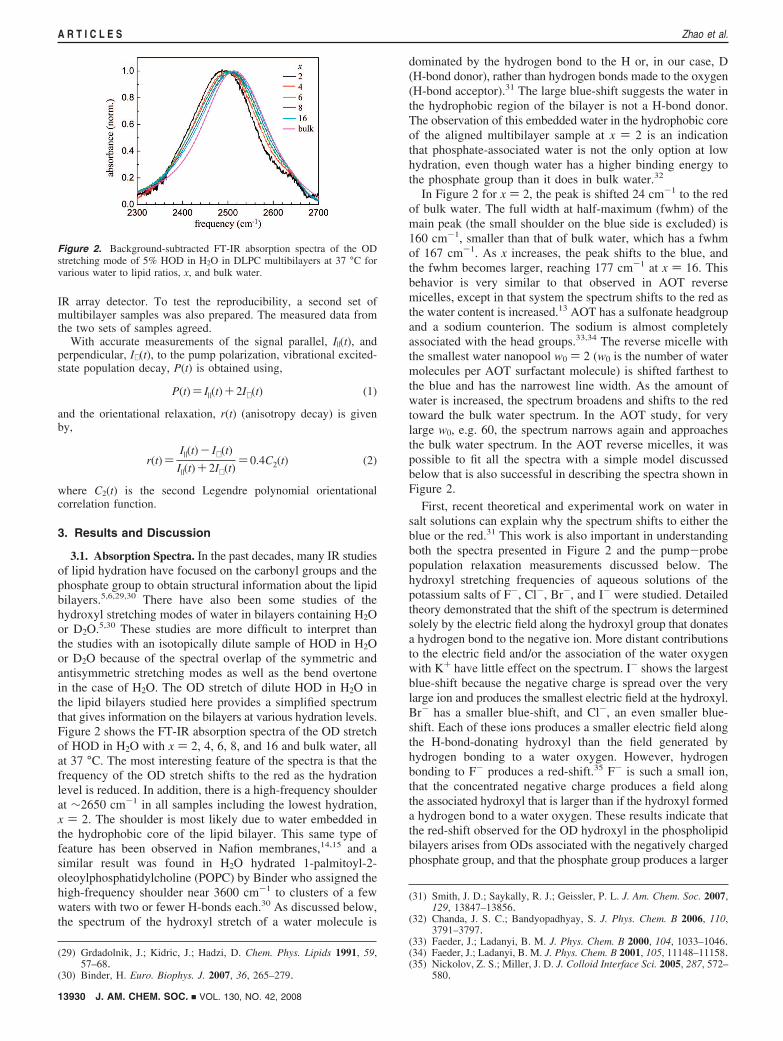
3.1. Absorption Spectra. In the past decades, many IR studiesof lipid hydration have focused on the carbonyl groups and thephosphate group to obtain structural information about the lipidbilayers.5,6,29,30 There have also been some studies of thehydroxyl stretching modes of water in bilayers containing H2Oor D2O.5,30 These studies are more difficult to interpret thanthe studies with an isotopically dilute sample of HOD in H2Oor D2O because of the spectral overlap of the symmetric andantisymmetric stretching modes as well as the bend overtonein the case of H2O. The OD stretch of dilute HOD in H2O inthe lipid bilayers studied here provides a simplified spectrumthat gives information on the bilayers at various hydration levels.Figure 2 shows the FT-IR absorption spectra of the OD stretchof HOD in H2O with x ) 2, 4, 6, 8, and 16 and bulk water, allat 37 °C. The most interesting feature of the spectra is that thefrequency of the OD stretch shifts to the red as the hydrationlevel is reduced. In addition, there is a high-frequency shoulderat ∼2650 cm-1 in all samples including the lowest hydration,x ) 2. The shoulder is most likely due to water embedded inthe hydrophobic core of the lipid bilayer. This same type offeature has been observed in Nafion membranes,14,15 and asimilar result was found in H2O hydrated 1-palmitoyl-2-oleoylphosphatidylcholine (POPC) by Binder who assigned thehigh-frequency shoulder near 3600 cm-1 to clusters of a fewwaters with two or fewer H-bonds each.30 As discussed below,the spectrum of the hydroxyl stretch of a water molecule is
dominated by the hydrogen bond to the H or, in our case, D(H-bond donor), rather than hydrogen bonds made to the oxygen(H-bond acceptor).31 The large blue-shift suggests the water inthe hydrophobic region of the bilayer is not a H-bond donor.The observation of this embedded water in the hydrophobic coreof the aligned multibilayer sample at x ) 2 is an indicationthat phosphate-associated water is not the only option at lowhydration, even though water has a higher binding energy tothe phosphate group than it does in bulk water.32
In Figure 2 for x ) 2, the peak is shifted 24 cm-1 to the redof bulk water. The full width at half-maximum (fwhm) of themain peak (the small shoulder on the blue side is excluded) is160 cm-1, smaller than that of bulk water, which has a fwhmof 167 cm-1. As x increases, the peak shifts to the blue, andthe fwhm becomes larger, reaching 177 cm-1 at x ) 16. Thisbehavior is very similar to that observed in AOT reversemicelles, except in that system the spectrum shifts to the red asthe water content is increased.13 AOT has a sulfonate headgroupand a sodium counterion. The sodium is almost completelyassociated with the head groups.33,34 The reverse micelle withthe smallest water nanopool w0 ) 2 (w0 is the number of watermolecules per AOT surfactant molecule) is shifted farthest tothe blue and has the narrowest line width. As the amount ofwater is increased, the spectrum broadens and shifts to the redtoward the bulk water spectrum. In the AOT study, for verylarge w0, e.g. 60, the spectrum narrows again and approachesthe bulk water spectrum. In the AOT reverse micelles, it waspossible to fit all the spectra with a simple model discussedbelow that is also successful in describing the spectra shown inFigure 2.
First, recent theoretical and experimental work on water insalt solutions can explain why the spectrum shifts to either theblue or the red.31 This work is also important in understandingboth the spectra presented in Figure 2 and the pump-probepopulation relaxation measurements discussed below. Thehydroxyl stretching frequencies of aqueous solutions of thepotassium salts of F-, Cl-, Br-, and I- were studied. Detailedtheory demonstrated that the shift of the spectrum is determinedsolely by the electric field along the hydroxyl group that donatesa hydrogen bond to the negative ion. More distant contributionsto the electric field and/or the association of the water oxygenwith K+ have little effect on the spectrum. I- shows the largestblue-shift because the negative charge is spread over the verylarge ion and produces the smallest electric field at the hydroxyl.Br- has a smaller blue-shift, and Cl-, an even smaller blue-shift. Each of these ions produces a smaller electric field alongthe H-bond-donating hydroxyl than the field generated byhydrogen bonding to a water oxygen. However, hydrogenbonding to F- produces a red-shift.35 F- is such a small ion,that the concentrated negative charge produces a field alongthe associated hydroxyl that is larger than if the hydroxyl formeda hydrogen bond to a water oxygen. These results indicate thatthe red-shift observed for the OD hydroxyl in the phospholipidbilayers arises from ODs associated with the negatively chargedphosphate group, and that the phosphate group produces a larger
(29) Grdadolnik, J.; Kidric, J.; Hadzi, D. Chem. Phys. Lipids 1991, 59,57–68.
(30) Binder, H. Euro. Biophys. J. 2007, 36, 265–279.
(31) Smith, J. D.; Saykally, R. J.; Geissler, P. L. J. Am. Chem. Soc. 2007,129, 13847–13856.
(32) Chanda, J. S. C.; Bandyopadhyay, S. J. Phys. Chem. B 2006, 110,3791–3797.
(33) Faeder, J.; Ladanyi, B. M. J. Phys. Chem. B 2000, 104, 1033–1046.(34) Faeder, J.; Ladanyi, B. M. J. Phys. Chem. B 2001, 105, 11148–11158.(35) Nickolov, Z. S.; Miller, J. D. J. Colloid Interface Sci. 2005, 287, 572–
580.
Figure 2. Background-subtracted FT-IR absorption spectra of the ODstretching mode of 5% HOD in H2O in DLPC multibilayers at 37 °C forvarious water to lipid ratios, x, and bulk water.
13930 J. AM. CHEM. SOC. 9 VOL. 130, NO. 42, 2008
A R T I C L E S Zhao et al.

electric field at the associated hydroxyl than if it was hydrogenbonded to a water oxygen.
In AOT reverse micelles13 it was determined that the IRspectra at all ω0 greater than the smallest, ω0 ) 2, could be fitby summing the spectrum of bulk water and the spectrum ofthe ω0 ) 2 AOT reverse micelle. The only adjustable parameterused to obtain the total normalized spectrum at each ω0 wasthe ratio of the ω0 ) 2 and the bulk water spectra. Similarly,the IR spectra of the DLPC samples of x ) 4, 6, 8 and 16 canalso be fit using the spectrum of the x ) 2 sample and that ofbulk water from 2250 to 2750 cm-1. Here, bulk water is usedas a model for bulk-like water, which reflects OD hydroxylsthat are not associated with the phosphate ion of the DLPCheadgroup. A third small Gaussian peak is included to fit thehigh-frequency shoulder of the water in the hydrophobic regions.Figure 3 shows the results of the fitting procedure for two ofthe samples, x ) 4 (A) and 8 (B). The fits are quite good,capturing both the shift and the change in shape of the spectrumwith x. For x ) 4, the component of x ) 2 contributes 71%,and the bulk-like component contributes 29%. For x ) 6, thecomponents are 59% and 41%, for the x ) 2 and bulk-likecomponents, respectively. For x ) 8, the components are 41%and 59%, for the x ) 2 and bulk-like components, respectively,and for x ) 16, the respective components are 28% and 72%.
The relative fractions obtained from the fits to the IR spectrumare proportional to µ2C, where µ is the transition dipole moment,and C is the concentration. However, µ depends on the type ofhydrogen bond, so the relative fractions are not necessarilydirectly related to the relative concentrations.13 To obtain theconcentration ratios, we need to find the ratio of µ2 for bulkwater and the x ) 2 component. The required ratio can be foundby measuring the ratios of the spectral areas of 5 mol % HODin H2O to 5 mol % HOD in H2O contained in the x ) 2 sample(5.5 wt % H2O) after correcting for the differences of the waterconcentrations and sample thicknesses. The ratio of µ2 for bulk
water to the x ) 2 component is 1.07. The determination of thetransition dipole ratio enables us to calculate the concentrationratio for the bilayer samples of x ) 4, 6, 8 and 16.
Grdadolnik et al. surveyed theoretical calculations of thenumber of water molecules that can hydrogen bond to thephosphate oxygens.29 They concluded that no more than 4 watermolecules can be accommodated at the phosphate. Hydrogenbonding causes the frequency of the PO2
- antisymmetricstretching band to red-shift from 1250 cm-1 for dry to 1230cm-1 in a hydrated bilayer.6,29 When x > 3, in addition to thephosphate group-associated water molecules, additional watermolecules form bulk-like water clusters near the hydrophobiccholine group.11 Thus, at the larger values of x it was proposedby Hsieh and Wu that there are two hydration regions.11 Asdiscussed below, the population relaxation experiments com-bined with the absorption measurements demonstrate that, evenfor x ) 2, there are two hydration regions.
The results of the spectroscopic analysis illustrated in Figure3 are summarized in Table 1. The spectral shifts shown in Figure2 can be understood in terms of the recent theoretical andexperimental work on aqueous salt solutions.31 The aqueoussalt solution work indicates that the bulk-like water componentarises from waters that are not hydrogen bonded to an anion,and the work of Hsieh and Wu suggests that these waters areassociated with the choline group and are labeled as Ch in Table1. (By bulk-like, we mean water that has a spectrum similar tothat of bulk water, but not necessarily the same dynamics asdiscussed below. Bulk-like does not mean that there is noassociation with a headgroup.) The conclusion that no more than4 water molecules can be associated with the phosphate group29
is consistent with the results given in Table 1 within experi-mental error. Even for x ) 16, only ∼4 water molecules are inthe x ) 2 component. However, as discussed below, the datain Table 1 will be reconsidered in terms of a more completeanalysis that uses the pump-probe data.
The shoulder on the blue side of the line at ∼2640 cm-1 ismore difficult to analyze. The large blue-shift suggests that thesewaters are in a hydrophobic region and will have a much smallertransition dipole than the other components. An analysis of asimilar peak in Nafion membranes indicated that µ2 for waterin a hydrophobic environment is a factor of ∼4.8 smaller thanthat of bulk water.14 Using this value, the approximate percent-ages of water in the hydrophobic environment are ∼13% inthe x ) 2 bilayer sample and <5% in the x ) 16 sample. Thehydrophobic water component will be neglected in the analysisof the pump-probe data because of its small amplitude andbecause the pump-probe signal depends on µ4C, making thehydrophobic water contribution to the signals negligible.
3.2. Vibrational Population Relaxation. It has been demon-strated previously that the vibrational population relaxation, P(t),of the OD stretch of dilute HOD in H2O in nanoscopic watersystems is extremely sensitive to local environments.13-15 Figure
Figure 3. Examples of fitting the absorption spectra for x ) 4 (panel A)and x ) 8 (panel B). The data (circles) can be fit (red line) by the sum ofthe spectra of x ) 2 and bulk water. Only the relative amplitude of the twospectra is varied. A third small Gaussian peak is included to account forthe high-frequency shoulder associated with water molecules in hydrophobicregions of the bilayers.
Table 1. Results from Fitting the IR Spectra (see Figure 3)a
x % x ) 2 % Ch (bulk-like)
2 100 04 72 286 60 408 42 5816 29 71
a Percent of x ) 2 component and bulk-like water (cholineassociated, Ch) component, where x is the number of waters per DLPCmolecule.
J. AM. CHEM. SOC. 9 VOL. 130, NO. 42, 2008 13931
Water at Surfaces of Multibilayer Model Membranes A R T I C L E S
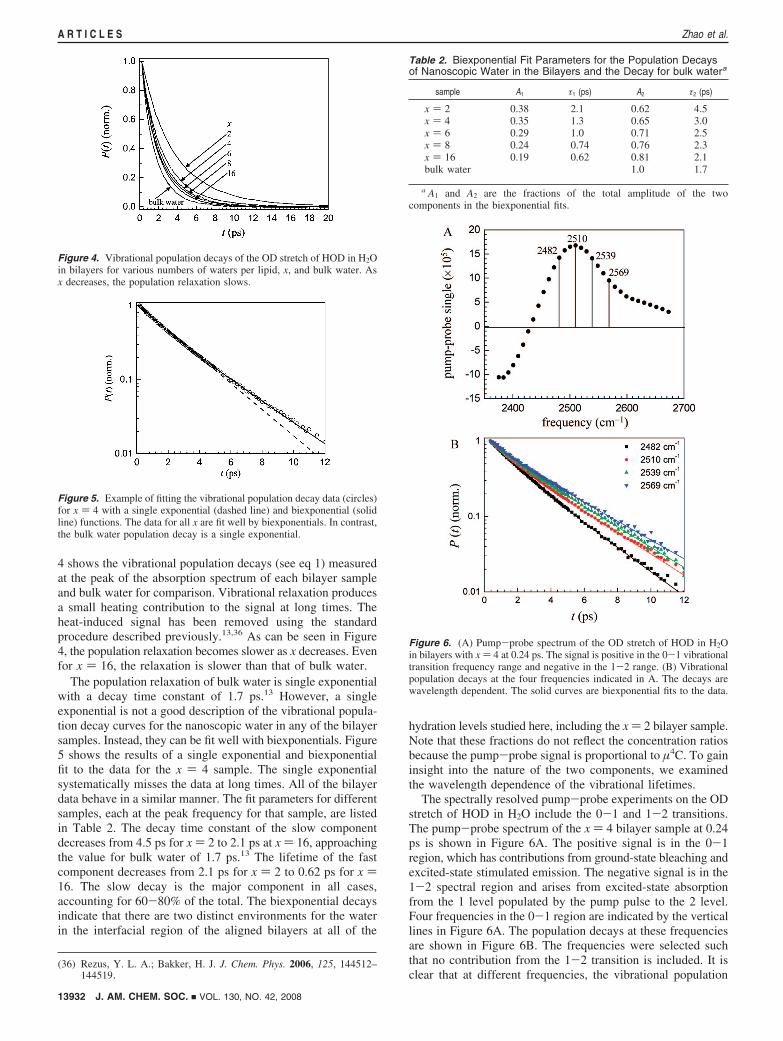
4 shows the vibrational population decays (see eq 1) measuredat the peak of the absorption spectrum of each bilayer sampleand bulk water for comparison. Vibrational relaxation producesa small heating contribution to the signal at long times. Theheat-induced signal has been removed using the standardprocedure described previously.13,36 As can be seen in Figure4, the population relaxation becomes slower as x decreases. Evenfor x ) 16, the relaxation is slower than that of bulk water.
The population relaxation of bulk water is single exponentialwith a decay time constant of 1.7 ps.13 However, a singleexponential is not a good description of the vibrational popula-tion decay curves for the nanoscopic water in any of the bilayersamples. Instead, they can be fit well with biexponentials. Figure5 shows the results of a single exponential and biexponentialfit to the data for the x ) 4 sample. The single exponentialsystematically misses the data at long times. All of the bilayerdata behave in a similar manner. The fit parameters for differentsamples, each at the peak frequency for that sample, are listedin Table 2. The decay time constant of the slow componentdecreases from 4.5 ps for x ) 2 to 2.1 ps at x ) 16, approachingthe value for bulk water of 1.7 ps.13 The lifetime of the fastcomponent decreases from 2.1 ps for x ) 2 to 0.62 ps for x )16. The slow decay is the major component in all cases,accounting for 60-80% of the total. The biexponential decaysindicate that there are two distinct environments for the waterin the interfacial region of the aligned bilayers at all of the
hydration levels studied here, including the x ) 2 bilayer sample.Note that these fractions do not reflect the concentration ratiosbecause the pump-probe signal is proportional to µ4C. To gaininsight into the nature of the two components, we examinedthe wavelength dependence of the vibrational lifetimes.
The spectrally resolved pump-probe experiments on the ODstretch of HOD in H2O include the 0-1 and 1-2 transitions.The pump-probe spectrum of the x ) 4 bilayer sample at 0.24ps is shown in Figure 6A. The positive signal is in the 0-1region, which has contributions from ground-state bleaching andexcited-state stimulated emission. The negative signal is in the1-2 spectral region and arises from excited-state absorptionfrom the 1 level populated by the pump pulse to the 2 level.Four frequencies in the 0-1 region are indicated by the verticallines in Figure 6A. The population decays at these frequenciesare shown in Figure 6B. The frequencies were selected suchthat no contribution from the 1-2 transition is included. It isclear that at different frequencies, the vibrational population
(36) Rezus, Y. L. A.; Bakker, H. J. J. Chem. Phys. 2006, 125, 144512–144519.
Figure 4. Vibrational population decays of the OD stretch of HOD in H2Oin bilayers for various numbers of waters per lipid, x, and bulk water. Asx decreases, the population relaxation slows.
Figure 5. Example of fitting the vibrational population decay data (circles)for x ) 4 with a single exponential (dashed line) and biexponential (solidline) functions. The data for all x are fit well by biexponentials. In contrast,the bulk water population decay is a single exponential.
Table 2. Biexponential Fit Parameters for the Population Decaysof Nanoscopic Water in the Bilayers and the Decay for bulk watera
sample A1 τ1 (ps) A2 τ2 (ps)
x ) 2 0.38 2.1 0.62 4.5x ) 4 0.35 1.3 0.65 3.0x ) 6 0.29 1.0 0.71 2.5x ) 8 0.24 0.74 0.76 2.3x ) 16 0.19 0.62 0.81 2.1bulk water 1.0 1.7
a A1 and A2 are the fractions of the total amplitude of the twocomponents in the biexponential fits.
Figure 6. (A) Pump-probe spectrum of the OD stretch of HOD in H2Oin bilayers with x ) 4 at 0.24 ps. The signal is positive in the 0-1 vibrationaltransition frequency range and negative in the 1-2 range. (B) Vibrationalpopulation decays at the four frequencies indicated in A. The decays arewavelength dependent. The solid curves are biexponential fits to the data.
13932 J. AM. CHEM. SOC. 9 VOL. 130, NO. 42, 2008
A R T I C L E S Zhao et al.

decays of the OD stretch are different. As in Figure 5, the fitsare biexponentials.
The wavelength-dependent biexponential fitting results forall samples are shown in Figure 7. The plots display thevibrational lifetimes and the fractions of the total amplitude ofthe two components in the biexponential fit. Only data in the0-1 portion of the spectrum are shown. The dashed lines areguides to the eye. The common feature of the vibrational lifetimedata for all hydration levels is the existence of two significantlydifferent lifetime components each with substantial amplitude.The vibrational lifetime is very sensitive to the local environ-ment. Two relaxation components and changes in the lifetimesof the two components with hydration level have been observedpreviously in the nanoscopic water channels of Nafionmembranes.14,15 Figure 7 shows that the population decaysdisplay some wavelength dependence. First, consider thepopulation decay time constants, τ1 and τ2. For the intermediatevalues of x, 4, 6, and 8, there is no wavelength dependence forτ1 within experimental error. Given the lower signal-to-noiseratio because of the low water content for x ) 2, it is not clearwhether there is a wavelength dependence. For x ) 16, theremay be a change in τ1 at lower frequencies. As discussed indetail below, this component is assigned to waters associatedwith the phosphate groups. The lack of wavelength dependencesuggests a relatively uniform environment for waters associatedwith the phosphates. For τ2, given the low scatter in the data, itseems clear that there is a wavelength dependence for x ) 4, 6,and 8, and most likely for 2, but for x ) 16, there is nowavelength dependence. τ2 reflects the vibrational relaxation
of the more bulk-like component of the water, which is mostlikely associated with the choline groups. The fact that the decayconstants vary with wavelength indicates that the distributionis inhomogeneous. These waters experience a variety ofenvironments. The wavelength dependence of the decay am-plitudes for the x ) 2 and 16 bilayers is very pronounced. Inboth cases, the phosphate-associated water fraction becomeslarge on the red side of the spectrum. In bulk water, moleculesthat form the shortest, strongest hydrogen bonds have the lowestabsorption frequencies.37 As discussed above, recent theoreticalwork shows that the red shift is caused by an increased localelectric field at the OD.31 For x ) 2, the increased fraction ofthe phosphate component (the 1 component) on the red sideof the spectrum is caused by the hydrogen bonding of the ODto the phosphate group. It is not immediately obvious why the1 component of the x ) 16 sample has such a large presenceon the red side of the spectrum. It is possible that it is causedby a combination of ODs bound to the phosphates and watermolecules that are becoming increasingly bulk-like with strongerhydrogen bonds than those of waters in the immediate proximityof the choline groups.
The lifetime data shown in Figure 7 demonstrate clearly thatthere are two distinct types of environments for the watermolecules interacting with the head groups of the bilayers. Thebiexponential decays are consistent with the decomposition ofthe spectra (Figure 3) into two major components. In addition,the lifetime decreases with increased water content, suggestingthat an environmental change occurs with hydration consistentwith the changes that take place during lipid bilayer swelling.28
It has been reported that the absorbed water molecules aresuccessively accommodated into spaces between head groupsand in the interbilayer space during stepwise phospholipidhydration.5 Table 2 shows that the lifetime of the slowercomponent changes from 4.5 ps at x ) 2 to 2.1 ps at x ) 16,approaching the lifetime of bulk water (1.7 ps). The approachof the slow component to the bulk water lifetime further suggeststhat this component is a choline-associated bulk-like waterhydration shell, while the faster component is phosphate-associated.
Using the assignment that the fast component in the decaysis due to phosphate-associated water and the slow componentis due to choline-associated bulk-like water, we can obtainadditional information on the distribution of water in theheadgroup region. In spite of the small number of watermolecules and the substantially red-shifted absorption spectrum,the vibrational lifetime decay for x ) 2 is biexponential,indicating that even at the lowest hydration water experiencesat least two distinct environments. For x ) 2 in Table 2, wetake the A1 value to be determined by the fraction that is fromphosphate associated and the A2 value to be determined by thefraction that is choline associated. However, to get the actualfraction of the concentrations for each type of water in the x )2 sample, we need to determine the ratio of the two transitiondipoles because the pump-probe signal goes as µ4C. In section3.1 the ratio of µ2 for bulk water to the x ) 2 component wasfound to be 1.07. However, the x ) 2 component is itself amixture of phosphate-associated water and choline-associatedbulk-like water. We use an iterative procedure to determine thecorrect ratio between the two types of water. Initially, as givenin Table 2, we take the x ) 2 sample to be 60% choline-associated water and 40% phosphate-associated water, and that
(37) Lawrence, C. P.; Skinner, J. L. J. Chem. Phys. 2002, 117, 8847–8854.
Figure 7. (A) Vibrational decay time constants for the two componentsof the biexponential population decays as a function of wavelength in the0-1 spectral region for the different values of x. (B) Normalized fractionsof the total amplitude for the two components of the biexponential populationdecays as a function of wavelength in the 0-1 spectral region for thedifferent values of x. The dashed lines are guides for the eye. Withinexperimental uncertainty, some of the data sets are wavelength independent,while other data sets display a clear wavelength dependence.
J. AM. CHEM. SOC. 9 VOL. 130, NO. 42, 2008 13933
Water at Surfaces of Multibilayer Model Membranes A R T I C L E S

the choline-associated water has the same transition dipolemoment as that of bulk water. We use the 60/40 ratio and thebulk water x ) 2 transition dipole ratio to obtain a first estimateof the µ2 ratio for choline-associated water to phosphate-associated water. The 60/40 ratio is used to get µ4, which inturn is used to correct the 60/40 initial concentration ratio bymultiplying the A1 value by the µ4 value and then renormalizingthe total of A1 and A2 at x ) 2 since CPh/CCh ) µ4(A1/A2). Theprocedure is repeated until a constant µ2 ratio is reached. Theratio of µ2 is found to be 1.17, and the ratio of µ4 is 1.37.
With the µ4 ratio, the fraction of phosphate-associated waterand choline-associated water for x ) 2 is determined to be 46%and 54%, respectively (see Table 3). Clearly these numbers andthe other numbers presented in Table 3 are approximate becausethey depend on an estimated transition dipole ratio. However,other than the x ) 2 sample, there are two observables, thespectroscopic data (Table 1) and the pump-probe data (Table2), for calculating the concentration ratios, which provide acheck on the validity of the values. The results are containedin Table 3. The concentration fractions are obtained from thepopulation relaxation data in Table 2 by multiplying the A1 valueby 1.37 (µ4) and then renormalizing the total of A1 and A2. Forthe spectroscopic data contained in Table 1, the portion of thex ) 2 fraction that is choline associated (54%) must be addedto the %Ch (bulk-like) fraction. For example, in Table 1, forthe x ) 4 sample, the x ) 2 component is 0.72, 46% of whichis phosphate-associated water. The other 54% is choline-associated. Therefore, 0.72 is multiplied by 0.46 to give 33%phosphate-associated, and the other 67% is choline-associatedwater.
The fractions of phosphate-associated water and choline-associated bulk-like water are presented in Table 3. The fractionsobtained from the two observables are not identical, but aresimilar and follow the same trend, suggesting that the resultsare reasonably accurate. The agreement is obtained using onlythe concentration ratio of the x ) 2 sample from the populationdecay data without adjusting for structural changes that occurat different hydration levels, suggesting that the model basedon two types of water molecules is approximately correct. Thefractions in Table 3 obtained from the population relaxationdata in Table 2 are probably more accurate because the twocomponents of the biexponential decays are relatively straight-forward to obtain, and any error in the values given in Table 3will be predominately caused by the determination of thetransition dipole ratio. The fractions determined from thespectroscopic data also require the transition dipole ratio, butin addition, the broad spectra must be fit with two componentswhich are not evident in the spectra, and then the x ) 2component must be reapportioned.
The trend in Table 3 shows that the fraction of phosphate-associated water decreases and that of choline-associated waterincreases as the hydration level increases. Employing the values
obtained from the pump-probe data, the number of watermolecules increases from approximately 1 to 4 for the phosphate-associated component and from approximately 1 to12 for thecholine-associated component, which is in agreement with theobservation that absorbed water molecules are successivelyaccommodated into spaces between head groups and in theinterbilayer space during stepwise phospholipid hydration.5
Although the water molecules can be divided into two types,the wavelength dependence of the two vibrational lifetimes ata fixed hydration level indicates that a given type of water maystill experience a range of environments. In Figure 7, the slowcholine-associated water component (τ2) has a wavelengthdependence at all water concentrations except the highest. Forτ1, the x ) 4, 6, and 8 do not have a wavelength dependence,which suggests relatively uniform environments for the watermolecules associated with the phosphates. As mentioned above,although there are horizontal lines drawn through the x ) 2and 16 data in Figure 7, these may have a wavelengthdependence, particularly x ) 2. The changes in the vibrationallifetimes with hydration level demonstrate that the structuresare dependent on the number of water molecules associated witha lipid molecule.
3.3. Orientational Relaxation. The orientational anisotropydecay is obtained from the pump-probe data using eq 2.Because the experiments are conducted on the OD stretch ofHOD using low concentration HOD in H2O, the measurementsdetermine the orientational relaxation of the HOD moleculesdirectly. The experiment measures the time-dependent changein the direction of the OD bond vector and avoids problemsassociated with studying pure H2O or pure D2O. In previousstudies, measurements were made on water in DMPC “mem-brane fragments” using either pure H2O or D2O.17,18 Excitationtransport from one molecule to another can be a source ofanisotropy decay. In addition, because H2O and D2O havesymmetric and antisymmetric stretching modes, which havetransition dipoles that point in different directions relative tothe molecular frame, relaxation between these two modes willcause anisotropy decay and may produce fast components inthe population relaxation. Nonetheless, these interesting studiesreported that water associated with the membrane fragmentsexists in heterogeneous environments and that orientationalrelaxation is very slow at very low hydration levels.17,18
Figure 8 displays the anisotropy decays for the bilayers, x )2, 4, 6, 8, and 16 and for bulk water taken at the center frequencyof the absorption spectrum of each sample. In addition, fits to
Table 3. Percentages of Phosphate-Associated Water Molecules(Ph%) and Choline-Associated Bulk-Like Water Molecules (Ch%)Determined from the Spectroscopic (spec) Data in Table 1 and thePump-probe (p-p) Population Relaxation Data in Table 2 forDifferent Numbers of Water Molecules Per Lipid (x)
x Ph% (p-p) Ch% (p-p) Ph% (spec) Ch% (spec)
2 46 544 42 58 33 676 36 64 28 728 30 70 19 8116 24 76 13 87
Figure 8. Anisotropy decays (orientational relaxation) of the OD stretchof HOD in H2O in bilayers for various numbers of waters per lipid, x, andbulk water. As x decreases, the population relaxation slows. The solid curvesare biexponential fits to the data except for bulk water, which is a singleexponential.
13934 J. AM. CHEM. SOC. 9 VOL. 130, NO. 42, 2008
A R T I C L E S Zhao et al.
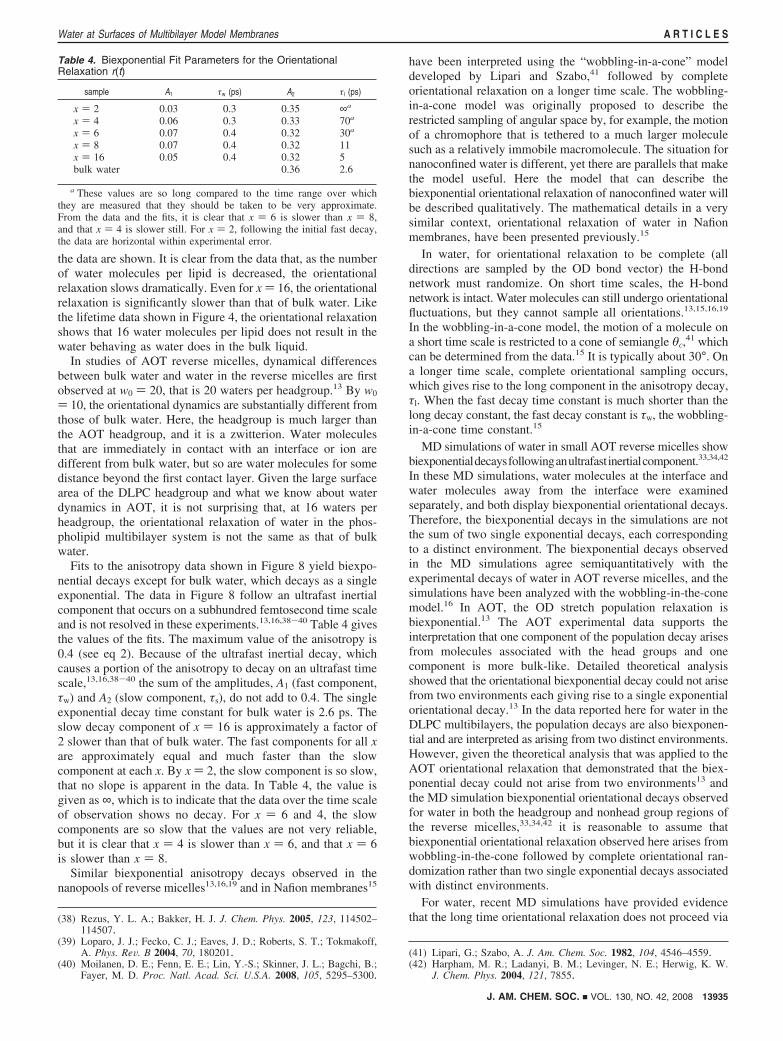
the data are shown. It is clear from the data that, as the numberof water molecules per lipid is decreased, the orientationalrelaxation slows dramatically. Even for x ) 16, the orientationalrelaxation is significantly slower than that of bulk water. Likethe lifetime data shown in Figure 4, the orientational relaxationshows that 16 water molecules per lipid does not result in thewater behaving as water does in the bulk liquid.
In studies of AOT reverse micelles, dynamical differencesbetween bulk water and water in the reverse micelles are firstobserved at w0 ) 20, that is 20 waters per headgroup.13 By w0
) 10, the orientational dynamics are substantially different fromthose of bulk water. Here, the headgroup is much larger thanthe AOT headgroup, and it is a zwitterion. Water moleculesthat are immediately in contact with an interface or ion aredifferent from bulk water, but so are water molecules for somedistance beyond the first contact layer. Given the large surfacearea of the DLPC headgroup and what we know about waterdynamics in AOT, it is not surprising that, at 16 waters perheadgroup, the orientational relaxation of water in the phos-pholipid multibilayer system is not the same as that of bulkwater.
Fits to the anisotropy data shown in Figure 8 yield biexpo-nential decays except for bulk water, which decays as a singleexponential. The data in Figure 8 follow an ultrafast inertialcomponent that occurs on a subhundred femtosecond time scaleand is not resolved in these experiments.13,16,38-40 Table 4 givesthe values of the fits. The maximum value of the anisotropy is0.4 (see eq 2). Because of the ultrafast inertial decay, whichcauses a portion of the anisotropy to decay on an ultrafast timescale,13,16,38-40 the sum of the amplitudes, A1 (fast component,τw) and A2 (slow component, τs), do not add to 0.4. The singleexponential decay time constant for bulk water is 2.6 ps. Theslow decay component of x ) 16 is approximately a factor of2 slower than that of bulk water. The fast components for all xare approximately equal and much faster than the slowcomponent at each x. By x ) 2, the slow component is so slow,that no slope is apparent in the data. In Table 4, the value isgiven as ∞, which is to indicate that the data over the time scaleof observation shows no decay. For x ) 6 and 4, the slowcomponents are so slow that the values are not very reliable,but it is clear that x ) 4 is slower than x ) 6, and that x ) 6is slower than x ) 8.
Similar biexponential anisotropy decays observed in thenanopools of reverse micelles13,16,19 and in Nafion membranes15
have been interpreted using the “wobbling-in-a-cone” modeldeveloped by Lipari and Szabo,41 followed by completeorientational relaxation on a longer time scale. The wobbling-in-a-cone model was originally proposed to describe therestricted sampling of angular space by, for example, the motionof a chromophore that is tethered to a much larger moleculesuch as a relatively immobile macromolecule. The situation fornanoconfined water is different, yet there are parallels that makethe model useful. Here the model that can describe thebiexponential orientational relaxation of nanoconfined water willbe described qualitatively. The mathematical details in a verysimilar context, orientational relaxation of water in Nafionmembranes, have been presented previously.15
In water, for orientational relaxation to be complete (alldirections are sampled by the OD bond vector) the H-bondnetwork must randomize. On short time scales, the H-bondnetwork is intact. Water molecules can still undergo orientationalfluctuations, but they cannot sample all orientations.13,15,16,19
In the wobbling-in-a-cone model, the motion of a molecule ona short time scale is restricted to a cone of semiangle θc,41 whichcan be determined from the data.15 It is typically about 30°. Ona longer time scale, complete orientational sampling occurs,which gives rise to the long component in the anisotropy decay,τl. When the fast decay time constant is much shorter than thelong decay constant, the fast decay constant is τw, the wobbling-in-a-cone time constant.15
MD simulations of water in small AOT reverse micelles showbiexponentialdecaysfollowinganultrafastinertialcomponent.33,34,42
In these MD simulations, water molecules at the interface andwater molecules away from the interface were examinedseparately, and both display biexponential orientational decays.Therefore, the biexponential decays in the simulations are notthe sum of two single exponential decays, each correspondingto a distinct environment. The biexponential decays observedin the MD simulations agree semiquantitatively with theexperimental decays of water in AOT reverse micelles, and thesimulations have been analyzed with the wobbling-in-the-conemodel.16 In AOT, the OD stretch population relaxation isbiexponential.13 The AOT experimental data supports theinterpretation that one component of the population decay arisesfrom molecules associated with the head groups and onecomponent is more bulk-like. Detailed theoretical analysisshowed that the orientational biexponential decay could not arisefrom two environments each giving rise to a single exponentialorientational decay.13 In the data reported here for water in theDLPC multibilayers, the population decays are also biexponen-tial and are interpreted as arising from two distinct environments.However, given the theoretical analysis that was applied to theAOT orientational relaxation that demonstrated that the biex-ponential decay could not arise from two environments13 andthe MD simulation biexponential orientational decays observedfor water in both the headgroup and nonhead group regions ofthe reverse micelles,33,34,42 it is reasonable to assume thatbiexponential orientational relaxation observed here arises fromwobbling-in-the-cone followed by complete orientational ran-domization rather than two single exponential decays associatedwith distinct environments.
For water, recent MD simulations have provided evidencethat the long time orientational relaxation does not proceed via(38) Rezus, Y. L. A.; Bakker, H. J. J. Chem. Phys. 2005, 123, 114502–
114507.(39) Loparo, J. J.; Fecko, C. J.; Eaves, J. D.; Roberts, S. T.; Tokmakoff,
A. Phys. ReV. B 2004, 70, 180201.(40) Moilanen, D. E.; Fenn, E. E.; Lin, Y.-S.; Skinner, J. L.; Bagchi, B.;
Fayer, M. D. Proc. Natl. Acad. Sci. U.S.A. 2008, 105, 5295–5300.
(41) Lipari, G.; Szabo, A. J. Am. Chem. Soc. 1982, 104, 4546–4559.(42) Harpham, M. R.; Ladanyi, B. M.; Levinger, N. E.; Herwig, K. W.
J. Chem. Phys. 2004, 121, 7855.
Table 4. Biexponential Fit Parameters for the OrientationalRelaxation r(t)
sample A1 τw (ps) A2 τl (ps)
x ) 2 0.03 0.3 0.35 ∞a
x ) 4 0.06 0.3 0.33 70a
x ) 6 0.07 0.4 0.32 30a
x ) 8 0.07 0.4 0.32 11x ) 16 0.05 0.4 0.32 5bulk water 0.36 2.6
a These values are so long compared to the time range over whichthey are measured that they should be taken to be very approximate.From the data and the fits, it is clear that x ) 6 is slower than x ) 8,and that x ) 4 is slower still. For x ) 2, following the initial fast decay,the data are horizontal within experimental error.
J. AM. CHEM. SOC. 9 VOL. 130, NO. 42, 2008 13935
Water at Surfaces of Multibilayer Model Membranes A R T I C L E S

small step Gaussian diffusion.43 The MD simulations of Laageand Hynes highlighted the well established tetrahedral natureof the H-bond network of water.43 On the basis of this physicalpicture for the microscopic structure of water, Laage and Hynesfound that the orientational motions of water molecules are betterdescribed by a jump reorientation model based on Ivanov’sapproach,44 in which the jumps correspond to the rearrangementof hydrogen bonds among water molecules43 or water moleculesand ions.45 Complete orientational randomization of the hy-droxyl transition dipole can not only involve many infinitesimalrandom steps but must also involve the breaking and formingof hydrogen bonds. Energetic considerations show that a watermolecule will not break a hydrogen bond without virtuallyimmediately forming a new hydrogen bond.46 The MD simula-tions show that the H-bond switching process involves thetransient formation of a bifurcated hydrogen bond to reducethe energetic penalty for switching hydrogen bond partners. Thisbifurcated hydrogen bond is the transition state in the largeamplitude orientational jump that leads to the formation of anew local H-bond configuration.43 In the simulation, the averageangular amplitude of the jump was determined to be ∼60°. Thisis far from the diffusive limit, yet this model produces a singleexponential decay for the orientational correlation function(anisotropy),43,44 that is, a single exponential decay for the slowcomponent in the orientational relaxation observed here. It isnot possible to experimentally determine the jump angles inbulk water and in nanoconfined water systems, but jump anglesin the range of 60° to 70°, which should occur in water andwater-ion systems,43,45 lead to values for the jump time thatare close to but not identical to the measured long time decayconstant, τl.15 In bulk water, the jumps occur between differentwater H-bond configurations. In DLPC multibilayer system, thehydroxyls can be bound to other water molecules or to ions.Therefore, jumps can occur that involve reformation of the localH-bond structure involving water-water bonds and water-ionbonds.45
The wobbling-in-a-cone followed by jump reorientationmodel is useful for understanding the trends displayed in Figure8 and Table 4. On a short time scale, the fast component of theorientational anisotropy decay reflects the sampling of a rangeof angular space that occurs without breaking and reforminghydrogen bonds. Thermal energy causes orientational fluctua-tions within an intact hydrogen bond potential energy well. Thelong component is caused by jump reorientation. The samemodel has been applied to the orientational relaxation of waterin very concentrated salt solutions.47 As mentioned above, theorientational relaxation can involve breaking hydrogen bondsto an ion as well as to other water molecules.45,47 Hydrogenbond rearrangement is a concerted process with each jumpreorientation event involving a number of water molecules. Eachevent should not be viewed as consisting of a hydrogen bondbreaking and leaving a vacant hydrogen bonding site, but rathera more or less global restructuring of the local network.43 At x) 16, there is a sufficiently large number of water moleculesto allow a substantial H-bonding network to form, making
concerted jump reorientation relatively fast. Jump reorientationin the hydrated bilayers is still slower than bulk water, however,because interactions with the ions and topological restrictionsimposed by the membrane surface limit the extent and flexibilityof the H-bonding network.
As the water content is decreased, fast angular sampling ofa H-bonding configuration (wobbling-in-a-cone) is still possible,but jump reorientation becomes increasingly difficult. For x )2, there is approximately one water associated with thephosphate and one with the choline. Jump reorientation becomeshighly unfavorable, and the rate of orientational relaxationbecomes so long that it is undetectable with the currentexperiments. For x ) 4, there are about 2 water moleculesassociated with the phosphates and two with the cholines, andthe beginning of a H-bonding network becomes possible.Orientational relaxation is still very slow, but detectable. Asthe number of waters per lipid increases, the H-bonding networkgrows, and complete orientational relaxation becomes increas-ingly fast.
4. Concluding Remarks
In this paper we report polarization- and frequency-selectedultrafast IR pump-probe experiments and FT-IR absorptionmeasurements on the OD stretching mode of HOD in H2O inaligned DLPC phospholipid multibilayers. Both the OD stretchvibrational population relaxation and the water orientationalrelaxation were measured as a function of water content, x, from2 to 16 water molecules per lipid. The results were comparedto the same experiments on bulk water. The aligned bilayersprovide a well-defined model membrane and at the same timegive sufficient water absorption to make the isotopically diluteexperiments possible.
The FT-IR spectra of the OD stretch display an increasinglylarge red-shift relative to bulk water as x decreases (Figure 2).The peak position and shape of the spectra can be fit using atwo-component model consisting of the x ) 2 spectrum (verylow water content) and the bulk water spectrum (Figure 3). Thevibrational population decays slow substantially as the watercontent of the bilayers is reduced (Figure 4). The pump-probedata display biexponential decays for all x, in contrast to bulkwater, where the OD stretch population relaxation is a singleexponential (Figures 5-7). The biexponential decays combinedwith the two-component fits of the water spectra support themodel that water is associated with the bilayers in two distinctenvironments,8,11 that is phosphate-associated waters and cho-line-associated waters. Using the pump-probe data and the FT-IR data, it is possible to estimate the number of water moleculesin each environment as a function of x (Table 3).
The orientational relaxation (Figure 8, Table 4) shows adramatic slowing as the water content of the bilayers isdecreased. The orientational relaxations at all x fit well to abiexponential. It is proposed that the fast component arises fromorientational fluctuations that occur with the H-bonding networkintact. The slow component, which leads to complete orienta-tional randomization, requires a rearrangement of the H-bondingnetwork. The orientational relaxation is discussed in terms of acombined wobbling-in-a-cone41 and jump reorientation43,45
model.15 On a time scale in which the H-bonding network isintact, the orientational motion is constrained by the angularpotential determined by the local H-bonding network.40 On alonger time scale, concerted H-bond rearrangement producesorientational jumps that eventually result in complete orienta-tional randomization. As the water content of the bilayers is
(43) Laage, D.; Hynes, J. T. Science 2006, 311, 832–835.(44) Ivanov, E. N. SoV. Phys. JETP 1964, 18, 1041–1045.(45) Laage, D.; Hynes, J. T. Proc. Natl. Acad. Sci. U.S.A. 2007, 104, 11167–
11172.(46) Eaves, J. D.; Loparo, J. J.; Fecko, C. J.; Roberts, S. T.; Tokmakoff,
A.; Geissler, P. L. Proc. Natl. Acad. Sci. U.S.A. 2005, 102, 13019–13022.
(47) Park, S.; Fayer, M. D. Proc. Natl. Acad. Sci. U.S.A. 2007, 104, 16731–16738.
13936 J. AM. CHEM. SOC. 9 VOL. 130, NO. 42, 2008
A R T I C L E S Zhao et al.

decreased, it becomes increasingly difficult for concerted H-bondrearrangement to occur. To reduce the energetic price paid forbreaking a hydrogen bond, a new hydrogen bond must beformed. At very low water content, there are no new H-bondacceptors available so H-bond switching is slowed. This isevident in the anisotropy decay for x ) 2. Following the fastwobbling, no slow orientational relaxation occurred on the timescale of the experiment, indicating a lack of H-bond switchingevents.
These experiments have implication for the behavior of waterin biological systems, particularly water at the surfaces of cellmembranes. The biexponential population decays show thatthere are at least two distinct types of water environments, andthe differences in the environments persist even as the hydrationlevel of the membranes increases. At the lowest hydration levels,waters are associated with the ionic portions of the head groups,and as shown by the orientational relaxation, the structuralrearrangement of the water molecules is very slow. However,as the amount of water increases, the ability of the water torestructure increases substantially. By 16 water molecules perheadgroup, the orientational relaxation time is only a factor of2 slower than that of bulk water. Membranes of adjacent cellsare separated by a few tens of nanometers.48-50 If the spacebetween cells contained only water, this separation is sufficientfor water well removed from the cell membrane surfaces tobehave like bulk water. However, the regions between cells are
generally crowded with a variety of relatively large biologicalmolecules.48,49 Therefore, in spite of the relatively largeseparation between cell membranes, the combination of theinteraction of water with the membranes and with the intercel-lular biomolecules could result in little, if any, of the waterbehaving like bulk water.
Future experiments will explore the orientational relaxationin more detail to obtain information on the cone angles andjump times. In addition, analysis of orientational relaxation datacan provide information about the angular potential that governsorientational relaxation.40 The chemical composition of thebilayers will be changed by, for example, adding cholesterol.27
Ultrafast 2D-IR vibrational echo spectroscopy will also beemployed to study the dynamics of water in the bilayers.13,47
The 2D-IR vibrational echo experiment measures spectraldiffusion, which provides a direct probe of the time-dependentstructural evolution of water.46,51-54
Acknowledgment. This work was supported by the Departmentof Energy (DE-FG03-84ER13251), the National Institutes of Health(2-R01-GM061137-09), and the National Science Foundation(DMR 0652232). D.E.M. thanks the NDSEG for a fellowship.
JA803252Y
(48) Aricescu, A. R.; Siebold, C.; Choudhuri, K.; Chang, V. T.; Lu, W.;Davis, S. J.; van der Merwe, P. A.; Jones, E. Y. Science 2007, 317,1217–1220.
(49) He, W.; Cowin, P.; Stokes, D. L. Science 2003, 302, 109–113.(50) Rambourg, A.; Leblond, C. P. J. Cell. Biol. 1967, 32, 27–53.
(51) Fecko, C. J.; Eaves, J. D.; Loparo, J. J.; Tokmakoff, A.; Geissler,P. L. Science 2003, 301, 1698–1702.
(52) Fecko, C. J.; Loparo, J. J.; Roberts, S. T.; Tokmakoff, A. J. Chem.Phys. 2005, 122, 054506-054518.
(53) Asbury, J. B.; Steinel, T.; Kwak, K.; Corcelli, S.; Lawrence, C. P.;Skinner, J. L.; Fayer, M. D. J. Chem. Phys. 2004, 121, 12431–12446.
(54) Asbury, J. B.; Steinel, T.; Stromberg, C.; Corcelli, S. A.; Lawrence,C. P.; Skinner, J. L.; Fayer, M. D. J. Phys.Chem. A 2004, 108, 1107–1119.
J. AM. CHEM. SOC. 9 VOL. 130, NO. 42, 2008 13937
Water at Surfaces of Multibilayer Model Membranes A R T I C L E S