Embed Size (px)
Citation preview

i
Water and Wastewater Management in Local Government:
Skills Needs and Development
Final Report Part II
To
The Local Government Sector Education and Training (LGSETA)
Ochieng Aoyi1, Maurice Onyango2, Thokozani Majozi3, Esmail Seid3, Taile Leswifi2, Sophia
Rwanga1, John Kesi4
1Centre for Renewable Energy and Water, Vaal University of Technology
2Department of Chemical and Metallurgical Engineering, Tshwane University of
Technology,
3School of Chemical and Metallurgical Engineering, University of the Witwatersrand
4 University of Johannesburg

ii
Executive summary
Conventional and advanced wastewater treatment methods
Wastewater treatment has experienced many challenges in the recent years. On the one hand this
has been due to the stringent environmental laws governing discharge limits, and on the other hand
it is due to the emerging contaminants that do not lend themselves to the conventional treatment
methods. The response to these challenges has been an effort to develop more robust but low-cost
treatment methods. To obtain an optimal balance between cost and robustness, a lot of scientific
and engineering work needs to be done to exploit the competencies at the interface of the relevant
disciplines. In this regard, there are several approaches that have been employed in recently, of
which there are two main ones. The first one is the integration of conventional methods
(biodegradation) with advanced ones (advanced oxidation processes). The other one is the process
intensification. Previous research has shown that integrating biological process with heterogeneous
photocatalysis improves the performance of anaerobic digesters (AD). Further, the performance of
the integrated systems can be improved through reactor choice and process intensification, in which
individual reactors are optimized. Fluidized bed reactors (FBR) are of special interest due to the
fact that they have high performance for multiphase operations such as heterogeneous photocatalytic
degradation of biorecalcitrant wastewater.
Photocatalysis has been considered as a rapid process for degrading recalcitrant organic
contaminants in wastewater. Titanium dioxide has been widely applied as an appropriate
photocatalyst due to its high activity. In many cases the TiO2 has been used in slurry or suspension
during photocatalysis. However, the problem of applying TiO2 in slurry form has been the difficulty
in separating it from the treated effluent since it does not settle but remains in suspension
Acid Mine drainage Acid mine drainage is considered as one of the main pollutants of water in many countries that have
historic or current mining activities. Although any mineral deposit contains sulphide is a potential
source of AMD, certain types of mining are more prone than the others. There are records of acid
mine drainage where coal, pyritic Sulphur, copper, zinc, silver and lead among others have been
mined. Acid mine drainage is produced by the oxidative dissolution of sulphide minerals in the
presence of oxygen and water. Treatment methods currently used in South Africa are reverse osmosis
and neutralization method. Waste sludge and brine are produced, depending on level of treatment,
requiring disposal.

3
Economic sustainability and technical feasibility become key drivers in determining the sustainability
of any proposed method or system for any application. Recovery of sulphuric acid from acid mine
drainage is thought to be economically sustainable process of reducing the environmental impact of
acid mine drainage. The recovery of sulphuric acid process will be integrated with adsorption
techniques for the removal of metals and heavy metals.
Water Energy Nexus
Whilst the concept of water-energy nexus is inherent in most systems, it has been ignored for many
years, thereby leading to missed opportunities. In the past, energy and water systems have been
developed and managed independently. Water plays a critical role in the generation of electricity and
energy is required to treat and distribute water. This has been true for many decades, but the water
and energy systems have investigated and developed independently. Recent trends have focused on
looking at the connections that exist between water and energy in industries for sustainable operation.
Global shortages of energy and water have rendered comprehensive approaches to water and energy
optimization even more important than ever before, hence the work presented in this report.Process
industries have recently committed and allocated resources to mitigating the detrimental impact on
the environment due to their activities. They have made significant progress, in conserving resources,
and reducing the intensity of energy usage. These efforts have gradually shifted from a unit-based
approach to a systems-level paradigm. Process integration is a holistic approach to process design
and operation which emphasizes the unity of the process. Process integration design tools have been
developed over the past two decades to attain process improvement, productivity enhancement,
conservation in mass and energy resources, and reductions in the operating and capital costs of
chemical processes. This technique has been successfully applied in many industries world-wide and
particularly in Europe and USA. In the case of USA processing industries, the amount of reuse and
recycle of wastewater has been tremendous - gross water use to water intake ratios exceed 7.5 in
petroleum refining and 3 in chemical production. The gross water is the amount of water that would
have to be used if there was no reuse and recycle.
Recently, process integration techniques have been applied in a South African main power plant
with the objective of reducing the water intake. This objective can be achieved by identifying water
sources (providers) and sinks (users) in the water network, followed by matching appropriate
sources and sinks as water quality allows. The water network, therefore, first has to be compiled
and flow and quality data can subsequently be allocated to process units in the network. The process
integration tool showed savings of between 4% and 13% of the water intake by changing the way
water is currently utilized and reused at the station. Management of the cooling cycle, and especially
blowdown water, together with related procedures have a significant impact on the amount of

4
freshwater intake and are responsible for the bulk of the possible savings identified by the work
since most of water used at the station is supplied to the cooling towers. Optimization of water
utilization in the power station has a direct impact on the amount of waste produced, which translates
into at least 50% (or more) reduction in wastewater management costs. This is mainly due to savings
in freshwater consumption.
Skills Gap
AMD and recalcitrant pollutant: Skill are needed to implement cutting-edge technologies to address
emerging contaminants including AMD, which pose problems to both water and wastewater
treatment systems. In South Africa management of AMD, pharmaceutical wastes and other
biorecalcitrant wastes need urgent attention. The skill requirements for the processes that manage
such wastes include, the use of membranes, photocatalysis and adsorption techniques. There are a
few Universities in South Africa including University of Stellenbosch, University of the
Witwatersrand and the Vaal University of technology that have developed membrane techniques for
AMD remediation and advanced oxidation processes. However, these skills have not been transferred
to the people who need them most; local government and industries.
Process integration: To address the problem of emerging contaminants, there are two approaches that
define the trajectory of the research path that adds value to life. The first one is the use of wastes or
low-cost materials as feedstock for energy production. This approach is often described as waste
beneficiation. In recent years, the efficiency of many processes has been enhanced by the use of nano-
modified materials. The second approach involves the integration of the conventional energy
production processes with advanced ones to improve production. The application of process
integration in wastewater treatment is an area that has not been developed in many engineering
curriculum in South Africa.
Sustainable Process Engineering: Water management is largely about striking balance between demand
and supply. Sustainable Process Engineering (SPE) is one of the emerging technologies, which
optimizes the use of water, still needs a lot of skill development. It is important to note that the
National Research Foundation/Department of Science Technology Chair in SPE at the University of
the Witwatersrand is the only research group that develops and applies process integration tools for
wastewater minimization in process industries. The SPE technology is aimed at reducing water
consumption and hence reduces water demand.

5
EXECUTIVE SUMMARY ............................................................................................................................................. II
CONVENTIONAL AND ADVANCED WASTEWATER TREATMENT METHODS ....................................................................................... II
ACID MINE DRAINAGE .............................................................................................................................................. II
WATER ENERGY NEXUS .....................................................................................................................................................III
SKILLS GAP..................................................................................................................................................................... IV
CHAPTER 1 ............................................................................................................................................................... 2
1. WASTEWATER TREATMENT ............................................................................................................................. 2
1.1 INTRODUCTION ................................................................................................................................................... 2
1.2 WASTEWATER CHARACTERISTICS ............................................................................................................................ 3
1.3 PRE-TREATMENT ................................................................................................................................................. 4
1.4 BIOLOGICAL METHODS.......................................................................................................................................... 6
Biofilters ..................................................................................................................................................... 6
Aerobic processes ...................................................................................................................................... 7
Anaerobic digestion ................................................................................................................................... 8
1.5 CONVENTIONAL WASTEWATER TREATMENT METHODS .............................................................................................. 11
Modern trends in wastewater management ........................................................................................... 11
Capital and operating cost ....................................................................................................................... 12
Effluent discharge limits ........................................................................................................................... 13
Sustainability ............................................................................................................................................ 14
1.6 CONVENTIONAL WASTEWATER TREATMENT METHODS .............................................................................................. 15
Characteristics of the wastewater ........................................................................................................... 15
Treatment methods ................................................................................................................................. 19
Water/wastewater management policies and regulations ..................................................................... 21
Sustainability ........................................................................................................................................... 25
Evaluation of emerging water/wastewater treatment technologies ...................................................... 26
Skill needs................................................................................................................................................. 28
Conclusion and recommendations ........................................................................................................... 30
REFERENCES........................................................................................................................................................... 31
CHAPTER 2 ............................................................................................................................................................. 33
ACID MINE DRAINAGE ................................................................................................................................... 33
2.1 INTRODUCTION ................................................................................................................................................. 33
Occurrence and composition of acid mine drainage ................................................................................ 34
Environmental impact of acid mine drainage .......................................................................................... 36
Management approach to remediation................................................................................................... 36
Emerging trends and challenges .............................................................................................................. 41
Skills development.................................................................................................................................... 42
Conclusions............................................................................................................................................... 43
REFERENCES ..................................................................................................................................................... 44
CHAPTER 3 ............................................................................................................................................................. 46
ADVANCED OXIDATION PROCESS .................................................................................................................. 46
3.1 INTRODUCTION ................................................................................................................................................. 46
3.2 APPLICATION OF PHOTODEGRADATION TECHNIQUES................................................................................................. 46
Photodegradation of pharmaceutical waste ........................................................................................... 47
Monthly solar irradiation data ................................................................................................................. 48
Photodegradation ofemerging contaminants.......................................................................................... 48
3.3 CONCLUSION .................................................................................................................................................... 51
REFERENCES........................................................................................................................................................... 52

6
CHAPTER 4 ............................................................................................................................................................. 53
EMERGING CHALLENGES ............................................................................................................................... 53
4.1 INTRODUCTION ................................................................................................................................................. 53
4.2 EMERGING CONTAMINANTS................................................................................................................................. 53
Textile industry wastewater ..................................................................................................................... 54
Emerging pharmaceutical contaminants ................................................................................................. 54
Acid mine drainage treatment using adsorption method ........................................................................ 55
Other emerging pollutants in wastewater and sewage treatment plants ............................................... 56
4.3 EMERGING TREATMENT TECHNOLOGIES ................................................................................................................. 57
Integrated adsorption and photodegradation ......................................................................................... 58
Integrated photodegradation, adsorption and biodegradation (IPB) ...................................................... 58
4.4 CONCLUSION .................................................................................................................................................... 62
REFERENCES........................................................................................................................................................... 64
CHAPTER 5 ............................................................................................................................................................. 65
WATER RE-USE .............................................................................................................................................. 65
5.1 INTRODUCTION ................................................................................................................................................. 65
Water-energy nexus concept ................................................................................................................... 65
Background on water-energy nexus ........................................................................................................ 66
Process integration .................................................................................................................................. 67
Examples of industrial applications of process integration tools ............................................................. 71
Case study: Water management through process integration in a coal fired Power Station .................. 71
5.2 METHODOLOGY ................................................................................................................................................ 75
Data gathering and analysis .................................................................................................................... 75
Modelling ................................................................................................................................................. 80
5.3 RESULTS AND DISCUSSION ................................................................................................................................... 83
Model that optimizes the water utilization network................................................................................ 83
With regeneration/desalination plant ..................................................................................................... 87
Without regenerator/desalination plant ................................................................................................. 89
With regeneration/desalination plant ..................................................................................................... 90
Further discussion .................................................................................................................................... 96
Selected cost benefit analysis................................................................................................................... 97
5.4 CONCLUSIONS AND RECOMMENDATIONS ............................................................................................................... 98
5.5 ACTION PLAN.................................................................................................................................................. 100
REFERENCES......................................................................................................................................................... 101
CHAPTER 4 ........................................................................................................................................................... 102
SKILL GAP .................................................................................................................................................... 102
6.1 WATER ENGINEERS .......................................................................................................................................... 102
6.2 WATER TECHNICIANS ....................................................................................................................................... 102
6.3 WATER MANAGEMENT INSPECTORS .................................................................................................................... 103
6.4 PROCESS INTEGRATION PRACTITIONERS AND SKILLS GAP IN SOUTH AFRICA .................................................................. 103
6.5 CONCLUSION AND WAY FORWARD ...................................................................................................................... 103
Conclusions............................................................................................................................................. 103
Way forward .......................................................................................................................................... 104
REFERENCES......................................................................................................................................................... 105

vii
List of Figures
Figure 1 Distribution map of the wastewater plants. .............................................................................................. 3
Figure 2 Feed stream into wastewater treatment plant ........................................................................................... 5
Figure 3 Flocculation unit (pond) ........................................................................................................................ 5
Figure 4 Settling tank (Carolina) ......................................................................................................................... 5
Figure 5 Stages of different biological processes,.................................................................................................. 6
Figure 6 Biofilter unit at XFSA ........................................................................................................................... 7
Figure 7 Aeration process, Plant XFSA ............................................................................................................... 7
Figure 8 Schematic diagram of anaerobic digestion process. .................................................................................. 8
Figure 9 Anaerobic digesters, Plant XFSA ........................................................................................................... 9
Figure 10 Generation of electricity from biogas, Plant XEC .................................................................................. 9
Figure 11 Treated wastewater, Plant XFSA. ....................................................................................................... 10
Figure 12 Effluent from an underperforming treatment plant (Plant XAMP) ......................................................... 11
Figure 13 F Animals in holding pens................................................................................................................ 17
Figure 14 Water used for cleaning holding pens. ....................................................................................... 18
Figure 15: Acid neutralization plant, mixing tank. .............................................................................................. 39
Figure 16: Aeration tank. ............................................................................................................................. ..... 40
Figure 17: Reverse osmosis .............................................................................................................................. 41
Figure 18: Monthly solar radiation for May to November 2012 at VUT ................................................................ 48
Figure 19 Battery of solar reactors in use .......................................................................................................... 49
Figure 20 Solar simulator, research progress. .................................................................................................... 50
Figure 21 Photodegradation of SMX with a decrease in solution pH.................................................................... 51
Figure 22: Integrated biological and photodegradation ........................................................................................ 60
Figure 23: Overall COD reduction for the integrated system................................................................................ 61
Figure 24 Hybrid diagram of 2011 US interconnected water and energy flows ...................................................... 67
Figure 25 Reuse of water from one process to another ........................................................................................ 69
Figure 26. Reuse with regeneration ................................................................................................................... 70
Figure 27 Recycling with regeneration .............................................................................................................. 70
Figure 28 The diagram developed served as the basis for further development of the GAMS model........................ 76
Figure 29 Superstructure for the mathematical model ......................................................................................... 80
Figure 30 Cost allocation when brine is being disposed of in a landfill ................................................................ 93
Figure 31. Alternative treatment cost allocation for Desalination plant ................................................................. 95

8
List of Tables
Table 1 Wastewater characteristics ..................................................................................................................... 4
Table 2 Effluent discharge limits ....................................................................................................................... 14
Table 3. Types and amount of wastes from an animal unit at red meat abattoirs. .................................................. 16
Table 4 Water uses ratings............................................................................................................................... 19
Table 5. Waswastewater treatment unit operations and processes at red. .............................................................. 21
Table 6. Upper limits for wastewater discharge MWWTP .................................................................................. 23
Table 7 Industries and their potential pollutants ................................................................................................. 56
Table 8 Industries and pollutants (organic) ........................................................................................................ 57
Table 9 . Industrial application of process integration tools.................................................................................. 71
Table 10 Identified variables, sources and sinks ................................................................................................. 77
Table 11 Stream values and qualities ................................................................................................................. 79
Table 12 Senarios modeled ............................................................................................................................. .. 85
Table 13 Minimum Freshwater usage for respective scenario's without a desalination plant ................................... 86
Table 14 Minimum freshwater usage for respective scenarios with a desalination plant ......................................... 87
Table 15. Minimum combined freshwater usage and waste without a desalination plant ........................................ 89
Table 16 Minimum combined freshwater usage and waste with a desalination plant .............................................. 91
Table 17. Minimum cost while waste can be disposed of on ash dams. ...................................................... 92
Table 18. Minimum cost when disallowing any wastewater ............................................................................... 94
Table 19. Minimum cost with brine treatment incorporated in treatment costs....................................................... 96
Table 20. Example Stream flows and qualities ................................................................................................. 115

9
Acronyms
Acronyms
AD Anaerobic Digestion
AOPs Advanced Oxidation Processes
BOD Biochemical Oxygen Demand
CBZ Carbamazepine
COD: Chemical Oxygen Demand
DBSA Development Bank Of Southern Africa
DCF Diclofenac
DON Dissolved Organic Nitrogen
DRWH Domestic Rainwater Harvesting
DWA Department of Water Affairs
DWAF Department of Water Affairs And Forest
EDCs Endocrine Disrupting Compounds
FBB: Fluidized Bed Bioreactor
GIS Geographical Information System
HRT Hydraulic Retention Time
ISBD In Situ Biological Denitrification
ISRM In Situ Redox Manipulation: ISRM
LCFAs Low Carbon Fatty Acids
LPM Litres Per Minute MB
Methelyne Blue
MWW: Molasses Wastewater
NGDB National Groundwater Database
NSAIDs Non-Steroidal Anti-Inflammatory Drugs
NWP North West Province
NWP-SOER North West Province Environmental Outlook
PAC Powdered Activated Carbon
PPCPs Pharmaceutical and Personal Care Products

10
PRBs Permeable Reactive Barriers
RWH Rainwater Harvesting
SAWS South African Weather Services
SEM Scanning Electron Microscopy
LGSETA Local Government Sector Education And Training Authority
SMX Sulfamethoxazole
TiO2 Titanium (IV) Oxide
TOC Total Organic Carbon
UKZN University of Kwazulu Natal
US University of Stellenbosch
UV Ultraviolet
VUT Vaal University of Technology
WC Water Conservation
WDM Water Management Demand
WH Water Harvesting
WRC Water Research Commission
WSA Water Service Authorities
WSLG Water Sector Leadership Group
WSP Water Services Providers
WWTPs Wastewater Treatment Plants
CPU Condensate Polishing Units
PA Pinch Analysis
MEN Mass Exchange Network
CMB Central Monitoring Basin
HCSD High Concentration Slurry Disposal
BMCR Boiler Maximum Continuous Rating
ETP Effluent Treatment Plant ,
GAMS General Algebraic Modelling System
ZLED Zero Liquid Effluent Discharge
OD Oxygen Demand
AU Animal Unit

11
CARA Conservation of Agricultural Resource Act
POU Point Of Use
SIPP Silver-Impregnated Porous Pot Filter
CWF Ceramic Water Filter
PLWH People Living With The Human Immunodeficiency Virus
UF Ultra Filtration
CBOs Community-Based Organizations
1

1
Acknowledgement
Part of the data presented in this work is from the Masters work done by Mr Seth Apollo, Mr
John Akach and Mr John Kesi.

2
CHAPTER 1
1. Wastewater treatment
1.1 Introduction
Over the years technologies and industrial products have changed and hence the characteristics of
the resulting wastewater. Consequently, design works must include systems that can treat non-
traditional constituents. Public concerns over the presence of trace organic chemicals in water are
accelerating the application of advanced treatment technologies to remove objectionable
compounds from wastewater. Although there is reasonable certainty that the removal of trace
organic compounds will be needed, the timing, the specific compounds or classes of compounds
that will require removal, and the technologies that will be needed, are unknown. Going forward,
planning strategies might include leaving space on the plant site and in the hydraulic profile based
on the technologies that we now know can remove some trace organics, including advanced
oxidation processes and biological nutrient removal.
It has been reported that more than R3 billion per annum is spent on treating wastewater in South
Africa yet compliance by some parts of the sector is poor. This has a negative impact on the
country’s water resource quality (Lutchamma-Dudoo, 2010).
The treatment processes are predominantly influenced by the available infrastructure, characteristics
of the wastewater and cost. The wastewater treatment plants are distributed throughout the country
and the level of their operations is varied. Figure 3 shows the distribution of the wastewater plants
in various parts of South Africa.

3
Figure 1 Distribution map of the wastewater plants.
The treatment processes are similar throughout the country, they range from basic processes such
as anaerobic ponds, trickling filters to aeration basins to more developed enhanced biological
nutrient removal (EBNR) systems (Nozaic et al., 2008) in (Lutchmma-Dutoo, 2010)
1.2 Wastewater characteristics
Wastewater composition is becoming increasingly complex and this is a problem compounded by
the fact that environmental are becoming more stringent with time. Some of the pollutants that are
of great concern are encountered in pharmaceutical, distillery and molasses wastewater.
Wastewater from a local distillery was characterized and the composition was compared to that of
molasses wastewater (Table 1).

4
Table 1 Wastewater characteristics (Apollo et at., 2013)
Characteristics Inoculum Distillery MWW Inoculated
distillery
Inoculated
MWW
Total COD (mg/L) 2942± 127 5761± 105 4980± 117 5050 ± 59 4738 ± 56
Soluble COD (mg/L) 900 ± 35 4125± 87 3820± 64
BOD (mg/L) 526 1160 1118 1701 1652
Total nitrogen
(mg/L)
59 142 392 206 455
Total phosphates
(mg/L)
36 34 7 72 40
Total suspended
solids (mg/L)
112 87 62 205 181
pH 6.8-7.2 4.2-4.5 4.6-4.8 6.8-7.1* 6.8-7.1*
* Adjusted values
1.3 Pre-treatment
Pretreatment start with the removal of solid material from the feed stream (Figure 2). The
composition of the feed stream depend on the upstream activities. Municipal wastewater treatment
plants visited, the main source of pollution is abattoir waste as shown in (Figure 2). It is important
to separate SS before feeding wastewater into a bioreactor owing to the fact that the SS limit mass
transfer in the system. The separation can be achieved using settling, flocculation (Figure 3) and
filtration (Figure 4) methods. It has been reported (Aiyuk et al. 2003) that during the pre-treatment,
FeCl3 or natural water of extract of seed of moringa oleifera can be used to remove PO43- and SS.

5
Figure 2 Feed stream into wastewater treatment plant
Figure 3 Flocculation unit (pond)
Figure 4 Settling tank (Carolina)
6
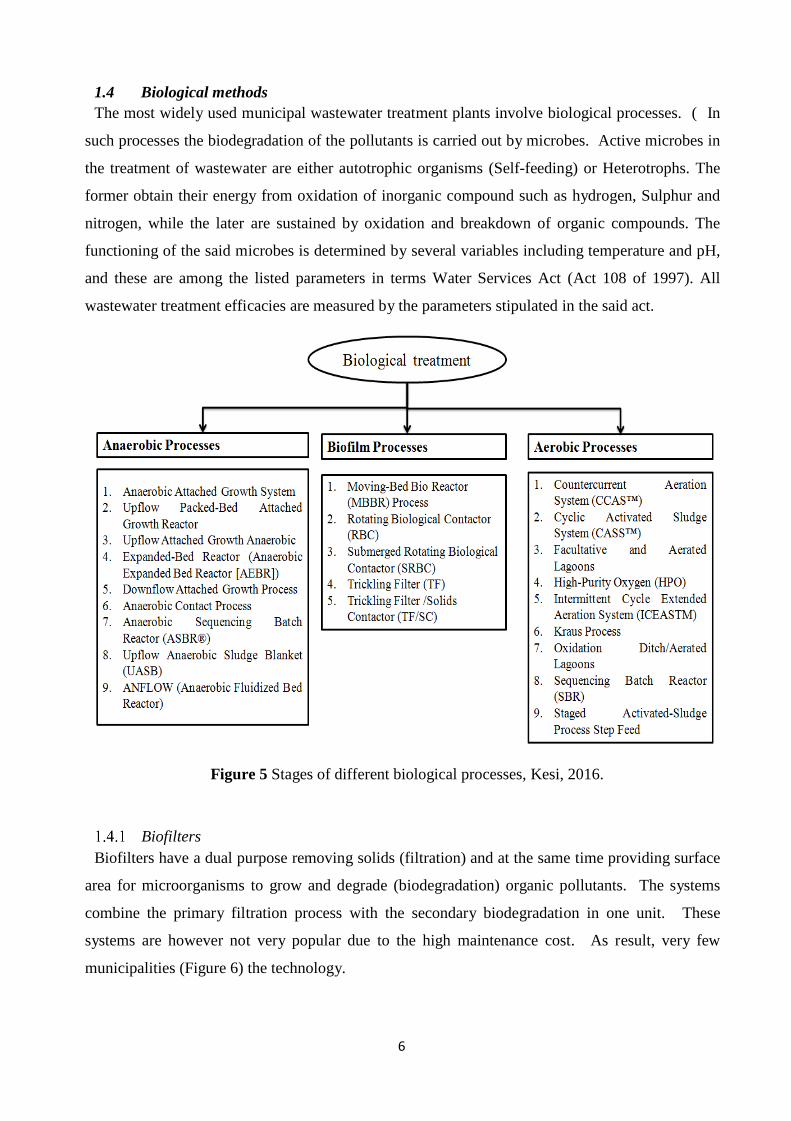
1.4 Biological methods
The most widely used municipal wastewater treatment plants involve biological processes. ( In
such processes the biodegradation of the pollutants is carried out by microbes. Active microbes in
the treatment of wastewater are either autotrophic organisms (Self-feeding) or Heterotrophs. The
former obtain their energy from oxidation of inorganic compound such as hydrogen, Sulphur and
nitrogen, while the later are sustained by oxidation and breakdown of organic compounds. The
functioning of the said microbes is determined by several variables including temperature and pH,
and these are among the listed parameters in terms Water Services Act (Act 108 of 1997). All
wastewater treatment efficacies are measured by the parameters stipulated in the said act.
Figure 5 Stages of different biological processes, Kesi, 2016.
Biofilters
Biofilters have a dual purpose removing solids (filtration) and at the same time providing surface
area for microorganisms to grow and degrade (biodegradation) organic pollutants. The systems
combine the primary filtration process with the secondary biodegradation in one unit. These
systems are however not very popular due to the high maintenance cost. As result, very few
municipalities (Figure 6) the technology.

7
Figure 6 Biofilter unit at XFSA
Aerobic processes
The biodegradation process may be aerobic or anaerobic, where the former is without free oxygen
but the presence of nitrates and the later means neither free oxygen nor nitrates. Aerobic systems
(Figure 7) are relatively less challenging and most of them work well. As such there is no major
concern as far as their operation is concerned. The major limitations are that they produce a lot of
sludge and are costly to operate. The main cost component being the aeration such limitation can
be addressed by using anaerobic digesters.
Figure 7 Aeration process, Plant XFSA

8
Anaerobic digestion
This study has shown that anaerobic digestion is not widely employed in most municipal
wastewater treatment plants. This is most wastewater treatment process (Figure 8) is sparingly used
in wastewater treatment plants across the country. Moreover the few ADs that are in use are either
underutilized (Figure 9) or have completely collapsed. However there are municipalities that have
demonstrated successful application of anaerobic treatment of wastewater in South Africa. Among
the most successful cases are those that have incorporated technology to convert biogas into
electricity. Known public entities utilizing anaerobic digestion are Joburg Water and PetroSA. Sasol
Firm in Sasolburg had pilot plant in 2013 used for treating wastewater and flaring methane. South
Africa Breweries (SAB) completed one treatment plant for the purposes of wastewater treatment
and supplementing their boiler fuel.
Figure 8 Schematic diagram of anaerobic digestion process.
The main driver for lack of the technology adoption is by and large finance and funding. Secondly,
leadership priorities and capacity, thirdly, technical know-how and lack of incentives such as
monitoring and enforcement is clouded by other equally demanding issues. Decentralized research
and development is also not helping the situation. Figure 8 provides and illustrative schematic
diagram of an anaerobic digestion.

9
Figure 9 Anaerobic digesters, Plant XFSA
The main challenge with regard to the production of electricity from biogas lies in the lack of skills
the run such a process that requires multi- and trans-disciplinary advanced competencies.
Considering the fact that most municipalities cannot successfully employ AD to treat even nutrient
rich wastewater, it is critically important to equip municipal water technicians and engineers with
skills needed to modern and green technology like that of biogas to electricity conversion (Figure
10).
Figure 10 Generation of electricity from biogas, Plant XEC
After a series of steps the wastewater (Figure 11) that is released into the water bodies should have
pollution loads that are within the acceptable limits (Table 2).

10
Figure 11 Treated wastewater, Plant XFSA.
The process is temperature and pH sensitive. There are few digester types but the underlying
principle is the same. A complete anaerobic process converts the digestate into a substrate that is
almost odourless and stabilized. Despite the well-grounded knowledge of this technology it remains
relatively neglected in many treatment plants. Water Institute of Southern Africa (WISA) provided
a comprehensive operating guide for Anaerobic Digestion of Wastewater Sludge in 1992. However,
even after the release of the guide adoption rate of the technology remains relatively erratic. There
are more advantages favoring use of anaerobic digestion. One of the main problems in this regard
is that the composition of the feed vary with time and space. Therefore, there is a need to develop
systems on the basis of regional variations.
In plant where only primary and aerobic techniques are used to treat wastewater, the final effluent
still remain heavily polluted (Figure 12) especially for overloaded systems. The COD concentration
of this effluent was found to be up to 2000 ppm, which is way above the prescribed SA limits (Table
2).

11
Figure 12 Effluent from an underperforming treatment plant (Plant XAMP)
1.5 Conventional wastewater treatment methods
Modern trends in wastewater management
The onset of wastewater management can be traced back to 1500 BC when an ancient system was
constructed in Mohenjo-Daro near river Indus in Pakistan. Since then classical and complex
contemporary technologies evolved as the nature of wastewater characteristics changed with advent
of industrial revolution. Even with the increase of complexity of treatment systems, the driving force
remains the same: ameliorating water quality to specific standards for intended subsequent use.
Having understood that wastewater pollutants reduction had a biological phenomenon, the
discharge into rivers was not a solution of the problem, if the amount of wastewater discharged was
too great in comparison with the river flow rate. This marked the beginning of secondary treatment
system. The first biological systems built in Germany consisted of radial systems in irrigation fields.
These kind of systems could only handle very low loads typically 0.24-0.36 m3 (hah)-1. Since then
technologies evolved that could handle larger waste load. For example in 1903, continuously
operated trickling filter was developed. One of the first large-scale plants was built in the form of
contact beds using large pieces of coke and operated with intermittent filtration, in Stahnsdorf near
Berlin. This kind of system could handle 500-2000 m3 (hah)-1. Sixty years later (1960) high load
trickling filter was adopted that could handle as high as 8000 m3 (hah)-1 waste load.

12
In the early 1990s, it was realized that there was a lack of effective communication between the
designers and the operators of digesters in South Africa. This was the motivation for the work done
by Ross et al. (1993), through which the Sludge Management Division of the Water Institute of
Southern African produced an operating guide to assist in training personnel. The operating guide
gives detailed trouble shooting procedures that are required to diagnose a digester upset. Indicators
of the upset of a digester include rate of biogas production, biogas composition, and production of
odorous volatiles, increase in foaming, decrease in pH and increase in solids supernatant. Under a
given set of operating conditions, these indicators vary with wastewater characteristics. Sudden
changes in the operating conditions such as COD loading, mixing, temperature and toxicity may
cause the upset. In their operating guide, one of the recommendations that Ross and co-workers
made was that anaerobic digesters should operate in two stages and that one of the stages should be
heated. Further, the authors recommended a high degree of mixing for the primary digester to
reduce or eliminate dead zones. The optimal design should be such that the capital cost is minimized
to the level that does not compromise efficiency.
Capital and operating cost
Wastewater treatment plants became large, complex facilities that required considerable amounts
of energy for their operation. After the rise of oil prices in the 1970s, concern for energy
conservation became a more important factor in the design of new pollution control systems. From
the perspective of the wastewater industry therefore, five major trends are currently mandatory.
These include nutrient removal and recovery, energy conservation and production, sustainability,
treatment for non-traditional contaminants, and community engagement.
Rising energy costs seems to be directing new approaches in wastewater treatment, thus the trends
are raising the bar for wastewater utilities toward being energy neutral or energy positive, whereby
energy is not just managed, but instead recovered and reused. Current initiatives to increase biogas
production, manage oxygen demand, and control equipment for efficient power use will move the
industry into the right direction. A fundamental change in the use of aerobic biological treatment
may be required to complete the transition from energy user to energy supplier. Moreover, future
treatment plants may incorporate additional anaerobic processes, or chemical and physical barriers,
to remove pollutants without aerobic bacteria thus creating energy rather than using energy.
However, there are limits to the ability to increase the energy efficiency of existing processes, and
there are budgetary limits for implementing new processes and technologies that help achieve an
energy neutral target. A prudent strategy dictates that utilities work to achieve the energy neutral
goal incrementally. Toward that end, there are five key components that can frame energy
optimization strategies including: 1) maximize efficiency 2) provide more treatment for less power;

13
3) consider technologies to reduce or produce energy; 4) generate renewable energy; and 5) evaluate
the plant carbon footprint.
Effluent discharge limits
Effluent discharge limits (Table 2) are imposed to deter the release of pollutants into water bodies.
However, the conventional parameters such as pH, alkalinity, COD, colour and BOD are still
important indicators of the level of pollution. However these parameters often do not give an
indication of the toxicity levels.

14
Table 2 Effluent discharge limits (EMM, 2010)
Determinant Lower limits of
Concentration
1 2
Total solids (TS), mg l-1 1000
Nickel, mg l-1 20 50
Zinc, mg l-1 20 50
Cobalt, mg l-1 20 20
Chromium, mg l-1 20
Lead, mg l-1 5 20
Copper, mg l-1 5 50
Cadmium, mg l-1 5 22
Boron, mg l-1 5 50
Total COD, mg l-1 500
All sugars and starch (expressed as glucose), mg l-1 1500 1000 Available chlorine 100
Total phosphate mg l-1 50
Phenol, mg l-1 150 10 Chloride 500 1000
Alkalinity, mg [CaCO3] l-1 2000
Substances not in solution (including fats, oil, grease, waxes, etc.
and where the volume of effluent discharged does not exceeding 10,000 kL, mg l-1500
Fats, oil, grease, waxes, etc., soluble in petroleum ether 500 10
Sulphides, mg l-1 10 1
Hydrogen sulphides, mg l-1 5
Substances from which HCN can be liberated, in drainage sewer etc, mg l-120 20
Ammonium nitrogen, mg l-1 200
Formaldehde, mg l-1 50
Non-organic solids suspension, mg l-1 100
Fluorine containing compounds, mg l-1 5 5
Sodium, mg l-1 500
Anionic surface active agents, mg l-1 500 500
Sulphate, mg l-1 1800 400
Electrical conductivity (EC) -1 500 400
pH 6.0 6-10
1-EMM (2010); 2- Sacks and Buckley (2004)
Effluents that do not meet these limits must be treated at municipal treatment plants and the charges
due per month for the treatment and conveyance (Ti) can be calculated as (EMM, 2010):
Sustainability
Another key characteristic of modern wastewater treatment facilities is the sustainable nature of
the processes. At wastewater treatment facilities, this means reduced consumption of resources and
increased recycling and reuse of water, nutrients, and other materials contained in wastewater. In
some areas, the need to increase reuse will require some decentralization with construction of
satellite treatment plants. Caps on greenhouse gas emissions affect the selection of treatment

15
technologies and operating strategies particularly for sludge. Increased water conservation alters
both the flows and pollutant concentrations in raw wastewater, potentially leading to new challenges
and opportunities.
1.6 Conventional wastewater treatment methods
Characteristics of the wastewater
Wastewater can be characterised into three broad catagories as follows: 1. Physical, which deal
with solid properties and thermal; 2. Biological which entails aspects such as pathgens, microbial
ecology, biomarkers and antibiotics; 3. Chemical which is described in terms of pH, ions & metals,
fats, oil & grease; organics and nutrients as well as micro constituents (Drexter et al., 2014). The
characteristics of wastewater are important when considering the applicable treatment technologies
and potential for re-use. The physical state of wastewater have impacts on its chemical behaviour
and biological content.
Abattoir Wastewater refers to a mixture of organic and inorganic solids, suspended and dissolved
in water. The wastewater from abattoirs constitute same chemical characteristics as those of
domestic sewage only being highly concentrated to an extend that they are almost wholly organic.
The organic loadings in the wastewater is highly variable as its constituents (proteins,
carbohydrates, fats and other molecules) are not fixed in quantity and formulation. The measure of
organic matter is oxygen demand (OD), which is the amount of oxygen required to break the organic
matter down.
Waste and wastewater loadings composition are varied depending on the origin in the abattoir for
instance paunch processing and slaughter floor wastewater is highly diverse (Jensen et al., 2014).
Waste and wastewaters at the abattoirs are generated from processes such as resting animals; carcass
dressing; slaughtering; reprocessing of by-products and is made up of animal dung, urine and water
from washing lairages (Table 3). Agro-industrial and food processing usually leads to generation of
wastewaters, the quantity and organic loading is determined by a number of factors, like the
industrial or legal regulations guiding the specific industry processes and technology, feedstock/
raw material characteristics, and the need for cleanliness and sanitization (Petruccioli et al., 2011).

16
Table 3. Types and amount of wastes from an animal unit at red meat abattoirs.
Waste Type Amount per Animal Unit (AU)
Rumen / stomach content 18 kg
Manure (Lairages) 4 kg
Condemned material/Trimmings 9 kg
Blood from bleeding area 12 L
Bloody water (rinse off) 2 L
Waste Water (Inflow = 880 liter x 85%) 748 L
Red meat abattoirs association (2014)
An average number of animal units (AUs) slaughtered at the studied high throughput abattoirs is
198.6 on daily basis (Monday to Friday), with a minimum and maximum of 80 and 600 AU
respectively. More than 25% of the examined abattoirs in the districts Fezile Dabi and Sedibeng
Municipalities uses between 200-300 m3 water daily and about 80% of the is outputted as
wastewater. The volumes of wastewater produced are important with regard to wastewater
treatment and water management.
The red meat abattoir wastewater shows highly variable amounts in biochemical oxygen demand
(BOD), chemical oxygen demand (COD), total solids, suspended solids, oil and grease, and
nutrients level (nitrogen; phosphorus; potassium). The amounts of the loadings are influenced
largely by the animal types, frequency of animals slaughtered and quantity of water used for various
abattoir processes (Satyanarayan and Vanerkar, 2005). Secondly, wastewater from abattoirs are
characterised by high organic loadings; relatively high temperature (20 to 30°C); organic biological
nutrients; alkalinity (Chukwu et al., 2011).
The effluent from abattoirs constitute surface cleaning water, diluted blood, dissolved solids, fats;
manure, partially digested feed, urine and meat trimmings, paunch contents and the volume is
determined by size of the abattoir, animal type, meat processing activities and technology in use at
the individual abattoirs. Beef abattoir result in higher COD generation than is the case with piggery
abattoir where the range is 1000 -11000 mg/l (Petruccioli et al., 2011). Studies from 1992 - 2000
by Jensen (2014) indicate that while the range is very wide, the loading are generalized at ˃ 5000
mg/l COD.
Variations in organic loading have been reported (Johns et al., 1995) in Jensen (2014) where
medium strengths were 1000 - 3000 mg/l COD to high strength at 5000 - 10000 mg/l COD.
Wastewaters from food processing plants are characterized by high biological oxygen demand

17
(BOD) concentration, high levels of suspended solids, nutrients and minerals (Lee and Okos, 2011).
The effluent is considered nontoxic; biodegradable; composition stable during the year and can be
transferred to municipal after pretreatment (Petruccioli et al., 2011). There is an economic value,
potential for energy generation, reduced agro-industrial waste that can be derived from improved
production process design and value adding to waste from red-meat abattoirs (Petruccioli et al.,
2011).
Animal’s pens at the abattoir are used for holding animals prior to slaughter and generate
substantial amount of wastes in the form of animal dung and urine that is usually cleansed by high
pressured water (Figure 1). Another waste stream that is associated with the abattoirs is the feedlots
that are usually affiliated to the abattoirs. The holding pens for pigs are normally equipped with the
vaporised drizzling water to avert heat stress as pigs are highly vulnerable to heat. This is not only
to avoid animals stress but an alignment with the humane treatment practice of the concentrated
animals keeping.
Figure 13 F Animals in holding pens

18
Figure 14 Water used for cleaning holding pens.
Nearly 80% of the abattoirs under examination have their own feedlots which generate several
tons of animal dung and wastewater used for cleaning the pens (Figure 13 F Animals in holding
pensFigure 13). As such, abattoir businesses generate a significant amount of organic waste that
requires specialized treatment and disposal procedures. One of the challenging wastes streams that
require further in-depth research is on how cattle hooves can add value to the abattoir business or
further down as useful resource.
The amount of water used is almost directly proportional to the number of animal units slaughtered
at given abattoir. The various animal species were converted to animal units to standarise the
numbers. However, animal type though may be converted to the animal unit have a varying degree
of water use. Water is a critical resource at the abattoirs industry for both production and processing
of the finished products. Tens of thousands litres of water are used daily at all red meat high
throughput abattoirs. The mean water use per day is 110 m3 in the study area, standard deviation is
78 m3 and the range is 260 m3. About 30% of the studied abattoirs did not quantify the amount of
water they used daily. The sources of water used are mainly two, namely, boreholes and municipal
water. Rain water harvesting is rarely practiced despite the large surface area of the abattoirs
structures. For those that measures their water use daily, the averages are as follows: the lowest
range are 40 - 55 m3 (35%), the middle ranges are 85 - 150 m3 (40%) and higher limits is 200 - 300
m3 (25%).
The two main sources are municipal water (35%) and boreholes accounting for 65% of the water
uses at the abattoirs. All the boreholes used by respondents in the study area were not registered.
Those who acquire water from borehole do not account for the costs of sourcing the water. The costs
19
are treated as overhead cost and as such it is challenging to establish water related cost structure.
Municipalities are billing abattoirs on a monthly basis according to their water use. The average
cost related to water use is R59, 912 per month, and the standard deviation is R49,165 and the range
being R126, 140.
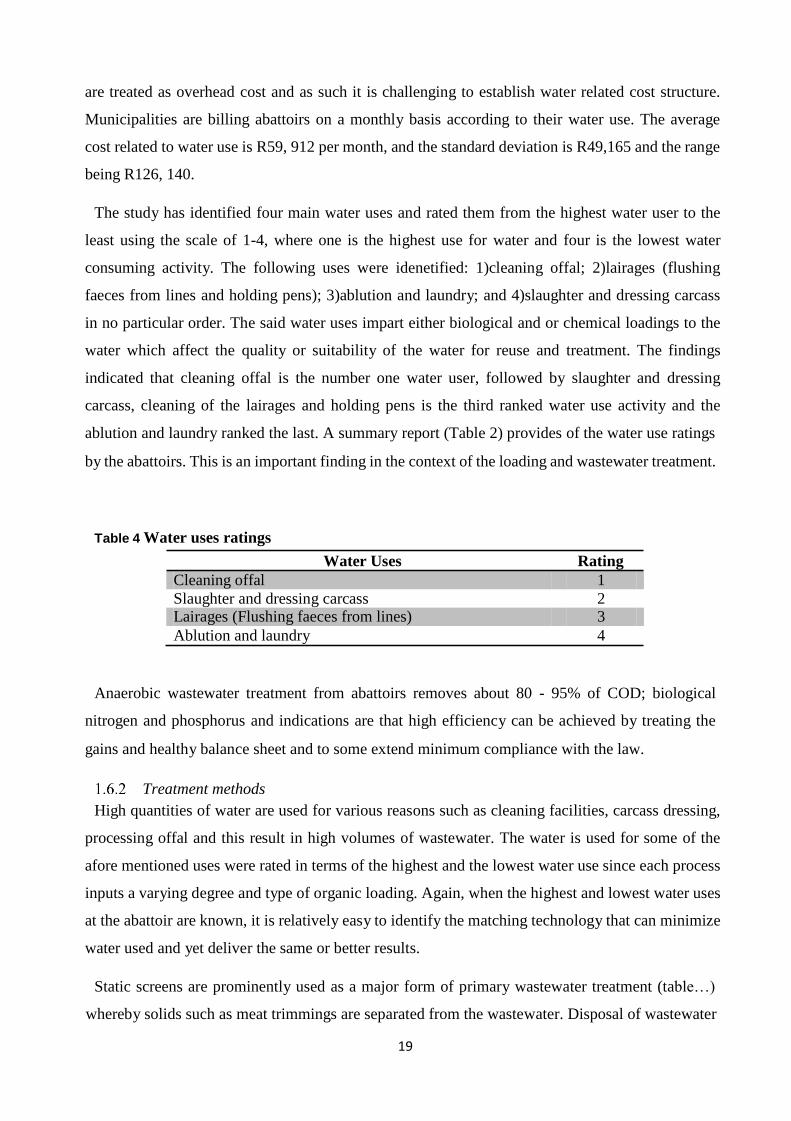
The study has identified four main water uses and rated them from the highest water user to the
least using the scale of 1-4, where one is the highest use for water and four is the lowest water
consuming activity. The following uses were idenetified: 1)cleaning offal; 2)lairages (flushing
faeces from lines and holding pens); 3)ablution and laundry; and 4)slaughter and dressing carcass
in no particular order. The said water uses impart either biological and or chemical loadings to the
water which affect the quality or suitability of the water for reuse and treatment. The findings
indicated that cleaning offal is the number one water user, followed by slaughter and dressing
carcass, cleaning of the lairages and holding pens is the third ranked water use activity and the
ablution and laundry ranked the last. A summary report (Table 2) provides of the water use ratings
by the abattoirs. This is an important finding in the context of the loading and wastewater treatment.
Table 4 Water uses ratings
Water Uses Rating
Cleaning offal 1
Slaughter and dressing carcass 2 Lairages (Flushing faeces from lines) 3
Ablution and laundry 4
Anaerobic wastewater treatment from abattoirs removes about 80 - 95% of COD; biological
nitrogen and phosphorus and indications are that high efficiency can be achieved by treating the
gains and healthy balance sheet and to some extend minimum compliance with the law.
Treatment methods
High quantities of water are used for various reasons such as cleaning facilities, carcass dressing,
processing offal and this result in high volumes of wastewater. The water is used for some of the
afore mentioned uses were rated in terms of the highest and the lowest water use since each process
inputs a varying degree and type of organic loading. Again, when the highest and lowest water uses
at the abattoir are known, it is relatively easy to identify the matching technology that can minimize
water used and yet deliver the same or better results.
Static screens are prominently used as a major form of primary wastewater treatment (table…)
whereby solids such as meat trimmings are separated from the wastewater. Disposal of wastewater

20
in the studied abattoirs is shared equally (50/50) between channelling to the municipality wastewater
treatment plant (WWTP) and irrigation of pastures thus natural or planted. In one incidence there
was a contract between the abattoir owner and the landscaping company where the wastes and
wastewater were used as an organic fertilizer. Overall, almost all abattoirs separated blood into
different channel from the wastewater to avoid blood coagulating into a solid mass and blocking up
drains. Static screens are similarly common for trapping trimmings, hair, small bones and other solid
materials and this is achieved by embedded vertical sieves that act as filters that allow water through
while catching solids. Only 11% of the abattoirs harvest blood and use it as fertilizer for lawns.
Those that irrigate with the wastewater mix blood and wastewater at the settling ponds and irrigate
with mixture of the two.
Settling ponds are used by 50% of the respondents and about 19% uses septic tanks as a form of
primary wastewater treatment. The ponds are arranged differently; some in series while others are
set randomly. The water is pumped from one pond to the next while the sediments are taken to
cultivated pastures or lawns. In some cases, the sediments are only removed when the pond is filled
up.
The environmental problem of eutrophication was observed around such pounds and over a period
some traits of wetland emerge within the immediate environment of the settling ponds since they
are largely on the ground surface. The study indicates those primary treatments of wastewater at red
meat abattoirs involves practices such as solid separation; channelling and pumping to the municipal
wastewater treatment plants.

21
Table 5. Waswastewater treatment unit operations and processes at red.
Treatment Units Operations and Processes
Physical Screening, Comminution, Flow
equalization, Sedimentation, Flotation,
Granular, medium filtration
Chemical Chemical precipitation, Adsorption,
Disinfection, Chlorination, Other
chemical applications
Biological Activated sludge processes; Aerated
agoons; Trickling filters; Rotating
biological contactors; Pond stabilization;
Anaerobic digestion; Biological nutrient
removal; enzymes addition
Source: Simate et al., (2011).
Some of the surveyed abattoirs only apply physical wastewater treatment and very few apply any
of the treatment methods cocurrently. Static screens and filtration are amongst the predominants
treatment methods at abattoirs. Meat Safety Act (MSA) (Act no. 40 of 2000) is the key regulations
for abattoirs and is generally concerned with hygiene and meat safety and very little to do with water
besides prescribing the quality.
Water/wastewater management policies and regulations
Waste management generally refers to a number of activities such as waste generation; storage;
transportation; treatment; re-use, recovery and where applicable the final disposal of various waste
streams. The study found out that about 156 municipalities are water services authorities (WSA)
and some of the 156 are also Water Service providers (WSP). This state of being the authority and
the service provider may be interpreted as a conflict of interest. However, self-regulatory tools such
as SANS 241 are widely adopted and used in most municipalities.
The high throughput red meat abattoirs are required to have waste management plans due to the
number of activities entailed in the waste management. The competent authorities in dealing with
waste management are primarily national government, secondly provincial and the local authority.
The national sphere of government gives context to the legislation while the local government may
impose own bylaws in their jurisdiction. The National Environmental Management Act, 1998 (Act

22
107 of 1998) (NEMA) forms the basis of environmental management in South Africa but other
specific laws relating to conservation, water, waste and air quality are equally relevant in this case.
The National Water Act (NWA), 1998 (Act no. 36 of 1998), objects are to manage national water
resources in order to achieve sustainable use of water for the benefit of all water users. Section 21(1)
of the Water Services Act, 1997 (Act No. 108 of 1997) requires every water services authority to
promulgate bylaws, which contains conditions for the provision of water services. The act is
premised on the integrated natural resources framework and seek to ensure that quality of water
resources is maintained and protected. The Act is aimed at ensuring that the water resources are
protected, used, developed, conserved, managed in order to:
a) Meet the basic human needs sustainably;
d) Promote the efficient, sustainable and beneficial use of water in the public interest;
e) Facilitate social and economic development;
f) Provide for growing demand for water use
g) Protect aquatic and associated ecosystems and their biological diversity;
h) Reduce and prevent pollution and degradation of water resources;
i) Meet international obligations and
k) Manage floods and drought
The above listed aims of the NWA (1998) is where red meat abattoirs can play major role and
potentially reduce their water and energy related bills by simply adopting South African waste
management hierarchy.
All types of water uses are regulated by National Water Act (NWA), 1998 (Act no. 36 of 1998),
in particular section 21 (e); (f); (g); and (h). Section 21(e), regulates irrigation of land with
wastewater while, section 21. (f) is concerned with discharging waste or water containing waste into
a water resource through a pipe, canal, sewer, sea outfall or other conduit. Section 21 (g) seek to
protect the water resources at which water is discharged. Lastly, section 21 (h), may affect abattoir
that generate steam or are in one way or the water independent power producers.
Abattoirs through their processing and waste management practices and do generate odour and
that is controlled through Air Quality Act (AQA) (Act No.39 of 2004). Section 35 (1) of the Air
Quality Act of 2004 enables the competent authority to take measures for the control of offensive
odours emanating from specific activities. No such measures have been prescribed as yet. Again,
Section 35(2) forces land owners or occupier of any premises to take reasonable measures to prevent
gaseous emissions of any offensive odour caused by any activity on such premises. The waste
management and facilities are also regulated by this section.

23
The abattoir effluents are subjected to the municipal by- laws which stipulates the acceptable
values key parameters values (Tab. 4) of the effluent that are deemed acceptable for discharge into
the municipal wastewater treatment plant (MWWTP). The authorities conduct a periodic random
sampling of the abattoir effluents that comes into their system and where the values may exceed the
stipulated amounts abattoirs are fined to pay a predetermined amount of money. Abattoir apply
some form of pretreatment to their wastewater in order to meet some minimum requirements of the
by-laws and avoid paying penalties.
Table 6. Upper limits for wastewater discharge MWWTP
Key Parameter Acceptable values in Gauteng
COD 3000 to 5000 mg/L
TSS 500 mg/L
NH3-N 200 to 300 mg/L
pH 6 to 10.
The available pretreatment facilities are hardly sufficient to also meet the requirements of the by-
laws quality standard for suspended solids, fats, oils and grease. The volumetric and cumulative
aspects of the abattoir wastewater do not seem to have been considered in terms of the municipal
by-laws. The high volumes of abattoir wastewater may cumulatively increase the concentration of
Conservation of agricultural resource act (CARA), 1983 (act no. 43 of 1983) objectives are to
provide for the conservation of the natural agricultural resources of the Republic by the maintenance
of the production potential of land, by the combating and prevention of erosion and weakening or
destruction of the water sources, and by the protection of the vegetation and the combating of weeds
and invader plants. The common wastewater management identified in the study area are largely in
contravention of the objectives of this act, as they are more likely to contaminate water resources
and are largely contributing to eutrophication.
In terms of the Act agricultural resources refers to the soil, the water sources and the vegetation.
In order to ensure the protection of agricultural resources CARA (Act. No 43 of 1983) makes
provision for the control of the following aspects that were identified to relate to water and or
wastewater management from the sampled abattoirs:
(1) In order to achieve the objects of this Act the Minister may prescribe control measures which
shall be complied with by land users to whom they apply.
(2) Such control measures may relate to-

24
(b) the utilization and protection of land which is cultivated;
(c) the irrigation of land;
(d) the prevention or control of waterlogging or salination of land;
(e) the utilization and protection of vleis, marshes, water sponges, water courses and water sources;
(n) the protection of water sources against pollution on account of farming practices
All the studied abattoirs do not recycle or recover anything from their wastewater, while the CARA
(Act 43 of 1983) seem to suggest that material reuse and recovery of useful material by defining
conservation “in relation to the natural agricultural resources, includes the protection, recovery
and reclamation of those resources”. It can therefore be considered mandatary that nutrients are
such as nitrogen, phosphorus and potassium (NPK) are recovered from wastewater and also that
water should be reused. Recovery of energy from wastewater may also be empowered in terms of
this CARA.
The current waste management practices of organic waste streams at abattoirs enables soil
contamination by way of leachate infiltration into the soil. Land contamination through
eutrophication can lead to the spread of invader plant species. This invader plants may in turn
outgrow some indigenous or even endemic plants in their habitat, leading or contributing to their
extinction. Invader plants species lack natural enemy due to the fact that they grow outside their
territories. Again, spread artificial wetlands as prominently observed in one piggery abattoir may be
experienced as the contaminants are in at times dissolved in water.
In brief, wastewater resources play important roles in improving fertility of the soil and act as
fertigation as opposed to rain water that only irrigates crops without enhancing any nutrients to the
plants, however, different streams of wastewaters require some treatment prior to being applied to
the soil to ensure proper soil functionality and quality of crops. Various wastewater streams can
adversely affect cation exchange capacity, soil water holding capacity,
Meat Safety Act (MSA) (Act no. 40 of 2000) was promulgated to provide for measures to promote
meat safety and the safety of animal products; to establish and maintain essential national standards
in respect of abattoirs; to regulate the importation and exportation of meat; to establish meat safety
schemes; and to provide for linked activities such as the management of waste and condemned
material from abattoirs. The regulations requires that water quality be compliant with SANS 241:
ii. The whole specifications of different abattoirs units are contained in the act.

25
Sustainability
Sustainability pillars are premised on three pillars namely, people, environment and economy. The
sustainability paradigm is by and large an effort to recognize the value of environmental services
and products. Daly (1990b) defined environment sustainability in three parts: 1. The rate at which
resources are utilized does not surpass the rate of regeneration, 2. The rate of waste generation from
diverse uses should not exceed the assimilative capacity of the environment, and 3. The depletion
of non-renewable resources should be weighed against the development of renewable substitutes
for the resources. Water is not substitutable and water resources flourish in well balanced functional
ecosystem. However, the rate of use and management of wastewater disposal to the environment is
within human capacity to manage and should be in manner that addresses the economic aspects as
enshrined in the broad definition of sustainability.
Water issues relate to sustainability at many levels, one being that water is the source of life and
basic right as enshrined in the bill of rights. However, the challenges regarding quantity, quality and
biodiversity are central to how water ought to be used and managed. South African national
development plan talks to green economy development and alternative waste management and
treatment can be turned into one of the pillars to achieve the envisaged development. Some of the
outlines technologies in previous section are clear ways by which wastewater can be managed
sustainably and at the heart of such technologies is the thrust for green economic development that
encapsulate water, energy and food nexus. Wastewater treatment is considered as bulk energy
user while in actual fact have the potential to generate about 9.3 folds of the processes energy needs
(Shizas and Bagley, 2004).
Abattoirs and MWWTP have uncovered anaerobic digester which allows methane and other
greenhouse gases to escape into the atmosphere. The main three GHGs are namely Carbon Dioxide
(CO2), Methane (CH4) and Nitrous oxide (N2O). CO2 is the most significant emissions in RSA and
the main source of the emissions is the energy sector (Country Report, 2010; Davidson and Winkler,
2003). Alternative energy and energy production are then key aspects in an effort to avert the GHG
effects and production. Methane is energy rich gas and if harvested and harnessed can form the part
of Integrated Energy Resources Plan as envisioned by Department of Energy (DoE, 2010).
In the case of water and wastewater management and treatment, there is an opportunity for
individual abattoirs to be energy sufficient while being environmentally responsible by adding value
to their waste. There are few entities in the country that uses or have commercial waste and
wastewater to generate own bioenergy for instance, Sedibeng Brewery, City of Johannesburg’s
Northern WWTP, BMW South Africa’s Rosslyn uses energy generated from feedlot waste. There
is potential to generate 1.9 jobs for every MW generated from Biogas according to the engineering

26
news (22 Oct, 2013), table 5 provide energy potential of the common wastewater treatment
technologies. This then means biogas technology amongst the known treatment technologies can
enhance the sustainability capacity of WWTP by cutting electrical bill, provide jobs and preventing
potential pollutants reaching our water resources. Sustainable development therefore is when the
need of the people is addressed in a manner that does not inhibit natural cycle but rather enhances
it.
Table 5 Energy potential of various feedstock (Adapted from Boyd, 2012)
Feed stock Quoted potential
capacity
Reference Notes
Wastewater to
wwtp
850 MWth Essence
Report
Municipal wastewater
WWTP load consists of
captured domestic black
water, domestic greywater
and industrial wastewaters
Households
(rural)
Agricultural
Cattle in
feedlots
Piggeries
Poultry farm
310000
households*estimate:
Approximately
680GWh/year of thermal
energy
3906 MWth 79 - 215
18 - 715
940 - 2976
Biogas for
Better life
I.e. rural cattle
*Assume 6mᵌ digesters,
produce 1mᵌ biogas/day,
1mᵌ biogas = 6kwh thermal
energy
Excluding rural cattle use
high range
Evaluation of emerging water/wastewater treatment technologies
The environmental sustainability concept is centred around the realisation that natural resources
are finite and ecological services are derived from a functional ecosystem. Progressive emerging
technologies ought to aim at imitating the natural cycles and consider product life cycle as a priority
in order to achieve zero waste. However, some of the best technologies are not yet used by the
relevant end users such as the municipalities and abattoir owners. Table 6 outlines some of the
common technologies in the wastewater industries. There is a varying degree of wastewater and
water treatment technologies efficacy of the outlined technologies and the applicability has to be
largely guided by the wastewater stream. The use and adoption of a particular technology is ideally
underpinned by three main things, namely characteristics of wastewater; available technology and
the compliance with the applicable legislation. However, political by-in, incentives and funding are
the main drivers of certain technology adoption.

27
Table 6 Wastewater treatment technologies and the advantages and disadvantages
Technology Wastewater
characteristics
Advantages Disadvantages
Fermentations for
biomass and
secondary
products
Anaerobic Digestion
· Works best at
warmer
temperatures (30 to 60°C)
Combustion
Gasification
Algal growth for
biodiesel production
Bioethanol
production
· Nutrients (C, N)
· Non-toxic effluent for
microbial growth
· Dissolved or suspended
organic
· pH: 5.5 – 8.5
· Good design to control
digestion and collection
of gas Dissolved or
suspended Organic
· Biomass
· Low water content and
Suspended organic matter
· Carbon and nitrogen
sources, oxygen
· Non-toxic effluent for growth
· Dissolved organic – limited
COD · Carbon and nitrogen
sources
· Non-toxic effluent for
microbial growth
· Carbohydrate (sugar)
rich
· Dissolved organics (or
suspended with emerging
technology)
· Can produce high value
secondary
metabolites as by- products
· Can remove toxic and
recalcitrant chemicals
· Suitable with most
substrates
· Can achieve 90%
conversion
· Help contain odour · Produces biogas for
heating, electricity
generation and steam
· Produces less biomass
than aerobic
fermentation
· Heat energy
· Destruction/conversion
of all hazardous material
· Mature technology
available
· 95% fuel-to-feed
efficiency · Low energy requirements- use energy
of sunlight for algal
growth.
· Can result in carbon
dioxide
sequestration
· Can utilise dilute
wastewater streams · Established technology
producing fuel
suitable for a variety of
combustion
engines
· Chemicals
such as phenol
are inhibitory.
· pH, salinity,
aeration need
to be adjusted
for growth
of the microbe. · H2S oxidised
to SO2. and
when combined
with water
vapour can form
suphuric acid
which is
corrosive
· High capital
investment
· Electricity
costs are higher
than for a coal-
fired
power station.
· Could produce
hazardous off- gases
· Algal ponding
area can
represent
considerable
land area.
·
Photobioreactors
have large capital costs.
· No suspended
solids
· Evaporation,
dilution,
contamination
· Cost of
carbohydrate
rich raw materials · Large volumes
of bioreactors
needed
· Non-dilute
wastewaters
required

28
Microbial Fuel Cells · Non-variable wastewater
sources
· Non-toxic effluent for
microbial growth
· Dissolved organics
· Can be used at less than
20°C
· Suitable for use with
low concentration
of organics in
wastewaters · Efficient (direct
conversion to
electricity)
· Capital
intensive
· Still in
development
· Variable COD
reduction
depending on
wastewater
Heat recovery · Wastewaters with temperature above ambient
Adapted from Burton et al., 2009
· Direct heat recovery · Heat above
ambient and the need for heat energy.
Anaerobic waste stabilisation ponds are among treatment methods used for treatment of
agricultural wastes and the disadvantage is that the ponds are uncovered and allow CH4 and CO2 to
escape to atmosphere. This is not only waste of potential energy resource but also have negative
impact on global warming. More 50% of the surveyed abattoir expressed interest in adopting biogas
technology. Biogas technology is perceived as waste management strategy and potential renewable
energy source.
Skill needs
Number of skills related challenges were mentioned during data collection at the municipalities
and also during the round table consultative session. The shortage of skill is on both soft skills like
management and hard skills like engineers. For instance, there is relatively lack of understanding
regarding the financing of water infrastructure as well as institutional governance water. Some of
the identified skills shortages includes.
There is intra and inter municipalities competition for skilled labourers. Graduates are leaving the
government sector to work as consultant or be absorbed by the industries. There are few individual
who studied water management at honour degree levels and largely responsible for taking random
samples at the predetermined spots. The water division are largely headed by civil engineers who
oversees the water reticulation and maintenance. The structure of the section is not uniform but most
affluent municipality afford to hire chemists and microbiologist to deal with water related subject
matters. Predominantly the labuor force constitute National Qualification Framework (NQF) levels
3 to 6.

29
Table 7, Diversity of skill requirement at municipalities
City Name Water Division Name Responsibilities/Divisions
Cape Town Water and Sanitation 1. Water Demand Management
2. Bulk Water
3. Finance and Commercial
4. Waste water Management
5. Wastewater operations
Magaung Metro Water and Sanitation 1. Engineering (not specific)
2. Operations & maintenance
3. Demand management
4. Purification
5. services
City of Johannesburg Contracted private company
(Johannesburg Water): Water
and Sanitation
The services are completely
outsourced to the contractor and the
contract account to the municipality
through the board of directors.
The municipalities are highly diverse and the manner in which they execute their water related
responsibilities. As a results each municipality will have different skills requirements. It may be
recommended that SALGA provides guidelines in terms of the hierarchy or structure for water and
sanitation. All levels of water service complain about the “over supply of unskilled individuals” and
it is really challenging to identify where the skills are lack. There is probably a need to conduct an
in-depth study ton identify the gaps as juniors are complaining that the superiors do not understand
their jobs and verse versa.
For instance, many municipalities have only civil engineers who are overseeing technicians.
Municipalities are largely dependent service providers in the water management, services and
treatment. There a concern that the hired services providers do not partake in skills transfers despite
that being part of their contractual agreement. The skilled personnel are leaving poor municipalities
to higher paying owns and or are leaving the local government sector only to come back as
consultants.
local government’s capability to deliver
The local government is characterized by high degree of diversity and as a result a one size fit all
approach in their ability to deliver services may not work. Local municipalities are to a large extent
autonomous bodies and their proximity to where service delivery is required is an added advantage.

30
However, majority of the local government are unable to deliver services to their own satisfaction,
due to a number of factors, such as funds and funding; improper placements; skills; Municipal
Finance Management Act (MFMA) (Act 56 of 2003) are said to be among of the issues ability to
render services. Political leadership and buy-in of some projects are some of the issues that affect
the efficacy of the local government.
strengths, challenges and opportunities
Local authorities have an ideal opportunity flourish in the green economy as anticipated by the
national development plan. The opportunity is embedded in environmental management
stewardship.
There is lack of alignment between the local government and affiliated institutions that are meant
to lessen the work load of municipalities such as South Africa Local Government Association
(SALGA) and Local Government Sector Education and Training Authority (LGSETA). For
instance, SALGA has been working with South African Biogas Industry Association (SABIA) to
among other things create employment by training biogas technicians and using the wastewater to
generate electricity for running of MWWTP but this has not had any in routes to the local
authorities.
Conclusion and recommendations
One of the major challenges facing local government is enforcement, monitoring and evaluation of
the projects. The wastewater from the abattoirs is rarely sampled and in some local municipalities
while other never sample wastewater from abattoirs in the Free State. Some local municipalities in
Sedibeng are largely depending on rand water for the sampling and testing of water. The
municipalities largely rely on the services of contractors do draw specification and execute the
actual work, this creates a problem when it comes to monitoring and payments of the since more
often than not there is no verification of the quality of work done due to capacity.
It is finally recommended that professional body guidelines be utilized in terms of structures or
organogram of the technical departments. Position of seniority should be aligned to professional
seniority and senior people be accountable to the professional bodies as is the case with lawyers;
nurses and accountants. Some of the people working in what ought to be a technical department are
neither registered nor affiliated to a professional body. This model is already working with some
municipal department such as Public Health, where practitioner are registered. That will influence
the conduct beyond moral obligation but to professional accountability.
The institutions are of higher learning are continually building some of the best technologies that
continue to utilized. It is therefore recommended that municipality head of departments to

31
periodically identify the gaps in their sections and one of the best ways is some periodic seminars
with the institutions of higher learning, whereby they can display what they have developed and get
to understand the challenges at government level. Human resources development should compile a
training needs list from the sections concerned and be followed through.
References
Aiyuk, S., Forrez, I., L. D.K.,van Haandel, A., Verstraete, W. (2003). Anaerobic and
complementary treatment of domestic sewage in regions with hot climates—A review.
Bioresource Technology, 97(17), 2225-2241.
Apollo, S. Onyango, M.S., Ochieng, A. An integrated anaerobic digestion and UV photocatalytic
treatment of distillery wastewater, J. Hazard. Mater. 261 (2013) 435–442. [20] L.S. Clesceri, A
Boyd, A. 2012. Informing international UNFCCC technology mechanisms from the ground up:
Using biogas technology in South Africa as a case study to evaluate the usefulness of the
potential elements of an international technology agreement in the UNFCCC negotiations
process. Energy Policy 51: 301-311.
Burton, S., Cohen, B., Harrison, S., Pather-Elias, S., Stafford, W., Van Hille, R. & Von Blottnitz,
2009. Energy from wastewater-A Feasibility Study. Guides for: 1. Technology Developers
and Researchers; 2. Industry and wastewater Generators and 3. Policy makers. Department
of Chemical Engineering, University of Cape Town.
Burton, S., Cohen, B., Stafford, W., van Hille, R., von Blottnitz, H., (2009). Energy from
wastewater – A feasibility study Technical report, WRC Report no.1732/1/09.
Cao, X., Oda, Y., Shiraishi, F. (2010). Photocatalytic and adsorptive treatment of 2,4-dinitrophenol
using a TiO2 film covering activated carbon surface, Chemical Engineering Journal 156 (2010)
98–105.
Chukwu, o., Adeoye, P.A., and Chidiebere, I., 2011. Abattoir wastes generation, management and
the environment: a case of Minna, North Central Nigeria. International Journal of
Bioscience Vol. 1, 6: 100-109.
Daly, H.E., 1990b. Toward some operational principles of sustainable development. Ecological
Economics 2:1-6.
Davidson, O. and Winkler, H. 2003. South Africa’s Energy Future: Visions, Driving Factors and
Sustainable Development Indicators. Reports for phase 1 of the sustainable Development
and Climate Change. Energy and Development Research Centre, University of Cape Town.
Drexter, I.L.C., Prieto, A.L., and Yeh, D., 2014. Comprehensive water quality and purification,
Volume 3. Elsevier.
Lee, W., and Okos, M.R., 2011 Sustainable food processing systems - Path to a zero discharge:

32
reduction of water, waste and energy. Procedia Food Science, 11th International Congress
on Engineering and Food (ICEF11), 1: 1768–1777
Ross, W.R., Novella, P.H., Pitt, A.J., Lund, P., Thomson, B.A., King, P.B., Fawcett, K.S. (1992).
Anaerobic digestion of wastewater sludge: operating guide.
Sacks, J. Buckley, C.A., (2004). Anaerobic digestion of high-strength or toxic organic effluents
in available digestion capacity, WRC Report no. 762/1/04.
Satyanarayan, S., Ramakant & A.P. Vanerkar (2005) Conventional Approach for Abattoir
Wastewater Treatment, Environmental Technology, 26:4, 441-448
Shizas, I. and Bagley, D., 2004. Experiemental determination of energy content of unknown
organics in municipal wastewater streams. J. Energy Eng. 130:45-53
Simate, G.S., Cluett, J., Lyuke, S.E., Musapatika, E.T., Ndlovu, S., Walubeka, L.F., and Alvarez,
A.E. 2011. The treatment of brewery wastewater for reuse: State of the art. Desalination
273:235-247.
33
CHAPTER 2
Acid mine drainage
2.1 Introduction
South African mines have generated a vast economic benefit and still play an important role in
ensuring the country’s position in the global market. However, despite such benefits, the operations
and ceasing of mines have become a major concern. Mining activities have produced a vast amount
of hazardous waste throughout the world, which are commonly associated with high content of acid
generating sulfide minerals, in particular acid mine drainage (AMD).
Acid mine drainage is a significant and costly environmental impact of the mining industry
worldwide. Over the last few decades there has been an increasing public awareness of the potential
environmental hazards arising from mining activities, in particular acid mine drainage (AMD).
Although any mineral deposit which contains sulphide is a potential source of AMD, certain types
of mining are more prone than others. There are records of acid drainage where coal, pyritic sulphur,
copper, zinc, silver and lead among others have been mined. Every mine is unique in terms of its
AMD potential; thus, the nature and size of the associated risk and feasibility of mitigation options
will vary from site to site. Also, the impact of AMD is dependent on local conditions and
geomorphology. There are no standardized methods from ranking, measuring and reducing the risk
of AMD.
The provinces that are mainly affected by AMD in South Africa are Mpumalanga, North West,
Gauteng and Free State. Gauteng, the Witwatersrand Basin, has received much attention due to the
decanting of contaminated water from the old mines in the Krugersdorp area into the Cradle of
Humankind. This interest then led to the establishment of an inter-ministerial committee on AMD
in late 2010. A technical task group was formed to investigate the problem and to recommend
possible solutions The report was focused mainly on the immediate problems arising from gold
mining in the Western Basin , the Central Basin and Eastern Basin (McCarthy, 2011).
Acid mine drainage treatment can be divided into active and passive methods. Passive methods
include biological treatment with constructed wetlands and chemical treatment with limestone
drains. Active treatment methods include chemical precipitation with alkaline chemicals, biological
treatment with bioreactors, and other techniques such as adsorption, ion exchange and reverse
osmosis. Commonly used treatment method for AMD is neutralization by limestone to neutralize
the acidity and remove the metals by forming their insoluble hydroxide precipitates. Although this
method is an effective method for AMD treatment, the main setback of this method is the huge
34
amount of sludge produced which has costly disposal requirements (Nleya et al., 2015, Wang et al.,
2013).
A number of approaches have been proposed to control and manage AMD. These include: decant
prevention and management, ingress control — reduction of the rate of flooding and the eventual
decant volume and water quality management. The latter approach proposes the use of active,
passive and in-situ treatment technologies that are tailored designed for specific AMD since water
quality of AMD varies from one source to another. Treatment technologies are very expensive and
require a thorough appraisal before adoption. Because of the stringent nature of environmental
regulations, advanced potential technologies such as adsorption and membrane technologies are
being explored. Skills development plays an important role in the growth of every country’s
economy, service delivery and technology improvement. It builds confidence in people, hence it is
crucial to ensure that the people in water sector are well-skilled and developed. In order to develop
and implement a coordinated approach to the skills gaps, it is necessary to quantify and specify the
water sector skills needs, quantity and specify the current system outputs, therefore establish the
gaps and give recommendations on how to bridge skills gaps and address skills shortages.
Occurrence and composition of acid mine drainage
Underground mine workings, mine waste dumps, tailing and ore stockpiles are the major sources
of acid mine drainage. Iron disulphide (FeS2), or pyrite, is the most important mineral associated
with acid mine drainage generation. According to Gray (Gray, 1997) the breakdown of pyrite is
affected by its morphology, such as crystallinity, particle size, and reactivity. Acid mine drainage
results from a series of reactions starting with the oxidation of pyrite in the presence of oxygen and
water to form ferrous ions and sulphuric acid (Kalin et al., 2006, Nengovhela et al., 2007, Salomons,
1995). According to Akcil and Koldas (Akcil and Koldas, 2006), the first most important reaction
is the oxidation of pyrite into dissolved iron, sulphate and hydrogen. The rate of pyrite oxidation is
dependent on solid phase compositional variable, microbial activities, and availability of oxygen
and water (Lapakko, 2002).
2FeS2 + 7O2 + 2H2O → 2 Fe2+ + 4SO42- + 4H+ (1)
The present of sulphate in mine waste drainage is typically the first indicator of sulphide mineral
oxidation. In a sufficiently oxidation environment (dependent on O2 concentration, pH greater than
3.5 and bacterial activity) ferrous iron released in Eq. (1) may be oxidized to ferric iron, according
to the following reaction (Akcil and Koldas, 2006, Blowes et al., 2003):
4Fe2+ + O2 + 4H+ ↔ 4Fe3+ + 2H2O (2)

35
If oxygen is low, Reaction (2) will not occur until the pH reaches 8.5. Under any conditions,
Reaction (2) is the rate-limiting step in pyrite oxidation because the conversion of ferrous to ferric
is slow at pH values below 5 under abiotic conditions (Skousen and Association, 1998).
At pH values between 2.3 and 3.5, ferric iron precipitates as Fe(OH)3, leaving little Fe3+ in
solution while simultaneously lowering the pH (Akcil and Koldas, 2006). The remaining ferric iron
reacts directly with pyrite to produce more ferrous iron and acidity.
Fe3+ + 3H2O ↔ Fe (OH)3(s)↓ + 3H+ (3)
If pH is less than 2, ferric hydrolysis products like Fe(OH)3 are not stable and Fe3+ remains in
solution (Dold, 2010). Nevertheless, any remaining Fe3+ from Eq. (2) that does not precipitate into
Fe(OH)3 from solution through Eq. (3) may be used to oxidize additional pyrite, according to the
following reaction:
FeS2 + 14Fe3+ + 8H2O → 15Fe2+ + 2SO42- + 16H+ (4)
From Reaction (4) the oxidation of pyrite by ferric iron results in further decrease in pH (Singer
and Stumm, 1970).
While oxygen is a primary oxidant, the ferric iron (Fe3+) resulting from the oxidation of ferrous
iron (Fe2+) is now recognized as a more potent oxidant than oxygen even at circumneutral pH (Zdun,
2001).
From the discussion above the formation of AMD may be considered to take place in three major
steps:
1. Oxidation of iron sulphide (Eq. (1)), and enhanced oxidation of sulphide minerals by ferric
iron (Eq. (4))
2. Oxidation of ferrous iron (Eq. (2)), and
3. Hydrolysis and precipitation of ferric iron and other minerals (Eq. (3))
The primary factors that determine the rate of acid generation are:
pH;
Temperature;
Oxygen content of the gas phase, if saturation is less than 100%;
Oxygen concentration in the water phase;
Degree of saturation with water;
Chemical activity of Fe3C;
Surface area of exposed metal sulfide;
Chemical activation energy required to initiate acid generation; and
Bacterial activity.

36
Reaction (2) and (4) can be significantly accelerated by the presence of acidophilic bacteria such
as Thiobacillus ferroxidans (Jennings et al., 2008, Singer and Stumm, 1970). This bacterium and
several other species through to be involved in pyrite weathering are widespread in the environment.
Thiobacillus ferroxidans has been shown to increase iron conversion rate by a factor of hundreds to
as much as a million (Blowes et al., 2003, Singer and Stumm, 1970).
Environmental impact of acid mine drainage
Acid mine drainage affects lotic ecosystems in numerous and interactive ways. The overall impact
of AMD is dependent on local conditions, climate and the extent and distribution of the AMD
generation deposits. These effects can be categorized as chemical, physical, biological and
ecological. The increased acidity caused by acid mine drainage has a range of negative effects
depending on the severity of the pH change. These changes have an effect on the aquatic life and
get to the food chain. It may disturb the reproduction system of aquatic life such as fish and therefore
may decrease their population. It also affects the infrastructure by corrosion.
Lowering of the pH of water to a point where it is unsuitable for domestic or other uses.
The reactions which produce acid mine drainage results in a high sulphate content in the
resultant water that will remain high even after the acid is neutralized. This water is unfit for
domestic, agricultural and some industrial uses and will increase the salinity of the receiving aquatic
environment.
The acidity of the water liberates metals, including toxic metals and radionuclides from the
rocks which it interacts with. This may result in acute and chronic toxicity to both humans and
environment.
Management approach to remediation
Acid mine drainage is a significant and costly environmental impact of the mining industry
worldwide. The mining continues to affect surface and groundwater resources even long after
mining operations have ceased. Not only does the mining operation have an impact on the
environmental; the excavation process also exposes sulphides in the walls of the opencast allowing
the ingress of water and oxygen.
According to a report by the Inter-Ministerial Committee on AMD, it has been reported that
estimated
The key factors which differentiate the developing problem in South Africa from international
examples reported in Inter-Ministerial Committee on AMD report is the interconnection of large
voids, the sheer scale of the Witwatersrand operations and the fact that many of the problem areas
are located in or close to the major urban areas. In other countries, mine flooding was planned to

37
minimize impacts, while in South Africa this has not been done and in this would not have been
possible owing to the closure of older mines within a basin long before flooding was contemplated.
According to a report by the Inter-Ministerial Committee on AMD, international experience
reveals a number of factors that leads to the successful implementation of programmes dealing with
mining legacies, including AMD:
Acceptance that there is a problem that needs to be addressed in a coordinated programme
between government and the mining industry.
High-level coordination between ranges of stakeholders, with government playing the leading
role.
Decisive action by the State to secure and provide funding.
Ongoing research optimal and sustainable short-, medium-, and long-term solution
Principles and actions for mine water management in the Department of Water Affairs (DWA)
Best Practice Guidelines for Mine Water Management are defined in the following steps:
1. Pollution prevention
2. Minimization of impacts: water reuse and reclamation water treatment
3. Discharge or disposal of waste and/or wastewater
In order to develop cost-effective and environmental sound management strategy of AMD
discharges from abandoned and active mines, the problems were split into two components:
management of flooding and management of water quality.
Assessment of technologies for the treatment of AMD
Acid mine drainage has significant economic and environmental impacts owing both the corrosive
effects of acid water on infrastructure and equipment, and the severe environmental impacts related
to the low pH and high metal and salt loadings. These impacts continue long after mine has ceased
and can have adverse impacts on the ecology of streams, affecting the beneficial use of waterways
downstream of mining operations.
Contamination of AMD ranges from location to location, therefore there will not be one single
treatment method that can be used in every situation and that appropriate treatment methods need
to be selected from the range available for each mine water type encountered. Analysis shows that
there is a wide variation in water quality from different basins, for example, the Eastern Basin
produce near-neutral water with a sulphate content of around 1 000 – 1 500 mg/L, and the Western
Basin produce a highly acidic water with sulphate content as much as 5 000 mg/l (Committee, 2010).
An appropriate technologies will need to be identified for each and the different waters.

38
The current methods used in South African for acid mine drainage treatment are neutralization and
reverse osmosis method.
2.1.3.1 Neutralization method
One of the most environmentally effective techniques available for mitigating AMD is internal
neutralization methods. Although neutralization is an effective method for AMD treatment, it is also
accompanied by the treatment of produced metal hydroxide precipitate which has costly disposal
requirements. The acid is neutralized by dosing the AMD with lime or limestone, then passing it
through settling tanks to remove sediments and particulate material. The effluent produced often
contains more sulphate than is acceptable to discharge to the environment. A neutralization plant is
build and in operation in Randfontein for treatment of waste water from Sibanye Gold mining void.
The treated water is recycled back to the mines.
Process:
Slurry of lime is dispersed into a tank containing acid mine drainage and recycled sludge to
increase water pH to about 9, Figure 1. At this pH, most toxic metals become insoluble and
precipitate, aided by the presence of recycled sludge. Air is introduced in this tank to oxidize iron
and manganese and assist in their precipitation, Figure 2. The resulting slurry is directed to a sludge-
settling vessel, such as a clarifier. In that vessel, clean water will overflow for release, whereas
settled metal precipitates (sludge) will be recycled to the acid mine drainage treatment tank, with a
sludge-wasting side stream.

39
Acid mine drainage
Recycled sludge
Figure 15: Acid neutralization plant, mixing tank.
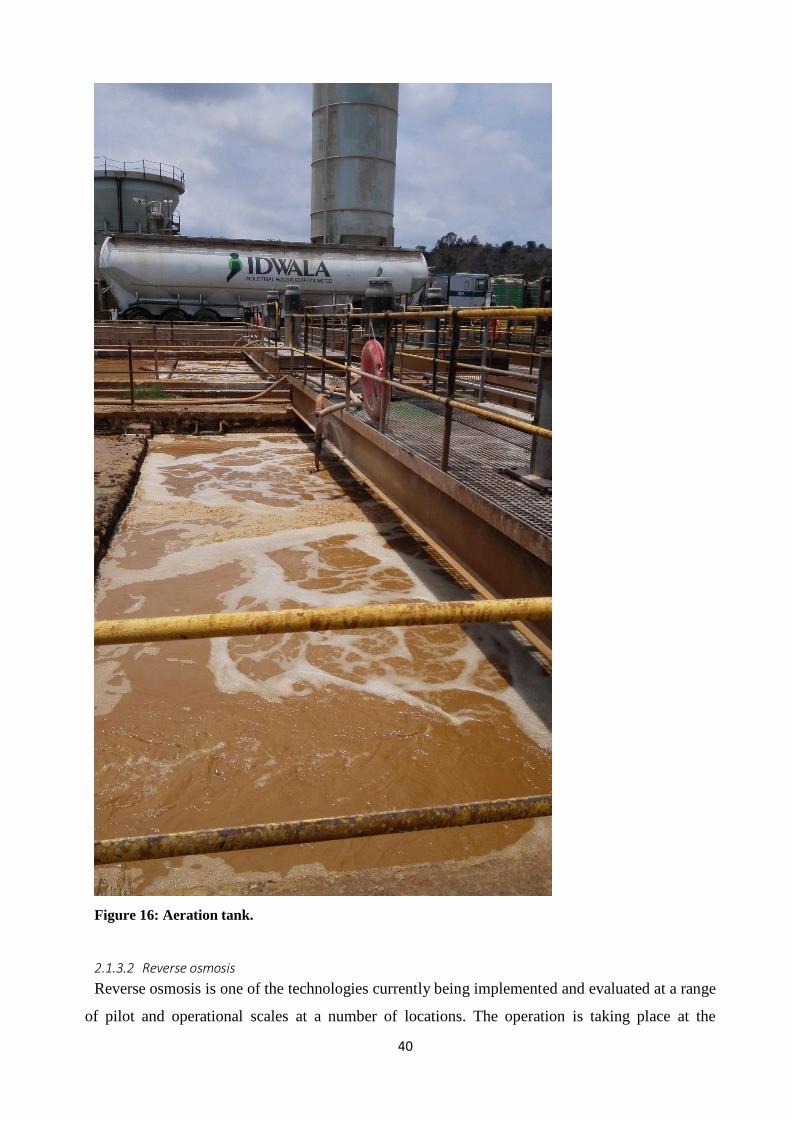
40
Figure 16: Aeration tank.
2.1.3.2 Reverse osmosis
Reverse osmosis is one of the technologies currently being implemented and evaluated at a range
of pilot and operational scales at a number of locations. The operation is taking place at the

41
eMalahleni and Optimum Water Reclamation Plants in Mpumalanga. Acid mine drainage from coal
mines is treated to potable quality and used to supplement the local municipal water supply.
Process:
Reverse osmosis (RO) is a water purification technology that uses a semipermeable membrane to
remove ions, molecules, and larger particles from drinking water. It is the process of forcing a
solvent from a region of high solute concentration through a semipermeable membrane to a region
of low solute concentration by applying a pressure in excess of the osmotic pressure. Reverse
Osmosis works by using a high pressure pump to increase the pressure on the high solute
concentration side of the RO and force the water across the semi-permeable RO membrane. The
amount of pressure required depends on the contaminants concentration of the feed water. The more
concentrated the feed water, the more pressure is required to overcome the osmotic pressure. Figure
3 demonstrate how contaminated water moves through semipermeable membrane.
Figure 17: Reverse osmosis
Emerging trends and challenges
In South Africa there are currently two plants for treating AMD to portable quality at full scale.
These plants are not financially self-sustaining. Internationally experience has shown that AMD
treatment is unlikely to be financially self-sustaining (Committee, 2010). The costs of this treatment
are estimated at around R11 per cubic meter, with a capital of treating 20 Ml/day (20 000 m3/day)
at each plant, including amortization of the capital costs of the plant over a projected 20 year design
life of the plant (Committee, 2010). This is not economically self-sustaining and relies on a subsidy
from the mining companies.

42
By-product from these treatment methods (neutralization and reverse osmosis) is also a problem.
Waster sludge and brine are produced, depending on the level of treatment, requiring disposal. The
water quality from the Central and Eastern Basin is expected to be better than that from the Western
Basin and therefore needs less pre-treatment; however, none of the water measured in the different
basins is suitable for discharge to the river systems.
Environmental protection and rehabilitation are fast becoming a priority. Economic sustainability
and technical feasibility become key drivers in determining the sustainability of any proposed
method or system for any application. It is imperative that the acidity is removed in order to
minimize the environmental impact. However, the sustainable way will be the removal of the acid
with the focus being on recovery and reutilization of the acid. Recovery of acid from acid mine
drainage water will not only produce potable water for reuse, but will also recover a valuable
resource. There is an ongoing study on the sustainability assessment of the recovery and utilization
of acid from acid mine drainage (Nleya et al., 2015). Effects have been directed towards the recovery
of sulphuric acid due to the economic and environmental benefit of this approach. The recovery of
acid will be integrated with adsorption technique to remove the metals (e.g. iron, manganese, copper
and etc) after the recovery of acid.
Skills development
Water engineering jobs in particular play a crucial role in finding new technology innovations for
critical areas such as purifying water and maintaining existing water infrastructure that is under
pressure of population growth in emerging markets such as South Africa. South Africa is looking
for holistic solutions of skill gaps by starting with the educational system that is supposed to produce
a sustainable stream of engineers and engineering technologists. Increased need for water engineers
and technologists is also due to the growing focus on the environment due to the threat posed by
climate change. The shortage of engineers is not a problem in South Africa only; it is a global
shortage which has affected developed and developing economies alike.
The United States of America (USA) produces 60 000 engineering graduates a year through STEM
(Science, Technology, Engineering and Mathematics) Education and Training which is a far less
number of engineers need yearly, of about 200 000 engineers are needed yearly. The focus,
currently, in Australia is on the water sector. The water sector has to recruit up to half of their 80
000 strong technical workforce within the next decade to replace the ageing workers. Like other
countries in the world, South Africa is experiencing shortage of qualified, experience, registered
engineers. South Africa is looking for solutions of shortage of engineers by starting with the

43
educational system that is supposed to produce a sustainable stream of engineers and engineering
technologists (Affairs, 2009).
Methods that have been developed for the recovery of sulphuric acid from industrial water solutions
include rectification processes, membrane process, ion exchange, solvent extraction, rectification,
crystallization and acid retardation process. These processes require engineering skill of distillation
process, the use of membranes and adsorption techniques.
Conclusions
Currently in South African there are two reverse osmosis treatment plant for treating AMD to
potable quality at full scale. The other treatment plant is the neutralization plant which is not able
to produce water suitable to discharge to river systems. The amount of sludge produced from this
treatment method presents a serious disposal challenges. The water qualities of different basins vary
from one basin to another; hence it is not possible to recommend one single treatment method
suitable for all types of mine water. Mine water can be acidic or neutral, have high or low metals
content, have high or low sulphate and these characteristics determine which treatment methods are
appropriate. It is possible that water quality in the mine voids will improve over time, given proper
water management and a suitable treatment technology. It is imperative that the acidity is removed
in order to minimize the environmental impact, however it might be more economically attractive
to consider the recovery of acid from acid mine drainage. The acid recovery methods can be
integrated with adsorption technique for the removal and metals and heavy metals. The required
skills will be expects engineers in distillation process, the use of membranes and adsorption
techniques.

44
References DWA. E. 2009. A coordinated approach to the water sector skills crisis. 154.
Akcil, A. & Koldas, S. 2006. Acid mine drainage (amd): causes, treatment and case studies.
Journal of cleaner production, 14, 1139-1145.
Akpor, O. & Muchie, M. 2010. Remediation of heavy metals in drinking water and wastewater
treatment systems: processes and applications. International journal of physical sciences, 5,
1807-1817.
Blowes, D., Ptacek, C., Jambor, J. & Weisener, C. 2003. The geochemistry of acid mine drainage.
Treatise on geochemistry, 9, 612.
Committee, I.-M. 2010. Mine water management in the witswatersrand gold fields with special
emphasis on acid mine drainage. 146.
Dold, B. 2010. Basic concepts in environmental geochemistry of sulfidic mine-waste management,
intech open access publisher.
Gray, N. 1997. Environmental impact and remediation of acid mine drainage: a management
problem. Environmental geology, 30, 62-71.
Jennings, S. R., Blicker, P. S., Neuman, D. R. & Group, R. R. 2008. Acid mine drainage and
effects on fish health and ecology: a review, reclamation research group.
Kalin, M., Fyson, A. & Wheeler, W. N. 2006. The chemistry of conventional and alternative
treatment systems for the neutralization of acid mine drainage. Science of the total
environment, 366, 395-408.
Lapakko, K. 2002. Metal mine rock and waste characterization tools: an overview. Mining,
minerals and sustainable development, 67, 1-30.
Mccarthy, T. S. 2011. The impact of acid mine drainage in south africa. South african journal of
science, 107, 01-07.
Monachese, M., Burton, J. P. & Reid, G. 2012. Bioremediation and tolerance of humans to heavy
metals through microbial processes: a potential role for probiotics? Applied and
environmental microbiology, 78, 6397-6404.
Nengovhela, A., Yibas, B. & Ogola, J. 2007. Characterisation of gold tailings dams of the
witwatersrand basin with reference to their acid mine drainage potential, johannesburg, south
africa. Water sa, 32.
Nleya, Y., Simate, G. S. & Ndlovu, S. 2015. Sustainability assessment of the recovery and
utilisation of acid from acid mine drainage. Journal of cleaner production.

45
Salomons, W. 1995. Environmental impact of metals derived from mining activities: processes,
predictions, prevention. Journal of geochemical exploration, 52, 5-23.
Singer, P. C. & Stumm, W. 1970. Acidic mine drainage: the rate-determining step. Science, 167,
1121-1123.
Singh, R., Gautam, N., Mishra, A. & Gupta, R. 2011. Heavy metals and living systems: an
overview. Indian journal of pharmacology, 43, 246.
Skousen, J. & Association, N. M. 1998. Handbook of technologies for avoidance and remediation
of acid mine drainage, national mine land reclamation center morgantown.
Solomon, F. 2008. Impacts of metals on aquatic ecosystems and human health.
Wang, L. P., Ponou, J., Matsuo, S., Okaya, K., Dodbiba, G., Nazuka, T. & Fujita, T. 2013.
Integrating sulfidization with neutralization treatment for selective recovery of copper and
zinc over iron from acid mine drainage. Minerals engineering, 45, 100-107.
Yadav, S. 2010. Heavy metals toxicity in plants: an overview on the role of glutathione and
phytochelatins in heavy metal stress tolerance of plants. South african journal of botany, 76,
167-179.
Zdun, T. 2001. Modelling the hydrodynamics of collie mining void 5b. Msc dissertation,
university of western australia, australia.

46
CHAPTER 3
Advanced oxidation process
3.1 Introduction
New techniques for wastewater decolorization have emerged with improved performance and are
also environmental friendly. An example is advanced oxidation processes (AOPs) such as
heterogeneous photocatalysis, Fenton, photo-Fenton and ozonation. These techniques have
received attention due to their ‘green’ nature in that they eliminate or reduce the use or generation
of hazardous substances (Navgire et al. 2012). The main challenge with the use of AOPs is
production of intermediate compounds, which affect the performance of the photo reactors. Most
of the technical difficulties associated with AOPs arise from the fact that oxidation processes are
non-selective with the potential for significant interference (Stocking et al., 2011). One of the
most widely used AOP include photocatalysis.
Among the most promising technologies for the removal of recalcitrant pollutants are the AOPs
such as photolysis, ozonation, electrochemical oxidation, ultrasound irradiation (sonolysis), sub-
critical wet air oxidation, homogeneous photo-Fenton oxidation and heterogeneous semiconductor
photocatalysis (Klavarioti et al., 2009). The use of AOPs is advantageous in that they destroy
pollutants instead of simply transferring the pollutant to a different phase (Fernández-Ibáñez et al.,
1999). This eliminates the need to regenerate or dispose of sludge produced in the process of
treating wastewater (Zainudin et al., 2010). Of the many AOPs, heterogeneous semiconductor
photocatalysis has attracted a significant attention as a potential commercial system for the treatment
of pharmaceutical wastes due to its low energy and chemical input requirements especially when
powered by sunlight (Klavarioti et al., 2009).
3.2 Application of photodegradation techniques
Photodegradation is typically conducted using solar irradiation or ultraviolet (UV) lamps. The use
of solar irradiation is constrained by the limitation of the intensity and reliability of the irradiation.
The UV lamps can produce reliable source of irradiation, however, the main limitation associated
with the use of these lamps is the energy cost. In South Africa the data on the amount of irradiation
produced per year indicate that there is a potential for this technology both in South Africa and the
continent of Africa in general.

47
Photodegradation of pharmaceutical waste
Photocatalytic degradation involves the use of a semi-conductor (photocatalyst) in the presence of
a light source to degrade such complex hydrocarbon compounds into simpler organic compounds.
The semiconductors that can be used as photocatalyst are TiO2, WO, FeTiO and SrTiO. The success
of photocatalysis is dependent on the toxicity of the intermediate compounds. The identity of the
intermediate compound can give an insight into the mechanism of the photodegradation process.
There has been an increasing interest in photocatalysis evidenced by increasing number of scientific
publications in this area. Over the last few decades, the scientific and engineering interest in the
application of heterogeneous photocatalysis using TiO2 powder for the decomposition of organic
hazardous materials in liquid phases has grown exponentially (Brosillon et al., 2008; Shan et al.,
2010; Nawi et al., 2012).
Zeolite is a promising support material for TiO2 photocatalyst due to its regular pores and channel
sizes, and good adsorption ability. In South Africa zeolite (clinoptilolite) exists naturally and this
can make the process less costly. Titanium dioxide supported on zeolite integrates the
photocatalytic ability of TiO2 with the adsorption properties of zeolite, which induces a synergistic
effect, resulting in enhancement of photocatalytic efficiency (Huang et al., 2008). However,
preparation of the catalyst coated support material (zeolite) should be carefully done to limit the
interaction between the active sites of the material and the catalyst as this greatly affects
performance of photodegradation (Durgakumari et al., 2002).
Photodegradation performs well in mineralization of toxic and biorecalcitrant organic compounds,
however, it is faced with some challenges. In the first place, the major challenge of this process is
high energy requirement in cases where artificial irradiation such as UV light is used. In this case,
the associated cost can often be prohibitive for wastewater treatment. Another problem is
encountered in the treatment of wastewater with high colour intensity such as distillery and textile
industry effluent. In this case, the high colour intensity hinders the penetration of light rays thus
lowering the performance of the process. It therefore means that for photocatalytic degradation to
perform well in the treatment of such wastewater high dilutions are required. This again is not
economical as a larger reactor volume is required. Studies of solar photodegradation requires
accurate information on the solar irradiation available as this is one of the major determinants of the
performance of any solar photoreactor.
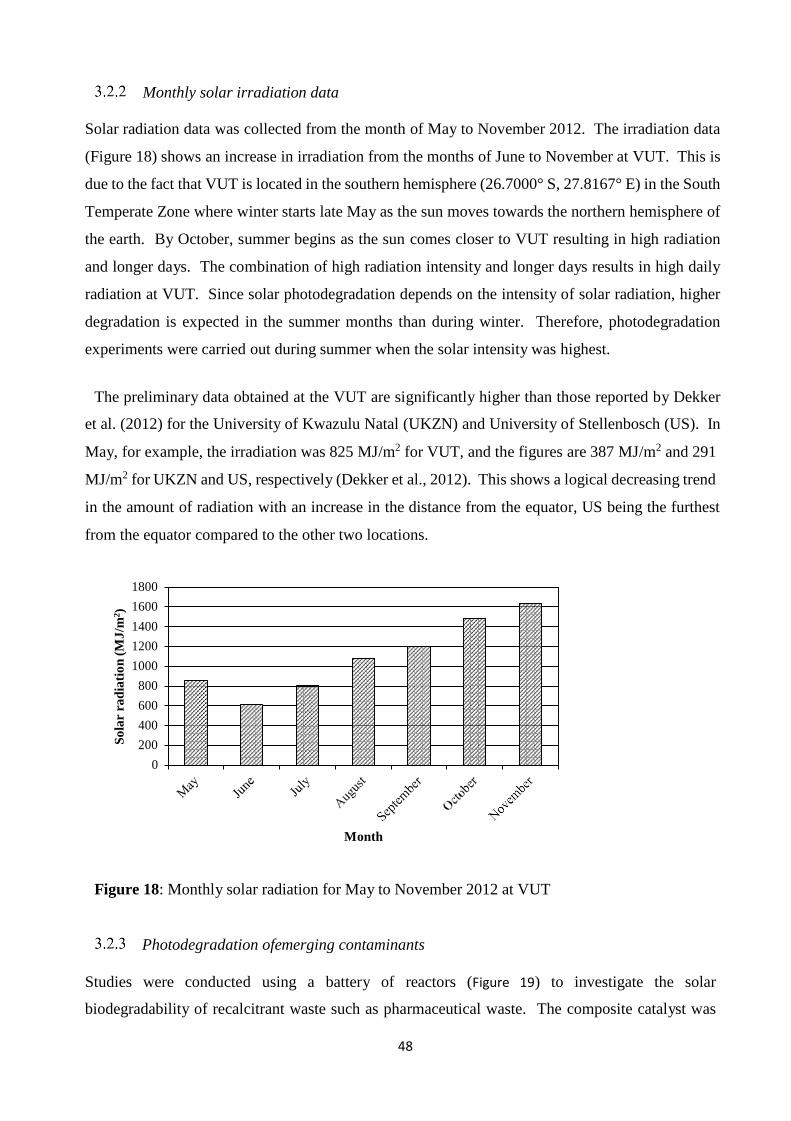
48
So
lar
rad
iati
on
(M
J/m
2)
Monthly solar irradiation data Solar radiation data was collected from the month of May to November 2012. The irradiation data
(Figure 18) shows an increase in irradiation from the months of June to November at VUT. This is
due to the fact that VUT is located in the southern hemisphere (26.7000° S, 27.8167° E) in the South
Temperate Zone where winter starts late May as the sun moves towards the northern hemisphere of
the earth. By October, summer begins as the sun comes closer to VUT resulting in high radiation
and longer days. The combination of high radiation intensity and longer days results in high daily
radiation at VUT. Since solar photodegradation depends on the intensity of solar radiation, higher
degradation is expected in the summer months than during winter. Therefore, photodegradation
experiments were carried out during summer when the solar intensity was highest.
The preliminary data obtained at the VUT are significantly higher than those reported by Dekker
et al. (2012) for the University of Kwazulu Natal (UKZN) and University of Stellenbosch (US). In
May, for example, the irradiation was 825 MJ/m2 for VUT, and the figures are 387 MJ/m2 and 291
MJ/m2 for UKZN and US, respectively (Dekker et al., 2012). This shows a logical decreasing trend
in the amount of radiation with an increase in the distance from the equator, US being the furthest
from the equator compared to the other two locations.
1800
1600
1400
1200
1000
800
600
400
200
0
Month
Figure 18: Monthly solar radiation for May to November 2012 at VUT
Photodegradation ofemerging contaminants Studies were conducted using a battery of reactors (Figure 19) to investigate the solar
biodegradability of recalcitrant waste such as pharmaceutical waste. The composite catalyst was

49
then used to adsorb and photodegrade the pharmaceuticals sulfamethoxazole (SMX), diclofenac
(DCF) and carbamazepine (CBZ) in a three phase fluidised bed photocatalytic reactor using sunlight
to activate the TiO2. The effect of the initial pH of the substrate solution on the adsorption and
photodegradation of the substrates was determined by varying the pH of the substrate solution from
4 to 10. The results (Figure 21) show an increase in the adsorption and photodegradation of SMX
with a decrease in solution pH. Results in Figure 18 show that solar irradiation is very low in winter,
and there was a variation in irradiation on a daily basis and throughout the year. To address the
problem of this periodic fluctuation, a high precision solar simulator unit (Figure 20) was purchased
which will give consistent and reliable irradiation data.
Figure 19 Battery of solar reactors in use

50
Figure 20 Solar simulator, research progress.

51
C/C
0
Adsorption Photodegradation
1
0.8
0.6
0.4
0.2
0
0 30 60 90 120 150 180 210 240 270 300 330 360 390 420
Time (min)
4 4.6 7 10
Figure 21 Photodegradation of SMX with a decrease in solution pH.
However there was some adsorption due to hydrophobic interactions of the SMX molecules and the
PAC surface. Increasing the solution pH to 7 and 10 resulted in a decrease in adsorption of SMX
on the PAC surface due the repulsion between the positively charged SMX molecules and the
positively charged surface of the PAC. This repulsion reduced the adsorption due to hydrophobic
interactions since the SMX molecules were repelled from the surface of the PAC.
3.3 Conclusion
Pharmaceutical pollutants in wastewater have become an increasing concern in recent years.
Adsorption and photocatalytic degradation of pharmaceutical pollutants have proved to be very
efficient in the removal of pharmaceutical contaminants. The results show that an increase in the
adsorption and photodegradation of SMX with a decrease in solution pH. These results show that
the use of the synthesised composite catalyst in the fluidised bed reactor provided a stable and
efficient system capable of long term use. The results from this work also show that this system
can be used for the removal of pharmaceutical substrates at low concentrations. Fluidized bed
reactors have been applied in many counties including China and the USA but very little has been
reported on its application in South Africa. It is therefore recommended that efforts should be
made to explore the feasibility of applying this technology in this country.

52
References
Brosillon, S., Djelal, H., Merienne, N., Amrane, A. (2008). Innovative integrated process for the
treatment of azo dyes: coupling of photocatalysis and biological treatment, Desalination,
222(1-3), 331-339.
Cao, X., Oda, Y., Shiraishi, F. (2010). Photocatalytic and adsorptive treatment of 2,4-
dinitrophenol using a TiO2 film covering activated carbon surface, Chemical Engineering
Journal 156 (2010) 98–105.
Dekker, J., Nthontho, M., Chowdhury, S., Chowdhury, S. (2012). Investigating the effects of
solar modelling using different solar irradiation data sets and sources within South Africa.
Solar Energy, 86(9), 2354-2365.
Durgakumari, V., Subrahmanyama, M., Rao, S.K.V., Ratnamala, A., Noorjahan, M., Tanaka, K.
(2002). An easy and efficient use of TiO2 supported HZSM-5 and TiO2 + HZSM-5 zeolite
combinate in the photodegradation of aqueous phenol and p-chlorophenol, Applied Catalysis
A: General, 234 155–165.
Huang, M., Xu, C., Wu, Z., Huang, Y., Lin, J., Wu, J. (2008). Photocatalytic discolorization of
methyl orange solution by Pt modified TiO2 loaded on natural zeolite, Dyes and Pigments,
77(2), 327-334.
Navgire, M., Yelwnde, A., Arbad, B., Lande, M. ( 2012). Photodegradation of molasses by a
MoO3-TiO2 nanocrystalline composite material. Chinese Journal of Catalysis 33(2-3), 261–
266.
Nawi, M. A., and Sabar, S. (2012). Photocatalytic decolourisation of Reactive Red 4 dye by an
immobilised TiO2/chitosan layer by layer system. Journal of colloid and interface science,
372(1), 80-87.
Shan, A. Y., Ghazi, T. I. M., Rashid, S. A. (2010). Immobilisation of titanium dioxide onto
supporting materials in heterogeneous photocatalysis: a review. Applied Catalysis A:
General, 389(1), 1-8.
Stocking, A.P.E., Sunil, K., Zoeckler, J., Liang, S., Flores, A., Rodriguez, R., Browne, T.,
Roberts, R., Brown, A., (2011). Advanced oxidation processes.
http://www.ncbi.nlm.nih.gov/pubmed/21948142.

53
CHAPTER 4
Emerging challenges
4.1 Introduction
In recent days, the emerging challenges with regard to wastewater treatment include emerging
biorecalcitrant compounds and increasing volumes of pollutants getting into municipal wastewater
treatment plants. Further, the high cost of reducing or removing toxic compounds in wastewater is
the main problem encountered by many industries and municipalities in their efforts to treat
wastewater. Treatment of wastewater is an industrial cost component that many industries would
be happy to avoid since it requires energy but may not generate capital. In particular, for industries
that produce effluents that are not easily biodegradable, aerobic biodegradation which is a relatively
expensive biological process is the typical method to use. In this process, aeration accounts for 55%
of the process energy requirement (Essam et al., 2007).
From local government perspective, most of the municipal water technologists and an engineers
are not adequately equipped with skills required to implement new techniques, which these technical
staff working in the local government may not have had any prior training. Efforts to address these
challenges, which include both emerging contaminant and the corresponding technologies,
inevitable require skill development.
4.2 Emerging contaminants
Emerging pollutants have only become an issue in recent years with the development of better
analytical techniques that are capable of detecting chemicals at low concentrations of up to ng/L
level. The environmental toxicity of emerging pollutants to humans and wildlife is still not well
understood. For this reason, most countries currently have little or no relevant legislation regulating
the release of these contaminants into surface water. However, widespread production, use and
continuous input into the environment, their persistence in the environment, bioaccumulation and
potential chronic toxicity to aquatic biota even at low concentrations have raised concerns over
emerging contaminants in recent years (Houtman, 2010). With increasing research on the effects
of emerging contaminants on the environment, these wastes are expected to be under regulation
soon (Malato et al., 2009). Therefore there is a need to develop appropriate methods for treating
emerging contaminants to be used when regulation starts. The main emerging contaminants are
associated with pharmaceuticals, textile and mineral processing.
54
Textile industry wastewater
The textile industry is considered as one of the largest water consumers in the world (Wouter et
al., 1998). Ramigi and Buckely (2006) reported that in the current environmental legislation, textile
industries have been labelled as high priority industry with respect to pollution and with specific
regard to toxicity caused by recalcitrant wastes, high salt and heavy metals in their effluent.
Wastewater which contains various pollutants is generated during various stages of the textile
manufacturing process. Specifically, the major sources of wastewater generated by the textile
industry originate from the washing (scouring) and bleaching of natural fibres and from dyeing and
finishing steps (Chen et al., 2008). Robert & Sanjeev (2005), reported that out of more than one
million tons of dyes produced, about 280,000 tons are annually discharged as effluent worldwide.
Emerging pharmaceutical contaminants
Emerging environmental contaminants are mainly organic micropollutants produced by human
activities such as pharmaceutical and personal care products (PPCPs), Endocrine Disrupting
Compounds (EDCs), illicit drugs, sweeteners, nanoparticles, flame retardants, perfluorinated
compounds, organic solvents, complexing agents, plasticizers, pesticides and surfactants detected
in trace amounts of several ng/L up to low μg/L in wastewater treatment effluents and water sources
(Houtman, 2010). From domestic, agricultural and industrial sources, these emerging contaminants
enter wastewater treatment plants (WWTPs) where their removal is usually incomplete mainly due
to their biorecalcitrant nature. Wastewater treatment facilities have therefore been identified as the
main pathway through which emerging contaminants enter surface and ground water (Baeza and
Knappe, 2011).
Pharmaceutical products form a class of emerging pollutants which include human and veterinary
medicines and their metabolites. To achieve their function, pharmaceutical drugs are designed to
persist in the body in the form in which they were ingested and are often only slightly altered before
excretion in urine and faeces (Fent et al., 2006). These drugs and their metabolites, once excreted,
maintain their persistence in the environment, resisting degradation in WWTPs and surface waters.
As a result, residues of pharmaceutical drugs have been ubiquitously detected in treated waters and
surface waters in North America, Europe and Asia (Monteiro and Boxall, 2010).

55
Acid mine drainage treatment using adsorption method
Over the last few decades there has been an increasing public awareness of the potential
environmental hazards arising from mining activities, in particular acid mine drainage (AMD).
Although any mineral deposit which contains sulphide is a potential source of AMD, certain types
of mining are more prone than others. There are records of acid drainage where coal, pyritic sulphur,
copper, zinc, silver and lead among others have been mined. Acid mine drainage affects lotic
systems in numerous and interactive ways. This results in multiple pressures, both direct and
indirect, on the organisms comprising the community structure of the ecosystem. These effects can
be loosely categorized as chemical, physical, biological and ecological, although the overall impact
on the community structure is the elimination of species, simplifying the food chain and so
significantly reducing ecological stability.
The impact of acid mine drainage on water quality in South African relates to gold and coal minings.
Gold tailings dumps have been a feature of the landscape around the large gold mining towns since
mining began and have been discharging polluted water for decades. The effect of this so-called
diffuse pollution has been particularly pronounced in the case of the Blesbokspruit in Springs and
the Klip River (which drains the southern portion of the Witwatersrand escarpment) because tailings
dumps abound in their upper catchments. The effect of the diffuse and point source pollution arising
from gold mines of the Central and Western basins is well illustrated by the salinity of the Vaal
River, which more than doubles between the Vaal Dam and the Barrage as a result of the inflow of
water from the Klip River and the Blesbokspruit (via the Suikerbos River). The low quality of water
at the Barrage necessitates the periodic release of water from the Vaal Dam to reduce the salinity
for the downstream Vaal River users. According to the inter-ministerial document of 2010, the
Western, Central and Eastern Basins are identified as priority areas requiring immediate action
because of the lack of adequate measures to manage and control the problems related to AMD, the
urgency of implementing intervention measures before problems become more critical and their
proximity to densely populated areas. The situation in other mining regions of the country requires
additional information, monitoring and assessments of risk, particularly in vulnerable areas such as
the Mpumalanga Coal Fields, where the impact of mining on the freshwater sources in the upper
reaches of the Vaal and Olifants River Systems is of serious concern.
A number of approaches have been proposed to control and manage AMD. These include: decant
prevention and management, ingress control — reduction of the rate of flooding and the eventual
decant volume and water quality management. The latter approach proposes the use of active,
passive and in-situ treatment technologies that are tailored designed for specific AMD since water
quality of AMD varies from one source to another. Treatment technologies are very expensive and
require a thorough appraisal before adoption. Because of the stringent nature of environmental

56
regulations, advanced potential technologies such as adsorption and membrane technologies are
being explored.
Other emerging pollutants in wastewater and sewage treatment plants
The wastewater treatment plants were solely meant for the treatment of domestic sewage and grey
water. However, industries emerged overtime and depending on their scales of operations some
discharged their wastewater directly in the municipal line with only primary treatment. This broad
about extra burden in terms of the infrastructure capacity, for instance almost all abattoir on the
immediate periphery of towns discharge their wastewater directly in to the municipal line. The
challenge is further intensified by the apparent lack of bylaws say for instance in Free State as
compared to Gauteng. Table 7 and Table 8 show typical emerging contaminants at the municipal
wastewater treatment plants per industry.
Table 7 Industries and their potential pollutants (Kesi, 2016)
Industry Inorganic pollutants
Gas and coke and chem. Manufacture Ammonia
Sheep dipping Arsenic
Plating Cadmium
Plating, chrome tanning, alum anodizing Chromium
Copper plating, copper pickling Copper
Gas manufacture, plating, metal cleaning Cyanides
Scrubbing of flue gases, glass etching Fluorides
Laundries, paper mills, textile bleaching Free chlorine
Plating Nickel
Textile industry, tanneries, gas manufacture. Sulfides
Tanning, sawmills Sulfites
Fertilizer industry, steel works Mercury

57
Cyanides, sulfides and ammonia are among the relatively new contaminants to the municipal
wastewater treatment plants in Emfuleni local municipality. The Emfuleni Local municipality in
Gauteng took that aspect into consideration and enlisted the services of Rand Water to monitor the
emerging contaminants. Industrial inspection is done by Rand Water on behalf of the municipality.
Samples are taken randomly on a monthly basis. For instance, at the abattoirs they analyse for fats
and oil. Table 3 highlights industries in Emfuleni and Metsimaholo local municipalities.
Table 8 Industries and pollutants (organic) (Kesi, 2016)
Industry Organic pollutant
Acetate rayon, beet root manufacture Acetic acid
Soft drinks and citrus fruit processing Citric acid
Wool scouring, laundries, textile industry Fats, oils, grease
Synthetic resins and penicillin manufacture. Formaldehyde
Petrochemical and rubber factories Hydrocarbons
Oil refining, pulp mills Mercaptans
Explosives and chemical works Nitrocompounds
Distilleries and fermentation plants Organic acids
Gas and coke manufacture, chem. plants Phenols
Food processing, textile industries Starch
Dairies, breweries, sweet industry Sugars
Dyeing, wine,$ leather, chem. manufacture Tartaric acid
Cosmatatics industry Synthetic estrogens
The management of wastewater from the above mentioned industries is regulated by water use
license. But where the industry is using municipal sewer line, some of these pollutants may go
unnoticed since they are not analysed.
4.3 Emerging treatment technologies
A single wastewater treatment unit can hardly remove complex contaminants encountered in the
present day wastes generated by industries and domestics. Consequently, the construction of
centralized sewage treatment plants began in the late 19th and early 20th centuries, principally in
the United Kingdom and the United States. Instead of discharging sewage directly into a nearby
body of water, it was first passed through a combination of physical, biological, and chemical
processes that removed some or most of the pollutants. Also beginning in the 1900s, new sewage-
collection systems were designed to separate storm water from domestic wastewater, so that
treatment plants did not become overloaded during periods of wet weather. After the middle of the

58
20th century, increasing public concern for environmental quality led to broader and more stringent
regulation of wastewater disposal practices. Higher levels of treatment were required. For example,
pre-treatment of industrial wastewater, with the aim of preventing toxic chemicals from interfering
with the biological processes used at sewage treatment plants, often became a necessity. In fact,
wastewater treatment technology advanced (ion exchange, advanced oxidation processes,
adsorption, and membrane technologies, among others) through use to the point where it became
possible to remove virtually all pollutants from sewage. This was very costly, however, such high
levels of treatment were not usually justified.
Integrated adsorption and photodegradation In adsorption, the pollutants in the wastewater accumulate on the surface of a solid (adsorbent) as a
result of intermolecular attractions. Adsorbents are some of the best support materials for TiO2
powder due to their capacity to adsorb and therefore concentrate reactants near the TiO2 attached
onto their surfaces. This concentration of reactants near the TiO2 is especially advantageous when
dealing with reactants at very low concentrations (Augugliaro et al., 2006). Since both the initial
pollutant and degradation products are to be photodegraded, the adsorbent support would need to
have a high affinity for a wide range of pollutants. As hydroxyl radicals produced by TiO2 are very
reactive, the adsorbent combined with TiO2 must be inert to these radicals. If the adsorbent is not
inert, its structure would be broken down and it will also compete with the pollutants for the
hydroxyl radicals thus reducing the rate of the photocatalysis reaction.
The AC has been widely applied for the adsorption of a wide range of organic pollutants in
wastewater and air. The major drawback of using AC for adsorption has been the fact that
commercial AC is relatively costly as compared to other adsorbents. Two modes of AC
regeneration using photocatalysis have been investigated: desorption of the pollutants from the AC
followed by pollutant photodegradation and combination of the AC and TiO2 in which the TiO2
photodegrades the pollutants adsorbed on the AC (Sheintuch and Matatov-Meytal, 1999). The
former method suffers from long regeneration cycles due to the slow rate of desorption of the
pollutants from the AC. The combined AC and TiO2 system is advantageous due to the short
diffusion paths of the pollutants from the AC to the TiO2 which increases the rate of regeneration.
Integrated photodegradation, adsorption and biodegradation (IPB)
Integration of the photodegradation and anaerobic digestion seems to have a high potential in the
treatment of wastewater streams containing recalcitrant organic compounds. However, as much as
the photocatalytic pre-treatment can lead to increased biodegradability of some recalcitrant organic

59
contaminants, it can also produce some more toxic products which can be more difficult to
biodegrade. It is therefore very important to determine whether the photodegradation should be
conducted before the anaerobic degradation, or to be employed to finally polish the anaerobically
treated wastewater, in order to get rid of the biorecalcitrant component of the wastewater in question.
This choice, however, depends on the type of wastewater to be treated. Improvement of the
integrated photodegradation/biodegradation system can be achieved by using a porous adsorbent as
a support material for microbes and the photocatalyst.
It is a fact that photodegradation of organic pollutants is a competitive technique for wastewater
treatment for the removal of those organic pollutants that are not easily treatable using biological
methods due to their high chemical stability, high toxicity and/or low biodegradability. Although
photodegradation for complete mineralisation can be expensive, its combination with biological
treatment is reported to reduce operating cost (Oller et al., 2011). On the one hand, such a system
can lead to an increase in methane yield if photodegradation is preceded by biodegradation. On the
other hand, employing photodegradation as a post-treatment for an anaerobic degradation system
may lead to thorough removal of traces of organic contaminants which might need long
biodegradation time.

60
CO
D>
guid
elin
es
CO
D>
guid
elin
es
Bio
deg
rad
able
TOC or COD
BOD
HPLC Ion chromatography
Wastewater
Preliminary
analyses
Discharge
COD<guideline
AOP
Yes
Toxicity No
>50%
Biodegradability analysis
During AOP treatment
Biodegradability
analysis
During AOP treatment Biodegradable Non
Yes
Biodegradable
TOC
No >500 ppm
biodegradable Diluted Undilute
Biological
Non-
Yes
No
Biodegradabl
Biological
treatment
AOP treatment biodegradabl
AOP Biological
treatment
Discharge
COD<guideline
Biodegradability analysis
During AOP
COD>guidelines
AOP Biodegradabilit
y analysis
During AOP
Discharge
COD<guideline
Discharge
COD<guideline
Figure 22: Integrated biological and photodegradation, adopted from Oller et al. (2009)
(a) Efficiency of the integrated biological and photochemical process
The photodegradation (AOP) and AD processes were integrated in two ways; in the first case, AD
was performed before the AOP (AD-AOP) while in the second case the AOP was conducted before
the AD (AOP-AD). In Figure 23, the results for colour and COD reduction are shown. In the first
place, results for AD system as a single treatment process is shown, the effluent from the AD system
was then fed into the AOP system and the additional pollutant removal was recorded. The sum of

61
Deg
rdati
on
, %
removal by AD and AOP is then presented as the overall removal by the AD-AOP system. Removal
by the AD-AOP system is then compared with that of the AOP-AD system. In both cases AD was
conducted for a period of 28 days while AOP was carried out for 60 minutes since this was the
optimum irradiation time.
100
80
60
Colour
40 COD
20
0
AD AOP AD-AOP AOP-AD
Figure 23: Overall COD reduction for the integrated system
Figure 23: Overall COD reduction for the integrated system shows that AD treatment alone
achieved colour removal of 32% and COD reduction of 57%. For the integrated process in which
the AOP was followed by the AD process (AOP-AD) an improved colour removal of 81% and a
COD removal of 73% was achieved. It can therefore be deduced that photodegradation pre-
treatment of MB converted the MB molecules into a form that could easily be degraded by the
consortia of microbes in the bioreactor. Also, the good COD reduction efficiency of the AD-AOP
(76%) can be attributed to the fact that the initial AD step reduced the colour of the sample and this
reduced light attenuation in the subsequent AOP unit.
(b) Energy consumption
If UV photodegradation (AOP) was employed as the only treatment method to reduce colour and
COD to above 75% as was achieved by the integrated AOP-AD system, then higher energy would
be required to drive the process. It required irradiation time of 120 minutes to achieve colour and
COD reduction of about 75% using 15 W UV lamp and this consumed 108 kJ of energy. However,
in the AOP-AD integrated system an overall COD and colour removal of above 80% was achieved
with shorter irradiation time of 60 minutes and this consumed 54 kJ. Therefore, the AOP-AD
integration consumed 50% less energy to achieve same pollutant removal than if AOP was applied
as a stand-alone process. Moreover, considering that the energy content of methane is about 38

62
MJ/m3, the energy produced by the AD process was about 3.06 kJ and this can further reduce the
energy consumption of the integrated AOP-AD system. However, it is important to note that energy
consumed by the pumps and other units was not considered in these calculations.
4.4 Conclusion
Anaerobic up-flow fixed bed reactor and annular photocatalytic reactor were used to study the
efficiency of integrated anaerobic digestion (AD) and ultraviolet (UV) photodegradation of real
distillery effluent, raw molasses wastewater (MWW) and methylene blue textile dye. It was found
that UV photodegradation as a stand-alone technique achieved colour removal of 54% and 69% for
the distillery and MWW, respectively, with a COD reduction of < 20% and a negligible BOD
reduction. On the other hand, AD as a single treatment technique was found to be effective in COD
and BOD reduction with efficiencies of above 75% and 85%, respectively, for both wastewater
streams. However, the AD achieved low colour removal efficiency, with an increase in colour
intensity of 13% recorded when treating MWW while a colour removal of 51% was achieved for
the distillery effluent. The application of UV photodegradation as a pre-treatment method to the AD
process reduced the COD removal and biogas production efficiency. However, an integration in
which UV photodegradation was employed as a post-treatment to the AD process achieved high
COD removal of above 85% for MWW and distillery wastewater samples, and colour removal of
88% for the distillery effluent. Thus, photodegradation can be employed as a post-treatment
technique to an AD system treating distillery effluent for complete removal of the biorecalcitrant
and colour imparting compounds.
For the textile dye, it was found that anaerobic degradation performed better in COD reduction than
in colour reduction, achieving 57% and 32% reduction, respectively. In contrast, photodegradation
performed better than the AD in colour reduction achieving 70% efficiency but achieved a lower
COD reduction of 54%. The efficiency of the two processes applied separately in the degradation
of MB dye was generally low. However, integrated AOP-AD system achieved better degradation
with colour and COD reductions of 81% and 80%, respectively. Moreover, it was found that UV
photodegradation pretreatment improved the biodegradability of the MB dye by 3- folds after
irradiation time of 60 minutes. Thus integration of the two processes in such a way that UV
photodegradation precedes the AD process led to higher biogas production than that of the stand-
alone AD process.
All the results reported up to this stage are from batch processes. Batch operation of reactors is
important for validation of technology and optimisation of basic operating parameters. However,
batch reactors are not efficient and cost effective and are therefore seldom used where continuous

63
reactors can be employed. The use of batch systems for photocatalysis has been extensively studied.
However, there is very little data on the use of continuous reactors for photocatalysis.
Bioenergy is a field that a lot of research efforts need to be focussed in response to the increasing
energy demands. In this regard, process optimization and catalyst development are research areas
that are attracting a lot of attention. In this context, literature shows that there is an increasing
application of computational fluid dynamic simulation technique and photocatalysts to biological
systems. This technique will provide more insight into the hydrodynamics and kinetics of biological
processes and the photocatalyst will improve bioenergy production and yield.
Projection
Bioenergy is a field that a lot of research efforts need to be focussed in response to the increasing
energy demands. In this regard, process optimization and catalyst development are research areas
that are attracting a lot of attention. In this context, literature shows that there is an increasing
application of computational fluid dynamic simulation technique and photocatalysts to biological
systems. This technique will provide more insight into the hydrodynamics and kinetics of biological
processes and the photocatalyst will improve bioenergy production and yield.

64
References
Augugliaro, V., Litter, M., Palmisano, L., Soria, J. (2006). The combination of heterogeneous
photocatalysis with chemical and physical operations: a tool for improving the photoprocess
performance. Journal of Photochemistry and Photobiology C: Photochemistry Reviews, 7(4),
127-144.
Chen, Y., Cheng, J. J., Creamer, K. S. (2008). Inhibition of anaerobic digestion process: a review.
Bioresource technology, 99(10), 4044-4064.
Fent, K., Weston, A. A., Caminada, D. (2006). Ecotoxicology of human pharmaceuticals. Aquatic
toxicology, 76(2), 122-159.
Essam, T., Amin, M.A., Tayeb, O.E., Mattiasson, B., Guieysse, B. (2007). Solar-based
detoxification of phenol and p-nitrophenol by sequential TiO2 photocatalysis and
photosynthetically aerated biological treatment Water Research, 41(8), 1697-1704.
Kesi, J. (2016), Application of Biogas Technology in South Africa, unpublished Masters project.
Malato, S., Fernández-Ibáñez, P., Maldonado, M. I., Blanco, J., Gernjak, W. (2009).
Decontamination and disinfection of water by solar photocatalysis: recent overview and trends.
Catalysis Today, 147(1), 1-59.
Monteiro, S. C., Boxall, A. B. (2010). Occurrence and fate of human pharmaceuticals in the
environment. In Reviews of environmental contamination and toxicology (pp. 53-154).
Springer New York.
Oller, I., Malato, S., Sánchez-Pérez, J. A. (2011). Combination of advanced oxidation processes
and biological treatments for wastewater decontamination—a review. Science of the total
environment, 409(20), 4141-4166.
Remigi, E.U., Buckley, C.A, (2006). Co-digestion of high strength/toxic organic effluents in
anaerobic digesters at wastewater treatment works, WRC report no. 1074/1/06.
Sheintuch, M., Matatov-Meytal, Y. I. (1999). Comparison of catalytic processes with other
regeneration methods of activated carbon. Catalysis Today, 53(1), 73-80.
65
CHAPTER 5
Water re-use
5.1 Introduction
Recent trends have focused on looking at the connections that exist between water and energy in
industries for sustainable operation. Global shortages of energy and water have rendered
comprehensive approaches to water and energy optimization even more important than ever
before, hence the work presented in this report.
Process industries have recently committed and allocated resources to mitigating the detrimental
impact on the environment due to their activities. They have made significant progress, in
conserving resources, and reducing the intensity of energy usage. These efforts have gradually
shifted from a unit-based approach to a systems-level paradigm. Process integration is a holistic
approach to process design and operation which emphasizes the unity of the process. Process
integration design tools have been developed over the past two decades to attain process
improvement, productivity enhancement, conservation in mass and energy resources, and
reductions in the operating and capital costs of chemical processes. This technique has been
successfully applied in many industries world-wide and particularly in Europe and USA. In the case
of USA processing industries, the amount of reuse and recycle of wastewater has been tremendous
- gross water use to water intake ratios exceed 7.5 in petroleum refining and 3 in chemical
production. The gross water is the amount of water that would have to be used if there was no reuse
and recycle.
Water-energy nexus concept
Whilst the concept of water-energy nexus is inherent in most systems, it has been ignored for many
years, thereby leading to missed opportunities. In the past, energy and water systems have been
developed and managed independently. Water plays a critical role in the generation of electricity
and energy is required to treat and distribute water. This has been true for many decades, but the
water and energy systems have investigated and developed independently.
Recently, process integration techniques have been applied in a South African main power plant
with the objective of reducing the water intake. This objective can be achieved by identifying water
sources (providers) and sinks (users) in the water network, followed by matching appropriate
sources and sinks as water quality allows. The water network, therefore, first has to be compiled

66
and flow and quality data can subsequently be allocated to process units in the network. The process
integration tool showed savings of between 4% and 13% of the water intake by changing the way
water is currently utilized and reused at the station. Management of the cooling cycle, and especially
blowdown water, together with related procedures have a significant impact on the amount of
freshwater intake and are responsible for the bulk of the possible savings identified by the work
since most of water used at the station is supplied to the cooling towers. Optimization of water
utilization in the power station has a direct impact on the amount of waste produced, which translates
into at least 50% (or more) reduction in wastewater management costs. This is mainly due to savings
in freshwater consumption.
Background on water-energy nexus
Water plays a critical role in the generation of electricity and energy is required to treat and
distribute water. This has been true for many decades, but the water and energy systems have been
investigated and developed independently. Recent trends have focused on looking at the
connections that exist between water and energy in industries for sustainable operation. The water-
energy nexus has recently become more important since water resources are also becoming scarce.
For instance, drought in the United States recently resulted in limited availability of water affecting
operation of some power plants and other energy production activities. The recent unconventional
oil and gas production using hydraulic fracturing, so called fracking, has also showed the strong
interdependence between water and energy resources. Climate change, population growth and
uplifting people from poverty mainly require managing water and energy in an integrated manner.
Policies addressing water rights and water impacts of energy further bring incentives to study the
water-energy nexus.
These trends may present challenges, but they also present opportunities. They can result in
strategic approaches for technology research and development (R&D) to address regional water-
energy issues and also have impact at the national and global scale. Enhancing and integrating data
and models will better inform researchers, decision makers and the public. Figure 24 shows the
macro scale water-energy flow in the United States on a national scale, where water is used for
producing energy and energy is used to treat and distribute water for human use. Thermoelectric
power generation withdraws approximately 40% of freshwater for cooling and dissipates significant
quantity of energy due to inefficiencies in converting thermal energy to electricity. Agriculture
competes directly with the energy sector for water resources. However, agriculture also contributes
to the energy sector via production of biofuels. These clearly signify the clear connection between
energy and water. Future technologies for carbon capture and sequestration could further increase

67
the water intensity of most energy systems, whereas the use renewable energy sources, such as solar
and wind can lower it.
Figure 24 Hybrid diagram of 2011 US interconnected water and energy flows
Source: US Energy Information Administration (EIA) 2011 Annual Energy Review (AER)
report.
Process integration
The major consumers of water in the process industries in South Africa are chemical,
petrochemical, textile, paper, cellulose, food and beverage industries, as well as power plants. As
water resources are becoming scarcer, these industries are under increasing pressure to minimize

68
water consumption. Water minimization initiatives are also driven by strict environmental
regulations, rising public awareness and increase in the cost of freshwater and effluent treatment. It
is also worth mentioning that the South African agricultural sector consumes more than 60% of
water. However, a larger part of this water is recovered through boreholes, thereby rendering this
sector almost self-sufficient.
Pollution of global water bodies is becoming an international concern due to its noticeable effect
on human health. Processing industries are at the forefront when it comes to water pollution since
they produce hazardous waste. Industrial facilities require large quantities of freshwater and thus
produce considerable amounts of wastewater. The traditional method of water pollution control in
industry is the use of end-of pipe (centralized) treatments, where all effluent streams are combined
and sent to a common treatment system. However, this approach tends to increase the treatment cost
and results in a higher capital cost to build the treatment facility. The current trend is to reduce
freshwater consumption and wastewater generation within the chemical process, which can be
achieved by using process integration.
Process integration is a systematic and general method for designing integrated production
systems, ranging from individual processes to total sites, with special emphasis on the efficient use
of energy and reducing environmental effects. The first trend of process integration emerged as
pinch analysis (PA), which was developed in the 1970s/1980s based on the discovery of a heat
recovery pinch. The main motivation was to give solution to the process industries to reduce their
energy requirements due to the energy crises the world faced during the well-known energy
embargo of the seventies... Based on the analogy of heat and mass transfer, the second trend, i.e.
mass integration was then established in late 1980s for the synthesis of mass exchange network
(MEN), and many other pollution prevention practices (El-Halwagi, 1997). The most important
special case of mass integration that received good attention from both academic and industrial
practitioners is water minimization. Process integration technique for water minimization is initiated
by identifying water sources (providers) and sinks (users) in the water network, followed by
matching appropriate sources and sinks as water quality allows. This implies that the water network
has to be confirmed a priori, with flow and quality data subsequently allocated to process units in
the network.
In the context of water minimization, process integration could be described as a systematic
technique used to analyze, synthesize, design and optimize a water network system for reducing
freshwater consumption and minimize wastewater generation. Typical steps involved in any
industry related to freshwater and wastewater minimization include:
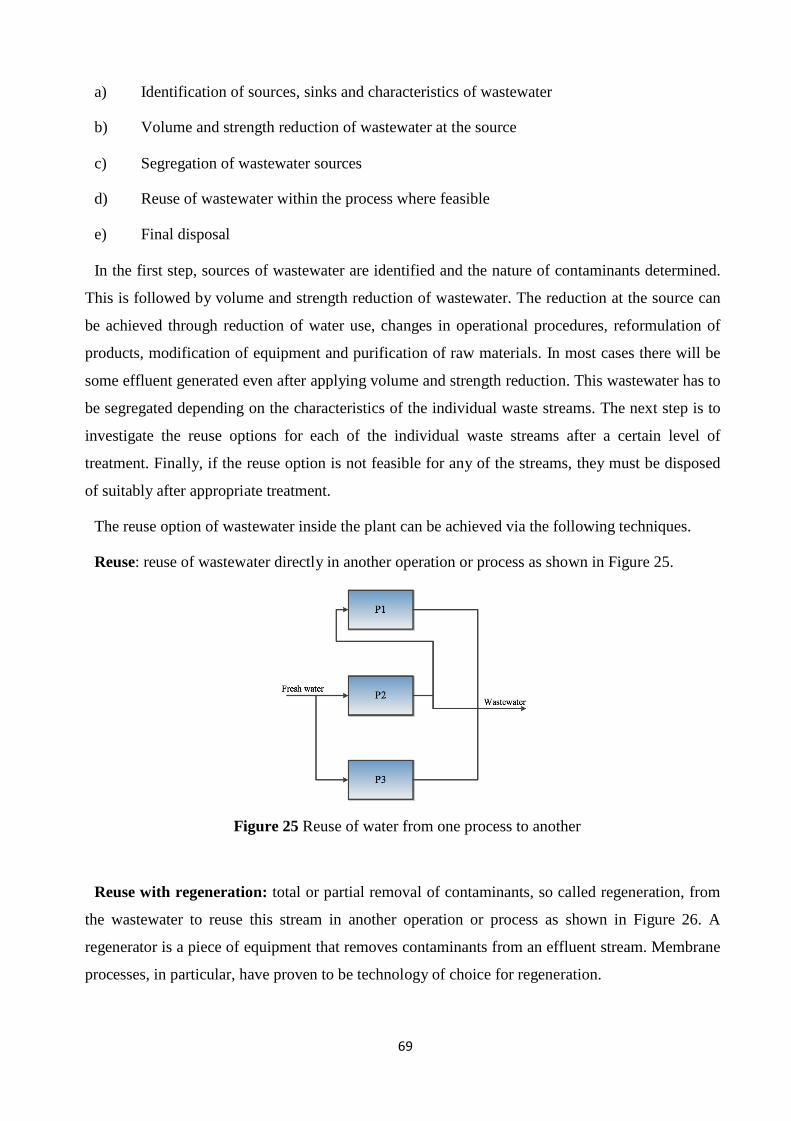
69
a) Identification of sources, sinks and characteristics of wastewater
b) Volume and strength reduction of wastewater at the source
c) Segregation of wastewater sources
d) Reuse of wastewater within the process where feasible
e) Final disposal
In the first step, sources of wastewater are identified and the nature of contaminants determined.
This is followed by volume and strength reduction of wastewater. The reduction at the source can
be achieved through reduction of water use, changes in operational procedures, reformulation of
products, modification of equipment and purification of raw materials. In most cases there will be
some effluent generated even after applying volume and strength reduction. This wastewater has to
be segregated depending on the characteristics of the individual waste streams. The next step is to
investigate the reuse options for each of the individual waste streams after a certain level of
treatment. Finally, if the reuse option is not feasible for any of the streams, they must be disposed
of suitably after appropriate treatment.
The reuse option of wastewater inside the plant can be achieved via the following techniques.
Reuse: reuse of wastewater directly in another operation or process as shown in Figure 25.
Figure 25 Reuse of water from one process to another
Reuse with regeneration: total or partial removal of contaminants, so called regeneration, from
the wastewater to reuse this stream in another operation or process as shown in Figure 26. A
regenerator is a piece of equipment that removes contaminants from an effluent stream. Membrane
processes, in particular, have proven to be technology of choice for regeneration.

70
Figure 26. Reuse with regeneration
Recycling with regeneration: total or partial removal of contaminants (regeneration) from
wastewater to reuse it in the same operation or process where it was produced as shown in Figure
27.
Figure 27 Recycling with regeneration
The application of the techniques described above has the benefit of reduction in the final
wastewater flowrate, reduction in cost of wastewater disposal and reduction in freshwater use. All
operational practices whose objective is to minimize the generation of effluent require a change in
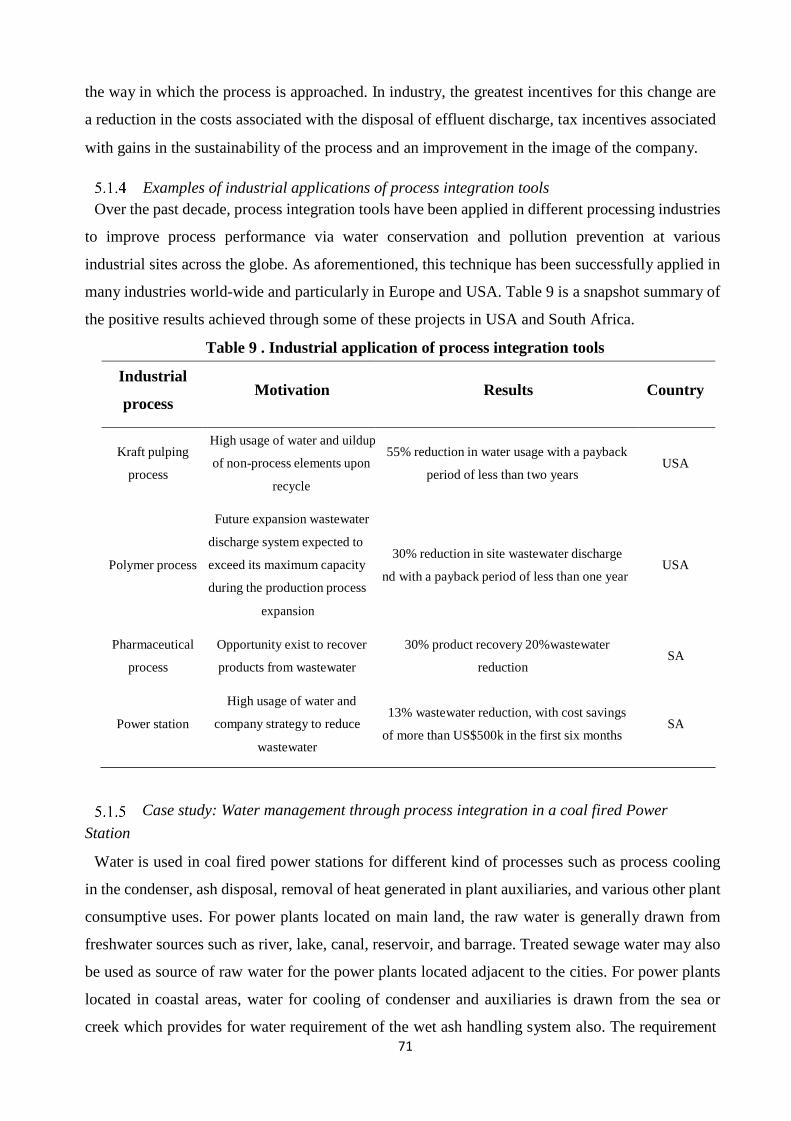
71
the way in which the process is approached. In industry, the greatest incentives for this change are
a reduction in the costs associated with the disposal of effluent discharge, tax incentives associated
with gains in the sustainability of the process and an improvement in the image of the company.
Examples of industrial applications of process integration tools
Over the past decade, process integration tools have been applied in different processing industries
to improve process performance via water conservation and pollution prevention at various
industrial sites across the globe. As aforementioned, this technique has been successfully applied in
many industries world-wide and particularly in Europe and USA. Table 9 is a snapshot summary of
the positive results achieved through some of these projects in USA and South Africa.
Table 9 . Industrial application of process integration tools
Industrial
process
Motivation
Results
Country
Kraft pulping
process
High usage of water and uildup
of non-process elements upon
recycle
55% reduction in water usage with a payback
period of less than two years
USA
Polymer process
Future expansion wastewater
discharge system expected to
exceed its maximum capacity
during the production process
expansion
30% reduction in site wastewater discharge
nd with a payback period of less than one year
USA
Pharmaceutical
process
Opportunity exist to recover
products from wastewater
30% product recovery 20%wastewater
reduction
SA
Power station
High usage of water and
company strategy to reduce
wastewater
13% wastewater reduction, with cost savings
of more than US$500k in the first six months
SA
Station
Case study: Water management through process integration in a coal fired Power
Water is used in coal fired power stations for different kind of processes such as process cooling
in the condenser, ash disposal, removal of heat generated in plant auxiliaries, and various other plant
consumptive uses. For power plants located on main land, the raw water is generally drawn from
freshwater sources such as river, lake, canal, reservoir, and barrage. Treated sewage water may also
be used as source of raw water for the power plants located adjacent to the cities. For power plants
located in coastal areas, water for cooling of condenser and auxiliaries is drawn from the sea or
creek which provides for water requirement of the wet ash handling system also. The requirement

72
of water for other plant consumptive uses is met from an alternative source or by installing
desalination plant.
A typical list of plant systems/applications requiring consumptive water is:
a) Cooling water system for condenser & plant auxiliaries
b) Ash handling system
c) Power cycle make-up
d) Equipment cooling system
e) Air conditioning and ventilation system
f) Coal dust suppression system
g) Service water system
h) Potable water system
i) Gardening
j) Evaporation from raw water reservoir
The details on water using and water producing operations are given below. Minimizing plant
water requirements needs actions such as rational use of water in each processes, regeneration of
deteriorated quality water, directly using wastewater in another process that requires low grade
water and recycle and reuse of wastewater streams.
(a) Cooling water system
Cooling water is used to condense the exhaust steam leaving from turbine, secondary cooling in
heat exchangers for cooling equipment, and other plant auxiliaries. 60,000 m3/h of water is
circulated in a condenser to cool the exhaust steam in typical 500 MW power generating facility.
The temperature rise across the condenser is about 100C. A once through type or closed cycle type
of cooling system can be employed. Once through types of cooling systems are mostly used in
coastal regions with a restriction of the discharge temperature of the hot water not more 70C above
the temperature of receiving water body. In case of once through systems, the additional evaporation
from the surface of the water body to dissipate the imposed heat load by the power station amounts
to about 1% of the circulating water flowrate. On the other hand, closed cycle systems involve a
cooling tower where 1.5-1.7% of the water circulated in the condenser is lost through evaporation.
Drift loss amounts to typically 0.05% of the cooling/circulating water flow. Make-up water is
needed in case of closed cycle systems, to compensate for loss of water on account of evaporation,

73
drift and blowdown. The latter is necessary to maintain a desired level of dissolved solids in the
circulating water. The requirement of make-up water (M) to be supplied, and blowdown water (B)
to be discharged, are dependent on cycles of concentration (C) of the circulating water system as
indicated below:
and ( 1)
(2)
where, E is evaporation from cooling tower, D is drift loss to the atmosphere, and C is the cycles
of concentration of the circulating water system. The permissible cycles of concentration which can
be maintained in the circulating water system is dependent on quality of cooling tower make-up and
scheme of cooling water treatment adopted. The blowdown water from the cooling tower can be
used for disposal of bottom ash, and unutilized blowdown, if any, is led to central monitoring basin
(CMB) of the plant for further utilization/ treatment/ disposal outside the plant boundary. The
quantum of blowdown water can be further reduced by increasing the cycles of concentration which
can be achieved by suitably improving the chemical regime of circulating water, if feasible.
(b) Ash handling system
For a typical 500 MW power plant with a 40% ash content coal results in generation of about 140
ton/h ash. This ash is made up of fly ash and bottom ash with a ratio of 80:20 respectively. Most of
the time water is used to dispose of the ash as a wet slurry and sent to ash ponds. Due to
environmental concerns, thermal power plants are looking at options to minimize water
requirements in wet ash disposal for bottom ash and dry disposal for fly ash. The reduction of
consumptive water requirement includes reducing water to ash ratio for slurry disposal, recirculation
of ash pond water and use of high concentration slurry disposal (HCSD) system for fly ash.
Currently most power plants are characterized by slurry concentration of 30% for fly ash and 25%
for bottom ash. In some power plants the use of recirculated ash pond water has resulted in a
reduction of water requirement of ash handling by 30%. The HCSD system for handling fly ash
demands positive displacement pumps, since the concentration of solids by weight is more than
60%, as compared to lean slurry transportation which is about 25 – 30% concentration. Currently
there are technologies that can be used to transport fly ash without the use of water. However,
bottom ash has to be disposed in wet/semi-wet form since proven technology for dry evacuation of
74
bottom ash is not available for large size plants. Cooling tower blowdown can be a good source for
transporting and disposal of ash. For power plants that use ash water recirculation system, about
70% of ash water is expected to be recovered and available for reuse. Under these conditions cooling
tower blowdown would be sufficient as a make-up water for the ash handling system. Consequently,
the use of raw water for the ash handling system is completely avoided. If HCSD system is used
instead of wet slurry system for disposal of fly ash, available cooling tower blowdown would suffice
to meet water requirements of HCSD system and no additional water would be required from raw
water source.
(c) Power cycle make- up
Power cycle make-up refers to demineralized (demin) water added in condenser hotwell to
compensate for loss of water due to boiler blowdown and other losses from the system. The quantum
of blowdown water depends on boiler steam parameters and quality of make-up demin water. In the
past, the demin water make-up requirement of power cycle has been amply considered even up to
the order of 8% of boiler maximum continuous rating (BMCR) flow. Over a period of time, this
requirement has been reducing, and now a days, design power cycle make-up is generally taken as
3% of boiler maximum continuous rating (BMCR) flow. Accordingly, power cycle make-up
requirement for a typical 500 MW unit shall be about 50 m3/h. In practice, plants are being managed
with further reduced make-up, as large size units are provided with condensate polishing units
(CPU) and materials of better metallurgy used in feed heating and boiler components. In the present
study, power cycle make has been considered as 2% of BMCR flow.
(d) Coal dust suppression
Water is usually sprayed over heaps of crushed coal, belt conveyors, and transfer points and during
coal unloading in order to reduce the negative environmental impact of fugitive dust emissions. The
amount of water required for coal dust suppression depends upon size of coal stockyard, coal
consumption rate, volatility of coal and ambient conditions. Normally, low- grade water such as
cooling tower blowdown or plant wastewater is used for coal dust suppression. In order to reduce
plant water consumption, water available from drains of coal yard can be recovered and reused for
coal dust suppression water system.
(e) Minimizing effluent discharge
Wastewater generated in a thermal power plant typically includes clarifier sludge, filter backwash,
cooling tower blowdown, regeneration waste of demin plant and CPU, and boiler blowdown etc.
Normally, clarifier sludge is disposed of along with ash slurry and boiler blowdown is led to central

75
monitoring basin (CMB) of the plant. Water required for wet ash disposal is tapped from cooling
tower blowdown, and unutilized blowdown water, if any, is led to the CMB.
In the present study, clarifier sludge is considered to be treated for removal of solid waste, and
recovered water is recycled to inlet of the clarifier. Filter backwash water from filters of demin plant
and potable water system are also considered to be recycled to inlet of the clarifier. The boiler
blowdown is considered to be usable in cooling water system to supplement the make-up water as
it is expected to have negligible impact on cooling tower inlet temperature. Water from plant drains
and filter backwash is treated in effluent treatment plant (ETP), and recovered water is collected in
the CMB. Requirement of water for low grade applications such as coal dust suppression and
gardening is met from CMB. The wastewater in CMB has high TDS as a result of regeneration
waste and cooling tower blowdown water. If water were to be recovered from this wastewater for
recycling in the plant, its treatment would require application of membrane separation technology.
5.2 Methodology
The adopted approach in this study was to build the mathematical model from mass balances and
solving it using the General Algebraic Modelling System (GAMS) software. GAMS is a high-level
modelling system for mathematical programming and optimization, which can handle complex,
large and multicomponent systems. Its main strength lies in the comprehensive suite of solvers that
are tailored to various types model structures. The following sections highlight the sequence of steps
as applicable to this case study.
Data gathering and analysis
(a) Flow sheet
Kriel power station management provided the water balance diagrams, specified process water
quality standards for certain units, and Saltman water and salt balance modelling spreadsheet. In
an iterative process between ART and Kriel personnel, a process flow diagram of water flow at the
power station was developed. Figure 28 shows the developed diagram of water utilization at the
power station. Certain operations. Such as floor washing also utilize other sources at times, but this
diagram was found to be the norm of the current situation.

76
Kriel water flow diagram
Figure 28 The diagram developed served as the basis for further development of the
GAMS model.
(b) Sources and sinks
Water sources and sinks were identified from the process flow diagram. Table 10 shows the
respective processes classified as water sources and sinks. Note that a process unit may serve as
both a source and a sink for example a cooling tower has a demand for water and is a source of
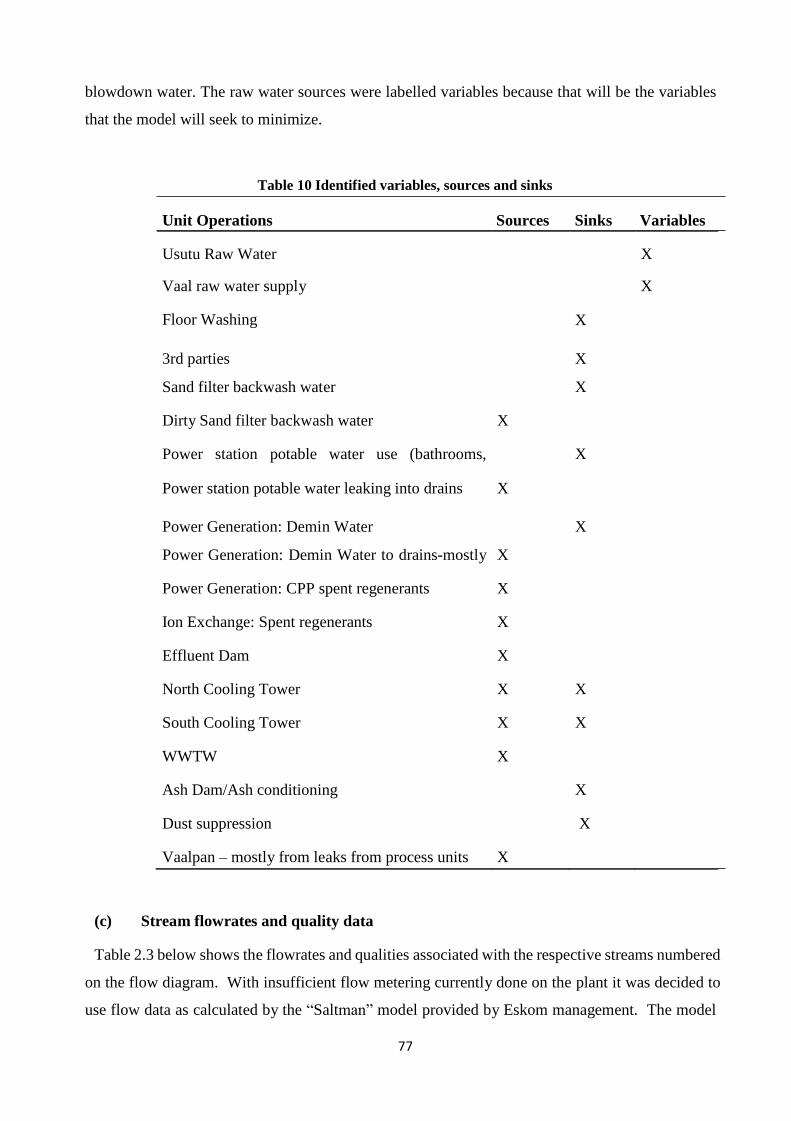
77
blowdown water. The raw water sources were labelled variables because that will be the variables
that the model will seek to minimize.
Table 10 Identified variables, sources and sinks
Unit Operations Sources Sinks Variables
Usutu Raw Water
X
Vaal raw water supply X
Floor Washing
X
3rd parties
X
Sand filter backwash water
X
Dirty Sand filter backwash water
X
Power station potable water use (bathrooms,
X
Power station potable water leaking into drains
X
Power Generation: Demin Water
X
Power Generation: Demin Water to drains-mostly
X
Power Generation: CPP spent regenerants
X
Ion Exchange: Spent regenerants
X
Effluent Dam
X
North Cooling Tower
X
X
South Cooling Tower
X
X
WWTW
X
Ash Dam/Ash conditioning
X
Dust suppression
X
Vaalpan – mostly from leaks from process units
X
(c) Stream flowrates and quality data
Table 2.3 below shows the flowrates and qualities associated with the respective streams numbered
on the flow diagram. With insufficient flow metering currently done on the plant it was decided to
use flow data as calculated by the “Saltman” model provided by Eskom management. The model

78
calculates the water balance for the station based on chosen operational parameters and received
water qualities. This data corresponds well with the available metered values. The stream qualities
are as given by Kriel staff. The values in bold are estimated values.
The model used by ART can incorporate multiple components (such as sulphates, conductivity,
Total Dissolved Solids etc), however, it was decided to initially use only Total Dissolved Solids
(TDS) as modelling parameter. The main reason for this is a lack of available data for other
components. For some streams TDS values had to be correlated from conductivity measurements –
an accepted practice at lower ion activities such as found with these stream compositions. Stream
compositions for all process streams will be needed if more components are to be incorporated.
Importantly, especially the sulphate concentration is of concern as it may often be the limiting
parameter in cooling towers (when the allowable sulphate concentration is exceeded before other
limits are reached). This is further investigated in the discussion surrounding cooling towers.

79
1 Usutu Raw water from Davel Reservoir 14749 43 68.1
2 Fire-hydrants 2203 43 68.1
3 Sludge to effluent 444 61 95
4 Dirty backwash water to drains 444 48 75
5 Filtered water 14305 45 70.4
Water 3rd parties 45 70.4
Water to Kriel town 45 70.4 9, 11 Water to Kriel mine and NW Shaft 45 70.4
Water to contractors 45 70.4
Water to kwanala centre 45 70.4
3rd parties 3000 45 70.4
10 Clean filter backwash water 444 45 70.4
12 Potable to Power Station 3000 45 70.4
13 Demin water feed 7862 45 70.4
14 Demineralized water production 7506 0 0.07
15 Demineralized water to Power Station 6824 0 0.07
16 Water to CPP regeneration 682 0 0.07
17 Deminiralized water to regeneration 682 0 0.07
18 HP Demineralized to Power Station by 0 0 0.07
19 Demin water to station drains 3412 0 0.07
20 Potable water to Sewage plant 300 255 400
21 Potable water to Station drains 1890 58 91
22 Vaal raw water supply 92778 130 204
23 Usutu Raw water to north cooling system 0 45 70.4
24 Recovered water from Vaalpan 800 732 1150
25 Recovered sewage effluent 1216 249 391
26 North cooling tower blow down 3177 2548 4000
27 North cooling tower clarifier sludge 714 2548 4000
28 Spent regenerants to effluent system 1039 127 200
29 Usutu raw water to south cooling system 0 45 70.4
30 Recovered water from the maturation pond 0 567 890
31 Recovered water fron coal stock yard 0 510 800
32 South cooling tower blow down 6467 2548 4000
33 South cooling tower clarifier sludge 627 2548 4000
34 Sewage from the Power Station 300 255 400
35 Sewage from the Kriel mine 1350 255 400
36 Sewage effluent for use in cooling 0 249 391
37 Sewage effluent to ash dams 0 249 391
38 Sewage effluent to the environment 0 249 391
39 Sewage sludge to drying beds 50 249 391
40 Ash conditioning 1400 6369 10000
41 Dust suppression 400 2548 4000
Table 11 Stream values and qualities
Flow
Stream quality
Stream Stream description (rmat3e/d) TDS Conductivity (uS/cm)
6 -

80
Modelling
GAMS software is used to develop the process integration model. As described on the GAMS
website (www.gams.com, March 2014), GAMS is specifically designed for modelling linear,
nonlinear and mixed integer optimization problems. The system's inherent solvers allow a user to
solve complex problems with a simple and very flexible setup.
The received data in Table 11 is used to develop a model that generates a water use network by
calculating optimal distribution of available water sources (at specified qualities) with the goal of
minimising the intake of freshwater as well as wastewater generated. It is also worth noting that the
regeneration process unit in the superstructure allows for the calculation of optimum placement and
capacity of a water treatment facility.
(a) Mathematical model
The mathematical formulation is based on the superstructure shown if Figure 29.
Figure 29 Superstructure for the mathematical model
Sets

81
Continuous variables
Binary variable
Parameters
Constraints Regenerator constraints

82
Constraints are shown below. Constraint (1) states that the total flowrate into a regenerator is
made up of individual flows from each source to the regenerator. Constraint (2), on the other hand
stipulates that the outlet stream from a regenerator is the sum of all the streams to various sinks from
the same regenerator. Constraint (3) gives the inlet concentration of contaminant c into the
regenerator. Lastly, constraint (4) is the definition of the rejection rate that is specific to contaminant
c in regenerator r.
(1)
(2)
(3)
(4)
Water using operations constraints
Constraint (5) states that the total flowrate into sink i comprises the freshwater flowrate plus the
total flow from all the relevant sources and the flow from the regenerator. In its current form, this
constraint assumes a single regenerator. Constraint (6) states that the outlet stream from source j is
made up of wastewater that is dispensed with as effluent, the overall reuse stream from source j to
all the relevant sinks, as well as the water stream into the regenerator. Constraint (7) states that the
total load of contaminant c into sink i cannot exceed the maximum allowed load of the same
contaminant in the sink. Lastly, constraint (8) is a feasibility constraint that ensures that all the
flowrates in the final design are within allowable limits.
(5)
(6)
(7)
(8)

83
Objective function
The objective function focusing on the minimization of the total freshwater intake into the facility
is given in constraint (9a). It may also include the amount of wastewater generated as in (9b) or
minimize the costs associated with intake of freshwater and treatment of wastewater as in (9c)
(9a)
(9b)
(9c)
All three objective functions were used by ART to minimize the respective variables. This
eventually will enable power station management to make decisions from both a water use target
and cost point of view.
Further constraints can be added to prevent unwanted or impractical solutions. However, the idea
is not to eliminate all the degrees freedom, hence forcing only one solution, but to leave the model
to calculate how distribution of resources could be most efficiently achieved.
5.3 Results and discussion
Model that optimizes the water utilization network
As discussed earlier, flow data used in the model was taken from the Saltman model provided by
Eskom. The freshwater intake of 109 730 m3/day predicted by the Saltman model compares well
to the current 110 to 115 Ml/d water usage reported by station personnel. Note that this value, which
would be the point of reference to compare the findings from this study against, translates into a
litres per unit of electricity sent out (l/uso) value of above 2.35. This is significantly more than the
reported design spec of 1.8 l/uso or current 2.19 l/uso target for the station. Two separate models
were compiled, 1) with a regeneration unit or desalination plant that is able to clean water with a
high salt load to produce good quality effluent that can be re-used, and 2) a model that optimizes
the water utilization network without a regenerator being used.
With each of the two models, three different objective functions were set (given by equations 9 a -
c) to minimize freshwater intake, freshwater and wastewater combined or costs associated with
water intake and treatment respectively. Each of this targets provide unique networks and different

84
targets to work towards by station management, whether it is in order to reach the minimum
freshwater intake, to minimize waste production or endeavoring to minimize costs associated with
water usage and waste management. After formulating the initial model with sources and sinks as
listed in Table 2.2, it was apparent that certain modelling outcomes could contribute to more
effective water management, but may not necessarily be implemented without further investment
or certain commitments by station management. The outcomes are:
A - Re-use of wastewater treatment plant effluent: Currently the connecting infrastructure between the wastewater treatment plant (WWTP) and the
power station is in a state of disrepair. The plant’s effluent is also of a poor quality. It will require
capital investment to upgrade or replace the treatment plant and refurbish the connecting
infrastructure.
B - Allowing interchange of blowdown water between the two cooling towers
With the two cooling towers operating at different cycles of concentration (CoC), the blowdown
water of the South cooling tower (operated at lower CoC) is of acceptable quality to feed into the
North cooling tower. If recycling of blowdown to the towers is being incorporated, a careful study
of possible accumulation of contaminants at steady state conditions will have to be conducted first.
Too high salt concentrations may damage infrastructure in the cooling loop.
C – Use of any water for floor washing operation
From preliminary results it seems possible that preventing certain sources that might be harmful
to operators from going to floor washing can have a significant influence on the water network.
This may be sources such as sewage plant effluent or ion exchange regenerants.
In order to test the impact of each of these possibilities, eight scenarios were created as shown in
Table 12, thus allowing each of A, B and C or not. The scenarios were created by adding or removing
constraints from the GAMS model.

85
Table 12 Senarios modeled
Scenarios Re-use WWTP
water
Blowdown
interchange
allowed
Floorwash water
from any source
Currently NA NA NA
Scenario 1 No Yes Yes
Scenario 2 Yes Yes Yes
Scenario 3 Yes No Yes
Scenario 4 No No No
Scenario 5 No No Yes
Scenario 6 No Yes No
Scenario 7 Yes No No
Scenario 8 Yes Yes No
The
reasoning behind investigating different scenarios is that water saving can thus be quantified for
each scenario and associated cost be determined for eventual use in a cost benefit analysis.
Ultimately it is important to keep in mind that all of these findings result from very specific inputs
to the models and any findings must be evaluated in this light.
The findings for the three discussed objective functions when run on both models, with and without
a desalination plant, is presented and evaluated.
Objective function: Minimize freshwater intake
As discussed earlier the current freshwater intake into the station ranges from 110 – 115 ML/d.

86
Without regenerator/desalination plant
The model was run for each of the scenarios and respective objective function values obtained as
shown in Table 13.
Table 13 Minimum Freshwater usage for respective scenario's without a desalination plant
WW - Wastewate; FW- Freshwater;
Z- objective function; Fr - Total flow
nto Regenerator; STP -Sewage
Treatment Plant; Fret - flow out of
regenerator
Re-use
WWTP
water
Blowdown
interchange
allowed
Floorwash
water from
any source
Z as FW usage without
Regen in ML/d
Currently NA NA NA FW 112 WW 10
Scenario 1 No Yes Yes FW 96.801 WW 0
Scenario 2 Yes Yes Yes Fw 95.591 WW 0
Scenario 3 Yes No Yes Fw 103.581 WW 8.008
Scenario 4 No No No Fw 104.86 WW 8.052
Scenario 5 No No Yes Fw 103.8 WW 6.994
Scenario 6 No Yes No Fw 96.801 WW 0
Scenario 7 Yes No No Fw 104.651 WW 9.06
Scenario 8 Yes Yes No FW 95.591 WW 0
The figures reported in Table 13 translate into freshwater savings of 13% for scenarios 8 and 2, to
4% for scenario 4 or l/uso, respectively. The absolute minimum amount of freshwater intake with
the current operational parameters (obtained from Saltman and station personnel) is 95.6 ML/d in

87
scenarios 2 and 8 corresponding to 2.04 l/uso, which is still above both the design target of 1.8 l/uso,
but lower than the present station target of 2.19 l/uso. Remember that the l/uso value at the start of
this project was about 2.35.
As the current usage figures were used as demands for respective sinks, the above savings are
calculated even with prevailing leaks. Hence any savings achieved by fixing leaks etc. can be
directly subtracted from these values.
From the results where scenario’s 1, 2, 6 and 8 with blowdown interchange allowed it is also clear
that, with different cycles of concentration and hence different water chemistry in the cooling water
of the cooling towers, significant savings may lie in utilizing blowdown water from the two cooling
cycles correctly. As mentioned before these values are for very specific input parameters that may
show optimistic results, however, even if these results may be exaggerated the trend of water savings
with interchange of blowdowns remains. The re-use of WWTP effluent contributes close to 3%
savings in freshwater intake and a further 2 – 3% savings can be added if the model has the freedom
to allocate any source’s water to floor washing. It is also interesting to note that scenario 4 where
none of A, B or C is allowed still manages a 3% reduction in freshwater intake through optimizing
the water use network.
Appendix I shows the water networks suggested by the model to achieve the minimum objective
function for each scenario. These networks can be used as a starting point to identify the so called
low hanging fruit. Practical infeasibilities appearing on these networks can be corrected by
collaborating with station personnel to identify them during the implementation stage and
investigating the effect of altering the model to eliminate the infeasibility. Water networks for the
subsequent runs with other objective functions are not shown as these are to a large extent
representative of those networks. However, it is recommended that each is individually evaluated
during the implementation phase of the project.
With regeneration/desalination plant
Table 2.6 shows the minimum freshwater intake achieved by the model with a regeneration plant
for the respective scenarios as defined before. Note that scenarios 1, 2, 6 and 8 are for all intents
and purposes the same as the values achieved by the model without a desalination plant, while the
values for the other scenarios are in the order of 5 - 8% lower than findings in Table 14.
Table 14 Minimum freshwater usage for respective scenarios with a desalination plant

88
Treatment Plant; Fret -
of regenerator
flow out water allowed any source
Currently NA NA NA FW 112 WW 10
Scenario 1
No
Yes
Yes
FW 96.81
WW 0
Scenario 2
Yes
Yes
Yes
Fw 95.591
WW 0
Scenario 3
Yes
No
Yes
Fw 95.92
WW 0
Scenario 4
No
No
No
Fw 97.62
WW 0
Scenario 5
No
No
Yes
Fw 97.51
WW 0
Scenario 6
No
Yes
No
Fw 96.801
WW 0
Scenario 7
Yes
No
No
Fw 96.14
WW 0
Scenario 8
Yes
Yes
No
FW 95.591
WW 0
WW - Wastewater; FW-
Freshwater; Z- objective
function; Fr - Total flow into
Regenerator; STP -Sewage
Re-use
WWTP
Blowdown
interchange
Floorwash
water from
Z as FW usage with
Regen in ML/d
When evaluating the networks (not shown) suggested by the models it can be concluded that the
reason why scenarios 1, 2, 6, and 8 have the same values is that they already have no liquid waste
stream even when there is no regeneration unit. These are also the scenarios that allowed an
interchange of blowdown streams, thereby eliminating the waste. Scenarios 3, 4, 5 and 7 however,
had waste streams in 3.1.1 which are treated by the desalination plant to be reintroduced in the
cooling cycle, thus lowering the required freshwater intake.
Most significant of these observations are that no desalination plant is necessary if the water
networks suggested for the scenario’s with equal objective function values are found to be valid and
feasible.

89
Treatment Plant; Fret -
out of regenerator
flow water allowed any source
Currently NA NA NA FW 112 WW 10
Scenario 1
No
Yes
Yes
FW 96.801
WW 0
Scenario 2
Yes
Yes
Yes
Fw 95.591
WW 0
Scenario 3
Yes
No
Yes
Fw
103.581
WW 8.008
Scenario 4
No
No
No
Fw 104.86
WW
8.052
Scenario 5
No
No
Yes
Fw 103.8
WW
6.994
Scenario 6
No
Yes
No
Fw 96.801
WW 0
Scenario 7
Yes
No
No
Fw
104.651
WW 9.06
Scenario 8
Yes
Yes
No
FW 95.591
WW 0
Objective Function: Minimize freshwater intake and wastewater
Without regenerator/desalination plant
Table 1 shows exactly the same freshwater and generated wastewater volumes as the findings from
3.1.1, even when the waste is added as part of the objective function to be minimized. Optimum
utilization of water sources therefore also translates into minimization of waste as previous waste
streams are re-used by re-structuring the water use network.
Table 15. Minimum combined freshwater usage and waste without a desalination plant
WW - Wastewater; FW-
Freshwater; Z- objective
function; Fr - Total flow into
Regenerator; STP -Sewage
Re-use
WWTP
Blowdown
interchange
Floorwash
water from
Z as FW+WW without
Regen in ML/d
As in 3.1 scenarios utilizing the blowdown, or a portion of the blowdown water, from one cooling tower as
feed water in another show the most promising figures. This also leads to a zero liquid effluent discharge as

90
the purge of accumulated salts is achieved by using the remaining blowdown water for ash conditioning.
Once again this emphasizes the importance of managing the decision making regarding the frequency of
blowdown as well as the utilization of blowdown water.
With regeneration/desalination plant
Adding a regenerator to the equation enables the model to send any residual waste for treatment and so
minimizing the waste while having more fresh (regenerated) water as a source. It can be seen in Table 2.8
that the scenarios that did not have any waste streams before still have the same objective function values
when compared to findings from 3.2.1., while the scenario’s that previously had waste streams now have
significantly lower objective functions.

91
Table 16 Minimum combined freshwater usage and waste with a desalination plant
WW - Wastewater; FW-
Freshwater; Z- objective function; Fr
- Total flow into Regenerator; STP -
Sewage Treatment Plant; Fret - flow
out of regenerator
Re-use
WWTP
water
Blowdown
interchange
allowed
Floorwash
water from
any source
Z as FW+WW with
Regen in ML/d
Currently NA NA NA FW 112 WW 10
Scenario 1
No
Yes
Yes
FW 96.81
WW 0
Scenario 2
Yes
Yes
Yes
Fw 95.591
WW 0
Scenario 3
Yes
No
Yes
Fw 95.92
WW 0
Scenario 4
No
No
No
Fw 97.62
WW 0
Scenario 5
No
No
Yes
Fw 97.51
WW 0
Scenario 6
No
Yes
No
Fw 96.801
WW 0
Scenario 7
Yes
No
No
Fw 96.1
WW 0
Scenario 8
Yes
Yes
No
FW 95.591
WW 0
From these findings one can conclude that a desalination plant does make a difference in reducing
wastewater as well as the freshwater intake when effluent management enters the equation.
Objective Function: Minimizing cost of freshwater intake and waste treatment
Costs associated with water utilization and waste management at Kriel Power Station can be
calculated in several ways as discussed in the following three sub-sections.
Without regenerator/desalination plant and waste disposed on ash dams

92
According to internal Eskom information, Kriel power station currently pays R6 068/ML for
freshwater obtained from the Vaal scheme and R8 045/ML for water obtained from the Usuthu
scheme. Cost of treatment of sewage water is estimated to be R4 000/ML (Sezani and Marlene,
2012). No costs are currently paid for waste disposal as cooling water purge streams are disposed
of on the ash dams. As seen in Table 17, with no regeneration plant, costs are minimized as
freshwater intake is minimized. Even if this is the current situation at the power station, attributing
no cost to waste management reduces this table’s value for future decision making as waste
management threatens to take on significant costs in the future.
Table 17. Minimum cost while waste can be disposed of on ash dams.
WW - Wastewater; FW- Re-use Blowdown Floorwash Z as cost of
FreshwaterC; Zurrently function; Fr
NA water
NA allowed
NA any source
FWR+S7T12P0w0i0t.h0o0ut FW 112 WW 10
RegeneratoScenario- 1 No Yes Yes R 601 613.64
Treatment Plant; Fret FW WW 0
out of regeSnceernataorrio 2 Yes Yes Yes R 598 662.29 FW 95.59 WW 0
Scenario 3
Yes
No Yes R 653 783.55 FW WW
Scenario 4
No
No No R 653 783.55 Fw WW
Scenario 5
No
No Yes R650 522.06 FW WW
Scenario 6
No
Yes No R606 724.32 FW WW 0
Scenario 7
Yes
No No R659 005.30 FW WW
Scenario 8
Yes
Yes No R 604 237.60
With regeneration/desalination plant and disposal of brine to landfill
FW WW 0
DWA intends to prohibit the disposal of saline streams on ash dams in the near future. This means
blowdown water will have to be treated via a desalination plant. Costs to do that will be in the order
of R5 000 to R10 000 (with the R10 000 figure being used in the model) per ML treated plus
R1 970 000 for disposal of brine. This treatment costs includes attenuation of capital costs and were
conservatively deducted from previous ART studies for desalination plants, while the disposal costs
for brine are from a quote supplied by a waste management company late in 2013. Figure 30
illustrates the cost allocation used in the model for this section.
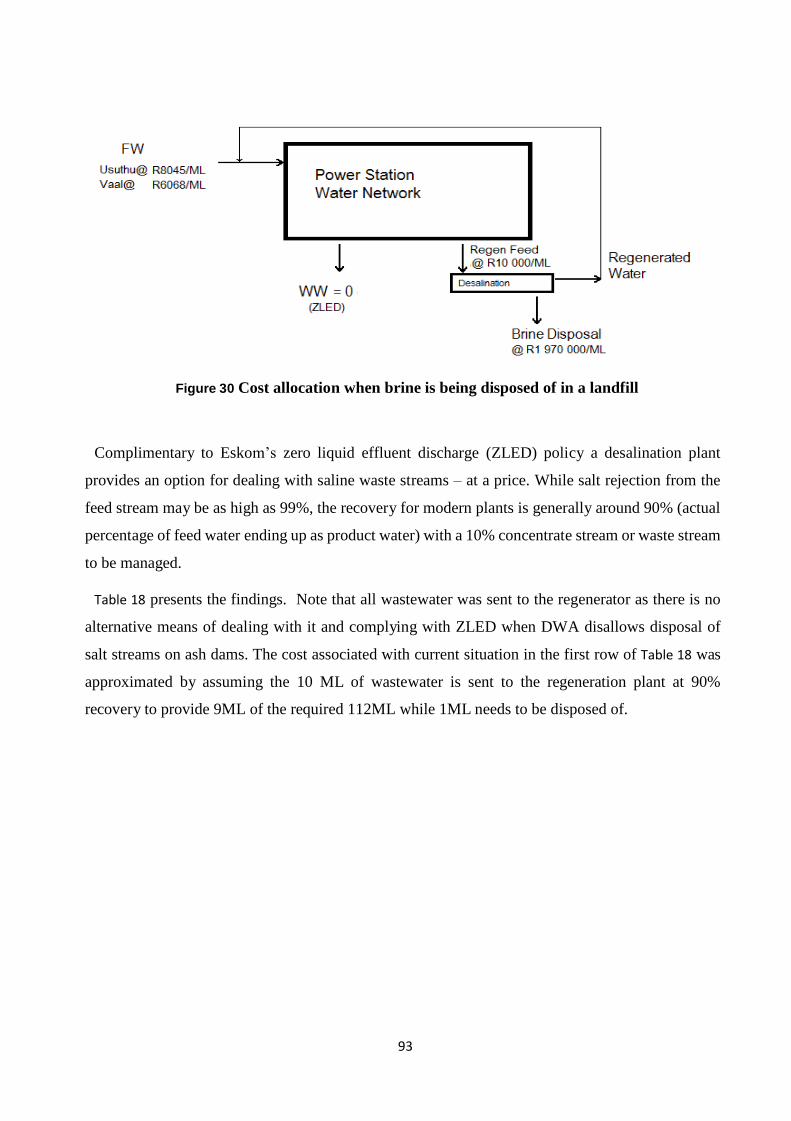
93
Figure 30 Cost allocation when brine is being disposed of in a landfill
Complimentary to Eskom’s zero liquid effluent discharge (ZLED) policy a desalination plant
provides an option for dealing with saline waste streams – at a price. While salt rejection from the
feed stream may be as high as 99%, the recovery for modern plants is generally around 90% (actual
percentage of feed water ending up as product water) with a 10% concentrate stream or waste stream
to be managed.
Table 18 presents the findings. Note that all wastewater was sent to the regenerator as there is no
alternative means of dealing with it and complying with ZLED when DWA disallows disposal of
salt streams on ash dams. The cost associated with current situation in the first row of Table 18 was
approximated by assuming the 10 ML of wastewater is sent to the regeneration plant at 90%
recovery to provide 9ML of the required 112ML while 1ML needs to be disposed of.

94
Table 18. Minimum cost when disallowing any wastewater
WW - Wastewater; FW-
Freshwater; Z- objective
function; Fr - Flow into
Regenerator; STP -Sewage
Treatment Plant; Fret - flow out
of regenerator
Re-use
WWTP
water
Blowdown
interchange
allowed
Floorwash
water from
any source
Z as cost of
Fw+Fr+Fret+STP with
Regen in ZAR
Currently
NA
NA
NA
R2600 000.00
FW 112 WW 10
Scenario 1
No
Yes
Yes
R601 806.30
FW 96.81 WW 0
Scenario 2
Yes
Yes
Yes
R596 807.89
FW 95.195 WW 0
Scenario 3
Yes
No
Yes
R2 099 949.78
FW 95.92 WW 0
Scenario 4
No
No
No
R2 287 548.83
Fw 97.62 WW 0
Scenario 5
No
No
Yes
R2 071 249.33
FW 97.51 WW 0
Scenario 6
No
Yes
No
R607 707.10
FW 96.81 WW 0
Scenario 7
Yes
No
No
R2 560 558.52
FW 96.14 WW 0
Scenario 8
Yes
Yes
No
R602 789.35
FW 95.7 WW 0
With Regeneration/Desalination Plant and Brine management on site
The findings above show how the wastewater treatment costs render the cooling tower blowdown
management critical, even when it can simply be sent to the treatment plant to re-produce
freshwater.
Furthermore the model’s suggested water networks for scenarios that previously produced no
wastewater (Scenarios 1, 2, 6 and 8) still prevents any water from being treated by the desalination
and this translates into costs that amount to a fraction of that for the other scenarios.

95
An alternative to the cost structure different from the above scenario is to include brine
management facilities with the desalination plant at a cost of R40 000/ML (also estimated from
previous ART studies) of wastewater treated by the plant. These costs include the capital costs
attenuated and may be less for a more energy efficient technology such as eutectic freeze or much
more if energy costs are high. Figure 31 illustrates the cost allocation in the model for this section.
Figure 31. Alternative treatment cost allocation for Desalination plant
As before the cost associated with current situation in the first row was estimated by assuming the
10 ML of wastewater is sent to the regeneration plant at 90% recovery to provide 9ML of the
required 112ML of freshwater. The results in Table 19 indicate at least 50% cost reduction with on-
site waste management compared to landfilling costs of brine. The results in Table 19 indicate at
least 50% cost reduction with on-site waste management compared to landfilling costs of brine.

96
Table 19. Minimum cost with brine treatment incorporated in treatment costs
WW - Wastewater; FW-
Freshwater; Z- objective
function; Fr - Flow into
Regenerator; STP -Sewage
Treatment Plant; Fret - flow out
of regenerator
Re-use
WWTP
water
Blowdown
interchange
allowed
Floorwash
water from
any source
Z as cost of
Fw+Fr+STP with
Regen in ZAR
Currently NA NA NA R1 200 000.00
FW 112 WW 10
Scenario 1 No Yes Yes R601 806.30
FW 96.81 WW 0
Scenario 2 Yes Yes Yes R596 807.89
FW 95.195 WW 0
Scenario 3 Yes No Yes R890 340.12
FW 95.92 WW 0
Scenario 4 No No No R931 176.32
Fw 97.62 WW 0
Scenario 5 No No Yes R891 594.88
FW 97.51 WW 0
Scenario 6 No Yes No R607 707.10
FW 96.81 WW 0
Scenario 7 Yes No No R982 706.13
FW 96.14 WW 0
Scenario 8 Yes Yes No R602 789.35
FW 95.7 WW 0
Further discussion
(a) Cooling Tower Blowdown Management
As shown throughout the minimization models in this section, feeding blowdown from a cooling
tower operated at a lower cycles of concentration into one operated at a higher CoC (like the South
and North cooling towers respectively), can save a lot of water. Doing this in effect changes the
salt balance around the cooling tower operated at lower CoC and thus the operating conditions must
be carefully evaluated. The developed GAMS model assumes steady state and therefore the
accumulation of salts as blown down is continuously recycled is not automatically calculated.
Appendix II contains an example of the mass balance to be conducted around the cooling towers
before a change to the water network is to be implemented. This is a critical part of the
implementation phase.
The following aspects of cooling tower operation must be taken into consideration at Kriel:
The “Chemistry standard for Cooling Water” at Kriel sets maximum TDS and Sulphate
concentrations in cooling water at the same level for both cooling towers. This however contradicts
97
the reported different CoC for the two towers unless operational staff manages blowdown on
different levels. It would be strongly advised to appoint a task team to revisit the way it is being
managed.
General operational “habits” and philosophies regarding the use of cooling water also
compromise the conservation of water. This goes hand in hand with the abovementioned bullet.
With the cooling cycles’ proportionately large water usage, maintenance of any leaking
equipment (such as ejector weirs) in the cycle may contribute significant water savings and must be
managed and executed diligently.
(b) Freshwater consumption target
The original (design spec.) water consumption target for Kriel Power Station is reported to bel 1.8
l/uso. It is important to note that this target was set for better quality coal, thus increasing the
efficiency of the generation cycle and possibly also better freshwater quality which would allow
higher cycles of concentration and therefore less make-up water needed. If the findings from the
model can be incorporated a water consumption of 2.04l/uso may be achieved at the reduced 95ML
of freshwater per day and this value may be improved on by eliminating current losses.
It is important to also note that improving the power factor of the plant through optimizing the
cooling towers (refurbishment, better water quality etc.) or improving boiler performance (better
coal quality or optimization of boiler/cooling cycle interaction) the water consumption rate is also
improved as the unit sent out improves. The relationship between cooling tower efficiency and
power generation also contributes significantly to this. A PhD student has recently completed a
study of the interdependent optimization of the cooling tower and boiler as part of his doctorate
degree (Ndlovu, 2013).
Selected cost benefit analysis
The following findings from section 3 were chosen to do a high level cost benefit analysis in order
to get a provisional estimation of the value that may be contributed by each option.
(a) Sewage Treatment Plant
A current heuristic rule for costing of activated sludge sewage treatment plants is a cost of R1
million per Ml/d plant capacity. For package treatment plants this cost is in the region of 20% lower.
For a plant capacity of 1.6Ml/d needed this translates into cost of +- R1.3 Million for a new package
treatment plant at Kriel.

98
If it is assumed that treated sewage is at the required quality to replace 1ML of freshwater per day,
this amount to a saving of R6064*30 = R182 000/month or R2.2 Milllion per year. This figure
justifies the upgrade or replacement of the sewage treatment plant and also prioritising the
refurbishment/replacement of the current piping infrastructure from the sewage treatment plant to
the power station that is in a dilapidated state.
(b) Blowdown management
Given the points discussed, the cost of an appointed task team to investigate findings from this
study and investigate cooling tower operations at Kriel in general must be weighed up against
expected savings from the work they perform. For a scope entailing a desktop investigation and
interviews with internal specialists, it is being assumed for this evaluation’s purposes that a team of
2 specialists will spend 360 man hours at approximately R1000/h on such a study. Translating to a
cost of R360 000. If 50% of the 13% freshwater savings from the findings in 3.1 of this project
associated with blowdown management can be achieved, it translates into at least R50 000 of
savings daily or R1.5 Million per month. That is discounting associated wastewater treatment costs.
(c) Regeneration/Desalination plant
With capital costs attenuated into treatment costs freshwater produced from wastewater sent to a
desalination plant will cost an estimated R30 to R50/m3 compared to the R6/m3 currently paid for
Vaal freshwater. In terms of the freshwater consumption targets a desalination plant also only shows
an improvement in the scenarios evaluated earlier that do not allow blowdown from one cooling
tower to be re-used in the other. This is largely due to total elimination of blowdown waste when
these streams are carefully managed.
As the abovementioned waste elimination is only achieved by using a portion of the blowdown
water on ash dumps, the one situation where there would be no other option but some form of
wastewater treatment or regeneration is when DWA disallows this practice and therefore forces
another form of wastewater treatment.
5.4 Conclusions and recommendations
The following conclusions can be made from the findings in this document:
Savings of between 4% and 13% may be possible by changing the way water is currently
utilized and re-used at the station. These figures translate into l/uso figures of 2.23 to 2.04
respectively with February 2014 consumption values (the current station target being 2.19 l/uso
according to station personnel). These savings still do not achieve the design water consumption

99
target of 1.8 l/uso. The same objective function values are achieved by minimizing freshwater
consumption or the sum of freshwater consumption and wastewater produced.
Reuse of the wastewater treatment plant effluent has a direct impact on water consumption
and investment in infrastructure to enable the introduction of good quality sewage effluent into the
cooling towers shows savings in the order of R2.2 million per year.
Optimization of the stations water network still brings 3% savings without implementation
of any of the three preliminary findings mentioned.
Observations on site showed a significant amount of water ends up in the station drains.
With the bulk of water use at the station going to the cooling towers it is expected that regardless if
any other of the findings of this study is implemented, effective maintenance on cooling cycle
equipment (such as valves, ejector weirs etc.) may reduce water consumption by as much as 5% or
R1 million/month. Findings in this report are based on input water demands (for respective unit
process) that include prevailing leaks at the station. Any savings through maintenance is additional
to the results already shown in this report.
Management of the cooling cycle and especially blowdown water with related procedures
have a significant impact on the amount of freshwater intake. A thorough understanding of the
intricacies of cooling tower operation and performance is critical to optimise this. The appointment
of a task team to perform this work approximates savings of R1.5 Million per month after initial
investment of an estimated R360 000 and it is highly recommended.
As the water use target is measured in relation to the amount of power generated, the
measurement can be improved by optimizing the cooling cycle/boiler relationship. It is
recommended that a task team using process optimization tools is implemented to investigate this.
If saline waste streams cannot be prevented (where blowdown interchange is infeasible) a
desalination plant improves on freshwater consumption figures and serves to aid Eskom’s ZLED
policy. In instances where no waste is produced the desalination plant adds no value in terms of
freshwater consumption or otherwise.
With the incorporation of a desalination plant the daily costs associated with water will
rise from around R700 000 per day to R1 million – R2.5 million per day depending on the waste
management option chosen.
It was found that optimization of the power stations water utilization has a direct impact
on the amount of waste produced which translates into a 50% (or more) reduction in waste
management costs (apart from savings in freshwater consumption).

100
Implementation of any of the water networks or portions of it should be foregone by a well
executed HAZOP study with risk management. Neglecting to identify instances where the loss of
a necessary good quality stream is not introduced to a unit process may lead to equipment damage.
Ultimately it is important to keep in mind that all of these findings result from quite specific
inputs to the models and any findings must be evaluated in this light.
This work has showed the clear water energy nexus that exist in the power plant. Flows of
energy and water are basically interweaved each other. Optimizing the freshwater efficiency in
electricity generation will play a great role to tackle freshwater scarcity the world is facing. The
reason being approximately 40% of freshwater withdrawal in developed nations is used for power
generation.
5.5 Action plan
ART recommend the appointment of a task team based at Kriel, with input from experts from head
office and other supporting Eskom structures. The team will draft an action plan from findings of
this project that may include the following tasks:
The water networks recommended by the optimization model are shown in Appendix I.
These networks can be used as a starting point to identify the so called low hanging fruit. Practical
infeasibilities appearing on these networks can be corrected by identifying them with station
personnel and investigating the effect of altering the model to eliminate the infeasibility as part of
the implementation of the project.
Look at current listed projects. Prioritise according to the GAMS models’ suggested water
networks
Appoint and manage a task team optimizing cooling tower operations (with specific
attention to water quality management).
Involve specialist to optimise Boiler/Cooling Tower interaction. Any improvement here
translates into a multiple improvement in the l/uso target achieved.
With several leaks and losses due to infrastructure in a poor condition it is suggested that
the action plan include a directive to the engineering team to focus attention on updating
maintenance plans and schedules for equipment in the cooling cycle.
Conduct a HAZOP study before implementation of findings.
101
References
Dunn, R.F., El-Halwagi, M.M. (2003). Process integration technology review: background and
applications in the chemical process industry. J. Chem. Technol. Biotechnol. 78:1011–1021
Kriel Management, (2014). Kriel WAF Report 2013 -2014 Linnhoff, B., Townsend, D.W., Boland, D., Hewitt, G.F., Thomas, B.E.A., Guy A.R.., and
Marsland, R.H. (1982) “A User Guide on Process Integration for the Efficient Use of Energy,"
IChemE UK
El-Halwagi, M. M. (1997). "Pollution Prevention through Process Integration", Academic Press. Ndlovu, M. (2014) Optimization of Power Plant Utility Systems Using Process Integration, PhD
Thesis, University of Pretoria
Sezani and Marlene, 2012, Green Drop Requirements 2013 South African Wastewater Services
Incentive-based Regulation, DWA Smith, R. (1995), Chemical Process Design, McGraw-Hill, New York.
U.S. Department of Energy, (2014). The Water-Energy Nexus: Challenges and Opportunities.
Wang, Y. P., and Smith, R. (1994). Wastewater minimization, Chem Eng Sci, 49(7): 981 - 1002.
www.GAMS.com, 2014
102
CHAPTER 4
Skill gap
Water management is very broad and hence requires varied specs of skills. A number of studies
conductive in many provinces in South Africa have shown a worrying situation amongst personnel
responsible with managing our small water treatment plants (SWTPs). In terms of administrative
issues, some plant operators were found not to have adequate knowledge of the functioning of the
SWTPs and most were unable to calculate chlorine dosage, determine flow rates or undertake repairs
of basic equipment. Poor working conditions, frequent stock depletion of chemicals, lack of
maintenance culture, lack of emergency preparedness and poor communication were also cited. To
improve performance of SWTPs local governments must audit the skills they have and require to
sustainably manage water resources. Broadly they should ensure qualified staff in the following
knowledge domains are available: process engineering, microbiology, chemistry and management.
In addition as part of continuous professional development the local government should offer
periodic training especially to plant operators and develop retention strategies by ensuring that
highly skilled personnel have clear career growth path and are their rewards are commensurate with
their qualification and skills.
6.1 Water engineers
Crucial to water management, though, is the role of engineers. In South African for every 3,166
people one is one engineer. During the RTD, the expert from Namibia, Prof Samuel John, reported
that in Namibia, for every 1639 people one is an engineer. Compared to South Africa, one may
tend to justify the numbers on the basis of population difference; approximately 2.5 million in
Namibian compared to 54 million in South Africa currently. The other side of the story is a
comparison between South Africa and a fellow BRICS country, like India, with a very huge
population (approx. 1.27 billion). For every 136 people in India one is an engineer. This compels us
to look elsewhere to explain the disparity. One may blame this on history, which is true to some
extent. However, more importantly, the disparity could be more to do with our mind set than history.
If history created the mind-set then it is not too late to develop a curriculum that will create a
paradigm shift. This we must done collectively and now. A study conducted by Hosking and Jacoby
(2013) show that of the 13 local municipalities sampled in the whole country, one engineer serves
90,925 people.
6.2 Water technicians
Over the years the number of competent technicians working in the local government has been
decreasing due to retirement and migration. The replace of those leaving has been slow due to a
lack of mentoring programme in place. The emphasis here in on those who are both qualified and

103
competent. There are many jobless technicians in the market with paper qualifications but at the
same time there exist many unfilled vacancies for the same category of people. Of the 13
municipalities there were 243 unfilled posts for technicians in 2009/2010, out of which, 155 were
in Ethekwini municipality.
6.3 Water management inspectors
Water management inspectors are in a special category of experts that must be distinguished from
engineers and technicians. The inspectors need to have technical, managerial and legal knowledge
on water and environmental issues. The role of an inspector should be more preventive than
corrective.
6.4 Process integration practitioners and skills gap in South Africa
NRF/DST Chair in Sustainable Process Engineering at the University of the Witwatersrand is the
only research group that develops and applies process integration tools for wastewater minimization
in process industries. Promoting education and training professionals in this area will be required
for sustainable development. Therefore, this research group is critical and has to grow in the country
for providing young and experienced engineers with the required skills and competences which help
to cope with the labour market demands and rapid development, particularly in the water and
wastewater industry.
6.5 Conclusion and way forward
Conclusions
While wastewater is perceived as burden with regard to the financial implication of managing and
treating it, there are opportunities to harness benefits from wastewater to point of turning some costs
into profit. For instance, energy cost can be significantly reduced by adopting biogas technology.
There is seem to a link between biodiversity, food production and wastewater that needs to be
investigated further to get the full benefit of the nutrients removed from the sewage.
The process integration technique described above has a potential to reduce the energy and water
requirements of process industries. This technique has successful applied in many industries in
Europe and US. The gross water is the amount of water that would have to be used if there was no
reuse and recycle. This project will investigate where South Africa process industries stand when it
comes to reuse and recycle and propose potential solutions for best practice of water and wastewater
management.
In this work, it is proposed that the solution to the challenges facing both the anaerobic degradation
and photocatalytic degradation of organic pollutants lies in the integration of the two processes.

104
This is based on the possibility that photocatalytic pre-treatment of toxic pollutants can increase
their biodegradability before conducting the anaerobic process. Moreover, the cost of energy
required by the photodegradation process can be offset by the energy generated by the anaerobic
process.
Way forward
Proposed interventions based on early warning indicators
It was reported that an estimated 63% of South Africans dwell in urban areas, with 40% in
metropolitan municipalities. The population estimates project that in 15 years, 7.8 million more
people will move from rural areas to cities in South Africa and that in 2050, another 20 years from
then, a further 6 million. Given the figures, some of the recommendations that came from the
discussion are that there is need to:
(a) Coordinate advisory functions and apply differentiated regulations;
(b) Inculcate in the public a sense of deep reverence for water as is the case in Middle East;
(c) Generate ideas that can be converted into content, which result in development of relevant
curriculum to equip people with skills relevant our situation;
(d) Develop more skills in science and engineering;
(e) Collect and exchange data identify, priorities, pollution sources and hotspots;
(f) Generate region specific data and extrapolate, to other regions, only where applicable and
(g) Implement low-cost but efficient technologies and management strategies such as
intelligent pressure regulation.
6.5.2.1 Priority issues
There was a detailed discussion on the challenges and possible interventions, all of which cannot
be included here. However, as a way of example the question about obtaining clean water from sea
water came up several times. In response to the question, Dr Beason Mwaka (Water and Sanitation
Department) explained that it costs R12 to produce 1000 L clean water from sea water. The same
volume can be produced at a cost of R8 and R1 of from sewage and river water, respectively. For
sea water or sewage to be used as a source of clean water engineers would work hard to reduce the
treatment cost. The critical issues were identified as.
a) Water leaks and other un-accounted water losses
b) Skill development
c) Maintenance of the infrastructure

105
REFERENCES
Al-Momani, F., Touraud, E., Degorce-Dumas, J. R., Roussy, J., Thomas, O. (2002).
Biodegradability enhancement of textile dyes and textile wastewater by VUV photolysis.
Journal of photochemistry and Photobiology A: Chemistry, 153(1), 191-197.
Arruda, S.M; Souza, G.U; Xavier, M.F; Silva, A.; Souza, A.A.U. (2011). Water reuse and
Wastewater minimization in chemical industries using differentiated regeneration of
contaminants.
Augugliaro, V., Litter, M., Palmisano, L., Soria, J. (2006). The combination of heterogeneous
photocatalysis with chemical and physical operations: a tool for improving the photoprocess
performance. Journal of Photochemistry and Photobiology C: Photochemistry Reviews, 7(4),
127-144.
Beltrán, F. J., García-Araya, J. F., Álvarez, P. M. (1999). Wine distillery wastewater degradation.
1. Oxidative treatment using ozone and its effect on the wastewater biodegradability. Journal
of agricultural and food chemistry, 47(9), 3911-3918.
Brosillon, S., Djelal, H., Merienne, N., Amrane, A. (2008). Innovative integrated process for the
treatment of azo dyes: coupling of photocatalysis and biological treatment. Desalination,
222(1), 331-339.
Burton, S., B. Cohen, S. Harrison, S. Pather-Elias, W. Stafford, R. van Hille, and H. von Blottnitz
2009. ENERGY FROM WASTEWATER – A FEASIBILITY STUDY. Essence report. Water
Research Council.
Chun, H., Yizhong, W. (1999). Decolorization and biodegradability of photocatalytic treated azo
dyes and wool textile wastewater. Chemosphere, 39(12), 2107-2115.
Denison, J., Wotshela, L., 2009. Indigenous water harvesting and conservation practices: historical
context, cases and implications. Water Research, Commission Report No. TT 392/09, Pretoria,
RSA.
Edwards, W. Sheldon, M.S., Zeelie, P.J., de Jager, D., Dekker, L.G., Bezuidenhout, C.C.
(2013).water Re-use using dua-stage memberane Biorector for industrial effluent treatment.
WRC report no TT556/13.
El-Halwagi, M. M. (1997) "Pollution Prevention through Process Integration", Academic Press.
Fernández-Ibáñez, P., Malato, S., De Las Nieves, F. J. (1999). Relationship between TiO2 article
size and reactor diameter in solar photoreactors efficiency. Catalysis Today, 54(2), 195-204.
106
Gomes de Moraes, S., Sanches Freire, R., Duran, N. (2000). Degradation and toxicity reduction
of textile effluent by combined photocatalytic and ozonation processes. Chemosphere, 40(4),
369-373.
Gould, J., 1999. Contributions Relating to Rainwater Harvesting. Sutherland, D.C.,Fenn, C.R.,
2000. Assessment of Water Supply Options, Thematic Review IV.3 prepared as an input to the
World Commission on Dams, Cape Town.
Hosking, S.G, Jacoby, K.T., (2013) Trends in the insight into the growing South Africanmunicipal
water service delivery problem, WRC Report no 2087/1/P/13.
Huang, M., Xu, C., Wu, Z., Huang, Y., Lin, J., Wu, J. (2008). Photocatalytic discolorization of
methyl orange solution by Pt modified TiO2 loaded on natural zeolite. Dyes and Pigments,
77(2), 327-334.
Klavarioti, M., Mantzavinos, D., Kassinos, D. (2009). Removal of residual pharmaceuticals from
aqueous systems by advanced oxidation processes. Environment international, 35(2), 402-417.
Knüppe (2010): The challenges facing sustainable and adaptive groundwater management in
South Africa. http://www.wrc.org.za.
Malato, S., Fernández-Ibáñez, P., Maldonado, M. I., Blanco, J., Gernjak, W. (2009).
Decontamination and disinfection of water by solar photocatalysis: recent overview and trends.
Catalysis Today, 147(1), 1-59.
Mati, B., De Bock, T., Malesu, M., Khaka, E., Oduor, A., Meshack, M., Oduor, V., 2006. Mapping
the potential of rainwater harvesting technologies in Africa. In: A GIS Overview on
Development Domains for the Continent and Ten Selected Countries. Technical Manual No. 6.
World Agroforestry Centre (ICRAF), Netherlands Ministry of Foreign Affairs, Nairobi, Kenya,
pp. 126.
Miranda, M. P., Benito, G. G., Cristobal, N. S., Nieto, C. H. (1996). Color elimination from
molasses wastewater by Aspergillus niger. Bioresource Technology, 57(3), 229-235.
Mwenge Kahinda, J., Boroto, R.J. Taigbenu, A. E., 2005. Developing an Integrated Water
Resources Management and Rainwater Harvesting Systems in South Africa. Paper Presented
at the 12th SANCIAHS Symposium. September 5–7, 2005, Johannesburg, RSA, (CD format).
Mwenge Kahinda, J., Taigbenu, A.E., Boroto, R.J., 2010. Domestic rainwater harvesting as an
adaptation measure to climate change in South Africa. Journal Physics and Chemistry of the
Earth 35, 742–751

107
Nawi, M. A., Sabar, S. (2012). Photocatalytic decolourisation of Reactive Red 4 dye by an
immobilised TiO2/chitosan layer by layer system. Journal of colloid and interface science,
372(1), 80-87.
Oller, I., Malato, S., Sánchez-Pérez, J. A. (2011). Combination of advanced oxidation processes
and biological treatments for wastewater decontamination—a review. Science of the total
environment, 409(20), 4141-4166.
Pant, D., Adholeya, A. (2007). Biological approaches for treatment of distillery wastewater: a
review. Bioresource technology, 98(12), 2321-2334.
Pathade. G.R. (2003). A review of current technologies for distillery wastewater treatment,in: P.K.
Goel (Ed.). Advances in Industrial Wastewater Treatment, ABD Publishers, Jaipur, India, 180–
239.
Prinz, D., 2002. The Role of Water Harvesting in Alleviating Water Scarcity in Arid Areas. In:
Keynote Lecture, Proc., International Conference on Water Resources Management in Arid
Regions. 23–27 March, 2002, Kuwait Institute for Scientific Research, Kuwait, (vol. III, 107–
122).
Reddy, S. S., Kotaiah, B. (2005). Decolorization of simulated spent reactive dye bath using
solar/TiO2/H2O2. International Journal of Environmental Science & Technology, 2(3), 245-
251.
Riemann K, Louw D, Chimboza, N and Fubesi, M (2012). A proposed groundwater management
framework for municipalities in South Africa. Water SA Vol. 38 No. 3 International
Conference on Groundwater Special Edition 2012
Savin, I. I., Butnaru, R. (2008). Wastewater characteristics in textile finishing mills.
Environmental Engineering Management Journal (EEMJ), 7(6), 859–864
Scott, J. P., Ollis, D. F. (1995). Integration of chemical and biological oxidation processes for
water treatment: review and recommendations. Environmental Progress, 14(2), 88-103.
Seid, E.R., Majozi, T. (2014). Optimization of energy and water use in multipurpose batch plants
using an improved mathematical formulation. Chem. Eng. Sci. 111, 335-349.
Serpone, N., Sauve, G., Koch, R., Tahiri, H., Pichat, P., Piccinini, P., Hidaka, H. (1996).
Standardization protocol of process efficiencies and activation parameters in heterogeneous
photocatalysis: relative photonic efficiencies ζ. Journal of photochemistry and photobiology A:
Chemistry, 94(2), 191-203.

108
Shan, A. Y., Ghazi, T. I. M., Rashid, S. A. (2010). Immobilisation of titanium dioxide onto
supporting materials in heterogeneous photocatalysis: a review. Applied Catalysis A: General,
389(1), 1-8.
Sheintuch, M., Matatov-Meytal, Y. I. (1999). Comparison of catalytic processes with other
regeneration methods of activated carbon. Catalysis Today, 53(1), 73-80.
South Africa 1997. Water Services Act (Act 108 of 1997).
Statistics SA, 2006. Census 2001, Metadata information on households and housing.
<http://www.statssa.gov.za/census01/html/households.pdf>
Winter D., 2011. Power Outages and their Impact on South Africa’s Water and Wastewater
Sectors. Water Research Council. WRC Report No. KV 267/11
WISA 2007. HandBook for the operation of Wastewater treatment works. Water Institute of
Southern Africa.
Zainudin, N. F., Abdullah, A. Z., Mohamed, A. R. (2010). Characteristics of supported nano-TiO2
ZSM-5/silica gel (SNTZS): Photocatalytic degradation of phenol. Journal of hazardous
materials, 174(1), 299-306.
Zhang, X., Lei, L. (2008). Effect of preparation methods on the structure and catalytic performance
of TiO2/AC photocatalysts, Journal of hazardous materials, 153(1), 827-833.
Wang, Y. P., and Smith, R. (1994). Wastewater minimization, Chem Eng Sci, 49(7): 981 - 1002. Sezani and Marlene, 2012, Green Drop Requirements 2013 South African Wastewater Services
Incentive-based Regulation, DWA Ndlovu, M. (2014) Optimization of Power Plant Utility Systems Using Process Integration, PhD
Thesis, University of Pretoria
Kriel Management, (2014). Kriel WAF Report 2013 -2014
El-Halwagi, M. M. (1997). "Pollution Prevention through Process Integration", Academic Press.
Linnhoff, B., Townsend, D.W., Boland, D., Hewitt, G.F., Thomas, B.E.A., Guy A.R.., and
Marsland, R.H. (1982) “A User Guide on Process Integra ion for the Efficient Use of
Energy," IChemE UK Smith, R. (1995), Chemical Process Design, McGraw-Hill, New York.
Dunn, R.F., El-Halwagi, M.M. (2003). Process integration technology review: background and
applications in the chemical process industry. J. Chem. Technol. Biotechnol. 78:1011–1021

109
U.S. Department of Energy, (2014). The Water-Energy Nexus: Challenges and Opportunities.
www.GAMS.com, 2014.

110
APPENDIX I: Flow Sheets for Freshwater Minimization Scenarios Scenario 1: Freshwater intake (96 801m3/d)
Scenario 2: Freshwater intake (95 591 m3/d)

111
Scenario 3: Freshwater intake (103 581 m3/d)
Scenario 4: Freshwater intake (104 860 m3/d)

112
Scenario 5: Freshwater intake (103 800 m3/d)
Scenario 6: Freshwater intake (96 801m3/d)

113
Scenario 7: Freshwater intake (104 651 m3/d)
Scenario 8: Freshwater intake (95 591 m3/d)

APPENDIX II: Testing a New Water Network With a Cooling Tower Mass Balance.
This example illustrates how the mass balances and operational conditions for the cooling towers
have to be evaluated carefully for each suggested water network before implementing changes.
Figure 23 contains data from one of the water networks suggested by the model for a scenario
incorporating blowdown interchange. The total freshwater intake for this scenario was 95Ml/d and
no wastewater was produces. The quality data of the streams is taken from the model for TDS and
estimated values for sulphates.

Table 20. Example Stream flows and qualities
Streams into CTN
Flow (m3/d) SO4 Content(mg/kg) Fractional TDS Fractional TDS
Effluent dam 833.3 331 5.78473 1965 34.34137
SF1 181.1 100 0.379815 70 0.265871
CPP 208.22 15 0.065504 128 0.558967
Boilers 0 1 0 3.2 0
Ps potable 588.285 100 1.233791 58 0.715599
IX 518.9 15 0.163241 128 1.392988
Vaal 351.3 435 3.204949 1150 8.472853
CTS blowdn 6000 750 94.37701 2600 327.1736
Fw vaal 39000 15 12.26901 130 106.3314
TOTAL 47681.105
AVG (mg/kg) 117.4780471 479.3
Streams into CTS
Flow (m3/d) SO4 Content(mg/kg) Fractional TDS Fractional TDS
Effluent dam 847.1 331 5.511581 1965 34.91009
SF1 181.3 100 0.356456 70 0.266164
CPP 208.6 15 0.06152 128 0.559987
Boilers 0 1 0 3.2 0
Ps potable 589.6 100 1.159219 58 0.717198
IX 520 15 0.153357 128 1.395941
Vaal 357.3 435 3.055838 1150 8.617565
CTN blowdn 3066.7 750 45.22105 2600 167.2239
Fwvaal 45102.3 15 13.30142 130 122.969
TOTAL 50872.9
AVG 68.82044393 336.7
Of interest for our discussion are the average sulphate and TDS contents of the streams going into
each cooling tower. Per definition the cycles of concentration is the concentration of the cooling
water divided by the concentration of the make-up water. The station’s upper limits for the

concentration of TDS in the cooling water are 2600mg/l and 750mg/l for sulphates (if the most
conservative standard is used).
When the maximum CoC that can be allowed for the South cooling tower is calculated for instance
we find it to be 750/68.8 = 10.9 for sulphates and 2600/336.7 = 7.7 for TDS. For the North cooling
towers the values are 6.4 and 5.4 respectively. This water network can therefore not be blindly
employed and the cooling towers operated at CoC’s higher than these values without violating set