Embed Size (px)
DESCRIPTION
Water Accounting in Australia London Group Meeting, Denmark September 2004. Michael Vardon and Stuart Peevor. 2003 C. Miles. Presentation Overview. Background Results Problems Improvements Water Information Development Plan Use Forward Work Plan. Mean annual runoff 387000 GL. - PowerPoint PPT Presentation
Citation preview
Water Accounting in AustraliaLondon Group Meeting, Denmark
September 2004
2003 C. Miles
Michael Vardon and Stuart Peevor
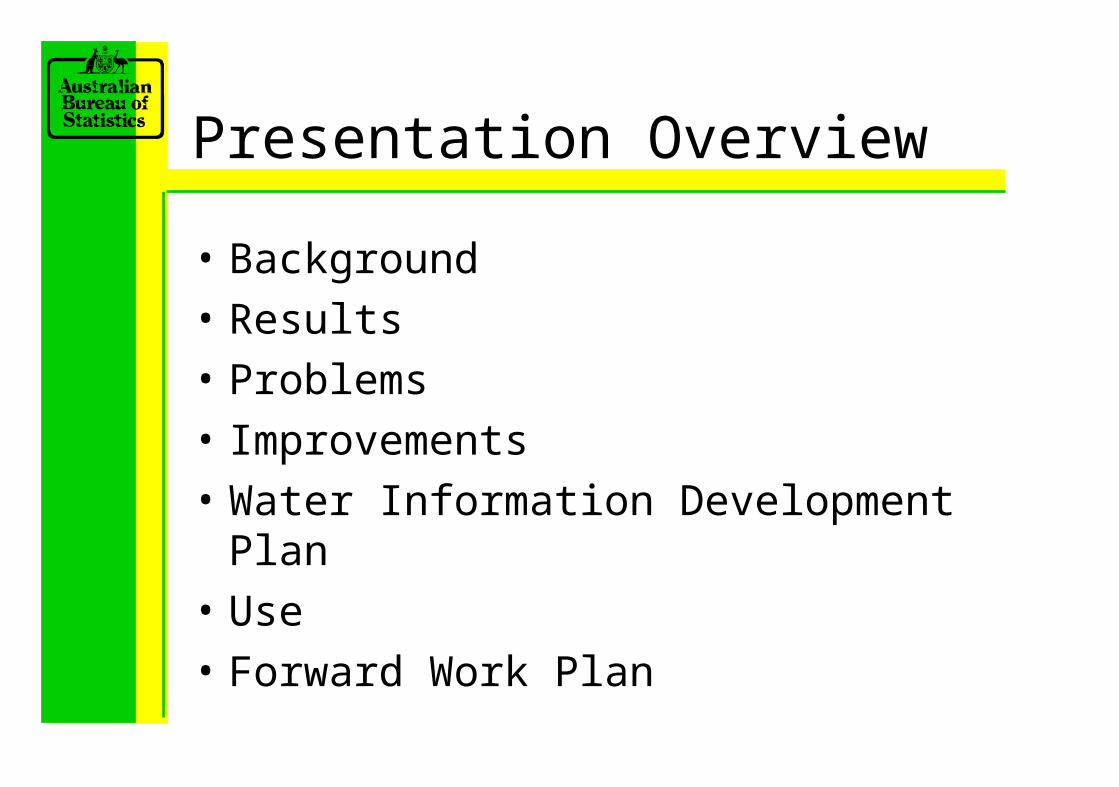
Presentation Overview
• Background
• Results
• Problems
• Improvements
• Water Information Development Plan
• Use
• Forward Work Plan
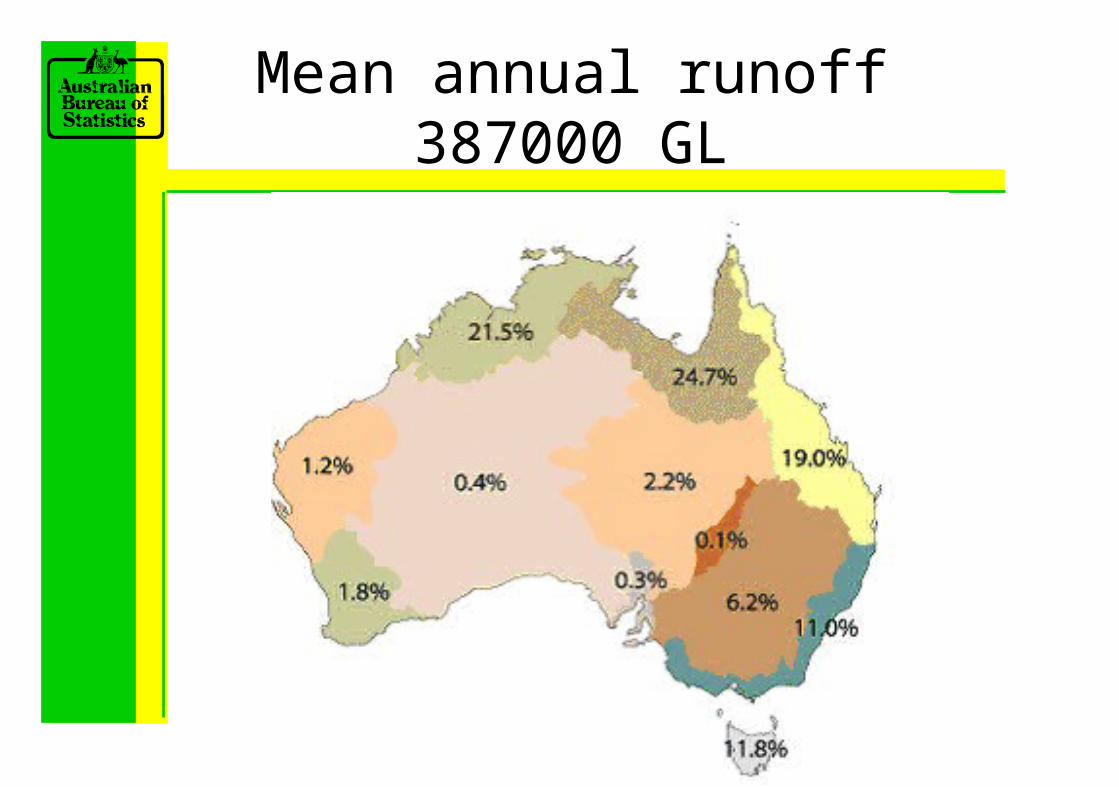
Mean annual runoff387000 GL
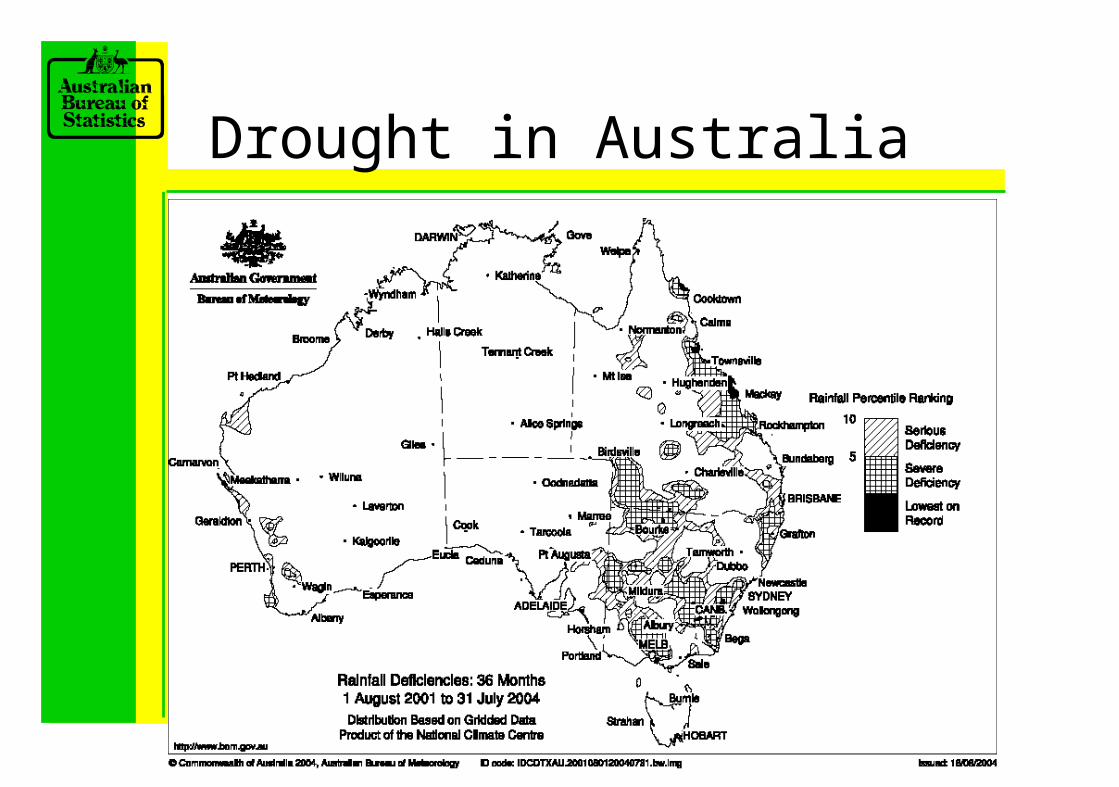
Drought in Australia
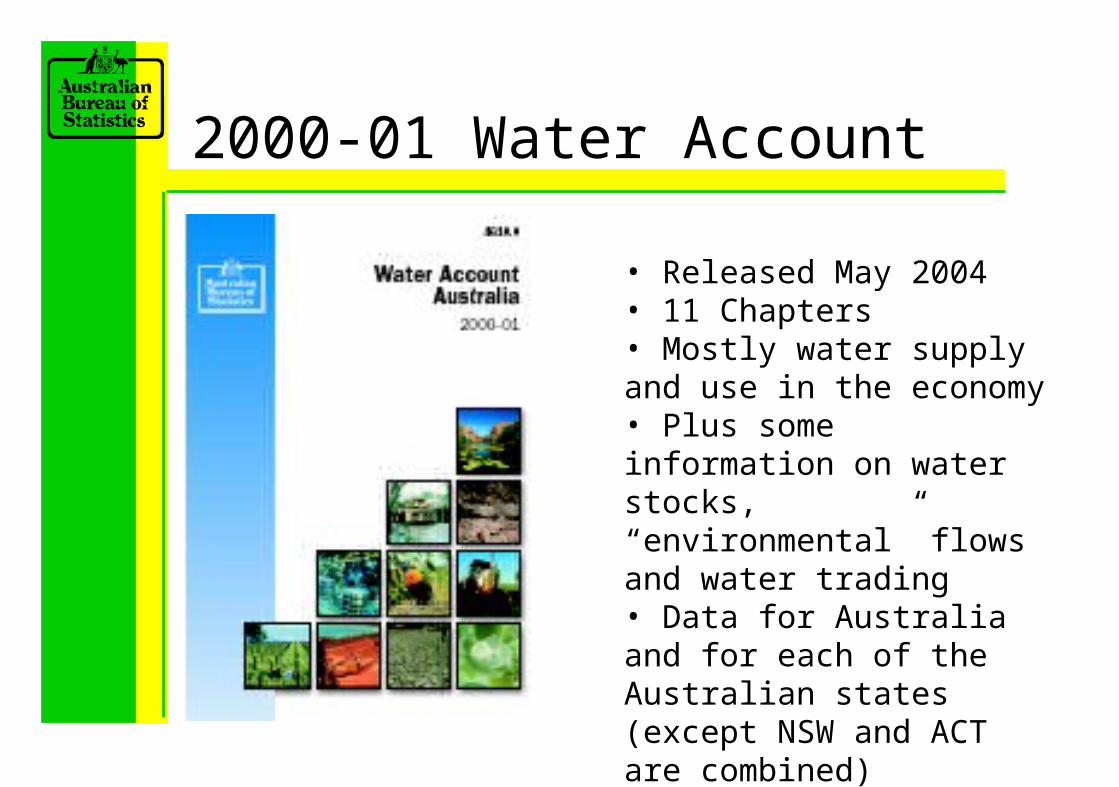
2000-01 Water Account
• Released May 2004• 11 Chapters• Mostly water supply and use in the economy • Plus some information on water stocks, “environmental” flows and water trading• Data for Australia and for each of the Australian states (except NSW and ACT are combined)• Previous edition released in 2000
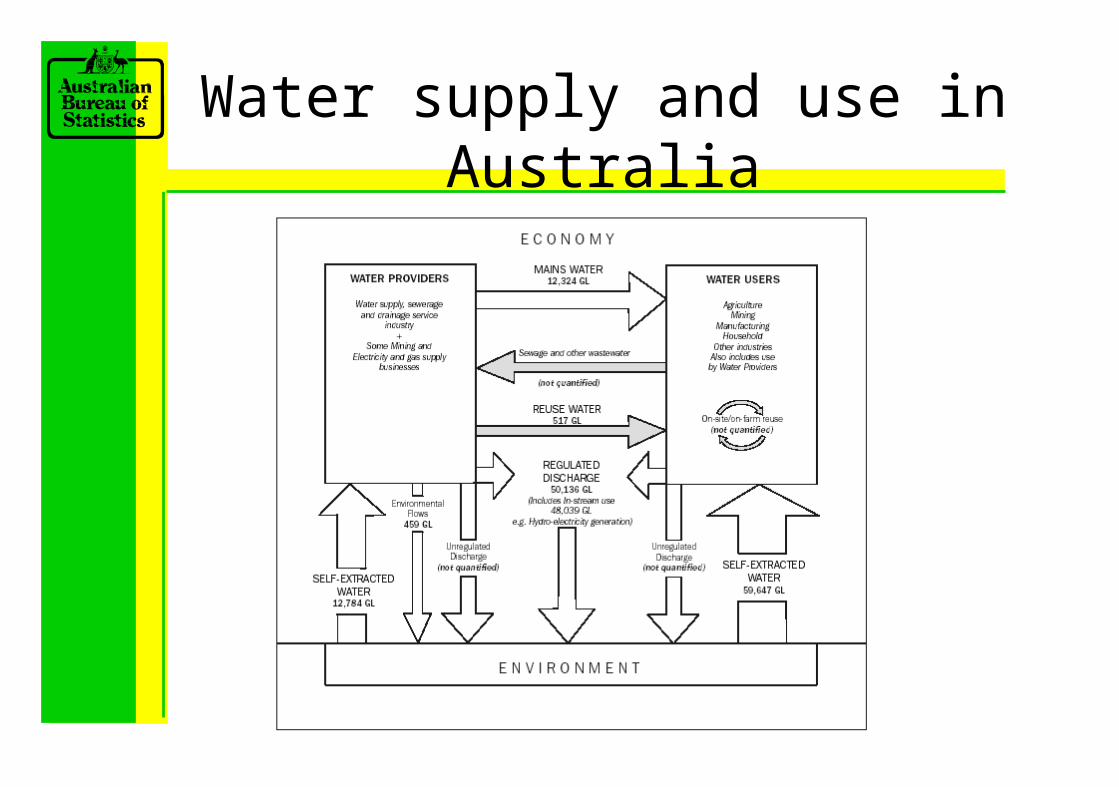
Water supply and use in Australia
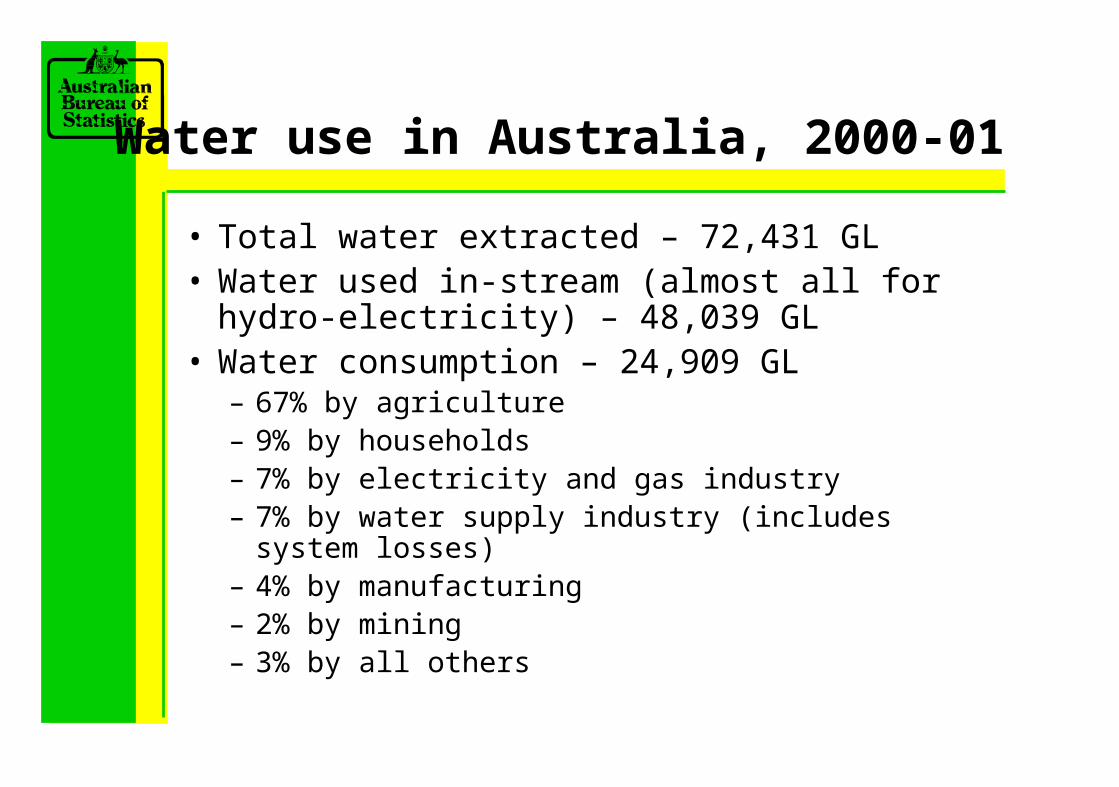
Water use in Australia, 2000-01
• Total water extracted – 72,431 GL• Water used in-stream (almost all for hydro-
electricity) – 48,039 GL• Water consumption – 24,909 GL
– 67% by agriculture– 9% by households– 7% by electricity and gas industry– 7% by water supply industry (includes system losses)– 4% by manufacturing– 2% by mining– 3% by all others
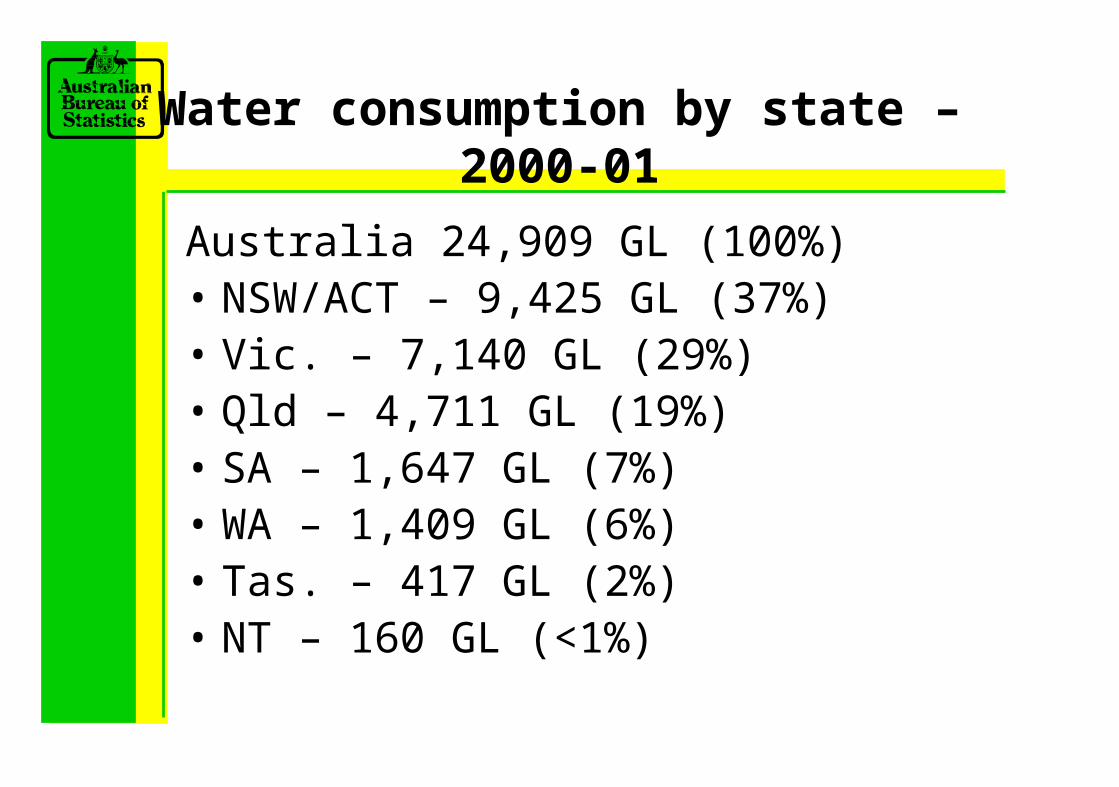
Water consumption by state – 2000-01
Australia 24,909 GL (100%)• NSW/ACT – 9,425 GL (37%)• Vic. – 7,140 GL (29%)• Qld – 4,711 GL (19%)• SA – 1,647 GL (7%)• WA – 1,409 GL (6%)• Tas. – 417 GL (2%)• NT – 160 GL (<1%)
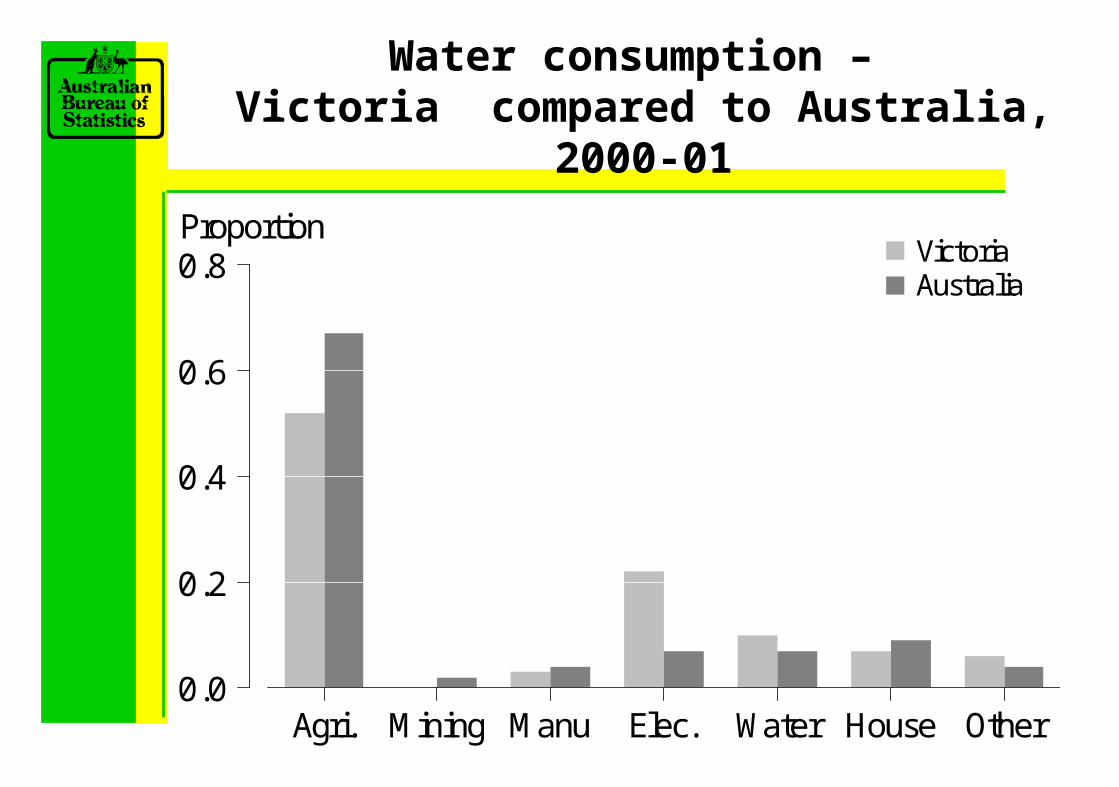
Water consumption – Victoria compared to Australia, 2000-01
Agri. Mining Manu Elec. Water House Other
Proportion
0.0
0.2
0.4
0.6
0.8 VictoriaAustralia
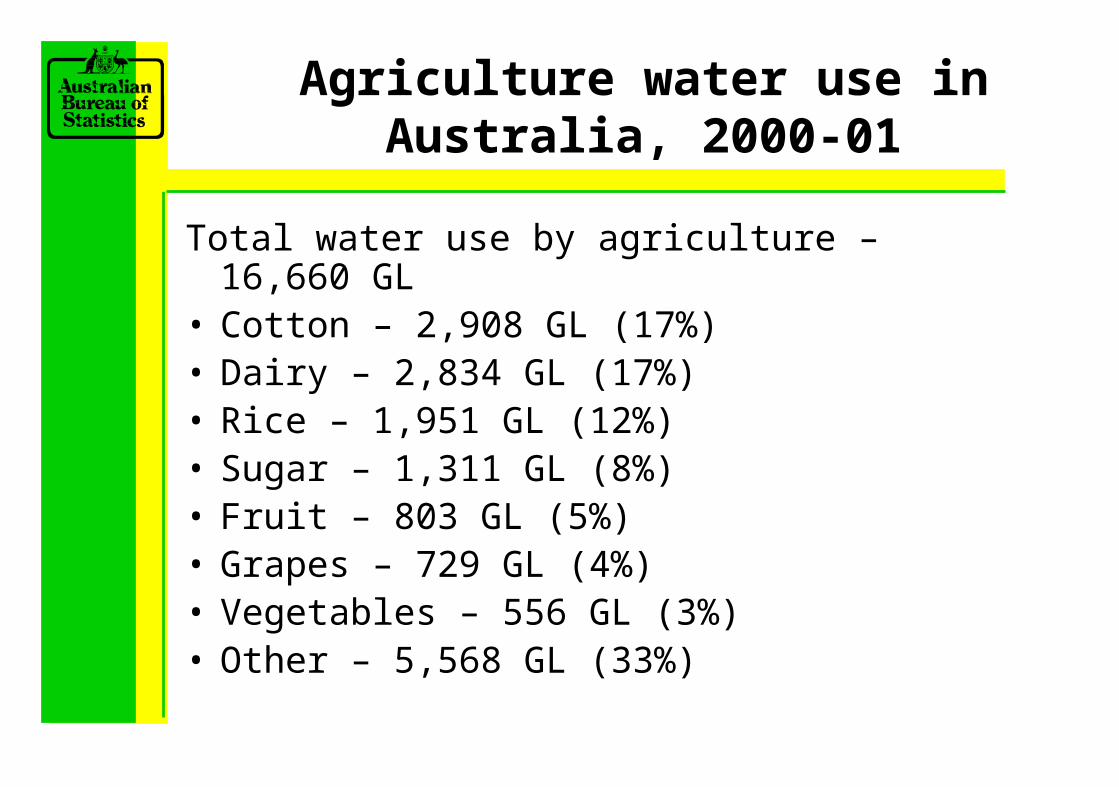
Agriculture water use in Australia, 2000-01
Total water use by agriculture – 16,660 GL• Cotton – 2,908 GL (17%)• Dairy – 2,834 GL (17%)• Rice – 1,951 GL (12%)• Sugar – 1,311 GL (8%)• Fruit – 803 GL (5%)• Grapes – 729 GL (4%)• Vegetables – 556 GL (3%)• Other – 5,568 GL (33%)
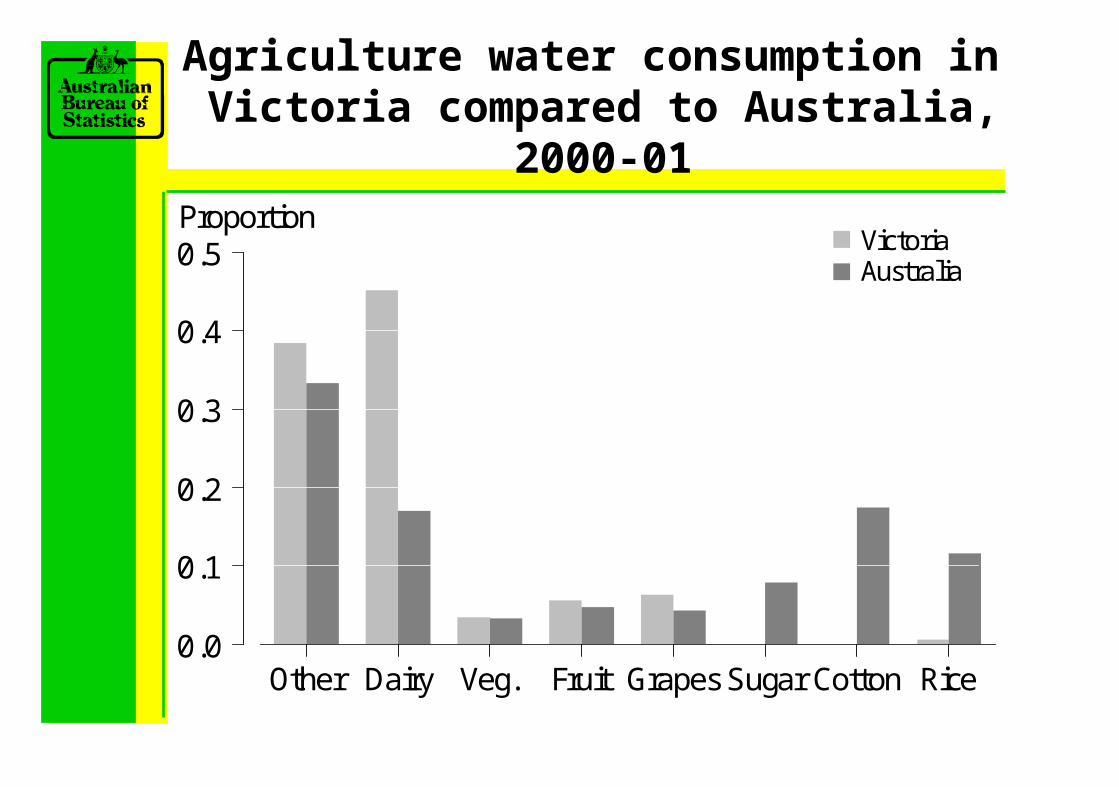
Agriculture water consumption in Victoria compared to Australia, 2000-01
Other Dairy Veg. Fruit GrapesSugar Cotton Rice
Proportion
0.0
0.1
0.2
0.3
0.4
0.5 VictoriaAustralia
Water supply industry, 2000-01
• 479 water providers
• Supplied 12,784 GL
• 1,769 GL of system water losses
• 1,837 GL of regulated discharge (62% of this to ocean)
• Very important to understand the industry
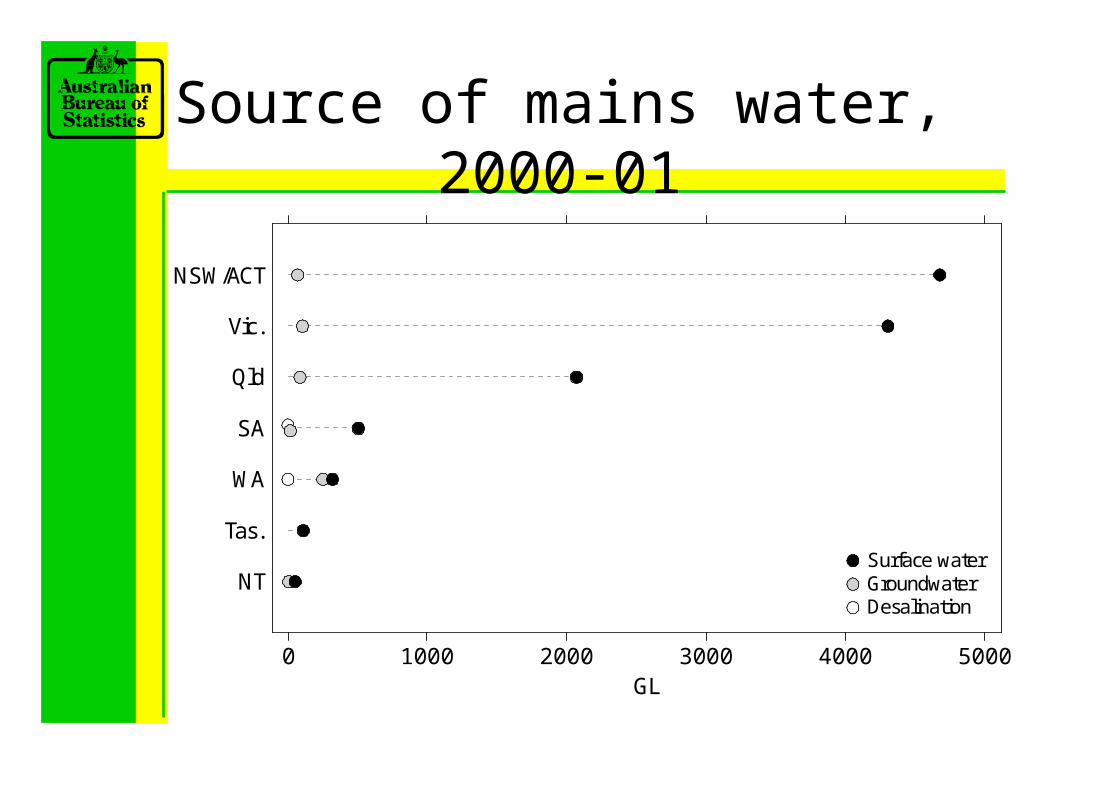
Source of mains water, 2000-01
NSW/ACT
Vic.
Qld
SA
WA
Tas.
NT
0 1000 2000 3000 4000 5000GL
Surface waterGroundwaterDesalination
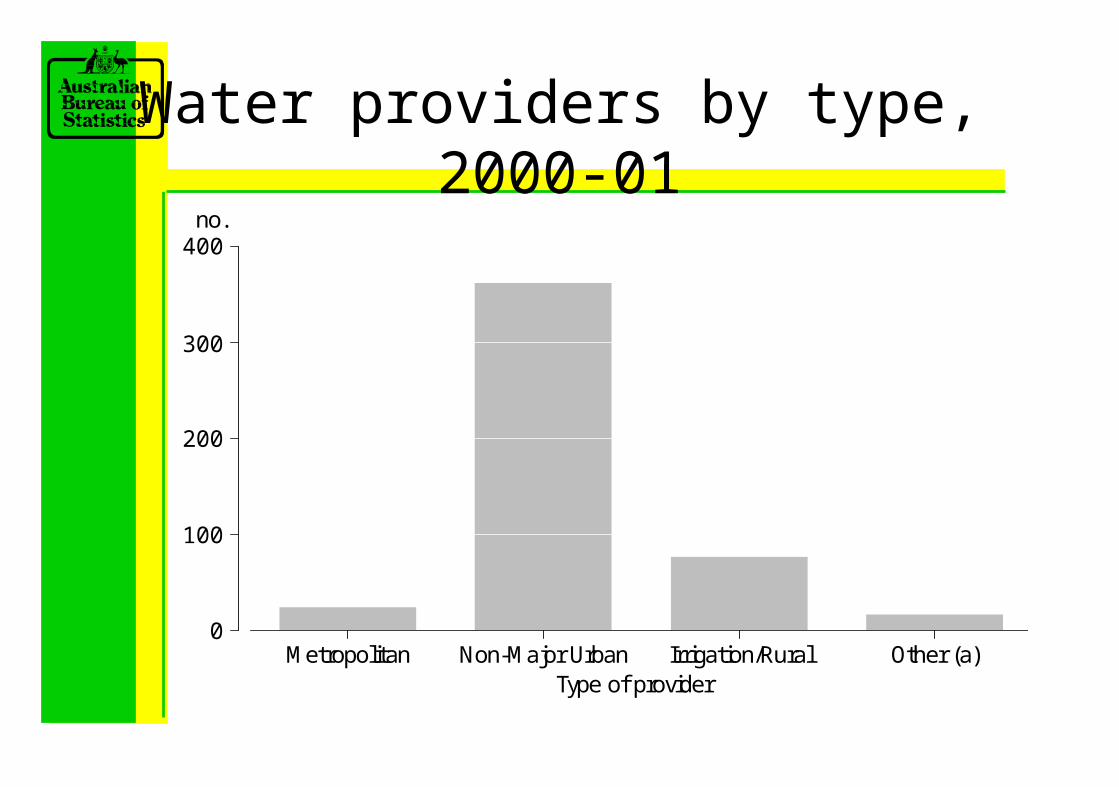
Water providers by type, 2000-01
Metropolitan Non-Major Urban Irrigation/Rural Other (a)Type of provider
no.
0
100
200
300
400
Extra information
• The Australian water account contains a range of information to assist with interpretation and understanding of data
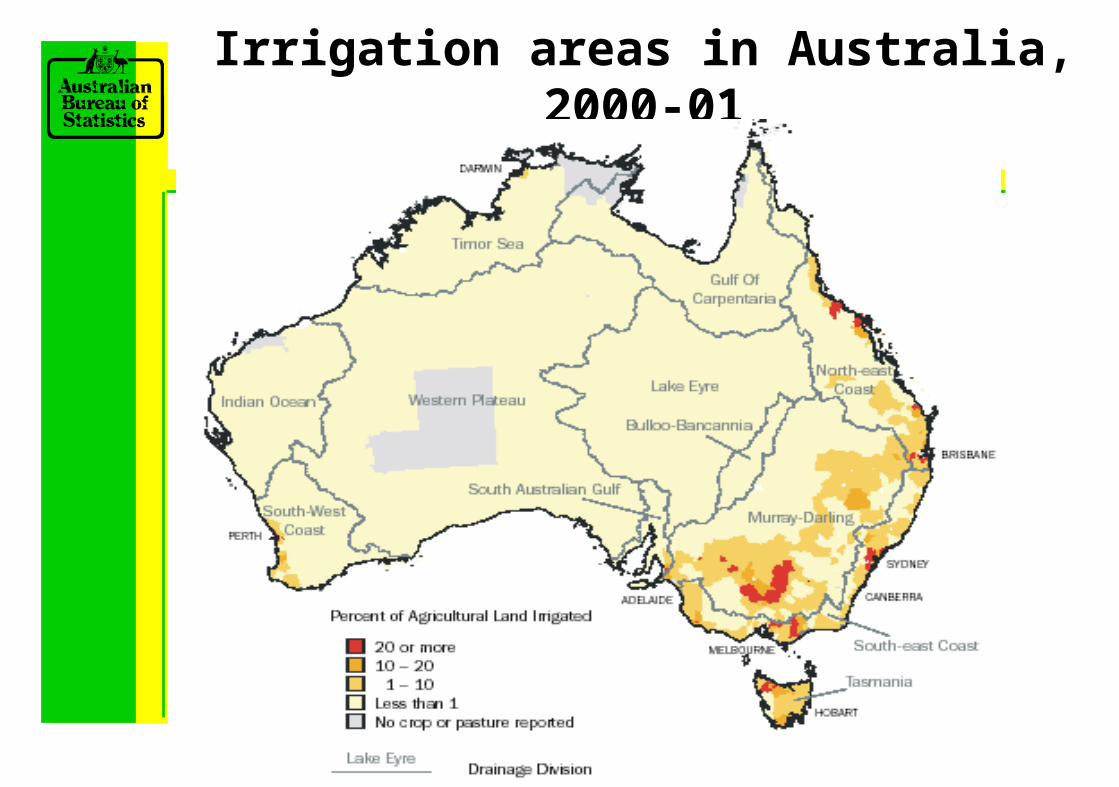
Irrigation areas in Australia, 2000-01
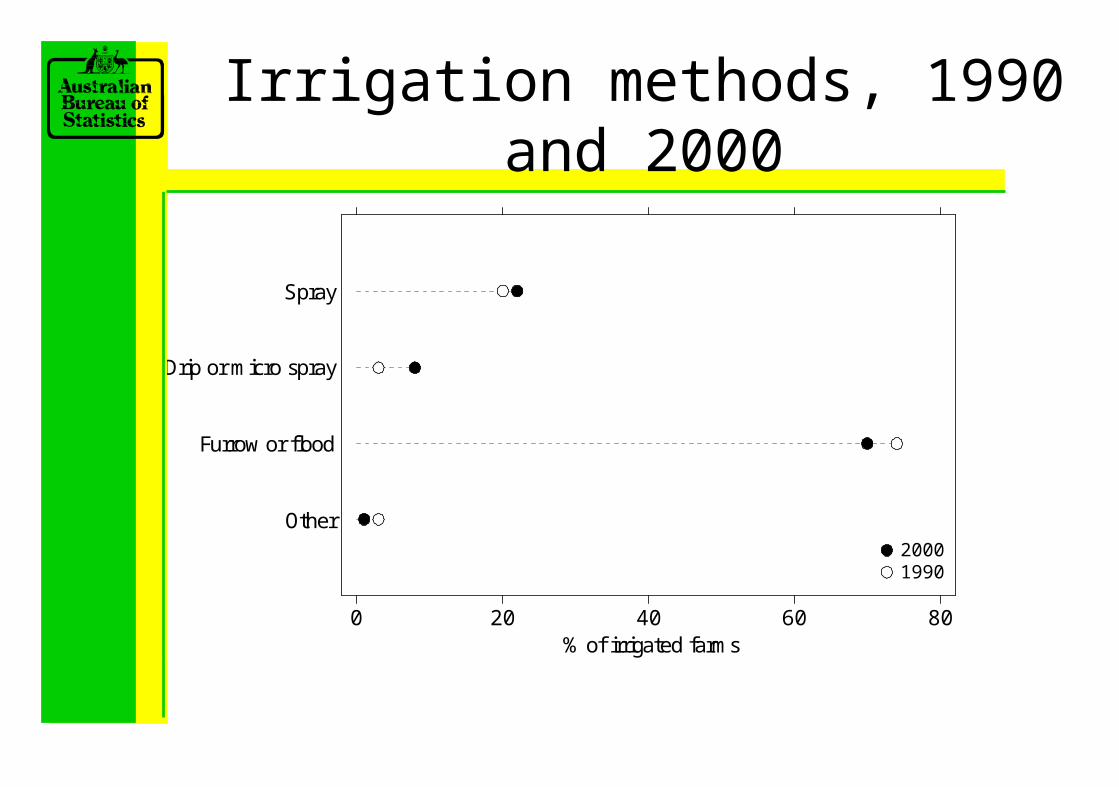
Irrigation methods, 1990 and 2000
Spray
Drip or micro spray
Furrow or flood
Other
0 20 40 60 80% of irrigated farms
20001990
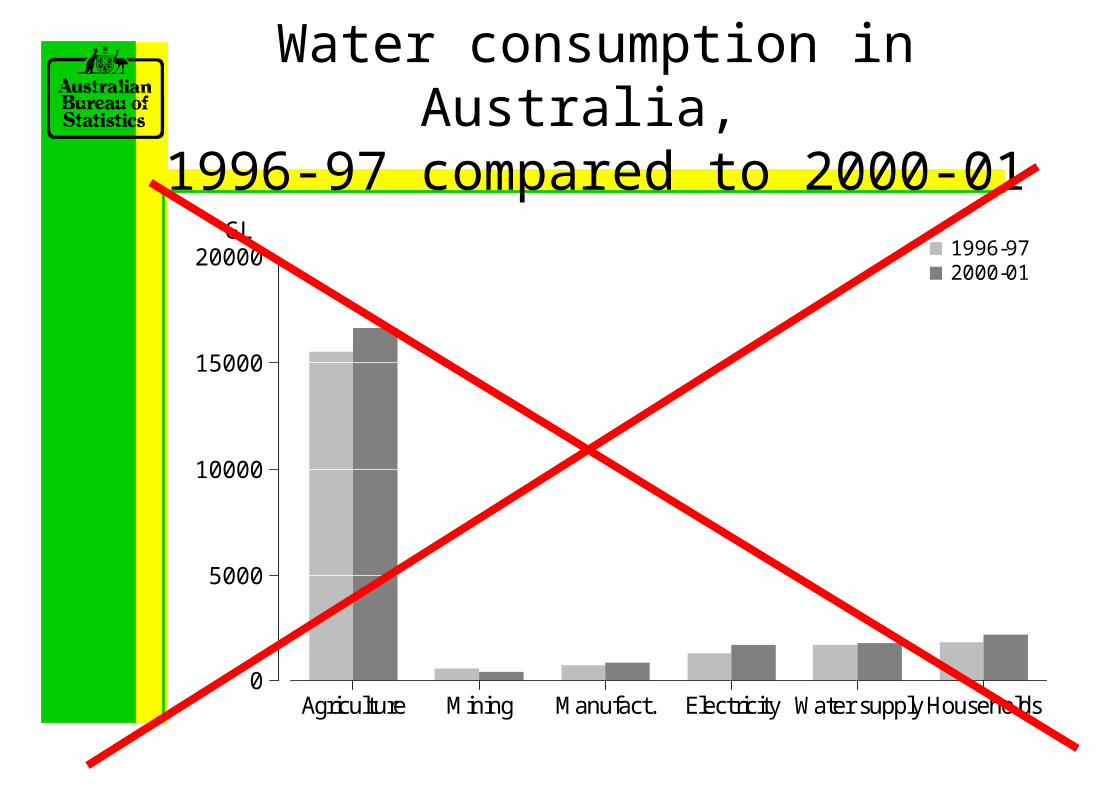
Water consumption in Australia, 1996-97 compared to 2000-01
Agriculture Mining Manufact. Electricity Water supplyHouseholds
GL
0
5000
10000
15000
20000 1996-972000-01
Comparisons between 1996-97 and 2000-01
The data in the two editions of the water account are not strictly comparable because of differences in:
• Climate
• Data sources
• Metering of water use
• Methods and definitions
Errata
Tables• 1.3 Water consumption, employment and IGVA.• 9.8 Rainwater tanks• 10.9 Surface water stocks
Problems
• A 100 or more data sources
• Dozens of agencies
• Different classifications/definitions
• Still a need to rely on modelling to fill some cells
• A regular source for data on water stocks is not apparent
• Need to be careful about double counting
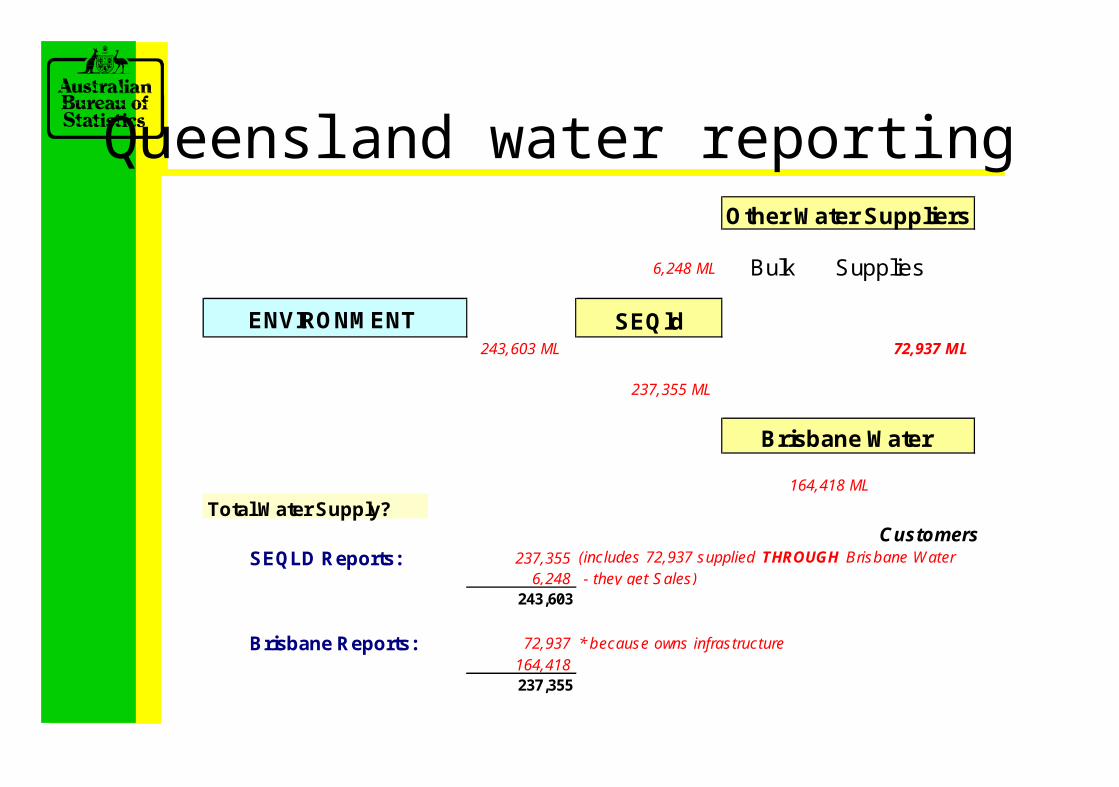
Other Water Suppliers
6,248 ML Bulk Supplies
SEQld243,603 ML 72,937 ML
237,355 ML
164,418 ML
Total Water Supply? Customers
SEQLD Reports: 237,355 (includes 72,937 supplied THROUGH Brisbane Water6,248 - they get Sales)
243,603
Brisbane Reports: 72,937 * because owns infrastructure164,418237,355
ENVIRONMENT
Brisbane Water
Queensland water reporting
Next edition on the Water Account
Next account in respect of 2004-05
Then four yearly
Content similar in to 2000-01 but with some improvements . . . .
Planned improvements (1)
• Reduced time between reference period and publication
• Data for river basins/water catchments
• More industry splits, especially for the “other agriculture” category
• More information on economics/finance (but not necessarily a monetary account)
• More ABS survey data
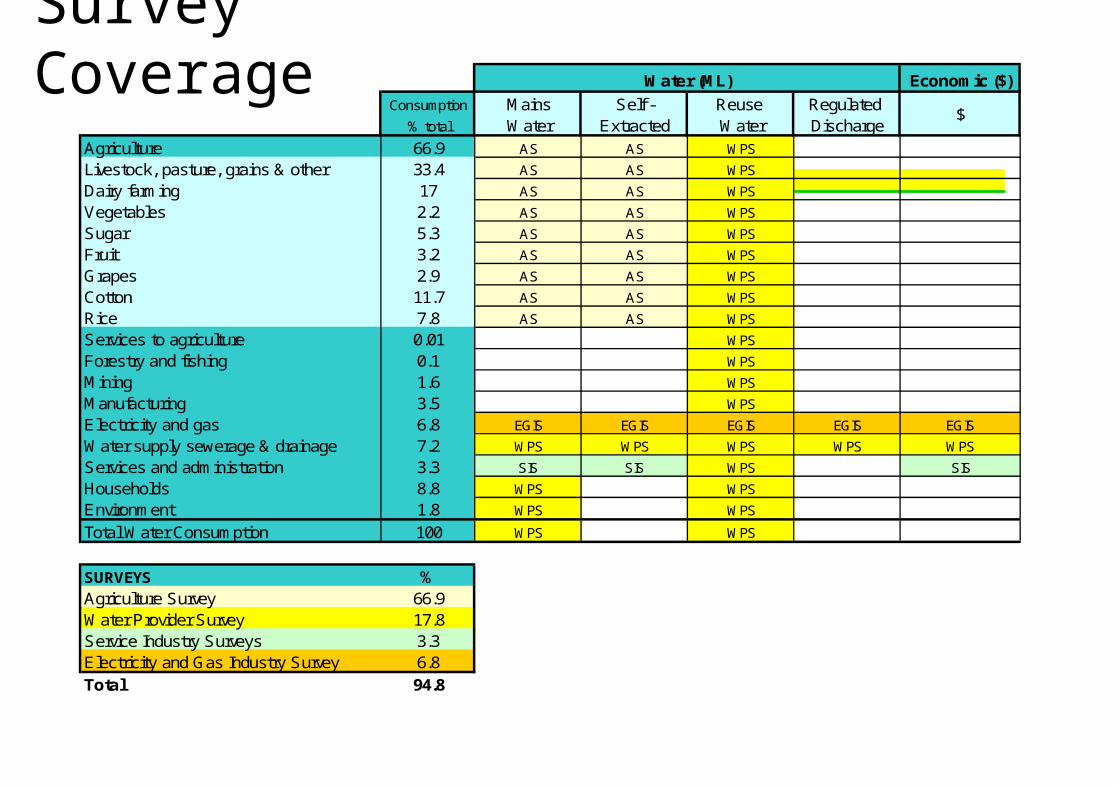
Economic ($)
Consumption Mains Self - Reuse Regulated % total Water Extracted Water Discharge
Agriculture 66.9 AS AS WPS
Livestock, pasture, grains & other 33.4 AS AS WPS
Dairy farming 17 AS AS WPS
Vegetables 2.2 AS AS WPS
Sugar 5.3 AS AS WPS
Fruit 3.2 AS AS WPS
Grapes 2.9 AS AS WPS
Cotton 11.7 AS AS WPS
Rice 7.8 AS AS WPS
Services to agriculture 0.01 WPS
Forestry and fishing 0.1 WPS
Mining 1.6 WPS
Manufacturing 3.5 WPS
Electricity and gas 6.8 EGIS EGIS EGIS EGIS EGIS
Water supply sewerage & drainage 7.2 WPS WPS WPS WPS WPS
Services and administration 3.3 SIS SIS WPS SIS
Households 8.8 WPS WPS
Environment 1.8 WPS WPS
Total Water Consumption 100 WPS WPS
SURVEYS %Agriculture Survey 66.9Water Provider Survey 17.8Service Industry Surveys 3.3Electricity and Gas Industry Survey 6.8Total 94.8
Water (ML)
$
Survey Coverage
Planned improvements (2)
Better coordination and understanding of of data suppliers and data users
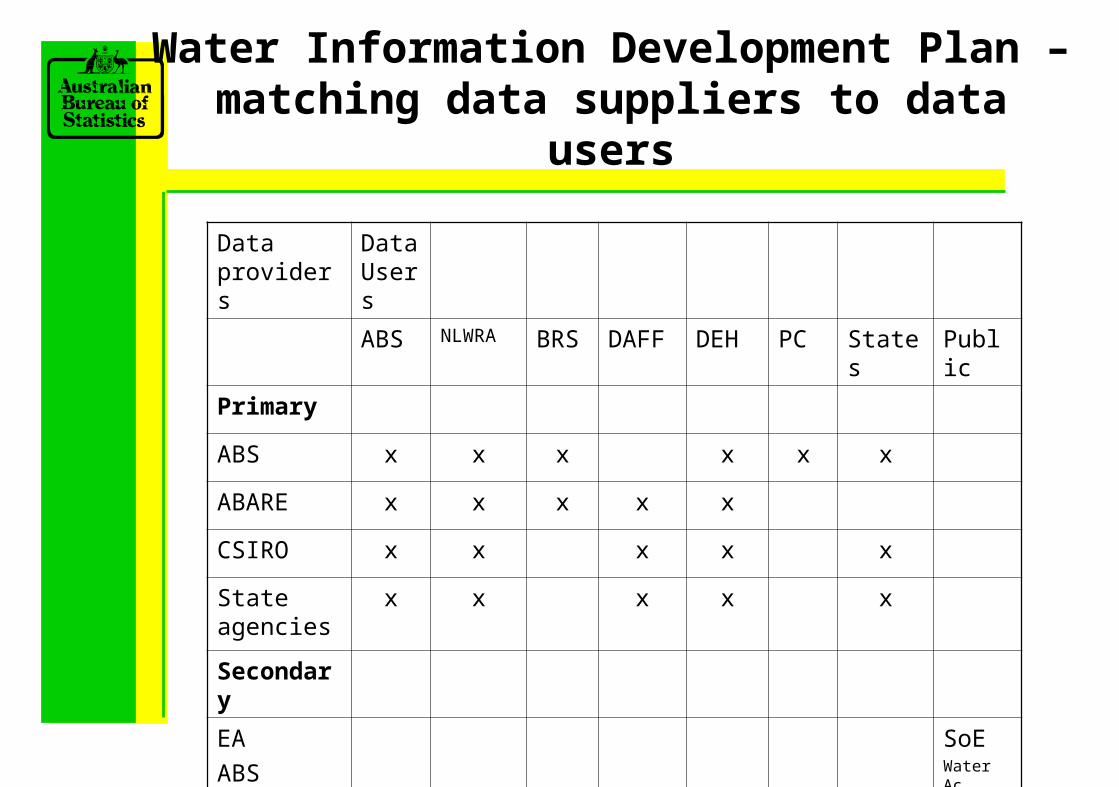
Water Information Development Plan – matching data suppliers to data users
Data providers
DataUsers
ABS NLWRA BRS DAFF DEH PC States Public
Primary
ABS x x x x x x
ABARE x x x x x
CSIRO x x x x x
State agencies
x x x x x
Secondary
EA
ABS
NLWRA
SoEWater Ac.
Theme
reports
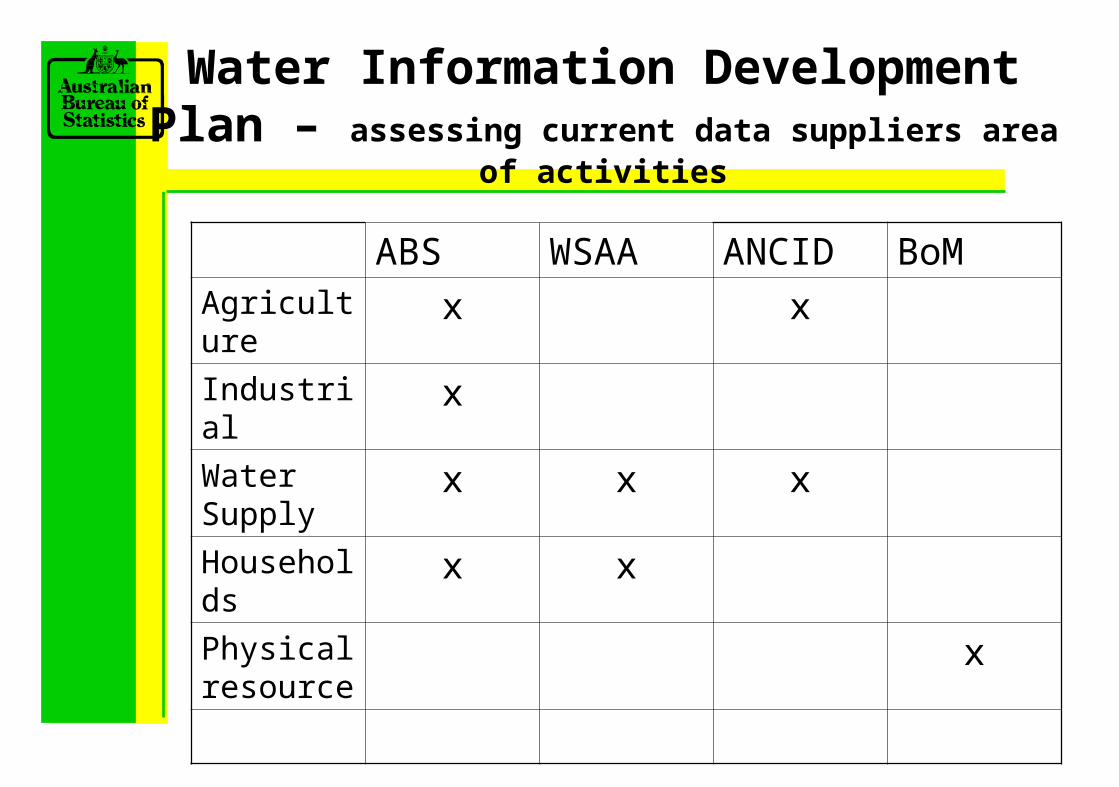
Water Information Development Plan – assessing current data suppliers area of activities
ABS WSAA ANCID BoMAgriculture x x
Industrial xWater Supply
x x x
Households x x
Physical resource
x
Who is using the water account and how is being used?
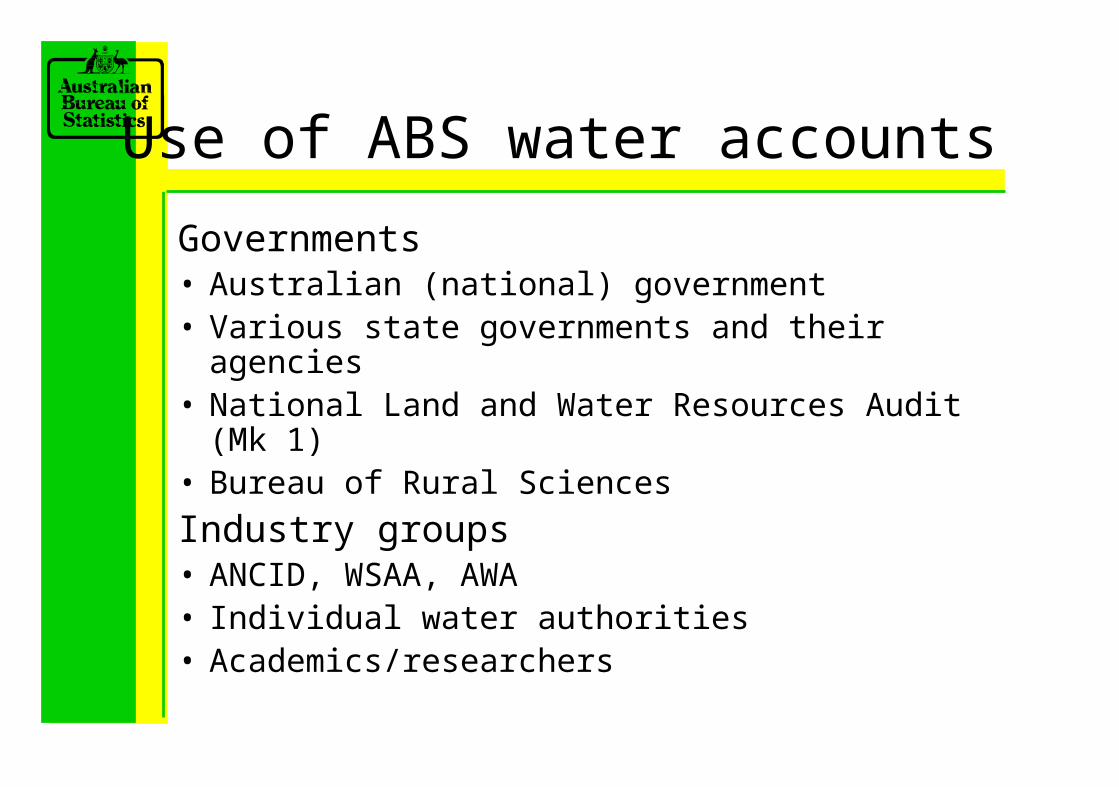
Use of ABS water accounts
Governments• Australian (national) government• Various state governments and their agencies • National Land and Water Resources Audit (Mk 1)• Bureau of Rural Sciences
Industry groups• ANCID, WSAA, AWA• Individual water authorities• Academics/researchers
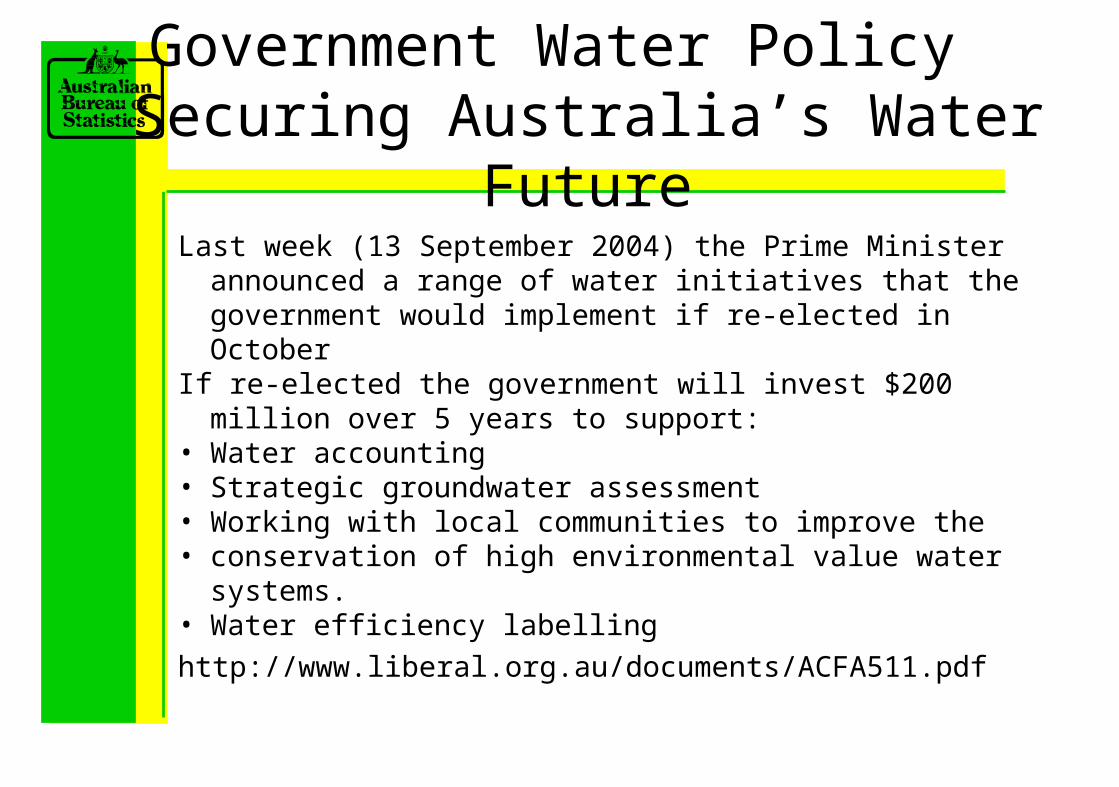
Government Water Policy Securing Australia’s Water Future
Last week (13 September 2004) the Prime Minister announced a range of water initiatives that the government would implement if re-elected in October
If re-elected the government will invest $200 million over 5 years to support:
• Water accounting• Strategic groundwater assessment• Working with local communities to improve the• conservation of high environmental value water
systems.• Water efficiency labellinghttp://www.liberal.org.au/documents/ACFA511.pdf
Policy on on Water Accounting
“Water accounting: a nationally consistent system for collecting and processing water-related data is needed to create confidence in decisions by investors in the water market and the water industry more broadly, and to improve the setting of sustainable flow levels in rivers. Such a system would involve automated data collection at monitoring stations, national standards for water accounting and metering, and improved hydrologic modelling of priority water sources”
http://www.liberal.org.au/documents/ACFA511.pdf
Sophisticated users of ABS water accounts
Analytical work• Lenzen, M. (2004) – Nature preparation and use of water accounts
in Australia.• Wittwer, G. (2003) – An outline of TERM and modifications to
include water usage in the Murray-Darling Basin (TERM = The Enormous Regional Model).
• Foran, B. and Plody, F. (2002) – The future of water (Ch. 6 in Future dilemmas).
• Lenzen, M. and Foran, B. (2001) – An input-output analysis of Australian water usage.
• Centre for International Economics (2004) - Implications of water reforms for the national economy
Lenzen, M. and Foran, B. (2001) An input-output analysis of Australian water usage.
• 30% of Australia’s water use was devoted to domestic food production and a further 30% to food exports
• If by 2050 Australia’s population grows to 25 million people and per-capita expenditure doubles, the annual water requirement for Australia may more than double to 50,000 GL per annum

Centre for International Economics (2004)Implications of water reforms for the national
economy
• Irrigation contribution to the economy is $12.4 billion (2.3 per cent of Australia’s GDP)
• irrigation directly and indirectly contributes around 171 000 employee (2.6 percent of total employment)
• Reducing water use in the Murray-Darling Basin by 10% (=540 GL) is estimated to result in the loss of 400-900 jobs and $88 million to GDP
Environment and Energy StatisticsForward Work Plan for Water
• A subset of a larger work plan
• Few resources for expansion of work in 2004-05, but more scope in 2005-06.
• Centre for Environment and Energy Statistics will advise ABS on overall priorities (more later about this)
Contact details
Michael Vardon
02 6252 7348
Stuart Peevor
02 6252 7042


![London College of Finance and Accounting · Review for Educational Oversight: London College of Finance and Accounting 2 ] About this report This report presents the findings of the](https://img.dokumen.tips/doc/110x75/5fc3116deeba2d537b3a78d2/london-college-of-finance-and-accounting-review-for-educational-oversight-london.jpg)