Embed Size (px)
Citation preview

WASTEWATER TECHNOLOGY IN YEMEN
Dr. Fadhl Ali Al-Nozaily, Water and Environment Center, Sana'a University, Republic of Yemen;
Email: [email protected]
ABSTRACT The main objective of this paper is to review the existing situation of sanitation in the Republic of Yemen, including the activities and management undertaken by concerned bodies. Wastewater management will be assessed, including a review of projects under implementation and suggestions for better improvement. Specifically, the paper will discuss the level of coverage by the water and wastewater services, the treatment methods used in Yemen, sludge problems in Yemen, and the reuse of wastewater.
INTRODUCTION In Yemen, in response to urban development and high population growth, a water and wastewater network was constructed during the 1990s to manage household water influents and effluents. This led to wastewater disposal in cesspits (of two to three square meters in surface area and with depths of up to 20 meters). However, in many cases the cesspits flooded and overflowed into the streets of several of Yemen’s main and secondary cities. In other cases, the cesspits were connected to an overloaded wastewater treatment system which also overflowed with blackwater, greywater and other forms of pollution. In some places, such as Al-Mukalla, a lack of wastewater treatment meant that wastewater was discharged into the sea. Further, despite the extension and increased construction of wastewater treatment plants, the concurrent production of more sludge proved problematic as it was unable to be adequately disposed off. This was particularly the case for some mechanical treatment plants, such as those under operation in Sana'a and Ibb cities, where hundreds of tons of sludge were unable to be disposed off. This paper therefore aims at reviewing and better understanding the existing situation of wastewater, sludge and reuse management in the Republic of Yemen, in order to suggest some measures for better management and better improvement.
THE LEVEL OF COVERAGE BY WATER AND WASTEWATER SERVICES Water scarcity and its ongoing depletion are considered as the major causes of the lack of adequate potable water available to consumers. It is estimated that 75 percent of the population of Yemen lacks wastewater services, while 50 percent of them cannot get clean drinking water. Moreover, theses coverage percentages are decreasing with time due to continuous population growth and urban development, which do not correlate with increased services delivery in water and wastewater. For example the coverage of water services was decreased in urban areas from 50 percent in the year 2000 to 47 percent in the year 2002. The wastewater services coverage also decreased from 26 to 25 percent, respectively. However, there is a distinction to be made between consumption patterns in different parts of the country: in rural mountainous regions consumption was about 30 litres per capita per day (l/c/d), while in the urban mountainous areas that was much higher at 70 l/c/d, with a slightlyhigher figure for the hot coastal areas. This low water consumption has led to an increase in the pollutant concentration of wastewater. The wastewater BOD in the mountainous cities is three to four times the highest known concentration in the world while it reached only two times in case of coastal areas although there is enough water is available to some extent.
133

TECHNOLOGICAL AND SANITATION PROBLEMS IN YEMEN In some rural areas, dry sanitation is still applied to separate the solid (faeces) from the liquid parts of wastewater (ie liquids like urine, or those from washing, cleaning and ablution). The liquid wastewater is then used for irrigation while solid wastes are used as fertilizer. Due to the unhygienic nature of these applications, this method has almost been completely discontinued in urban areas, but is still being used in some rural areas. Therefore, sanitation, and particularly the disposal of solid waste in rural areas, is considered a major problem which has become a health hazard for the population. In some rural and urban areas, cesspits are used as a means of wastewater disposal, and in cases where people are using dried wells as cesspits, groundwater basins are subsequently being threatened. Other problematic factors include the disposal of used oil into the wastewater network and then into the wastewater treatment plants. A lack of adequate cleansing processes to remove and treat the presence of oil at the plants has led plant operators discharge the raw wastewater to the wadi without treatment, further risking contamination. As there is only a limited number of industries with their own pretreatment systems in Yemen, the rest of the factories are discharging their wastewater into the public network without prior treatment and with no monitoring system applied. This has, in some cases, caused the death of the bacteria. In other cases, industrial effluents have been discharged directly into the cesspits, creating a contamination risk for the soil and groundwater.
The treatment methods used in Yemen In Yemen, three different technologies are used for primary and secondary (biological) wastewater treatment, as shown in Table 1 below. They are namely:
o a fully mechanical system, such as activated sludge systems, as used in Sana'a and Ibb cities in Yemen;
o a partial mechanical system, such as trickling filters, which were preceded by imhof tanks as is the case in Hajjah city;
o and natural system like waste stabilization ponds, as is the case in most of cities in Yemen: Aden, Amran, Rada'a, Al-Hodiedah, Dhamar, Yarim and Taiz, for example.
The sanitation sector faces many problems in terms of the operation and maintenance of the full and partially full mechanical systems, due to a lack of requisite skilled labour. The high cost of operation and maintenance is also problematic and is caused by the high cost of the spare parts, or a lack of spare parts due to discontinued production by industry. However, the need for experts to operate and maintain these complicated systems and the need for continuous training of system operators is considered secondary to the problem of a lack of spare parts. Comparatively, waste stabilization ponds are easy to operate and maintain and their effluent is considered safe for irrigation provided that the minimum retention time for wastewater in the ponds is at least ten days, in order to be subjected to sunshine (light) and undergo appropriate treatment. Although these systems are seemingly easy to maintain, water and wastewater corporations face many difficulties in securing adequate space to build and develop their operations and to extend the reach of services. Moreover, proper care of these systems is often neglected, despite the fact that they are quite simple, as in the case at Al-Hodiedah, Taiz and Dhamar cities. Another problem affecting the treatment process is the scarcity of water and concurrent consumption rates that are decreasing with time due to its unavailability. This low water consumption causes an increase in wastewater pollutant concentrations. For example, BOD was increased from 500 mg/l
134

during the 1980s to 800 mg/l during the 1990s and then to 1200 mg/l at the beginning of the year 2000. This increase caused malfunctioning of the treatment plants that were designed in the 1980s and constructed at the end of 1990s – plants such as Ibb and Sana'a (see Table 1 below). These wastewater treatment plants became organically overloaded before the full hydraulic capacity was achieved and before the designed period was reached. Table (1) Existing wastewater treatment systems at different cities in Yemen
Variables Units Sana'a Ibb Hajjah Aden* Amran
Rada'a
Al-Hodiedah
Dhamar Yarim Taiz
Used Technol.
- Activated sludge Imhof tank followed by trickling filter
Waste stabilization ponds
End Design period
Year 2005 2005 2005 2013 2005 2010 2000 2005 2005 2000
Situation of the WWTP
--- OVER LOADED IN THE RANGE OF THE DESIGN CAPACITY
Over loaded
In the range of the design capacity
Just started
Over loaded
Start operation
Year 2000 1993 1998 2000 2002 1995 1983 1991 2003 1983
Actual flow rate
m3/d 36000 7 000 1200 17000 1100 1500 18000 6 000 --- 8000
Design flow rate
m3/d 50,000 5256 2428 70000 1480 1881 12000 11000 1771 9000
Design BOD
mg/l 500 843 312 800 500 280 1000 700 500
Actual BOD
mg/l 1200 1316 1100 372 1518 900 582 900 962 1000
Reuse of effluent
--- Restricted irrigation
*In addition to this treatment plant (Al-Arish), there is other treatment plant called (Al-Shaab)with an existing capacity of 15,000m operated in two parts 1979 and 1989
SLUDGE PROBLEM IN YEMEN Sludge is produced during treatment at the wastewater treatment plant and is estimated as 60 to 80 percent of BOD load. In the case of mechanical treatment, the sludge is produced on daily basis and treated by thickeners and then dried in drying beds. At the moment, mechanical systems in Yemen are having difficulties drying the solids, which require bigger areas for the drying beds, as insufficient space is available. This is ironic because usually the mechanical system is chosen for its comparative compactness: it does not require as much space as, for example, natural systems such as waste stabilization ponds. Solid waste treated by the mechanical system should, after treatment, be able to be easily taken away from the site and used as fertilizer. In the meantime, the sludge treatment is limited to thickening up to solid concentration of five percent, then the sludge is pumped into a drying beds to dry it up to 40 percent dry solids. Before the sludge is pumped into the drying beds, a polymer material is used to agglomerate the solids and facilitate the separation of water from solids, which ultimately decreases
135

the drying time as the digesters are not used. Although the period designed for the sludge to remain in the drying beds is 14 days, the actual period applied is usually 20 days, including the addition of the polymer. After this time however, the sludge is still not suitable to be used as a fertilizer – even as a domestic fertiliser – because it has not been treated to remove the pathogenic bacteria which would affect the farmers. At present, due to the absence of sufficient space to install enough drying beds, it is intended to construct anaerobic digesters in order to digest and disinfect the sludge, at the same time converting the biogas resulted from the digestion into electrical and thermal energy to be utilized in the site. Nevertheless, this technology is very precise and also requires highly skilled labour, which is no necessarily available. On the other hand, in those cities that use waste stabilization ponds (WSPs) technology, the sludge itself is considered as a more suitable fertilizer that if treated, as it stayed for six months to one year drying in the anaerobic ponds that were constructed at the beginning of the treatment systems.
REUSE OF WASTEWATER TREATMENT Currently, wastewater effluent is used in restricted irrigation, although it still not yet treated enough to be ready for irrigation (Table 1). However, some anomalies have been found, as follows:
o wastewater effluent after treatment that is not legally to be used for irrigation, has been used; o the effluent is mixed with raw water discharged from time to time due to the excessive
discharges and oil that enters the treatment plant; o some people are opening the manholes and clogging the effluent to stop the water flowing to
the treatment system, and then pumping it to the fields for irrigation. These unusual situations create health hazards and although there are efforts to stop them legally, there is still the need for improvement. Nevertheless, there is a plan to implement several more projects focused on the safe reuse of water that also complies with international standards.
CONCLUSION In order to protect the environment, wastewater should never be disposed of directly without any treatment. As Yemen is a developing country with scarce water resources, there is a need to increase the wastewater concentration on the one hand and to reuse the wastewater effluent after treatment on the other. Thus the treatment system applied should be robust in terms of efficiency and cost, meaning that systems like that of a WSP, in combination with anaerobic system, should be applied. Building capacity is therefore an important action in order to improve the management skills for wastewater and sludge treatment.
136

REFERENCES Metcalf and Eddy (2000) Wastewater Engineering; Treatment and Reuse. McGraw Hill. Arthur, J. P. (1983) ‘Notes on the Design and Operation of Waste Stabilization Ponds in Warm Climates of Developing countries’, World Bank Technical Paper No. 6, IBRD, Washinghton DC. National Water and Sanitation Authority (1995). ‘Water supply and sanitation in provincial towns’, Contract No. 2, Hadjah, Bidding documents, Sana', Republic of Yemen. Prepared by: Gitec & Dorsch Consult GMBH, Germany. Veenstra, S.; Al-Nozaily, F.; and Alaerts (1995). ‘Purple non-sulfur bacteria and their influence on waste stabilization pond performance in the Yemen Republic’. Water Science Technology. 31 (12) pp: 141-149. Yanez, F. (1980) ‘Evaluation of the San Juan Stabilization ponds’. Final research report CEPIS/WHO/IDRC. Lima.
، المؤسسه المحليه للمياه )لم تنشر (2004 -2000التقارير الشهريه حول محطة مياه الصرف الصحي بصنعاء للسنوات . الجمهوريه اليمنيه-صنعاء–والصرف الصحي
.صل شخصي، مختلف المسئولين في المؤسسات المحليه المختلفه، صنعاء، عدن، حجه، الجمهوريه اليمنيهتوا
137

OVERCOMING CONSTRAINTS IN TREATED GREYWATER REUSE IN OMAN SA Prathapar, Department of Soils, Water & Agricultural Engineering, Sultan Qaboos University, Al
Khod, Oman; Email: [email protected].
A.Jamrah, Department of Civil Engineering, Sultan Qaboos University; M. Ahmed, Department of Soils,
Water & Agricultural Engineering, Sultan Qaboos University; S. Al Adawi, Department of Soils, Water
& Agricultural Engineering, Sultan Qaboos University; S. Al Sidairi, Department of Civil Engineering,
Sultan Qaboos University; A. Al Harassi, Department of Civil Engineering, Sultan Qaboos University.
ABSTRACT The Sultanate of Oman is an arid country with a rapidly developing economy and a high population growth rate. Together, these factors have increased the demand for freshwater. In response, the Sultanate has developed well fields and installed desalination plants across Oman. Albeit meeting the demand for freshwater, such investments are straining the country’s financial and natural resources. Experience in several arid and semi-arid countries indicates that greywater can be a cost-effective alternative source of water. However, a lack of data on this alternative has impeded the widespread knowledge about and acceptance of it, up until recently. Ahmed et al. (2003), Jamrah et al (2004) and Prathapar et al. (2004) have recently collected relevant data which reveal that there are several factors constraining treated greywater reuse in Oman. For the purposes of this paper, they are categorized as quantity, quality, financial, legal, social and institutional constraints. The possible means of overcoming these constraints are also discussed.
INTRODUCTION
The Sultanate of Oman is an arid country with a rapidly developing economy and a high population growth rate, factors that have increased the demand for freshwater in recent years. In response, the Sultanate has developed 623 well fields and installed 43 desalination plants across the country. The well fields produce 6309 million gallons per annum (78500 m3/d approximately) and desalination plants have a total production capacity of 44.4 million gallons per day (202000 m3/d approximately). The freshwater is distributed to consumers at a price that varies between 1.14 USD/m3 and 1.71 USD/m3, depending on the sector (domestic or industrial) and the level of consumption (MHEW, 2002). These prices are believed to be subsidized by the Government, implying that the actual cost of water production and distribution is somewhat higher than the sale price. Furthermore, pumping out groundwater for domestic, industrial and agricultural purposes has resulted in decline in the groundwater levels and coastal salinisation across the country. Hence it may be surmised that the demand for freshwater is straining the country’s financial and natural resources. This condition is attributable to many factors, but a fundamental problem is the perception that freshwater is required to meet all demands for water, from drinking to gardening. This paradigm of water consumption must shift to one that promotes the consumption of adequate amounts of water of acceptable quality. Such a paradigm shift will convert freshwater uses and users to water uses and users, and therefore reduce pressure on the freshwater reserves and demands of the Sultanate. This shift also requires that alternative sources of water are identified, and appropriate technology is developed to harness them. Experience in several other arid and semi-arid countries indicates that greywater can be a cost effective alternative source of water. Greywater is defined as water from baths, showers, washing machines and bathroom sinks. Some sanitary experts define greywater as water that is lower in quality than potable water (drinking water), but of higher quality than black water (toilet effluents). Greywater decomposes much faster than blackwater and contains fewer pathogens, making it easy to treat.
138

Furthermore, separation of greywater from blackwater will result in septic tanks of smaller sizes, lowering wastewater treatment costs and minimizing the potential for groundwater contamination. Greywater has been used to promote sustainable development and resource conservation without compromising public health and environmental quality. Griggs et al. (1996) identified greywater reuse for irrigation and toilet flushing as a major water conservation measure. In a study conducted in the city of Los Angeles (Sheikh, 1993) on the utilization of greywater effluents for irrigation, 12 to 65 percent of water savings were observed. The study also noted that the water-savings potential of individual homes can be significant and as high as 50 percent of the total water used. An Australian experience shows that reuse of greywater for toilet flushing and lawn-gardening could achieve water savings from 30 to 50 percent of the total household water usage. Additionally, typical water savings in the range of 0.5 to 2 litres were observed per event when hand-wash water was used to flush the toilet (Jeppesen, 1996). Despite several environmental and financial benefits, constraints associated with greywater production and treatment hinder successful implementation of a reuse strategy in Oman. In this paper such constraints are identified and classified as quantity, quality, social, financial, legal and institutional constraints. Potential means by which they may be overcome are also presented.
QUANTITY CONSTRAINTS
High percentage but small volumes: greywater production in Omani households
There have been many studies in the UK, USA, Europe and Australia in which greywater production has been quantified. Surendran and Wheatley (1998) reported that in the United Kingdom, on an average, approximately equal quantities of greywater and black water were produced. Hodges et al. (1998) reported that about two thirds of domestic water was greywater. Data on household greywater production in Oman is not available at present. In order to rectify this deficiency, Jamrah et al (2004) collected qualitative data on water-related activities through a survey, and data on water consumption per activity (as reported by the Ministry of Housing Energy and Water) to estimate the total greywater produced in Omani houses The survey was conducted in 221 households with 1543 occupants, representing an urban population of similar lifestyle, culture and income. Information collected included the type of dwelling, number of occupants, floor area of the house, water meter reading, type of washing machines (manual, semi-automatic or automatic), number of washing cycles per week, frequency of showers, frequency and type of sink use for hand washing, teeth brushing, ablution and hair washing, frequency of toilet flushing, frequency of kitchen and bathroom floor-washing and frequency of garden watering. Survey results (see Table 1 below) revealed that greywater production among households varied widely (high coefficient of variation = CV). The average per capita freshwater consumption was about 195 litres per day (lpd), and 82 percent of this quantity could be classified as greywater. This is higher than the percentages reported by Surendran and Wheatley (1998) and Hodges et al. (1998). The differences may be due to (a) Jamrah et al.’s (2004) estimates based on a qualitative survey, and (b) Hodges et al. (1998) and Surendran and Wheatley (1998)’s data from temperate countries of Western culture, whose attitude towards water and water use are different from those live in a Middle Eastern Islamic country.
139

Jamrah et al. (2004) observed that greywater generated in Omani households would be independent of the floor area, but dependent on the size of the family. Greywater production increased with family size, but per capita greywater production decreased with the family size. From the study by Jamrah et al., it is reasonable to conclude that a large portion of water consumed in Omani household ends up as greywater and the volume of greywater produced at houses vary widely, depending on the size of the household. Table 1. Summary of greywater use estimates (l/person/day). Laundry Shower Sink Kitchen Greywater Blackwater Garden Cooking TotalMean 13 83 9 55 161 11 10 18 195 Std Dev.
13 51 8 53 90 11 5 14 103
C.V. 0.96 0.61 0.86 0.97 0.56 0.98 0.53 0.76 0.53 The variability in greywater produced in different households may not constrain greywater treatment and reuse, but the levels of greywater production could. Based on the data presented above, average households of eight occupants would produce approximately 1200 lpd, which is considered by the greywater industry too small an amount to develop greywater treatment systems commercially.
Large volumes but not reliable - Greywater production at mosques A significant source of greywater in Oman is the ablution water at mosques. Worshippers wash before each prayer and most mosques have ablution rooms with separate plumbing to drain water separately from black water. Prathapar et al. (2004) studied variations in the quality and quantity of greywater produced at two mosques in Oman. Their results were based on 25 weeks of data collection, beginning in October 2003, whereas results presented here are based on 42 weeks of data collection, beginning in October 2003. The first mosque at which data was collected is located at the Sultan Qaboos University (SQU). The number of worshippers per day varies from less than 100 to a few thousand, depending on the day of the week and whether the students are on leave. Weekly water use data has been collected since October 2003 and two sets of daily data for a two-week period were collected. The first was in January 2004 when students were on leave and the second was in February 2004 when the students were on campus. Weekly greywater production at the SQU mosque ranged from 32.6 m3 to 111.2 m3. Average weekly greywater production was 63.7 m3, (± 15.5 m3), with a coefficient of variation of 0.27. The primary reason for the wide range of greywater production at the SQU mosque was that the students were on leave for a period of five weeks during the data collection period. Daily greywater produced at the SQU mosque during holidays ranged from 0.84 m3 to 3.17 m3. Average daily greywater production was 2.05 m3, (± 0.56 m3), with a coefficient of variation of 0.27. Comparatively, daily greywater produced at the SQU mosque during semester ranged from 1.31m3 to 15.4 m3. Average daily greywater production was 6.6 m3, (± 4 m3), with a coefficient of variation of 0.61. The second mosque is located in Al Hail South. The number of worshippers during a day may vary from a small number to a few hundred depending on the day of the week or events hosted by the mosque for members of the community. In general, the number of worshippers was high on Fridays. Weekly water use data has been collected since October 2003. Daily water use data were collected for a two-week period in January 2004. The greywater produced every week at the Al Hail South mosque ranged from 4.1 m3 to 17.6 m3. The average weekly greywater production was 9.93 m3 (± 2.7 m3), with a coefficient of variation of 0.27. Greywater production was high during weeks when the mosque hosted a community event. Daily greywater
140

produced at the Al Hail South mosque ranged from 0.77 m3 to 1.94 m3. The average daily greywater production was 1.47 m3, (± 0.38 m3), with a coefficient of variation of 0.26. Analysis of daily and weekly greywater production data from both the mosques indicates a high degree of temporal variability in the amount of water produced on a daily basis. This makes the supply of greywater unreliable. However, the reliability of treated greywater can be increased if it is stored before use.
Quality Constraints
Greywater quality depends on the water source, plumbing system, living habits, personal hygiene of the users and types of greywater such as commercial, domestic or industrial. Other factors such as cleaning products used, dishwashing patterns, laundering practices, bathing habits and disposal of household chemicals will also influence the characteristics of greywater. As a result, the physical, chemical and biological characteristics of greywater vary greatly among families and businesses. Omani household greywater quality data reported by Jamrah et al (2004) are summarized and assessed in relation to the standards set by the Ministry of Regional Municipalities Environment and Water Resources, as presented in Table 2 below. Results obtained are similar to those reported by Jeppesen (1996) and Stephensone and Judd (1998). Results show that there is a considerable variation in quality among sources of greywater. Since most greywater is produced from showers, a comparison of shower water quality and Omani standards is made in Table 2. It reveals that greywater from Omani households would require treatment before reuse. Results also show that laundry water is highly contaminated (Table 2), but the volume is small (Table 1). Therefore, it can be disposed of together with blackwater and the remaining water from households may be separated as greywater. Table 2: Quality of greywater from Omani houses. Unit Shower Sink Laundry Standard
A1Standard B2
Acceptability
Total Solids (TS) mg/l 683 817 2700 Total Suspended Solids (TSS)
mg/l 353 505 315 15 30 N
Total Dissolved Solids (TDS)
mg/l 330 312 2385 1500 2000 Y
Total Fixed Solids (TFS)
mg/l 268 355 877
Total Volatile Solids (TVS)
mg/l 416 462 967
Fixed Suspended Solids (FSS)
mg/l 221 158 105
Volatile Suspended Solids (VSS)
mg/l 133 347 210
Turbidity NTU 375 133 444 pH 7.4 7.1 8.3 6-9 6-9 Y Dissolved Oxygen (DO)
mg/l 2.6 3.0 2.9
Conductivity mS/m 1.4 1.5 2.9 2 2.7 Y Alkalinity mg/l 15.0 13.3 28.3
1 A: Fruits & Vegetables likely to be eaten raw. Areas with public access. 2 B: Fruits and Vegetables likely to be cooked and eaten. Areas with no public access.
141

Unit Shower Sink Laundry Standard A1
Standard B2
Acceptability
Total Organic Carbon (TOC)
mg/l 83.5 70.2 174.6
Nitrate mg/l 28.7 10.2 25.8 Surfactants mg/l 14.9 41.9 118.3 Chemical Oxygen Demand (COD)
mg/l 294.3 58.0 231.3 150 200 N
Biological Oxygen Demand (BOD)
mg/l 130.0 42.1 179.7 15 20 N
Ca mg/l 15.7835 19.6953 18.7334 Mg mg/l 56.0771 20.9806 60.8399 150 mg/l 150
mg/l Y
Na mg/l 184.4993 148.9361 667.1468 200 mg/l 300 mg/l
Y
K mg/l 43.1312 5.5405 23.4326 Zn mg/l 2.4256 0.0392 0.1373 5 mg/l 5 mg/l Y Fe mg/l ND ND ND 1 mg/l 5 mg/l Y Al mg/l 0.0135 0.0108 0.0810 5 mg/l 5 mg/l Y Ba mg/l 0.0000 ND ND 1 mg/l 2 mg/l Y As mg/l 0.0300 0.0150 0.0000 0.1 mg/l 0.1 mg/l Y Cd mg/l ND ND ND 0.01 mg/l 0.01
mg/l Y
Pb mg/l 0.1036 0.0622 0.0829 0.1 mg/l 0.2 mg/l Y Cu mg/l 0.0127 0.0000 0.0064 0.5 mg/l 1 mg/l Y Ni mg/l 0.0352 0.0352 0.0352 0.1 mg/l 0.1 mg/l Y Coliform MPN >200.5 >200.5 >200.5 N E Coli MPN >200.5 >200.5 >200.5 N End of Table 2 Prathapar et al. (2004) analysed ablution water samples from mosques in terms of pH, electrical conductivity, turbidity, dissolved oxygen, BOD5, COD, coliforms, E. Coli, total suspended solids, total dissolved solids and total carbon. Table 3 (below) shows the results compared with wastewater reuse guidelines in Oman. The results show that the pH, E.C. and TDS of greywater produced at both mosques are within limits of water suitable for irrigation, but the BOD5, COD, Coliform and E.Coli levels exceed permissible concentrations, requiring treatment before reuse. Table 3: Quality of greywater at Al Hail South mosque and at SQU mosque
SQU Al Hail South Acceptable Parameter Unit n Mean S.D. n Mean S.D.
Standard A3
Standard B4
pH 17 7.10 0.24 14 7 0.39 6-9 6-9 Y E.C. µS cm-1 17 219 34 14 240 52 2000 2700 Y BOD5 mg l-1 17 61 22 14 58 38 15 20 N COD mg l-1 11 163 60 7 158 104 150 200 N Coliform N/100
ml 16 3522 3115 9 3378 5832 200 1000 N
3 A: Fruits & Vegetables likely to be eaten raw. Areas with public access. 4 B: Fruits and Vegetables likely to be cooked and eaten. Areas with no public access.
142

SQU Al Hail South Acceptable Parameter Unit n Mean S.D. n Mean S.D.
Standard A3
Standard B4
TSS mg l-1 17 25 22 34 15 15 30 N TDS mg l-1 17 120 19 132 28 1500 2000 E.Coli. N/100
ml 16 110 214 11 15 40
Turbidity NTU 17 34 17 14 51 36 D.O. mg l-1 17 5.63 1.43 14 4.81 1.88 TC mg l-1 11 67 37 7 67 30
In addition to variation in quality among sources within a house, quality also varies with time. This is evident in the data reported by Ahmed et al. (2003), presented in Table 4 (below). Table 4. Temporal variation in greywater quality
pH
EC dS/m
BOD5
mg/l Turbidity NTU
DO mg/l
Source
Week 1
Week 2
Week 1
Week 2
Week 1
Week 2
Week 1
Week 2
Week 1
Week 2
Fresh 8.04 - 1.55 - 0.7 - 0.56 - 6.2 - Hand Basin
7.63
7.4 1.52
1.74
70.3
Low
49.0
23.6
3.2
2.6
Shower 7.84 7.4 1.54 1.0 99.4 141 52.1 228 5.7 2.0 Washing Machine
8.79 8.1 3.18 2.47 240 876 480 2.3 0.8
Kitchen Morning
6.30 5.5 1.53 1.73 546 614 213 378 1.7 1.4
Kitchen Noon
6.25 7.1 1.64 1.99 315 84.7 79.9 84 1.3 1.8
Kitchen Night
6.68 7.0 1.62 1.84 386 42.4 2.67 33.1 1.8 2.0
Considering the data reported by Jamrah et al (2004), Prathapar et al. (2004) and Ahmed et al. (2003), and comparing them with Omani standards for treated wastewater reuse, it is reasonable to conclude that greywater quality in Oman varies among sources, and with time, and has to be treated before reuse.
OVERCOMING QUANTITY AND QUALITY CONSTRAINTS High variability in terms of quantity and quality of greywater, which is the case in Oman, can pose serious complications for the design, operation and maintenance of greywater treatment facilities. Greywater treatment systems require rigorous maintenance. Many greywater treatment systems fail because adequate effort is not provided to maintain installed systems. During storage of untreated greywater, suspended solids settle, aerobic microbial activities increase, anaerobic release of soluble COD increases and atmospheric re-aeration occurs. Storing greywater for 24 hours may improve the water quality by rapid settlement of solid particles, however, storage beyond it leads to depleted dissolved oxygen levels and other aesthetic problems (Dixon et al. 1999). Greywater is usually treated sequentially, as below (Surendran and Wheatley, 1998, Shouler et al. 1998):
143

Storage of Greywater: Untreated greywater cannot be stored for more than 24 hours, because it will turn septic due to microbial activity. It is recommended that the size of the storage tank is at least 2.4 times the maximum expected flow to allow sludge accumulation and sludge loading. Balancing and screening: The greywater can be acidic or alkaline, depending on its contaminants. This requires pH balancing. Furthermore, greywater may contain solid particles including hair, which has to be screened. Anaerobic treatment: This is allowed to improve the Biological Oxygen Demand status of the greywater. Aerobic treatment: This may include aeration, flotation, dilution and addition of chemicals such as alum, lime, or chlorine. Slow filtering: Filtering may include slow sand filters and carbon filters to remove odor and toxins.
However, the final design depends on quality, quantity and timing of greywater generated, soil and climatic conditions, and legal requirements. Successful designs are simple, require minimum energy, and are in a position to receive greywater any time and treat it. In almost all cases reported in Oman, the TSS, BOD5, COD, DO, Coliforms and E. Coli exceed Omani wastewater reuse standards. Laboratory tests showed that 200 ml of greywater with less than 200.5 MPN Coliform and E.Coli can be treated with 0.3 ml of chlorine solution at 4.5 mg/l concentration; and home-made sand filters have shown to be effective in removing suspended solids from greywater. Therefore, a low cost treatment system (Figure 1) may be designed as per the process outlined below, and depicted in Figure 1 (below). Initially, water is sent through a settlement pond (A) to a greywater storage tank (B). Pond A traps solids which are denser than water, and it should be cleaned periodically. Water collected and stored in B during the day will be chlorinated and lifted to sand filters C at nights. Filtered water will be stored in Tank D for reuse later. Figure 1: A low cost greywater treatment system
C
A Soil Surface
D B
144

SOCIAL CONSTRAINTS As part of the survey referred to earlier, Jamrah et al. (2004) assessed Omanis’ attitude towards treated greywater reuse. The survey revealed that: (a) 84 percent of the respondents were in favor of treating and reusing greywater; (b) 74 percent of the respondents felt that adoption of greywater treatment system would be financially beneficial; (c) 82 percent of the respondents felt that treated greywater could be used for irrigation; (d) 72 percent of the respondents felt that treated greywater could be used for toilet flushing; and (e) 42 percent said that it can be used to wash cars. However, 61 percent felt that treated greywater reuse may lead to environmental degradation and another 47 percent felt that it would harmful to human health. Surprisingly, 16 percent responded favorably for treated greywater to be used for potable purposes. Those not in favor of treated greywater reuse cited religion, health, environmental degradation including groundwater contamination and costs as reasons. Another survey (unpublished) conducted among 400 students of SQU found that 62.5 percent supported separating greywater from blackwater, 58.5 percent would use treated greywater at home and 43 percent would pay extra to change existing plumbing to facilitate greywater use. When asked for the main reasons for not accepting unlimited use of treated wastewater, 40 percent identified health and 37 percent identified religion as the reasons. In spite of some Omanis’ perception that the reuse of treated greywater is contrary to religious teachings, a council of leading Islamic scholars of Saudi Arabia issued a special fatwa in 1978 permitting the reuse of treated wastewater, even for ablution (wudu), provided that the wastewater is treated at the required level of purity for its intended use and did not result in any adverse public health effects (Faruqui et al. 2001). Furthermore, it has been repeatedly demonstrated that chlorination removes all biological pathogens from greywater. Therefore, it appears that a promotional campaign based on these facts may be necessary to address Omanis’ religious and health concerns.
FINANCIAL CONSTRAINTS In Oman, like many other countries, household plumbing combines greywater and blackwater, thus requiring modifications to plumbing to separate them. Furthermore, the amount of greywater produced from individual households (approximately 1 m3 d-1) may not be financially attractive to consumers. It is recalled that the potable water is supplied at a subsidized price between $1.14 – $1.71 USD per cubic metre. This subsidy may be a disincentive for public to make the necessary investment in greywater treatment and reuse systems. Unless it is demonstrated that the cost of modification of existing plumbing and installation and management of the greywater treatment system can be recuperated in a realistic time period, only those who are environmentally motivated and with concern for a national cause would invest in greywater separation and treatment systems. However, the separation, treatment and reuse of greywater in situ will reduce pressure on urban sewage systems and the cost of building them. The Government of Oman is now investing in new urban sewage systems in Muscat area, replacing septic tanks in houses. Hence, it may be appropriate to evaluate whether providing a subsidy to Omanis to separate, treat and reuse greywater in situ is more financially beneficial than investing in larger sewage systems to transport and treat all wastewater produced at households. There is evidence of financial benefits of treating and reusing greywater elsewhere. Faruqui and Al-Jayyousi (2002) for example, found four household irrigation projects in Jordan using greywater to have benefit-cost ratios from 2.8 to 9.4. Therefore, greywater treatment and reuse for home vegetable gardens may be an attractive option for financially rational consumers. Booker (2000) demonstrated that the cost of reclaiming greywater is about 30 to 40 percent cheaper than supplying potable water to
145

houses in Melbourne, Australia. He argued that communal greywater treatments systems would be more economical than greywater treatment systems for single dwellings. His analysis excluded positive external factors such as reduced demand for potable water and reduced flow of sewage.
LEGAL CONSTRAINTS At present, Omani wastewater reuse standards do not distinguish between greywater and blackwater. They require that greywater be treated to the standards of potable water. However, there are many households and mosques in Oman (and in many other parts of the world) that use untreated greywater for home irrigation. In principle such uses are illegal, but the bottom line is that unrealistic laws have poor participation rates and are not easily enforceable. There is also a lack of evidence to suggest that such common illegal practice has done any harm to an individual or a society. As the reuse of greywater is not widely practiced in water-starved Oman, there is no evidence of harm, yet there is also a lack of standard guidelines for greywater reuse. It may therefore be appropriate to develop legal standards, based on practicality, for this purpose. This may result in more lenient standards for greywater reuse than for blackwater reuse, thereby distinguishing between the two. In addressing these legal and regulatory aspects of wastewater management, the Government of Oman may like to consider those legal codes developed, revised and adopted by several states in the USA and in Australia as guides to develop a similar such one for Oman.
INSTITUTIONAL CONSTRAINTS Further to the legal and regulatory aspects of wastewater management, instigating a paradigm shift and implementing effective practices requires the partnership of an institution. We have seen how overseas experience, in particular in arid and semi-arid countries, indicates that greywater can be a cost effective alternative source of water that can be used to promote sustainable development and resource conservation without compromising public health and environmental quality. However, in spite of such apparent and tangible benefits, treated greywater reuse has not been widely adopted in Oman. There is a need to generate interest among public so that greywater reuse becomes a reality in Oman. This can be achieved if an institution in Oman, be it governmental or otherwise, champions and promotes treated greywater reuse based on facts instead of perceptions. It is appropriate to note here that treated greywater reuse in Jordan and Palestine is promoted by religious scholars (Imams) and perhaps a similar approach could be undertaken in Oman. To reap the benefits, the reuse of greywater must be more deeply institutionalize in Oman.
CONCLUSION
When various constraints for treated greywater reuse are considered in totality, many of them are not insurmountable. In cases where low volumes of greywater are produced and the separation of greywater requires major modification to plumbing, it may not be prudent to invest in greywater treatment systems. However, it would be beneficial to individuals and to the nation of Oman if both society as a whole and the building industry in particular could be persuaded to install greywater treatment systems in (a) new houses, (b) new apartment complexes, and (c) public buildings such as mosques and schools, where existing plumbing may be easily modified to separate greywater from blackwater. The benefits would be higher still if the treated greywater can be used for irrigating fruits and vegetables. This would require an Omani institution to champion this cause and promote treated greywater reuse based on facts.
146

ACKNOWLEDGEMENT This research is funded by His Majesty’s Fund for Strategic Research (SR/AGR/BIOR/03/01), administered by Sultan Qaboos University. The financial support of Sultan Qaboos University (SQU Research Projects: IG/AGR/SOIL/02/01) is gratefully acknowledged.
REFERENCES Ahmed, M., S.A. Prathapar, A. Al-Belushi, A. Al-Busaidi and M. Al-Haddabi. 2003. ‘Greywater Reuse Potential in Oman’. The Institution of Engineers, Australia. 28th International Hydrology and Water Resources Symposium. Wollongong, NSW, Australia. Booker, N. 2000. ‘Economic scale of greywater reuse system’. http://www.dbce.csiro.au/inno-web/1200/economic_scale.htm Dixon, A., D. Butler, A. Fewkes and M. Robinson. 1999. Measurement and Modeling of quality changes in stored untreated greywater. Urban Water. 1(4): 293-306. Faruqui, N.I., A.K. Biswas and M.J. Bino (Eds). 2001. Water Management in Islam. IDRC and U.N. University Press, Ottawa, Canada. 200 pp. Faruqui, N. and O. Al-Jayyousi. 2002. ‘Greywater reuse in urban agriculture for poverty alleviation: A case study in Jordan’. Water International, 27(3): 387-394. Griggs, J.C. Shouler, M.C. & Hall, J. 1996. ‘Water Conservation and the Built Environment. 21 AD: Water’. Architectural Digest for the 21st Century. School of Architecture, Oxford Brookes University. Jamrah, A., Al-Futaisi, S.A. Prathapar, M.Ahmad and Ali Al Harasi. 2004. ‘Evaluating greywater reuse potential for sustainable water resources management in the Sultanate of Oman’. International Conference on Water Demand Management. Dead Sea, Jordan. Jeppesen, B. 1996. ‘Domestic greywater re-use: Australia’s challenge for the future’. Desalination. 106:311-315. NSW Health (Australian Government). 2000. ‘Domestic greywater treatment systems accreditation guidelines’, p.12. (Omani) Ministry of Housing, Energy and Water. 2002. ‘Annual Report. 2002’, p. 76. Prathapar, S.A., M Ahmed, S. Al Adawi, and S Al Sidiari. 2004. ‘Variation in quality and quantity of greywater produced at two mosques in Oman’. International Wastewater Conference, Salalah, Oman. Sheikh, B. 1993. ‘Water Management in the '90s: A Time for Innovation’, Los Angeles grey water pilot project. Proceedings of the 20th Anniversary Conference. Seattle, Washington. Katherine Hon, Editor. American Society of Civil Engineers. P. 907. Stephenson, T. and Judd, S. 1998. ‘In-Building Wastewater Treatment for Water Recycling: Final Report’. Cranfield University, p.9. Surendran, S. and A.D. Wheatley. 1998. ‘Greywater Reclamation For Non-Potable Reuse’. J. CIWEM. 12: 406-413.
147

DESALINATION PRIVATISATION IN THE SULTANATE OF OMAN CASE STUDY: BARKA POWER AND DESALINATION PLANT
Taher M. Ali Sajwani, Technical Expert, MHEW; Ahmed Al Subhi, AES Barka SAOC
Email: [email protected]
ABSTRACT The Government of the Sultanate of Oman decided in 1999 to open up and privatize the whole electricity sector. This was considered part of Omani economic reforms that have taken place since the third and fourth five years plans instigated by the Government. As part of the electricity privatization process, it was decided to fast–track the implementation of some projects to enhance the infrastructure of power supply, due to the high demand from new and existing customers. The Barka power and desalination plant was one of the projects approved by the government to be executed by the private sector during this period. It was the first dual purpose power generation and desalination plant, 100 percent owned by international and local investors. The capacity of the first phase of the plant is 427 MW and 20 MIGD. This paper highlights some issues of privatization of desalination plants associated with power generation in Oman, for which the Barka power and desalination plant will be considered as a case study.
INTRODUCTION The history of major desalination plants in Oman goes back to early 1970s when it was decided by the government to build the Ghubrah power and desalination plant in the Governorate of Muscat, to meet the high demand for potable water for domestic purposes, due to the fast development of the country, population increase and rapid rise in living standards. Today, five Wilayats out of six in Muscat depend mainly on desalinated water for their daily water supply in order to meet domestic, industrial and commercial demand. The installation capacity of the Ghubrah plant, which comprises of seven multi–stage flash units with associated steam and gas turbines units, is now 41 million imperial gallons per day (MIGD). The average daily production in 2003 reached 33 MIGD. Until this year, the government of the Sultanate of Oman was responsible for the supply of electricity and potable water supply. Based on the (international and local) experience of the Manah Power station in the mid nineties, and the outcome of the study, "Oman Electricity and Related Water Sector Privatisation" in 1999, it was decided by the Cabinet to open up and privatise the electricity and related water sector. The study recommended that before the process take place, certain fast-track projects should be executed to strengthen the infrastructure of the power and water supply. The Barka Power and Desalination Plant was one of these such recommended projects that was chosen to be implemented by the private sector on a Build, Operate and Own (BOO) basis, for 15 years from the commercial operation date (COD). It was decided to start plant construction in 2000, to be completed by 2003.
148

BARKA POWER AND DESALINATION PLANT
Background The project tender was floated by the Tender Board on 30/04/2000 and bids by three international bidders were received on September 4th, 2000. The successful bidder, AES BARKA of USA and its local partner Multitech signed the contract document on November 26th, 2000 and the Commercial Operation Date was set on April 4th, 2003. The main plant contents, agreements, environmental and other contractual requirements are listed below.
Main Plant Contents
o Three MSF units (each 6.7 MIGD), No. of stages 16 heat recovery +3 heat rejection. o Two Gas Turbine each rated at 117 MW with generator 159 MVA each at reference condition
of 50 C and 100% humidity. o One Steam Turbine rated at 222 MW with generator 280 MVA. o Fuel Facilities (Natural Gas and Fuel Oil as supplementary). o Two heat recovery steam generator (HRSG), with supplementary firing, including
demineralisation water treatment for boiler. o Sea Water Intake and out –fall facilities for phase (I) and (II) (Four sea water embedded pipes,
length of the pipes is 1200m and diameter 2.2m for intake and 2.5m for outfall). o Control and administration building. o All ancillary facilities (transformers, switchgear, fire fighting facilities, etc). o Remineralisation plant (CO2, limestone, chlorination, fluoridation, etc). o Roads, Security fence and system,
Main Agreements.
o Power and Water Purchase Agreement (PWPA). o Natural Gas Sales Agreement (NGSA). o Usufruct Agreement (land lease). o Master Novation Agreement. o Founders Agreement. o Performance Bond. o Omani Contents and Omanisation.
Environmental Requirements An Environmental Impact Assessment (EIA) study was undertaken and the results of the study were better than the parameters mentioned in the Agreement. The fuel for Barka plant is natural gas which has low Sulphur content of 5 ppm or less. The main by-product of the combustion is water vapour, carbon dioxide (CO2) with the limit of 40 mg/nm3, and oxides of nitrogen (NOx) with the limit of 60 mg/nm3.The Sulphur dioxide (SO2) and particulate (smoke) associated with coal or oil produced other than in trace amounts. Plant emission and noise levels are controlled to meet the requirement of Ministry of Regional Municipalities, Environment and Water resources and World Bank Guidelines. Using Dry low NOx (DLN) combustion significantly reduces the NOx, which is the main environmental concern in the gas-fired plant. NOx levels during plant performance testing have been well below the required levels.
149
Clean water after treatment has been used inside the plant for landscaping. The seawater outfall has been designed to minimize the thermal effect of the circulated seawater that is returned to the marine environment.
Tariff Usually the tariff of an IP (W) P is divided into two sections, namely the capacity charge and the energy/water output charge. The capacity charge consists of an investment charge and a fixed operation and maintenance charge. Adjustments are made toward scheduled unavailability of the plant and/or units, forced outage and de-rating of the plant. The calculation formulae also take into account the inflation and exchange rates. The energy/water output charge consists of a fuel charge, variable operation and maintenance charge and number of start-ups of the units above those offered by the project company.
Why Privatise Desalination plants Recently in the Gulf countries, the trend has shifted responsibility for implementation of desalination plant projects from governments to the private sector. This could be attributed to the following factors:
o Desalination projects need significant capital and their operation expenditures can affect the civic budgets and thereby influence government spending on other priorities. Governments call for public/private partnership, to help share these costs and responsibility.
o Due to higher comparative costs of production for ground and natural water, high subsidies are required. The private sector focuses on the subsidies and makes efforts to reduce them with higher technical, operational and financial efficiencies and performance.
o Large sums of foreign and local investment for a longer time can be attracted. o The desalination industry can be regulated with proper contractual obligations and duties. This
would guarantee security of supply, particularly by the private sector. o Capital markets can be stimulated with new capital and participants. o The project implementation period can be shortened by the private as compared to public
sector and the plant lifetime can be lengthened due to higher quality maintenance available privately.
o The technology of desalination is closely associated with electricity, underlining the importance of efficiency and performance of the plants.
CONCLUSION Desalination is partly a solution to water shortage problems in water scarce countries such as those in the Gulf. It comprises is a significant yet vital part of economy in Oman. However, due to higher costs of desalination compared to natural water, subsidies are required. The private sector is therefore encouraged to participate in building, operating and owning desalination projects. Local and international investors have a readiness to invest in the desalination business and in general, it is important to accumulate local experience in the field of desalination operations, manufacturing, research and development, projects execution, etc. Several sectors can benefit from the privatisation of desalination plants, such as capital markets, local trade, manufacturers, contractors, investors etc. However, regulation is necessary and performance, efficiencies, timing, quality control, etc could be enhanced through better conditions of contracts. Thus, it is important to spread awareness about privatisation, and especially as relates to desalination, to the public.
150

DECENTRALIZED WASTEWATER USE FOR URBAN AGRICULTURE IN PERI-URBAN AREAS: AN IMMINENT OPTION FOR THE ORGANISATION OF ISLAMIC CONFERENCE COUNTRIES
Al-Beiruti, Shihab N. Head of Services and Programs Section, Inter-Islamic Network on Water Resources
Development and Management, Amman, Jordan. E-mail: [email protected]
ABSTRACT This paper concentrates on the experience, methods and results of the Inter-Islamic Network on Water Resources Development and Management (INWRDAM) in greywater treatment and use, in order to make it easily affordable to more Islamic countries. Over the last five years the INWRDAM has undertaken applied research on decentralized wastewater treatment and use. This has focused on instigating a holistic approach for the development of “state of the art” modular on-site greywater treatment and use units at the INWRDAM household level, and implementing capacity building of the local peri-urban communities to enable them to practice sustainable urban agriculture (UA) by saving fresh water and safeguarding the environment. The outcome of this research to date has been the optimization of the modular low-cost units for greywater treatment and use by drip irrigation techniques and selection of crops for home gardens. These findings were the results of three projects. The first, entitled ‘Post Project Evaluation of Permaculture Techniques’, and second, entitled ‘Greywater Treatment and Reuse in Home Gardens’, were both conducted in the town of Ein Al-Baida, Tafila Governorate, in the southern part of Jordan, and were funded by research grants from the International Development Research Centre, Ottawa, Canada (IDRC). The third project, entitled ‘Community Involvement in Reuse of Greywater to Improve Agriculture Output’, was financed by the Jordanian Ministry of Planning and International Cooperation of Jordan (MOPIC), and benefited more than 800 households in 90 peri-urban sites throughout Jordan with greywater units and drip irrigation systems. The INWRDAM also succeeded in establishing similar greywater activities in other Islamic countries such as Lebanon, where the adoption of greywater in a cluster of six towns is being implemented. The results of this research were well-accepted by the local community and by the government of Jordan. More projects addressing greywater use are now being implemented in Jordan, Palestine and Lebanon, with emphasis on conserving fresh water, improving sanitation and generating extra income for the poor in peri-urban areas. They constitute sustainable urban agriculture practices. As a result of these activities, a recent evaluation of INWRDAM’s greywater projects indicated that ‘INWRDAM has contributed to raising the profile of greywater use both in Jordan and in other parts of the world’.
INTRODUCTION
Freshwater is a finite, naturally renewable resource received by way of precipitation, but significantly, is unevenly distributed in time and space. In 1989, Falkenmark, Lundqvist and Widstrand ranked countries according to “per capita annual water resources”. For annual water resources of 1700 m3 and above, shortage will be local and rare; for 1000 m3 and below, it will hamper health, economic development, and well being; and for 500 m3 and below, water availability will be a primary constraint to life (3). Since 1995, the INWRDAM published water scarcity data on 55 Muslim countries, revealing that most of these countries have water availability of less than 1000 m3 and 10 countries out of the total, including Jordan, have per capita water of less than 500 m3.
151

Centralized sewerage systems, the preferred choice for planners and decision makers, are inappropriately provided to individual communities and wastewater is transported from several scattered communities to centralized facilities. The high cost of conventional sewers is regarded as one of the major constraints to expanding wastewater services to small communities. A World Bank review of sewerage investment in eight capital cities in developing countries found that costs range between US $600 to $4000 per capita (1980 prices), with total household annual cost of US$ 150 to 650 (2). The conventional sewerage systems are more costly in small communities: because of their size and layout, small communities do not enjoy the economies of scale needed for building large systems. The low population density means that longer sewers are needed to serve each household. The cost per household in the Jordan Valley rural sanitation project was projected at US$2200, four times the average of all urban wastewater projects constructed in Jordan between 1997 and 1996 (4). Conventional sewerage systems are designed as waste transportation systems in which water is used as a transportation medium. Reliable water supply and consumption of 100 litres per capita per day (lpcd) are basic requirements for the problem-free operation of conventional sewerage systems. Conventional sewerage is not appropriate for small communities in the Middle East region where water supplies are intermittent and only limited amounts of water are available. By transporting the wastewater away from the generating community, several reuse opportunities can be lost. Reuse opportunities are often located within the generating community for landscape or for agriculture. Recent research and development in the field of greywater and wastewater management suggests that centralized wastewater management is environmentally unsustainable (5).
GREYWATER USE
A functional and sustainable wastewater management scheme begins at the household level and is largely dependant on the “software” or human component of the process. Only when perception of need and perhaps also the anticipation of a wastewater use system has been internalised at the neighbourhood/ user level, will planning and implementation be successfully executed (6). Local-level support of a treatment and recovery scheme can, in turn, catalyse pro-active institutional and vertical support from the government. Once the software component has been integrated into the project development, the “hardware” or technological component can act to promote a comprehensive, integrated, and sustainable wastewater treatment and recovery strategy for the community - if it is well selected and “appropriate”. Wastewater and greywater treatment technologies in the developing world must have one overriding criterion: the technology must be cost-effective and appropriate. Greywater use represents the largest potential source of water-saving in domestic uses. The use of domestic greywater for landscape irrigation makes a significant contribution towards the reduction of potable water use. In Arizona, for example, it is documented that an average household can generate about 135,000 to 180,000 litres of greywater per year (7). This illustrates the immense potential amounts of water that can be used, especially in arid regions like the Middle East and North Africa. Domestic greywater use offers an attractive option in arid- and semi-arid regions due to severe water scarcity, rainfall fluctuations, and the rise in water pollution. To ensure sustainable water management, it is crucial to move towards the goal of efficient and appropriate water use. Greywater use contributes to promoting the preservation of high-quality fresh water as well as reducing pollutants in the environment. Meeting different needs with the appropriate quality of water may prove to be economically beneficial and at the same time reduce the need for new water supplies at a higher marginal cost (7/8).
152

HEALTH GUIDELINES
Wastewater treatment must meet quality standards safe for human contact, use and consumption and for application to irrigated crops. In most countries, guidelines and standards for greywater either do not exist or are being revised or expanded. The most frequent guidelines directing the use of greywater to a level considered safe enough to protect human health are those outlined in the Engelberg Standards. These guidelines outline acceptable microbial pathogen levels for treated wastewater for use in restricted and non-restricted irrigation. Restricted irrigation refers to the irrigation of crops not directly consumed by humans (e.g. olive trees, fodder crops). For restricted irrigation, wastewater effluents must contain ≤ 1 viable intestinal nematode egg per litre. Unrestricted irrigation refers to the irrigation of vegetable crops eaten directly by humans, including those eaten raw, and also to the irrigation of sports fields, public parks, hotel lawns, and tourist areas. The criteria for unrestricted irrigation, contains the same helminth criteria as restricted irrigation, in addition to a restriction of no more than a geometric mean concentration of ≤ 1000 faecal coliforms per 100 ml/treated effluent. These guidelines have been introduced to directly protect the health of consumers who may eat uncooked crops, such as vegetables and salads (9).
GREYWATER TREATMENT PROCESSES The daily quantity of greywater collected or recovered from a household in rural areas is usually small. The major difficulty presented for treatment of greywater is the large variation in its composition. For instance, laundry effluents contain high concentrations of detergents and washed out dirt, and this can double or even treble the organic content of the greywater. Cooking and frying oil and fat in the form of food that remains on dishes and in cooking utensils, results in the biggest source of organic pollution in greywater recovered from an average family house. Treatment of greywater to a quality level suitable for irrigation of home garden crops not eaten raw can be achieved by a variety of methods, but low cost and low technology must be the main factors in selecting a treatment method. Anaerobic treatment systems, such as up-flow anaerobic sludge blanket or the confined space constructed wetland offer reasonable choices for greywater treatment. Anaerobic treatment processes are not affected by wide variation in influent quality or shock loads as compared to aerobic processes. The main pollution load in greywater is in the form of organic matter and pathogenic micro organisms. Greywater can contain about 105/ 100 ml of potentially pathogenic micro organisms. Stored greywater undergoes changes in quality, which include growth in numbers of micro organisms according to the limiting factors for each particular micro organism. Research has shown that counts of total coliforms increased from 100-105/100 ml to above 105/ 100 ml within 48 hours in stored greywater from various sources. Of more concern is the potential infection route that greywater provides for viral infections. It is important that the nutrient resources (nitrogen and phosphorous) be conserved if the wastewater is destined for use in agriculture irrigation. Greywater use in irrigating home gardens in rural areas offers higher potential success and public acceptance.
CHARACTERIZATION OF GREYWATER The quality of greywater is directly related to the amount of water used in the house. It is affected by certain habits of the occupants such as bathing, the use of disposable or washable diapers and baby washing, and whether dishwashing is undertaken by hand or with a dishwashing machine. The flush toilet consumes much more water than the non-flush type commonly used by the rural poor in developing countries, and in much of the Middle East. Highly urbanized and high-income families use
153
much more domestic water than the rural poor. The kitchen is a major source of pollutants in greywater and cloths washing and laundry may come next. Some countries enforce regulations that prevent mixing greywater originating from the kitchen sink with greywater from other sources in the house. The use of soaps and body shampoos and excess use of detergents and cleansing chemicals can in general significantly increase the pollution of greywater. Greywater is relatively low in suspended solids and turbidity, indicating that a greater proportion of the contaminants is dissolved. The COD:BOD ratio may be as high as 4:1 (much higher than values reported for sewage) and this is mainly due to use of detergents of low biodegradability. COD values could vary from 40 to 370 mg/l between sites, with similar variations arising at an individual site. Greywater is also deficient in macronutrients such as nitrogen and phosphorous (10).
INWRDAM EXPERIENCE IN GREYWATER TREATMENT AND USE From 2001 to 2003, the International Development Research Centre (IDRC), Ottawa, Canada provided INWRDAM with financial assistance to enable it to conduct an applied research project for greywater treatment and use in irrigation of home gardens in Ein Al Beida village, Tafila Governorate in southern Jordan. The main objective of the research was “to help the periurban poor in Jordan preserve precious fresh water, achieve food security, and generate income, while helping to protect the environment”. To achieve this goal, the following specific objectives set for this project were to:
o increase greywater recovery and make it more convenient and safe to handle; o minimize environmental impacts associated with greywater use and ascertain whether
greywater treatment is necessary and cost-effective; o improve gardening/permaculture practices; o strengthen local capacity to safely and efficiently use greywater and enable women to be
better managers of household resources; o promote changes in policies to encourage greater greywater use in Jordan.
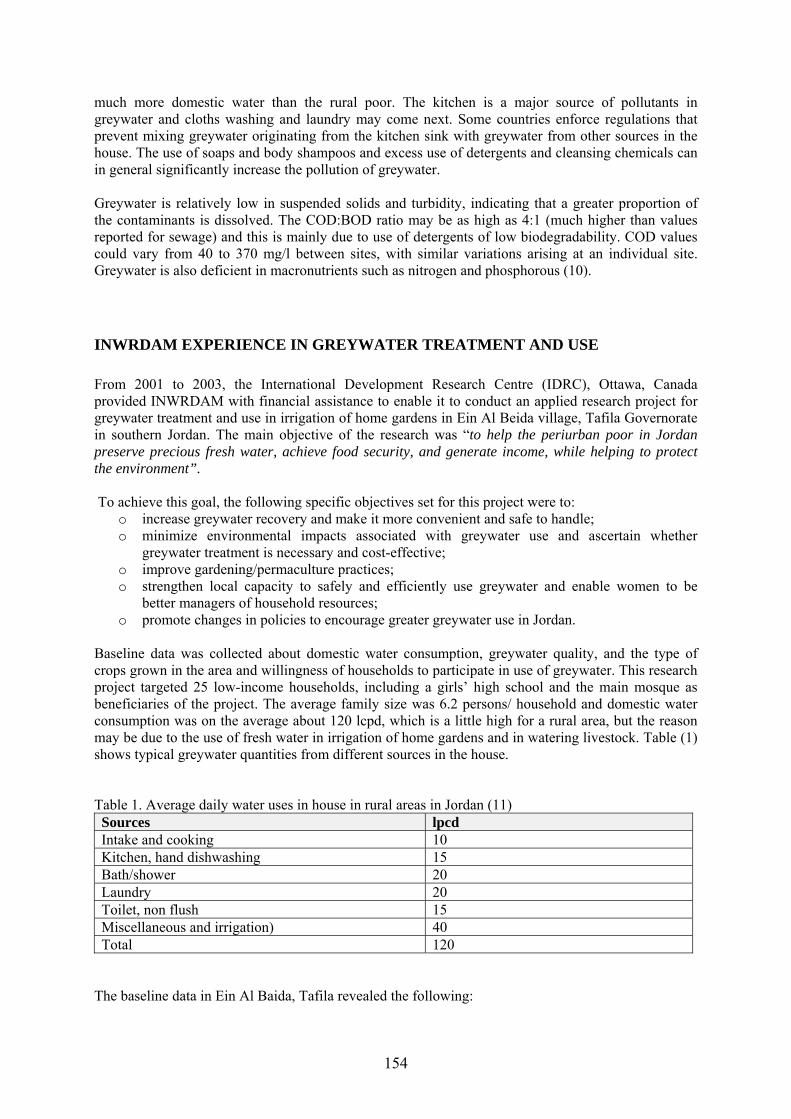
Baseline data was collected about domestic water consumption, greywater quality, and the type of crops grown in the area and willingness of households to participate in use of greywater. This research project targeted 25 low-income households, including a girls’ high school and the main mosque as beneficiaries of the project. The average family size was 6.2 persons/ household and domestic water consumption was on the average about 120 lcpd, which is a little high for a rural area, but the reason may be due to the use of fresh water in irrigation of home gardens and in watering livestock. Table (1) shows typical greywater quantities from different sources in the house. Table 1. Average daily water uses in house in rural areas in Jordan (11) Sources lpcd
Intake and cooking 10 Kitchen, hand dishwashing 15 Bath/shower 20 Laundry 20 Toilet, non flush 15 Miscellaneous and irrigation) 40 Total 120
The baseline data in Ein Al Baida, Tafila revealed the following:
154

o The average BOD5 of raw greywater ranged from 300 mg/l to 1200 mg/l due to low water consumption and because the kitchen sinks were considered as a source of recovered greywater.
o The detergent concentration in greywater, measured by the methylene blue active substances (MBAS), and ranged from 10 mg/l to 300 mg/l.
o Salinity of greywater was on average equal to 820 µS/cm, which nearly doubled from the 450 µS/cm value for domestic water supply.
o The average background soils salinity; measured as sodium adsorption ratio (SAR) was about two.
o The main crop in home gardens was olive trees and most families preferred to raise chicken and goats.
o Most households had no religious or cultural barriers precluding the use of wastewater and women showed a willingness and ability to learn new methods of irrigation and home gardening.
Women leaders in the village community were identified and trained to be trainers of other women and girls on various subjects, such as upstream pollution prevention in the house by wise use of detergents, good dishwashing practices and permaculture techniques. Local technicians were trained to carry out the operation and maintenance of greywater treatment units.
Description of technology On-site greywater treatment methods developed by INWRDAM were designed to minimize costs, maximize the ease of construction, lower operation and maintenance costs and yield greywater of a quality suitable at least for restricted irrigation.
The two-barrel system Two plastic barrels constitute the treatment kit, each with a capacity volume of 160 litres, and a large cover, which can be closed tightly. The two barrels are lined up beside each other and interconnected with 50 mm PVC pipes. The first barrel or tank is fitted with pipes to allow grease, oil and solids to separate, and thus acts as a pre-treatment or primary treatment chamber, where the solid matter in the influent greywater settles and other components, such as grease and soap foam, float. When the cover is opened, the chamber can be cleared of both floating and settled material. The second barrel or tank acts as a storage tank for primarily greywater. As soon as this barrel is filled, a floating device switches on a small water pump which then delivers the water through the drip irrigation network. The two-barrel kit was found suitable for small families such as pensioners and old couples with no kids.
The four-barrel system This system is an improvement on the two barrel kit. Two tanks each with a 220 litre capacity are filled with gravel that act as anaerobic filters, which are inserted between the pretreatment tank and final storage tanks. The four barrels are lined up next to each other and interconnected with 50 mm PVC pipes. Once solids and floating material settle in the first barrel, the relatively clear water from the first barrel enters into the bottom of the second barrel. Next, the water from the top of the second barrel enters into the bottom of the third barrel. This water passes through the gravel lumps (2-3 cm size graded gravel) and from the top of the third barrel is taken into the fourth. Anaerobic treatment is accomplished in the two middle barrels. Anaerobic bacteria gets established on the stone surface so that when the greywater passes through the stones, the bacteria works on breaking down components of the organic material found in the greywater. The last barrel acts as a storage tank for treated
155

greywater. As soon as this barrel is filled, a floating device switches on a small water pump which then delivers the water through the drip irrigation network. For an average family home, 20-30 trees (olives, fruit etc) that are planted in the domestic garden can be irrigated. With the resident time of one to two days in the four-barrel treatment kit, the influent greywater undergoes a treatment level that meets the World Health Organization’s guidelines for restricted irrigation, specifically equivalent to a level between primary and secondary treatment.
The confined trench system Two plastic barrels and a dug trench filled with gravel media constitute the confined trench system. The first barrel functions is a grease, oil and solids separator and thus acts as a pretreatment or primary treatment chamber, where the solid matter from the influent greywater settles and the floating components, such as grease and soap foam floats, and can be removed regularly. A trench, approximately three metres long, 1 metre wide and 1 metre deep, is dug close to the first barrel and is lined with an impermeable polyethylene sheet of 400-500 µm thickness. The trench is then filled with 2 to 3 cm size graded gravel. Pretreated wastewater from the first barrel enters the bottom part of the trench from one side and flows slowly to the other end. The sides of the side trench are plastered with a mud layer so that the liner sheet is not punctured by sharp stones. A 120 litre capacity plastic barrel is perforated and burred in the gravel at each end of the trench so that treated wastewater follows throughout the trench and upwards to fill this barrel. As soon as this barrel is filled, a floating device switches on a small water pump which then delivers the water through the drip irrigation network. Residence time of greywater in the trench is two to three days under anaerobic conditions. The confined trench unit can serve more than one nearby family sharing same garden plot, and can also deliver more water quantity between pumping cycles. Tables 2A, 2B and 2C (below) show the quality of a representative raw greywater in rural areas of Jordan and the effluent quality of treated greywater that can be used to irrigate productive home gardens.
Table 2 A. Effluent quality from 2- barrel system (households No 1) Sample type pH TSS O&G BOD5 ABS 11-6-02 6.4 39 24 154 19 21-7-02 6.7 69 21 186 60 14-8-02 7.8 2 14 23 1 05-9-02 8.3 57 NTa 59 2 20-10-02 6.1 94 30 518 NT 13-12-02 8 19 96 12 NT aNT= Not tested
Table 2 B. Effluent quality from 4- barrel system (households No 6) Sample type pH TSS O&G BOD5 ABS 11-6-02 6.8 183 31 844 110 14-8-02 4.7 165 7 564 95 14-12-02 6.3 76 44 369 NT 17-02-03 7.4 128 40 246 170 29-05-03 8.2 88 NT 225 NT aNT= Not tested
156

Table 2 C. Effluent quality from confined trench (households No 3) Sample type pH TSS BOD5 COD 07-07-03 7.7 398 467 327 03-08-03 7.2 22 14 87 06-09-03 7.6 48 32 198
The greywater quality parameters, shown in the tables above, demonstrate the degree of effectiveness of the treatment of greywater. The variation in greywater quality was substantial and was affected by the care of family members with respect to up stream prevention of pollution. The regular cleaning of the oil and grease separator barrel resulted in big improvements in treatment and reduction of coliform counts. The greywater of these units were fit for irrigating olive trees, cactus and many fodder crops. Monitoring of the impact of greywater on soil and plants after two years of application revealed some increase in soils SAR, but it was below a level that could affect plant yield. All plant growth rates were improved due to regular complementary irrigation and there was no contamination of crops with fecal coliform. During this project, the INWRDAM developed a special environmentally-friendly liquid dishwashing detergent and bathing shampoo that contain potassium or magnesium ions in place of some sodium ions, so that the long-term impact of detergents is controlled. The long-term impact of greywater application on soil and plants was also addressed and available data monitored over two years indicate that no build-up of harmful salinity and harmful chemicals was recorded. The cost of the kit module that serves a family of six, including a drip irrigations system for 2000 m2 garden area, was around US$ 230, whereas the two-barrel kit and four-barrel module was US$ 370, and the confined trench serves up to 12 persons was US$ 500, including drip irrigation systems. A cost/benefit analysis indicates that the household’s income increases thanks to greywater irrigation, saving fresh water costs, a reduced septic tank disposal cost and improved crop yield. This saving is in the range of 10 to 30 Jordanian Dinar (JD) per month. This means that cost of greywater units can be recovered on the average in less than three years. The life of the greywater units is estimated to be more than 10 years with minimal running cost.
INWRDAM’s Phase II of the Greywater Project INWRDAM conducted Phase I of this IDRC-funded project from May 2001 to May 2003 in Tafila Governerate, southern Jordan. During Phase I, INWRDAM installed 25 greywater units in low income households of the periurban community of Ein Al-Baida, a town in Tafila. Five different types of on-site greywater treatment units/modules were developed and tested over three years. Two out of the five modules were selected as potential units for further improvement. One module is known as the four-barrel unit (see Figure 1), which consists of four recycled plastic barrels lined up in an arrangement to receive greywater and achieve physical and biological treatment. A small automatic electric pump is used to deliver treated greywater to a trickle irrigation system serving a small garden of trees. The second unit (see Figure 2) is known as the Confined Trench (CT) module. It consists of a stage for removal of oil and grease, as well as a dug trench of about 3.5 m3 filled with gravel that serves as the treatment medium. The treated greywater is then pumped automatically through a trickle irrigation system. In addition to units installed in Ein Al-Baida, INWRDAM has also installed over 750 greywater units of different types for the benefit of low income families across Jordan in 2002, through a project financed by the Jordanian Ministry of Planning and International Cooperation (MOPIC).
157

Phase II will construct 300 additional greywater systems for low income families in clusters of towns in selected periurban areas, so as to further improve technical aspects, remove social and institutional obstacles and build momentum, thus accelerating the adoption of the greywater system in Jordan and elsewhere in the region. A key component of the project will be to promote community participation in all stages of the project by adopting participatory methodology. Phase II will involve cooperation between concerned agencies in wastewater use, social development, building codes and public health. The National Centre for Agriculture Research and Technology Transfer (NCARTT) will be involved in the environmental and agricultural research components of this project. The Phase II Goal is: “To help the peri-urban poor in Jordan preserve precious fresh water, achieve food security, and generate income, while helping to protect the environment”. The Phase II Objective is: “To evaluate previous greywater use projects in Jordan, validate existing approaches, address social and institutional obstacles to scaling up greywater use, and monitor and refine systems to ensure long-term sustainability”. The implementing organizations of Phase II look forward to cooperation amongst all stakeholders to ensure a successful outcome of this applied research project. Figure 1. Four-Barrel Greywater Treatment Unit
CONCLUSIONS AND RECOMMENDATIONS
The project resulted in many direct and indirect benefits to the community and the environment. Women in the community benefited most from this project through training workshops, dialogue and learning by doing - acquiring new management skills and learning to build a productive garden. The monthly domestic water consumption decreased by about 30 percent for all greywater users and income of the poor increased on the average by US$50 to US$150 per month. Many beneficiaries no longer had to pay a large portion of their meager monthly income to regularly emptying their septic tanks, thus many families started to copy and imitate the practice of their neighbors with respect to greywater use. The following recommendations can be made regarding greywater use technologies:
o The scheme or technology should be a recognised priority in public or environmental health, and both centralized or de-centralized technologies should be considered.
o The technology should be low-cost and require low energy input and mechanization, which reduces the risk of malfunction.
o The technology should be simple to operate, be local-labor intensive, maintained by the community, and not rely on expensive chemical inputs, such as chlorine or ozone to meet quality guidelines.
o The treatment should be capable of being incrementally upgraded as user demand or quality standards and treatment guidelines increase.
158

The results of this project convinced the Ministry of Planning and International Cooperation of Government of Jordan that greywater use can preserve fresh domestic water, help improve agriculture productivity at household level and generate income. As a consequence of these tangible benefits, the Ministry of Planning of Jordan funded INWRDAM in September 2002 to enable the implementation of more than 700 greywater units in rural areas of Jordan. This project was successfully completed on June 2003. IDRC has approved in February 2004 a grant worth of CAD$725.000.- for INWRDAM to further test and develop the greywater kits so that communities can be served with 300 of such kits over the coming 3 and half years in Jordan.
REFERENCES 1 - Kalkenmark, M., Lundqvist, J. Widstrand, C. 1989. ‘Macro-Scale Water Scarcity’. 2 - Requires Micro-Scale Approaches. ‘Aspects of Vulnerability in Semi-arid Development’. Natural Resources Forum, 13 (4), 258-267. 3 - Chandrant D. Thatte (2002). ‘Water and Food Security – How the Poor Will Get Their Food?’. Water Resources Management; Crosscutting Issues, I. H. Oclay Unver and Rajiv K. Gupta (eds). Middle East Technical University Development Foundation Publishing and Communications Co., Ankara. 4 - Mara, D. 1996. ‘Unconventional Sewerage Systems: Their Role in Low-cost Urban Sanitation’. Low-Cost Sewerage (D. Mara, ed), pp. 13-18. Chichester: John Wiley and Sons. 5 - Loredo, D. and Thompson R. 1998. ‘Assessment of Jordan Valley Rural Sanitation Feasibility Study’, Environmental Health Project (EHP) Activity Report No. 44. Washington DC: USAID. 6 - Hedberg T. 1999. ‘Attitudes of Traditional and Alternative Sustainable Sanitary Systems’. Water Science and Technology. 39 (5) 9-16. 7 - Khouri, N., Kalbermatten, J. M., and Bartone, C. 1994. ′The reuse of wastewater in agriculture: A guide for planners’. Washington, DC: UNDP/World Bank Water and Sanitation Program. 8 - Website: http://www.watercasa.org/pub/graywater-guidelines.html. 9 - Odeh R. Al-Jayyousi. ‘Greywater reuse: towards sustainable water management’, Desalination. 156 (2003) 181-192. 10 -Mara, D. and Cairncross, S. 1989. ‘Guidelines for safe use of wastewater and excreta in agriculture and aquaculture’. Geneva: United Nations Environmental Programme/World Health Organization. 11 - B. Jefferson, A. Laine, S. Parsons, T. Stephenson and S. Judd. 1990. ‘Technologies for domestic wastewater recycling’. Urban Water, 1: 285-292. 12 -Bino, J. Murad and Al-Beiruti, S. ‘Greywater Treatment And Reuse Project, Tafila, Jordan (2000-2003)’. Conducted by the Inter-Islamic Network on Water Resources Development and Management with financial support from the International Development Research Centre (IDRC).
159

USE OF PYROAURITE TYPE SORBENT, ACTIVATED CARBON AND FLYASH IN REDUCING COD OF DOMESTIC WASTEWATER
Dr R.P. Singh, Piyush Gupta, Namrata Gupta and Radha Gupta; School of Chemical Sciences, Chemistry
Department, St. John’s College, Agra; E-mail: [email protected]
ABSTRACT The aim of the research was to evaluate the ability of a synthesized pyroaurite type sorbent (PTS) as an alternative media over activated carbon (AC) and flyash (FA) for domestic wastewater treatment. The main components of domestic wastewater are proteins, carbohydrates, detergents, tannins, lignin, humic acid, fulvic acid, melanic acid and many other dissolved organic compounds that cause high values of chemical oxygen demand (COD). Batch tests were carried out to reduce COD at different initial COD values, treatment times, adsorbent doses and pH values of the media. The results have indicated that the COD can be reduced by up to 90 percent by PTS or AC, while the use of flyash only reduces COD up to about 60 percent. The trend of COD removal percentage by PTS is fairly comparable to that of commercial activated carbon. Though the capacity of FA is lower than that of PTS or AC, its low material cost makes it an attractive option for the treatment of domestic wastewater. Thus, the treatment of domestic wastewater can be done not only by PTS or AC, but also by flyash generated from a thermal power plant, or any factory, to reduce the organic load.
INTRODUCTION Water pollution by organic and inorganic chemicals is of serious environmental concern and wastewater is one type of polluted water that results from human use, be it domestic or industrial. Domestic wastewater differs in its characteristics from industrial wastewater. In domestic wastewater the organic load mainly results from processes like bathing, sewage, food processing, and washing the floor, clothes, utensils and animals. The main components of domestic wastewater are proteins, carbohydrates, detergents, tannins, lignin, humic acid, fulvic acid, melanic acid and many other dissolved organic compounds (Manka et al., 1974). The organic content of wastewater is traditionally measured using lumped parameters such as biochemical oxygen demand (BOD), chemical oxygen demand (COD) and total organic carbon (TOC). Commercial activated carbon is regarded as the most effective material for controlling the organic load. However, due to its high cost, and the fact that about 10 to 15 percent is lost during regeneration, unconventional adsorbents like flyash, peat, lignite, bagasse pith, wood and saw dust have been widely investigated for the removal of refractory materials (Pandey et al., 1985), with varying degree of success. Several investigations (Mott and Weber, 1992; Viraraghavan and Dronamraju, 1992) explored the use of flyash as an adsorbent for the treatment of wastewater to remove a variety of organic compounds and color. Gupta et al. (1990) used flyash for the removal of chrome dye from aqueous solutions and found that the mixture of flyash and coal (1:1) may substitute the activated carbon. Each of them concluded that flyash has a significant capacity for adsorption of organic compounds from aqueous solutions. It was reported that the carbon content of flyash plays a significant role during the adsorption of organic compounds by flyash (Banerjee et al., 1995). The adsorption capacity increases with the increasing carbon content of flyash. However, a review of the literature showed that very little investigation has been conducted to find out the suitability of synthetic sorbents like PTS or flyash for the removal of COD from domestic wastewater.
160

The aim of this research was therefore to evaluate the ability of a synthesized pyroaurite type sorbent (PTS) as an alternative media over activated carbon (AC) and flyash (FA) for water treatment. The research is likely to lead to the commercial development and modification of self synthesized pyroaurite -type sorbent for water treatment, with the following perceived benefits: aluminium (Al) free, multipurpose, low cost and rapid sorption medium.
TOXICITY OF ALUMINIUM Recently, aluminium exposure has been hypothesized as a risk factor for the development or acceleration of the onset of neuro-degenerative disorders such as Alzheimers disease and encephalopathia in humans. The so-called biologically inert Al has cumulative effects and it has been reported to cause dementia (Lopez et al., 2000). It can also cause brain damage, bone disease and anaemia in patients subjected to haemodialysis using water containing 0.1-1 ppm Al, which is the normal dose of Al (DL = 0.03 mg/l and MPL = 0.20 ppm) in drinking water, where aluminium is used in water treatment plants. Exploring and/or developing lower risk agents with high performance in the water treatment is therefore important, so as to avoid such levels of aluminium (Al) that can have detrimental effects on human health.
REASON FOR SYNTHESIZING PYROAURITE TYPE SORBENT Conventional sorbents face numerous shortcomings, summarised below, which constitute the principal reasons for synthesizing pyroaurite type sorbent:
o Activated carbon is an ideal adsorbent for organics but has high production and regeneration costs
o Flyash has a significant capacity for absorption of organic compounds from aqueous solutions. The carbon content of flyash plays a significant role during the absorption of organic compounds. Flyash has a low sorption capacity and cannot be used directly in column without modification.
o Conventional sorbents cannot remove contaminants rapidly from very dilute solutions (Kŏcí et al., 2004).
o The use of microbes for water treatment is an attractive technique but unsuitable for applications on a large scale.
o Advanced treatment processes such as ion exchange, reverse osmosis, membrane separation, electrodialysis, chemical precipitation are very expensive.
o Pyroaurite-type sorbent is expected to have double layer hydroxides, oxides and other functional intercalating carbonate ion in their inner layers (Seida et al., 2001). Functionalisation can enhance its sorptive properties for specific needs.
MATERIALS AND METHODS Domestic wastewater samples were collected from a drain near St. John’s Crossing of Agra city. The pH and EC of the samples were measured on site and the other parameters were analysed in the lab according to the APHA (1998). Samples were stored at a temperature below 4ºC to avoid any change in the physico-chemical characteristics. The COD of the samples was estimated by dichromate oxidation before and after the sorption of contaminants with sorbents. A pyroaurite-like compound (PLC) was synthesized from MgCl2 and FeCl3 by following the method reported (Seida et al., 2001). PLC was modified to obtain PTS. The modification was made by treating PLC with cetyltrimethyl ammonium bromide and dodecan-1-thiol.
161

Flyash was obtained from the Faridabad thermal power plant, Haryana. The flyash was derived out of the bituminous coal obtained from the Siyal and Gaddi coal mines of Bihar (India). The sample received was washed with distilled water to remove surface dust and was dried in the sun. Flyash samples were stored in the laboratory in an airtight plastic container. The physico-chemical characterisation of flyash was carried out using standard procedures. In addition, physical properties such as density and surface area were also determined. The major components of flyash are: alumina, silica, iron oxide, calcium oxide and residual carbon. However, the constituents of flyash vary according to the type of coal used and degree of combustion. In this case, granular activated carbon was procured from CDH, India. The batch experiments were run in different glass flasks of 250 ml capacity, using a shaker at an average speed of 150 repetitions per minute (rpm). Prior to each experiment, a predetermined amount of adsorbent was added to each flask. The stirring was kept constant for each run throughout the experiment, ensuring equal mixing. The desired pH was maintained using dilute NaOH/HCl solutions. Each flask was filled with a known volume of the sample, with the desired pH, to commence the stirring. The flask containing the sample was withdrawn from the shaker at the predetermined time interval and filtered through Whatmann No. 44 filter paper. The experiments were carried out under different conditions. The effect of initial COD values was investigated by keeping all the conditions constant except for a change in the initial COD concentration, using simulated COD bearing solutions prepared by dissolving a known amount of glucose in distilled water. The residual COD concentration was determined after each run. Each sorbent was agitated with 10 g/l of wastewater of COD value 600 mg/l for different time periods, of between 30 and 220 minutes. After the predetermined time intervals, the samples were withdrawn and filtered and the residual COD concentration was determined. 100 ml of the sample was treated with different doses of sorbents (10-70 g/100 ml) to evaluate the effect of sorbent dose. A control sample with 0 g/100 ml was used to estimate sorption from any other matter than sorbent. The samples were agitated for a specific time, filtered and then analyzed for the residual COD. The pH effect was studied taking a specific concentration, adsorbent dose, and contact time, and varying the pH values from 2 to 8 using dilute NaOH/HCl solutions. The samples were agitated for specific time, filtered and then analysed for the residual COD concentration.
RESULTS AND DISCUSSION
The results observed after the physicochemical analysis of the wastewater as depicted in Table 1 indicate that domestic wastewater is highly polluted with organic load and suspended matter. Organic load is depicted in terms of COD and BOD. The COD value is much higher than the permissible limit. The composition of flyash in Table 2 indicates that the flyash is predominantly silicious followed by the insoluble oxides of aluminium, iron, calcium, magnesium, titanium, alkali oxides and a negligible amount of phosphorus pentoxide and sulphur oxides. In case of flyash as an adsorbent, the metal salts hydrolyse in the presence of natural alkalinity to form metal hydroxides. The multivalent cations present in flyash can reduce the zeta potential while the metal hydroxides are good adsorbents. They form monomolecular layer on the surface of suspended organic matter and remove it by enmeshing them and settling.
162
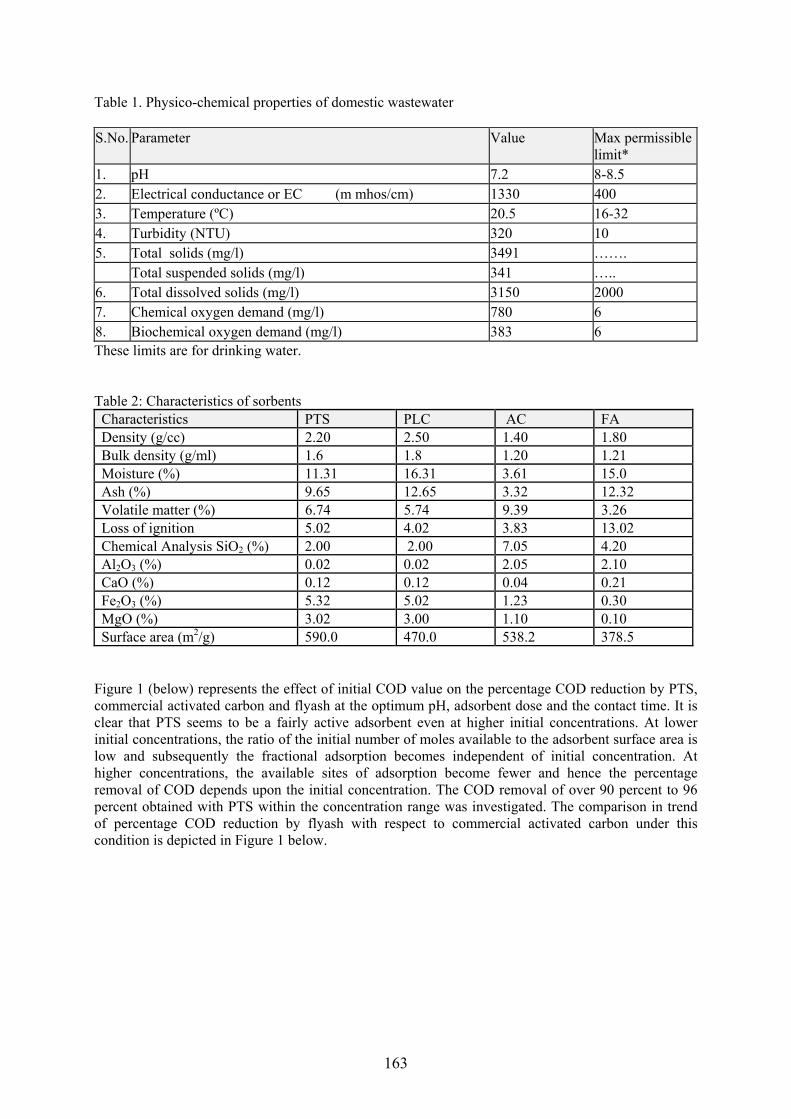
Table 1. Physico-chemical properties of domestic wastewater S.No. Parameter Value Max permissible
limit* 1. pH 7.2 8-8.5 2. Electrical conductance or EC (m mhos/cm) 1330 400 3. Temperature (ºC) 20.5 16-32 4. Turbidity (NTU) 320 10 5. Total solids (mg/l) 3491 ……. Total suspended solids (mg/l) 341 ….. 6. Total dissolved solids (mg/l) 3150 2000 7. Chemical oxygen demand (mg/l) 780 6 8. Biochemical oxygen demand (mg/l) 383 6 These limits are for drinking water. Table 2: Characteristics of sorbents Characteristics PTS PLC AC FA Density (g/cc) 2.20 2.50 1.40 1.80 Bulk density (g/ml) 1.6 1.8 1.20 1.21 Moisture (%) 11.31 16.31 3.61 15.0 Ash (%) 9.65 12.65 3.32 12.32 Volatile matter (%) 6.74 5.74 9.39 3.26 Loss of ignition 5.02 4.02 3.83 13.02 Chemical Analysis SiO2 (%) 2.00 2.00 7.05 4.20 Al2O3 (%) 0.02 0.02 2.05 2.10 CaO (%) 0.12 0.12 0.04 0.21 Fe2O3 (%) 5.32 5.02 1.23 0.30 MgO (%) 3.02 3.00 1.10 0.10 Surface area (m2/g) 590.0 470.0 538.2 378.5
Figure 1 (below) represents the effect of initial COD value on the percentage COD reduction by PTS, commercial activated carbon and flyash at the optimum pH, adsorbent dose and the contact time. It is clear that PTS seems to be a fairly active adsorbent even at higher initial concentrations. At lower initial concentrations, the ratio of the initial number of moles available to the adsorbent surface area is low and subsequently the fractional adsorption becomes independent of initial concentration. At higher concentrations, the available sites of adsorption become fewer and hence the percentage removal of COD depends upon the initial concentration. The COD removal of over 90 percent to 96 percent obtained with PTS within the concentration range was investigated. The comparison in trend of percentage COD reduction by flyash with respect to commercial activated carbon under this condition is depicted in Figure 1 below.
163

Figure 1. COD percentage reduction by sorbents at pH 6, sorbent dose 10 g/l, contact time 1 h, temperature 20.5ºC and rpm 150
0102030405060708090
100
CO
D re
duct
ion
% b
y so
rben
ts
200 400 600 800 1000
Initial COD
PTSACFA
Figure 2. COD percentage reduction at different contact times and at pH 6, sorbent dose 10 g/l, initial COD 600 mg/l, temperature 20.5ºC and rpm 150
0102030405060708090
100
CO
D re
duct
ion
% b
y so
rben
ts
20 60 100 140 180 220
Contact time, min
PTSACFA
Figure 2 represents the percent removal of COD at different contact times by PTS, flyash and commercial activated carbon. It seems that COD removal has been achieved to the extent of more than 98.7, 98.1 and 67.8 % by PTS, AC and FA respectively at a maximum time period of 220 minutes and the trend of percent COD reduction with PTS was comparable to that of commercial activated carbon. Figure 3. COD percentage reduction using different sorbet doses at pH 6, initial COD 600 mg/l, contact time 1 hr, temperature 20.5ºC and rpm 150
0102030405060708090
100
CO
D re
duct
ion
% b
y so
rben
ts
10 30 50 70
Sorbent dose, g/l
PTSACFA
164
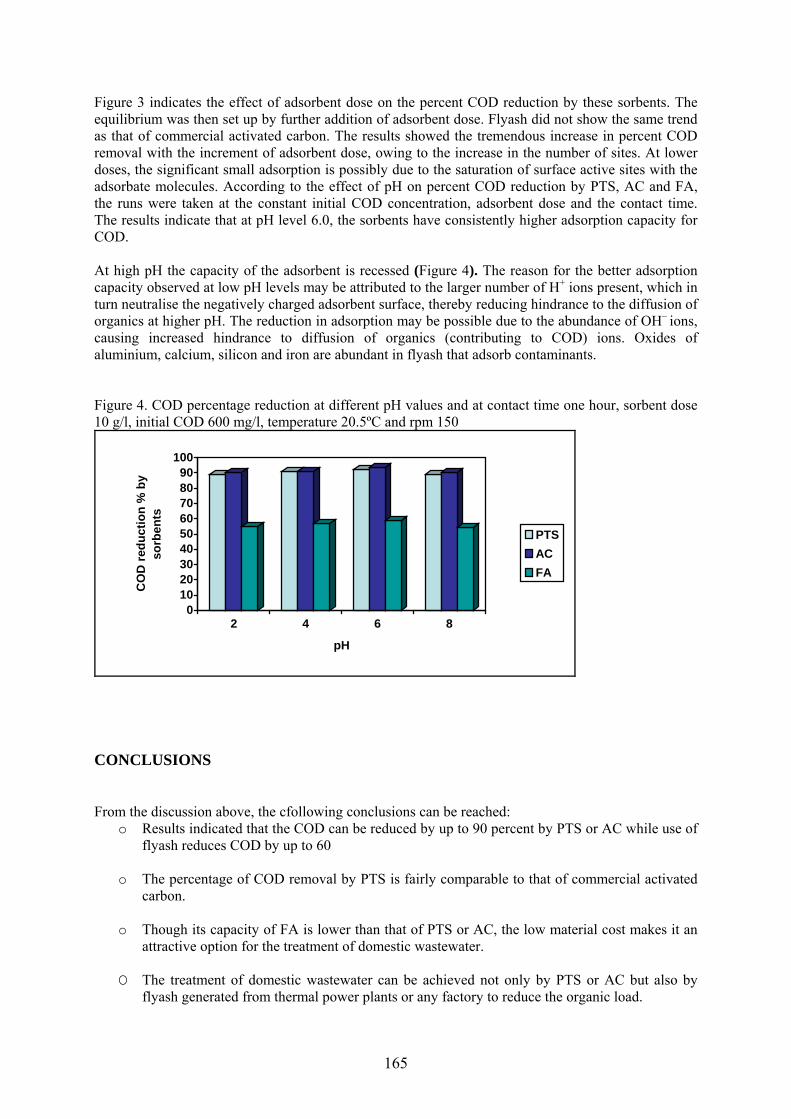
Figure 3 indicates the effect of adsorbent dose on the percent COD reduction by these sorbents. The equilibrium was then set up by further addition of adsorbent dose. Flyash did not show the same trend as that of commercial activated carbon. The results showed the tremendous increase in percent COD removal with the increment of adsorbent dose, owing to the increase in the number of sites. At lower doses, the significant small adsorption is possibly due to the saturation of surface active sites with the adsorbate molecules. According to the effect of pH on percent COD reduction by PTS, AC and FA, the runs were taken at the constant initial COD concentration, adsorbent dose and the contact time. The results indicate that at pH level 6.0, the sorbents have consistently higher adsorption capacity for COD. At high pH the capacity of the adsorbent is recessed (Figure 4). The reason for the better adsorption capacity observed at low pH levels may be attributed to the larger number of H+ ions present, which in turn neutralise the negatively charged adsorbent surface, thereby reducing hindrance to the diffusion of organics at higher pH. The reduction in adsorption may be possible due to the abundance of OH– ions, causing increased hindrance to diffusion of organics (contributing to COD) ions. Oxides of aluminium, calcium, silicon and iron are abundant in flyash that adsorb contaminants. Figure 4. COD percentage reduction at different pH values and at contact time one hour, sorbent dose 10 g/l, initial COD 600 mg/l, temperature 20.5ºC and rpm 150
0102030405060708090
100
CO
D re
duct
ion
% b
y so
rben
ts
2 4 6 8
pH
PTSACFA
CONCLUSIONS
From the discussion above, the cfollowing conclusions can be reached:
o Results indicated that the COD can be reduced by up to 90 percent by PTS or AC while use of flyash reduces COD by up to 60
o The percentage of COD removal by PTS is fairly comparable to that of commercial activated
carbon.
o Though its capacity of FA is lower than that of PTS or AC, the low material cost makes it an attractive option for the treatment of domestic wastewater.
O The treatment of domestic wastewater can be achieved not only by PTS or AC but also by
flyash generated from thermal power plants or any factory to reduce the organic load.
165

ACKNOWLEDGEMENT The authors are grateful to the Council of Scientific and Industrial Research of India for funding this study through the project No. 01(1828)/02/EMRII. They also thank Dr O.P. Garg, Mr S.P. Garg and their trust Smt. Basanti Devi and C.L. Garg Educational Trust for getting their laboratory renovated.
REFERENCES Clesceri, L.S., Greenberg, A.E. and Eaton, A.D. (eds). 1998. ‘Standard Methods for the Examination of Water and Wastewater’, 20th edition. Washington DC: APHA, AWWA, WEF, Banerjee, K., Cheremisinoff, P.N. and Cheng, S.L. 1995. ‘Sorption of organic contaminants by flyash in a single solute system’, Environmental Science Technology. 29: 2243-2251 Gupta, G.S., Prasad, G. and Singh, V.N. 1990. ‘Removal of chrome dye from aqueous solutions by mixed adsorbents: flyash and coal’, Water Research. 30: 24-45 Johnson, G.E., Hunka, L.M. and Field, J.H. 1965. ‘Use of coal and flyash as adsorbents for removing organic contaminants from secondary effluents’, Ind. Eng. Chem. Proc. Design Develop. 4: 323-327 Kŏcí V., Ocelka T., Mlejnek M. and Grabic R. (2004) Efficiency assessment of wastewater treatment plant based on SPMD sampling. Central European Journal of Chemistry 2, 91-112 Lopez F.F., Cabrera C., Lorenzo M.L. and Lopez N.C. 2000. ‘Aluminium levels in species and aromatic herbs’, Science Total Environment. 257 : 191-196 Manka, J., Rebhun, M., Mandelbaum, A. and Bortinger, A. 1974. ‚Characterization of organics in secondary effluents’, Environmental Science Technology. 8: 1017-1020 Pandey, K.K., Prasad, G. and Singh, V.N. 1985. ‘Copper Removal from aqueous solution by flyash’, Water Research 9: 869-873 Seida, Y., Nakano, Y. and Nakamura, Y. 2001. ‘Rapid removal of dilute lead from water by pyroaurite like compound’, Water Research 35(10): 2341-2346 Viraragharan, T. and Dronamraju, M.M. 1992. ‘Utilization of coal ash, water pollution control’, Journal of Environmental Studies. 40: 79-85
166

REMOVAL OF HEAVY METALS FROM ELECTROPLATING EFFLUENTS BY CARBONIZED AGROWASTES
R.P Singh, N. Gupta, R. Suman and Radha Gupta School of Chemical Sciences, Chemistry Department, St. John’s College, Agra
E-mail: [email protected]
ABSTRACT This paper discusses a study aimed to evaluate the feasibility of using powdered pseudoactivated carbon prepared from agrowastes for the removal of heavy metals from electroplating effluents. During the study, batch tests were conducted using an electroplating industry effluent that contained 18.0, 18.9, 8.6 and 15.6 ppm of Cr(VI), Ni(II), Cu(II) and Zn(II) respectively. The ability of coconut coir carbon (CCC), sagaun sawdust carbon (SSC), wheat stem carbon (WSC) and rice husk carbon (RHC) to remove heavy metals from the effluent was studied. The removal was in the order of Ni > Zn > Cu > Cr over a wide range of initial concentrations: 1-20 mg/l at sorbent dose 1 g/l, pH 4.8, temperature 25°C, rpm 250 for five hours (5 h). The sorption increased with increasing contact time but the equilibrium was attained in two hours for Cr, 3.0 h for Cu, 3.5 h Zn and 4 h for Ni. The order of metal removal capacities for these chemical sorbents was: RHC > CCC > WSC > SSC. Electroplating effluent showed four to ten percent lower removal as compared to synthetic standard solution under similar conditions.
INTRODUCTION In India, there are over 50,000 large, medium and small electroplating units mostly scattered in urban areas. Most large units are captive to some other large industrial units (Chauhan and Chauhan, 2002). Medium units cater to selected business groups as feeder units. Small units mostly carry out job plating where, unlike captive and feeder units, most of the operations are performed manually by family-owned business in residential areas and there is no space for effluent treatment. The variety of processes and methods of operation in the metal finishing industry gives rise to a wide range of effluent compositions (Pigage et al., 2002). The processing baths contain a high concentration of potentially polluting materials. In general, the wastewater can be expected to contain cyanides of potassium or sodium, complex cyanides, copper, nickel and zinc in acid solution, hexavalent chromium, oil wastes and solvents. Due to the proprietary nature of many products used in the metal finishing, the precise composition is quite often not known. Dissolved chemicals and metals, which are not toxic to aquatic life at very low concentration levels, are, however, the major concern. The permitted levels of metal contaminants in the electroplating wastewater to be discharged, as applicable in various parts of the world as well as in India, are very low, but the electroplating effluents have their very high levels. A typical wastewater from an electroplating industry is likely to have in ppm 100-500 suspended solids, 20-100 Cr(VI), 30-150 total Cr, 15-90 CN—, 5-25 Cu, 15-70 Ni and 10-200 Zn whereas the permitted levels of these contaminants in the electroplating wastewater to be discharged are 100, 0.1, 2.0, 0.2, 2.0, 2.0 and 5.0 ppm respectively. The pH is in the range of 4 to10, and should be changed to between 6.5 and 7.5 before water is released into the environment. Though activated carbon is an ideal adsorbent for organic matter due to its organophilic character, it is not economical for wastewater and soil treatment owing to its high production and regeneration costs, and about 10 to 15 percent loss during regeneration by chemical or thermal treatment. The high cost of activated carbon and synthetic resins has prompted the search for substitutes that are abundant, cheap, renewable and ecofriendly (Dakiky et al, 2002; Buerge-Weirich et al, 2002). Subsequently, the use of agricultural residues such as sawdust or industrial by-products like bagasse have received considerable attention (Achari and Anirudhan, 1995; Gaghate et al., 1990; Siddique et al., 1999; Haribabu, 1992;
167

Rai and Surendra, 1999; Rangaraj et al., 1999; Selvakumari et al. 2001; Singh et al., 2000). Most of these materials contain functional groups associated with proteins and polysaccharides like lignin, cellulose and hemi cellulose. The pollutant uptake is believed to occur through coulombic attraction and ion exchange processes involving these groups. Though these materials generally do not have high sorption capacity as compared to activated carbon, they are plentiful, inexpensive and renewable. This offers an attractive approach to the removal of metal cations in solution. The sorption capacity of these materials could be enhanced by various physicochemical modifications to improve their physical and structural properties, making them more suitable for full-scale filter applications. The goal of this research is to evaluate the ability of coconut coir carbon (CCC), sagaun sawdust carbon (SSC), wheat stem carbon (WHC) and rice husk carbon (RHC) as effective, low cost, biomass sorption media to remove heavy metals from the electroplating effluent.
MATERIAL AND METHODS The sagaun sawdust used in this study was collected from the saw machine at Panchkuian, Agra. Coconut coir, rice husk and wheat stem were obtained from the local market. All the four agrowastes were dried in the sun, crushed, washed thrice with distilled water and rinsed with 1 percent HCl to remove water soluble impurities, particularly metal ions and surface adhered particles. Then they were kept in 0.1 N NaOH solution overnight to remove lignin and in 0.1 CH3COOH to remove alkalinity developed due to NaOH. Thereafter, they were washed well with distilled water till the wash water became colourless, and dried at 110ºC in an oven for two hours to get rid of moisture and other volatile impurities. Their carbons were prepared by keeping four parts of the above agrowastes with three parts by weight of concentrated H2SO4 in an air oven maintained at 150oC for 24 h. The carbonized agrowastes were washed with distilled water to remove free acid (SO4
2– ions). Then they were soaked in 1% w/v sodium carbonate solution overnight to remove any residual acid. Again they were washed with distilled water and dried at 110oC for two hours. The carbons so obtained were ground in a mortar with a pestle and sieved through a standard sieve to get the particle size less than 300 microns throughout the study. All chemicals used were of analytical grade unless otherwise specified. Distilled deionized water (DDW) was used throughout the experiment. Five standard solutions of 1, 5, 10, 15 and 20 mg/l concentrations of Cr, Ni, Cu and Zn for instrument calibration and sorption study were prepared by diluting their stock solution of 1 g/l, i.e., 1 ml �1 mg metal. To prepare the Cr (VI) stock, 2.828 g anhydrous K2Cr2O7 was dissolved in about 200 ml DDW, 1.5 ml conc. HNO3 and diluted to 1 litre with DDW. The stock solution of Ni, Cu and Zn were prepared by dissolving 1.000 g of 99.5 percent AR 325 mesh metal powder from CDH, New Delhi in a minimum volume of 1:1 acid (HNO3 for Ni and Cu, and HCl for Zn) and diluting to one litre with one percent (v/v) acid. The capacity studies were carried out by transient batch tests. In 25 numbers (5 concentrations of 4 metals each + 5 controls one for each) of 100-ml capacity PVC bottles with screw caps, 0.05 g of sorbent was added to each bottle of 5 sets, each set having 6 bottles 5 for different concentrations of a metal and 1 for its control. 50 ml of the metal solution or effluent was added to each bottle. The solution was buffered with 0.07M sodium acetate - 0.03 M acetic acid to pH 4.8. Each bottle was shaken in a reciprocating shaker at 180 rpm for five hours at room temperature, and the metal concentration was measured per hour until the solution reached equilibrium. The control samples without sorbent were to demonstrate metal uptake due to the sorbent, not from other sources such as the walls of the container, centrifuge tube etc. The contents were centrifuged at 2000 rpm for 10 min and the supernatant liquid was filtered using a 0.45-µm membrane filter. The filtrate was analysed for metal ions. The initial and final concentrations of the metal solutions were determined using a Perkin-Elmer A-Analyst 100 AAS by Standard Methods (APHA et al., 1998). Experiments were triplicated and results averaged.
168

RESULTS AND DISCUSSION The characteristics of the final solutions are listed in Table 1 below. Such carbons are expected to be more than four times more effective than raw agrowastes (Manju and Anirudhan, 1997; Perisamy and Namasivayam, 1995). Table 1. Characteristics of Adsorbents Parameters RHC CCC WSC SSC Composition (in %) Moisture 3.82 4.96 5.67 4.22 Ash 4.56 7.85 5.68 8.36 Carbon 79.89 80.32 78.9 81.73 Silica 2.76 4.36 3.02 4.64 Sodium 0.13 0.11 0.17 0.09 Potassium 0.29 0.31 0.27 0.23 Calcium 0.35 0.39 0.41 0.32 Magnesium 0.03 0.02 0.07 0.01 Phosphorous 0.05 0.04 0.06 0.03 Iron 0.27 0.19 0.32 0.12 Miscellaneous 7.85 1.45 5.34 0.25 Properties pH 8.32 7.64 7.34 7.83 Conductivity (µS/m) 0.92 0.80 0.75 0.62 Specific gravity (g/L) 1.20 1.34 1.10 1.12 Porosity (ml/g) 1.01 0.92 0.83 0.72 Surface area (m2/g) 456 397 328 298 Cation exchange capacity(meq/g) 0.70 0.90 0.53 Nil
The physicochemical properties of carbonized agrowastes vary widely from plant to plant and method to method of carbonization. They depend on the variety of a plant and area in which it is cultivated, temperature of carbonization, operational features and efficiency of the heating equipment like oven or furnace, The peaks of their X-ray diffractogram can be used to identify major components, such as crystalline quartz, amorphous silica, calcium orthosilicate, cristobalite, sillimanite, crystalline carbonate etc. (Swamy et al. 1998). Their scanning electron micrographs can depict their morphology, particularly linear or curved type fibers with holes in the fibers and other places in the skeletal structure. The number and size of pores of a carbon can also be determined. More numerous and larger-sized pores but smaller particle size make a better sorbent. The bands of their FTIR spectra can indicate the presence of carboxy, hydroxyl and sulphonic groups responsible for cation exchange.
169

Table 2. Effect of Cr, Ni, Cu and Zn concentration on their % removal at agitation time 4 h, rpm 240 and sorbent dose 1 g/l, pH 4.8 and temperature 25oC
Metal Concentration (mg/l)*
RHC CCC WSC SSC
Cr(VI) 1 5 10 15 20
92.1 89.5 84.2 75.7 68.1
90.9 88.2 82.4 71.1 62.3
88.3 84.5 76.8 65.9 56.1
85.1 80.0 70.9 58.4 48.5
Ni(II) 1 5 10 15 20
97.6 97.0 95.5 91.3 84.2
95.9 94.7 91.9 86.0 76.6
94.3 92.7 88.4 79.6 70.9
92.8 90.4 84.5 71.2 62.9
Cu(II) 1 5 10 15 20
94.2 92.7 89.2 81.2 72.5
93.6 91.7 86.9 78.9 68.6
91.9 89.0 83.9 73.4 63.4
88.0 83.6 76.1 62.3 54.1
Zn(II) 1 5 10 15 20
95.4 94.2 91.5 85.2 78.5
94.7 93.2 89.4 80.9 72.1
92.3 90.6 84.5 75.2 64.2
90.8 87.0 80.2 68.1 56.5
Cr(VI) 18.0 67.4 61.0 55.7 47.2 Ni(II) 18.9 83.0 75.2 68.5 60.3 Cu(II) 8.6 89.0 86.5 83.4 75.5 Zn(II) 15.6 81.0 75.4 68.3 60.7 *The second set of data is for metal ions present in electroplating effluents. Figure 1. Effect of contact time on the % removal of Cr at 5 mg/l concentration, sorbent dose 1 g/l, pH 4.8 and temperature 25oC
4045505560657075808590
0.5 1 1.5 2 2.5 3 3.5 4
Time (in hrs.)
Ads
orpt
ion
(%)
RHCCCCWSCSSC
The effect of contact time on sorption was also investigated (Figure 1) The uptake of metal ions at 1, 5, 10, 15 and 20 mg/l concentrations by different sorbents was thus calculated and results are listed in Table 2.
170

The data were analysed using the Freundlich and the Langmuir equations:
ln a = ln k + 1/n ln c Freundlich equation c/a = 1/Qb + c/Q Langmuir equation
where a (mg/g) is the metal sorbed per unit mass of sorbent (a = x/m where x mg of metal is sorbed on m grams of sorbent), c (mg/l) is equilibrium concentration in aqueous phase, k (mg/g) and n are Freundlich constants related to adsorption capacity and adsorption intensity respectively, Q (mg/g) and b (l/g) are Langmuir constants related to adsorption capacity of sorbent and adsorption maximum (energy of adsorption) respectively. The Langmuir constants were calculated at five initial concentrations under optimal conditions (Table 3). Table 3. Comparison of Langmuir and Freundlich constants and correlation coefficients (R2 values) for the sorption of heavy metals by RHC, CCC, WSC and SSC
Langmuir constants and R2 Freundlich constants and R2System Q, mg/g b, 1/g R2 k, mg/g 1/n R2
Cr/RHC Cr/CCC Cr/WSC Cr/SSC
15.5637 14.3753 13.1134 11.4383
0.7730 0.7581 0.6130 0.5978
0.9975 0.9986 0.9998 0.9999
7.422 6.985 6.199 5.102
0.5057 0.4686 0.4605 0.4311
0.9665 0.9529 0.9759 0.9531
Ni/RHC Ni/CCC Ni/WSC Ni/SSC
18.7713 17.1763 15.8784 14.0016
2.3191 1.4426 1.1181 0.9786
0.9993 0.9998 0.9984 0.9965
16.956 11.884 9.430 7.413
0.4823 0.4753 0.4782 0.4551
0.9501 0.9484 0.9503 0.5266
Cu/RHC Cu/CCC Cu/WSC Cu/SSC
17.1083 15.6278 14.2539 12.2523
1.0063 0.9955 0.8527 0.6460
0.9991 0.9998 0.9995 0.9977
9.697 8.936 7.511 5.539
0.4839 0.4718 0.4501 0.4505
0.9512 0.9523 0.9530 0.9534
Zn/RHC Zn/CCC Zn/WSC Zn/SSC
18.3009 16.3204 14.9322 12.5572
1.1852 1.1634 0.8557 0.8492
0.9979 0.9987 0.9998 0.9139
11.151 9.922 8.269 6.878
0.5088 0.4744 0.8023 0.4147
0.9584 0.9488 0.9445 0.9468
Sorption capacity is found to decrease with increase in metal concentration. The higher uptake at lower initial concentration can be attributed to the availability of more isolated metal ions. Sorption rate is very rapid during initial the contact period due to the availability of more sites for sorption. More than 60 per cent of sorption is reached within 1 hour. However, equilibrium was attained after two hours for Cr, three hours for Zn, 3.5 hours for Cu and four hours for Ni. RHC could remove a greater amount of these metals than any other carbon studied. It was found to remove 92.1 percent Cr (VI), 97.6 percent Ni, 94.2 percent Cu and 95.4 percent Zn at concentration 1 mg/l, sorbent dose 1 g/l, rpm 240, agitation time 4 h, pH 4.8 and temperature 25°C. The order of metal removal capacities for these chemical adsorbents was RHC > CCC > WSC > SSC. The order of removal/sorption of metals was Ni > Zn > Cu > Cr. The effect of various parameters affecting the adsorption such as initial metal concentration, adsorbent dose, contact time and pH was determined. Adsorption decreases with rise in metal concentration but increases with increase in adsorbent dose. The rate of adsorption is high in the beginning as sites are available and unimolecular layer increases. Adsorption and desorption occur together and rates become equal at a stage called adsorption equilibrium when isotherms are applied. That is why there is little increase in the percentage removal when the contact time is increased from four to five hours. The subsequent slow rise in the curve may be due to adsorption and intra-particle diffusion that occurs simultaneously with dominance of adsorption.
171
The pseudoactivated carbons may consist of oxides of silicon, calcium, magnesium and iron, for example. They may have anion adsorption sites similar to minerals like alumina and clay. Such sites are aquo groups (—M—OH2
—) and hydroxo groups (—M—OH). The surface chemistry of an oxide in contact with an aqueous solution is determined to a large extent by deprotonation or a hydroxyl ion association reaction. However, some evidence suggests that an anion like Cr2O7
— can be adsorbed by an ion exchange mechanism even though the surface is neutral. Had Cr(VI) not been in dichromate form, it would have been adsorbed to the maximum extent based on its ionic size and potential. The optimum pH for metal removal was found in the acidic medium (Singh et al. 2001). This may be attributed to the large number of H+ ions in the acidic medium that neutralize the negatively charged adsorbent surface, thereby reducing hindrance to diffusion of dichromate ions. At higher pH, the abundance of OH– ions create increased the difficulties in the diffusion of dichromate ions.
CONCLUSIONS The following conclusions can be drawn from the above results:
o CCC, SSC, WSC and RHC remove heavy metals from the effluent in the order of Ni > Zn > Cu > Cr over a wide range of initial concentration 1-20 mg/l at sorbent dose 1 g/l, pH 4.8, temperature 25°C and rpm 250 for five hours.
o The sorption increased with decreasing metal concentration and increasing contact time, but the equilibrium was attained in 2 h for Cr, 3.0 h for Cu, 3.5 h Zn and 4 h for Ni.
o The order of metal removal capacities for these chemical sorbents was: RHC > CCC > WHC > SSC.
o Electroplating effluent showed four to ten percent lower removal as compared to synthetic standard solution under similar conditions.
o The sorption followed Freundlich as well as Langmuir isotherms. o The present paper shows the possibility of using agrowastes particularly rice husk abundantly
available in our country to produce cheaper activated carbons. The data thus generated may be used for designing treatment plants for industrial effluents having low levels of heavy metals and hold a promise for commercial exploitation.
ACKNOWLEDGEMENT The authors thank Dr O.P. Garg (an NRI scientist/businessman from Hamberg), his brother Mr S.P. Garg (an eminent architect from Delhi) and the Smt.Basanti Devi and C.L. Garg Educational Trust for renovating our laboratory and providing research facilities as well as encouragement.
REFERENCES Achari S.V. and Anirudhan J.S. 1995. ‘Phenol removal from aqueous system by sorptions of jackwood sawdust’, Indian Journal of Chem. Technology. 2: 137-141 APHA, AWWA and WEF. 1998. ‘Standard Methods for the Examination of Water and Wastewater’. 20th edition, Clesceri, L.S., Greenberg, A.E. and Eaton, A.D. (Editors), APHA, AWWA, WEF, Washington DC Buerge-Weirich D., Hari R., Xue H., Behra P. and Sigg L. 2002. ‘Adsorption of Cu, Cd and Ni on goethite in the presence of natural groundwater ligands’, Environ. Sci. Technol., 30, 320-330
172

Chauhan S. and Chauhan S.V.S. (2002) ‘Chemical characteristics of effluents of two important industries at Agra’, Nature Environment and Pollution Technology, 1(4), 431-433 Dakiky M., Khamis M., Manassa A., Merdo M. (2002) ‘Selective adsorption of chromium(VI) in industrial wastewater using low cost abundantly available adsorbents’, Advances in Environmental Research, 6, 533-540 Gajghate D.G., Saxena, E. R., and Rao, M. (1990) ‘Kinetics of adsorption of lead by activated carbon from aqueous solution’, Ind.. Journal of Environmental. Health., 32, 369-376 Haribabu E., Upadhyay S.N. and Upadhyay Y.D. 1992. ‘Removal of chromium(VI) by flyash', Chem. Environ. Pes. 1(3), 289-294 Manju G.N. and Anirudhan T.S. 1997. Use of coconut fibre pith-based pseudo-activated carbon for chromium (VI) removal. Ind. Journal of Environmental. Health. 39(4), 289-298 Perisamy K. and Namasivayam C. 1995. ‘Removal of Ni(II) from aqueous solution and nickel industry wastewater agricultural wastes: peanut hulls’, Waste Management. 15(1), 66-68 Pigage A., Juskenas R. and Selskis A. 2002. ‘Waste treatment of two electroplating solution of Cu and Zn by mixing and precipitation’, Separation Science and Technology. 37(13), 3155-3168 Rai and Surendra Kumar A.K. 1999. ‘Treatment of chromium bearing wastewater by adsorption on brick kiln ash and flyash’, Ind. Journal of Environmental Health. 41(1): 65-73 Rangaraj S., Arabindoo B. and Murugesan V. 1999. ‘Sorption characteristics of parachlorophenol on activated palm seed coat carbon’, Ind. Journal Environmental Health., 41(1): 16-23 Selvakumari G., Murugusan M., Pattabi, S. and Satish Kumar, M. 2001. ‘Sorption of metals from electroplating industry effluent by maize cob carbon’. Proceedings, X National Symposium on Environment, BARC, Mumbai, 133-135 Siddique B.A., Sharma P.P. and Mohamad S. 1999. ‘Adsorption studies on phosphate treated sawdust: Separation of Cr(VI) from Zn(II), Ni(II), Cu(II) and their removal and recovery from electroplating waste’, Ind. Journal of Environmental. Protection. 19(11), 846-852 Singh R.P., Singh Y. and Swaroop D. 2000. ‘Defluoridation of groundwater in Agra city using low cost adsorbent’. Bull. Environ. Contam. Toxicol., 65, 120-125 Singh R.P., Singh Y., Swaroop D., Gupta N. and Singh S. 2001. ‘Comparison of activated carbon, fly ash, rice husk and saw dust for the removal of Cr, Zn, Cd and Pb from wastewater’. Proceedings RAWM-2001, IAEM, 285-289 Srinivasan K., Balasubramanian N. and Ramakrishnan T.V. 1988. ‘Studies on chromium removal by rice husk carbon’, Ind. Ournal of. Environmental Health. 30: 376 Swamy M.M., Mall I.D., Prasad B. and Mishra I.M. 1998. ‘Sorption characteristics of o-cresol on baggase flyash and activated carbon’, Ind. Journal of Environmental Hlth., 40(1): 67-78
173