Embed Size (px)
Citation preview

Onondaga County Health Department
Division of Environmental Health
421 Montgomery Street
Syracuse, New York 13202
Waste-to-Energy Facility Monitoring
Program
2014 Summary Report
March 1, 2015
Submitted By: Indu Gupta, MD, MPH Commissioner of Health

Summary Statement: In the monitoring conducted to date, no relationship has been established between the operation of the Waste-to-Energy Facility and any significant increased levels of constituents in the environment.
Introduction
The Onondaga County Health Department initiated a Waste-to-Energy Facility monitoring program in 1994, the year prior to the facility being placed into operation. In 2003, the monitoring program for air, soil and ash was reevaluated, and a more effective and efficient program was developed and implemented starting in 2004. As an alternative to offsite air monitoring, direct interaction was established with the Onondaga County Resource Recovery Agency (OCCRA) and the New York State Department of Environmental Conservation (DEC) in providing stack monitoring results and improved assurance on reporting of adverse events and equipment failures. This allows for evaluation of short-term changes in the Waste-to-Energy Facility emissions, an effective alternative to the previous limited scope offsite air monitoring conducted over a nine year period. Long-term deposition impacts continue to be evaluated by soil and ash monitoring. All soil samples are analyzed for metals twice a year. Several changes related to organics testing have been implemented based on the low levels detected in the monitoring conducted to date, and the fact that there is no evidence of a trend or levels associated with health risks. Starting in 2009, half of the soil sampling sites were analyzed for organics each year; therefore each site is sampled biennially. The monitoring program has the flexibility of testing a site again in the following year should an elevated level of any organic constituent be detected. The four soil ash route sites have been eliminated from the program. To date these sites have not shown any elevation of metals or organics indicating that ash transport in covered vehicles is not a significant environmental or health concern. Ash, directly from the Waste-to-Energy Facility continues to be analyzed for metals twice a year and organics once a year. Under present contracts, organic analysis is performed by Axys Analytical Services, LTD, and metal analysis is performed by Life Science Laboratories, Inc. The collection of soil is performed by Onondaga County Health Department, Division of Environmental Health staff, while collection of the ash is the responsibility of Covanta Energy System under New York State Department of Environmental Conservation protocols. During 2014, the WTE facility processed 314,826 tons of waste. Air Monitoring
During 2014, the department interacted directly with OCCRA and DEC in review of the stack monitoring results and reporting of adverse events and equipment failures by the facility operator, Covanta Energy. The department also reviewed both the monitoring conducted at the stack on a continuous basis and reported quarterly to DEC, as well as the annual stack test that is performed by an independent contractor. At no time did the monitoring indicate constituents above levels of health concern. The annual stack test

incorporates an extensive list of analytes that include metals and organics. All of the analytes were well below permit limits. Soil and Ash Testing for Organics
Soil from six routine sites and one control site, collected in the spring of 2014, was analyzed for dioxins/furans (PCDD/PCDF), polychlorinated biphenyls (PCB’s), and polycyclic aromatic hydrocarbons (PAH’s). Ash, also collected in the spring of 2014, was analyzed for the same constituents. Organic sample results are compared to published background data and U.S. Department of Health and Human Services, Agency for Toxic Substances and Disease Registry (ATSDR) Toxicological Profiles, EPA Preliminary Remediation Goals, and NYSDEC Soil Cleanup Objectives. In general, little change in levels of these compounds has been observed from background through the present organic screening period. The levels of organics in the ash were similar to reports for ash identified by other investigators and reported in published literature. Each form of dioxin/furan has associated with it a toxic equivalency factor that is used to calculate a total toxic equivalency (TEQ) for each sample. Attachment A shows the historical dioxin/furan TEQ values for soil sites and ash samples. All levels remain well below the ATSDR and EPA action levels and there is no indication of a trend. For ash, dioxin/furan total TEQ remain fairly consistent. Ash is not homogeneous and an inconsistent result occurs occasionally. The results are similar to those reported by other investigators. Attachment B shows the historical PCB values for soil sites and ash samples. All levels remain below the ATSDR and EPA action levels and there is no indication of a trend. Soil and Ash Testing for Metals
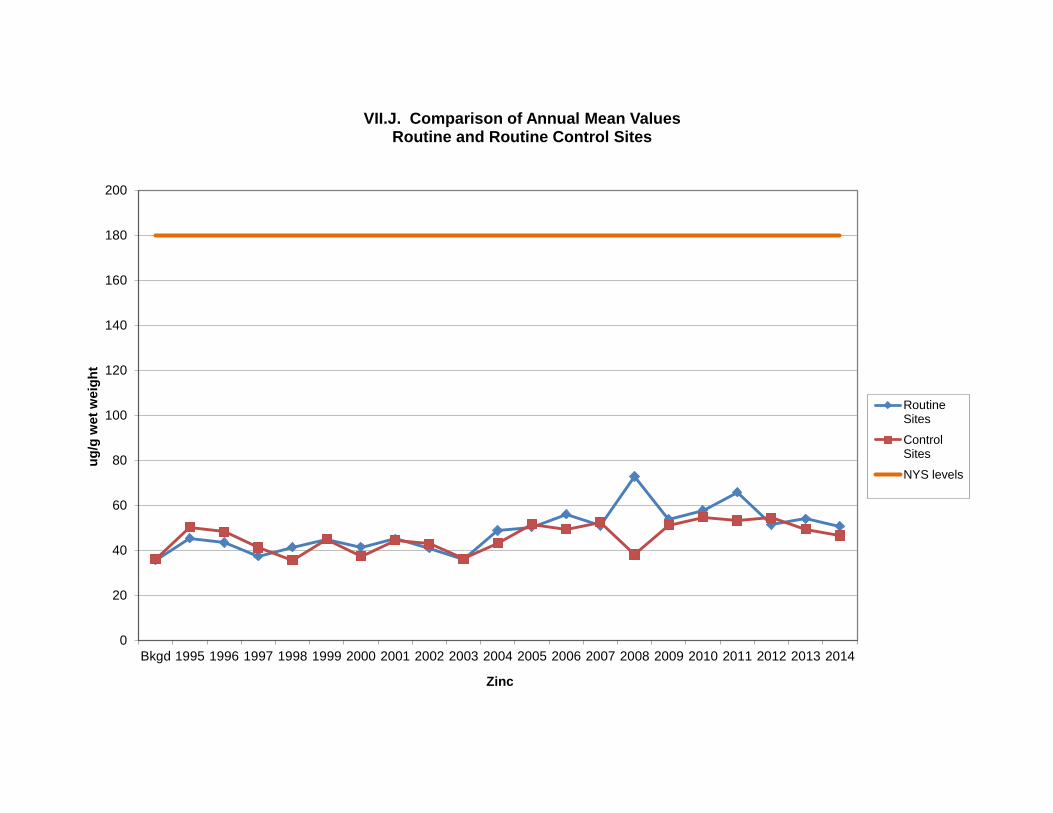
Soil from the fourteen soil sites and ash were analyzed for ten different metals twice during the year (Spring and Fall). The metal results are issued in two different reports, one for soils and one for ash. In 2011, due to improvements in the contract laboratory’s equipment, the detection limits for beryllium, cadmium, and selenium have been lowered. Therefore there are detectable levels of these metals in many of the samples as compared to previous years. Metal results are compared to background levels, published national averages for urban areas and a statewide rural soil survey. Soil and ash are not homogeneous and can contain materials that can account for an occasional inconsistent result. Hence, a single elevated or depressed value will not be assumed to be indicative of a change at a specific site. Rather, the pattern of values for that specific element must demonstrate a statistically significant difference, which may be indicative of a real environmental change. In general, the metal results for 2014 fall within the expected range of values for urban areas and demonstrate no significant variation from background levels. Cadmium does appear to be trending up since 2011; however, the trend is the same for both routine and control sites therefore eliminating any tie to the Waste-to-Energy Facility.

Attachment C shows the historical levels for the ten metals at the routine and control soil sites. Due to the volume of data, the mean (average) of all routine sites and all control sites for each year is presented. The complete report includes all of the data for each site. Attachment C-1 provides data on New York State Department of Environmental Conservation Soil Cleanup Objectives, a New York State rural soil survey, and USEPA soil screening levels for metals in residential soil. Attachment D shows the historical levels of the ten metals in ash.
Summary and Conclusions
In general, the organic and metal results for this monitoring period are within the
expected range for urban environments and are below any levels associated with health risk. Any fluctuations in sample results appear to be a reflection of the low levels detected, expected variation as a result of sample collection, preparation, and laboratory procedures, or possible variable levels due to past activities at a site. All levels remain below those associated with health concerns. The results should be viewed in the context of an ongoing program of environmental monitoring performed by the Onondaga County Health Department as a part of its overall Waste-to-Energy Facility Monitoring Program. In the monitoring conducted to date, no relationship has been established between the operation of the Waste-to-Energy Facility and any significant increased levels of constituents in the environment. The following are the detailed Waste-to-Energy Facility Monitoring Program reports that have been issued on the 2014 soil and ash testing: 2014 Screening Summary for Organic Constituents 2014 Soil Metals Analysis Summary 2014 Ash Characterization Summary Copies of these reports are available upon request.

The following abbreviations may be used in this report:
As Arsenic. ATSDR Agency for Toxic Substances and Disease Registry Be Beryllium. Cd Cadmium. CES Certified Environmental Services. Cr Chromium. CV Coefficient of Variation. ELS Environmental Laboratory Services. Hg Mercury. LD Limit of Detection. ND None Detected. ug/g micrograms per gram. Ni Nickel. OCCF Onondaga County Correctional Facility. OCHD Onondaga County Health Department. PAH Polyaromatic Hydrocarbon PCB Polychlorinated Biphenyls PCDD/PCDF Polychlorinated Dibenzo-p-Dioxins/Dibenzofurans Pb Lead. pg/g picograms per gram PPM parts per million. SD Standard Deviation. Se Selenium. SHFD Sentinel Heights Fire Department V Vanadium. WTE Waste to Energy Facility. Zn Zinc. ~ approximately. < Less than. > Greater than. NA Not applicable. NS Not sampled.

O n e i d a L a k e
O n o n d a g a L a k e
Oti s
c
oL
ak
e
S k a n e a t e l e s L a k e
Cro
ss
La
ke
§̈¦90
§̈¦90
§̈¦81
§̈¦81
§̈¦690
§̈¦690
§̈¦481
§̈¦481
_̂A
ONONDAGA
NATION
TERRITORY
Baldwinsvi l le
Solvay
Manlius
Minoa
Jordan
Fayet tevi l le
Skaneateles
Tully
Elbr idge
NorthSyracuse
EastSyracuse
Liverpool
Marcel lus
Fabius
Cami l lus
C L A Y
P O M P E Y
C I C E R O
F A B I U S
L Y S A N D E R
M A N L I U S
O N O N D A G A
D E W I T T
T U L L Y
O T I S C O
L A F A Y E T T E
E L B R I D G E
S P A F F O R D
C A M I L L U S
S K A N E A T E L E S
V A N B U R E N
M A R C E L L U S
S Y R A C U S E
S A L I N A
G E D D E S
9
87
6
5
4
3
1
2
14
13
12
11
10
Onondaga County Health Department Soil Monitoring Sites
0 2 4 6
Miles
I
A. Incinerator
1. Beaver Lake Nature Center
2. Dutch Hill Tower
3. Clark Reservation
4. Jamesville Beach
5. Jamesville-DeWitt High School
6. Nob Hill Apartments
7. The Nottingham
8. Syracuse University Skytop
9. WTVH Tower
10. Jamesville Penitentiary
11. Southwood Park
12. Sentinel Hights Fire Department
13. DOT at Jaquith
14. Pratts Falls Park
January 2015

Attachment A

Attachment A
Dioxin/Furan TEQ Soil Resuts Through Year 2014 (pg/g dry weight)
Routine Soil Sites
Site Year
1994 1999 2000 2001 2002 2004 2005 2006 2007 2008 2009 2010 2011 2012 2013 2014
Clark Reservation 1.8 1.2 2.27 1.42 1.23 2.03 1.90 1.76 1.73 1.26 *** 1.64 *** 1.75 *** 1.67
Jamesville Beach 0.6 0.5 1.09 0.82 0.70 0.71 0.97 0.86 0.93 0.77 *** 0.52 *** 0.488 *** 0.493
OCCF 0.79 2.2 1.68 1.47 1.26 1.38 5.54 1.52 1.94 1331.72@ 1.72 *** 2.13 *** 7.67 ***
DOT @ Jaquith 2 1.5 1.64 3.41 2.41 3.78 3.38 1.73 39.90@ 2.62 *** 3.95 *** 2.43 ***
Dutch Hill * 0.77 1.41 1.16 1.40 1.03 1.26 1.02 1.02 0.64 *** 0.73 *** 2.44 *** 1.25
Erie - Poolsbrook * 1.39 1.5 1.14 1.86 ** ** ** ** ** ** ** ** ** ** **
Nottingham 0.51 0.78 0.79 0.80 0.70 0.94 0.85 0.84 0.74 0.76 *** 0.43 *** 0.791 ***
SHFD 12 8.02 9.89 9.72 7.02 8.09 6.27 7.20 10.74 *** 7.12 *** 16 *** 19.6
Sevier Rd 1.8 2.07 2.58 2.56 ** ** ** ** ** ** ** ** ** ** **
Beaver Lake * 0.51 0.53 0.85 0.70 0.72 0.64 0.69 0.65 0.38 *** 0.5 *** 0.751 ***
Ch. 3 Towers 3.36 3.88 3.35 9.66 7.79 7.69 5.39 2.44 3.72 *** 0.45 *** 1.02 ***
Gen.Crushed Stone 2.77 1.98 2.13 ** ** ** ** ** ** ** ** ** ** **
Highland Forest 1.18 1.24 0.96 ** ** ** ** ** ** ** ** ** ** **
JD High School 1.32 1.29 1.12 1.10 1.48 1.16 1.06 1.28 *** 1.13 *** 0.951 *** 1.25
Nob Hill 0.93 0.91 0.90 6.83 1.01 1.00 1.07 1.05 *** 0.78 *** 0.488 *** 0.929
Pratts Falls 0.91 0.98 0.77 0.87 0.98 0.83 0.94 1.17 0.82 *** 0.94 *** 0.91 ***
Southwood 0.6 1.14 1.01 1.08 1.05 0.97 1.09 1.01 0.80 *** 0.93 *** 0.807 ***
Syracuse University 3.11 6.97 9.47 13.89 3.14 3.66 12.96 0.67 *** 2.45 *** 1.63 *** 2.57
* Denotes Control Sites
** Site no longer sampled due to program re-evaluation
*** Site not sampled this year. Sites are sampled every other year.
@ A single elevated value will not be assumed to be indicative of a change at a specific site, rather a pattern of values must demonstrate a statistically significant difference.
Combined Ash
Site Year
1999-Spring 1999-Fall 2000-Fall 2001-Fall 2002-Fall 2004-Spring 2005-Spring 2006-Spring 2007-Spring 2008-Spring 2009-Spring 2010-Spring 2011-Spring 2012-Spring 2013-Spring 2014-Spring
Day 1 and 2 256 153 109 123 177 72 191 246 250 243 168 200 197 116 176 135
Day 3, 4, and 5 242 205 154 137 220 445 142 148 276 240 126 172 129 127 161 90.4
Note: For reference purposes, the ATSDR investigation level for Dioxin/Furan TEQ is 50 pg/g and the EPA clean up level is 1,000 pg/g.

Figure 1
0
2
4
6
8
10
12
14
16
18
1994 1999 2000 2001 2002 2004 2005 2006 2007 2008 2009 2010 2011 2012 2013 2014
pg/
g
Dioxin/Furan TEQ in soil (pg/g dry weight)
Clark Reservation
Jamesville Beach
Sentinel Heights FD
JD High School
Nob Hill
Syracuse University
Dutch Hill-control
EPA action level is 1,000 pg/g

Figure 2
0
200
400
600
800
1000
1200
1400
1994 1999 2000 2001 2002 2004 2005 2006 2007 2008 2009 2010 2011 2012 2013 2014
pg/
g
Dioxin/Furan TEQ in soil (pg/g dry weight)
Jamesville Penitentiary
DOT@Jaquith
The Nottingham
Channel 3 Towers
Pratts Falls
Southwood
Beaver Lake-control
EPA action level is 1,000 pg/g

Figure 3
0
50
100
150
200
250
300
350
400
450
500
1999 1999 2000 2001 2002 2004 2005 2006 2007 2008 2009 2010 2011 2012 2013 2014
pg/
g)
Dioxins/Furans in ash (pg/g)
Day 1,2 composite
Day 3,4,5, composite

Attachment B

Attachment B
PCB Results through Year 2014 (pg/g dry weight)
Routine Soil Sites
Site
2000 2001 2002 2004 2005 2006 2007 2008 2009 2010 2011 2012 2013 2014
Clark Reservation 6010 2360 3150 2780 3610 2770 4110 2640 *** 2960 *** 2980 *** 2580
Jamesville Beach 1260 644 683 703 1110 781 1220 1610 *** 589 *** 707 *** 754
OCCF 3080 5230 2000 2310 6940 3120 6320 2190 2810 *** 2650 *** 3970 ***
DOT @ Jaquith 16100 15400 45100 9220 67100 49100 18000 14200 34700 *** 31800 *** 38400 ***
Dutch Hill * 2210 1170 1400 1200 1380 1140 1450 1340 *** 1060 *** 2350 *** 933
Erie - Poolsbrook * 2620 1400 2020 ** ** ** ** ** ** ** ** ** ** **
Nottingham 2140 2280 3610 1640 7380 2850 3050 2110 4200 *** 2020 *** 1290 ***
SHFD 3080 2970 1760 1900 2730 1610 2510 1730 *** 2240 *** 1260 *** 10800
Sevier Rd 1870 1600 2250 ** ** ** ** ** ** ** ** ** ** **
Beaver Lake * 1970 1210 5250 2650 1420 1360 1360 1370 2450 *** 1110 *** 1380 ***
Ch. 3 Towers 3360 2310 2490 1620 1830 1730 2220 1400 1510 *** 723 *** 1030 ***
General Crushed Stone 9430 3160 5450 ** ** ** ** ** ** ** ** ** ** **
Highland Forest 2120 1210 1270 ** ** ** ** ** ** ** ** ** ** **
JD High School 3580 1780 1732 1810 2640 1780 1720 2720 *** 1750 *** 1450 *** 1640
Nob Hill 3500 2480 2500 3440 2810 2970 2830 2950 *** 2510 *** 1820 *** 2610
Pratts Falls 1890 1840 1440 1620 1650 1220 1450 2050 1230 *** 1910 *** 1100 ***
Southwood 2240 2160 1150 1480 1470 1470 2750 1640 1640 *** 1120 *** 1240 ***
Syracuse University 10700 114000 11000 9510 6940 11400 10900 1170 *** 78600 *** 17400 *** 18700
* Denotes Control Sites
** Site no longer sampled due to program re-evaluation
*** Site not sampled this year. Sites are sampled every other year.
Combined Ash
Site
2000-Fall 2001-Fall 2002-Fall 2004-Spring 2005-Spring 2006-Spring 2007-Spring 2008-Spring 2009-Spring 2010-Spring 2011-Spring 2012-Spring 2013-Spring 2014-Spring
Day 1 and 2 79000 22000 13600 7850 2470 5770 3080 23000 3100 5930 1260 1800 16200 1660
Day 3, 4, and 5 4700 7020 6580 38000 33000 57000 3060 5550 51900 8840 6060 20500 10100 3210
PCB results prior to 2000 were all less than detection limits. Starting in 2000
detection limits were lowered so that usable concentrations were available.
Note: For reference purposes, the ATSDR indicates that typical mean PCB concentrations
in background soil are less than 100,000 pg/g

Figure 4
0
20000
40000
60000
80000
100000
120000
2000 2001 2002 2004 2005 2006 2007 2008 2009 2010 2011 2012 2013 2014
pg/
g
PCB in soil (pg/g dry weight)
Clark Reservation
Jamesville Beach
Sentinel Heights FD
JD High School
Nob Hill
Syracuse University
Dutch Hill-control
EPA typical background levels are < 100,000 pg/g

Figure 5
0
20000
40000
60000
80000
100000
120000
2000 2001 2002 2004 2005 2006 2007 2008 2009 2010 2011 2012 2013 2014
pg/
g
PCB in soil (pg/g dry weight)
Jamesville Penitentiary
DOT@Jaquith
The Nottingham
Channel 3 Towers
Pratts Falls
Southwood
Beaver Lake-control
EPA typical background levels are <100,000 pg/g

Figure 6
0
10000
20000
30000
40000
50000
60000
70000
80000
90000
2000 2001 2002 2004 2005 2006 2007 2008 2009 2010 2011 2012 2013 2014
pg/
g
PCB in ash (pg/g)
Day 1,2 composite
Day 3,4,5 composite

Attachment C

0
2
4
6
8
10
12
14
16
18
Bkgd 1995 1996 1997 1998 1999 2000 2001 2002 2003 2004 2005 2006 2007 2008 2009 2010 2011 2012 2013 2014
ug
/g w
et
weig
ht
Arsenic
VII.A. Comparison of Annual Mean Values Routine and Routine Control Sites
RoutineSites
ControlSites
NYS levels

0
0.5
1
1.5
2
2.5
3
3.5
4
4.5
5
Bkgd 1995 1996 1997 1998 1999 2000 2001 2002 2003 2004 2005 2006 2007 2008 2009 2010 2011 2012 2013 2014
ug
/g w
et
weig
ht
Beryllium
VII.B. Comparison of Annual Mean Values Routine and Control Sites
RoutineSites
ControlSites
NYS levels
The absence of a value on the chart
for any year indicates that the level
was below the limit of detection

0
0.5
1
1.5
2
2.5
3
Bkgd 1995 1996 1997 1998 1999 2000 2001 2002 2003 2004 2005 2006 2007 2008 2009 2010 2011 2012 2013 2014
ug
/g w
et
weig
ht
Cadmium
VII.C. Comparison of Annual Mean Values Routine and Control Sites
RoutineSitesControlSitesNYS levels
The absence of a value on the chart
for any year indicates that the level
was below the limit of detection

0
5
10
15
20
25
30
35
Bkgd 1995 1996 1997 1998 1999 2000 2001 2002 2003 2004 2005 2006 2007 2008 2009 2010 2011 2012 2013 2014
ug
/g w
et
weig
ht
Chromium
VII.D. Comparison of Annual Mean Values Routine and Control Sites
RoutineSitesControlSitesNYSlevels

0
10
20
30
40
50
60
Bkgd 1995 1996 1997 1998 1999 2000 2001 2002 2003 2004 2005 2006 2007 2008 2009 2010 2011 2012 2013 2014
ug
/g w
et
weig
ht
Lead
VII.E. Comparison of Annual Mean Values Routine and Control Sites
RoutineSitesControlSitesNYS levels

0
0.05
0.1
0.15
0.2
0.25
0.3
0.35
Bkgd 1995 1996 1997 1998 1999 2000 2001 2002 2003 2004 2005 2006 2007 2008 2009 2010 2011 2012 2013 2014
ug
/g w
et
weig
ht
Mercury
VII.F. Comparison of Annual Mean Values Routine and Control Sites
RoutineSites
ControlSites
NYS levels
The absence of a value on the chart
for any year indicates that the level
was below the limit of detection

0
5
10
15
20
25
30
35
Bkgd 1995 1996 1997 1998 1999 2000 2001 2002 2003 2004 2005 2006 2007 2008 2009 2010 2011 2012 2013 2014
ug
/g w
et
weig
ht
Nickel
VII.G. Comparison of Annual Mean Values Routine and Control Sites
RoutineSitesControlSitesNYS levels

0
1
2
3
4
5
6
Bkgd 1995 1996 1997 1998 1999 2000 2001 2002 2003 2004 2005 2006 2007 2008 2009 2010 2011 2012 2013 2014
ug
/g w
et
weig
ht
Selenium
VII.H. Comparison of Annual Mean Values Routine and Control Sites
RoutineSites
ControlSites
NYS levels
The absence of a value on the chart
for any year indicates that the level
was below the limit of detection

0
5
10
15
20
25
30
35
40
Bkgd 1995 1996 1997 1998 1999 2000 2001 2002 2003 2004 2005 2006 2007 2008 2009 2010 2011 2012 2013 2014
ug
/g w
et
weig
ht
Vanadium
VII.I. Comparison of Annual Mean Values Routine and Control Sites
RoutineSitesControl Sites
NYS levels
0
20
40
60
80
100
120
140
160
180
200
Bkgd 1995 1996 1997 1998 1999 2000 2001 2002 2003 2004 2005 2006 2007 2008 2009 2010 2011 2012 2013 2014
ug
/g w
et
weig
ht
Zinc
VII.J. Comparison of Annual Mean Values Routine and Routine Control Sites
RoutineSites
ControlSites
NYS levels

Attachment C-1

Metal NYS SCO’s for restricted use residential (ppm)
Rural Soil Survey (ppm)
USEPA Soil Screening levels for residential (ppm)
Arsenic 16 (0.21) 16 0.39
Beryllium 14 1.2 160
Cadmium 2.5 (0.86) 2.5 70
Chromium 36 30 280
Lead 400 133 400
Mercury 0.81 0.3 6.7
Nickel 140 29.5 1600
Selenium 36 4 390
Vanadium NA 38 390
Zinc 2,200 180 23,000
New York State Department of Environmental Conservation Soil Cleanup Objectives (SCO’s) - The Health Based SCO’s were calculated considering all exposure pathways: ingestion, inhalation, dermal, carcinogenic (1 in a million cancer risk), and non-carcinogenic (using risk reference doses). The final health based SCO is based on the most conservative pathway calculation. In some cases the SCO has been modified to match background if the rural background levels for NYS are above the calculated SCO (the health based SCO is in parenthesis). Restricted use means no livestock or animal product consumption. NYS Statewide Rural Surface Soil Survey (2005)-determined concentration ranges for 170 commonly assessed analytes in discrete surface soil samples collected at randomly selected rural NYS properties. USEPA Soil Screening Levels for residential–Values were calculated based on the ingestion-dermal exposure pathway for residential soils. These screening levels are not action levels or clean up levels, they are a tool for further evaluation.

Attachment D

0
50
100
150
200
250
300
Fall
1998
Sprin
g 1
999
Fa
ll 1
999
Sprin
g 2
000
Fall
2000
Sprin
g 2
001
Fall
2001
Sprin
g 2
002
Fall
2002
Sprin
g 2
003
Sprin
g 2
004
Fa
ll 2
004
Sprin
g 2
005
Fall
2005
Sprin
g 2
006
Fall
2006
Sprin
g 2
007
Fall
2007
Sprin
g 2
008
Fall
2008
Sprin
g 2
009
Fall
2009
Sprin
g 2
010
Fall
2010
Sprin
g 2
011
Fall
2011
Sprin
g 2
012
Fall
2012
Sprin
g 2
013
Fall
2013
Sprin
g 2
014
Fall
2014
ug
/g d
ry w
eig
ht
(pp
m)
VII.A. Mean Values Ash Data Dry Weight
Arsenic
Cadmium
Chromium
Nickel
Vanadium

0
2
4
6
8
10
12
ug
/g d
ry w
eig
ht
(pp
m)
VII.B. Mean Values Ash Data Dry Weight
Beryllium
Mercury
Selenium

0
2000
4000
6000
8000
10000
12000
ug
/g d
ry w
eig
ht
(pp
m)
VII.C. Mean Values Ash Data Dry Weight
Lead
Zinc