Embed Size (px)
Citation preview
Waste Stream Characterization Project
Civ of Greensboro, North Carolina
Final Report
May 1992
Prepared by
HDR Engineering, Inc. Charlotte, North Carolina

Table of Contents
Section
1 ‘,. ;’
2
3
4
5
Title .
Executive Summary . . . . . . . . . . . . . . . . . . . . . . . . . . . .
Waste Stream Characterization Project Approach . . . . . . . . . .
Results of the 1992 Waste Stream Characterization Study . . . . .
Comparison of 1991 and 1992 Waste Stream Indices . . . . . . . .
Conclusions . . . . . . . . . . . . . . . . . . . . . . . . . . . . . . .
Attachments
“Waste Stream Characterization Project; City of Greensboro, NC; Interim Report; April 1991”
Deftitions of Waste Categories
Normalized Results of the 1992 Target Group Waste Strmn Characterization Study
Normalized Results of the 1992 Control Group Waste Stream Characterization Study
Overview of the City’s Solid Waste Reduction Education Progmn
Target Group Waste Generation Rates for March 30 - April 3, 1992
Control Group Waste Generation Rates for March 30 - April 3, 1992
Pane
1
5
14
19
25
-i-

List of Figures and Tables
Fimre
_ ._ 2-l -. *
2-2
2-3
Tsble
l-l
3-l
3-2
4-l
4-2 c -
Ititl!E Pace .
sorting Area Lay-out . . . . . . . . . . . . . . . . . . . . . . . . . . . ‘7
ExampleofaCompletedLogSheet . . . . . . . . . . . . . . . . . . 8
1992 Field Staffat Work. . . . . . . . . . . . . . . . . . . . . . .
Waste Stream Characterization Study Comparisonof 1991& 1992Data . . . . . . . . . . . . . . . . .
Results of the 1992 Target Group Waste Stream Characterization Study . . . . . . . . . . . . . . . . . . . . . 15
Results of the 1992 Control Group Waste Stream Characterization Study . . . . . , . . . . . . . . . . . . . . . 16
Comparison of 1991 & 1992 Solid Waste Generated by Households . . . . . . . . . . . . . . . . . . . . . . . . . . . . . . . 20
Comparison of 1991 & 1992 Collection Rates for the Targut and Control Neighborhoods . . . . . . . . . . . . . . . . 24

Secrion 1 Executive Sumnary
In the spring of 1991 the City of Greensboro’s Solid Waste Management Division (iz:F 3ty) embarked on a project which was specifically aimed at reducing municipal solid waste through so~~reduction. The primary objective of this project, which is funded by the Enviror.~nental Prokction Agency, is to assess the impact of public education techniques and mater& on changing behavior or attitudes toward solid waste generation. As part of this project, the City requested that HDR Engineering (HDR) quantify and characterize the solid waste generated by two selected groups of households. HDR designed and implemented a residential waste stream characterization study aimed at identifying the components in the residential waste stream which would be amenable to source reduction and would yield the greatest impact on the waste stream.
Prior to the onset of the waste stream characterization study, the City identified two nxciential neighborhoods, each consisting of approximately 1000 households, to be included in the :: ::fject. Care was taken to ensure that the neighborhoods selected were similar in their representi.ion of a wide variety of so&-economic characteristics. The next step in the selection process was to designate one neighborhood to be targeted for source reduction promotional activities (the target neighborhood). The other neighborhood, which was designated as the control neighborhood would not participate in or intentionally be exposed to source reduction promotional activities.
Having decided upon the ateas to be included in the project, the City then selected a representative sample of 250 homes located in the target neighborhood (referred to as the Target Group), and a similar sample of 250 homes located in the control neighborhood (referred to as the Control Group) to be included in the residential waste stream characterization study. It was these households whose waste generation habits would be documented by HDR.
During the week of March 18-22, 1991, wastes collected from both groups of households were manually sorted under the direction of HDR staff into 22 categories at the City of Greensboro’s White’- Street Landfill. Based upon the results of the initial residential waste stream characterization study, HDR recommended that yard waste, disposable paper products, junk mail, and food waste be targeted for source reduction.
Upon the conclusion of the initial waste stream characterization portion of the project, the City began work on the next phase of activities; namely the commencement of a Solid Waste Education Program to be presented to all of the residents living in the target neighborhoo?. This program was designed to educate and inform residents so as to affect behavior regard~?g the generation of solid waste. Though the focus of the program was to affect behavior 53 ZA to reduce the generation of solid waste by means of source reduction, it was hypothesizd that recycling rates might also be impacted by the educational campaign.
1

HDR returned to the White Street Iandfti the week of March 30 - April 3, 1992 to repeat the process of hand sorting and weighing the waste components generated by the 250 target households and 250 control households included in the study. The sorting area set-up, waste collection strategy, waste categories, sorting methods, and documentation procedures used during the 1991 waste composition study were replicated during the 1992 study. h total, composition
=. a@ was recorded for 14,662 pounds of wastes generated by the Target Group and 15,056 pounds of wastes generated by the Control Group.
The data collected during the 1992 residential waste steam characterization study was analyzed and compared with the 1991 baseline indices. The results of this analysis are presented in Table l-l.
Conclusions which can be made based upon the changes in the quantity and characteristics of the waste streams studied in 1991 in comparison to those studied in 1992 are as follows:
l The individual households within the Target Group disposed of 7.41 fewer pounds of waste during the week-long waste characterization study conducted in 1992 than they did during the week-long study conducted in 1991. The Control Group also realized a decrease; having disposed of 4.19 fewer pounds of waste this year when compared to last.
0 A comparison of percent changes in the weight of wastes targeted for source reduction which were generated by Target Group households and Control Group households shows that the percentage reductions real&d by the Target Group surpassed the reductions real&d by the Control Group by more than 10% for all categories except Other Food Waste. These changes, for the purposes of this study, are considered significant.
0 A comparison of percent changes in the weight of wastes which are accepted for recycling in the City of Greensboro and were generated by Target Group households and c - Control Group households shows that for five of the seven qualifying categories, the percentage reductions realized by the Target Group surpassed the reductions realized by the Control Group by more than 10%. Significant reductions were seen in the household generation of Recyclable Paper, Recyclable Glass, Recyclable Aluminum, Recyclable Plastic, and Clothing. ‘Ihe only exceptions to the significant reduction in recyclables were the disposal rates malized for Recyclable Ferrous and Rubber & Leather.
2

Table 1-l Waste Stream Characterization Study
Comparisonofl!B1&l!MData
TAR06
ToTa
1991
WEloHT PER
roTAL
1992
WEmIlT PER
HousEHoLD HOUSRHOLD HousRHoLD HOUSRHOLD
t 6.79 5.47
1.19 I 6.63
1.W 1.20
0.60 0.82
l.u 1.06
4.06 3.08 i
1.49 2.15
1.1s I 1.16
RUBBER & LEATHER
OTHRR POOD-WBTE
1.47 1.16
1.92 1.44
2.02 1.72
2.78 2.34
I 17.63 29.33
I 0.08 I 0.04 I
I 0.12 0.20
1.60 1.28
l.WI . 0.92
1 2.17 2.92
I 22.86 21.92
I 0.29 I -0.04 t-1 OTHEIlAUSC.WASTE I
I 0.07 I 0.36 1
I 0.00 0.97 I 0.97 0.W
I 5.2s I 5.08 I I 7.9a 5.6s
I 78.92 74-m
I 4.18 a33
I -7.41 4.19 f ~‘: %YFALQUANTlTIEs] I 72.33 64.92
’ WEIOH.l?I ARE APPROXIMATED IN POUNDS
3 o:-IuLl

Data obtained from 1991 and 1992 White Stat Iandfidl Scale House records show that for the two week period preceding each waste stream characterizaion study, the week of each waste stream characterization study, and the week following each waste stmam characterization study, SigMcant changes wert seen in the target neighboriaul’s waste generation habits. In 1992 the target neighborhood dispoat of 20.11 fewtt tons of wasteduringthefourweekperioddefrnedabovethantbeyhaddimnssdofpriotto‘tbe commencement of the City’s Solid Waste Education Pxogmm. This compass to a 1;17 tonreductioninthewastesbeamgeaerPtedbythecontFolneinhborhoodfortberune periods of time.
4

su.ion 2
Waste Stream Characterization Project Appmach
In order to insure the comparability of 1991 data with that collected in 1992, every e:- -. was made upon the part of HDR to ensure that both the initial and final waste stream ch&rac&~-zation stud& were conducted in the same manner. A copy of the report issued in AptJ 1991 describing the initial waste stream characterization study is presented in Attachment f The following section describes the methodology used during the second and final waste stream characterization project as requested by the City of Greensboro.
. Waste Cost Megones - The waste categories which were sorted for during the 1992 project were identical to those originally selected prior to the 1991 waste stream characterization study. The categories were selected and defmed (see Attachment 2) so that the impact of source reduction activities might be more easily identified at the conclusion of this year’s analysis. The waste categories selected for inclusion in the waste steam characterization are shown beiow:
Disposable Paper Recyclable Paper Junk Mail other Paper
Disposable Plastic Recyclable Plastic Other Plastic
Rubber & Leather
Clothing other Textiles
Recyclable Glass Vegetable/Fruit Debris other Glass Other Food Waste
Battexies Other HH Waste
Recyclable Ferrous Recyclable Aluminum other Metal
Wood
Yard Waste
Other Misc. Waste
. . ure Mater& and I&nnment -- In preparation for the waste stream characterization study the C& made available to HDR the following equipment/materials for use during the sorting study:
0 A fenced-in site with sufficient area and concrete pad to properly conduct the study.
0 Truck weigh scales, roll-off container 0 Bathrooms, parking and a break area for the crew
5

HDR arranged to provide the following equipment/materials for use during the sorting study:
Closed sided tents (2) sorting tables (2) portable weigh scales (2) 32 gallon refise containers 5 gallon buckets Tarps, n&es, shovels, brooms safety equipment (coveralls, gloves, masks, goggles) Firstaidsupplies
Set-UQ - Gn Friday, 3/27/92, equipment was delivered to the White Street Iandfill, including coveralls for the work crew and two 20*x40’ closed sided tents. The original plan called for setting up the tents on that day, however due to the high wind gusts the tents were set up on the concrete pad on Saturday, 3/28/92.
On Monday, 3/30/92, all other aquipment, including the refuse containers, buckets, sorting tables, and portable weigh scales were set-up under the direction of HDR staff. As was the case last year, the tent with the white roof was selected to be used for sorting wastes collected from the Target Group, and the tent with the blue and white roof was used for sorting wastes collected from the Control Group.
Within each of the tents, signs identifyiig the 22 waste categories were hung on the side walls and a refuse container was placed underneath eatih sign. A 32 gallon container was used for wastes whose volumes were anticipated to be high, and the five gallon buckets were used for categories whose volumes were anticipated to be relatively low. The tables which were used last year for sorting wastes were once again put to use this year, with one table beiig placed in the center of each tent. The end walls of each tent were left partially open so that wastes could be brought in at one end of the tent, sorted, and then weighed and removed at the other end of
-the tent. A roll-off container was placed between the two tents to serve as a collection point for wastes which had been sorted and documented. Overall, the area set-up was identical to the set- up used in 1991 (see Fii 2-l).
Log sheets corresponding to each of the categories were designed and used by HDR supervisors to RX& the following Mormation on a daily basis: the source of the waste (Target Group or Control Group); weather conditions; container (including contents) weights; the time at which weights were taken; the extent to which a weighed container was full; any other significant observation made by the HDR supervisor regarding the components of the waste category; and the initials of the supewisor logging in the waste stream data (see Figure 2-2 for an example of a completed log sheet).
6

FIgmu-1 &tiDg Azea Lay-out
go0 0 8 8 0
8 0 8 0 0 8 0 0
O OeJ
TARGET TENT
.
CONTROL
LEGEND
I 1 SORTING TABLE 0 32-GALLON BARREL
9 RECORDING STATION (DESK 6 CHAIR)
0 PORTABLE SCALE
0 Al ALUMINUM STORAGE
CfTYOFGREENSBOiW WASTE COMPOSITKN ANALYSIS

Figure 2-2 Example of a Completed Log Sheet
3 !% !k - St - $ - % 9 - !k - . ii - s -
- \ \ \ \ \ ‘,
4 a?: rl
0 .
s s a
3
-
8

The weights recorded on the log sheets were adjusted for container tare weights (7.2 pounds for the 32 gaIlon refuse containers; 2.1 pounds for the five gallon buckets) after the end of each work day. It should be noted that weights recorded on 3/30/92 - 4/l/92 represented the waste streams received at the Landfill on Monday, 3/30/92. The weights recorded on 4/2/92 - 4/3/92 represented the waste streams received at the Landfill on Thursday, 4/2/92. -
s -. -. - . Rmonnel As- - Anangements were made with Western Temporaries in Greensboro to hire people to assist with the waste stream characterization project. Gn Monday, 3/30/92, sixteen people came to the White Street La&fill (including one person who had worked on the waste stream analysis conducted in 1991) at 830 AM to work on the project. Workers were given an orientation to the project and provided with coveralls, gloves, goggles, dust masks, and assigned to one of the sorting tents (Target Group or Control Group). HDR supervisors conducted t@ning sessions with the two teams and used the opportunity to answer any questions that the workers might have. Unlike last year, worker turn over by the end of the ~&ywasverylow,soitw9s~necessarytorequestassistancefromanyotbertemporary agencies other than Western. The following day, and throughout the rest of the week, eighteen people workedon the sorting project. A core group of field personnel (consisting of fourteen temporary workers) did stay on the job for the full 40 hour week, and overall they did an excellent job sorting through the waste stream.
Throughout the study HDR supervisors worked with the field personnel to help sort the wastes, to make sure that sorting procedures were followed, and to log in container weights. At the start of the work day (which after Monday began at 7:30 AM) field personnel checked in with an HDR supervisor and then pmceeded to the tent other than the one they had worked in duting the previous day. This same strategy was used last year, with the purpose being to balance out any differences between the two teams in sorting techniques. The few new field personnel that did come in during the week were assigned to a work team based on staffing needs and were trained by their respective HDR supervisor. other field personnel already familiar with sorting procedures assisted with answering their new co-workers questions which helped to make staffing Bnsitions smooth.
. Waste Collection m - On Monday morning, 3/30/92, while field personnel were being trained, two City collection trucks were picking up wastes from 250 households within each of the neighborhoods under study. officials from the City’s Solid Waste Management Division rode in each of the trucks to direct the driver to the stnets within the target and control neighborhoods where wastes were to be collected for analysis. Each of the trucks picked up wastes from 250 households and then procee&d to the White Street Landfill where they were weighed and directed to the sorting area. At approximately lo:30 AM wastes from each of the
9

trucks were dumped beside their respective tents. A total of 9,040 pounds of wastes were collected for analysis on Monday from the 250 households comprising the Target Group. Another 10,040 pounds of wastes were collected for analysis on Monday from the 250 households mmprising the Control Group.
.
=, zTwo City collection trucks returned to the neighborhoods under study to pick-up wastes from the mmaining households. The contents of these two trucks were weighed at the White St&et LaudflU, but the wastes were not taken to the sorting area for analysis. A total of 10,540 pounds of waste were collected on Monday from the remaining households in the target neighboxhd. bother 19,820 pounds of waste were collected on Monday from the mmaining households in the control neighborhood.
On Thursday morning, 4/2/92, the same waste collection procedure was followed in each of the neighborhoodsunder study. Drivers of the collection trucks returned to the same streets and households inch&d in Monday’s Target Group and Control Group collection route. If there was no roll-out comainer at the curb the truck pmceeded to the next household on the pick-up list. A total of 6,320 pounds of waste were collected for analysis from the Target Group households which set out waste for collection on Thursday. On the same day a total of 6,560 pounds of waste were collected for analysis from the Control Group households which set out waste for collection.
The sorting and documentation of waste received at the White Street U&fill from both the Target Group and Contml Group on Monday, 3/30/92, was completed prior to the arrival of collection ttucks hauling Thursday’s wastes. When these trucks arrived at the Landfill, they were weighed, and then proceeded to the sorting area and dumped their loads next to the apprcpiate tent. As was the case Monday, the wastes collected from the remainder of the households in the target and control neighborhoods were collected separately on Thursday morning; the contents of the collection trucks were weighed at the Landfill but were not taken to the Ug area for analysis. The recorded weights were as follows: 3,740 pounds from the
- remainder of the target neighborhood, and 10,340 pounds of waste from the remainder of the control neighborhood.
. m So- Docu-on Procedures -- During the tmining and orientation sessions for field staff the pm&ures to be followed in conducting the waste stream characterization study were discussed. Workers were told of the necessity for keeping the two waste streams under study sepamte until the various components were documented by HDR supervisors. Once documented, the wastes would be dum@ together into a centrally located roll-off container.
10

The only wastes which were not put into the roll-off container were those collected for the Recyclable Aluminum category. With the permission of the City, Recyclable Aluminum which had been documented was saved for resale at an aluminum by-back center. As an incentive for the field staff, the proceeds collected from a given day’s aluminum sales were divided among workers who returned to work on the following day. .
~_ Th&ghout the week field staff worked outside as well as inside of the tents. Those outside of the tents took charge of moving wastes from the piles onto the sorting tables. In addition, outside workers took charge of pulling Yard Waste and other large components easily spotted in the waste stream. The majority of the field staff were stationed at the sorting tables separating components into their appropriate categories.
During the tmining and orientation session, time was spent fming the field staff with the various categories and ,&mlxments comprising each. In response to questions raised by the field staff, HDR supervisors added examples of category components to the signs hung inside each of the tents. Within each tent the staff worked as a team. Armed with gloves, hand rakes, and empty five gallon buckets to use as a temporary depository for wastes, individual team members quickly became “spe&li& in pulling certain waste categories (see Figure 2-3 for illustrations of field staff at work). All bags and containers placed on the sorting tables were opened and their contents analyzed. Items pulled from the waste stream were dumped into the appropriate component container along the periphery of the tent walls. Magnets were used to check that the Recyclable Ferrous materials were not mixed with the Recyclable Aluminum items.
HDR supexvisors worked with the field personnel to help sort ‘the wastes and make sure that sorting procedures were followed. In cases where items were constructed of multiple materials, HDR supervisors decided how to categorize an item based on the material that constituted the bulk of the item’s weight. As sorters finished with a batch of wastes, the remaining scraps were pushed to the opening at the end of the table and an EIDR supervisor determined the categorieation for the remaining debris. In most cases these remaining materials were categorized and Other Miscellaneous Waste. When items were found with could prove hazardous to the field staff, such as hypodermic needles and shards of glass, an HDR supervisor took charge of removing materials from the sorting tables.
Once a container for a specific waste category was filled, the container was weighed to the nearest tenth of a pound, and an HDR supervisor recorded the data on the appropriate log sheet. The type of container (32 gallon waste container or five gallon bucket) was noted by the supervisor on the log sheet. The wastes (with the exception of Recyclable Aluminum) were then
11

dumped into the roll-off container located between the two tents. At the end of each day all containers, whether full or not, were weighed, and the data recorded by an HDR supervisor on the appropriate log sheet. The sorting areas were then swept and any debris found on the floor of the tent was placed in a refuse container to await sorting on the following day.
=. ,The documentation process for the wastes received at the sorting areas on Monday from both the Target and Control Groups was completed on Wednesday, 4/l/92. The second and final delivery of wastes from the Target and Control Groups arrived on Thursday moxning, 4/2/92 at approximately 1O:OO AM. The wastes we= dumped next to theii respe&ve tents and the sorting procedure resumed.
The week-long waste characterization study was conducted under clear, and for the most part sunny skies. Though the winds gusted fiercely at times, field staff were able to complete the categorization pxocess prior to the end of the workday on Friday. A total of 5,988 pounds of waste collected from the Target Group households which wert set out wastes on Thursday were sorted and documented by noon on Friday, 4/3/92. Likewise, a total of 5,733 pounds of waste collested from the control Group households which set out wastes on Thursday were sorted and documented by noon on Friday, 4/3/92.
. m - On Friday, 4/3/92, after all wastes had been moved from the sorting arena, the field staff and HDR supervisors cleaned the equipment and tools that were used for the study. The equipment supplied by the City was returned and all HDR materials and tools were removed from the job site by 3:30 PM. The rental equipment, including the tents and covet& were scheduled for pick-up on Saturday and Tuesday morning respectively.
13

section 3 Results of the 1992 Waste Stream Characterization Study
During the time when the second and fina waste stream characterization study was conducted a w,of 29,718 pounds of wastes were manually sotted into 22 diiennt categories identified in &ta&ment 2. Gf this total, 14,662 pounds of wastes were generated by the 250 households comprising the Target Group during the week of March 30 - April 3,1992. The remainmg 15,056 pounds of wastes that were characterized during the study were generated by the 250 households comprising the Conttol Group.
Prior to the commencement of this waste stnzam characterization study, the City had estimated that a total of 13,000 pounds of waste would be disposed of by the 250 homes in the Target Group and the equivalent amount of wastes would be disposed of by the 250 homes in the Control Group over the two day colleztion period. Aswasthecaselastyear,bothgroups disposal indices exceeded this amount; the Target Group generated an excess of 2,360 pounds and the Control Group generated an excess of 3,600 pounds.
The data gathered during the 1992 waste stream characterization study was compiled according to categories of wastes, generators of wastes (Target Group or Control Group), and the day of waste collection (Monday, 3/30/92 or Thursday, 4/2/92). Tables 3-l and 3-2 show the characterizations of Monday’s and Thursday’s waste collections for the Target and Control Groups respedvely.
14

Table 3-l Results of the 1992 Target Group Waste Stream Charactehtion Study
I 536.8 I 6.2%1 I 369.6 t 6.251
I 726.6 1 r.rrl I 4121 I 6.9d I ll34.71
I 150.2 I 2.5%1
U1.J 8.0% ..: .*i*d. P-6%
542.5 B 10.2
-. .: : .. :::“; ::j:. . .
36.6 0.6% . . . . . . ,. 14la: 2JI
IDISPOSABLE PXASTIC I I 161.6 I 1.911 I 121.0 I 2.011 2126
146.3
310.7
I- 73$.4:-j.
IRECYCLABLE PLASTIC I I 92.91 l.l% l OllZERPLASTlC
. . ., . ToT<LAsrlc
197.0 23%
451.5 . . SZ%
I 41.6 1 0.5rl I 6.4 1 0.1x1 I 4aol I 46.01 I 172.8 I
I 230.8 I 2.711 I 68.1 I l.l%l
I 95.2 I 1.6%1
I m.9 I I lo(.J I l.S%l I am.7 I
IOTHER POOD WASTE I I 466.9 I 5.611 I 194.2 I 3.221 1 661.11
m
I _ I
Y.AlID WASTE I r. e6.01 42.7% r 2950.21 49.3%
IBATTERIES I I 4.9 I O.l%l I 0.0 I o.onl I 56.1 I 0.9x1
I 4.9 I lHoUsEHoLD HAZ WASIE I I 15.3 I 0.2rl L 71.4 1
OTlml Misc. WASTE I
I TVTN, QU-
I 666.5 1.7% I 490.4 8.2% I 1156.9 I
f--AZ]
l wEloHTsARElNPouNDs
15

I
Table 3-2 Results of the 1992 Control Group Waste Stream Characterization Study
ID- PAPRR IRBCY- PAPER I
160.9 1.7%
103.8 1.1%
146.6 1.6% . ,i2iii. : 4.4%
1-J .’ ‘., :;,:,. :. .:. ..:...:.,:.:.: ,,,: W&&M, :.>, . . -.:. ,: . . .).
I 443.7 I 29%1 134.9 2.4%
85.0 1.5%
56.6 1.0%
‘. 276.5 j 4.8%
I 238.7 I 1.6%)
IRUBRRR & LEATHER I lCLQTHK4 I lOTHER- I IWOOD I
I 553.6 1 3.7rl
I 24422 j 42.6% .3389.2f- 36.4%
390.2 6.6%
HOUSRHOLD HAZ WMTR I
I 1164.7 7.7%
1
IomER MISC. WASTE I I 764.5 I 8.4%1
I TOT’ QtTANTKlES
l wEK3Hr8AREINPouNDS
I 5732.5 1
o:-mua
16

Results of the study show that Yard Waste was the single largest component of the waste stream for each of the Groups studied. After Yard Waste, the next largest component was paper, (Recyclable, Gther, and Disposable Paper categories combined together), followed by Other Miscellaneous Waste, Recyclable Glass, and then Other Food Waste. These categories made up nearly 80% of the weight of both waste streams being studied. The individual percentages
)- yliz42d for these waste categories are as follows: w
Major Components of the 1992 Waste Stream Characterization Study
Target Group Control Group
I Recyclable IQjer I 7.8 96
Yard waste I 38.7 46
Recyclable Paper
GtherMisc. Waste
Other Paper
7.9 I
8.1 46
Disposable Paper I 6.2 %
Recyclable Glass
GtherMisc. Waste
other Paper
Disposable Paper
Recyclable Glass
other Food Waste I 4.6 46
I Total 1 83.7 96
Other Food Waste
A U.S. Environmental Protection Agency report which was written by Franklin Assoc., Ltd. estimatesthatin199OYardWasteaccountedfor19.8%oftotaldisczds.1 Thus,accordingto this national annual average, the amount of Yard Waste received from both the Target and Control Groups was more than would have been expected.
-As was the case last year, Yard Waste accounted for a greater percentage of the waste stream generated by the Target Group than that generated by the Control Group. Though the largest percentage of the Target Group’s waste stream was attributed to Yard Waste, on a household basis, the Target Group disposed of less Yard Waste than did the Control Group households. From Table l-l it can be seen that in 1992 the average Target Group household disposed of 28.92 pounds of Yard Waste, whereas the average Control Group household disposed of 29.33 pounds of Yard Waste.
’ Source: Fraukiin Associates, Ltd. churctcriution of MuniciD~ Solid Waste in the United States, 1960-2ooo fUti 1988). U.S. Environmenti Protection Agency. Much, 1988.
17

The large amount of Yard Waste generated was no doubt due to the seasonal timing of the study combined with weather conditions. Fortunately for comparison purposes, the weather patterns experienced prior to and during the 1991 study were similar to those experienced this year. On the last collection day of the week prior to the 1992 study (3/26/92) the weather was cool and rainy. By the weekend prior to the study however, the weather was favorable for yard work, and$qse conditions continued until the study was finished.
For informational purposes, stat&tics were applied to the data collected for both the Target and ControlGroupto&lectYardWasteasrcpnsenting18%ofthewastestxeam. T&normal&d data for the two groups are shown in Attachments 3 and 4 mspectively. A comparison of these tables adjusts the percentages of major components of the Target and Control Groups as follows:
: 1992 Waste Sbwam Characterization Study Major Component hcentages Foiiowing the
! Normalization of Yard Waste to 18%
18

I
section 4 Comparison of 1991 and 1992 Waste Stream Indices
The overall purpose of this study is to determine the impact of source reduction promotional *- activities on solid waste characteristics and generation rates. In otder to measure this impact,
* 0 baseline data was collected in 1991 for a group which would be exposed to source reduction promotional activities (the Target Group) as well as a group which would not intentionally be exposed to source reduction promotional activities (the Control Group).
During the 12 months that followed the initial waste stream analysis, residents in the Target Gmup received information from the City regarding ways in which they might change both the quantity and qualities of their waste stream. The focus of the City’s Solid Waste Education Pmgtam inc&-xied Disposable Paper, Junk Mail, Food Wastes, and Yard Waste. As the discussion of sowcc xeductbn often tmnslates over into other means of changing waste disposal habits, it was thought inkrest in recycling among residents in the Target Group might also be heightened as a result of the City’s Solid Waste Education Program. Waste categories sorted for during the study and which contain items considered acceptable for recycling at various locations within the City include Recyclable Paper, Recyclable Glass, Recyclable Ferrous, Recyclable Aluminum, Recyclable Plastic, Rubber & Leather, and Clothing.
One year following the collection of baseline data representing 22 categories of waste generated during a one week period by the Target Group as well as Control Group of households, a new datasetwascollected. The1992dataset,whichwascollectedinthesamemaanerasthatof 1991, when compared with the 1991 data set reveals that changes in the waste stream have taken Ph=
Table 4-l presents an overview of the differences in the household waste generation habits of 1991 compared to those of 1992. Though per capita generation rates decreased among both
_ ,groups studied, the reductions realized in total waste quantities generated on a per household basis for the Target Group (-7.41 Ibs.) was significantly greater than that reahzed by those generated for the Control Group (-4.19 lbs.).
19

Table 4-l Comparison of l991& 1992 Solid Waste Generated by Households
RECYCLABLE FERROUS RECYCLABLE ALUMINUM OTHER METAL
TOTAL METAL
TOTAL PLASTIC
RUBBER & LEATHER -0.45 CLOTHING -0.21 OTHER TEXTILES 0.16 WOOD -0.31 VEGETABLE I FRUIT DEBRIS -0.94 OTHER FOOD WASTE 0.74
. . v&D ‘WASTE I I 6-06
0.29 0.97
OTHER MISC. WASTE
‘:. TOTAL QUANTlTlES
I -0.18
I -7.43
0.67 0.01
-2.27
i ..y .: :... ;I* 1
-0.42 a.20
I lIl65
I -2.33 1
I -9.19
l WElOHTS ARE APPROXIMATED IN POUNDS
20

The changes which occurred in the generation of wastes which were the focus of source teduction promotional activities presented to the Target Group reveals the following information:
l DipnblePqm - 1.74 lba. - 1.32 Ibs. -10.98 96
l Juakh4ail - 2.52 lb. - 2.51 lba. -14.55 96
l V~le/Fluit Debris - 0.94 lb& - 0.30 lbs. -35.69 96
l OtherFoodWaste + 0.75 Ihs. - 0.06 Ihs. +32.40 96
l YmiWMte . + 6.06 lba. +11.65 Ibs. -39.38 96
TUWL WTJAVG. % CHANGE + 1.61 lb& I + 7.46 ltm. I -13.64 96
* Per capita weights are averaged based on total waste stream percentages. ** Level of significance represents the difference in the percentage change in weight reahxed by the
Target Group when compared to that realized by the Control Group. It should be noted that HDR studies in the past have shown that monthly waste generation rates can vary as much a8 20% due to seasonal variations. Keeping in mind that the 1992 waste strezun characterization study was conducted 12.25 months following the conclusion of the 1991 waste stream characterization study, a variation of 5% (20% x .25) might be expected within the waste streams under study. Therefore, for the purposes of this study, a variation between 1991 and 1992 data of 10% or more is considered significant in that it is more than double that which might have been expected.
If a change of 10% or more in weight is used as the level which indicates signifkance, in all cases the changes in weight real&d by households in the Target Group for the categories which were the focus of source reduction, with the exception of Other Food Waste, were signiiicant when compared to changes in the household waste streams generated by the Control Group.
The total weight of Yard Waste that was generated by households in both groups during the 1992 characterization study was greater than the amount of Yard Waste generated in 1991. The amount of Yard Waste generated by households in the Control Group increased by 65.89 96 in 1992 compared to the amount generated in 1991. Households within the Target Group on the other hand real&d a 26.51% increase in Yard Waste in 1992 when compared to 1991 data. . Therefore, despite the fact that there was an overall increase in waste within this category, the change in Yard Waste weight generated by the Target Group was 39.38% less than the change in Yard Waste weight which was generated by the Control Group.
21

Though there was a significant reduction in the amount of Vegetable/Fruit Debris found in the Target Group’s waste stream, the amount of Other Food Waste increased. The reasons behind this are unclear, yet despite the increase in Other Food Waste, the total average percent reduction of -13.64 96 in the categories targeted for waste reduction is still significant.
A lo&at the changes which OCCUR& in the generation of wastes which are accept& for recycling within the City of Greensboro and therefore might have been impacted by the source reduction promotional activities reveals the following information:
Change In Weights chilqp la wdghts Led of Sqnifi-
l Recy&ble Ferrow - 0.78 ltm. - 0.78 ibr. - 6.76 96
l Recvclable Aluminum + 0.01 lba. + 0.22 Ita -34.58 %
l Recyclable Plastic - 0.15 Ibs. + 0.01 lb& -19.62 %
. RubberkIatkr - 0.45 It%. - 0.41 Itm. + 0.15 I
l c1OthiI.l8 - 0.21 Ihs. - 0.20 Ihs. -18.99 I
TOTAL WT./AVG. % CHANGE - 5.56 lbs. - 3.22 lbs. -17.27 96
* Per capita weights are averaged based on total waste stream percentages. ** Level of significance represents the difference in the percentage change in weight realized by the
Target Group when compared to that realized by the Control Group. It should be noted that HDR studies in the past have shown that monthly waste generation rates can vary as much as 20% due to seasonal variations. Keeping in mind that the 1992 waste stream characterization study was conducted 12.25 months following the conclusion of the 1991 waste stream characterization study, a variation of 5 % (20% x 25) might be expeckd within the waste streams under study. Therefore, for the purposes of this study, a variation between 1991 and 1992 data of 10% or more is considered significant in that it is more than double that which might have been expected.
Again, using the s&a&tic of a 10% or more change in weight to indicate a level of significance in change, the Merences in weight of nearly all of the recyclables which are accepted for recycling in the City of Greensboro were significant for the households in the Target Group when compared to changes in the household waste streams generated by the Control Group. The only exception to this were the data collected for Recyclable Ferrous (a 6.76% decrease) and data collected for Rubber & Leather (a 0.15 96) increase.
22
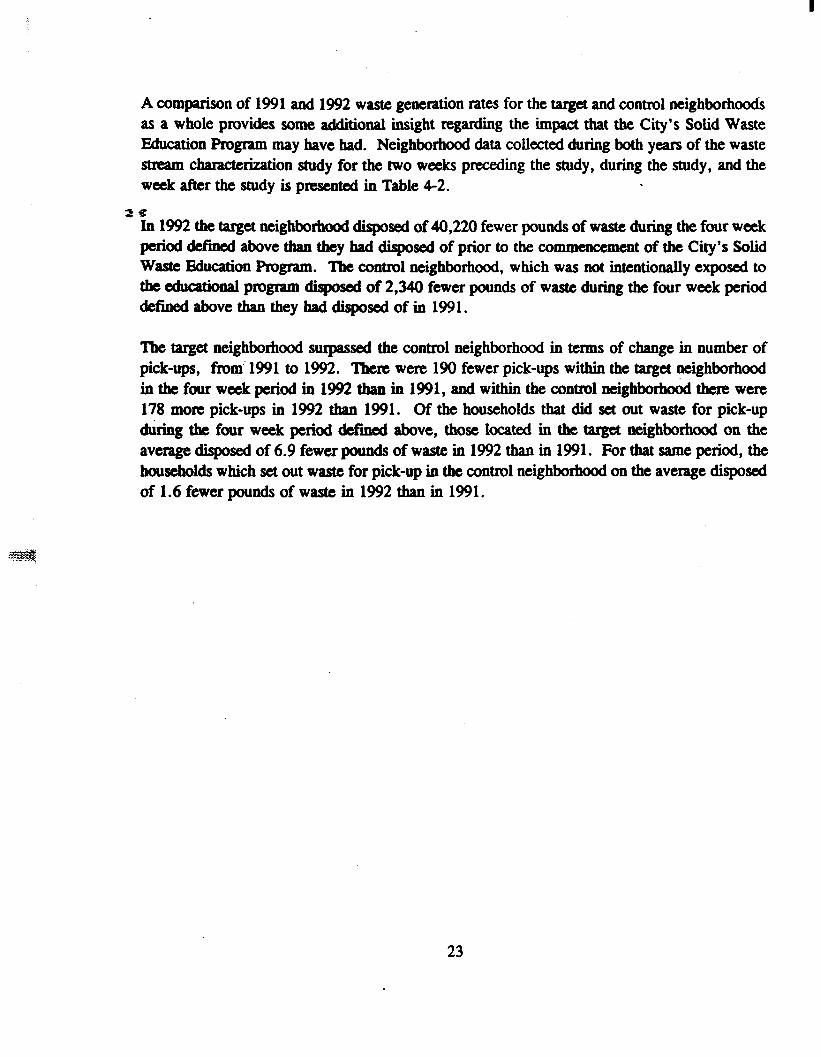
A comparison of 1991 and 1992 waste generation tates for the target and control neighborhoods as a whole provides some additional insight regarding the impact that the City’s Solid Waste Education Program may have had. Neighborhood data collected during both years of the waste stream chatactetization study for the two weeks preceding the study, during the study, and the week after the study is presented in Table 4-2. .
zs In 1992 the target neighborhood disposed of 40,220 fewer pounds of waste duting the four week period defined above than they had disposed of prior to the co mmencement of the City’s Solid %ste Education Program. The control neighborhood, which was not intentionally exposed to the educational program diqosed of 2,340 fewer pounds of waste during the four week period defked above than they had disposed of in 1991.
‘Ibe target neighborhood surpassed the control neighborhood in terms of change in number of pick-ups, from’ 1991 to 1992. Tkere were 190 fewer pick-ups within the target neighborhood in the four week period in 1992 than in 1991, and within the control neighborhood there were 178 more pick-ups in 1992 than 1991. Of the households that did set out waste for pick-up during the four week period defined above, those located in the target neighborhood on the average disposed of 6.9 fewer pounds of waste in 1992 than in 1991. For that same period, the households which set out waste for pick-up in the control neighborhood on the average disposed of 1.6 fewer pounds of waste in 1992 than in 1991.
23


section 5 Conclu!sions
The data collected during the 1992 residential waste steam characterization study has now been analyzed and compared with the 1991 baseline disposal indices. If changes in tbe Target and
’ %ontrol Group’s composite totals for households are compared by both component weights and waste stream percentages it is obvious that changes have occurxd which have influenced the disposal of waste (see Table l-l). However if the changes in the residential solid waste generation rates of the target and control neighborhoods for a one month’s duration of time are looked at, the differences between the two groups is even more striking.
Table 4-2 presents a ,broader view of the two neighborhoods which have been the focus of this waste stream characterization study. All of the data presented in this table wete gathered from scale house mmds which ate kept by the City of Greensboro. The dil%etences between the quantities of waste generated by the target neighborhood as well as the number of collections the households in this neighborhood required in the month of March 1992 when compared with that of 1991 is quite obvious. The control neighborhood, which was initially thought of as beiig similar to the target neighborhood in several respects, experienced a relatively insignificant decrease in the amount of waste generated in 1992 when compared to that of 1991, and a relatively significant increase in the number of collections required by households during this same period.
The inclusion of a Control Group in the waste stream characterization project provided baseline data which was of great importance in evaluating residential waste generation habits and the impact of the source reduction educational programs on solid waste chamcteristics and generation rates. Assuming that the initial evaluation of the control neighborhood with respect to its socio- economic similarities to the target neighborhood was correct, one would have expected that changes seen in the Target Group’s waste stream between 1991 and 1992 would have also occurred in the Control Group’s waste stream over the same period of time. In further support of this theory was the fact that the initial and final waste stream characterization study of the Target and Control Groups’ waste s&earns was conducted following a 12 month interval of time, and analysis of the Target and Control Groups’ waste streams were conducted simultaneously in 1991 and again in 1992. Thus, variations due to seasonal differences associated with the timing of the initial and final waste stream characterization studies were eliminated as a possible extraneous factor infhrencing the characteristics of the waste streams. Despite the expectation that the Target Group data collected in 1991 compared to that collected in 1992 would mirror the image of the Control Group data collected in 1991 and 1992, the results of the Waste Stream Characterization Project reveal the following facts:
25

. . . _^ . . . E ? z z x z z z
_ . . -_1- .
l T h e n u m b e r o f p o u n d s o f was te g e n e r a te d o n a week ly bas is by Ta rge t G roup househo lds was signi f icant ly r educed fo l low ing th e conc lus ion o f th e City’s S o l id W a s te S o u r c e R e d u c tio n E d u c a tio n P r o g r a m .
0 T h e n u m b e r o f p o u n d s o f was te g e n e r a te d o n a m o n th ly bas is by -househo lds 2s located in th e ta rge t n e i g h b o r h o o d was signi f icant ly r educed fo l low ing th e
conc lus ion o f th e City’s S o l id W a s te S o u r c e R e d u c tio n E d u c a tio n P r o g r a m .
a T h e d a ta col lected m g a r d i n g th e charac terist ics o f was tes g e n e r a te d o n a week ly basi i by Ta rge t G roup househo lds show a signi f icant reduc tio n in each o f th e ca tegor ies ta rge te d fo r source reduc tio n , excep t O the r F o o d W a s te , du r ing th e City’s S o l id W a s te S o u r c e R e d u c tio n E d u c a tio n P r o g r a m .
l T h e d a ta col lected rega rd ing th e charac terist ics o f was tes g e n e r a te d o n a week ly bas is by Ta rge t G roup househo lds show a signi f icant reduc tio n in f ive o f th e seven was te ca tegor ies wh ich a re accep te d fo r recyc l ing in th e City fo l low ing th e conc lus ion o f the i r S o l id W a s te S o u r c e R e d u c tio n E d u c a tio n P r o g r a m .
It is diff icult to a ttr ibute th e changes in th e charac terist ics seen in th e was te s t reams u n d e r study to o n e specif ic cause wi thout fu r the r research . Y e t g iven th e d a ta col lected du r ing th e two weeks o f was te s t ream charac ter izat ions, it appea rs th a t th e City’s source reduc tio n p r o m o tiona l ac tivities h a d th e des i red impac t o f reduc ing th e g e n e r a tio n o f res iden tia l so l id was te a n d shou ld b e inc luded a m o n g th e poss ib le exp lana tions fo r th e changes seen in th e Ta rge t G roup’s was te st ream.
2 6

Attachment 2 Definition of Waste Stream Characterization Study Categories
PAPER
Disposable Paper: Paper products which are either marketed as being disposable (diapers, 2 t towels and tissues, tableware) or are placed in the waste stream after being used once for a
limited period of time (any paper bags, coffee filters, single serving or convenience food cartons).
Recyclabk Paperz Paper products which are recyclable: newsprint, corrugated cardboard, or telephone books.
Junk Maii Any mail or advertisement magazines found in the waste stream.
Other Paper: Other paper includes books and magazines, waxed paperboard, and any other paper items found in the waste stream which are not listed in the previously mentioned components.
GLASS Recyclable Glass: Any clear, green, or brown glass containers which are recyclable.
Other Glass: This component category consists of glass such as mirror, window or auto glass, eye glasses, television screens or cooking ware.
METALS
Recyclable Ferrous: Any steel or bi-metal containers to which a magnet will adhere.
Recyclable Aluminum: Any aluminum soft drink or beer cans and aluminum foil to which a magnet will not adhere.-
Other Metal: Any other items whose volume consists of at least 75% metal.
PLASTICS
Disposable Plastics: Any item which is made of at least 75% plastic and is marketed as being disposable (tableware, razors, pens) or is placed in the waste stream after being used once for a limited period of time (all plastic bags, single serving or convenience food cartons).
Recyclable Plastic: Plastic products which are recyclable: Milk jugs, soda bottles, and detergent bottles.
Other Plastics: Other plastics includes packaging materials and any other plastic item not plastic items found in the waste stream which are not listed in the previously mentioned components.

Attachment 3 Noquaihed Item&s of the 1992 Target Group
W& Stmam Characterization Study
D- ?A?BR 369.6 9.7
412.1
EEY 150.2 3.9
4813 UI @*;I; ::,: :. ‘. : tf
906.4 9.S
1136.7 11.7
E&l 313.2 3.1
llR3 12.2
%s.o’- %A
542.5 5.b
m
10.2 ii : . . .: ” _ SF ;:;:.;; ;. .:: .;;
161.6 27%
929 1.6%
197.0 3.3%
,:: u1.5-). :. 7.6%
7s.9 20
36.7 1.0 EB 1.0 1,’ 1: ,‘.*;4
&j -3.2
53.4 1.4
t.
113.7 3.0 20i;+..: . . . . . .
310.7 3.2% =I+ .::.. :7q 0.5
46.0 aL5
lR8 1.8
EB 296.9 1.1
m3.7 21
681.1 7.0
OTllE&LWMT% I I 6u.J 1 11.2%
l wEJoHTsARBD4KwNDa “DATA U NoRI(AttcBD fo RFFLEr7AuDwAsIFwxsRmmmm 18% OP TllB WASTE aTam%

Attachment 4 NormaIked Results of the 14M Control Group
Waste Stream Characterization Study
. .
I1 O.S%l
I I <I
11.0% 9.2
**DATA U NoRwALepD TO RBpLEer 7AILD Wm A8 w 18% OF TsiE WASTE SrmAM
n.1 o-3’ 69.4 0.8’
a3.2 21’
E 2m.7 27
347.9 2.1
553.6 4.9’
6.2 0.1
40.8 0.4
I lM.7 I 10.4’
-1

Attachment6 Target Group Waste Generation Rates for March 30 - April 3, B92

-7 Control Group Waste Generation Rates for March 30 - April 3,l992
I I r I

AttachmeJlt 1
Waste Stream Characterization Projet
City of Greensboro, North Carolina
Interim Report
April 1991
Prepared by
HDR Engineering, Inc. Charlotte, North Carolina

Attachment 2 Target Neighborhood Waste Generation Rates for March 1991

8
Attachment 3 Control Neighborhood Waste Generation Rates for March 1991
. ;
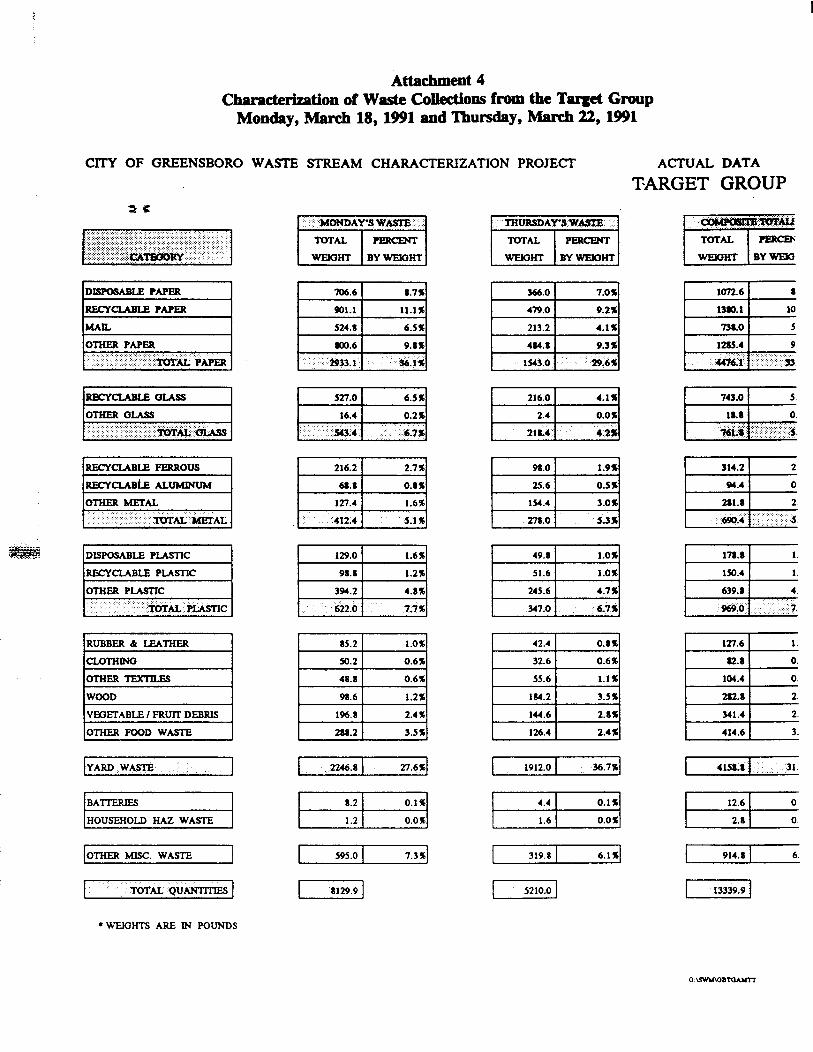
Attachment 4 Characterization of Waste Collections from the Targ& Group
Monday, March l&l991 and Thursday, March 22,l991
ClTY OF GREENSBORO WASTE STREAM CHARACTERIZATION PROJECT ACTUAL DATA
TARGET GROUP
DEPOSABLE WPER I
366.0 1.0%
479.0 9.2%
213.2 4.1%
494.1 9.3%
1543.0 W.61
REc!YcIABLE PAPER
OmER PAPER ,_.... :.::: ../. .,....
. . .: .j ‘.. : ..: %::ma pApER
IRECYCUBLE oL.Ass I I 527.0 I 6.5d I 216.0 I 4.1rl
OTHER GLASS ‘:?: ‘.:.::.:I-;;~
,, .:..
16.4 0.2%
343.4 :6.7%
RECYCLABLE FERROUS
REcYaABLE Al.uMlNuM
OTHER METAL
, :. +iYrAL~itnrrAL
216.2 2.7%
68.8 0.8%
127.4 1.6%
412.4 5.1%
in.8 1.
150.4 1.
639.8 4.
969.0 i : 7.
1 127.6 1 1. I 42.4 1 0.8%
I 32.6 1 0.6%1 I 82.8 I 0.
I 104.4 I 0.
I 282.8 I 2.
I . 48.8 I 0.6%1 I 55.6 1 1.14
I 98.6 1.2% I 184.2 I 3.5al
I 196.8 I 2.4’161 I lU.6 i 2.8%1 I 341.4 I 2
I 414.6 1 3. I 288.2 1 3.5al I 126.4 I 2.4161
YARD WASTE I
EJ
OTHER Misc. WASTE I
I TOTAL OUANTlTES 1
I 2246.8 2l.61
-1 595.0 7.3%
1 19lZO 36.1%
-1 I 319.8 6.1%
I rlzat 31.
pg=z
I 9i4.a I 6.
f] 1 1129.9 1 I 13339.9 I
*WElOHTS ARE LN POUNDS

Attachment 5 Cham&hation of Waste Colktions from the Control Group
Monday, March 18,1!Bl and ‘Ihmday, March 22,1991
:ITY OF GREENSBORO
BcYclABL.E PERROUS ECYCLABLE ALUMINUM
THER METAL
.. -koTAL METAL
ARD WASTE
THEB MISC. WASTE
TOTAL QUMTlTESS
‘WEIGHTS ARE IN POUNDS
WASTE STREAM CHARACTERIZATION PROJECT
174.2 2.6%
52.6 o.ax
134.6 2.0%
-361.4 5.4%
ii9.a 1.8%
9a.6 1.5%
311.6 4.ax
537.0 20%
327.2 6.1%
603.a 11.2%
334.a 6.2%
563.3 10.4%
.iti.i s3.9s
I 305.2 1 5.7%1
23.11
I 1660~1 30.8%
Fg=g
I 4a1.0 a.98
ACTUAL DATA
CONTROL GROUP
229.2 1.9%
172.6 1.4%
464.3 4.0% #j m
i
219.6 1.8%
300.6 25%
305.4 2.5%
422.2 3.5%
m57.7.t :.zLax
i2ia.4 10.1%
I m9a.l~

Attachment 6 Nomalized Waste Cokcthn RemIts for the Target Group
Monday, March 18,19!H and Thursday, March 22,1991
CITY OF GREENSBORO WASTE STREAM CHARACTERIZATION PROJECT NORMALIZED DATA
TARGET GROUP
178.) 1
150.4 1 639.6 ‘
969.of 1
98.0 2.3%
25.6 0.6%
154.4 3.7%
278.0 : &6X
I 319.8 7.6%
5;::: :.:::::ij:.:.: ..: .::.. ,. .C’ . . . . ..i . . . . . :‘:::::.:.x.: :.:.: ‘..:.:::::.:c..:.:..:. ;;“:: ~~~
.:.:.‘.‘:‘:I:::..~--::: 1:;:; m m ‘... .::;:xy-“:
I 706.6 1 lO.l%l
lMNL I
Ej <: ..: .:;::y:. ..:., ,‘, y: . . .: .,.,” ... I -527.01 7.6%1
16.4 0.2%
$43.4 .?.l%
216.2 3.1%
68.1 1.0%
127.4 1.8%
. . -412.4 5;9x
hBcYcL4BLB FERROUS I
I 129.0 I Id
I 9a.t I 1.4nl
IRUBBER 6r LEUHER I
lcLoTHlN0 I
IOTHERTFiXTUS I
IWOOD I
hE.OETABLE I FRUIT DEBRIS I
IOTHER FOOD WASTE I
I 1090.4 15.6%
a.2 I O.l%l I 1.2 I o.oxl
I 595.0 tl.5%
r--iq
riizk MISC. WAa I
I TOTAL QUrn
l WEKiHTSARElNFOUNDS l * DATA IS NORMAJJZED TO FEFLECT ‘YARD WASTE’ AS REPRESEITI’IN~ 18% OF THE WASTE STREAM

Attachment 7 Normabed Waste Collection Results for the Control Group
Monday, IMarch 18,199l and Thulsday, March 22,1991 CITY OF GREENSBORO WASTE STREAM CHARACTERUATION PROJECT
D-L.E PLASTIC .. .*-_ _ .-m ..” . . . . . . . -. RECYCLABLE p-=
OTHER PLASTIC :.:.‘:::::.:.:‘...:.:..:.:.::.::.~~~,p~~~ .,., :_ ,.,. > : . . . . . . : .. . . . .:.; . . . . .. 1
OTHER MISC. WASTE I
I TOTAL QIJ-
‘WEIOHTBAREINPOUNDS
174.2 2.7%
52.6 0.8%
134.6 2.1%
: -361.4 5.6%
I 305.2 I 6.1X1
I 23.8 I O.J%l
I 329.0 1 6.6%
I 119.a I 1.9x1
I 93.6 f 1.5al
I 109.4 I 2.2nl
I 74.0 I 1.5x1
1 k16.0 12.7%
I 6.2 1 O.I%l I 3.6 1 O.I%l
I 15.0 I O.Z%l I 5.2 1 0.1’161
1 737.4 11.5%
r---zY]
I 481.0 9.1%
l---zq
NORMALIZED DATA CONTROL GROUP
I 1218.4 10.7 I
l * DATA IS NORMALIZED TO - ‘YARD WASTE” AS REPRESENTIN 13% OF THE WASTE STRUM

I
tP
4 au
t I
w 5 3 P 7 Y e
\- >
\ \ \
3 . F
Y
;;
< .- U
? F
5; . i c i

The Three R’s Revisited Remember the famous three R’s we
’ leaned in school: Reading, wRiting and aRithmetic? Well now there’s a new set ofthreeR’sandtheytcpresentword.sthat actually begin with the letter. If you are familiar with the environmental move- ment you probably already know what they are: Reduce. Reuse. Recycle. The order of these three R’s is very important
Each of these three R’s represents a way in which to manage the growing solid waste (garbage) crisis in Greensboro and other cities across the country. The Solid Waste Reduction Education Program that you and your neighbors are a part of focuses on the first of the three R’s - Reduce.Let’stakeacloserlookateachof these three R’s and try to better under- stand their meaning and relationship with one another in managing solid waste in our community.
R educe - Also called waste reduc- tion, waste minimization and source re- duction, this method of managing solid waste does not simply mean to compress it into a smaller amount. It means to actually eliminate an amount of solid waste that otherwise would have been produced. Waste reduction is sometimes called source reduction because it must occur at the source whether in the home, at work, in a public building or any place where waste is prcxluced. Source reduc- tion of waste actually prevents waste pro- duction and therefore means we don’t have to manage it at all.
One example of waste reduction is stop- ping junk mail from coming to your home (did you take advantage of that opportu- nity?). Another is leaving your grass clippings on the lawn instead of bagging them and putting them in your garbage can (We’ll discuss this at length in a future issue). The beauty of waste re- duction is that it has a double impact on solving the solid waste crisis. First it
actually eliminates garbage and, second, it means we don’t have to think of some other way to manage that material. This allows us to concenaate on impartant materials that can’t be reduced. Reduc- tion is the first and most important of the new three R’s.
R euse - Reusing a part of the solid waste we might otherwise throw away can be accomplished in two ways. The material or item may be reused as is. therefore extending its useful life or it may somehow be changed to another material. The first way of reusing is what we do when we donate or sell clothing to other people; for example, giving a box of clothing or toys to a local charitable organization or having a yard sale in which you sell old mcords and comic books that you would otherwise throw away. The second way of reusing is what we do when we compost leaves, grass clippings and food waste. When we com- post these materials, wechange them into another useful material but we do not eliminate them. In both casts though, they have been diverted from the landfill and that is important.
R ecycle - This is the tern that we have all heard about Whatrecycling does is take a material that would otherwise go into the landfill and give it a new identity altogether. Sometimes the form of the material may change as in some plastics recycling and other times the material may return to its original form such as in glass bottle recycling. There are several materials presently recycled in Greens- boro. The City operates drop-off recy- cling centers and is testing curbside re- cycling. Chances are that you have taken materials somewhere to be recycled.
So how are all of these solid waste man- agement strategies related? As you recall
(See Three R’s on page 2)
Printed on Recycled Paper
\nd What Did You Say? be results are in from the survey that Lu-olina Evaluation and Research con- ucted in June. Again, thank you for your elp, for your thoughts, and for your me. What you have to say is very impor- mt to us, allowing us to have a greater n&Handing and to help you learn about te issues. Carolina Evaluation and Re- earth sentout918surveysandreceived 46 back. That is great!
Vho are you - that is, what do we know bout you and your neighbors fmm the tiormation you gave? We know that ach household has an average of 2.48 eople living in it We learned that 63% ‘ftheheadofthehousehavesomehigher ducation, either college or technical chool. We also found out that 75% of ouaremarriedand2496areeitherretired r do not work. This information is im- ortant in help us relate your under- tandingandknowledgewithothergtoups rithin our community. It also helps us elate certain activities or behaviors di- xtly to factors that explain those ac- ions. For instance, the size of the family iredy impacts the number of specific ems we find in the garbage.
n the survey, you were asked to rank ight problems identified throughout the ommunity as important issues. We mted to know what you feel is the most nportant issue. You placed crime and
(See What You Said on page 3)
1. Crime & drugs L 2. Quality of education 3. Spread of AIDS 4. Increasing cost of municipal
services 5. Deteriorating physical
environment 6. Low income bousing 7. Race relations 8. Day care center funding
How you and your neighbors r&the importance of eighl problem.

2
Junk Mail - Some Advice From the Cop Have you ever misplaced that important piece of mail, only to find tht it ended up in the garbage with the piles of junk mail you received that&y? Sound impossible? We’ve heard from citizens who wanted to search a garbage truck for that missed items something so important that they would be willing to rip open bags in tons ofgarbage,justtorecoverthelostmat&al. Too much unwanted mail can result in such a mishap.
Your commitment to action is a must if you want to eliminate most of your un- wanted mail. It takes more action than just sending in the Stopper. Organiza- tions you belong to, businesses you have credit with, banks you do business with and other organizations such as the De- partment of Motor Vehicles, raise money by selling your name and address to other businesses and to brokers of mailing lists. To ensure that every step is made to reduce this unwanttxl mail you should do the following:
lishers, mail order businesses, etc.).
3. When you receive unwanted mail, open it up and if there is an envelope with postage paid, write a note to the business asking them to take your name off their mailinglistandsentitbakintheenvelope they sent to you. Attach to your note the mailing label they used on their material so that they can delete your name ux- rectly. If you receive multiple mailings from the same business because they spelled your name differently or used initials rather than you full name, send back a sample of each mailing label. They wont search their files for multiple listings unless you point it out to them.
Last issue we provided you with a post- age paid card to mail to the Direct Mar- keting Association offices in New York to request that your name be removed from the lists that are sold through bro- kers to firms that want to advertise, raise funds, or sell directly to you. (Did you send that card in?) We received many inquiries regarding the junk mail issue. The response you gave on the survey in June regarding junk mail (see related article in this issue)ovenvhelmingly sug- gests that most of you desire to eliminate all the unneuxsaty junk mail delivered to your homes.
1. When entering into a new relation- ship with a business, tell them in writing that you do not want them to sell your name and address to anyone (don’t forget any charity you may support; they also sell your name and address).
2. In cases of existingrelationships with companies, you need to write a brief letter to them telling them to take your name off any list they may sell (banks, credit card companies, magazine pub-
As you can see, it takes effort to eliminate the mail you don’t want to receive. It will take several months to begin to see a change in the volume of unwanted mail. But,theeffortis worthit.Youmustbeon your guard all the time. Take action and put an end to those ‘junk mail blues’. Remember - give us a call at 373-2196 if you need another Stopper Card
Three R’s l?omthefirstissueofAdventuresinTrash, we stated that the problem we all face is that we are producing more and more tmsh for our landfills. And nobody wants a new landfill in their backyard. So the solution is to send less trash to the land- fills we presently have. We can accom- plish that by using the three R’s in the order that they are listed. But first let’s get an understanding of how much trash we’re throwing away.
According to results of the survey that we conducted in June, most people under- estimate the amount of garbage they produce. More than 44% of survey re- spondents feel they produce 20 to 30 lbs. of garbage a week, 3 1% feel they produce 30 to 40 lbs., 16.5% think they produce 40 to 50 lbs. and 8% think they produce more than 50 lbs. During the month of March, HDR Engineering sorted through the waste from your homes and calcu- lated that each household produced, on average, 45.5 lbs. per week That means that 75% percent of you underestimated the average amount of waste produced per household. Of course, individual garbage production rates will vary de-
pending on family size, but as a general rule we all think we produce less than we actually do. The bright side of this news is that it gives us more opportunity for reduction than originally thought. In fact, if you reduce just one pound a day from your household, 7 pounds a week from each home, we could reduce about 334,000 pounds of garbage a year from your 9 18 homes. Only one pound a day; 16 little ounces! Think about ways you can do this and give us your ideas.
As stated above, the reason that we want to reduce waste first is because it imme- diately eliminates having to manage it in another way. What can’t be reduced should then be reused. Lastly, what Can’t be reduced or reused should be recycled, if there is a buyer in our community. What we must understand is that recy- cling will not take care of all of our solid waste problems. Results from the survey, however, indicate that this is a common misperception. When asked what you thought was the reason for the nation’s garbage disposal problem, 22% of you stated that it was because of the lack of recycling programs. On the other hand, 17.5% of you did respond that too much garbage generated was the chief reason
for our garbage woes. Another signifi- cant finding in the survey is what options you feel will help to avoid future in- creases in the cost of garbage disposal. Almost 95% of you feel that recycling will have some or a considerable effect on avoiding future cost increases. Waste reduction was chosen by 85% of you to have some or a considerable effect. ‘Ihis clearly reveals a perception that recy- cling costs less than current disposal methods. Unfortunately, that is seldom true. If we assume recycling is theanswer tooursolidwasteproblemitmayactually make things worse by encouraging the production of more recyclable materials than manufacturers can use. And re- gardless of how recyclable a material is, if it can’t be processed and turned into a useful product and sold, it will end up in the landfill anyway.
The new thrtx R’s are your key to helping us solve the solid waste crisis locally. During the remainder of this program let’s focus on the most important of these - Reduce. The information in future issues of Adventures in Trash will provide you with valuable tips on how to solve a problem and clean up our environment.

3
What You Said One way to Ret some lasting reduction 1 Block Leaders drugs as number one. The table on page 1 shows how you ranked all of the issues. As you can see, these issues are important and deciding how to solve the problems and where to spend the limited dollars available is difficult. All eight need the attention of the ovemments, thebusiness community, d Civic orgnizations and individuals. Knowing what you think helps us understand better what we need todo.
results is to eliminate junk mail. Did you WewekxuneindividualstobecomeBlock know that is is 5% of the total garbage Leaders. Volunteer a few hours each you throw away? We asked you about monthass&ingstaffincoordinatingwaste junk mail in your homes and the follow- reduction progmms. Call 373-2787 or ing charts represent your responses. I 272-2167. - -
6 - 10 pieces -- 1-2pieces
It is very important that you and our staff know how much garbage you throw away and what it is made of. what kind of things are ‘trash’. This helps us plan services and educational materials. Do you know how much you throw away? If not, be sure to read the article entitled The Three R’s Revisited on the frost page. The chart below shows you of what your trash is made. A quick glance at the two biggest sections of the pie give you an indication of why we will be targetting paper and yard waste in this program.
5516%
How much junk mail do you get daily?
Food Metal Waste 5.2%
When asked the question, do you want to stop junk mail coming to your house?, 77% of the respondents answered yes. Of . those 77% who want to stop junk mail, only 26% stated that they knew how. It appears that most of you defi- ta nice& want to do son&thing about this material. We have ideas on how to help. If you read last month’s Ad- ventures in Trash, you Q\
I
I.-13 I learned one way to deal with the junk mail issue. But the story does not end there. See the article on junk mail in this issue to i
per 6%
Yard waste 31.2%
What ic in your travh.
Host Homes Needed Would you like to volunteer to host a small neighborhhod meeting in your home? Our staff will provide refresh- ments and a program on waste reduction. If you’re interested please give us a call at 373-2787 or 373-2167.
learn what more you can do to stop that junk mail!
” rtop jimk hOU.W?
mail from
/
6 ,Znuitatio A get acquainted meeting to discuss waste reduction and in particular, packaging and disposables, will be held October 28th at 7:15 p.m. in the Lewis Recreation Center. Lewis Recreation Center is near the Pisgah Church Road entrance to Country Park. To get to Lewis Recreation, turn off of Battleground Avenue onto Pisgah Church Road then take the first street to the left. Lewis Recre- ation Center will be on your left at the comer of Jaycee Park Drive and Forest Lawn Drive. Hope to meet you there!

October 1991 -, . . _-..-
A Monthly Newsletter on Waste Reduction . Number 3
Did You Know...
Come join us and meet the staff and let’s discuss waste reduction in your community. Monday night, October 28 at 7:15 p.m. at the Lewis Recreation Center just off Pisgah Church Road.
It’s a fact!!!
Packaging accounts for about 32% of all solid waste discards. It accounts for lo-15%, sometimes 50% of product cost!
Come join us Monday night and let’s discuss this issue.
A Recent survey conducted by American Opinion Research indicates that few people know the meaning of environmental symbols or terms. Out of 1 ,OMl people surveyed 80% don’t know what is meant by source reduction. (Hope- fully, we’ve gotten that message across to you!) Sixty percent were unfamiliar with the recycling symbol, three arrows chasing one another. Only 10% of the people surveyed could identify and describe a single environmental symbol according to the report
Host Homes Needed Would you like to volunteer to host a small neighborhood meeting in your home? Our staff will provide refresh- ments and a program on waste reduction. If you’re interested please give us a call at 373-2787 or 373-2167.
Printed on Recycled Paper

2
It’s a Fact!!! Effective January 1,1993, North Carolina Law bans yard waste from disposal into landfills except in landfills classified for such use. Yard waste includes material such as grass clippings, shrubbery and tree limb clippings, leaves, plant matter and landscape maintenance materials.
Compost Meeting On November 12,1991, we will be holding a class on Compost Construction. This program will be held at the Lewis Recreation Center from 7:15 - 9:oO p.m. Our discussion will involve proper con-
7% struction, materials to compost and plans for
B different types of bins. Please call Karen Neil1 or Marsha Clark at 375-5876 at the Cooperative Extension Service to register for this class.
Grasscycling - A Timesaving Alternative Are you tired of bagging your grass clippings; doesn’t it slow you down? For years we have had the luxury of just placing these bagged clippings on the curb to be taken away but after January 1993 state legislation will ban disposal of our yard waste in the public landfills. Do you have an ahemative plan?
Well, the North Carolina Cooperative Extension Service and Greensboro Beautiful have teamed up to launch a major campaign to teach you just what can be done with your yard waste. The two will announce the Grasscycling Lawn Care Plan next month.
The concept of Grasscycling involves returning grass clippings to the turf, not bagging them for LandtilI disposal. Grasscychng may also involve composting clippings. This grasscycling plan will conserve valuable landfill space and save homeowners time, money and labor. Look for coming articles to see how you can participate.

3
Don’t Trash ‘em, Compost ‘em Written by Karen Neill Every year hundreds of thousands of people dutifully rake their lawns, sack up their leaves and set the sacks by the curb for the gar- bagetn&Theaveragelawn can fill up to 16 bags raking andatjhat ra you canquicfly~e why landfill space is be- coming so scarce. What are the alternatives to putting leaves out with thetrash?Putthemto use asamulchorinthe decomposed form as compost for amending the soil.
- over them wi& the grass catcher bag anached. You wouldn’t even have
to rake them as long as you are mowing them before they get
too thick. Unlike whole leaves, shredded leaves won’t blow
away or wad up intoclumps when wet Shreddedleaves
also break down more
shredded leaves on all garden beds and under all shrubs for
Leaves make an excel- lent mulch fortheplantings on yourprop will settle down to three or four inches. erty. Spread on the soil over plant roots, By next fall, when the next batch of mulch conserves water, prevents weeds leaves is about to fall, the previous mulch and moderates fluctuating temperatures will have decomposed, making room for that disturb roots. You might want to another four to six inches of leaves. shred your leaves first Simply rake them into low piles and run the lawn mower Shredded leaves can also be turned into
great compost. This is the most versatile leaf product of all. By using compost you return organic matter to the soil in a usable form. Organic material in the soil improvespIantgrowthbylooseoingheavy clays, thus auowing better mot penetra- tion. It also improves the sandy soils capacity to hold water and nutrients and adds essential nutrients to any soils. This material is a rich, natural humus that results from the decomposition of such organic materials such as leaves, grass clippings and kitchen scraps, including vegetable and fruit peels if properly in- wrporated. A ‘passive’ compost pile, one that doesn’t need turning, can be made from only chopped leaves. It will slowly decompose in about two years.
Composting leaves and other yard waste isagre.atwastemductiontf&nique.Ifyou areinterestedinbuildingacompost,please read the article below. If you still have questions, call Karen Neill or the Master Gardener at the Guilford County Coop erative Extension Service at 375-5876.
The Basics of Cornposting Written by Karen Neil1
Composting occurs when air and water 4. Your third layer will consist of a 1 6. Now repeat steps 3 - 5 until the bin are mixed with a sufficient volume of inch layer of soil. This servesasan inocu- is almost full. A properly made heap will organic matter. To make a compost pile lant by adding microorganisms to the reach temperatures of 140 to 160 degrees that will decompose quickly, you will heapThis layer will help speed the com- in four to five days. At this time, you will want to follow these recommended steps. posting process. notice the pile settling, a good sign that
your heap is working properly. 1. First, construct some type of bin to 5. The fourth layer is a handful of com- hold theorganic material. This bin should mercial fertilizer to provide the nitrogen After three to four weeks, fork the mate- be 4 feet high by 4 feet wide. needed by these microorganisms. If you rial, turning the outside of the heap into
prefeito go completely organic, you can the center of the pile. If you turn the pile 2. Nextputa3to4inchlayerofchopped add a 2 to 3 inch layer of manure at this more often, compost can be made even brush or other coarse material on top of time instead. faster. By following these procedures, a the soil surface to allow air cir- heap started this culation around the base fall will be ready of the heap. for use next
spring. 3. Now you are ready to start putting in your gathered materi- als. Make this layer 6 to 8 inches deep. Water this layer so that material
‘sponge
If you have spe- cific questions about building a compost, call Karen Neil1 or the Master Gardener
at the Guilford County Cooperative
Extension Service at 375-

t
Mark you calendars. October 28 & November 12. Lewis Recreation Center. Hope to meet you there.
This newsletter is published by the City of Greensboro Environmental F?qrarns Division. We can be reached at 373-2787 or 373-2167.

Dear Sir/Madam:
I am a citizen concerned about the amount of waste paper going into our landfills and do not wish to receive any more direct mail. Please remove the following name(s) from your direct mail preference list. Thank you.
Name
Name
Name The Junk Mail stopper cop
Address
City/State Zip
Signed

I City of Greensboro
Solid Waste Management Division Junk Mail-Stopper
Are you tired of getting a lot of junk mail? Did you know that it costs the City of Creens- boro over $40,000 in tax money to dispose of 8,000 tons of junk mail from our homes each year? If the answer is yes to either question, then put the Jd MailStopper Cop to work for you! By filling out the reverse side and sending in the Junk Mail Stopper postcard below, you can significantly reduce the amount of direct (junk) mail you receive and we have to landfill. When you send in the Junk Mail Stopper your name will be registered on a delete file which is made available to other mail order and promotional companies. You may still get mail from local merchants and organizations that do not use direct mail services. Addi- tional name lines are provided for variations in your name that direct mail companies use. (e.g. John Henry Doe, John If. Doe, J. H. Doe, etc.) The postcard is postage paid so you do nof have to put Q stamp OR it to send it in! Simply tear off this top portion, fill out the postcard and put it in your mailbox. Putting the Junk Mail Stopper Cop to work will help to solve the garbage crisis and protect the environment in Greensboro.
Tear along dotted line _--_--__----------7--
1 POSTAGE HAS BEEN PAID BY ADDRESSEE 1
Mail Preference Service Direct Marketing Association 11 West 42nd Street PO. Box 3861 New York, NY 10163-3861
Recycled Paper

TARGET YOUR TRASH
Source Reduction Education Program
SOURCE REDUCTION, the primary waste management alternative as established by the State Legislature, is generally overlooked, with program emphasis placed on recycling activities. The purKose of recognizing this fact is not to discount the importance recycling plays in waste reduction but to focus attention on the need to implement ways to eliminate the creation of solid waste. If waste is not generated, the waste management costs, both tangible and intangible, for that waste is zero. Not only is the cost zero for the waste generator but for society as a whole.
All well and good. But how do you tackle this issue of waste avoidance or source reduction in a society surviving on a five minute fast food meal and prepackaged, individually wrapped, media-hyped, convenience shopping for everything from soup to stereos? Rather simply, you begin with what is in your trash cans. The method of solving any problem, regardless of context, is to clearly define the problem and that means getting to know what's in the trash you throw away each and every day.
A waste audit,, the way to get to know your trash, is not difficult to do but it is critical that it be done. It is one of the first steps in developing a successful source reduction program. The first three steps are: (1) Commitment; (2)
.L.;":.:!*. Ix__,... >- Selection of a team; and (3) Gathering backgrouncl information. The fourth step is conducting a waste audit. Commitment means having the support of the top management of your firm. Without this you will not have the support to create changes necessary to eliminate waste &items. Creating a team, a group representative of every department or organizational unit of your firm is important to ensure that no waste is overlooked and all ideas are considered. Before you seek to solve a problem you need to know as much about the components of the problem as you can. That means knowing where waste is generated, how "paper" flows throughout the organization, how inventory is maintained, who orders materials and supplies and what triggers such an order and other issues such as operating hours, seasonal changes, peak output days, who is responsible for collecting waste and who is responsible for disposing of it. Once you know as much as you can about how the organization brings in and how it creates waste, you are ready to conduct a waste audit.
A waste audit is a method of measuring the amount of waste l
generated by various categories of materials of which it is composed. (i.e., newspaper, magazines, computer paper, mixed office paper, production waste, inventory waste, food waste, plastics, wood waste, yard waste, metals, cardboard.) Depending of the size of your firm, this can be a fairly easy process. You need to identify all the materials, sort them out by those

categories, weigh them or measure them by volume and tally the totals, and project amounts by the month or by the year. W ith this information you can begin to identify ways to reduce the waste generated. You have a place to begin. If your firm is very large or has multiple locations and you believe you need assistance on conducting the audit, you have a number of alternatives. You can hire a firm that specializes in this
=vrvice; you can call the Office of Waste Reduction of the State at 919-571-4100; or you can participate in a local source reduction education program and gain the knowledge to help yourself.
The first two workshops have been held (May 22 and June 16). The third workshop will be held on July 22 at 8:30 a.m. at the Sheraton Hotel. The topic will be Waste Auditing and Reduction Programs, Some Practical Experience. If you are not on the mailing list to participate in this program, please call 373-2074 and talk to Elizabeth Treadway about getting involved.

TARGET YOUR TRASH
Waste Reduction Planning Tips
Last month we discussed the approach to initiating a source red=t=ion program within a business that begins with a commitment from management as expressed in a policy statement. After completion of a waste audit, you are ready to proceed. In June, an overview of the general implementation plan was discussed. For practical application, the following checklist is offered to assist you in developing a successful program. Some items may not Icfittt your particular setting but don't overlook anything. After reviewing the list, you may want to add an item and do so. You know your business better than anyone else. These are general activities that apply to a variety of waste types and will go a long way to meeting your waste reduction goals.
- Segregate all waste streams to reduce contamination of recoverable materials.
- Investigate waste exchange programs for both solid and hazardous waste.
- Establish quality assurance/quality control procedures to reduce the generation of rejected products-
- Replace disposable materials with reusable and recyclable materials.
- Investigate the use of returnable and/or recyclable containers and pallets.
- Identify specific waste materials that could be recycled either on-site or off-site.
- Provide employee training for source separation, reuse and any other reduction activities that will require a change in behavior.
- Establish an incentive program which encourages personnel to suggest changes which would reduce waste.
- Explore the use of recovery equipment for reducing hazardous waste in the form of sludges, solvents, acids, degreasers and other wastes. .
- Identify potential production changes which would improve efficiency.
- Investigate opportunities for product or ingredient substitution which would reduce the creation of hazardous waste.

- Purchase materials in bulk or larger containers, but purchase only what you need to avoid spoilage or obsolescence.
- Control inventory to reduce waste; rotate stock, using oldest purchases first.
2C - Invest in products and equipment that are durable, easily
repaired and/or recyclable.
- Ask vendors to minimize packaging, use recycled materials or use returnable packaging.
- Don't accept product samples from sales people if there is a chance that the samples will become a waste.
Tips for Small Businesses:
- Target one material for reduction when getting started.
- Work with neighboring businesses to share balers or dumpsters and other storage and collection containers.
- Initially focus on waste reduction ideas which require minimal capital investment.
- Involve all employees in planning and implementation.
Source reduction programs are successful when the plan addresses all elements of your organization and is developed after gaining a full understanding of how materials and supplies enter the business, how they are consumed or utilized in the business activities, and how that are transformed into a waste by-product. The planning tips given above help in developing the waste reduction ideas that will result in an acceptable and successful program for your business.
Our next Waste Reduction workshop will be on August 26 at the Sheraton Hotel on Greene Street at 8:45 a.m. The topic will be, "Buy Recycled, Buy Reusable: Businesses Role in Closing the Loop." Call Elizabeth Treadway (373-2074) for further information.

TARGET YOUR TRASH
Buy Recycled - Buy Reusable
Over the past several months in this column, we have discussed issues-of waste reduction such as doing a waste audit and star&kg a waste reduction program. Remember, reduce the amount of waste generated in your business first. That is the priority. But in addition, business must respond to the need to close the loop in waste reduction by utilizing purchasing power to stimulate the market for reusable and recycled products and supplies. Again, commitment must start at the top. There is a perception that l'recycled@' products cost more than virgin material products. Pricing is affected by the supply of clean recycled material, the cost of raw materials, and demand for the finished product. Basic Economic 101 - supply and demand drives the market place and therefore, the pricing.
How can you overcome some differences? Use preferential purchasing by setting a price differential that you are willing to pay. Set-aside a specific amount for purchasing, meeting a predetermined goal. Issue dual track bids, allowing bids from vendor offering recycled products and those offering virgin material products. This assist in comparison buying and sets the stage for open competition. Make a commitment and establish a positive policy that sends a clear message to manufacturers to invest in recycling equipment and that provides for competition in the market place.
Phase in your program. Establish a regular dialogue with your suppliers that sets the stage for a growing involvement in the purchase of reusable or recycled products. Look beyond the usual material list for recycled products such as paper items and seek out information on the availability of recycled/reusable items from suppliers of other products. Make your commitment known to all vendors that you are looking for opportunities to get involved.
Promote your program internally. Let your staff know what you expect from your program and ask for their ideas in getting started or in expanding opportunities. When you use recycled products or materials for your own products, announce your activity. "Printed on Recycled Paper" is used routinely now to alert the reader that the recycling loop has been closed by your action to buy and use recycled paper. Again, promote you action to your vendors. If they want your business, tell them what they must do to provide you with an increasing variety of recycled materials or products. Do your homework within your industry and find out what others are doing. Conduct annual program reviews to determine what is being done to involve your organization in buying reusable/recycled products.

Sources are available to assist your business in finding out how to get involved. The following are recommended :
National Buy Recycled Campaign The U.S. Conference of Mayors 1620 Eye Street, N.W. Washington, DC 20006
3C "Recycled Products Guide" American Recycling Market, Inc. P.O. Box 577 Ogdensburg, NY 13669
SWICH Solid Waste Information Clearinghouse P.O. Box 7219 Silver Spring, MD 29010
National Recycling Coalition 1101 30th St. N.W. Washington, DC 20007
WORKSHOP UPDATE: The Business Waste Reduction Education Program workshops have covered topics of how to conduct a waste audit, how to establish a waste reduction program and how to get involved in closing the loop. The next workshop will be on September 18 at the Sheraton Hotel - Downtown, at 8:45 a.m. on the topic of "The Full Cost of Waste Management." If you are interested in attending, please call Elizabeth Treadway, 373-2074, City of Greensboro.

TARGET YOUR TRASH
DO You Know Where Your Dollars Go?
Information gathered from the solid waste survey completed by Cham@r members last year, indicates that most businesses are not fully aware of the impact of regulations and technology on the cost of solid waste management. Almost 60% of the respondents indicated that the cost of waste disposal would not increase by more than the inflation rate. Costs can be defined at actual cash flow out of your business for services provided by various organizations but it can also be measured as an ttopportunityt' cost or hidden cost, found in internal practices that are creating waste.
Community-wide costs for solid waste management are found in two major areas. One is the actual costs incurred by the City of Greensboro for providing the collection services as well as the disposal services (cornposting, landfilling and recycling). Over the past 12 years, the cost of operation in real dollars has grown from $3.7 million to $15.6 million. Over that time period we have added new services, expanded service to include more homes and businesses, and imposed economies through automation. (For example, salaries for collection crews increased by $113,000 from 1984 to 1990, a six year period; in the period 1981 to 1984 those salaries increased by $350,000. The difference is growth
. .c -L..."i. is clearly attributed to the automated system.) 3zFxP-'T -.e" ..xk,
We have added new programs in the 1992 budget year that have had the greatest impact in the total cost of solid waste services to the community. These are for recycling and yard waste collection and cornposting. And they are being provided in direct response to mandates from the Federal and State governments. Have we seen the last of these changes? Perhaps the changes in the direct services you receive from the City Solid Waste Division will not be as drastic as you will be experiencing over the next 12 months. But, Federal mandates on the operation of the White Street Landfill will definitely impact the overall cost of services. An additional $3.5 million will be expended by 1997, over and above existing operating costs, to bring the landfill operation into compliance with the Federal rules on landfill management. And each time we develop a new landfill area within the White Street site we will be expending a similar amount in terms of 1992 dollars.
The second major area of cost that the community faces in 4 -*
managing solid waste is the "environmental impact" cost. The waste must be disposed of safely and with as little disturbance to the ecology of our community as possible. The more waste we generate, the more land and air space we must consume. Once utilized, we must care for that waste for generations to come to ensure that it does not contaminate the land and water and to

make sure it does not pose a hazard to the citizens. This cost, to be managed in a future of rules and technical principles yet unknown, can be minimized with the direct and considered efforts of all by avoiding the generation of waste at every opportunity.
Over the past several months we have been sharing with you principles and practices that, if employed by each of us,
=will result in a reduced growth rate for the production of solid caste. During the next 30 days, your business may be contacted by representatives of the Carolina Evaluation Research Center to participate in an evaluation of the information and materials used in our Business Sources Reduction Education Program. Please offer every assistance if you are called upon in this process. We are attempting to serve the needs of the business community in providing useful and appropriate information and tools to assist you in reducing you direct costs for solid waste management as well as your indirect costs that we have control over at the government level.
If you are in need of assistance in developing a source reduction program or would like further information, please call Elizabeth Treadway (373-2074).