Embed Size (px)
Citation preview
2020-2021 WASHINGTON STATEWIDE
Waste Characterization Study State of Washington Department of Ecology
Publication 21-07-026
Published August 2021

2020-2021 Washington Statewide Waste Characterization Study
Final Report
Acknowledgments
To the management and staff in the following jurisdictions and waste facilities who invited us into their
places of work and allowed us to carry out the field work that resulted in this report, or who shared data for
this report, we thank you for making this study possible.
Clark County West Vancouver Transfer Station
Cowlitz County Waste Control 3rd Ave Transfer Station
Island County Island County SW Complex
Jefferson County Jefferson County Solid Waste Transfer Station
Kittitas County Kittitas County Transfer Station
Mason County Mason County Transfer Station
Okanogan County Okanogan Central Landfill
Twisp Transfer Station
Skamania County Stevenson Transfer Station
Snohomish County Southwest Recycling and Transfer Station
Spokane County Spokane Regional Waste to Energy Facility
Whitman County Carothers Rd SW Site Transfer Station
King County
Pierce County
City of Bellingham
City of Seattle
Accessibility
The Department of Ecology is committed to providing people with disabilities access to information and
services by meeting or exceeding the requirements of the Americans with Disabilities Act (ADA), Section 504
and 508 of the Rehabilitation Act, and Washington State Policy #188.
To request an ADA accommodation, contact Ecology by phone at 360-407-6900 or email at
[email protected]. For Washington Relay Service or TTY call 711 or 877-833-6341. Visit Ecology’s
website for more information.

2020-2021 Washington Statewide Waste Characterization Study
Final Report
August 2021 | ii
Table of Contents Acknowledgments..................................................................................................................................... i
List of Tables ........................................................................................................................................... iii
List of Figures ........................................................................................................................................... v
Project Overview ..................................................................................................................................... 1
Introduction ...................................................................................................................................................... 1
Impacts of COVID-19 Pandemic ........................................................................................................................ 1
Summary of Methodology ................................................................................................................................ 2
Sample Allocation and Schedule ...................................................................................................................... 6
Determining the Composition of the Statewide Waste Stream ....................................................................... 9
Quantifying the Waste Stream ....................................................................................................................... 10
Interpreting the Results .................................................................................................................................. 13
Changes in the Methodology Since 2015-2016 .............................................................................................. 14
Statewide Characterization Results ......................................................................................................... 15
Overall Disposed Waste Stream ..................................................................................................................... 15
Commercial Waste.......................................................................................................................................... 19
Residential Waste ........................................................................................................................................... 23
Self-hauled Waste ........................................................................................................................................... 27
Comparison to the 2015-2016 Study ....................................................................................................... 31
Appendix A: List and Definitions of Material Types .................................................................................. 39
Appendix B: Field Forms Used During the Study ...................................................................................... 59
Appendix C: Waste Generation Area Composition Results ....................................................................... 65
Appendix D: Supplemental Composition Results ..................................................................................... 99

2020-2021 Washington Statewide Waste Characterization Study
Final Report
August 2021 | iii
List of Tables
Table 1: WGAs and Counties Included in the 2020-2021 Statewide Study and Supplemental Analysis ................................... 3 Table 2: Counties and Facilities Visited for Sampling and Surveying ....................................................................................................... 4 Table 3: Numbers of Waste Samples Characterized, by Sector .................................................................................................................. 5 Table 4: Number of Material Types per Material Class ................................................................................................................................... 5 Table 5: The Eight Material Groupings Used for the Packaging and Product Analysis ..................................................................... 6 Table 6: Facility Schedule 2020-2021, by Season .............................................................................................................................................. 7 Table 7: Sample Goals vs Actuals 2020-2021, by County .............................................................................................................................. 8 Table 8: Sample Goals vs Actuals 2020-2021, by WGA .................................................................................................................................. 9 Table 9: Number of Vehicles Surveyed by County ........................................................................................................................................ 11 Table 10: Estimated Tons of Disposed Waste by Sector ............................................................................................................................. 12 Table 11: Annual Disposed Tonnage by WGA ................................................................................................................................................. 12 Table 12: Example Percent Composition and Error Range ......................................................................................................................... 13 Table 13: Overall Statewide Disposed Waste Stream Fifteen Most Prevalent Material Types, 2020-2021 ........................... 17 Table 14: Overall Statewide Disposed Waste Stream, Detailed Composition, 2020-2021 ........................................................... 18 Table 15: Commercial Disposed Waste Sector Fifteen Most Prevalent Material Types, 2020-2021 ........................................ 21 Table 16: Commercial Disposed Waste Sector, Detailed Composition, 2020-2021 ........................................................................ 22 Table 17: Residential Disposed Waste Sector Fifteen Most Prevalent Material Types, 2020-2021........................................... 25 Table 18: Residential Disposed Waste Sector, Detailed Composition, 2020-2021 .......................................................................... 26 Table 19: Self-hauled Disposed Waste Sector Fifteen Most Prevalent Material Types, 2020-2021.......................................... 29 Table 20: Self-hauled Disposed Waste Sector, Detailed Composition, 2020-2021 ......................................................................... 30 Table 21: Waste Composition Changes and Trends, 2015-2016 vs. 2020-2021 ............................................................................... 38 Table 22: List of Material Types ............................................................................................................................................................................. 40 Table 23: Material Types by Packaging and Products Material Groups ............................................................................................... 43 Table 24: Central WGA Overall Disposed Waste Stream, Detailed Composition, 2020-2021 ..................................................... 70 Table 25: Central WGA Commercial Disposed Waste Sector, Detailed Composition, 2020-2021 ............................................ 71 Table 26: Central WGA Residential Disposed Waste Sector, Detailed Composition, 2020-2021 .............................................. 72 Table 27: Central WGA Self-hauled Disposed Waste Sector, Detailed Composition, 2020-2021 ............................................. 73 Table 28: East WGA Overall Disposed Waste Stream, Detailed Composition, 2020-2021 ........................................................... 75 Table 29: East WGA Commercial Disposed Waste, Detailed Composition, 2020-2021 ................................................................. 76 Table 30: East WGA Residential Disposed Waste Sector, Detailed Composition, 2020-2021 ..................................................... 77 Table 31: East WGA Self-hauled Disposed Waste Sector, Detailed Composition, 2020-2021 .................................................... 78 Table 32: Northwest WGA Overall Disposed Waste Stream, Detailed Composition, 2020-2021 .............................................. 80 Table 33: Northwest WGA Commercial Disposed Waste Sector, Detailed Composition, 2020-2021 ..................................... 81 Table 34: Northwest WGA Residential Disposed Waste Sector, Detailed Composition, 2020-2021 ........................................ 82 Table 35: Northwest WGA Self-hauled Disposed Waste Sector, Detailed Composition, 2020-2021....................................... 83 Table 36: Puget Sound WGA Overall Disposed Waste Stream, Detailed Composition, 2020-2021 ......................................... 85 Table 37: Puget Sound WGA Commercial Disposed Waste Sector, Detailed Composition, 2020-2021 ................................ 86 Table 38: Puget Sound WGA Residential Disposed Waste Sector, Detailed Composition, 2020-2021 .................................. 87 Table 39: Puget Sound WGA Self-hauled Disposed Waste Sector, Detailed Composition, 2020-2021 ................................. 88 Table 40: Southwest WGA Overall Disposed Waste Sector, Detailed Composition, 2020-2021 ............................................... 90 Table 41: Southwest WGA Commercial Disposed Waste Sector, Detailed Composition, 2020-2021 ..................................... 91 Table 42: Southwest WGA Residential Disposed Waste Sector, Detailed Composition, 2020-2021 ........................................ 92 Table 43: Southwest WGA Self-hauled Disposed Waste Sector, Detailed Composition, 2020-2021....................................... 93 Table 44: West WGA Overall Disposed Waste Stream, Detailed Composition, 2020-2021 ......................................................... 95 Table 45: West WGA Commercial Disposed Waste Sector, Detailed Composition, 2020-2021................................................. 96 Table 46: West WGA Residential Disposed Waste Sector, Detailed Composition, 2020-2021 ................................................... 97 Table 47: West WGA Self-hauled Disposed Waste Sector, Detailed Composition, 2020-2021 .................................................. 98
2020-2021 Washington Statewide Waste Characterization Study
Final Report
August 2021 | iv
Table 48: Supplemental Statewide Results - Five-study Material Type Translation ...................................................................... 100 Table 49: Supplemental Statewide Results—Overall Statewide Disposed Waste Stream, Ten Most Prevalent Material
Types, 2020-2021 ....................................................................................................................................................................................................... 109 Table 50: Supplemental Statewide Results—Overall Statewide Disposed Waste Stream, Detailed Composition, 2020-
2021 ................................................................................................................................................................................................................................. 110 Table 51: Supplemental Statewide Results—Statewide Commercial Disposed Waste Sector, Ten Most Prevalent
Material Types, 2020-2021..................................................................................................................................................................................... 112 Table 52: Supplemental Statewide Results—Statewide Commercial Disposed Waste Sector, Detailed Composition,
2020-2021 ..................................................................................................................................................................................................................... 113 Table 53: Supplemental Statewide Results—Statewide Residential Disposed Waste Sector, Ten Most Prevalent Material
Types, 2020-2021 ....................................................................................................................................................................................................... 115 Table 54: Supplemental Statewide Results—Statewide Residential Disposed Waste Sector, Detailed Composition,
2020-2021 ..................................................................................................................................................................................................................... 116 Table 55: Supplemental Statewide Results—Statewide Self-hauled Disposed Waste Sector, Ten Most Prevalent
Material Types, 2020-2021..................................................................................................................................................................................... 118 Table 56: Supplemental Statewide Results—Statewide Self-hauled Disposed Waste Sector, Detailed Composition,
2020-2021 ..................................................................................................................................................................................................................... 119

2020-2021 Washington Statewide Waste Characterization Study
Final Report
August 2021 | v
List of Figures
Figure 1: Map of Waste Generation Areas ........................................................................................................................................................... 3 Figure 2: The 16-Cell Grid Applied to a Tipped Load ...................................................................................................................................... 9 Figure 3: Overall Statewide Disposed Waste Stream Composition by Material Class, 2020-2021 ........................................... 15 Figure 4: Overall Statewide Disposed Waste Stream Composition by Material Class, Combined Packaging and
Products, 2020-2021 .................................................................................................................................................................................................. 16 Figure 5: Overall Statewide Disposed Waste Stream Packaging, Products, and Other Material Groups, 2020-2021 ....... 16 Figure 6: Commercial Disposed Waste Sector Composition by Material Class, 2020-2021 ........................................................ 19 Figure 7: Commercial Disposed Waste Sector Composition by Material Class, Combined Packaging and Products,
2020-2021 ....................................................................................................................................................................................................................... 20 Figure 8: Commercial Disposed Waste Sector Packaging, Products, and Other Material Groups, 2020-2021 ................... 20 Figure 9: Residential Disposed Waste Sector Composition by Material Class, 2020-2021 .......................................................... 23 Figure 10: Residential Disposed Waste Sector Composition by Material Class, Combined Packaging and Products,
2020-2021 ....................................................................................................................................................................................................................... 24 Figure 11: Residential Disposed Waste Sector Packaging, Products, and Other Material Groups, 2020-2021 ................... 24 Figure 12: Self-hauled Disposed Waste Sector Composition by Material Class, 2020-2021 ....................................................... 27 Figure 13: Self-hauled Disposed Waste Sector Composition by Material Class, Combined Packaging and Products,
2020-2021 ....................................................................................................................................................................................................................... 28 Figure 14: Self-hauled Disposed Waste Sector Packaging, Products, and Other Material Groups, 2020-2021 .................. 28 Figure 15: T-test Material Categories .................................................................................................................................................................. 32 Figure 16: Sample Vehicle Selection Sheet ....................................................................................................................................................... 59 Figure 17: Sample Placard ........................................................................................................................................................................................ 60 Figure 18: Sample Sorting and Characterization Form, Front ................................................................................................................... 61 Figure 19: Sample Sorting and Characterization Form, Back .................................................................................................................... 62 Figure 20: Vehicle Survey Form, Front ................................................................................................................................................................ 63 Figure 21: Vehicle Survey Form, Back .................................................................................................................................................................. 64 Figure 22: Central WGA ............................................................................................................................................................................................. 66 Figure 23: East WGA ................................................................................................................................................................................................... 66 Figure 24: Northwest WGA ...................................................................................................................................................................................... 67 Figure 25: Puget Sound WGA ................................................................................................................................................................................. 67 Figure 26: Southwest WGA ...................................................................................................................................................................................... 68 Figure 27: West WGA ................................................................................................................................................................................................. 68 Figure 28: Supplemental Statewide Results—Overall Statewide Disposed Waste Stream ........................................................ 108 Figure 29: Supplemental Statewide Results—Statewide Commercial Disposed Waste Sector, Composition by Material
Class, 2020-2021 ........................................................................................................................................................................................................ 111 Figure 30: Supplemental Statewide Results—Statewide Residential Disposed Waste Sector, Composition by Material
Class, 2020-2021 ........................................................................................................................................................................................................ 114 Figure 31: Supplemental Statewide Results—Statewide Self-hauled Disposed Waste Sector, Composition by Material
Class, 2020-2021 ........................................................................................................................................................................................................ 117

2020-2021 Washington Statewide Waste Characterization Study
Final Report
August 2021 | 1
Project Overview
Introduction
To obtain data about the composition of disposed waste in the state of Washington, the Washington State
Department of Ecology (Ecology) commissioned Cascadia Consulting Group (Cascadia) to conduct a four-
season municipal solid waste (MSW) characterization study in 2020-2021. Ecology may use the findings from
this study to assist municipalities as well as public and private solid waste managers to design targeted waste
reduction, product stewardship, and material recovery programs, inform solid waste planning efforts,
sustainable materials management efforts, and compare against previous studies. Cascadia conducted similar
studies in 2009 and 2015-2016, and the 2020-2021 study protocol essentially replicates the protocol used in
previous studies.
The results of this study include:
A packaging versus product analysis which groups each of the 143 unique material types into packaging,
products, or one of six other material groups.0F
1
Detailed composition results for each of the state’s six waste generation areas (WGAs)—Central, East,
Northwest, Puget Sound, Southwest, and West.
A comparison with the 2015-2016 Washington Statewide Waste Characterization Study.
A supplementary analysis which combines the data collected during this study with four additional
studies completed by other jurisdictions around the state.
The main body of this report includes an overview of the study including a summary of the study
methodology, the overall composition results by sector from the 2020-2021 study, and a comparison to the
previous study conducted in 2015-2016. Appendices include lists and definitions of material types, field forms
used in this study, composition results by WGA, and supplemental composition results of the study data
combined with additional studies in Washington.
Impacts of COVID-19 Pandemic
The 2020-2021 study occurred concurrently with the global COVID-19 pandemic. The pandemic posed unique
challenges to completing field work according to the original study plan that would not be expected during a
normal year. Logistical and scheduling challenges included limiting onsite visitors at facilities, restricted
access to the scale house and restrooms for field staff, and unexpected facility staffing limitations due to
employee medical leave and/or quarantine mandates. Cascadia augmented its health and safety protocol to
include additional training for field staff prior to field work, additional personal protective equipment (PPE)
requirements such as mandatory face masks, and portable hand washing stations. Field staff maintained six
feet distance and respected safety protocols of each facility, which sometimes included a safety briefing prior
to field work. The impacts of the COVID-19 pandemic to the data will be discussed in sections below.
1 The project team originally agreed on 141 material types for the 2020-2021 study. To obtain additional detail, the field crew sorted the original aseptic and polycoated packaging material type into three distinct material types: aseptic containers, gable top containers, and other polycoated packaging.

2020-2021 Washington Statewide Waste Characterization Study
Final Report
August 2021 | 2
Summary of Methodology
This section summarizes the planning and data collection approaches used in the 2020-2021 statewide study.
The methods used in this study essentially replicate the methods used in the 2009 and 2015-2016 studies,
with modifications noted. The 2020-2021 study uses statistical procedures equivalent to the previous 2015-
2016 statewide study. The detailed study design created for the 2015-2016 study can be found in the Ecology
publication 1607032.pdf (wa.gov).
Ecology initially created a plan for the 2020-2021 study that provided the framework for all subsequent data
collection and analysis strategies. This planning stage included:
1. Selecting representative counties to visit across the state
2. Scheduling solid waste disposal facilities, statewide, for surveying and sampling
3. Defining the waste sectors to include in the study
4. Creating the list of material types to measure in the study
Following the planning stage, Cascadia implemented the data collection and analysis strategies, which
included:
1. Determining the composition of the waste stream through sampling and sorting
2. Quantifying the waste stream through vehicle surveys
Each of these steps in the planning phase is explained below.1F
2
SELECTING REPRESENTATIVE COUNTIES
Ecology first selected ten counties in which to collect and sort waste samples. These ten counties represent
Washington’s six Waste Generation Areas (WGAs): Central, East, Northwest, Puget Sound, Southwest, and
West. A WGA groups counties with similar geographies, demographics, and economies to reduce the
complexity of the study.
In addition to the ten counties chosen as data collection sites, Ecology and Cascadia collaborated to select
four additional recent studies for additional comparative analysis. As part of the analysis, Cascadia combined
the existing composition data from the four selected studies with the 2020-2021 statewide data. The four
selected studies include:
2019 King County Waste Characterization Study (excludes Seattle)
2020-2021 City of Seattle Waste Characterization Study
2019 City of Bellingham Waste Characterization Study
2015-2016 Pierce County Waste Characterization Study (excludes Tacoma)
Table 1 and Figure 1 below show the counties visited for sampling and the additional counties included in the
supplemental analysis. Composition results for the six Washington WGAs are included in Appendix C: Waste
2 Refer to the Ecology publication 1607032.pdf (wa.gov) for a more detailed description of the 2015-2016 methodology that was replicated for the 2020-2021 study.

2020-2021 Washington Statewide Waste Characterization Study
Final Report
August 2021 | 3
Generation Area Composition Results. The supplementary analysis of data from additional counties is
included in Appendix D: Supplemental Composition Results.
Table 1: WGAs and Counties Included in the 2020-2021 Statewide Study and Supplemental Analysis
WASTE GENERATION AREA COUNTIES VISITED FOR
STATEWIDE STUDY SUPPLEMENTAL COUNTIES
ANALYZED
Central Kittitas, Okanogan
East Spokane, Whitman
Northwest Island Whatcom County (City of Bellingham)
Puget Sound Snohomish King County, Pierce County, City of Seattle
Southwest Skamania, Clark, Cowlitz2F
3
West Jefferson, Mason
Figure 1: Map of Waste Generation Areas
3 Cowlitz County was used as an alternative county in season two of field work due to staffing limitations at Stevenson Transfer Station in Skamania County.

2020-2021 Washington Statewide Waste Characterization Study
Final Report
August 2021 | 4
SCHEDULING FACILITIES
After selecting the ten counties to visit, Ecology recruited one solid waste facility in each county where waste
sampling, sorting, and surveying would occur. Table 2 lists the selected counties and corresponding facilities
visited.
Table 2: Counties and Facilities Visited for Sampling and Surveying
COUNTY FACILITY
Clark County West Vancouver Transfer Station
Cowlitz County Waste Control 3rd Ave Transfer Station
Island County Island County SW Complex
Jefferson County Jefferson County Solid Waste Transfer Station
Kittitas County Kittitas County Transfer Station
Mason County Mason County Transfer Station
Okanogan County Okanogan Central Landfill; Twisp Transfer Station3F
4
Skamania County Stevenson Transfer Station4F
5
Snohomish County Southwest Recycling and Transfer Station
Spokane County Spokane Regional Waste to Energy Facility
Whitman County Carothers Rd SW Site Transfer Station
DEFINING WASTE SECTORS
Waste sectors are defined according to the source, or generator, of the disposed waste (residential or
commercial) and by how materials are delivered to disposal facilities (commercially collected or self-hauled).
For the 2020-2021 study, Cascadia and Ecology divided Washington’s waste stream into the following three
waste sectors:
Commercial: waste hauled by contracted or municipally operated vehicles in which 80 percent or more of
the waste is from institutional, commercial, or industrial sources.
Residential: waste hauled by contracted or municipally operated vehicles in which 80 percent or more of
the waste is from single-family and/or multifamily residential sources.
Self-hauled: waste hauled by vehicles not operated by a franchise or municipality, including waste that
was generated as a result of construction or demolition activities.
4 Twisp Transfer Station was used as an alternative facility in season two of field work due to construction taking place at Okanogan Central Landfill at the time of the study.
5 During the final season of field work, the sort crew sampled at Stevenson Transfer Station in the morning and unexpectedly finished the day at West Vancouver Transfer Station due to a lack of incoming vehicles at Stevenson Transfer Station.

2020-2021 Washington Statewide Waste Characterization Study
Final Report
August 2021 | 5
Cascadia characterized a total of 520 samples. Table 3 shows how many samples the field crew collected and
sorted from each of the three waste sectors.
Table 3: Numbers of Waste Samples Characterized, by Sector
SECTOR NUMBER OF SAMPLES
Commercial 240
Residential 120
Self-hauled 160
Total 520
CREATING THE LIST OF MATERIAL TYPES
Ecology and Cascadia created the list of 143 material types (based on the 2015-2016 study and updated
needs for tracking specific materials) and organized them into 12 broad material classes. Table 4 shows the
number of material types in each of the broad material classes. The definitions of each material type, and the
organization by material class, can be found in Appendix A: List and Definitions of Material Types.
Table 4: Number of Material Types per Material Class
MATERIAL CLASSES NUMBER OF MATERIAL
TYPES WITHIN CLASS
Paper Packaging 8
Paper Products 8
Plastic Packaging 17
Plastic Products 12
Glass 6
Metal 9
Organics 10
Wood Debris 9
Construction Materials 12
Consumer Products 18
Hazardous and Special Wastes
29
Residuals 5
Total 143

2020-2021 Washington Statewide Waste Characterization Study
Final Report
August 2021 | 6
Packaging and Product List
To align with the 2015-2016 study and conduct the packaging and product analysis, Cascadia also aggregated
the 143 material types into eight material groupings, listed in Table 5 below. For example, all materials in
both Paper Packaging and Plastic Packaging material classes are classified as Packaging for this analysis. The
material group Glass is split and all glass containers are moved under Packaging, while plate glass and non-
glass ceramics are under Products. The remaining glass material, R/C glass, is considered Residues.
Table 5: The Eight Material Groupings Used for the Packaging and Product Analysis
PACKAGING AND PRODUCT MATERIAL CLASSES
Packaging Wood Debris
Products Construction Materials
Metal Hazardous/Special Waste
Organics Residues
For a thorough list of the classification of material types into packaging and product material groupings, see
Appendix A: List and Definitions of Material Types.
Sample Allocation and Schedule
Cascadia collected a total of 520 samples of residential, commercial, and self-hauled disposed municipal solid
waste5F
6 from 11 different counties in Washington. In general, Cascadia conducted sampling and sorting at
each facility one day per season for four seasons (summer, autumn, winter, and spring). The first season of
field work began in August 2020, and the final season of field work was completed in April 2021. Below are
the dates of field work for each season:
Season 1: August 10 – 21, 2020
Season 2: November 11 – 20; December 14 – 18, 2020
Season 3: February 8 – 12; February 22 – 26, 2021
Season 4: April 5 – 16, 2021
During the second season of field work, staffing limitations due to the COVID-19 pandemic and onsite
construction prevented the field crew from sample collection at two facilities. The field crew sampled at
Twisp Transfer Station in place of Okanogan Central Landfill in Okanogan County and at Waste Control 3rd
Ave Transfer Station in Cowlitz County in place of Stevenson Transfer Station. During the fourth season of
field work, the field crew sampled a half day at Stevenson Transfer Station and a day and a half at West
Vancouver Transfer Station due to limited incoming loads at Stevenson Transfer Station in Skamania County.
Table 6 shows the facility schedule for each season of field work.
6 Municipal solid waste (MSW) is defined as a subset of solid waste which includes unsegregated garbage, refuse and similar solid waste material discarded from residential, commercial, institutional, and industrial sources and community activities, including residue after recyclables have been separated (Chapter 173-350 WAC).

2020-2021 Washington Statewide Waste Characterization Study
Final Report
August 2021 | 7
Table 6: Facility Schedule 2020-2021, by Season
8/10 8/11 8/12 8/13 8/14 8/17 8/18 8/19 8/20 8/21
Spokane Regional Waste to Energy Facility X
Carothers Rd SW Site Transfer Station X
Kittitas County Transfer Station X
Okanogan Central Landfill X
Island County SW Complex X
Southwest Recycling and Transfer Station X
Jefferson County Solid Waste Transfer Station X
Mason County Transfer Station X
Stevenson Transfer Station X
West Vancouver Transfer Station X
11/16 11/17 11/18 11/19 11/20 12/14 12/15 12/16 12/17 12/18
Spokane Regional Waste to Energy Facility X
Carothers Rd SW Site Transfer Station X
Kittitas County Transfer Station X
Twisp Transfer Station* X
Island County SW Complex X
Southwest Recycling and Transfer Station X
Jefferson County Solid Waste Transfer Station X
Mason County Transfer Station X
Waste Control 3rd Ave Transfer Station** X
West Vancouver Transfer Station X
2/8 2/9 2/10 2/11 2/12 2/22 2/23 2/24 2/25 2/26
Spokane Regional Waste to Energy Facility X
Carothers Rd SW Site Transfer Station X
Kittitas County Transfer Station X
Okanogan Central Landfill X
Island County SW Complex X
Southwest Recycling and Transfer Station X
Jefferson County Solid Waste Transfer Station X
Mason County Transfer Station X
Stevenson Transfer Station X
West Vancouver Transfer Station X
4/5 4/6 4/7 4/8 4/9 4/12 4/13 4/14 4/15 4/16
Spokane Regional Waste to Energy Facility X
Carothers Rd SW Site Transfer Station X
Kittitas County Transfer Station X
Okanogan Central Landfill X
Island County SW Complex X
Southwest Recycling and Transfer Station X
Jefferson County Solid Waste Transfer Station X
Mason County Transfer Station X
Stevenson Transfer Station X
West Vancouver Transfer Station X X
Season Four: April 2021
*Twisp Transfer Station was a substitute for Okanogan Central Landfill
**Waste Control 3rd Ave Transfer Station was a substitute for Stevenson Transfer Station
Season One: August 2020
Season Two: November - December 2020
Season Three: Februrary 2021

2020-2021 Washington Statewide Waste Characterization Study
Final Report
August 2021 | 8
Table 7 below shows the sample goals and actual samples collected by county. Table 8 shows the sample
goals and actual samples collected by WGA. Cascadia collected and sorted the total number of samples
planned for each WGA even though the actual daily site and sample allocation deviated slightly from the
original plan.
Table 7: Sample Goals vs Actuals 2020-2021, by County
RESIDENTIAL COMMERCIAL SELF-HAULED TOTALS
COUNTY WGA Goal Actual Goal Actual Goal Actual Goal Actual
Spokane East 12 12 24 26 16 14 52 52
Whitman East 12 12 24 22 16 18 52 52
Kittitas Central 12 12 24 26 16 14 52 52
Okanogan Central 12 12 24 22 16 18 52 52
Island Northwest 12 12 24 24 16 16 52 52
Snohomish Puget Sound 12 12 24 24 16 16 52 52
Jefferson West 12 11 24 24 16 17 52 52
Mason West 12 13 24 24 16 15 52 52
Skamania Southwest 12 3 24 15 16 13 52 31
Cowlitz Southwest 0 3 0 5 0 3 0 11
Clark Southwest 12 18 24 28 16 16 52 62
Totals 120 120 240 240 160 160 520 520

2020-2021 Washington Statewide Waste Characterization Study
Final Report
August 2021 | 9
Table 8: Sample Goals vs Actuals 2020-2021, by WGA
RESIDENTIAL COMMERCIAL SELF-HAULED TOTALS
WGA Goal Actual Goal Actual Goal Actual Goal Actual
East 24 24 48 48 32 32 104 104
Central 24 24 48 48 32 32 104 104
Northwest 12 12 24 24 16 16 52 52
Puget Sound 12 12 24 24 16 16 52 52
West 24 24 48 48 32 32 104 104
Southwest 24 24 48 48 32 32 104 104
Totals: 120 120 240 240 160 160 520 520
Determining the Composition of the Statewide Waste Stream
SELECTING SAMPLES
Cascadia used a systematic sampling protocol to ensure accurate representation of loads from each sector
and provided the scale house attendant with detailed instructions for selecting loads to sample. When an
eligible vehicle arrived at the scale house and was selected for sampling, the scale house attendant directed
the vehicle to the tipping area where it was intercepted by the Sort Crew Manager.6F
7
The Sort Crew Manager selected a sample from the load by superimposing an imaginary 16-cell grid (see
below) over the dumped material. Then, with the assistance of a loader operator, they extracted a sample of
waste weighing approximately 200 pounds from a randomly selected cell. Each sample was labeled with the
identifying sample ID number and digitally photographed.
Figure 2: The 16-Cell Grid Applied to a Tipped Load
7 Due to staffing limitations, the Mason County Transfer Station was unable to provide scale house staff to assist with vehicle selection. An Ecology staff person assisted with vehicle selection during the third and fourth seasons of field work.
2020-2021 Washington Statewide Waste Characterization Study
Final Report
August 2021 | 10
SORTING SAMPLES
To determine the statewide 2020-2021 composition—the percentage of each material present in the waste
stream—the sort crew hand sorted each disposed waste sample into 143 material types. Hand sorting and
weighing every material type found in a sample produces accurate measurements that can be reliably
converted to percentages and then applied to tonnage figures to quantify the waste stream. The sorting
protocol follows these five steps7F
8:
Step 1: Review methodology and sorting categories with the crew. Before the sorting begins, the sort
crew reviewed the safety protocols, procedures, forms, and material definitions in detail.
Step 2: Photograph the sample. The sort crew photographed the sample using a digital camera, ensuring
that the Sample Placard identifying the sample was visible in each photo.
Step 3: Sort the sample. Once the sample was placed on the sorting table, the sort crew sorted material
by hand into the prescribed material categories in plastic baskets. Individual members of the sort crew
typically specialized in groups of materials, such as papers or plastics. The Sort Crew Manager monitored
the accuracy of sorting, re-sorting any materials that were improperly classified. The complete list of
material types and definitions are included in Appendix A: List and Definitions of Material Types.
Step 4: Weigh the sample. The sort crew verified the purity of each material as it was weighed using a
pre-tared scale and records the data on the Sample Sorting and Characterization Form.
Step 5: Review Data. At the conclusion of each field work day, the Sort Crew Manager conducted a
quality control review of the data recorded.
Quantifying the Waste Stream
STATEWIDE DISPOSED TONS
The first step in quantifying Washington’s disposed waste stream was
to determine the amount of solid waste disposed statewide. Ecology
provided Cascadia with an annual disposed tonnage figure of 5,275,558
tons. The reported tonnage data is from 2017, the most recent year
available.
SECTOR ALLOCATIONS OF WASTE DISPOSED
To calculate tonnages for each of the three waste sectors, Cascadia
carried out a vehicle survey during the first season of the 2020-2021
study at the ten recruited sampling sites to determine how many tons
of disposed waste were associated with each of the waste sectors.
Cascadia recorded the net weight from each vehicle disposing waste at
the facility and assigned these tons to the appropriate waste sector
using the Vehicle Survey Form. Compiling data from the vehicle survey
yielded the “sector splits,” or percent of total waste disposed, by weight
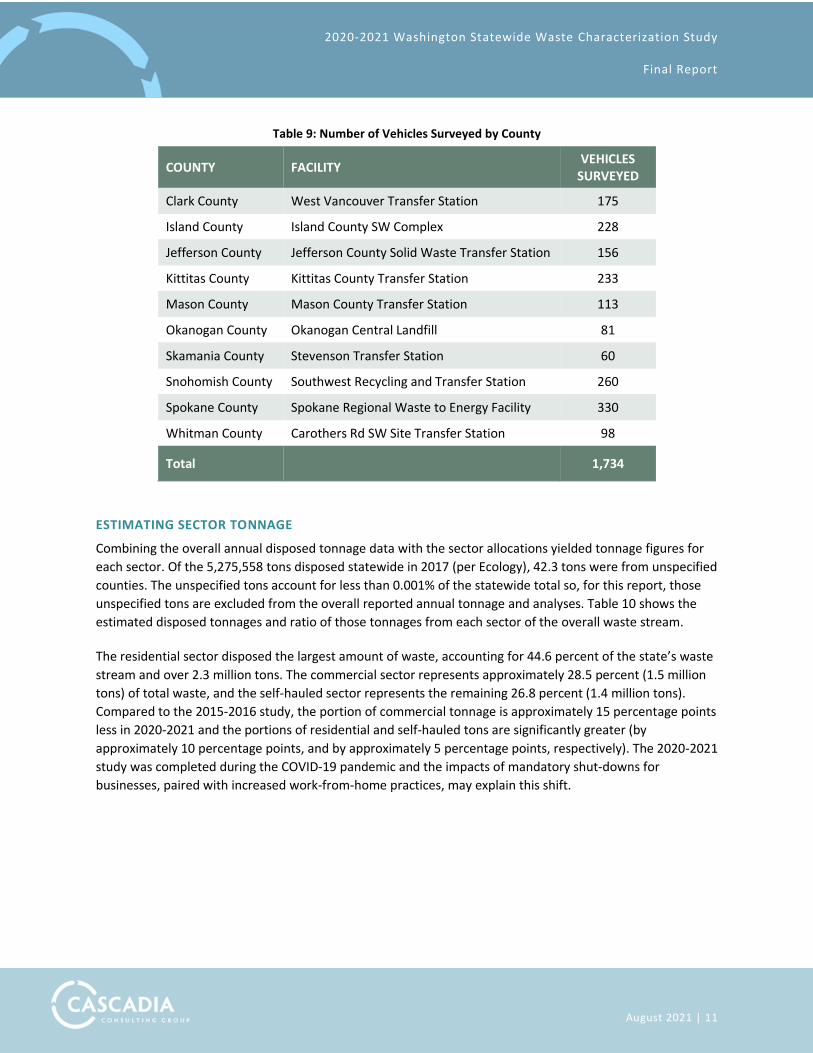
and sector. Table 9 presents the number of vehicles surveyed by
county.
8 A detailed description of sample selection and the hand sorting process from the 2015-2016 study (and used in the 2020-2021 study) can be found in the Ecology publication 1607032.pdf (wa.gov).
What does R/C stand for?
Most of the Material Classes
created for this study include a
material type that begins with
“R/C” such as R/C glass, R/C
metal, and R/C organics. These
initials stand for
“remainder/composite” and
define a material that either
cannot be categorized in any
other material type or where the
material is a composite of more
than one material.
Examples of items included in
some of the R/C material types
are insulated wire and cigarette
butts.
2020-2021 Washington Statewide Waste Characterization Study
Final Report
August 2021 | 11
Table 9: Number of Vehicles Surveyed by County
COUNTY FACILITY VEHICLES
SURVEYED
Clark County West Vancouver Transfer Station 175
Island County Island County SW Complex 228
Jefferson County Jefferson County Solid Waste Transfer Station 156
Kittitas County Kittitas County Transfer Station 233
Mason County Mason County Transfer Station 113
Okanogan County Okanogan Central Landfill 81
Skamania County Stevenson Transfer Station 60
Snohomish County Southwest Recycling and Transfer Station 260
Spokane County Spokane Regional Waste to Energy Facility 330
Whitman County Carothers Rd SW Site Transfer Station 98
Total 1,734
ESTIMATING SECTOR TONNAGE
Combining the overall annual disposed tonnage data with the sector allocations yielded tonnage figures for
each sector. Of the 5,275,558 tons disposed statewide in 2017 (per Ecology), 42.3 tons were from unspecified
counties. The unspecified tons account for less than 0.001% of the statewide total so, for this report, those
unspecified tons are excluded from the overall reported annual tonnage and analyses. Table 10 shows the
estimated disposed tonnages and ratio of those tonnages from each sector of the overall waste stream.
The residential sector disposed the largest amount of waste, accounting for 44.6 percent of the state’s waste
stream and over 2.3 million tons. The commercial sector represents approximately 28.5 percent (1.5 million
tons) of total waste, and the self-hauled sector represents the remaining 26.8 percent (1.4 million tons).
Compared to the 2015-2016 study, the portion of commercial tonnage is approximately 15 percentage points
less in 2020-2021 and the portions of residential and self-hauled tons are significantly greater (by
approximately 10 percentage points, and by approximately 5 percentage points, respectively). The 2020-2021
study was completed during the COVID-19 pandemic and the impacts of mandatory shut-downs for
businesses, paired with increased work-from-home practices, may explain this shift.

2020-2021 Washington Statewide Waste Characterization Study
Final Report
August 2021 | 12
Table 10: Estimated Tons of Disposed Waste by Sector
SECTOR EST. PERCENTAGE OF
DISPOSED WASTE
EST. TONS DISPOSED
STATEWIDE
Commercial 28.5% 1,507,196
Residential 44.6% 2,352,771
Self-hauled 26.8% 1,415,549
Totals 100.0% 5,275,515
ESTIMATING ANNUAL TONNAGE BY WGA
To estimate the annual tonnage by WGA, Cascadia aggregated the tonnage estimates for each type of waste
at all participating facilities within a WGA. The aggregated proportions for each sector were applied to the
total disposal tons disposed in 2017 for each WGA, as reported by Ecology. The total estimated annual
disposed tonnage by WGA is presented in Table 11.
Table 11: Annual Disposed Tonnage by WGA
WASTE GENERATION AREAS
ANNUAL DISPOSED TONNAGE
Central WGA 590,822
East WGA 844,896
Northwest WGA 334,760
Puget Sound WGA 2,818,338
Southwest WGA 500,073
West WGA 186,626
Total 5,275,515

2020-2021 Washington Statewide Waste Characterization Study
Final Report
August 2021 | 13
Interpreting the Results
HOW DATA ARE PRESENTED
The findings of this study present characterization results (by weight) as follows:
1. A pair of bar charts presents an overview of waste composition by material
class and material groupings that combine packaging and products.
2. A third bar chart presents an overview of waste composition arranged into
packaging, products, and other material groups. Refer to Appendix A: List and
Definitions of Material Types, for a table illustrating how material types were
grouped into packaging, products, and other material groups.
3. A table shows the 15 most prevalent material types, by weight.
4. A detailed table lists the full composition and quantity results for the 143
material types. Refer to Appendix A: List and Definitions of Material Types for
detailed descriptions and definitions of the material types.
The Statewide Characterization Results section presents the tables and figures listed above for each sector.
The results by WGA are included in Appendix C: Waste Generation Area Composition Results.
MEANS AND ERROR RANGES
Cascadia conducted statistical analyses on the data from the material characterization process to provide two
pieces of information for each material type:
1. The estimated percent composition of waste by weight.
2. The error range for the composition estimates at the 90 percent confidence level.
All error ranges (+/-) are calculated at the industry-standard 90 percent confidence level8F
9.
The example in Table 12 illustrates how the results can be interpreted. The best estimate of the amount of
newspaper packaging present in the overall waste stream is 10.4 percent. The 3.6 percent figure reflects the
degree of precision of the estimate. When calculations are performed at the 90 percent confidence level, we
are 90 percent certain that the true mean for newspaper packaging is between 10.4 percent plus 3.6 percent
and 10.4 percent minus 3.6 percent. In other words, we are 90 percent certain that the true mean lies
between 6.8 percent and 14.0 percent.
Table 12: Example Percent Composition and Error Range
MATERIAL EST. % +/-
Newspaper packaging 10.4% 3.6%
9 The equations used in these calculations appear in the Ecology publication 1607032.pdf (wa.gov).
Material Designations
For the sake of clarity,
Material Classes and
Groupings such as
Paper Packaging,
Glass, and Products are
capitalized and bolded.
Material types such as
newspaper packaging
and painted wood are
italicized.
2020-2021 Washington Statewide Waste Characterization Study
Final Report
August 2021 | 14
ROUNDING
When interpreting the results presented in the tables and figures in this report, it is important to consider the
effect of rounding. To keep the waste composition tables and figures readable, estimated tonnages are
rounded to the nearest ton, and estimated percentages are rounded to the nearest tenth of a percent. Due
to rounding, the tonnages or percentages presented in the report, when added together, may not exactly
match the subtotals and totals shown. Percentages less than 0.05 percent are shown as 0.0 percent even
though there may be weights associated with the material.
Changes in the Methodology Since 2015-2016
The methods used in 2020-2021 study essentially replicate the methods used in the 2009 and 2015-2016
studies. The following summarizes the notable changes from the 2015-2016 methodology:
Self-hauled C&D and Self-hauled Other sectors (2015-2016) were combined into a single Self-hauled
sector in 2021 (defined in Defining Waste Sectors section).
The list of recruited counties and facilities recruited for sampling was updated in 2020-2021 (Table
2).
The map and list of recruited jurisdictions for the supplementary analysis were updated in 2020-2021
(Table 1 and Figure 1).
The material types lists were based on lists in 2015-2016, with minor modifications for 2020-2021
(see Appendix A: List and Definitions of Material Types for details).
The sample allocations in 2015-2016 were updated in 2020-2021 (Table 7 and Table 8).
The sampling calendar from 2015-2016 was updated in 2020-2021 (Table 6).
The annual disposed tonnages were updated for 2020-2021 using the most recently available data
(Table 11).
The number of vehicle surveys from 2015-2016 was updated for 2020-2021 (Table 9).
Additional safety protocols due to the COVID-19 pandemic such as social distancing and mandatory
facial masks.

2020-2021 Washington Statewide Waste Characterization Study
Final Report
August 2021 | 15
Statewide Characterization Results
This section presents overall statewide composition results and the results by sector—commercial,
residential, and self-hauled.
Overall Disposed Waste Stream
This section characterizes the overall disposed MSW stream for the entire state of Washington, combining
samples from all three waste sectors and all six WGAs considered in this study. Composition and quantity
estimates are generated from data collected from all counties visited during the 2020-2021 statewide study
and presented using the material list of 143 material types.
OVERVIEW BY MATERIAL CLASS
Figure 3 below presents the composition of the overall statewide disposed waste stream by material class.
Organics accounts for nearly one quarter (22.8%) of the overall disposed waste, followed by Wood Debris
(13.5%), and Construction Materials (10.7%). Figure 4 presents the composition by material groupings that
combine packaging and product material types. Following the Organics material class, Paper is 16.7 percent,
Wood Debris is 13.5 percent, and Plastic is 13.1 percent of the overall disposed waste stream.
Figure 3: Overall Statewide Disposed Waste Stream Composition by Material Class, 2020-2021

2020-2021 Washington Statewide Waste Characterization Study
Final Report
August 2021 | 16
Figure 4: Overall Statewide Disposed Waste Stream Composition by Material Class, Combined Packaging and Products, 2020-2021
OVERVIEW OF PACKAGING AND PRODUCT MATERIAL GROUPS
Figure 5 below shows that the Products and Packaging material groupings each account for one-fifth
(approximately 20%) of the overall disposed waste stream. See Appendix A: List and Definitions of Material
Types for a material list that shows the material types included in Packaging and Product materials groups.
Figure 5: Overall Statewide Disposed Waste Stream Packaging, Products, and Other Material Groups, 2020-2021

2020-2021 Washington Statewide Waste Characterization Study
Final Report
August 2021 | 17
FIFTEEN MOST PREVALENT MATERIALS
The fifteen most prevalent material types in the overall waste stream, as shown in Table 13, together make
up over half (51.5%) of the waste stream. Edible food waste- vegetative (6.4%), and cardboard and Kraft
packaging (5.2%) are the most prevalent material types.
Table 13: Overall Statewide Disposed Waste Stream Fifteen Most Prevalent Material Types, 2020-2021
DETAILED COMPOSITION
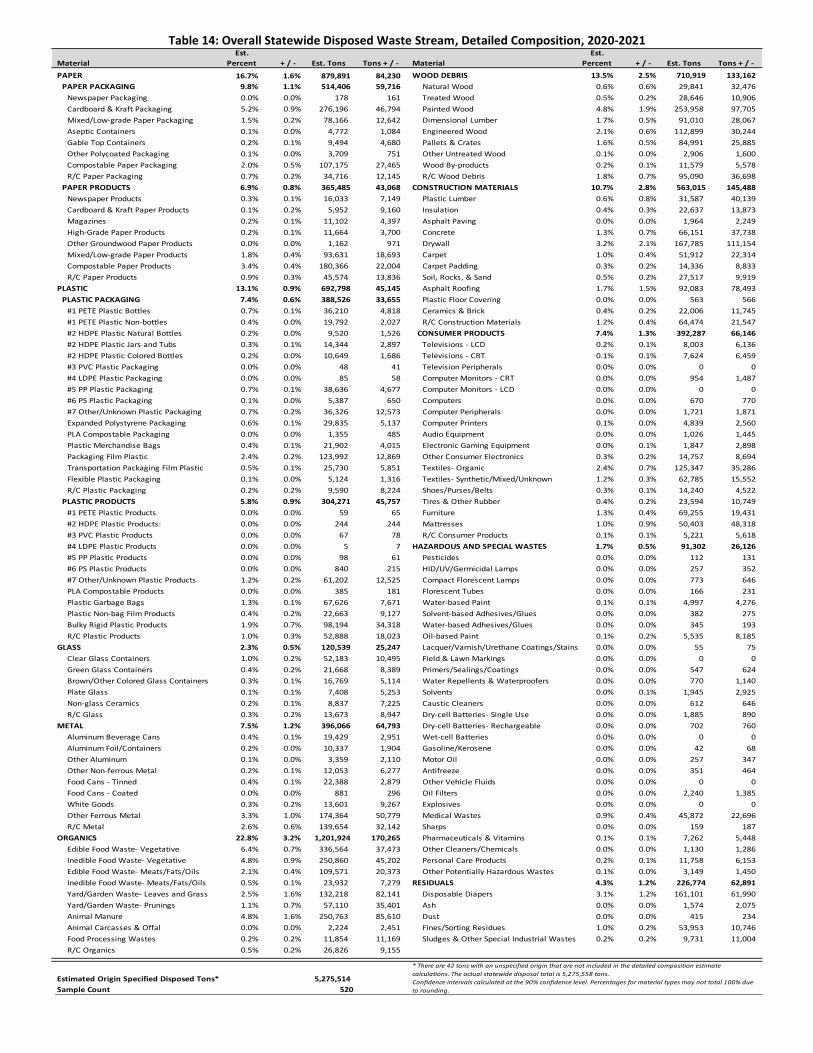
Table 14 below shows the detailed composition results by material type in the overall disposed waste stream.
MaterialEst.
PercentEst. Tons
Edible Food Waste- Vegetative 6.4% 336,564
Cardboard & Kraft Packaging 5.2% 276,196
Painted Wood 4.8% 253,958
Inedible Food Waste- Vegetative 4.8% 250,860
Animal Manure 4.8% 250,763
Compostable Paper Products 3.4% 180,366
Other Ferrous Metal 3.3% 174,364
Drywall 3.2% 167,785
R/C Metal 2.6% 139,654
Yard/Garden Waste- Leaves and Grass 2.5% 132,218
Packaging Film Plastic 2.4% 123,992
Engineered Wood 2.1% 112,899
Edible Food Waste- Meats/Fats/Oils 2.1% 109,571
Compostable Paper Packaging 2.0% 107,175
Bulky Rigid Plastic Products 1.9% 98,194
Total for Top Materials 51.5% 2,714,561
Percentages for material types may not total 100% due to rounding.
2020-2021 Washington Statewide Waste Characterization Study Draft Report
June 2021 | 18
Table 14: Overall Statewide Disposed Waste Stream, Detailed Composition, 2020-2021
Material
Est.
Percent + / - Est. Tons Tons + / - Material
Est.
Percent + / - Est. Tons Tons + / -
PAPER 16.7% 1.6% 879,891 84,230 WOOD DEBRIS 13.5% 2.5% 710,919 133,162
PAPER PACKAGING 9.8% 1.1% 514,406 59,716 Natural Wood 0.6% 0.6% 29,841 32,476
Newspaper Packaging 0.0% 0.0% 178 161 Treated Wood 0.5% 0.2% 28,646 10,906
Cardboard & Kraft Packaging 5.2% 0.9% 276,196 46,794 Painted Wood 4.8% 1.9% 253,958 97,705
Mixed/Low-grade Paper Packaging 1.5% 0.2% 78,166 12,642 Dimensional Lumber 1.7% 0.5% 91,010 28,067
Aseptic Containers 0.1% 0.0% 4,772 1,084 Engineered Wood 2.1% 0.6% 112,899 30,244
Gable Top Containers 0.2% 0.1% 9,494 4,680 Pallets & Crates 1.6% 0.5% 84,991 25,885
Other Polycoated Packaging 0.1% 0.0% 3,709 751 Other Untreated Wood 0.1% 0.0% 2,906 1,600
Compostable Paper Packaging 2.0% 0.5% 107,175 27,465 Wood By-products 0.2% 0.1% 11,579 5,578
R/C Paper Packaging 0.7% 0.2% 34,716 12,145 R/C Wood Debris 1.8% 0.7% 95,090 36,698
PAPER PRODUCTS 6.9% 0.8% 365,485 43,068 CONSTRUCTION MATERIALS 10.7% 2.8% 563,015 145,488
Newspaper Products 0.3% 0.1% 16,033 7,149 Plastic Lumber 0.6% 0.8% 31,587 40,139
Cardboard & Kraft Paper Products 0.1% 0.2% 5,952 9,160 Insulation 0.4% 0.3% 22,637 13,873
Magazines 0.2% 0.1% 11,102 4,397 Asphalt Paving 0.0% 0.0% 1,964 2,249
High-Grade Paper Products 0.2% 0.1% 11,664 3,700 Concrete 1.3% 0.7% 66,151 37,738
Other Groundwood Paper Products 0.0% 0.0% 1,162 971 Drywall 3.2% 2.1% 167,785 111,154
Mixed/Low-grade Paper Products 1.8% 0.4% 93,631 18,693 Carpet 1.0% 0.4% 51,912 22,314
Compostable Paper Products 3.4% 0.4% 180,366 22,004 Carpet Padding 0.3% 0.2% 14,336 8,833
R/C Paper Products 0.9% 0.3% 45,574 13,836 Soil, Rocks, & Sand 0.5% 0.2% 27,517 9,919
PLASTIC 13.1% 0.9% 692,798 45,145 Asphalt Roofing 1.7% 1.5% 92,083 78,493
PLASTIC PACKAGING 7.4% 0.6% 388,526 33,655 Plastic Floor Covering 0.0% 0.0% 563 566
#1 PETE Plastic Bottles 0.7% 0.1% 36,210 4,818 Ceramics & Brick 0.4% 0.2% 22,006 11,745
#1 PETE Plastic Non-bottles 0.4% 0.0% 19,792 2,027 R/C Construction Materials 1.2% 0.4% 64,474 21,547
#2 HDPE Plastic Natural Bottles 0.2% 0.0% 9,520 1,526 CONSUMER PRODUCTS 7.4% 1.3% 392,287 66,146
#2 HDPE Plastic Jars and Tubs 0.3% 0.1% 14,344 2,897 Televisions - LCD 0.2% 0.1% 8,003 6,136
#2 HDPE Plastic Colored Bottles 0.2% 0.0% 10,649 1,686 Televisions - CRT 0.1% 0.1% 7,624 6,459
#3 PVC Plastic Packaging 0.0% 0.0% 48 41 Television Peripherals 0.0% 0.0% 0 0
#4 LDPE Plastic Packaging 0.0% 0.0% 85 58 Computer Monitors - CRT 0.0% 0.0% 954 1,487
#5 PP Plastic Packaging 0.7% 0.1% 38,636 4,677 Computer Monitors - LCD 0.0% 0.0% 0 0
#6 PS Plastic Packaging 0.1% 0.0% 5,387 650 Computers 0.0% 0.0% 670 770
#7 Other/Unknown Plastic Packaging 0.7% 0.2% 36,326 12,573 Computer Peripherals 0.0% 0.0% 1,721 1,871
Expanded Polystyrene Packaging 0.6% 0.1% 29,835 5,137 Computer Printers 0.1% 0.0% 4,839 2,560
PLA Compostable Packaging 0.0% 0.0% 1,355 485 Audio Equipment 0.0% 0.0% 1,026 1,445
Plastic Merchandise Bags 0.4% 0.1% 21,902 4,015 Electronic Gaming Equipment 0.0% 0.1% 1,847 2,898
Packaging Film Plastic 2.4% 0.2% 123,992 12,869 Other Consumer Electronics 0.3% 0.2% 14,757 8,694
Transportation Packaging Film Plastic 0.5% 0.1% 25,730 5,851 Textiles- Organic 2.4% 0.7% 125,347 35,286
Flexible Plastic Packaging 0.1% 0.0% 5,124 1,316 Textiles- Synthetic/Mixed/Unknown 1.2% 0.3% 62,785 15,552
R/C Plastic Packaging 0.2% 0.2% 9,590 8,224 Shoes/Purses/Belts 0.3% 0.1% 14,240 4,522
PLASTIC PRODUCTS 5.8% 0.9% 304,271 45,757 Tires & Other Rubber 0.4% 0.2% 23,594 10,749
#1 PETE Plastic Products 0.0% 0.0% 59 65 Furniture 1.3% 0.4% 69,255 19,431
#2 HDPE Plastic Products: 0.0% 0.0% 244 244 Mattresses 1.0% 0.9% 50,403 48,318
#3 PVC Plastic Products 0.0% 0.0% 67 78 R/C Consumer Products 0.1% 0.1% 5,221 5,618
#4 LDPE Plastic Products 0.0% 0.0% 5 7 HAZARDOUS AND SPECIAL WASTES 1.7% 0.5% 91,302 26,126
#5 PP Plastic Products 0.0% 0.0% 98 61 Pesticides 0.0% 0.0% 112 131
#6 PS Plastic Products 0.0% 0.0% 840 215 HID/UV/Germicidal Lamps 0.0% 0.0% 257 352
#7 Other/Unknown Plastic Products 1.2% 0.2% 61,202 12,525 Compact Florescent Lamps 0.0% 0.0% 773 646
PLA Compostable Products 0.0% 0.0% 385 181 Florescent Tubes 0.0% 0.0% 166 231
Plastic Garbage Bags 1.3% 0.1% 67,626 7,671 Water-based Paint 0.1% 0.1% 4,997 4,276
Plastic Non-bag Film Products 0.4% 0.2% 22,663 9,127 Solvent-based Adhesives/Glues 0.0% 0.0% 382 275
Bulky Rigid Plastic Products 1.9% 0.7% 98,194 34,318 Water-based Adhesives/Glues 0.0% 0.0% 345 193
R/C Plastic Products 1.0% 0.3% 52,888 18,023 Oil-based Paint 0.1% 0.2% 5,535 8,185
GLASS 2.3% 0.5% 120,539 25,247 Lacquer/Varnish/Urethane Coatings/Stains 0.0% 0.0% 55 75
Clear Glass Containers 1.0% 0.2% 52,183 10,495 Field & Lawn Markings 0.0% 0.0% 0 0
Green Glass Containers 0.4% 0.2% 21,668 8,389 Primers/Sealings/Coatings 0.0% 0.0% 547 624
Brown/Other Colored Glass Containers 0.3% 0.1% 16,769 5,114 Water Repellents & Waterproofers 0.0% 0.0% 770 1,140
Plate Glass 0.1% 0.1% 7,408 5,253 Solvents 0.0% 0.1% 1,945 2,925
Non-glass Ceramics 0.2% 0.1% 8,837 7,225 Caustic Cleaners 0.0% 0.0% 612 646
R/C Glass 0.3% 0.2% 13,673 8,947 Dry-cell Batteries- Single Use 0.0% 0.0% 1,885 890
METAL 7.5% 1.2% 396,066 64,793 Dry-cell Batteries- Rechargeable 0.0% 0.0% 702 760
Aluminum Beverage Cans 0.4% 0.1% 19,429 2,951 Wet-cell Batteries 0.0% 0.0% 0 0
Aluminum Foil/Containers 0.2% 0.0% 10,337 1,904 Gasoline/Kerosene 0.0% 0.0% 42 68
Other Aluminum 0.1% 0.0% 3,359 2,110 Motor Oil 0.0% 0.0% 257 347
Other Non-ferrous Metal 0.2% 0.1% 12,053 6,277 Antifreeze 0.0% 0.0% 351 464
Food Cans - Tinned 0.4% 0.1% 22,388 2,879 Other Vehicle Fluids 0.0% 0.0% 0 0
Food Cans - Coated 0.0% 0.0% 881 296 Oil Filters 0.0% 0.0% 2,240 1,385
White Goods 0.3% 0.2% 13,601 9,267 Explosives 0.0% 0.0% 0 0
Other Ferrous Metal 3.3% 1.0% 174,364 50,779 Medical Wastes 0.9% 0.4% 45,872 22,696
R/C Metal 2.6% 0.6% 139,654 32,142 Sharps 0.0% 0.0% 159 187
ORGANICS 22.8% 3.2% 1,201,924 170,265 Pharmaceuticals & Vitamins 0.1% 0.1% 7,262 5,448
Edible Food Waste- Vegetative 6.4% 0.7% 336,564 37,473 Other Cleaners/Chemicals 0.0% 0.0% 1,130 1,286
Inedible Food Waste- Vegetative 4.8% 0.9% 250,860 45,202 Personal Care Products 0.2% 0.1% 11,758 6,153
Edible Food Waste- Meats/Fats/Oils 2.1% 0.4% 109,571 20,373 Other Potentially Hazardous Wastes 0.1% 0.0% 3,149 1,450
Inedible Food Waste- Meats/Fats/Oils 0.5% 0.1% 23,932 7,279 RESIDUALS 4.3% 1.2% 226,774 62,891
Yard/Garden Waste- Leaves and Grass 2.5% 1.6% 132,218 82,141 Disposable Diapers 3.1% 1.2% 161,101 61,990
Yard/Garden Waste- Prunings 1.1% 0.7% 57,110 35,401 Ash 0.0% 0.0% 1,574 2,075
Animal Manure 4.8% 1.6% 250,763 85,610 Dust 0.0% 0.0% 415 234
Animal Carcasses & Offal 0.0% 0.0% 2,224 2,451 Fines/Sorting Residues 1.0% 0.2% 53,953 10,746
Food Processing Wastes 0.2% 0.2% 11,854 11,169 Sludges & Other Special Industrial Wastes 0.2% 0.2% 9,731 11,004
R/C Organics 0.5% 0.2% 26,826 9,155
Estimated Origin Specified Disposed Tons* 100% 5,275,514
Sample Count 520
* There are 42 tons with an unspecified origin that are not included in the detailed composition estimate
calculations. The actual statewide disposal total is 5,275,558 tons.
Confidence intervals calculated at the 90% confidence level. Percentages for material types may not total 100% due
to rounding.

2020-2021 Washington Statewide Waste Characterization Study
Final Report
August 2021 | 19
Commercial Waste
This section characterizes the disposed waste stream from the commercial sector for the entire state of
Washington, combining commercial samples from all six WGAs considered in this study. Composition and
quantity estimates are generated from data collected from all counties visited during the 2020-2021
statewide study and are presented using the material list of 143 material types.
OVERVIEW BY MATERIAL CLASS
Figure 6 below presents the composition of the commercial disposed waste stream by material class.
Organics accounts for 17.1 percent of the disposed waste, followed by Wood Debris (14.8%), and Paper
Packaging (14.2%). Figure 7 presents the composition by material groupings that combine packaging and
product material types. Paper accounts for 22.3 percent and Plastic is 16.6 percent of the commercial
disposed waste stream.
Figure 6: Commercial Disposed Waste Sector Composition by Material Class, 2020-2021

2020-2021 Washington Statewide Waste Characterization Study
Final Report
August 2021 | 20
Figure 7: Commercial Disposed Waste Sector Composition by Material Class, Combined Packaging and Products, 2020-2021
OVERVIEW OF PACKAGING AND PRODUCT MATERIAL GROUPS
Figure 8 below shows that Packaging materials account for 27.1 percent and Products account for 19.9
percent of the commercial disposed waste stream. See Appendix A: List and Definitions of Material Types for
a material list that shows the material types included in Packaging and Product materials groups.
Figure 8: Commercial Disposed Waste Sector Packaging, Products, and Other Material Groups, 2020-2021

2020-2021 Washington Statewide Waste Characterization Study
Final Report
August 2021 | 21
FIFTEEN MOST PREVALENT MATERIALS
The fifteen most prevalent material types in the commercial waste stream, as shown in Table 15, together
make up 52.1 percent. Cardboard and Kraft paper (7.7%), edible food waste- vegetative (7.1%), and pallets
and crates (3.6%) are the most prevalent material types.
Table 15: Commercial Disposed Waste Sector Fifteen Most Prevalent Material Types, 2020-2021
DETAILED COMPOSITION
Table 16 below shows the detailed composition results by material type in the commercial disposed waste
stream.
MaterialEst.
PercentEst. Tons
Cardboard & Kraft Packaging 7.7% 115,957
Edible Food Waste- Vegetative 7.1% 107,297
Pallets & Crates 3.6% 54,093
Other Ferrous Metal 3.4% 50,519
Compostable Paper Products 3.2% 48,079
Compostable Paper Packaging 3.1% 47,238
Engineered Wood 3.0% 45,466
Edible Food Waste- Meats/Fats/Oils 2.9% 44,308
Inedible Food Waste- Vegetative 2.9% 43,988
Packaging Film Plastic 2.9% 43,724
Painted Wood 2.9% 43,104
Dimensional Lumber 2.8% 42,455
Bulky Rigid Plastic Products 2.2% 33,486
Concrete 2.2% 33,145
Drywall 2.1% 32,117
Total for Top Materials 52.1% 784,975
Percentages for material types may not total 100% due to rounding.

2020-2021 Washington Statewide Waste Characterization Study
Draft Report
June 2021 | 22
Table 16: Commercial Disposed Waste Sector, Detailed Composition, 2020-2021
Material
Est.
Percent + / - Est. Tons Tons + / - Material
Est.
Percent + / - Est. Tons Tons + / -
PAPER 22.3% 2.1% 336,761 31,095 WOOD DEBRIS 14.8% 2.4% 222,837 35,852
PAPER PACKAGING 14.2% 1.7% 214,313 25,765 Natural Wood 0.0% 0.0% 356 301
Newspaper Packaging 0.0% 0.0% 21 26 Treated Wood 0.2% 0.1% 3,747 2,097
Cardboard & Kraft Packaging 7.7% 1.3% 115,957 19,467 Painted Wood 2.9% 1.1% 43,104 17,260
Mixed/Low-grade Paper Packaging 1.8% 0.6% 26,876 9,185 Dimensional Lumber 2.8% 0.8% 42,455 12,482
Aseptic Containers 0.1% 0.0% 1,071 325 Engineered Wood 3.0% 0.8% 45,466 11,682
Gable Top Containers 0.3% 0.3% 4,532 4,498 Pallets & Crates 3.6% 1.1% 54,093 16,914
Other Polycoated Packaging 0.0% 0.0% 679 302 Other Untreated Wood 0.0% 0.0% 277 145
Compostable Paper Packaging 3.1% 0.7% 47,238 11,231 Wood By-products 0.6% 0.3% 8,334 5,104
R/C Paper Packaging 1.2% 0.7% 17,941 11,173 R/C Wood Debris 1.7% 0.6% 25,005 9,233
PAPER PRODUCTS 8.1% 1.1% 122,448 16,868 CONSTRUCTION MATERIALS 10.1% 2.3% 152,636 34,137
Newspaper Products 0.2% 0.1% 2,950 1,136 Plastic Lumber 0.2% 0.2% 3,600 3,433
Cardboard & Kraft Paper Products 0.4% 0.6% 5,837 9,159 Insulation 0.5% 0.6% 7,725 8,906
Magazines 0.2% 0.1% 2,968 2,156 Asphalt Paving 0.1% 0.1% 1,087 1,751
High-Grade Paper Products 0.5% 0.2% 6,804 3,427 Concrete 2.2% 1.2% 33,145 18,486
Other Groundwood Paper Products 0.0% 0.0% 607 612 Drywall 2.1% 1.2% 32,117 17,824
Mixed/Low-grade Paper Products 1.7% 0.4% 26,303 6,388 Carpet 1.1% 0.6% 17,068 9,737
Compostable Paper Products 3.2% 0.5% 48,079 7,530 Carpet Padding 0.5% 0.4% 7,598 6,597
R/C Paper Products 1.9% 0.6% 28,901 8,589 Soil, Rocks, & Sand 0.6% 0.3% 8,834 4,535
PLASTIC 16.6% 1.7% 249,724 25,315 Asphalt Roofing 0.3% 0.4% 4,736 5,758
PLASTIC PACKAGING 10.0% 1.3% 150,522 19,944 Plastic Floor Covering 0.0% 0.0% 269 309
#1 PETE Plastic Bottles 0.5% 0.1% 7,929 1,309 Ceramics & Brick 0.6% 0.4% 8,692 6,577
#1 PETE Plastic Non-bottles 0.3% 0.1% 5,143 999 R/C Construction Materials 1.8% 0.8% 27,766 11,763
#2 HDPE Plastic Natural Bottles 0.2% 0.0% 3,093 629 CONSUMER PRODUCTS 5.3% 1.3% 80,375 20,193
#2 HDPE Plastic Jars and Tubs 0.5% 0.1% 8,038 2,162 Televisions - LCD 0.1% 0.2% 2,122 3,425
#2 HDPE Plastic Colored Bottles 0.2% 0.0% 2,540 543 Televisions - CRT 0.1% 0.1% 1,575 1,801
#3 PVC Plastic Packaging 0.0% 0.0% 28 38 Television Peripherals 0.0% 0.0% 0 0
#4 LDPE Plastic Packaging 0.0% 0.0% 11 7 Computer Monitors - CRT 0.0% 0.0% 0 0
#5 PP Plastic Packaging 0.8% 0.2% 11,384 2,755 Computer Monitors - LCD 0.0% 0.0% 0 0
#6 PS Plastic Packaging 0.1% 0.0% 1,726 389 Computers 0.0% 0.0% 0 0
#7 Other/Unknown Plastic Packaging 1.5% 0.8% 22,659 12,346 Computer Peripherals 0.0% 0.0% 436 704
Expanded Polystyrene Packaging 0.7% 0.2% 10,579 2,494 Computer Printers 0.0% 0.1% 466 760
PLA Compostable Packaging 0.0% 0.0% 324 138 Audio Equipment 0.0% 0.0% 0 0
Plastic Merchandise Bags 0.2% 0.0% 3,112 498 Electronic Gaming Equipment 0.0% 0.0% 0 0
Packaging Film Plastic 2.9% 0.5% 43,724 7,198 Other Consumer Electronics 0.1% 0.1% 1,062 1,152
Transportation Packaging Film Plastic 1.3% 0.4% 19,882 5,588 Textiles- Organic 1.6% 0.5% 24,259 6,801
Flexible Plastic Packaging 0.1% 0.1% 1,565 1,173 Textiles- Synthetic/Mixed/Unknown 1.3% 0.6% 19,724 9,012
R/C Plastic Packaging 0.6% 0.5% 8,786 8,194 Shoes/Purses/Belts 0.1% 0.1% 2,063 1,191
PLASTIC PRODUCTS 6.6% 0.9% 99,202 13,669 Tires & Other Rubber 0.5% 0.2% 8,146 3,483
#1 PETE Plastic Products 0.0% 0.0% 7 9 Furniture 1.3% 0.9% 19,305 13,288
#2 HDPE Plastic Products: 0.0% 0.0% 179 222 Mattresses 0.1% 0.1% 1,217 1,956
#3 PVC Plastic Products 0.0% 0.0% 39 64 R/C Consumer Products 0.0% 0.0% 0 0
#4 LDPE Plastic Products 0.0% 0.0% 1 2 HAZARDOUS AND SPECIAL WASTES 3.1% 1.4% 46,364 21,071
#5 PP Plastic Products 0.0% 0.0% 66 56 Pesticides 0.0% 0.0% 0 0
#6 PS Plastic Products 0.0% 0.0% 329 112 HID/UV/Germicidal Lamps 0.0% 0.0% 253 352
#7 Other/Unknown Plastic Products 1.1% 0.3% 15,988 4,237 Compact Florescent Lamps 0.0% 0.0% 29 36
PLA Compostable Products 0.0% 0.0% 157 99 Florescent Tubes 0.0% 0.0% 141 230
Plastic Garbage Bags 1.6% 0.2% 24,287 3,520 Water-based Paint 0.1% 0.1% 2,021 2,161
Plastic Non-bag Film Products 0.8% 0.5% 11,828 7,581 Solvent-based Adhesives/Glues 0.0% 0.0% 293 258
Bulky Rigid Plastic Products 2.2% 0.6% 33,486 9,117 Water-based Adhesives/Glues 0.0% 0.0% 8 13
R/C Plastic Products 0.9% 0.3% 12,834 3,771 Oil-based Paint 0.0% 0.0% 0 0
GLASS 1.7% 0.5% 25,311 7,703 Lacquer/Varnish/Urethane Coatings/Stains 0.0% 0.0% 45 73
Clear Glass Containers 0.6% 0.2% 8,425 2,597 Field & Lawn Markings 0.0% 0.0% 0 0
Green Glass Containers 0.3% 0.1% 4,586 2,145 Primers/Sealings/Coatings 0.0% 0.0% 368 593
Brown/Other Colored Glass Containers 0.3% 0.1% 4,719 1,838 Water Repellents & Waterproofers 0.0% 0.1% 705 1,137
Plate Glass 0.4% 0.3% 5,808 5,112 Solvents 0.1% 0.2% 1,841 2,922
Non-glass Ceramics 0.1% 0.1% 1,461 1,390 Caustic Cleaners 0.0% 0.0% 53 82
R/C Glass 0.0% 0.0% 311 209 Dry-cell Batteries- Single Use 0.0% 0.0% 138 97
METAL 6.6% 1.0% 99,642 15,254 Dry-cell Batteries- Rechargeable 0.0% 0.0% 102 166
Aluminum Beverage Cans 0.3% 0.1% 5,016 909 Wet-cell Batteries 0.0% 0.0% 0 0
Aluminum Foil/Containers 0.1% 0.0% 2,042 524 Gasoline/Kerosene 0.0% 0.0% 42 68
Other Aluminum 0.1% 0.0% 875 654 Motor Oil 0.0% 0.0% 257 347
Other Non-ferrous Metal 0.1% 0.0% 1,113 460 Antifreeze 0.0% 0.0% 0 0
Food Cans - Tinned 0.5% 0.2% 7,030 2,446 Other Vehicle Fluids 0.0% 0.0% 0 0
Food Cans - Coated 0.0% 0.0% 151 117 Oil Filters 0.1% 0.1% 1,459 1,107
White Goods 0.1% 0.2% 2,239 3,640 Explosives 0.0% 0.0% 0 0
Other Ferrous Metal 3.4% 0.7% 50,519 10,546 Medical Wastes 2.3% 1.4% 33,978 20,463
R/C Metal 2.0% 0.5% 30,656 8,031 Sharps 0.0% 0.0% 9 7
ORGANICS 17.1% 2.1% 257,693 32,277 Pharmaceuticals & Vitamins 0.0% 0.0% 112 78
Edible Food Waste- Vegetative 7.1% 1.2% 107,297 17,978 Other Cleaners/Chemicals 0.0% 0.0% 113 133
Inedible Food Waste- Vegetative 2.9% 0.8% 43,988 12,574 Personal Care Products 0.2% 0.1% 2,286 1,304
Edible Food Waste- Meats/Fats/Oils 2.9% 0.8% 44,308 11,321 Other Potentially Hazardous Wastes 0.1% 0.1% 2,110 1,370
Inedible Food Waste- Meats/Fats/Oils 0.7% 0.3% 10,570 4,351 RESIDUALS 2.4% 0.9% 35,853 13,788
Yard/Garden Waste- Leaves and Grass 1.2% 0.5% 17,419 7,484 Disposable Diapers 1.0% 0.5% 15,252 7,942
Yard/Garden Waste- Prunings 0.5% 0.2% 7,560 3,606 Ash 0.0% 0.0% 208 239
Animal Manure 0.7% 0.3% 11,257 4,202 Dust 0.0% 0.0% 164 196
Animal Carcasses & Offal 0.0% 0.0% 101 158 Fines/Sorting Residues 0.7% 0.2% 10,498 2,398
Food Processing Wastes 0.8% 0.7% 11,854 11,169 Sludges & Other Special Industrial Wastes 0.6% 0.7% 9,731 11,004
R/C Organics 0.2% 0.1% 3,339 1,564
Estimated Origin Specified Disposed Tons 100% 1,507,195
Sample Count 240Confidence intervals calculated at the 90% confidence level. Percentages for material types may not
total 100% due to rounding.

2020-2021 Washington Statewide Waste Characterization Study
Final Report
August 2021 | 23
Residential Waste
This section characterizes the disposed waste stream from the residential sector for the entire state of
Washington, combining residential samples from all six WGAs considered in this study. Composition and
quantity estimates are generated from data collected from all counties visited during the 2020-2021
statewide study and use the material list of 143 material types.
OVERVIEW BY MATERIAL CLASS
Figure 9 below presents the composition of the residential disposed waste stream by material class. Organics
accounts for about one-third (33.1%) of the disposed waste. Paper Packaging, Paper Products, and Plastic
Packaging each make up approximately 8.5 percent of the disposed waste. Figure 10 presents the
composition by material groupings that combine packaging and product material types. Paper accounts for
17 percent and Plastic is 13.6 percent of the residential disposed waste stream.
Figure 9: Residential Disposed Waste Sector Composition by Material Class, 2020-2021

2020-2021 Washington Statewide Waste Characterization Study
Final Report
August 2021 | 24
Figure 10: Residential Disposed Waste Sector Composition by Material Class, Combined Packaging and Products, 2020-2021
OVERVIEW OF PACKAGING AND PRODUCT MATERIAL GROUPS
As shown in Figure 11, Products account for 21.6 percent and Packaging materials account for 21.2 percent
of the commercial disposed waste stream. See Appendix A: List and Definitions of Material Types for a
material list that shows the material types included in Packaging and Product materials groups.
Figure 11: Residential Disposed Waste Sector Packaging, Products, and Other Material Groups, 2020-2021

2020-2021 Washington Statewide Waste Characterization Study
Final Report
August 2021 | 25
FIFTEEN MOST PREVALENT MATERIALS
The fifteen most prevalent material types, as shown in Table 17, together make up 58.1 percent of the
residential waste stream. Animal manure (9.7%), edible food waste-vegetative (8.2%), and inedible food
waste-vegetative (7.6%) are the most prevalent material types.
Table 17: Residential Disposed Waste Sector Fifteen Most Prevalent Material Types, 2020-2021
DETAILED COMPOSITION
Table 18 below shows the detailed composition results by material type in the residential disposed waste
stream.
MaterialEst.
PercentEst. Tons
Animal Manure 9.7% 229,270
Edible Food Waste- Vegetative 8.2% 193,984
Inedible Food Waste- Vegetative 7.6% 179,866
Compostable Paper Products 5.1% 121,120
Cardboard & Kraft Packaging 3.2% 74,829
Painted Wood 3.1% 73,931
Packaging Film Plastic 2.9% 68,306
Drywall 2.9% 67,141
Other Ferrous Metal 2.6% 61,914
Edible Food Waste- Meats/Fats/Oils 2.6% 60,303
Compostable Paper Packaging 2.4% 56,268
Mixed/Low-grade Paper Products 2.1% 48,296
Yard/Garden Waste- Leaves and Grass 2.0% 48,084
Mixed/Low-grade Paper Packaging 1.9% 43,568
R/C Metal 1.7% 40,607
Total for Top Materials 58.1% 1,367,487
Percentages for material types may not total 100% due to rounding.

2020-2021 Washington Statewide Waste Characterization Study
Draft Report
June 2021 | 26
Table 18: Residential Disposed Waste Sector, Detailed Composition, 2020-2021
Material
Est.
Percent + / - Est. Tons Tons + / - Material
Est.
Percent + / - Est. Tons Tons + / -
PAPER 17.0% 2.5% 400,887 59,327 WOOD DEBRIS 5.1% 3.5% 120,314 83,340
PAPER PACKAGING 8.5% 1.5% 200,259 36,124 Natural Wood 0.3% 0.5% 7,883 10,852
Newspaper Packaging 0.0% 0.0% 149 158 Treated Wood 0.3% 0.2% 6,866 4,510
Cardboard & Kraft Packaging 3.2% 0.8% 74,829 17,973 Painted Wood 3.1% 2.6% 73,931 61,425
Mixed/Low-grade Paper Packaging 1.9% 0.3% 43,568 8,144 Dimensional Lumber 0.1% 0.0% 2,284 925
Aseptic Containers 0.1% 0.0% 3,456 1,012 Engineered Wood 0.5% 0.6% 12,389 14,004
Gable Top Containers 0.2% 0.1% 4,449 1,221 Pallets & Crates 0.0% 0.0% 237 285
Other Polycoated Packaging 0.1% 0.0% 2,772 676 Other Untreated Wood 0.1% 0.1% 1,528 1,311
Compostable Paper Packaging 2.4% 1.1% 56,268 25,015 Wood By-products 0.0% 0.1% 944 1,215
R/C Paper Packaging 0.6% 0.2% 14,767 4,706 R/C Wood Debris 0.6% 0.4% 14,253 8,892
PAPER PRODUCTS 8.5% 1.5% 200,628 35,988 CONSTRUCTION MATERIALS 5.1% 4.2% 120,030 99,728
Newspaper Products 0.5% 0.3% 12,063 7,025 Plastic Lumber 0.1% 0.1% 2,594 3,453
Cardboard & Kraft Paper Products 0.0% 0.0% 84 136 Insulation 0.0% 0.0% 672 595
Magazines 0.3% 0.2% 6,701 3,687 Asphalt Paving 0.0% 0.1% 877 1,410
High-Grade Paper Products 0.2% 0.1% 3,603 1,194 Concrete 0.5% 0.7% 12,065 16,001
Other Groundwood Paper Products 0.0% 0.0% 538 754 Drywall 2.9% 4.2% 67,141 98,416
Mixed/Low-grade Paper Products 2.1% 0.5% 48,296 12,734 Carpet 0.8% 0.7% 19,966 17,441
Compostable Paper Products 5.1% 0.8% 121,120 19,903 Carpet Padding 0.0% 0.0% 236 249
R/C Paper Products 0.3% 0.2% 8,221 4,278 Soil, Rocks, & Sand 0.3% 0.2% 8,203 5,638
PLASTIC 13.6% 1.0% 319,227 23,166 Asphalt Roofing 0.0% 0.0% 168 184
PLASTIC PACKAGING 8.6% 1.1% 202,388 25,942 Plastic Floor Covering 0.0% 0.0% 0 0
#1 PETE Plastic Bottles 1.1% 0.2% 24,945 4,536 Ceramics & Brick 0.1% 0.1% 2,267 2,458
#1 PETE Plastic Non-bottles 0.6% 0.1% 13,065 1,688 R/C Construction Materials 0.2% 0.4% 5,840 8,328
#2 HDPE Plastic Natural Bottles 0.2% 0.1% 5,840 1,371 CONSUMER PRODUCTS 7.5% 2.2% 176,272 50,982
#2 HDPE Plastic Jars and Tubs 0.1% 0.0% 3,411 996 Televisions - LCD 0.2% 0.2% 4,236 4,685
#2 HDPE Plastic Colored Bottles 0.3% 0.1% 6,898 1,556 Televisions - CRT 0.2% 0.2% 3,593 5,777
#3 PVC Plastic Packaging 0.0% 0.0% 11 12 Television Peripherals 0.0% 0.0% 0 0
#4 LDPE Plastic Packaging 0.0% 0.0% 66 56 Computer Monitors - CRT 0.0% 0.1% 954 1,487
#5 PP Plastic Packaging 1.1% 0.2% 25,081 3,672 Computer Monitors - LCD 0.0% 0.0% 0 0
#6 PS Plastic Packaging 0.1% 0.0% 3,250 458 Computers 0.0% 0.0% 0 0
#7 Other/Unknown Plastic Packaging 0.5% 0.1% 11,534 2,278 Computer Peripherals 0.0% 0.1% 1,121 1,715
Expanded Polystyrene Packaging 0.7% 0.2% 15,412 4,267 Computer Printers 0.1% 0.1% 3,183 2,237
PLA Compostable Packaging 0.0% 0.0% 896 416 Audio Equipment 0.0% 0.0% 0 0
Plastic Merchandise Bags 0.7% 0.2% 17,574 3,963 Electronic Gaming Equipment 0.0% 0.0% 0 0
Packaging Film Plastic 2.9% 0.4% 68,306 9,484 Other Consumer Electronics 0.5% 0.4% 11,211 8,516
Transportation Packaging Film Plastic 0.1% 0.0% 2,654 985 Textiles- Organic 2.7% 0.7% 64,559 15,895
Flexible Plastic Packaging 0.1% 0.0% 3,128 576 Textiles- Synthetic/Mixed/Unknown 1.2% 0.5% 27,410 11,623
R/C Plastic Packaging 0.0% 0.0% 319 418 Shoes/Purses/Belts 0.3% 0.1% 7,238 2,666
PLASTIC PRODUCTS 5.0% 1.4% 116,839 32,457 Tires & Other Rubber 0.4% 0.4% 9,954 8,801
#1 PETE Plastic Products 0.0% 0.0% 46 64 Furniture 0.3% 0.3% 6,906 6,092
#2 HDPE Plastic Products: 0.0% 0.0% 0 0 Mattresses 1.4% 2.0% 32,295 47,441
#3 PVC Plastic Products 0.0% 0.0% 0 0 R/C Consumer Products 0.2% 0.2% 3,612 5,078
#4 LDPE Plastic Products 0.0% 0.0% 4 7 HAZARDOUS AND SPECIAL WASTES 1.2% 0.5% 27,999 12,455
#5 PP Plastic Products 0.0% 0.0% 12 11 Pesticides 0.0% 0.0% 14 21
#6 PS Plastic Products 0.0% 0.0% 453 178 HID/UV/Germicidal Lamps 0.0% 0.0% 0 0
#7 Other/Unknown Plastic Products 1.2% 0.4% 27,476 8,489 Compact Florescent Lamps 0.0% 0.0% 718 644
PLA Compostable Products 0.0% 0.0% 189 139 Florescent Tubes 0.0% 0.0% 0 0
Plastic Garbage Bags 1.6% 0.3% 37,779 6,676 Water-based Paint 0.0% 0.0% 405 383
Plastic Non-bag Film Products 0.1% 0.1% 2,717 1,886 Solvent-based Adhesives/Glues 0.0% 0.0% 37 46
Bulky Rigid Plastic Products 1.3% 1.3% 30,250 29,898 Water-based Adhesives/Glues 0.0% 0.0% 259 176
R/C Plastic Products 0.8% 0.3% 17,912 6,232 Oil-based Paint 0.2% 0.3% 5,210 8,169
GLASS 3.3% 1.0% 77,299 22,386 Lacquer/Varnish/Urethane Coatings/Stains 0.0% 0.0% 9 15
Clear Glass Containers 1.7% 0.4% 39,377 10,048 Field & Lawn Markings 0.0% 0.0% 0 0
Green Glass Containers 0.7% 0.3% 16,424 8,100 Primers/Sealings/Coatings 0.0% 0.0% 71 86
Brown/Other Colored Glass Containers 0.5% 0.2% 10,648 4,718 Water Repellents & Waterproofers 0.0% 0.0% 30 47
Plate Glass 0.0% 0.0% 301 430 Solvents 0.0% 0.0% 93 145
Non-glass Ceramics 0.3% 0.3% 6,480 7,069 Caustic Cleaners 0.0% 0.0% 543 641
R/C Glass 0.2% 0.1% 4,068 2,009 Dry-cell Batteries- Single Use 0.1% 0.0% 1,324 740
METAL 6.4% 1.8% 149,650 43,214 Dry-cell Batteries- Rechargeable 0.0% 0.0% 442 701
Aluminum Beverage Cans 0.6% 0.1% 13,037 2,757 Wet-cell Batteries 0.0% 0.0% 0 0
Aluminum Foil/Containers 0.3% 0.1% 7,635 1,811 Gasoline/Kerosene 0.0% 0.0% 0 0
Other Aluminum 0.1% 0.1% 1,604 1,960 Motor Oil 0.0% 0.0% 0 0
Other Non-ferrous Metal 0.2% 0.1% 4,614 2,943 Antifreeze 0.0% 0.0% 0 0
Food Cans - Tinned 0.6% 0.1% 13,936 1,430 Other Vehicle Fluids 0.0% 0.0% 0 0
Food Cans - Coated 0.0% 0.0% 694 268 Oil Filters 0.0% 0.0% 217 227
White Goods 0.2% 0.3% 5,611 7,400 Explosives 0.0% 0.0% 0 0
Other Ferrous Metal 2.6% 1.6% 61,914 37,064 Medical Wastes 0.5% 0.4% 11,533 9,815
R/C Metal 1.7% 0.7% 40,607 15,371 Sharps 0.0% 0.0% 148 187
ORGANICS 33.1% 5.9% 778,319 138,763 Pharmaceuticals & Vitamins 0.2% 0.2% 4,091 4,006
Edible Food Waste- Vegetative 8.2% 1.1% 193,984 26,228 Other Cleaners/Chemicals 0.0% 0.0% 72 85
Inedible Food Waste- Vegetative 7.6% 1.4% 179,866 32,398 Personal Care Products 0.1% 0.0% 2,167 1,010
Edible Food Waste- Meats/Fats/Oils 2.6% 0.7% 60,303 16,719 Other Potentially Hazardous Wastes 0.0% 0.0% 615 371
Inedible Food Waste- Meats/Fats/Oils 0.5% 0.2% 12,283 5,797 RESIDUALS 7.8% 2.6% 182,773 61,211
Yard/Garden Waste- Leaves and Grass 2.0% 1.5% 48,084 34,386 Disposable Diapers 6.0% 2.6% 141,555 61,419
Yard/Garden Waste- Prunings 1.3% 1.2% 31,684 28,899 Ash 0.1% 0.1% 1,279 2,057
Animal Manure 9.7% 3.6% 229,270 85,025 Dust 0.0% 0.0% 161 113
Animal Carcasses & Offal 0.1% 0.1% 1,403 2,249 Fines/Sorting Residues 1.7% 0.4% 39,779 10,054
Food Processing Wastes 0.0% 0.0% 0 0 Sludges & Other Special Industrial Wastes 0.0% 0.0% 0 0
R/C Organics 0.9% 0.4% 21,442 8,857
Estimated Origin Specified Disposed Tons 100% 2,352,770
Sample Count 120
Confidence intervals calculated at the 90% confidence level. Percentages for material types may not
total 100% due to rounding.

2020-2021 Washington Statewide Waste Characterization Study
Final Report
August 2021 | 27
Self-hauled Waste
This section characterizes the disposed waste stream from the self-hauled sector for the entire state of
Washington, combining self-hauled samples from all six WGAs considered in this study. Composition and
quantity estimates are generated from data collected from all counties visited during the 2020-2021
statewide study and use the material list of 143 material types.
OVERVIEW BY MATERIAL CLASS
Figure 12 below presents the composition of the self-hauled disposed waste stream by material class. Wood
Debris accounts for over one-quarter (26.0%), Construction Materials make up 20.5 percent, and Organics
account of 11.7 percent of the disposed waste. Figure 13 presents the composition by material groupings
that combine packaging and product material types. Paper accounts for 10 percent and Plastic is 8.7 percent
of the self-hauled disposed waste stream.
Figure 12: Self-hauled Disposed Waste Sector Composition by Material Class, 2020-2021

2020-2021 Washington Statewide Waste Characterization Study
Final Report
August 2021 | 28
Figure 13: Self-hauled Disposed Waste Sector Composition by Material Class, Combined Packaging and Products, 2020-2021
OVERVIEW OF PACKAGING AND PRODUCT MATERIAL GROUPS
As shown in Figure 14, Products account for 18.8 percent and Packaging materials account for 10.7 percent
of the self-hauled disposed waste stream. See Appendix A: List and Definitions of Material Types for a
material list that shows the material types included in Packaging and Product materials groups.
Figure 14: Self-hauled Disposed Waste Sector Packaging, Products, and Other Material Groups, 2020-2021

2020-2021 Washington Statewide Waste Characterization Study
Final Report
August 2021 | 29
FIFTEEN MOST PREVALENT MATERIALS
The fifteen most prevalent material types, as shown in Table 19, together make up nearly 63 percent of the
self-hauled waste stream. Painted wood (9.7%), asphalt roofing (6.2%), and cardboard and Kraft packaging
(6.0%) are the most prevalent material types.
Table 19: Self-hauled Disposed Waste Sector Fifteen Most Prevalent Material Types, 2020-2021
DETAILED COMPOSITION
Table 20 below shows the detailed composition results by material type in the self-hauled disposed waste
stream.
MaterialEst.
PercentEst. Tons Cuml. Percent
Painted Wood 9.7% 136,923 9.7%
Asphalt Roofing 6.2% 87,179 15.8%
Cardboard & Kraft Packaging 6.0% 85,410 21.9%
Drywall 4.8% 68,528 26.7%
R/C Metal 4.8% 68,391 31.5%
Yard/Garden Waste- Leaves and Grass 4.7% 66,715 36.3%
Other Ferrous Metal 4.4% 61,932 40.6%
R/C Wood Debris 3.9% 55,831 44.6%
Engineered Wood 3.9% 55,043 48.5%
Dimensional Lumber 3.3% 46,271 51.7%
Edible Food Waste- Vegetative 2.5% 35,283 54.2%
Bulky Rigid Plastic Products 2.4% 34,458 56.7%
R/C Construction Materials 2.2% 30,868 58.8%
Pallets & Crates 2.2% 30,662 61.0%
Inedible Food Waste- Vegetative 1.9% 27,006 62.9%
Total for Top Materials 62.9% 890,500 62.9%
Percentages for material types may not total 100% due to rounding.

2020-2021 Washington Statewide Waste Characterization Study
Draft Report
June 2021 | 30
Table 20: Self-hauled Disposed Waste Sector, Detailed Composition, 2020-2021
Material
Est.
Percent + / - Est. Tons Tons + / - Material
Est.
Percent + / - Est. Tons Tons + / -
PAPER 10.0% 3.6% 142,242 51,070 WOOD DEBRIS 26.0% 6.9% 367,769 97,475
PAPER PACKAGING 7.1% 2.8% 99,833 39,965 Natural Wood 1.5% 2.2% 21,602 30,607
Newspaper Packaging 0.0% 0.0% 9 14 Treated Wood 1.3% 0.7% 18,033 9,706
Cardboard & Kraft Packaging 6.0% 2.7% 85,410 38,571 Painted Wood 9.7% 5.2% 136,923 73,996
Mixed/Low-grade Paper Packaging 0.5% 0.2% 7,722 3,021 Dimensional Lumber 3.3% 1.8% 46,271 25,122
Aseptic Containers 0.0% 0.0% 245 214 Engineered Wood 3.9% 1.7% 55,043 24,127
Gable Top Containers 0.0% 0.0% 513 427 Pallets & Crates 2.2% 1.4% 30,662 19,592
Other Polycoated Packaging 0.0% 0.0% 258 125 Other Untreated Wood 0.1% 0.1% 1,102 906
Compostable Paper Packaging 0.3% 0.1% 3,668 1,575 Wood By-products 0.2% 0.1% 2,301 1,893
R/C Paper Packaging 0.1% 0.1% 2,008 728 R/C Wood Debris 3.9% 2.4% 55,831 34,387
PAPER PRODUCTS 3.0% 1.2% 42,409 16,588 CONSTRUCTION MATERIALS 20.5% 7.1% 290,350 100,278
Newspaper Products 0.1% 0.0% 1,020 689 Plastic Lumber 1.8% 2.8% 25,393 39,843
Cardboard & Kraft Paper Products 0.0% 0.0% 32 46 Insulation 1.0% 0.8% 14,240 10,621
Magazines 0.1% 0.1% 1,432 1,047 Asphalt Paving 0.0% 0.0% 0 0
High-Grade Paper Products 0.1% 0.1% 1,257 723 Concrete 1.5% 2.0% 20,941 28,747
Other Groundwood Paper Products 0.0% 0.0% 17 28 Drywall 4.8% 3.4% 68,528 48,496
Mixed/Low-grade Paper Products 1.3% 0.9% 19,032 12,102 Carpet 1.1% 0.7% 14,878 9,945
Compostable Paper Products 0.8% 0.4% 11,166 5,602 Carpet Padding 0.5% 0.4% 6,502 5,868
R/C Paper Products 0.6% 0.7% 8,453 9,968 Soil, Rocks, & Sand 0.7% 0.5% 10,480 6,786
PLASTIC 8.7% 2.1% 123,847 29,336 Asphalt Roofing 6.2% 5.5% 87,179 78,281
PLASTIC PACKAGING 2.5% 0.6% 35,617 7,872 Plastic Floor Covering 0.0% 0.0% 294 475
#1 PETE Plastic Bottles 0.2% 0.1% 3,337 961 Ceramics & Brick 0.8% 0.7% 11,047 9,416
#1 PETE Plastic Non-bottles 0.1% 0.0% 1,584 512 R/C Construction Materials 2.2% 1.1% 30,868 16,018
#2 HDPE Plastic Natural Bottles 0.0% 0.0% 587 235 CONSUMER PRODUCTS 9.6% 2.6% 135,640 36,991
#2 HDPE Plastic Jars and Tubs 0.2% 0.1% 2,895 1,650 Televisions - LCD 0.1% 0.1% 1,645 1,993
#2 HDPE Plastic Colored Bottles 0.1% 0.0% 1,212 356 Televisions - CRT 0.2% 0.2% 2,457 2,258
#3 PVC Plastic Packaging 0.0% 0.0% 10 10 Television Peripherals 0.0% 0.0% 0 0
#4 LDPE Plastic Packaging 0.0% 0.0% 8 12 Computer Monitors - CRT 0.0% 0.0% 0 0
#5 PP Plastic Packaging 0.2% 0.1% 2,172 894 Computer Monitors - LCD 0.0% 0.0% 0 0
#6 PS Plastic Packaging 0.0% 0.0% 411 246 Computers 0.0% 0.1% 670 770
#7 Other/Unknown Plastic Packaging 0.2% 0.0% 2,133 694 Computer Peripherals 0.0% 0.0% 165 250
Expanded Polystyrene Packaging 0.3% 0.1% 3,844 1,398 Computer Printers 0.1% 0.1% 1,190 986
PLA Compostable Packaging 0.0% 0.0% 136 209 Audio Equipment 0.1% 0.1% 1,026 1,445
Plastic Merchandise Bags 0.1% 0.0% 1,216 409 Electronic Gaming Equipment 0.1% 0.2% 1,847 2,898
Packaging Film Plastic 0.8% 0.3% 11,963 4,883 Other Consumer Electronics 0.2% 0.1% 2,484 1,316
Transportation Packaging Film Plastic 0.2% 0.1% 3,193 1,428 Textiles- Organic 2.6% 2.2% 36,528 30,761
Flexible Plastic Packaging 0.0% 0.0% 431 161 Textiles- Synthetic/Mixed/Unknown 1.1% 0.4% 15,652 5,055
R/C Plastic Packaging 0.0% 0.0% 485 565 Shoes/Purses/Belts 0.3% 0.2% 4,939 3,453
PLASTIC PRODUCTS 6.2% 2.1% 88,231 29,212 Tires & Other Rubber 0.4% 0.4% 5,494 5,095
#1 PETE Plastic Products 0.0% 0.0% 6 8 Furniture 3.0% 0.9% 43,044 12,802
#2 HDPE Plastic Products: 0.0% 0.0% 65 103 Mattresses 1.2% 0.6% 16,890 8,954
#3 PVC Plastic Products 0.0% 0.0% 27 44 R/C Consumer Products 0.1% 0.2% 1,608 2,402
#4 LDPE Plastic Products 0.0% 0.0% 0 0 HAZARDOUS AND SPECIAL WASTES 1.2% 0.6% 16,939 9,136
#5 PP Plastic Products 0.0% 0.0% 19 20 Pesticides 0.0% 0.0% 98 129
#6 PS Plastic Products 0.0% 0.0% 57 46 HID/UV/Germicidal Lamps 0.0% 0.0% 4 5
#7 Other/Unknown Plastic Products 1.3% 0.6% 17,738 8,176 Compact Florescent Lamps 0.0% 0.0% 25 18
PLA Compostable Products 0.0% 0.0% 40 61 Florescent Tubes 0.0% 0.0% 24 23
Plastic Garbage Bags 0.4% 0.1% 5,560 1,375 Water-based Paint 0.2% 0.3% 2,571 3,670
Plastic Non-bag Film Products 0.6% 0.3% 8,118 4,719 Solvent-based Adhesives/Glues 0.0% 0.0% 52 83
Bulky Rigid Plastic Products 2.4% 1.0% 34,458 14,169 Water-based Adhesives/Glues 0.0% 0.0% 79 79
R/C Plastic Products 1.6% 1.2% 22,143 16,486 Oil-based Paint 0.0% 0.0% 325 510
GLASS 1.3% 0.6% 17,930 8,771 Lacquer/Varnish/Urethane Coatings/Stains 0.0% 0.0% 0 0
Clear Glass Containers 0.3% 0.1% 4,381 1,567 Field & Lawn Markings 0.0% 0.0% 0 0
Green Glass Containers 0.0% 0.0% 658 409 Primers/Sealings/Coatings 0.0% 0.0% 108 174
Brown/Other Colored Glass Containers 0.1% 0.1% 1,402 715 Water Repellents & Waterproofers 0.0% 0.0% 35 57
Plate Glass 0.1% 0.1% 1,298 1,132 Solvents 0.0% 0.0% 11 18
Non-glass Ceramics 0.1% 0.0% 897 549 Caustic Cleaners 0.0% 0.0% 15 25
R/C Glass 0.7% 0.6% 9,294 8,716 Dry-cell Batteries- Single Use 0.0% 0.0% 422 484
METAL 10.4% 3.2% 146,774 45,805 Dry-cell Batteries- Rechargeable 0.0% 0.0% 157 244
Aluminum Beverage Cans 0.1% 0.0% 1,376 531 Wet-cell Batteries 0.0% 0.0% 0 0
Aluminum Foil/Containers 0.0% 0.0% 660 267 Gasoline/Kerosene 0.0% 0.0% 0 0
Other Aluminum 0.1% 0.0% 880 424 Motor Oil 0.0% 0.0% 0 0
Other Non-ferrous Metal 0.4% 0.4% 6,326 5,526 Antifreeze 0.0% 0.0% 351 464
Food Cans - Tinned 0.1% 0.0% 1,423 508 Other Vehicle Fluids 0.0% 0.0% 0 0
Food Cans - Coated 0.0% 0.0% 36 47 Oil Filters 0.0% 0.1% 565 801
White Goods 0.4% 0.3% 5,750 4,228 Explosives 0.0% 0.0% 0 0
Other Ferrous Metal 4.4% 2.3% 61,932 33,069 Medical Wastes 0.0% 0.0% 361 171
R/C Metal 4.8% 1.9% 68,391 27,062 Sharps 0.0% 0.0% 2 3
ORGANICS 11.7% 6.6% 165,912 93,238 Pharmaceuticals & Vitamins 0.2% 0.3% 3,059 3,691
Edible Food Waste- Vegetative 2.5% 1.4% 35,283 19,827 Other Cleaners/Chemicals 0.1% 0.1% 946 1,277
Inedible Food Waste- Vegetative 1.9% 2.0% 27,006 28,905 Personal Care Products 0.5% 0.4% 7,305 5,928
Edible Food Waste- Meats/Fats/Oils 0.4% 0.2% 4,961 2,709 Other Potentially Hazardous Wastes 0.0% 0.0% 423 297
Inedible Food Waste- Meats/Fats/Oils 0.1% 0.0% 1,079 662 RESIDUALS 0.6% 0.3% 8,147 4,289
Yard/Garden Waste- Leaves and Grass 4.7% 5.2% 66,715 74,221 Disposable Diapers 0.3% 0.2% 4,294 2,720
Yard/Garden Waste- Prunings 1.3% 1.4% 17,866 20,128 Ash 0.0% 0.0% 87 122
Animal Manure 0.7% 0.6% 10,237 9,063 Dust 0.0% 0.0% 90 63
Animal Carcasses & Offal 0.1% 0.1% 721 962 Fines/Sorting Residues 0.3% 0.2% 3,676 2,942
Food Processing Wastes 0.0% 0.0% 0 0 Sludges & Other Special Industrial Wastes 0.0% 0.0% 0 0
R/C Organics 0.1% 0.1% 2,044 1,710
Estimated Origin Specified Disposed Tons 100% 1,415,549
Sample Count 160
Confidence intervals calculated at the 90% confidence level. Percentages for material types may not
total 100% due to rounding.

2020-2021 Washington Statewide Waste Characterization Study
Final Report
August 2021 | 31
Comparison to the 2015-2016 Study
Comparing waste composition data collected during the previous statewide study with the current study
allows for a useful examination of trends and changes in the waste stream over time. This section presents
macro-level comparisons.
STATISTICAL COMPARISONS
This section presents findings from statistical comparisons between the 2020-2021 waste composition data
and data from the previous study (2015-2016). The analysis examines statistical differences, using t-tests,
between the two studies to determine if changes in the composition of Washington state’s disposed waste
stream are statistically significant. This report does not attempt an in-depth examination of potential causes
of the changes in waste composition over time.
The year-to-year comparisons were made by examining the changes in the composition percentages for
selected material groupings. The 2020-2021 analysis uses the same waste categories as the 2015-2016
analysis. The material groupings included:
Recyclable Paper
Recyclable Plastic
Recyclable Metal
Recyclable Glass
Food
Other Compostables
Wood/Construction Debris
E-Waste
Hazardous and Special Waste
Other Materials
Figure 15 presents how the material types from the 2020-2021 study were merged into the ten waste
categories chosen for analysis.

2020-2021 Washington Statewide Waste Characterization Study
Final Report
August 2021 | 32
Figure 15: T-test Material Categories
2020-2021 Statewide Study 2015-2016 Statewide Study T-test Categories
Paper Paper
Newspaper Products Newspaper Products
Newspaper Packaging Newspaper Packaging
Cardboard/Kraft Products Cardboard/Kraft Products
Cardboard/Kraft Packaging Cardboard/Kraft Packaging
High-grade Paper Products High-grade Papers
Magazines Magazines
Mixed/Low Grade PaperPackaging Mixed/Low Grade Packaging
Mixed Low Grade Paper Products Mixed Low Grade Paper Products
Aseptic Containers Aseptic and Polycoat Packaging
Gable Top Containers Groundwood Products
Other Polycoated Packaging Other Groundwood Packaging
Other Groundwood Paper Products
Compostable Paper Packaging Compostable Paper Packaging
Compostable Paper Products Compostable Paper Products
R/C Paper Products R/C Paper Products
R/C Paper Packaging R/C Paper Packaging
Paper Processing Sludge
Plastic Plastic
#1 PETE Plastic Bottles #1 PET Bottles
#2 HDPE Plastic Colored Bottles #2 HDPE Colored Bottles
#2 HDPE Plastic Natural Bottles #2 HDPE Natural Bottles
Recyclable Paper
Other Materials
Recyclable Plastic
Other Compostables

2020-2021 Washington Statewide Waste Characterization Study
Final Report
August 2021 | 33
2020-2021 Statewide Study 2015-2016 Statewide Study T-test Categories
Plastic Plastic
Plastic Garbage Bags Plastic Garbage Bags
Plastic Merchandise Bags Plastic Merchandise Bags
Plastic Non-bag Film Products Non-bag Plastic Film Products
Flexible Plastic Packaging Flexible Plastic Packaging
Packaging Film Plastic Industrial Plastic Packaging Film
Transportation Packaging Film Plastic Non-industrial Plastic Packaging Film
R/C Plastic Packaging R/C Plastic Packaging
R/C Plastic Products R/C Plastic Products
Expanded Polystyrene Packaging Expanded Polystyrene Packaging
PLA/Compostable Products PLA/Compostable Product
PLA/Compostable Packaging PLA/Compostable Packaging
#1 PETE Plastic Products #1 PET Product
#2 HDPE Plastic Products #2 HDPE Product
#3 PVC Plastic Products #3 PVC Product
#4 LDPE Plastic Products #4 LDPE Product
#5 PP Plastic Products #5 PP Product
#6 PS Plastic Products #6 PS Product
#7 Other/Unknown Plastic Products #7 Other Product
Bulky Rigid Plastic Products Bulky Rigid Plastic Products
#1 PETE Plastic Non-bottles #1 PET Non-bottles
#2 HDPE Plastic Jars & Tubs #2 HDPE Jars & Tubs
#3 PVC Plastic Packaging #3 PVC Packaging
#4 LDPE Plastic Packaging #4 LDPE Packaging
#5 PP Plastic Packaging #5 PP Packaging
#6 PS Plastic Packaging #6 PS Packaging
#7 Other/Unknown Plastic Packaging #7 Other Packaging
Other Materials

2020-2021 Washington Statewide Waste Characterization Study
Final Report
August 2021 | 34
2020-2021 Statewide Study 2015-2016 Statewide Study T-test Categories
Glass Glass
Clear Glass Containers Clear Glass Containers
Green Glass Containers Green Glass Containers
Brown/Other Colored Glass Containers Brown Glass Containers
Plate Glass Plate Glass
R/C Glass R/C Glass
Compact Fluorescent Lamps Compact Fluorescent Lamps
Fluorescent Tubes Fluorescent Tubes
Metal Metal
Aluminum Beverage Cans Aluminum Beverage Cans
Food Cans - Coated Food Cans - Coated
Food Cans - Tinned Food Cans - Tinned
Other Ferrous Metal Other Ferrous Metal
Other Non-ferrous Metal Other Non-ferrous Metal
Aluminum Foil/Containers Aluminum Foil/Containers
Other Aluminum Other Aluminum
R/C Metals R/C Metal
White Goods White Goods
Organics Organics
Edible Food Waste - Meats/Fats/Oils Edible Food - Meat, Fats, Oils
Edible Food Waste - Vegetative Edible Food - Vegetative
Inedible Food Waste - Meats/Fats/Oils Inedible Food - Meats, Fats, Oils
Inedible Food Waste - Vegetative Inedible Food - Vegetative
Yard & Garden Waste- Leaves & Grass Yard & Garden Waste, Leaves & Grass
Yard & Garden Waste- Prunings Yard & Garden Waste, Prunings
Food Processing Wastes Crop Residues
Fruit Waste
Food
Other Compostables
Recyclable Glass
Other Materials
Other Materials
Recyclable Metal

2020-2021 Washington Statewide Waste Characterization Study
Final Report
August 2021 | 35
2020-2021 Statewide Study 2015-2016 Statewide Study T-test Categories
Wood Debris Wood Debris
Dimensional Lumber Dimensional Lumber
Engineered Wood Engineered Wood
Other Untreated Wood Other Untreated Wood
Pallets & Crates Pallets & Crates
R/C Wood Debris R/C Wood
Wood By-Products Wood By-Products
Painted Wood Painted Wood
Treated Wood Treated Wood
Construction Materials Construction Materials
Asphalt Roofing Asphalt Roofing
Drywall Drywall
Carpet Carpet
Carpet Padding Carpet Padding
Natural Wood Natural Wood
Asphalt Paving Asphalt Paving
Ceramics & Brick Ceramics & Brick
Concrete Concrete
Insulation Insulation
Plastic Floor Covering Plastic Flooring
Plastic Lumber Plastic Lumber
R/C Construction Materials R/C Construction
Non-glass Ceramics Non-glass Ceramics
Wood/Construction
Debris
Wood/Construction
Debris

2020-2021 Washington Statewide Waste Characterization Study
Final Report
August 2021 | 36
2020-2021 Statewide Study 2015-2016 Statewide Study T-test Categories
Other Materials Other Materials
Medical Wastes Medical Wastes
Pharmaceuticals and Vitamins Pharmaceuticals/ Vitamins
Sharps Sharps
Dry-cell Batteries - Rechargeable Dry-cell Batteries - Rechargeable
Dry-cell Batteries - Single Use Dry-cell Batteries - Single Use
Gasoline/Kerosene Gasoline/Kerosene
Antifreeze Antifreeze
Motor Oil Motor Oil
Oil Fi lters Oil Fi lters
Oil-based Paint Oil-based Clear Coatings
Solvents Oil-based Paint
Solvent-based Adhesives/Glues Solvents
Water-based Adhesives/Glues Solvent-based Glues
Pesticides Water Based Glues
Caustic Cleaners Fungicides
Other Cleaners/Chemicals Herbicides
Explosives Pesticides
Field and Lawn Markings Caustic Cleaners
HID, UV, and Germicidal Lamps Other Cleaners/Chemicals
Lacquer, Varnish, Urethane Coatings, and
StainsAsbestos
Other Potentially Hazardous Wastes Concrete/Masonry/ Wood Waterproofers
Other Vehicle Fluids Deck Coatings/Floor Paint
Personal Care Products Explosives
Primers, Sealings, and Coatings Fertil izers
Water-based Paint Field/Lawn Markings
Water Repellents and Waterproofers HID Lamps
Wet-cell Batteries Lacquer
Other Potentially Hazardous Waste
Other Vehicle Fluids
Personal Care Products
Primers/Sealers
Rust Preventive Coatings
Stains
Urethane Coatings
UV/Germicidal Lamps
Varnish
Water Based Paints
Water Repellants
Wet-cell Batteries
Hazardous and Special
Waste

2020-2021 Washington Statewide Waste Characterization Study
Final Report
August 2021 | 37
The differences in composition percentages of material groupings between studies can be divided into two
categories:
Statistically significant. These findings can be considered true differences because the probability of
observing these results if there had been no actual year-to-year change is low.
Not statistically significant. The statistical tests did not detect a significant change and the data do not
otherwise suggest a noteworthy difference.
Because the waste composition results are expressed as percentages, rather than absolute tonnages,
significant changes for one material may affect the percentages for other materials. For example, increases
over time in materials recycled may alter the percentages for other materials remaining in the waste stream.
2020-2021 Statewide Study 2015-2016 Statewide Study T-test Categories
Other Materials Other Materials
Television Peripherals Television Peripherals E-Waste
Televisions - CRT Televisions - CRT
Televisions - LCD Televisions - LCD
Audio Equipment Audio Equipment
Computer Monitors - CRT Computer Monitors - CRT
Computer Monitors - LCD Computer Monitors - LCD
Computer Peripherals Computer Peripherals
Computer Printers Computer Printers
Computers Computers
Electronic Gaming Equipment Electronic Gaming Equipment
Other Consumer Electronics Other Consumer Electronics
Shoes, Purses, and Belts Shoes, Purses, Belts
Textiles - Organic Textiles - Organic
Textiles - Synthetic, Mixed, or Unknown Textiles - Synthetic, Mixed, Unknown
Tires and Other Rubber Tires & Rubber
Furniture Furniture
Mattresses Mattresses
Ash Ash
Dust Dust
Fines/Sorting Residues Fines/Sorting Residue
Sludges and Other Special Industrial Wastes Sludge/Special Industrial
Soil, Rocks, and Sand Soil, Rocks, Sand
R/C Consumer Products R/C Consumer Products
R/C Organics R/C Organics
Animal Carcasses Animal Carcasses
Disposable Diapers Disposable Diapers
Animal Manure Animal Manure
Other Materials
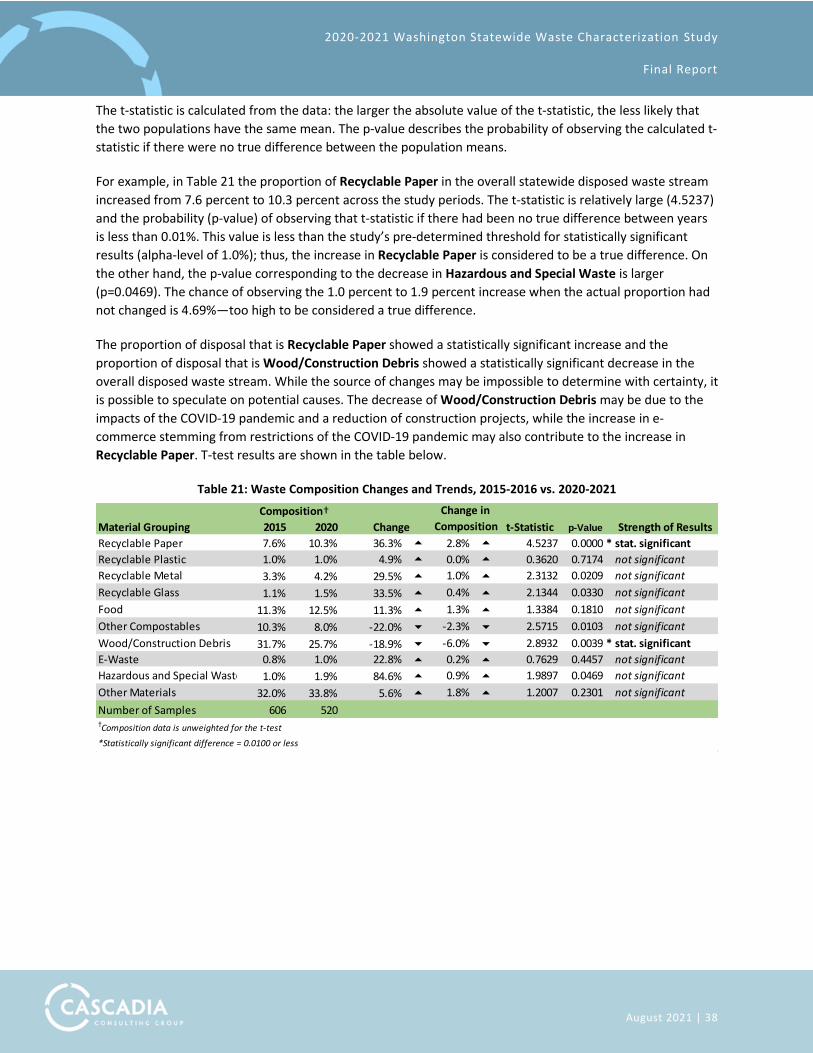
2020-2021 Washington Statewide Waste Characterization Study
Final Report
August 2021 | 38
The t-statistic is calculated from the data: the larger the absolute value of the t-statistic, the less likely that
the two populations have the same mean. The p-value describes the probability of observing the calculated t-
statistic if there were no true difference between the population means.
For example, in Table 21 the proportion of Recyclable Paper in the overall statewide disposed waste stream
increased from 7.6 percent to 10.3 percent across the study periods. The t-statistic is relatively large (4.5237)
and the probability (p-value) of observing that t-statistic if there had been no true difference between years
is less than 0.01%. This value is less than the study’s pre-determined threshold for statistically significant
results (alpha-level of 1.0%); thus, the increase in Recyclable Paper is considered to be a true difference. On
the other hand, the p-value corresponding to the decrease in Hazardous and Special Waste is larger
(p=0.0469). The chance of observing the 1.0 percent to 1.9 percent increase when the actual proportion had
not changed is 4.69%—too high to be considered a true difference.
The proportion of disposal that is Recyclable Paper showed a statistically significant increase and the
proportion of disposal that is Wood/Construction Debris showed a statistically significant decrease in the
overall disposed waste stream. While the source of changes may be impossible to determine with certainty, it
is possible to speculate on potential causes. The decrease of Wood/Construction Debris may be due to the
impacts of the COVID-19 pandemic and a reduction of construction projects, while the increase in e-
commerce stemming from restrictions of the COVID-19 pandemic may also contribute to the increase in
Recyclable Paper. T-test results are shown in the table below.
Table 21: Waste Composition Changes and Trends, 2015-2016 vs. 2020-2021
Material Grouping 2015 2020 Change t-Statistic p-Value
Recyclable Paper 7.6% 10.3% 36.3% 5 2.8% 5 4.5237 0.0000 * stat. significant
Recyclable Plastic 1.0% 1.0% 4.9% 5 0.0% 5 0.3620 0.7174 not significant
Recyclable Metal 3.3% 4.2% 29.5% 5 1.0% 5 2.3132 0.0209 not significant
Recyclable Glass 1.1% 1.5% 33.5% 5 0.4% 5 2.1344 0.0330 not significant
Food 11.3% 12.5% 11.3% 5 1.3% 5 1.3384 0.1810 not significant
Other Compostables 10.3% 8.0% -22.0% 6 -2.3% 6 2.5715 0.0103 not significant
Wood/Construction Debris 31.7% 25.7% -18.9% 6 -6.0% 6 2.8932 0.0039 * stat. significant
E-Waste 0.8% 1.0% 22.8% 5 0.2% 5 0.7629 0.4457 not significant
Hazardous and Special Waste 1.0% 1.9% 84.6% 5 0.9% 5 1.9897 0.0469 not significant
Other Materials 32.0% 33.8% 5.6% 5 1.8% 5 1.2007 0.2301 not significant
Number of Samples 606 520†Composition data is unweighted for the t-test
*Statistically significant difference = 0.0100 or less
Composition† Change in
Strength of ResultsComposition
2020-2021 Washington Statewide Waste Characterization Study
Final Report
August 2021 | 39
Appendix A: List and Definitions of Material
Types
Introduction
This section includes the list and definitions of the material types used in this study. The field crew sorted
materials into the 143 material types defined below. To be comparable to the 2015-2016 study, the list of
material types is designed to be organized by material class, by packaging and product material groups, and
“rolled up” into a condensed list used for presenting results of this study combined with the results from
other waste characterization studies from around the state.
The complete list of materials developed for this study, as well as their organization into various levels of
material groupings, is below, followed by detailed definitions for each material type. The rolled-up material
list used for the supplemental study, with the corresponding materials from the four additional city and
county studies, is shown in Appendix D: Supplemental Composition Results.
List of Material Types
For the 2020-2021 Statewide Waste Characterization Study, the field crew sorted solid waste into the 143
material types, and Cascadia calculated the composition percentages as well as quantities for each material
type.
MATERIAL TYPES ORGANIZED BY MATERIAL CLASSES
Table 22 below shows the complete list of material classes and material types used in the study.

2020-2021 Washington Statewide Waste Characterization Study
Final Report
August 2021 | 40
Table 22: List of Material Types
Material Class Material Class
Material Type Material Type
Paper Packaging Paper Products
Newspaper Packaging Newspaper Products
Cardboard and Kraft Packaging Cardboard/Kraft Products
Mixed/Low Grade Paper Packaging Magazines
Aseptic Containers High-grade Paper Products
Gable Top Containers Other Groundwood Products
Other Polycoated Packaging Mixed/Low-Grade Paper Products
Compostable Paper Packaging Compostable Paper Products
R/C Paper Packaging R/C Paper Products
Plastic Packaging Plastic Products
#1 PETE Plastic Bottles #1 PETE Products
#1 PETE Plastic Non-bottles #2 HDPE Products
#2 HDPE Plastic Natural Bottles #3 PVC Products
#2 HDPE Plastic Colored Bottles #4 LDPE Products
#2 HDPE Plastic Jars & Tubs #5 PP Products
#3 PVC Plastic Packaging #6 PS Products
#4 LDPE Plastic Packaging #7 Other Products
#5 PP Plastic Packaging PLA Compostable Products
#6 PS Plastic Packaging Plastic Garbage Bags
#7 Other/Unknown Plastic Packaging Plastic Non-bag Film Products
Expanded Polystyrene Packaging Bulky Rigid Plastic Products
PLA Compostable Packaging R/C Plastic Products
Plastic Merchandise Bags
Packaging Film Plastic Glass
Transportation Packaging Film Plastic Clear Glass Containers
Flexible Plastic Packaging Green Glass Containers
R/C Plastic Packaging Brown/Other Glass Containers
Plate Glass
Metal Non-glass Ceramics
Aluminum Beverage Cans R/C Glass
Aluminum Foil/Containers
Other Aluminum Organics
Other Non-ferrous Metal Edible Food Waste - Vegetative
Food Cans - Tinned Inedible Food Waste - Vegetative
Food Cans - Coated Edible Food - Meat/Fats/Oils
White Goods Inedible Food Waste - Meats/Fats/Oils
Other Ferrous Metal Yard & Garden Waste (Leaves & Grass)
R/C Metal Yard & Garden Waste (Prunings)
Animal Manure
Wood Debris Animal Carcasses & Ofal
Natural Wood Food Processing Wastes
Treated Wood R/C Organics
Painted Wood
Dimensional Lumber
Engineered Wood
Pallets & Crates
Other Untreated Wood
Wood By-products
R/C Wood Debris

2020-2021 Washington Statewide Waste Characterization Study
Final Report
August 2021 | 41
Table 22: List of Material Types, continued
Material Class Material Class
Material Type Material Type
Construction Materials Hazardous and Special Waste
Plastic Lumber Pesticides
Insulation HID, UV & Germicidal Lamps
Asphalt Paving Compact Fluorescent Lamps
Concrete Fluorescent Tubes
Drywall Water-based Paints
Carpet Solvent-based Adhesives/Glues
Carpet Padding Water-based Adhesives/Glues
Soil, Rocks & Sand Oil-based Paint
Asphalt Roofing Lacquer, Varnish, Urethane, & Stains
Plastic Floor Covering Field & Lawn Markings
Ceramics & Brick Primers, Sealers, & Coatings
R/C Construction Materials Water Repellants and Waterproofers
Solvents
Consumer Products Caustic Cleaners
Televisions - CRT Dry-cell Batteries - Single Use
Televisions - LCD Dry-cell Batteries - Rechargeable
Television Peripherals Wet-cell Batteries
Computer Monitors - CRT Gasoline/Kerosene
Computer Monitors - LCD Motor Oil
Computers Antifreeze
Computer Peripherals Other Vehicle Fluids
Computer Printers Oil Filters
Audio Equipment Explosives
Electronic Gaming Equipment Medical Wastes
Other Consumer Electronics Sharps
Textiles - Organic Pharmaceuticals & Vitamins
Textiles - Synthetic, Mixed, Unknown Other Cleaners/Chemicals
Shoes, Purses, Belts Personal Care Products
Tires & Other Rubber Other Potentially Hazardous Waste
Furniture
Mattresses Residuals
R/C Consumer Products Disposable Diapers
Ash
Dust
Fines/Sorting Residues
Sludges & Other Special Industrial Wastes

2020-2021 Washington Statewide Waste Characterization Study
Final Report
August 2021 | 42
MATERIAL TYPES ORGANIZED BY PACKAGING AND PRODUCTS MATERIAL GROUPS
Table 23 shows how each of the 143 material types were aggregated into the Packaging and Products
analysis found in the statewide study analysis above.

2020-2021 Washington Statewide Waste Characterization Study
Final Report
August 2021 | 43
Table 23: Material Types by Packaging and Products Material Groups
Material Group Material Group
Material Type Material Type
Packaging Products
Newspaper Packaging Newspaper Products
Cardboard & Kraft Packaging Cardboard/Kraft Products
Mixed/Low Grade Paper Packaging Magazines
Aseptic Containers High-grade Paper Products
Gable Top Containers Other Groundwood Products
Other Polycoated Packaging Mixed/Low-Grade Paper Products
Compostable Paper Packaging Compostable Paper Products
R/C Paper Packaging R/C Paper Products
#1 PETE Plastic Bottles #1 PETE Products
#1 PETE Plastic Non-bottles #2 HDPE Products
#2 HDPE Plastic Natural Bottles #3 PVC Products
#2 HDPE Plastic Colored Bottles #4 LDPE Products
#2 HDPE Plastic Jars & Tubs #5 PP Products
#3 PVC Plastic Packaging #6 PS Products
#4 LDPE Plastic Packaging #7 Other Products
#5 PP Plastic Packaging PLA Compostable Products
#6 PS Plastic Packaging Plastic Garbage Bags
#7 Other/Unknown Plastic Packaging Plastic Non-bag Film Products
Expanded Polystyrene Packaging Bulky Rigid Plastic Products
PLA Compostable Packaging R/C Plastic Products
Plastic Merchandise Bags Televisions - CRT
Packaging Film Plastic Televisions - LCD
Transportation Packaging Film Plastic Television Peripherals
Flexible Plastic Packaging Computer Monitors - CRT
R/C Plastic Packaging Computer Monitors - LCD
Clear Glass Containers Computers
Green Glass Containers Computer Peripherals
Brown/Other Glass Containers Computer Printers
Aluminum Beverage Cans Audio Equipment
Aluminum Foil/Containers Electronic Gaming Equipment
Food Cans - Tinned Other Consumer Electronics
Food Cans - Coated Textiles - Organic
Textiles - Synthetic, Mixed, Unknown
Organics Shoes, Purses, Belts
Edible Food Waste - Vegetative Tires & Other Rubber
Inedible Food Waste - Vegetative Furniture
Edible Food - Meat/Fats/Oils Mattresses
Inedible Food Waste - Meats/Fats/Oils R/C Consumer Products
Yard & Garden Waste (Leaves & Grass) Plate Glass
Yard & Garden Waste (Prunings) Non-glass Ceramics
Animal Manure White Goods
Animal Carcasses & Ofal
Food Processing Wastes
R/C Organics

2020-2021 Washington Statewide Waste Characterization Study
Final Report
August 2021 | 44
Table 23: Material Types by Packaging and Products Material Groups, continued
Material Class Material Class
Material Type Material Type
Metal Hazardous and Special Waste
Other Aluminum Pesticides
Other Non-ferrous Metal HID, UV & Germicidal Lamps
Other Ferrous Metal Compact Fluorescent Lamps
R/C Metal Fluorescent Tubes
Water-based Paints
Wood Debris Solvent-based Adhesives/Glues
Natural Wood Water-based Adhesives/Glues
Treated Wood Oil-based Paint
Painted Wood Lacquer, Varnish, Urethane & Stains
Dimensional Lumber Field & Lawn Markings
Engineered Wood Primers, Sealers, & Coatings
Pallets & Crates Water Repellants and Waterproofers
Other Untreated Wood Solvents
Wood By-products Caustic Cleaners
R/C Wood Debris Dry-cell Batteries - Single Use
Dry-cell Batteries - Rechargeable
Construction Materials Wet-cell Batteries
Plastic Lumber Gasoline/Kerosene
Insulation Motor Oil
Asphalt Paving Antifreeze
Concrete Other Vehicle Fluids
Drywall Oil Filters
Carpet Explosives
Carpet Padding Medical Wastes
Soil, Rocks & Sand Sharps
Asphalt Roofing Pharmaceuticals & Vitamins
Plastic Floor Covering Other Cleaners/Chemicals
Ceramics & Brick Personal Care Products
R/C Construction Materials Other Potentially Hazardous Waste
Residuals
Disposable Diapers
R/C Glass
Ash
Dust
Fines/Sorting Residues
Sludges & Other Special Industrial Wastes

2020-2021 Washington Statewide Waste Characterization Study
Final Report
August 2021 | 45
Definitions of Material Types
Paper Packaging
1. Newspaper Packaging: shredded newspaper packing material.
2. Cardboard and Kraft Packaging: unwaxed Kraft paper corrugated containers and boxes, unless poly- or
foil-laminated. Includes cardboard boxes and brown Kraft paper bags and packaging paper.
3. Mixed/Low-Grade Paper Packaging: low-grade recyclable papers, including non-corrugated paperboard
packaging, and other packaging made from groundwood paper. Includes egg cartons, and cereal and
cracker boxes.
4. Aseptic Containers: multi-layer paper packaging designed to keep food and other putrescible contents
fresh. Includes items like paper soup cartons and paper juice cartons.
5. Gable Top Containers: polycoated paper packaging often used for liquid products such as milk, plant-
based beverages, and juice. Most are opened by pushing open with a screw top closure or the gables at
the top back and pulling the top (spout) out.
6. Other Polycoated Packaging: other polycoated paper packaging. Includes ice cream cartons and frozen
food boxes. Does not include aseptic and gable top containers.
7. Compostable Paper Packaging: packaging paper that may be composted such as pizza boxes, waxed
cardboard boxes, and all cups/containers from fast food establishments.
8. Remainder/Composite Paper Packaging: non-recyclable and non-compostable types of papers such as
paper packaging with metal or plastic parts (except aseptic packaging). Examples would include plastic
lined or metal handled take-out food containers.
Paper Products
9. Newspaper Products: printed groundwood newsprint, including glossy ads and Sunday edition
magazines that are delivered with the newspaper (unless these are found separately during sorting).
10. Cardboard and Kraft Paper Products: unwaxed Kraft paper and corrugated products, unless poly- or foil-
laminated. Could include cat scratching pads.
11. Magazines: magazines, catalogs, and similar products with glossy paper. Includes Sunday edition news
magazines, if found separate from the newspaper.
12. High-Grade Paper Products: high-grade white or light-colored bond and copy machine papers and
envelopes, and continuous-feed computer printouts and forms of all types, except multiple copy
carbonless paper.
13. Other Groundwood Paper Products: non-packing products made from groundwood paper, including
phone books, some tablet paper, and paperback books.

2020-2021 Washington Statewide Waste Characterization Study
Final Report
August 2021 | 46
14. Mixed/Low-Grade Paper Products: low-grade recyclable papers, including colored papers, notebook or
other lined paper, envelopes with plastic windows, non-corrugated paperboard, carbonless copy paper,
and junk mail. This includes shredded paper.
15. Compostable Paper Products: non-packaging papers that can be composted such as paper
towels/napkins, paper cups, and plates (if purchased empty), and tissues.
16. Remainder Composite Paper Products: non-recyclable and non-compostable types of paper products
such as carbon paper and hardcover books, and composite materials containing paper mixed with metal
or plastic parts.
Plastic Packaging
17. #1 PETE (Polyethylene terephthalate) Plastic bottles: includes plastic bottles bearing the #1, such as
carbonated drink bottles and water bottles. Lids and caps are left attached to containers when feasible.
18. #1 PETE (Polyethylene terephthalate) Plastic non-bottles: includes plastic non-bottle packaging bearing
the #1, and would include oven-ready meal trays and other packaging. Also includes blow molded jars
bearing the #1, such as those commonly used for peanut butter.
19. #2 HDPE (High-density polyethylene) Plastic Natural Bottles: includes milk jugs and water jugs and any
natural bottle bearing the #2. Lids and caps are left attached to containers when feasible.
20. #2 HDPE (High-density polyethylene) Plastic Colored Bottles: includes detergent bottles, some personal
care product bottles, and any opaque plastic bottle bearing the #2. Lids and caps are left attached to
containers when feasible.
21. #2 HDPE (High-density polyethylene) Plastic Jars and Tubs: yogurt and margarine tubs and any packaging
jar or tub bearing the #2. Lids and caps are left attached to containers when feasible. This category
includes 5-gallon plastic pails (with or without handles) and lids.
22. #3 PVC (Polyvinyl chloride) Plastic Packaging: includes any plastic bottle or container marked with a # 3.
Lids and caps are left attached to containers when feasible.
23. #4 LDPE (Low-density polyethylene) Plastic Packaging: includes any plastic bottle or container marked
with the #4. Lids and caps are left attached to containers when feasible.
24. #5 PP (Polypropylene) Plastic Packaging: includes any plastic packaging marked with the #5 as well as
plastic straws. Lids and caps are left attached to containers when feasible.
25. #6 PS (Polystyrene) Plastic Packaging: includes any plastic packaging marked with the #6 such as
compact disc cases, some plastic to-go beverage cups, and any other rigid PS packaging. Lids and caps
are left attached to containers when feasible.
26. #7 Other/Unknown Plastic Packaging: includes all non-numbered plastic packaging and any other plastic
packaging product not listed in another category. Lids and caps are left attached to containers when
feasible. This includes plastic strapping.
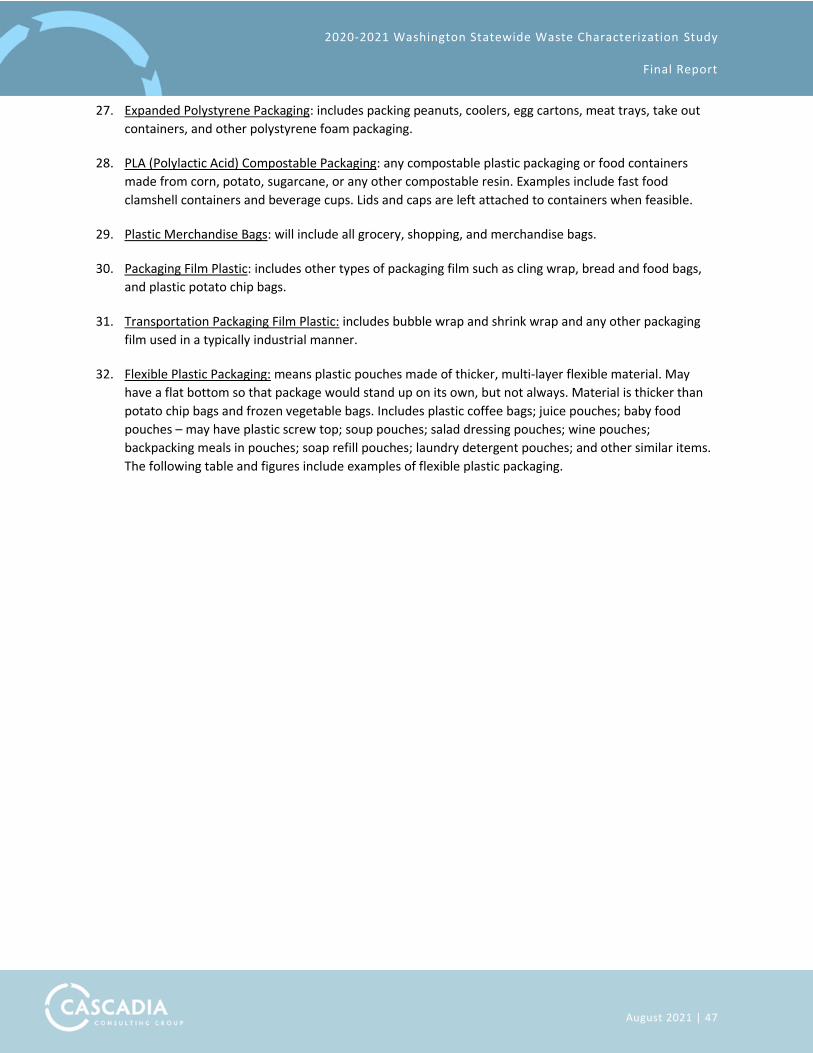
2020-2021 Washington Statewide Waste Characterization Study
Final Report
August 2021 | 47
27. Expanded Polystyrene Packaging: includes packing peanuts, coolers, egg cartons, meat trays, take out
containers, and other polystyrene foam packaging.
28. PLA (Polylactic Acid) Compostable Packaging: any compostable plastic packaging or food containers
made from corn, potato, sugarcane, or any other compostable resin. Examples include fast food
clamshell containers and beverage cups. Lids and caps are left attached to containers when feasible.
29. Plastic Merchandise Bags: will include all grocery, shopping, and merchandise bags.
30. Packaging Film Plastic: includes other types of packaging film such as cling wrap, bread and food bags,
and plastic potato chip bags.
31. Transportation Packaging Film Plastic: includes bubble wrap and shrink wrap and any other packaging
film used in a typically industrial manner.
32. Flexible Plastic Packaging: means plastic pouches made of thicker, multi-layer flexible material. May
have a flat bottom so that package would stand up on its own, but not always. Material is thicker than
potato chip bags and frozen vegetable bags. Includes plastic coffee bags; juice pouches; baby food
pouches – may have plastic screw top; soup pouches; salad dressing pouches; wine pouches;
backpacking meals in pouches; soap refill pouches; laundry detergent pouches; and other similar items.
The following table and figures include examples of flexible plastic packaging.

2020-2021 Washington Statewide Waste Characterization Study
Final Report
August 2021 | 48
INCLUDED –
THICKER, MULTI-LAYER PACKAGING
EXCLUDED –
THINNER, SINGLE LAYER PACKAGING
- Plastic coffee bags
- Juice pouches
- Baby food pouches – may have
plastic screw top
- Soup pouches
- Salad dressing pouches
- Wine pouches
- Backpacking meals in pouches
- Soap refill pouches
- Laundry detergent pouches
- Other similar items
- Potato chip bags and similar
- Candy wrappers
- Tortilla bags
- Frozen food bags (vegetables,
berries)
- Nut/snack bags
- Shrink plastic wrappers (snack
meat and cheese wrappers)
- Plastic sandwich bags that you
buy for single home use
- Thin produce bags as used in
grocery stores
- Newspaper bags
- Bread bags
- Small (2 inch) pouches for
condiments (mustard, relish,
etc.)
- Yogurt tubes
- Mailing pouches, usually colored
or white (not clear) (magazines,
medication pouches)
- 100% plastic mailing pouches
with bubble wrap
- Other similar items

2020-2021 Washington Statewide Waste Characterization Study
Final Report
August 2021 | 49
33. Remainder/Composite Plastic Packaging: other types of packaging that are not one of the above
materials and items that are composites of multiple plastics and plastics mixed with other materials. An
example of this material type is some bathroom silicone sealant tubes designed to be used with an
applicator gun. These tubes frequently have plastic bodies and tips but metal end caps.
Plastic Products
34. #1 PETE (Polyethylene terephthalate) Plastic Products: includes any PET product bearing the #1 and
used in a non-packaging application.
35. #2 HDPE (High-density polyethylene) Plastic Products: includes any other non-packaging product bearing
the #2.
36. #3 PVC (Polyvinyl chloride) Plastic Products: includes any non-packaging product bearing the #3 but also
including plastic piping, and some toys.
37. #4 LDPE (Low-density polyethylene) Plastic Products: includes any other non-packaging product bearing
the #4.
38. #5 PP (Polypropylene) Plastic Products: includes any plastic non-packaging product bearing the #5 but
also includes some reusable food containers.
39. #6 PS (Polystyrene) Plastic Products: includes any plastic non-packaging product bearing the #6 but also
includes plastic tableware.
40. #7 Other/Unknown Plastic Products: includes all non-packaging, non-numbered plastic product not
listed in another category. Examples could include some toys, household products, disposable plastic

2020-2021 Washington Statewide Waste Characterization Study
Final Report
August 2021 | 50
products (food utensils), durable plastic products (toothbrushes, dinnerware), and electronic media (CDs
and DVDs).
41. PLA (Polylactic Acid) Compostable Products: any compostable plastic product made from corn, potato,
sugarcane, or any other compostable resin. Examples include utensils and plates made of PLA.
42. Plastic Garbage Bags: includes all bags whose primary use is to hold trash or garbage.
43. Plastic Non-bag Film Products: includes plastic painter’s sheeting for drop cloths, other plastic tarps,
shower curtains, and any other film product not used for packaging purposes.
44. Bulky Rigid Plastic Products: Large (larger than a five-gallon bucket), wholly plastic products intended to
be used multiple times over a long period. Examples include garbage cans, some large children’s toys,
and plastic furniture.
45. Remainder/Composite Plastic Products: includes all other types of non-packaging plastic that are not
one of the above materials and items that are composites of multiple plastics and plastics mixed with
other materials. This section also includes plastic sheeting and tarps that are contaminated with other
materials such as paint or concrete residue. Examples would include plastic toys with metal
attachments.
Glass
46. Clear Glass Containers: bottles and jars made from clear glass.
47. Green Glass Containers: bottles and jars made from green glass.
48. Brown/Other Colored Glass Containers: bottles and jars made from brown glass. Note that blue glass
was included with brown glass.
49. Plate Glass: flat glass products such as windows, mirrors, and flat products.
50. Non-glass Ceramics: Ceramics not composed of true glass and not typically used as building materials.
Examples include dishes and crockware.
51. Remainder/Composite Glass: other types of glass products and scrap that do not fit into the above
materials, including light bulbs, glassware, oven-safe baking dishes such as Pyrex, and non-C&D
fiberglass. Note that ceramics (plates and knickknacks) will not be included here but will be placed in
“Non-Glass Ceramics” above.
Metal
52. Aluminum Beverage Cans: aluminum beverage cans.
53. Aluminum Foil/Containers: aluminum foil, food trays, and similar items.
54. Other Aluminum: aluminum scrap and products that do not fit into the above two materials.

2020-2021 Washington Statewide Waste Characterization Study
Final Report
August 2021 | 51
55. Other Non-Ferrous Metal: metallic products and pieces that are not aluminum and not derived from
iron (see “other ferrous”) and are not significantly contaminated with other metals or materials (see
“remainder/composite”).
56. Food Cans-Tinned: including zinc or tin-coated steel food containers. This material includes bi-metal
beverage cans, but not paint cans or other types of cans.
57. Food Cans-Coated: including many plastic-lined aluminum pet food containers.
58. White Goods: large household appliances or parts thereof. Special note should be taken if any of these
are found still containing refrigerant.
59. Other Ferrous Metal: products and pieces made from metal to which a magnet will adhere (including
stainless steel), and which are not significantly contaminated with other metals or materials (in the
latter case, the item will instead be included under “remainder/composite”). This material will include
paint and other non-food “tin cans”, as well as aerosol cans.
60. Remainder/Composite Metals: items made of a mixture of ferrous and non-ferrous or a mixture of metal
and non-metallic materials (as long as these are primarily metal). Examples include small appliances,
motors, and insulated wire.
Organics
61. Edible Food Waste-Vegetative: plant-based foods including the food container when the container
weight is not appreciable compared to the food inside. The food appears to be edible or appears to have
been edible when discarded. Foods with small blemishes should still be considered edible, but scraps of
food already removed from the edible portion, such as fruit peelings, should not be counted. This
includes edible breads, candies, and mostly full containers of soda, juice, etc.
62. Inedible Food Waste-Vegetative: plant-based foods including the food container when the container
weight is not appreciable compared to the food inside. The food appears to be inedible or appears to
have been inedible when discarded. Moldy foods or scraps of food already removed from the edible
portion, such as fruit peelings, are included here. Includes coffee filters and tea bags. This includes
inedible breads and candies.
63. Edible Food Waste-Meats/Fats/Oils: animal derived foods and oils including the food container when
the container weight is not appreciable compared to the food inside. The food appears to be edible or
appears to have been edible when discarded. Foods with small blemishes should still be considered
edible, but scraps of food already removed from the edible portion, such as bones, should not be
counted.
64. Inedible Food Waste-Meats/Fats/Oils: animal derived foods and oils including the food container when
the container weight is not appreciable compared to the food inside. Moldy foods or scraps of food
already removed from the edible portion, such as bones and eggshells, are included here.
65. Yard & Garden Waste (Leaves and Grass): grass clippings, leaves, and weeds.

2020-2021 Washington Statewide Waste Characterization Study
Final Report
August 2021 | 52
66. Yard & Garden Waste (Prunings): materials including shrubs, trees, and prunings six inches or less in
diameter (branches with leaves OK).
67. Animal Manure: all animal manures and soiled bedding and litter whether derived from an agricultural
or residential origin. Includes kitty litter.
68. Animal Carcasses, Offal: carcasses and pieces of small and large animal, unless the item is the result of
food preparation in a household or commercial setting. For instance, fish or chicken entrails from food
preparation and raw, plucked chickens will typically be classified as food, not as an animal carcass,
unless the material is from an agricultural or industrial source.
69. Food Processing Wastes: processing wastes that are left over from growing and processing fruit,
vegetables, meat, seafood, or other foods and that are treated as a waste (for example, meat packing
plant waste, fish processing waste). Does not include food residuals from restaurants or grocery stores
or food purchased as groceries. Does not include food from home gardens, fishing, hunting, or other
home food processing.
70. Remainder/Composite Organics: other organics that do not easily fit into the above materials. Includes
crop residues. Examples includes hair, dryer lint, cigarette butts, and candles. Note the identity of
anything that is not listed in the examples for this type or anything that is a large quantity.
Wood Debris
71. Natural Wood: wood that has not been processed, including stumps of trees and shrubs, with the
adhering soil (if any), and other natural woods, such as logs and branches in excess of six inches in
diameter.
72. Treated Wood: wood treated with preservatives such as creosote, chromated copper arsenate (CCA),
and alkaline copper quaternary (ACQ). This includes dimensional lumber and posts if treated, but does
not include painted or varnished wood. This material may also include some plywood (especially
“marine plywood”), strand board, and other wood.
73. Painted Wood: wood that has been painted, varnished, or coated in similar ways.
74. Dimensional Lumber: wood commonly used in construction for framing and related uses, including 2 x
4’s, 2 x 6’s, and posts/headers (such as 4x8’s).
75. Engineered Wood: building materials that have been manufactured and that generally include adhesive
as one or more layers. Examples include plywood (sheets of wood built up of two or more veneer sheets
glued or cemented together under pressure), particle board (wood chips pressed together to form large
sheets or boards), fiberboard (like particle board but with fibers), “glu-lam” beams and boards (built up
from dimensional or smaller lumber), and similar products.
76. Pallets and Crates: partial or whole wood pallets, crates, and similar shipping containers.
77. Other Untreated Wood: other types of wood products and materials that do not fit into the above
materials, excluding composite materials (See Remainder/Composites, below).

2020-2021 Washington Statewide Waste Characterization Study
Final Report
August 2021 | 53
78. Wood By-products: sawdust and shavings, not otherwise identifiable.
79. Remainder/Composite Wood Debris: items that consist primarily of wood but that do not fit into the
above materials, including composite materials that consist primarily (over 50 percent) of wood.
Examples of composites include wood with sheetrock nailed to it or with tiles glued to it (such that the
materials cannot be easily separated).
Construction Materials
80. Plastic lumber: dimensional or sheet lumber made from plastic and resin composites. Includes plastic
pallets.
81. Insulation: include all pad, roll, or blown-in types of insulation.
82. Asphalt Paving: asphalt paving material.
83. Concrete: cement (mixed or unmixed), concrete blocks, and similar wastes.
84. Drywall: used or new gypsum wallboard, sheetrock, or drywall present in recoverable amounts or pieces
(generally, any piece larger than two inches square will be recovered from the sample).
85. Carpet: pieces of carpet and rugs made of similar material.
86. Carpet Padding: foam rubber and other materials used as padding under carpets.
87. Soil, Rocks, and Sand: rock, gravel, soil, sand, and similar naturally occurring materials.
88. Asphalt Roofing: asphalt and fiberglass shingles, tar paper, and similar wastes from demolition or
installation of roofs. Does not include wooden shingle or shakes.
89. Plastic Floor Covering: such as plastic tile, vinyl flooring, and linoleum.
90. Ceramics and Bricks: includes clay, porcelain bricks, and tiles, such as used toilets, sinks, and bricks of
various types and sizes.
91. Remainder/Composite Construction Materials: other construction and demolition materials that do not
fit easily into the above materials or that are composites made up of two or more different materials.
Includes asbestos.
Consumer Products
92. Televisions-CRT: television sets containing a cathode ray tube (CRT).
93. Televisions-LCD: LCD or plasma.
94. Television Peripherals: DVRs, VCRs, DVD players, and other devices.
95. Computer Monitors-CRT: computer monitors containing a cathode ray tube (CRT).

2020-2021 Washington Statewide Waste Characterization Study
Final Report
August 2021 | 54
96. Computer Monitors-LCD: LCD computer monitors.
97. Computers: towers, laptops, and portable computers
98. Computer Peripherals: keyboard, mice and mouse pads, disk drives, and other devices.
99. Computer Printers: all types of computer printers including printers combined with scanners, fax
machines, or other peripherals.
100. Audio Equipment: examples include stereo equipment, receivers, speakers, radios, tape players, CD
players, and turntables.
101. Electronic Gaming Equipment: such as Nintendo, Play Stations, and joysticks.
102. Other Consumer Electronics: small electric appliances such as toasters, mixers, microwave ovens, power
tools, curling irons, cell phones, and anything else that runs with a plug or battery.
103. Textiles-Organic: cloth, clothing, and rope made of 100 percent cotton, leather, wool, or other naturally
occurring fibers. Composites of several different naturally occurring fibers (such as a wool jacket with a
cotton liner) can be included in this material, as can organic textiles with buttons and zippers.
104. Textiles-Synthetic, Mixed or Unknown: cloth, clothing, and rope made of unknown fibers, synthetic
fibers, or made from a mixture of synthetic and natural materials. This includes dryer sheets and
cleaning wipes.
105. Shoes, Purses, and Belts: all shoes and boots, purses, and belts whether made of leather, rubber, other
materials, or a combination thereof.
106. Tires and Other Rubber: vehicle tires of all types, including bicycle tires and including the rims if present,
and finished products and scrap materials made of rubber, such as bathmats, inner tubes, rubber hose,
and foam rubber (except carpet padding, see Construction Materials).
107. Furniture: mixed-material furniture such as upholstered chairs or a metal desk with a wood writing
surface. Furniture made primarily of a single material (a wood desk with metal drawer pulls, for
example) would be classified with that material category.
108. Mattresses: mattresses made of various materials and in any condition.
109. Remainder/Composite Consumer Products: this is a catch-all material for objects consisting of more
than one material.
Hazardous and Special Wastes
110. Pesticides: includes a variety of chemical compounds whose purpose is to discourage or kill pests and
microorganisms, including herbicides and fungicides. Multipurpose agricultural compounds (Three-in-
one pesticides/herbicide/fungicides, for example) are included in this category.
111. High-Intensity Discharge Lamps (HID), UV, and Germicidal Lamps: includes high pressure sodium, metal
halide, and mercury vapor. Includes lamps of all shapes and sizes (pin type or screw in) intended to

2020-2021 Washington Statewide Waste Characterization Study
Final Report
August 2021 | 55
inhibit bacterial or viral growth. If the type of lamp cannot be determined it will be included in the most
appropriate category based on information available to the sort crew.
112. Compact Fluorescent Lamps (CFL)
113. Fluorescent Tubes: includes linear, u-shaped, and circular.

2020-2021 Washington Statewide Waste Characterization Study
Final Report
August 2021 | 56
114. Water-based Paints: includes latex and other water-based paints and similar products.
115. Solvent-based Adhesives/Glues: oil/resin/volatile solvent-based glues and adhesives, including epoxy,
rubber cement, two-part glues and sealers, and auto body fillers.
116. Water-based Adhesives/Glues: water-based glues, caulking compounds, grouts, and spackle.
117. Oil-based Paint: includes alkyd and enamel paints. Multipurpose products (like primer/rust inhibitor
combinations) will be sorted according to the purpose listed first on the product label. Products with an
indeterminate purpose will sorted based on the field crew’s best judgement.
118. Lacquer, Varnish, Urethane Coatings, and Stains: multipurpose products (like primer/rust inhibitor
combinations) will be sorted according to the purpose listed first on the product label. Products with an
indeterminate purpose will sorted based on the field crew’s best judgement.
119. Field and Lawn Markings: multipurpose products (like primer/rust inhibitor combinations) will be sorted
according to the purpose listed first on the product label. Products with an indeterminate purpose will
sorted based on the field crew’s best judgement.
120. Primers, Sealers, and Coatings: includes undercoats, oil based clear coatings, rust preventative coatings,
deck coatings, and floor paint. Multipurpose products (like primer/rust inhibitor combinations) will be
sorted according to the purpose listed first on the product label. Products with an indeterminate
purpose will sorted based on the field crew’s best judgement.
121. Water Repellants and Waterproofers: includes waterproofers for concrete and masonry. This does not
include tar or bitumen-based repellants. Multipurpose products (like primer/rust inhibitor

2020-2021 Washington Statewide Waste Characterization Study
Final Report
August 2021 | 57
combinations) will be sorted according to the purpose listed first on the product label. Products with an
indeterminate purpose will sorted based on the field crew’s best judgement.
122. Solvents: includes chlorinated and flammable solvents, paint strippers, solvents contaminated with
other products such as paints, degreasers, and some other cleaners if the primary ingredient is (or was)
a solvent or alcohol such as methanol and isopropanol. Multipurpose products (like primer/rust inhibitor
combinations) will be sorted according to the purpose listed first on the product label. Products with an
indeterminate purpose will sorted based on the field crew’s best judgement.
123. Caustic Cleaners: caustic acids and bases whose primary purpose is to clean surfaces, unclog drains, or
perform other actions.
124. Dry-Cell Batteries, Single Use: dry-cell batteries of various sizes and types as commonly used in
households. These are not intended to be recharged. Includes cell phone and button cell batteries.
Batteries are not removed from items containing batteries.
125. Dry-Cell Batteries, Rechargeable: dry-cell batteries of various sizes and types as commonly used in
households. Includes cell phone and button cell batteries. Batteries are not removed from items
containing batteries.
126. Wet-Cell Batteries: wet-cell batteries of various sizes and types as commonly used in automobiles.
127. Gasoline/Kerosene: gasoline, diesel fuel, and fuel oils.
128. Motor Oil: lubricating oils, primarily used in vehicles but including other types with similar
characteristics.
129. Antifreeze: automobile and other antifreeze mixtures based on ethylene or propylene glycol.
130. Other Vehicle Fluids: includes brake, power steering, and hydraulic, and transmission fluid.
131. Oil Filters: used oil filters, primarily those used in cars but possibly including similar filters from other
types of vehicles and other applications.
132. Explosives: gunpowder, unspent ammunition, picric acid, and other potentially explosive chemicals.
133. Medical Wastes: materials typically discarded in a health care setting such as I.V. tubing and patient
drapes, specimen containers, and Petri dishes. Medical wastes that could be considered a biohazard are
weighed, but not further sorted. Includes personal protective equipment (PPE). Mixed bags of MSW and
medical waste will be treated as medical waste and not be further sorted.
134. Sharps: needles, syringes, and diabetic testing strips with a finger prick.
135. Pharmaceuticals and Vitamins: not including the container (classify the container according to the
material type). Examples include solid, liquid, cream, and gel medicines, inhalers, anti-bacterial creams,
rubbing alcohol, and anti-bacterial spray.
136. Other Cleaners/Chemicals: non-caustic cleaners and other household chemicals such as window cleaner,
toilet bowl cleaner, and carpet shampoo.

2020-2021 Washington Statewide Waste Characterization Study
Final Report
August 2021 | 58
137. Personal Care Products: soaps, cosmetics, shampoos, nail polish, nail polish remover, and other items.
138. Other Potentially Hazardous Wastes: other chemicals, harmful or potentially harmful wastes that do not
fit into the above categories, including unidentifiable materials and problem wastes. Includes fertilizers
and cigarette lighters.
Residuals
139. Disposable Diapers: disposable baby diapers and protective undergarments for adults (including
feminine hygiene products).
140. Ash: fireplace, burn barrel or firepit ash, as well as boiler and ash from industrial sources.
141. Dust: baghouse and other dusts from industrial sources, as well as bags of vacuum cleaner dust.
142. Fines/Sorting Residues: mixed waste that remains on the sorting table after all the materials that can
practicably be removed have been sorted out. This material will consist primarily of small pieces of
various types of paper and plastic, but will also contain small pieces of broken glass and other materials.
May also include material less than one-half inch in diameter that falls through a bottom screen during
sorting, for those using sorting boxes with screens, and if the material cannot otherwise be identified.
143. Sludges and Other Special Industrial Wastes: sludges and other wastes from industrial sources that
cannot easily be fit into any of the above materials. Includes paper processing sludges. Can include
liquids and semi-solids but only if these materials are treated as a solid waste.

2020-2021 Washington Statewide Waste Characterization Study
Final Report
August 2021 | 59
Appendix B: Field Forms Used During the Study
Figure 16: Sample Vehicle Selection Sheet
Washington Statewide Waste Characterization
Vehicle Selection Form
Site: Stevenson (Skamania)
Date:
Cross off one number for each type of vehicle entering the station.
When you reach the number circled, this vehicle should be asked to go to the sorting area to dump its load for sampling.
Continue for each block, beginning at #1, on the next line until the required number of vehicles is sampled.
FRANCHISED RESIDENTIAL: NEED 4 TOTAL - SAMPLE EVERY VEHICLE
1
1
1
1
FRANCHISED NON-RESIDENTIAL NEED 5 TOTAL - SAMPLE EVERY VEHICLE
1
1
1
1
1
SELF-HAUL NEED 4 TOTAL - SAMPLE EVERY 10TH VEHICLE1 2 3 4 5 6 7 8 9 10
1 2 3 4 5 6 7 8 9 10
1 2 3 4 5 6 7 8 9 10
1 2 3 4 5 6 7 8 9 10
Thursday, April 15, 2021
waste hauled by contracted or municipally operated vehicles (e.g.
Recology, Waste Management)
80 percent or more of the waste is from institutional, commercial, or
industrial sources. This includes loads of municipal solid waste (MSW) as
well as construction and demolition (C&D) materials.
May need to double or triple sample non-residential vehicles to get
6 samples.
Waste hauled by vehicles NOT contracted or municipally
operated. Includes self-hauled waste by residents or small hauling
companies (1-800-Got-Junk), city parks departments, road cleanup
crews, wastewater treatment departments, school districts/universities
hauling their own waste.
waste hauled by contracted or municipally operated vehicles in
which 80 percent or more of the waste is from single-family and/or
multifamily residential sources.
May need to double or triple sample residential vehicle(s) to get 3
samples.

2020-2021 Washington Statewide Waste Characterization Study
Final Report
August 2021 | 60
Figure 17: Sample Placard

2020-2021 Washington Statewide Waste Characterization Study
Final Report
August 2021 | 61
Figure 18: Sample Sorting and Characterization Form, Front
Sample ID Date #1 PET Bottles
#1 PET Non-bottles
Facility #2 HDPE Natural Bottles
#2 HDPE Colored Bottles
New spaper Packaging #2 HDPE Jars & Tubs
Cardboard/Kraft Packaging #3 PVC Packaging
Mixed/Low Grade Packaging #4 LDPE Packaging
Aseptic Containers #5 PP Packaging
Gable Top Containers #6 PS Packaging
Other Polycoat Containers #7 Other Packaging
Compostable Packaging Polystyrene Packaging
R/C Paper Packaging PLA/Compostable Packaging
New spaper Products Merchandise Bags
Cardboard/Kraft Products Other Packaging Film
Magazines Transportation Packaging Film
High-Grade Papers Flexible Plastic Packaging
Groundw ood Products R/C Packaging
Mixed Low Grade Paper Products #1 PET Product
Compostable Products #2 HDPE Product
R/C Paper Products #3 PVC Product
Clear Containers #4 LDPE Product
Green Containers #5 PP Product
Brow n Containers #6 PS Product
Plate Glass #7 Other Product
Non-glass Ceramics PLA/Compostable Product
R/C Glass Garbage Bags
Edible Food - Vegetative Non-bag Film Products
Inedible Food - Vegetative Bulky Rigid Plastic Products
Edible Food - Meat, Fats, Oils R/C Products
Inedible Food - Meats, Fats, Oils Alum. Beverage Cans
Leaves & Grass Alum. Foil/Containers
Prunings Other Aluminum
Animal Manure Other Nonferrous
Animal Carcasses Food Cans - Tinned
Food Processing Waste Food Cans - Coated
R/C Organics (note items below) White Goods
R/C includes: Other Ferrous
R/C Metals
Pla
sti
c P
ackag
ing
Pla
sti
c P
rod
ucts
Meta
l
Photo?
20
20
Wa
sh
ing
ton
DO
E W
as
te C
om
po
sit
ion
Stu
dy
Pap
er
Pro
du
cts
Pap
er
Packag
ing
Org
an
ics
Gla
ss
Tally
Sheet -
Page 1
of 2

2020-2021 Washington Statewide Waste Characterization Study
Final Report
August 2021 | 62
Figure 19: Sample Sorting and Characterization Form, Back
Natural Wood Pesticides
Treated Wood HID Lamps
Painted Wood Compact Fluorescents
Dimensional Lumber Fluorescent Tubes
Engineered Wood Water Based Paints
Pallets & Crates Solvent-based Glues
Other Untreated Wood Water Based Glues
Wood By-Products Oil-based Paint
R/C Wood Lacquer, Varnish, Urethane Coatings, Stains
Plastic Lumber Field/Law n Markings
Insulation Primers/Sealers/Coatings
Asphalt Paving Water Repellants/Waterproofers
Concrete Solvents
Dryw all Caustic Cleaners
Carpet Dry-cell Batteries-Single Use
Carpet Padding Dry-cell Batteries-Rechargeable
Soil, Rocks, Sand Wet-cell Batteries
Asphalt Roofing Gasoline/Kerosene
Plastic Flooring Motor Oil
Ceramics & Brick Antifreeze
R/C Construction Other Vehicle Fluids
Televisions - CRT Oil Filters
Televisions - LCD Explosives
VCR's, DVD's, DVR's Medical Wastes
Computer Monitors - CRT Sharps
Computer Monitors - LCD Pharmaceuticals/Vitamins
Computers Other Cleaners/Chemicals
Computer Peripherals Personal Care Products
Computer Printers Other Potentially Hazardous
Audio Equipment Disposable Diapers
Gaming Equipment Ash
Other Consumer Electronics Dust
Textiles - Organic Fines/Sorting Residue
Textiles - Synthetic Sludge/Special Industrial
Shoes, Purses, Belts
Tires & Rubber
Furniture
Mattresses
R/C Consumer
Tally
Sheet -
Page 2
of 2
20
20
Wa
sh
ing
ton
DO
E W
as
te C
om
po
sit
ion
Stu
dy
Resid
ues
Wo
od
Waste
sC
on
str
ucti
on
Mate
rials
Co
nsu
mer
Pro
du
cts
Hazard
ou
s a
nd
Sp
ecia
l W
aste

2020-2021 Washington Statewide Waste Characterization Study
Final Report
August 2021 | 63
Figure 20: Vehicle Survey Form, Front
Date ____/____/____
Survey Site __________________________ Surveyor __________________________ Page _____ of _____
Car Minimum Weight: __________lbs. Checked by ________________________ This sheet started at _________am pm
Truck Minimum Weight: __________lbs.
ID Samp?Vehicle
Type
Waste
TypeCounty Sector For All Loads
Notes & Comments
1. Rear Packer
2. Front Packer garbage = M RES single-family residential/multifamily
3. Side Packer C&D = C COM commercial
4. DB-Loose SHR self-haul from a residence
5. DB-Compacted
6. P ickup, Van, SUV
7. Large Other
8. Car SF MF COM SHR SHNR
9. Other % % % % % Car Pickup
tons lbs yds
tons lbs yds
tons lbs yds
tons lbs yds
tons lbs yds
tons lbs yds
tons lbs yds
tons lbs yds
tons lbs yds
tons lbs yds
tons lbs yds
tons lbs yds
tons lbs yds
tons lbs yds
tons lbs yds
tons lbs yds
tons lbs yds
tons lbs yds
tons lbs yds
tons lbs yds
tons lbs yds
tons lbs yds
tons lbs yds
tons lbs yds
tons lbs yds
tons lbs yds
if it's a
combination
= M
Enter the
weightback
ticket number
here (if used)
If needed for notes any time you choose NA or about the load, or
to record license/vehicle #s for identif ication purposes, w hen a
load is double sampled put the second sample ID here, etc.
Alternative
minumum w eight.
Check if used
and note the
facilities minimum
w eight at the top
of this sheet.
Net Weight of Load.
If you use the same units for all
loads just circle the units on the
f irst line, otherw ise be sure to
circle the units on every line.
Enter the
Sample ID if
this load
w as w as
sampled
SHNR self-haul not from a residence
(business, church, park)
What COUNTY did the load
originate in? (if they don't know
the county ask for the city)
Yard Waste
= Y

2020-2021 Washington Statewide Waste Characterization Study
Final Report
August 2021 | 64
Figure 21: Vehicle Survey Form, Back
GENERAL INSTRUCTIONS
Make entries neatly in pencil.
Enter the information at the top of each page. Enter total # of pages on each page at the end of the day.
Enter the net weight of the load. If the operator measures self-haul loads by volume, record the volume and indicate that the unit is "yds".
STEP-BY-STEP INSTRUCTIONS
CHECK IN WITH GATEHOUSE STAFF
Confirm the method for getting net weights.
AS THE VEHICLE ARRIVES RECORD THE TYPE OF VEHICLE ON THE SURVEY SHEET
WHEN A VEHICLE ARRIVES, STOP THE VEHICLE, THEN BEGIN QUESTIONS:
ALL DRIVERS:
Introduction: "Hello, the Washington DOE is conducting a survey today."
Ask the driver what kind of material they're bringing (garbage, construction debris, yard waste, or a combination of things).
only continue surveying drivers that are bringing materials for disposal (for example, if the facility has a recycling area and that is where they're heading then end the survey)
Ask the driver what county the load is from (if they don't know the county ask for the city)
Ask the driver what sector generated the load
If they report more than one sector, be sure to ask the driver for the estimated % of each.
Commercially collected residential: Single-family (SF) waste from a certified or franchised hauler collected at single family residences
Commercially collected residential: Multifamily (MF) waste from a certified or franchised hauler collected at multifamily residences
Commercially collected commercial (COM) waste from a certified or franchised hauler collected from non-residential sources (businesses, churches, parks, jails, etc.)
Self-haul residential waste hauled by anyone who is not a certified hauler that was collected at a residence (SF or MF)
Self-haul nonresidential waste hauled by anyone who is not a certified hauler that was not collected at a residence (collected from a business, church, park, jail, etc.)
Ask the driver what kind of material they're bringing (garbage, construction debris, yard waste, or a combination of things).
RECORD NET WEIGHTS
Circle the units used, if the same units are used all day just circle the units on the first row. If not circle the units on every row.
If the site has a minimum weight note it on the front page and every time a survey vehicle pays the minimum check it in the appropriate column.
0 = NA 1 = Construction 2 = Food Retail 3 = Big Box Retail 4 = Manufacturing
5 = Wholesale 6 = Mixed Commercial 7 = Other Retail 8 = Medical/Hospital 9 = Education
10 = Residential 11 = Landscaping 12 = Food Processing 13 = Agriculture 14 = Prison 15 = Other

2020-2021 Washington Statewide Waste Characterization Study
Final Report
August 2021 | 65
Appendix C: Waste Generation Area
Composition Results
This section first presents overall waste composition results by material class for each of Washington’s six
WGAs:
Central
East
Northwest
Puget Sound
Southwest
West
Each subsequent WGA section presents detailed composition tables for the following sectors:
Overall
Commercial
Residential
Self-hauled

2020-2021 Washington Statewide Waste Characterization Study
Final Report
August 2021 | 66
Overall Composition by Material Class
Figure 22: Central WGA
Figure 23: East WGA

2020-2021 Washington Statewide Waste Characterization Study
Final Report
August 2021 | 67
Figure 24: Northwest WGA
Figure 25: Puget Sound WGA

2020-2021 Washington Statewide Waste Characterization Study
Final Report
August 2021 | 68
Figure 26: Southwest WGA
Figure 27: West WGA

2020-2021 Washington Statewide Waste Characterization Study
Final Report
August 2021 | 69
Central Waste Generation Area Composition Tables

2020-2021 Washington Statewide Waste Characterization Study
Draft Report
June 2021 | 70
Table 24: Central WGA Overall Disposed Waste Stream, Detailed Composition, 2020-2021
Material
Est.
Percent + / - Est. Tons Tons + / - Material
Est.
Percent + / - Est. Tons Tons + / -
PAPER 20.2% 2.2% 119,478 13,144 WOOD DEBRIS 11.1% 3.0% 65,389 17,848
PAPER PACKAGING 12.0% 1.8% 71,053 10,353 Natural Wood 0.1% 0.1% 535 569
Newspaper Packaging 0.0% 0.0% 6 10 Treated Wood 0.6% 0.7% 3,370 4,311
Cardboard & Kraft Packaging 6.6% 1.3% 39,287 7,774 Painted Wood 0.9% 0.4% 5,415 2,356
Mixed/Low-grade Paper Packaging 2.1% 0.4% 12,157 2,472 Dimensional Lumber 2.7% 1.5% 16,168 8,756
Aseptic Containers 0.1% 0.0% 467 120 Engineered Wood 2.4% 1.1% 14,241 6,668
Gable Top Containers 0.6% 0.8% 3,553 4,438 Pallets & Crates 3.2% 1.7% 18,953 9,916
Other Polycoated Packaging 0.2% 0.0% 1,006 253 Other Untreated Wood 0.0% 0.0% 166 94
Compostable Paper Packaging 1.9% 0.4% 11,442 2,602 Wood By-products 0.3% 0.3% 1,812 1,900
R/C Paper Packaging 0.5% 0.2% 3,134 902 R/C Wood Debris 0.8% 0.4% 4,730 2,401
PAPER PRODUCTS 8.2% 1.3% 48,425 7,896 CONSTRUCTION MATERIALS 6.6% 2.1% 39,165 12,402
Newspaper Products 0.3% 0.1% 1,522 334 Plastic Lumber 0.1% 0.1% 375 362
Cardboard & Kraft Paper Products 0.0% 0.0% 29 46 Insulation 0.4% 0.3% 2,236 1,643
Magazines 0.6% 0.4% 3,693 2,238 Asphalt Paving 0.0% 0.0% 0 0
High-Grade Paper Products 0.3% 0.1% 1,863 859 Concrete 0.1% 0.1% 477 682
Other Groundwood Paper Products 0.1% 0.1% 461 744 Drywall 1.8% 1.4% 10,802 8,299
Mixed/Low-grade Paper Products 2.7% 0.8% 15,779 4,689 Carpet 0.8% 0.5% 4,745 2,836
Compostable Paper Products 3.4% 0.5% 19,856 2,829 Carpet Padding 0.0% 0.0% 0 0
R/C Paper Products 0.9% 0.4% 5,222 2,462 Soil, Rocks, & Sand 0.8% 0.6% 4,444 3,588
PLASTIC 14.8% 1.6% 87,713 9,356 Asphalt Roofing 0.6% 0.6% 3,745 3,572
PLASTIC PACKAGING 9.0% 1.0% 52,962 5,927 Plastic Floor Covering 0.0% 0.0% 128 208
#1 PETE Plastic Bottles 1.1% 0.2% 6,226 1,000 Ceramics & Brick 0.4% 0.5% 2,556 2,863
#1 PETE Plastic Non-bottles 0.5% 0.1% 2,790 399 R/C Construction Materials 1.6% 0.9% 9,657 5,177
#2 HDPE Plastic Natural Bottles 0.3% 0.1% 1,783 412 CONSUMER PRODUCTS 10.5% 2.5% 61,917 14,695
#2 HDPE Plastic Jars and Tubs 0.6% 0.3% 3,435 1,539 Televisions - LCD 0.4% 0.5% 2,388 2,732
#2 HDPE Plastic Colored Bottles 0.3% 0.1% 1,780 359 Televisions - CRT 0.6% 0.4% 3,291 2,627
#3 PVC Plastic Packaging 0.0% 0.0% 8 8 Television Peripherals 0.0% 0.0% 0 0
#4 LDPE Plastic Packaging 0.0% 0.0% 8 7 Computer Monitors - CRT 0.0% 0.0% 0 0
#5 PP Plastic Packaging 0.8% 0.1% 4,518 878 Computer Monitors - LCD 0.0% 0.0% 0 0
#6 PS Plastic Packaging 0.1% 0.0% 703 204 Computers 0.1% 0.1% 362 588
#7 Other/Unknown Plastic Packaging 0.5% 0.3% 3,157 1,689 Computer Peripherals 0.0% 0.0% 153 249
Expanded Polystyrene Packaging 0.6% 0.2% 3,450 1,162 Computer Printers 0.1% 0.1% 676 776
PLA Compostable Packaging 0.0% 0.0% 94 59 Audio Equipment 0.2% 0.2% 1,026 1,445
Plastic Merchandise Bags 0.3% 0.1% 1,966 351 Electronic Gaming Equipment 0.0% 0.0% 0 0
Packaging Film Plastic 3.1% 0.7% 18,344 4,184 Other Consumer Electronics 0.2% 0.2% 1,322 1,004
Transportation Packaging Film Plastic 0.6% 0.3% 3,671 1,573 Textiles- Organic 2.7% 0.7% 15,659 4,235
Flexible Plastic Packaging 0.1% 0.1% 712 384 Textiles- Synthetic/Mixed/Unknown 1.3% 0.4% 7,697 2,333
R/C Plastic Packaging 0.1% 0.1% 318 385 Shoes/Purses/Belts 0.3% 0.2% 1,641 1,005
PLASTIC PRODUCTS 5.9% 1.1% 34,751 6,523 Tires & Other Rubber 0.4% 0.2% 2,324 1,283
#1 PETE Plastic Products 0.0% 0.0% 1 2 Furniture 3.4% 1.7% 20,251 10,093
#2 HDPE Plastic Products: 0.0% 0.0% 126 204 Mattresses 0.9% 1.0% 5,127 6,113
#3 PVC Plastic Products 0.0% 0.0% 0 0 R/C Consumer Products 0.0% 0.0% 0 0
#4 LDPE Plastic Products 0.0% 0.0% 4 7 HAZARDOUS AND SPECIAL WASTES 1.4% 0.6% 8,128 3,618
#5 PP Plastic Products 0.0% 0.0% 13 14 Pesticides 0.0% 0.0% 21 34
#6 PS Plastic Products 0.0% 0.0% 172 69 HID/UV/Germicidal Lamps 0.0% 0.0% 38 60
#7 Other/Unknown Plastic Products 1.1% 0.3% 6,485 1,598 Compact Florescent Lamps 0.0% 0.0% 76 71
PLA Compostable Products 0.0% 0.0% 61 62 Florescent Tubes 0.0% 0.0% 157 231
Plastic Garbage Bags 1.2% 0.2% 7,242 1,192 Water-based Paint 0.0% 0.0% 192 250
Plastic Non-bag Film Products 0.7% 0.6% 4,021 3,476 Solvent-based Adhesives/Glues 0.0% 0.0% 80 96
Bulky Rigid Plastic Products 2.0% 0.7% 11,951 3,924 Water-based Adhesives/Glues 0.0% 0.0% 34 39
R/C Plastic Products 0.8% 0.2% 4,676 1,461 Oil-based Paint 0.0% 0.0% 0 0
GLASS 3.8% 0.9% 22,649 5,099 Lacquer/Varnish/Urethane Coatings/Stains 0.0% 0.0% 0 0
Clear Glass Containers 1.6% 0.3% 9,484 1,935 Field & Lawn Markings 0.0% 0.0% 0 0
Green Glass Containers 0.7% 0.2% 3,849 1,238 Primers/Sealings/Coatings 0.0% 0.0% 0 0
Brown/Other Colored Glass Containers 0.8% 0.3% 4,530 1,690 Water Repellents & Waterproofers 0.0% 0.0% 0 0
Plate Glass 0.6% 0.7% 3,606 4,162 Solvents 0.0% 0.0% 59 79
Non-glass Ceramics 0.1% 0.1% 536 317 Caustic Cleaners 0.0% 0.0% 38 61
R/C Glass 0.1% 0.1% 644 387 Dry-cell Batteries- Single Use 0.0% 0.0% 223 108
METAL 7.3% 1.6% 43,048 9,221 Dry-cell Batteries- Rechargeable 0.0% 0.0% 260 295
Aluminum Beverage Cans 0.6% 0.1% 3,647 852 Wet-cell Batteries 0.0% 0.0% 0 0
Aluminum Foil/Containers 0.2% 0.1% 1,477 363 Gasoline/Kerosene 0.0% 0.0% 0 0
Other Aluminum 0.1% 0.1% 568 521 Motor Oil 0.0% 0.0% 0 0
Other Non-ferrous Metal 0.0% 0.0% 230 177 Antifreeze 0.0% 0.0% 65 105
Food Cans - Tinned 0.9% 0.2% 5,203 1,164 Other Vehicle Fluids 0.0% 0.0% 0 0
Food Cans - Coated 0.0% 0.0% 264 176 Oil Filters 0.0% 0.0% 232 219
White Goods 0.4% 0.6% 2,239 3,640 Explosives 0.0% 0.0% 0 0
Other Ferrous Metal 2.6% 0.9% 15,488 5,161 Medical Wastes 0.7% 0.6% 4,096 3,396
R/C Metal 2.4% 1.1% 13,931 6,468 Sharps 0.0% 0.0% 1 1
ORGANICS 21.2% 2.6% 125,510 15,526 Pharmaceuticals & Vitamins 0.0% 0.0% 189 102
Edible Food Waste- Vegetative 9.5% 1.9% 56,400 11,060 Other Cleaners/Chemicals 0.0% 0.0% 9 15
Inedible Food Waste- Vegetative 3.6% 0.7% 21,406 4,393 Personal Care Products 0.0% 0.0% 268 169
Edible Food Waste- Meats/Fats/Oils 3.2% 0.8% 18,988 4,832 Other Potentially Hazardous Wastes 0.4% 0.2% 2,092 1,333
Inedible Food Waste- Meats/Fats/Oils 0.5% 0.2% 2,782 956 RESIDUALS 3.0% 0.5% 17,824 3,156
Yard/Garden Waste- Leaves and Grass 1.7% 0.6% 9,916 3,798 Disposable Diapers 2.0% 0.5% 11,891 3,018
Yard/Garden Waste- Prunings 0.2% 0.1% 1,387 764 Ash 0.0% 0.0% 87 122
Animal Manure 2.1% 0.7% 12,455 4,389 Dust 0.0% 0.0% 144 95
Animal Carcasses & Offal 0.0% 0.0% 10 14 Fines/Sorting Residues 1.0% 0.3% 5,685 1,748
Food Processing Wastes 0.0% 0.0% 0 0 Sludges & Other Special Industrial Wastes 0.0% 0.0% 17 28
R/C Organics 0.4% 0.2% 2,166 1,169
Estimated Origin Specified Disposed Tons 100% 590,822
Sample Count 104
Confidence intervals calculated at the 90% confidence level. Percentages for material types may not
total 100% due to rounding.

2020-2021 Washington Statewide Waste Characterization Study
Draft Report
June 2021 | 71
Table 25: Central WGA Commercial Disposed Waste Sector, Detailed Composition, 2020-2021
Material
Est.
Percent + / - Est. Tons Tons + / - Material
Est.
Percent + / - Est. Tons Tons + / -
PAPER 23.3% 4.3% 57,997 10,633 WOOD DEBRIS 16.8% 6.1% 41,881 15,241
PAPER PACKAGING 15.8% 3.2% 39,486 8,071 Natural Wood 0.0% 0.0% 105 121
Newspaper Packaging 0.0% 0.0% 6 10 Treated Wood 0.3% 0.4% 732 1,060
Cardboard & Kraft Packaging 10.0% 2.5% 24,842 6,286 Painted Wood 1.1% 0.8% 2,708 1,904
Mixed/Low-grade Paper Packaging 1.4% 0.5% 3,553 1,135 Dimensional Lumber 4.8% 3.2% 12,091 7,924
Aseptic Containers 0.0% 0.0% 103 69 Engineered Wood 5.0% 2.6% 12,396 6,556
Gable Top Containers 1.2% 1.8% 2,871 4,436 Pallets & Crates 4.0% 2.5% 10,070 6,172
Other Polycoated Packaging 0.1% 0.1% 174 202 Other Untreated Wood 0.0% 0.0% 67 65
Compostable Paper Packaging 2.7% 1.0% 6,791 2,384 Wood By-products 0.3% 0.4% 755 1,081
R/C Paper Packaging 0.5% 0.3% 1,144 814 R/C Wood Debris 1.2% 0.8% 2,957 2,050
PAPER PRODUCTS 7.4% 2.6% 18,512 6,432 CONSTRUCTION MATERIALS 5.8% 2.8% 14,584 6,895
Newspaper Products 0.1% 0.1% 293 202 Plastic Lumber 0.1% 0.1% 211 249
Cardboard & Kraft Paper Products 0.0% 0.0% 0 0 Insulation 0.4% 0.4% 889 997
Magazines 0.6% 0.8% 1,506 2,027 Asphalt Paving 0.0% 0.0% 0 0
High-Grade Paper Products 0.4% 0.2% 1,026 589 Concrete 0.0% 0.0% 0 0
Other Groundwood Paper Products 0.0% 0.0% 0 0 Drywall 0.8% 1.0% 2,119 2,405
Mixed/Low-grade Paper Products 2.5% 1.6% 6,130 3,874 Carpet 0.3% 0.4% 821 874
Compostable Paper Products 2.3% 0.8% 5,776 1,976 Carpet Padding 0.0% 0.0% 0 0
R/C Paper Products 1.5% 1.0% 3,780 2,378 Soil, Rocks, & Sand 0.3% 0.3% 764 823
PLASTIC 15.3% 2.9% 38,204 7,161 Asphalt Roofing 0.2% 0.3% 594 786
PLASTIC PACKAGING 7.7% 1.7% 19,240 4,306 Plastic Floor Covering 0.1% 0.1% 128 208
#1 PETE Plastic Bottles 0.7% 0.3% 1,818 661 Ceramics & Brick 1.0% 1.1% 2,515 2,862
#1 PETE Plastic Non-bottles 0.3% 0.1% 796 218 R/C Construction Materials 2.6% 1.5% 6,544 3,709
#2 HDPE Plastic Natural Bottles 0.2% 0.1% 572 226 CONSUMER PRODUCTS 6.2% 2.3% 15,511 5,688
#2 HDPE Plastic Jars and Tubs 1.0% 0.6% 2,392 1,434 Televisions - LCD 0.0% 0.0% 0 0
#2 HDPE Plastic Colored Bottles 0.2% 0.1% 616 282 Televisions - CRT 0.6% 0.7% 1,575 1,801
#3 PVC Plastic Packaging 0.0% 0.0% 2 4 Television Peripherals 0.0% 0.0% 0 0
#4 LDPE Plastic Packaging 0.0% 0.0% 2 2 Computer Monitors - CRT 0.0% 0.0% 0 0
#5 PP Plastic Packaging 0.5% 0.2% 1,251 511 Computer Monitors - LCD 0.0% 0.0% 0 0
#6 PS Plastic Packaging 0.1% 0.1% 271 180 Computers 0.0% 0.0% 0 0
#7 Other/Unknown Plastic Packaging 0.2% 0.1% 536 161 Computer Peripherals 0.0% 0.0% 0 0
Expanded Polystyrene Packaging 0.6% 0.3% 1,471 727 Computer Printers 0.0% 0.0% 0 0
PLA Compostable Packaging 0.0% 0.0% 60 49 Audio Equipment 0.0% 0.0% 0 0
Plastic Merchandise Bags 0.2% 0.1% 405 135 Electronic Gaming Equipment 0.0% 0.0% 0 0
Packaging Film Plastic 2.5% 1.0% 6,131 2,429 Other Consumer Electronics 0.2% 0.2% 421 613
Transportation Packaging Film Plastic 1.0% 0.6% 2,388 1,451 Textiles- Organic 1.9% 1.0% 4,853 2,422
Flexible Plastic Packaging 0.1% 0.1% 304 363 Textiles- Synthetic/Mixed/Unknown 1.1% 0.6% 2,838 1,600
R/C Plastic Packaging 0.1% 0.1% 226 366 Shoes/Purses/Belts 0.1% 0.1% 223 251
PLASTIC PRODUCTS 7.6% 2.2% 18,963 5,517 Tires & Other Rubber 0.4% 0.3% 1,105 787
#1 PETE Plastic Products 0.0% 0.0% 1 2 Furniture 1.8% 1.6% 4,496 3,951
#2 HDPE Plastic Products: 0.1% 0.1% 126 204 Mattresses 0.0% 0.0% 0 0
#3 PVC Plastic Products 0.0% 0.0% 0 0 R/C Consumer Products 0.0% 0.0% 0 0
#4 LDPE Plastic Products 0.0% 0.0% 0 0 HAZARDOUS AND SPECIAL WASTES 2.4% 1.4% 5,877 3,534
#5 PP Plastic Products 0.0% 0.0% 1 2 Pesticides 0.0% 0.0% 0 0
#6 PS Plastic Products 0.0% 0.0% 78 47 HID/UV/Germicidal Lamps 0.0% 0.0% 37 60
#7 Other/Unknown Plastic Products 1.3% 0.5% 3,158 1,367 Compact Florescent Lamps 0.0% 0.0% 0 0
PLA Compostable Products 0.0% 0.0% 56 62 Florescent Tubes 0.1% 0.1% 141 230
Plastic Garbage Bags 1.3% 0.3% 3,126 812 Water-based Paint 0.0% 0.0% 22 36
Plastic Non-bag Film Products 1.3% 1.4% 3,255 3,416 Solvent-based Adhesives/Glues 0.0% 0.0% 52 85
Bulky Rigid Plastic Products 2.6% 1.3% 6,433 3,138 Water-based Adhesives/Glues 0.0% 0.0% 0 0
R/C Plastic Products 1.1% 0.5% 2,729 1,270 Oil-based Paint 0.0% 0.0% 0 0
GLASS 2.2% 1.6% 5,533 4,008 Lacquer/Varnish/Urethane Coatings/Stains 0.0% 0.0% 0 0
Clear Glass Containers 0.8% 0.3% 1,927 682 Field & Lawn Markings 0.0% 0.0% 0 0
Green Glass Containers 0.1% 0.1% 344 258 Primers/Sealings/Coatings 0.0% 0.0% 0 0
Brown/Other Colored Glass Containers 0.2% 0.1% 590 288 Water Repellents & Waterproofers 0.0% 0.0% 0 0
Plate Glass 1.0% 1.6% 2,607 4,012 Solvents 0.0% 0.0% 48 77
Non-glass Ceramics 0.0% 0.0% 41 68 Caustic Cleaners 0.0% 0.0% 0 0
R/C Glass 0.0% 0.0% 24 28 Dry-cell Batteries- Single Use 0.0% 0.0% 51 83
METAL 8.0% 2.7% 19,963 6,830 Dry-cell Batteries- Rechargeable 0.0% 0.1% 102 166
Aluminum Beverage Cans 0.4% 0.2% 973 382 Wet-cell Batteries 0.0% 0.0% 0 0
Aluminum Foil/Containers 0.3% 0.1% 655 326 Gasoline/Kerosene 0.0% 0.0% 0 0
Other Aluminum 0.2% 0.2% 398 481 Motor Oil 0.0% 0.0% 0 0
Other Non-ferrous Metal 0.0% 0.1% 124 128 Antifreeze 0.0% 0.0% 0 0
Food Cans - Tinned 0.6% 0.4% 1,484 951 Other Vehicle Fluids 0.0% 0.0% 0 0
Food Cans - Coated 0.0% 0.0% 79 96 Oil Filters 0.0% 0.0% 55 72
White Goods 0.9% 1.5% 2,239 3,640 Explosives 0.0% 0.0% 0 0
Other Ferrous Metal 3.4% 1.6% 8,398 3,894 Medical Wastes 1.5% 1.4% 3,776 3,391
R/C Metal 2.3% 1.3% 5,611 3,167 Sharps 0.0% 0.0% 0 0
ORGANICS 18.7% 5.0% 46,645 12,573 Pharmaceuticals & Vitamins 0.0% 0.0% 20 25
Edible Food Waste- Vegetative 10.1% 4.1% 25,073 10,234 Other Cleaners/Chemicals 0.0% 0.0% 0 0
Inedible Food Waste- Vegetative 1.9% 1.0% 4,812 2,557 Personal Care Products 0.0% 0.0% 59 70
Edible Food Waste- Meats/Fats/Oils 3.8% 1.7% 9,574 4,216 Other Potentially Hazardous Wastes 0.6% 0.5% 1,515 1,281
Inedible Food Waste- Meats/Fats/Oils 0.4% 0.3% 1,071 768 RESIDUALS 1.3% 0.5% 3,132 1,312
Yard/Garden Waste- Leaves and Grass 1.0% 0.6% 2,599 1,432 Disposable Diapers 0.6% 0.3% 1,399 867
Yard/Garden Waste- Prunings 0.1% 0.1% 168 190 Ash 0.0% 0.0% 0 0
Animal Manure 1.2% 1.1% 3,104 2,730 Dust 0.0% 0.0% 0 0
Animal Carcasses & Offal 0.0% 0.0% 1 2 Fines/Sorting Residues 0.7% 0.4% 1,716 910
Food Processing Wastes 0.0% 0.0% 0 0 Sludges & Other Special Industrial Wastes 0.0% 0.0% 17 28
R/C Organics 0.1% 0.1% 243 160
Estimated Origin Specified Disposed Tons 100% 249,328
Sample Count 48Confidence intervals calculated at the 90% confidence level. Percentages for material types may not
total 100% due to rounding.

2020-2021 Washington Statewide Waste Characterization Study
Draft Report
June 2021 | 72
Table 26: Central WGA Residential Disposed Waste Sector, Detailed Composition, 2020-2021
Material
Est.
Percent + / - Est. Tons Tons + / - Material
Est.
Percent + / - Est. Tons Tons + / -
PAPER 20.6% 2.3% 43,452 4,925 WOOD DEBRIS 0.9% 0.4% 1,998 840
PAPER PACKAGING 9.2% 1.5% 19,309 3,132 Natural Wood 0.0% 0.0% 61 70
Newspaper Packaging 0.0% 0.0% 0 0 Treated Wood 0.0% 0.0% 0 0
Cardboard & Kraft Packaging 2.8% 0.7% 5,965 1,570 Painted Wood 0.2% 0.1% 518 311
Mixed/Low-grade Paper Packaging 2.9% 0.6% 6,106 1,340 Dimensional Lumber 0.1% 0.1% 256 268
Aseptic Containers 0.2% 0.0% 347 98 Engineered Wood 0.2% 0.2% 424 388
Gable Top Containers 0.3% 0.1% 568 130 Pallets & Crates 0.0% 0.0% 0 0
Other Polycoated Packaging 0.4% 0.1% 755 147 Other Untreated Wood 0.0% 0.0% 2 3
Compostable Paper Packaging 1.9% 0.5% 4,024 1,009 Wood By-products 0.0% 0.0% 50 81
R/C Paper Packaging 0.7% 0.1% 1,545 309 R/C Wood Debris 0.3% 0.3% 688 722
PAPER PRODUCTS 11.4% 1.9% 24,143 4,106 CONSTRUCTION MATERIALS 2.1% 2.3% 4,502 4,747
Newspaper Products 0.5% 0.1% 1,103 249 Plastic Lumber 0.1% 0.1% 164 263
Cardboard & Kraft Paper Products 0.0% 0.0% 0 0 Insulation 0.2% 0.2% 363 373
Magazines 0.9% 0.4% 1,960 937 Asphalt Paving 0.0% 0.0% 0 0
High-Grade Paper Products 0.1% 0.1% 291 116 Concrete 0.0% 0.0% 0 0
Other Groundwood Paper Products 0.2% 0.4% 461 744 Drywall 1.2% 1.9% 2,617 4,073
Mixed/Low-grade Paper Products 3.5% 1.1% 7,416 2,317 Carpet 0.6% 0.7% 1,210 1,376
Compostable Paper Products 5.8% 0.9% 12,203 1,826 Carpet Padding 0.0% 0.0% 0 0
R/C Paper Products 0.3% 0.2% 707 358 Soil, Rocks, & Sand 0.0% 0.1% 75 122
PLASTIC 15.1% 1.7% 31,830 3,652 Asphalt Roofing 0.0% 0.0% 13 20
PLASTIC PACKAGING 11.2% 1.1% 23,547 2,283 Plastic Floor Covering 0.0% 0.0% 0 0
#1 PETE Plastic Bottles 1.7% 0.3% 3,514 614 Ceramics & Brick 0.0% 0.0% 0 0
#1 PETE Plastic Non-bottles 0.8% 0.2% 1,713 318 R/C Construction Materials 0.0% 0.0% 61 98
#2 HDPE Plastic Natural Bottles 0.5% 0.2% 1,080 337 CONSUMER PRODUCTS 9.3% 4.2% 19,698 8,898
#2 HDPE Plastic Jars and Tubs 0.1% 0.1% 303 133 Televisions - LCD 0.6% 1.0% 1,279 2,060
#2 HDPE Plastic Colored Bottles 0.4% 0.1% 927 202 Televisions - CRT 0.0% 0.0% 0 0
#3 PVC Plastic Packaging 0.0% 0.0% 2 3 Television Peripherals 0.0% 0.0% 0 0
#4 LDPE Plastic Packaging 0.0% 0.0% 6 7 Computer Monitors - CRT 0.0% 0.0% 0 0
#5 PP Plastic Packaging 1.3% 0.3% 2,713 625 Computer Monitors - LCD 0.0% 0.0% 0 0
#6 PS Plastic Packaging 0.2% 0.0% 375 93 Computers 0.0% 0.0% 0 0
#7 Other/Unknown Plastic Packaging 1.0% 0.8% 2,172 1,668 Computer Peripherals 0.0% 0.0% 0 0
Expanded Polystyrene Packaging 0.4% 0.1% 937 281 Computer Printers 0.0% 0.0% 0 0
PLA Compostable Packaging 0.0% 0.0% 33 34 Audio Equipment 0.0% 0.0% 0 0
Plastic Merchandise Bags 0.6% 0.1% 1,269 286 Electronic Gaming Equipment 0.0% 0.0% 0 0
Packaging Film Plastic 3.7% 0.5% 7,842 1,091 Other Consumer Electronics 0.0% 0.0% 17 27
Transportation Packaging Film Plastic 0.2% 0.1% 365 276 Textiles- Organic 4.0% 1.6% 8,486 3,287
Flexible Plastic Packaging 0.1% 0.0% 275 95 Textiles- Synthetic/Mixed/Unknown 1.4% 0.6% 3,009 1,370
R/C Plastic Packaging 0.0% 0.0% 21 34 Shoes/Purses/Belts 0.6% 0.5% 1,237 957
PLASTIC PRODUCTS 3.9% 0.7% 8,283 1,462 Tires & Other Rubber 0.3% 0.4% 633 774
#1 PETE Plastic Products 0.0% 0.0% 0 0 Furniture 2.4% 2.7% 5,036 5,677
#2 HDPE Plastic Products: 0.0% 0.0% 0 0 Mattresses 0.0% 0.0% 0 0
#3 PVC Plastic Products 0.0% 0.0% 0 0 R/C Consumer Products 0.0% 0.0% 0 0
#4 LDPE Plastic Products 0.0% 0.0% 4 7 HAZARDOUS AND SPECIAL WASTES 0.6% 0.2% 1,276 482
#5 PP Plastic Products 0.0% 0.0% 4 7 Pesticides 0.0% 0.0% 0 0
#6 PS Plastic Products 0.0% 0.0% 60 30 HID/UV/Germicidal Lamps 0.0% 0.0% 0 0
#7 Other/Unknown Plastic Products 0.9% 0.2% 1,898 521 Compact Florescent Lamps 0.0% 0.0% 67 70
PLA Compostable Products 0.0% 0.0% 4 7 Florescent Tubes 0.0% 0.0% 0 0
Plastic Garbage Bags 1.7% 0.4% 3,611 858 Water-based Paint 0.1% 0.1% 153 246
Plastic Non-bag Film Products 0.0% 0.0% 48 78 Solvent-based Adhesives/Glues 0.0% 0.0% 27 44
Bulky Rigid Plastic Products 0.8% 0.4% 1,780 841 Water-based Adhesives/Glues 0.0% 0.0% 34 39
R/C Plastic Products 0.4% 0.2% 874 406 Oil-based Paint 0.0% 0.0% 0 0
GLASS 6.2% 1.2% 13,144 2,498 Lacquer/Varnish/Urethane Coatings/Stains 0.0% 0.0% 0 0
Clear Glass Containers 2.7% 0.6% 5,785 1,364 Field & Lawn Markings 0.0% 0.0% 0 0
Green Glass Containers 1.5% 0.6% 3,173 1,166 Primers/Sealings/Coatings 0.0% 0.0% 0 0
Brown/Other Colored Glass Containers 1.7% 0.8% 3,504 1,637 Water Repellents & Waterproofers 0.0% 0.0% 0 0
Plate Glass 0.0% 0.0% 0 0 Solvents 0.0% 0.0% 0 0
Non-glass Ceramics 0.2% 0.1% 432 304 Caustic Cleaners 0.0% 0.0% 38 61
R/C Glass 0.1% 0.1% 251 159 Dry-cell Batteries- Single Use 0.1% 0.0% 130 58
METAL 6.2% 2.1% 13,136 4,374 Dry-cell Batteries- Rechargeable 0.0% 0.0% 0 0
Aluminum Beverage Cans 1.1% 0.3% 2,233 734 Wet-cell Batteries 0.0% 0.0% 0 0
Aluminum Foil/Containers 0.3% 0.1% 694 154 Gasoline/Kerosene 0.0% 0.0% 0 0
Other Aluminum 0.0% 0.0% 6 10 Motor Oil 0.0% 0.0% 0 0
Other Non-ferrous Metal 0.0% 0.1% 99 122 Antifreeze 0.0% 0.0% 0 0
Food Cans - Tinned 1.5% 0.3% 3,256 643 Other Vehicle Fluids 0.0% 0.0% 0 0
Food Cans - Coated 0.1% 0.1% 182 147 Oil Filters 0.1% 0.1% 107 173
White Goods 0.0% 0.0% 0 0 Explosives 0.0% 0.0% 0 0
Other Ferrous Metal 1.1% 0.6% 2,363 1,218 Medical Wastes 0.1% 0.1% 265 184
R/C Metal 2.0% 2.1% 4,303 4,475 Sharps 0.0% 0.0% 1 1
ORGANICS 32.7% 3.9% 68,970 8,249 Pharmaceuticals & Vitamins 0.1% 0.0% 109 68
Edible Food Waste- Vegetative 13.1% 1.9% 27,562 3,906 Other Cleaners/Chemicals 0.0% 0.0% 0 0
Inedible Food Waste- Vegetative 7.4% 1.7% 15,504 3,518 Personal Care Products 0.1% 0.1% 143 144
Edible Food Waste- Meats/Fats/Oils 3.8% 1.0% 8,029 2,180 Other Potentially Hazardous Wastes 0.1% 0.1% 203 223
Inedible Food Waste- Meats/Fats/Oils 0.6% 0.2% 1,369 504 RESIDUALS 6.1% 1.2% 12,862 2,567
Yard/Garden Waste- Leaves and Grass 2.7% 1.5% 5,752 3,210 Disposable Diapers 4.4% 1.2% 9,383 2,607
Yard/Garden Waste- Prunings 0.2% 0.2% 442 338 Ash 0.0% 0.0% 0 0
Animal Manure 4.1% 1.6% 8,660 3,391 Dust 0.0% 0.0% 94 84
Animal Carcasses & Offal 0.0% 0.0% 8 14 Fines/Sorting Residues 1.6% 0.7% 3,384 1,470
Food Processing Wastes 0.0% 0.0% 0 0 Sludges & Other Special Industrial Wastes 0.0% 0.0% 0 0
R/C Organics 0.8% 0.5% 1,644 1,150
Estimated Origin Specified Disposed Tons 100% 210,869
Sample Count 24
Confidence intervals calculated at the 90% confidence level. Percentages for material types may not
total 100% due to rounding.

2020-2021 Washington Statewide Waste Characterization Study
Draft Report
June 2021 | 73
Table 27: Central WGA Self-hauled Disposed Waste Sector, Detailed Composition, 2020-2021
Material
Est.
Percent + / - Est. Tons Tons + / - Material
Est.
Percent + / - Est. Tons Tons + / -
PAPER 13.8% 4.6% 18,029 5,954 WOOD DEBRIS 16.5% 7.1% 21,509 9,249
PAPER PACKAGING 9.4% 4.3% 12,258 5,676 Natural Wood 0.3% 0.4% 369 551
Newspaper Packaging 0.0% 0.0% 0 0 Treated Wood 2.0% 3.2% 2,638 4,178
Cardboard & Kraft Packaging 6.5% 3.3% 8,480 4,295 Painted Wood 1.7% 1.0% 2,189 1,352
Mixed/Low-grade Paper Packaging 1.9% 1.3% 2,498 1,739 Dimensional Lumber 2.9% 2.8% 3,821 3,717
Aseptic Containers 0.0% 0.0% 18 16 Engineered Wood 1.1% 0.9% 1,421 1,155
Gable Top Containers 0.1% 0.0% 114 57 Pallets & Crates 6.8% 5.9% 8,883 7,761
Other Polycoated Packaging 0.1% 0.0% 77 41 Other Untreated Wood 0.1% 0.1% 97 67
Compostable Paper Packaging 0.5% 0.2% 627 262 Wood By-products 0.8% 1.2% 1,007 1,560
R/C Paper Packaging 0.3% 0.2% 445 235 R/C Wood Debris 0.8% 0.8% 1,085 1,019
PAPER PRODUCTS 4.4% 1.6% 5,771 2,031 CONSTRUCTION MATERIALS 15.4% 7.0% 20,079 9,151
Newspaper Products 0.1% 0.1% 126 93 Plastic Lumber 0.0% 0.0% 0 0
Cardboard & Kraft Paper Products 0.0% 0.0% 29 46 Insulation 0.8% 1.0% 984 1,252
Magazines 0.2% 0.1% 227 149 Asphalt Paving 0.0% 0.0% 0 0
High-Grade Paper Products 0.4% 0.5% 545 613 Concrete 0.4% 0.5% 477 682
Other Groundwood Paper Products 0.0% 0.0% 0 0 Drywall 4.6% 5.2% 6,067 6,819
Mixed/Low-grade Paper Products 1.7% 1.0% 2,233 1,270 Carpet 2.1% 1.8% 2,714 2,321
Compostable Paper Products 1.4% 0.7% 1,877 873 Carpet Padding 0.0% 0.0% 0 0
R/C Paper Products 0.6% 0.4% 735 525 Soil, Rocks, & Sand 2.8% 2.7% 3,605 3,490
PLASTIC 13.5% 3.7% 17,679 4,786 Asphalt Roofing 2.4% 2.7% 3,139 3,484
PLASTIC PACKAGING 7.8% 2.6% 10,175 3,373 Plastic Floor Covering 0.0% 0.0% 0 0
#1 PETE Plastic Bottles 0.7% 0.3% 894 432 Ceramics & Brick 0.0% 0.1% 41 65
#1 PETE Plastic Non-bottles 0.2% 0.1% 281 105 R/C Construction Materials 2.3% 2.8% 3,053 3,610
#2 HDPE Plastic Natural Bottles 0.1% 0.1% 131 73 CONSUMER PRODUCTS 20.4% 7.8% 26,708 10,218
#2 HDPE Plastic Jars and Tubs 0.6% 0.4% 740 544 Televisions - LCD 0.8% 1.4% 1,109 1,795
#2 HDPE Plastic Colored Bottles 0.2% 0.1% 237 92 Televisions - CRT 1.3% 1.5% 1,716 1,913
#3 PVC Plastic Packaging 0.0% 0.0% 4 6 Television Peripherals 0.0% 0.0% 0 0
#4 LDPE Plastic Packaging 0.0% 0.0% 0 0 Computer Monitors - CRT 0.0% 0.0% 0 0
#5 PP Plastic Packaging 0.4% 0.3% 554 345 Computer Monitors - LCD 0.0% 0.0% 0 0
#6 PS Plastic Packaging 0.0% 0.0% 57 30 Computers 0.3% 0.5% 362 588
#7 Other/Unknown Plastic Packaging 0.3% 0.2% 448 215 Computer Peripherals 0.1% 0.2% 153 249
Expanded Polystyrene Packaging 0.8% 0.7% 1,042 861 Computer Printers 0.5% 0.6% 676 776
PLA Compostable Packaging 0.0% 0.0% 1 1 Audio Equipment 0.8% 1.1% 1,026 1,445
Plastic Merchandise Bags 0.2% 0.1% 293 152 Electronic Gaming Equipment 0.0% 0.0% 0 0
Packaging Film Plastic 3.3% 2.5% 4,371 3,227 Other Consumer Electronics 0.7% 0.6% 885 795
Transportation Packaging Film Plastic 0.7% 0.4% 917 540 Textiles- Organic 1.8% 0.9% 2,319 1,128
Flexible Plastic Packaging 0.1% 0.1% 134 81 Textiles- Synthetic/Mixed/Unknown 1.4% 0.8% 1,850 1,001
R/C Plastic Packaging 0.1% 0.1% 71 115 Shoes/Purses/Belts 0.1% 0.1% 180 179
PLASTIC PRODUCTS 5.7% 2.4% 7,504 3,158 Tires & Other Rubber 0.4% 0.5% 585 653
#1 PETE Plastic Products 0.0% 0.0% 0 0 Furniture 8.2% 5.6% 10,718 7,350
#2 HDPE Plastic Products: 0.0% 0.0% 0 0 Mattresses 3.9% 4.7% 5,127 6,113
#3 PVC Plastic Products 0.0% 0.0% 0 0 R/C Consumer Products 0.0% 0.0% 0 0
#4 LDPE Plastic Products 0.0% 0.0% 0 0 HAZARDOUS AND SPECIAL WASTES 0.7% 0.5% 975 603
#5 PP Plastic Products 0.0% 0.0% 7 12 Pesticides 0.0% 0.0% 21 34
#6 PS Plastic Products 0.0% 0.0% 35 42 HID/UV/Germicidal Lamps 0.0% 0.0% 2 3
#7 Other/Unknown Plastic Products 1.1% 0.5% 1,429 642 Compact Florescent Lamps 0.0% 0.0% 9 9
PLA Compostable Products 0.0% 0.0% 0 0 Florescent Tubes 0.0% 0.0% 16 18
Plastic Garbage Bags 0.4% 0.1% 505 164 Water-based Paint 0.0% 0.0% 17 27
Plastic Non-bag Film Products 0.5% 0.5% 717 643 Solvent-based Adhesives/Glues 0.0% 0.0% 0 0
Bulky Rigid Plastic Products 2.9% 1.7% 3,738 2,201 Water-based Adhesives/Glues 0.0% 0.0% 0 0
R/C Plastic Products 0.8% 0.5% 1,072 597 Oil-based Paint 0.0% 0.0% 0 0
GLASS 3.0% 1.5% 3,971 1,921 Lacquer/Varnish/Urethane Coatings/Stains 0.0% 0.0% 0 0
Clear Glass Containers 1.4% 0.9% 1,771 1,191 Field & Lawn Markings 0.0% 0.0% 0 0
Green Glass Containers 0.3% 0.2% 332 326 Primers/Sealings/Coatings 0.0% 0.0% 0 0
Brown/Other Colored Glass Containers 0.3% 0.2% 436 305 Water Repellents & Waterproofers 0.0% 0.0% 0 0
Plate Glass 0.8% 0.9% 999 1,110 Solvents 0.0% 0.0% 11 18
Non-glass Ceramics 0.0% 0.0% 63 55 Caustic Cleaners 0.0% 0.0% 0 0
R/C Glass 0.3% 0.3% 369 351 Dry-cell Batteries- Single Use 0.0% 0.0% 42 37
METAL 7.6% 3.4% 9,949 4,387 Dry-cell Batteries- Rechargeable 0.1% 0.2% 157 244
Aluminum Beverage Cans 0.3% 0.2% 441 202 Wet-cell Batteries 0.0% 0.0% 0 0
Aluminum Foil/Containers 0.1% 0.0% 128 50 Gasoline/Kerosene 0.0% 0.0% 0 0
Other Aluminum 0.1% 0.2% 165 201 Motor Oil 0.0% 0.0% 0 0
Other Non-ferrous Metal 0.0% 0.0% 7 12 Antifreeze 0.0% 0.1% 65 105
Food Cans - Tinned 0.4% 0.1% 462 194 Other Vehicle Fluids 0.0% 0.0% 0 0
Food Cans - Coated 0.0% 0.0% 3 4 Oil Filters 0.1% 0.1% 70 114
White Goods 0.0% 0.0% 0 0 Explosives 0.0% 0.0% 0 0
Other Ferrous Metal 3.6% 2.4% 4,726 3,161 Medical Wastes 0.0% 0.0% 56 32
R/C Metal 3.1% 2.6% 4,017 3,433 Sharps 0.0% 0.0% 0 0
ORGANICS 7.6% 3.0% 9,895 3,863 Pharmaceuticals & Vitamins 0.0% 0.1% 60 71
Edible Food Waste- Vegetative 2.9% 1.2% 3,765 1,531 Other Cleaners/Chemicals 0.0% 0.0% 9 15
Inedible Food Waste- Vegetative 0.8% 0.5% 1,091 622 Personal Care Products 0.1% 0.0% 67 55
Edible Food Waste- Meats/Fats/Oils 1.1% 0.7% 1,386 906 Other Potentially Hazardous Wastes 0.3% 0.2% 374 295
Inedible Food Waste- Meats/Fats/Oils 0.3% 0.2% 342 265 RESIDUALS 1.4% 1.0% 1,830 1,284
Yard/Garden Waste- Leaves and Grass 1.2% 1.1% 1,565 1,438 Disposable Diapers 0.8% 1.0% 1,109 1,251
Yard/Garden Waste- Prunings 0.6% 0.5% 777 658 Ash 0.1% 0.1% 87 122
Animal Manure 0.5% 0.4% 691 555 Dust 0.0% 0.0% 50 44
Animal Carcasses & Offal 0.0% 0.0% 0 0 Fines/Sorting Residues 0.4% 0.2% 584 259
Food Processing Wastes 0.0% 0.0% 0 0 Sludges & Other Special Industrial Wastes 0.0% 0.0% 0 0
R/C Organics 0.2% 0.1% 279 135
Estimated Origin Specified Disposed Tons 100% 130,624
Sample Count 32
Confidence intervals calculated at the 90% confidence level. Percentages for material types may not
total 100% due to rounding.

2020-2021 Washington Statewide Waste Characterization Study
Final Report
August 2021 | 74
East Waste Generation Area Composition Tables

2020-2021 Washington Statewide Waste Characterization Study
Draft Report
June 2021 | 75
Table 28: East WGA Overall Disposed Waste Stream, Detailed Composition, 2020-2021
Material
Est.
Percent + / - Est. Tons Tons + / - Material
Est.
Percent + / - Est. Tons Tons + / -
PAPER 19.0% 2.2% 160,811 18,752 WOOD DEBRIS 9.8% 2.6% 83,099 22,043
PAPER PACKAGING 11.8% 1.7% 99,323 14,263 Natural Wood 0.2% 0.3% 1,829 2,353
Newspaper Packaging 0.0% 0.0% 168 161 Treated Wood 0.4% 0.3% 3,320 2,741
Cardboard & Kraft Packaging 6.0% 1.1% 51,026 9,073 Painted Wood 3.8% 1.8% 32,017 15,233
Mixed/Low-grade Paper Packaging 1.8% 0.3% 14,996 2,709 Dimensional Lumber 0.8% 0.3% 6,587 2,926
Aseptic Containers 0.1% 0.0% 954 340 Engineered Wood 0.9% 0.4% 7,552 3,027
Gable Top Containers 0.2% 0.1% 1,981 745 Pallets & Crates 2.6% 1.4% 22,061 11,928
Other Polycoated Packaging 0.1% 0.0% 1,015 366 Other Untreated Wood 0.0% 0.0% 185 152
Compostable Paper Packaging 1.7% 0.4% 14,396 3,155 Wood By-products 0.2% 0.2% 1,783 1,780
R/C Paper Packaging 1.8% 1.3% 14,787 10,982 R/C Wood Debris 0.9% 0.5% 7,765 4,413
PAPER PRODUCTS 7.3% 1.0% 61,489 8,812 CONSTRUCTION MATERIALS 8.7% 2.8% 73,219 23,685
Newspaper Products 0.4% 0.1% 3,052 1,168 Plastic Lumber 0.2% 0.3% 2,043 2,686
Cardboard & Kraft Paper Products 0.0% 0.0% 186 302 Insulation 0.8% 0.5% 6,426 4,478
Magazines 0.2% 0.1% 1,630 1,118 Asphalt Paving 0.1% 0.2% 877 1,410
High-Grade Paper Products 0.2% 0.1% 1,883 761 Concrete 2.5% 1.9% 21,110 16,352
Other Groundwood Paper Products 0.0% 0.1% 401 508 Drywall 1.1% 1.0% 9,283 8,556
Mixed/Low-grade Paper Products 1.7% 0.4% 14,736 3,668 Carpet 1.0% 0.8% 8,546 6,555
Compostable Paper Products 3.4% 0.6% 29,103 5,337 Carpet Padding 0.7% 0.8% 6,328 6,655
R/C Paper Products 1.2% 0.7% 10,498 5,925 Soil, Rocks, & Sand 0.7% 0.6% 6,310 4,700
PLASTIC 15.3% 2.2% 129,137 18,304 Asphalt Roofing 0.8% 0.9% 6,776 7,447
PLASTIC PACKAGING 8.3% 1.1% 69,948 9,546 Plastic Floor Covering 0.0% 0.0% 141 228
#1 PETE Plastic Bottles 1.0% 0.2% 8,209 1,527 Ceramics & Brick 0.0% 0.0% 344 319
#1 PETE Plastic Non-bottles 0.4% 0.1% 3,348 868 R/C Construction Materials 0.6% 0.8% 5,036 7,152
#2 HDPE Plastic Natural Bottles 0.2% 0.1% 2,031 523 CONSUMER PRODUCTS 9.4% 1.8% 79,497 15,197
#2 HDPE Plastic Jars and Tubs 0.4% 0.1% 2,966 1,114 Televisions - LCD 0.3% 0.5% 2,614 4,171
#2 HDPE Plastic Colored Bottles 0.3% 0.1% 2,250 688 Televisions - CRT 0.5% 0.7% 4,333 5,900
#3 PVC Plastic Packaging 0.0% 0.0% 29 39 Television Peripherals 0.0% 0.0% 0 0
#4 LDPE Plastic Packaging 0.0% 0.0% 0 0 Computer Monitors - CRT 0.0% 0.0% 0 0
#5 PP Plastic Packaging 1.0% 0.3% 8,040 2,619 Computer Monitors - LCD 0.0% 0.0% 0 0
#6 PS Plastic Packaging 0.1% 0.0% 1,186 235 Computers 0.0% 0.0% 0 0
#7 Other/Unknown Plastic Packaging 0.9% 0.9% 7,659 7,236 Computer Peripherals 0.0% 0.0% 0 0
Expanded Polystyrene Packaging 0.6% 0.2% 5,483 1,751 Computer Printers 0.2% 0.2% 1,628 1,887
PLA Compostable Packaging 0.0% 0.0% 252 162 Audio Equipment 0.0% 0.0% 0 0
Plastic Merchandise Bags 0.4% 0.1% 3,640 544 Electronic Gaming Equipment 0.0% 0.0% 0 0
Packaging Film Plastic 2.3% 0.4% 19,695 3,258 Other Consumer Electronics 0.7% 0.5% 5,703 4,290
Transportation Packaging Film Plastic 0.5% 0.2% 4,553 1,493 Textiles- Organic 2.5% 0.5% 20,732 4,115
Flexible Plastic Packaging 0.1% 0.0% 520 168 Textiles- Synthetic/Mixed/Unknown 0.8% 0.4% 7,155 3,004
R/C Plastic Packaging 0.0% 0.0% 86 124 Shoes/Purses/Belts 0.3% 0.2% 2,124 1,332
PLASTIC PRODUCTS 7.0% 1.7% 59,189 14,037 Tires & Other Rubber 0.4% 0.2% 3,776 1,789
#1 PETE Plastic Products 0.0% 0.0% 46 64 Furniture 2.5% 1.1% 21,035 9,053
#2 HDPE Plastic Products: 0.0% 0.0% 0 0 Mattresses 0.6% 0.5% 5,177 3,996
#3 PVC Plastic Products 0.0% 0.0% 0 0 R/C Consumer Products 0.6% 0.7% 5,221 5,618
#4 LDPE Plastic Products 0.0% 0.0% 0 0 HAZARDOUS AND SPECIAL WASTES 4.0% 2.4% 33,448 20,373
#5 PP Plastic Products 0.0% 0.0% 22 32 Pesticides 0.0% 0.0% 76 124
#6 PS Plastic Products 0.0% 0.0% 233 139 HID/UV/Germicidal Lamps 0.0% 0.0% 213 347
#7 Other/Unknown Plastic Products 1.0% 0.3% 8,476 2,338 Compact Florescent Lamps 0.0% 0.0% 0 0
PLA Compostable Products 0.0% 0.0% 71 75 Florescent Tubes 0.0% 0.0% 9 14
Plastic Garbage Bags 1.5% 0.3% 13,000 2,379 Water-based Paint 0.1% 0.1% 857 1,022
Plastic Non-bag Film Products 0.7% 0.7% 6,199 5,705 Solvent-based Adhesives/Glues 0.0% 0.0% 0 0
Bulky Rigid Plastic Products 2.8% 1.3% 23,700 10,795 Water-based Adhesives/Glues 0.0% 0.0% 115 110
R/C Plastic Products 0.9% 0.4% 7,442 3,465 Oil-based Paint 0.0% 0.0% 0 0
GLASS 2.0% 0.7% 17,277 5,621 Lacquer/Varnish/Urethane Coatings/Stains 0.0% 0.0% 0 0
Clear Glass Containers 1.2% 0.3% 9,752 2,800 Field & Lawn Markings 0.0% 0.0% 0 0
Green Glass Containers 0.4% 0.2% 3,620 1,884 Primers/Sealings/Coatings 0.0% 0.0% 108 174
Brown/Other Colored Glass Containers 0.3% 0.2% 2,224 1,299 Water Repellents & Waterproofers 0.0% 0.0% 35 57
Plate Glass 0.0% 0.1% 341 442 Solvents 0.2% 0.3% 1,793 2,921
Non-glass Ceramics 0.1% 0.1% 864 599 Caustic Cleaners 0.0% 0.0% 50 82
R/C Glass 0.1% 0.0% 476 394 Dry-cell Batteries- Single Use 0.0% 0.0% 185 79
METAL 7.2% 1.6% 60,516 13,252 Dry-cell Batteries- Rechargeable 0.0% 0.0% 0 0
Aluminum Beverage Cans 0.5% 0.1% 4,049 1,027 Wet-cell Batteries 0.0% 0.0% 0 0
Aluminum Foil/Containers 0.2% 0.0% 1,598 322 Gasoline/Kerosene 0.0% 0.0% 0 0
Other Aluminum 0.0% 0.0% 87 127 Motor Oil 0.0% 0.0% 0 0
Other Non-ferrous Metal 0.1% 0.0% 542 230 Antifreeze 0.0% 0.0% 0 0
Food Cans - Tinned 0.5% 0.1% 4,311 1,241 Other Vehicle Fluids 0.0% 0.0% 0 0
Food Cans - Coated 0.0% 0.0% 224 116 Oil Filters 0.1% 0.1% 469 562
White Goods 0.8% 0.9% 6,403 7,491 Explosives 0.0% 0.0% 0 0
Other Ferrous Metal 2.9% 0.8% 24,436 6,858 Medical Wastes 3.1% 2.4% 26,490 19,912
R/C Metal 2.2% 0.9% 18,866 7,197 Sharps 0.0% 0.0% 7 7
ORGANICS 20.9% 2.7% 176,398 23,011 Pharmaceuticals & Vitamins 0.0% 0.0% 131 97
Edible Food Waste- Vegetative 7.7% 1.4% 65,417 12,070 Other Cleaners/Chemicals 0.0% 0.0% 89 103
Inedible Food Waste- Vegetative 3.3% 0.7% 27,713 6,247 Personal Care Products 0.3% 0.2% 2,677 1,323
Edible Food Waste- Meats/Fats/Oils 2.7% 0.9% 22,757 7,375 Other Potentially Hazardous Wastes 0.0% 0.0% 142 158
Inedible Food Waste- Meats/Fats/Oils 0.5% 0.2% 4,163 1,892 RESIDUALS 3.7% 1.0% 31,495 8,854
Yard/Garden Waste- Leaves and Grass 2.3% 1.0% 19,699 8,613 Disposable Diapers 1.7% 0.9% 14,512 7,569
Yard/Garden Waste- Prunings 0.5% 0.3% 3,948 2,323 Ash 0.2% 0.2% 1,279 2,057
Animal Manure 3.4% 1.5% 28,343 12,951 Dust 0.0% 0.0% 0 0
Animal Carcasses & Offal 0.2% 0.3% 1,430 2,250 Fines/Sorting Residues 1.9% 0.5% 15,704 4,216
Food Processing Wastes 0.0% 0.0% 0 0 Sludges & Other Special Industrial Wastes 0.0% 0.0% 0 0
R/C Organics 0.3% 0.1% 2,927 1,173
Estimated Origin Specified Disposed Tons 100% 844,896
Sample Count 104Confidence intervals calculated at the 90% confidence level. Percentages for material types may not
total 100% due to rounding.

2020-2021 Washington Statewide Waste Characterization Study
Draft Report
June 2021 | 76
Table 29: East WGA Commercial Disposed Waste, Detailed Composition, 2020-2021
Material
Est.
Percent + / - Est. Tons Tons + / - Material
Est.
Percent + / - Est. Tons Tons + / -
PAPER 23.1% 4.4% 85,822 16,357 WOOD DEBRIS 13.1% 5.4% 48,573 19,931
PAPER PACKAGING 15.2% 3.4% 56,359 12,567 Natural Wood 0.0% 0.0% 32 53
Newspaper Packaging 0.0% 0.0% 14 23 Treated Wood 0.2% 0.3% 743 1,210
Cardboard & Kraft Packaging 8.4% 2.1% 30,982 7,739 Painted Wood 4.1% 3.7% 15,221 13,662
Mixed/Low-grade Paper Packaging 1.4% 0.5% 5,224 1,891 Dimensional Lumber 0.8% 0.5% 2,823 1,925
Aseptic Containers 0.1% 0.1% 465 265 Engineered Wood 0.8% 0.5% 2,903 1,982
Gable Top Containers 0.3% 0.2% 972 693 Pallets & Crates 5.8% 3.2% 21,337 11,870
Other Polycoated Packaging 0.1% 0.1% 282 199 Other Untreated Wood 0.0% 0.0% 94 104
Compostable Paper Packaging 1.9% 0.8% 7,137 2,798 Wood By-products 0.3% 0.4% 1,227 1,622
R/C Paper Packaging 3.0% 2.9% 11,283 10,904 R/C Wood Debris 1.1% 1.1% 4,192 4,069
PAPER PRODUCTS 7.9% 2.0% 29,463 7,564 CONSTRUCTION MATERIALS 11.3% 5.7% 41,946 21,149
Newspaper Products 0.3% 0.2% 1,108 775 Plastic Lumber 0.4% 0.7% 1,583 2,580
Cardboard & Kraft Paper Products 0.1% 0.1% 186 302 Insulation 0.1% 0.1% 442 508
Magazines 0.1% 0.1% 447 347 Asphalt Paving 0.0% 0.0% 0 0
High-Grade Paper Products 0.3% 0.2% 1,150 676 Concrete 5.3% 4.4% 19,495 16,224
Other Groundwood Paper Products 0.1% 0.1% 384 507 Drywall 1.6% 2.2% 5,892 8,098
Mixed/Low-grade Paper Products 1.8% 0.9% 6,500 3,192 Carpet 1.3% 1.6% 4,839 5,967
Compostable Paper Products 2.8% 0.9% 10,360 3,394 Carpet Padding 0.9% 1.4% 3,266 5,302
R/C Paper Products 2.5% 1.6% 9,328 5,872 Soil, Rocks, & Sand 0.4% 0.6% 1,391 2,119
PLASTIC 16.3% 3.7% 60,423 13,578 Asphalt Roofing 0.0% 0.0% 0 0
PLASTIC PACKAGING 8.3% 2.2% 30,959 8,327 Plastic Floor Covering 0.0% 0.1% 141 228
#1 PETE Plastic Bottles 0.6% 0.2% 2,094 812 Ceramics & Brick 0.1% 0.1% 236 283
#1 PETE Plastic Non-bottles 0.2% 0.1% 822 352 R/C Construction Materials 1.3% 1.9% 4,661 7,136
#2 HDPE Plastic Natural Bottles 0.2% 0.1% 618 204 CONSUMER PRODUCTS 4.2% 1.7% 15,695 6,376
#2 HDPE Plastic Jars and Tubs 0.5% 0.3% 1,714 930 Televisions - LCD 0.0% 0.0% 0 0
#2 HDPE Plastic Colored Bottles 0.2% 0.1% 830 371 Televisions - CRT 0.0% 0.0% 0 0
#3 PVC Plastic Packaging 0.0% 0.0% 23 38 Television Peripherals 0.0% 0.0% 0 0
#4 LDPE Plastic Packaging 0.0% 0.0% 0 0 Computer Monitors - CRT 0.0% 0.0% 0 0
#5 PP Plastic Packaging 1.0% 0.7% 3,713 2,452 Computer Monitors - LCD 0.0% 0.0% 0 0
#6 PS Plastic Packaging 0.1% 0.0% 502 180 Computers 0.0% 0.0% 0 0
#7 Other/Unknown Plastic Packaging 1.6% 1.9% 5,828 7,228 Computer Peripherals 0.0% 0.0% 0 0
Expanded Polystyrene Packaging 0.8% 0.4% 3,073 1,630 Computer Printers 0.0% 0.0% 0 0
PLA Compostable Packaging 0.0% 0.0% 91 72 Audio Equipment 0.0% 0.0% 0 0
Plastic Merchandise Bags 0.2% 0.1% 743 269 Electronic Gaming Equipment 0.0% 0.0% 0 0
Packaging Film Plastic 2.0% 0.7% 7,585 2,621 Other Consumer Electronics 0.0% 0.0% 34 45
Transportation Packaging Film Plastic 0.9% 0.3% 3,219 1,269 Textiles- Organic 1.5% 0.7% 5,559 2,608
Flexible Plastic Packaging 0.0% 0.0% 91 42 Textiles- Synthetic/Mixed/Unknown 0.8% 0.6% 2,828 2,401
R/C Plastic Packaging 0.0% 0.0% 11 18 Shoes/Purses/Belts 0.1% 0.1% 195 211
PLASTIC PRODUCTS 7.9% 2.4% 29,464 8,866 Tires & Other Rubber 0.7% 0.4% 2,507 1,634
#1 PETE Plastic Products 0.0% 0.0% 0 0 Furniture 1.2% 1.1% 4,573 4,256
#2 HDPE Plastic Products: 0.0% 0.0% 0 0 Mattresses 0.0% 0.0% 0 0
#3 PVC Plastic Products 0.0% 0.0% 0 0 R/C Consumer Products 0.0% 0.0% 0 0
#4 LDPE Plastic Products 0.0% 0.0% 0 0 HAZARDOUS AND SPECIAL WASTES 7.9% 5.5% 29,384 20,314
#5 PP Plastic Products 0.0% 0.0% 22 32 Pesticides 0.0% 0.0% 0 0
#6 PS Plastic Products 0.0% 0.0% 61 60 HID/UV/Germicidal Lamps 0.1% 0.1% 213 347
#7 Other/Unknown Plastic Products 1.1% 0.5% 4,039 1,802 Compact Florescent Lamps 0.0% 0.0% 0 0
PLA Compostable Products 0.0% 0.0% 56 74 Florescent Tubes 0.0% 0.0% 0 0
Plastic Garbage Bags 1.9% 0.6% 6,862 2,185 Water-based Paint 0.2% 0.3% 627 962
Plastic Non-bag Film Products 0.8% 1.3% 3,068 4,731 Solvent-based Adhesives/Glues 0.0% 0.0% 0 0
Bulky Rigid Plastic Products 3.2% 1.7% 11,964 6,366 Water-based Adhesives/Glues 0.0% 0.0% 0 0
R/C Plastic Products 0.9% 0.5% 3,392 1,842 Oil-based Paint 0.0% 0.0% 0 0
GLASS 1.4% 1.3% 5,025 4,974 Lacquer/Varnish/Urethane Coatings/Stains 0.0% 0.0% 0 0
Clear Glass Containers 0.7% 0.6% 2,487 2,194 Field & Lawn Markings 0.0% 0.0% 0 0
Green Glass Containers 0.4% 0.5% 1,424 1,697 Primers/Sealings/Coatings 0.0% 0.0% 0 0
Brown/Other Colored Glass Containers 0.3% 0.3% 972 1,143 Water Repellents & Waterproofers 0.0% 0.0% 0 0
Plate Glass 0.0% 0.0% 0 0 Solvents 0.5% 0.8% 1,793 2,921
Non-glass Ceramics 0.0% 0.0% 135 156 Caustic Cleaners 0.0% 0.0% 50 82
R/C Glass 0.0% 0.0% 7 12 Dry-cell Batteries- Single Use 0.0% 0.0% 14 18
METAL 7.6% 2.5% 28,137 9,174 Dry-cell Batteries- Rechargeable 0.0% 0.0% 0 0
Aluminum Beverage Cans 0.3% 0.1% 1,257 489 Wet-cell Batteries 0.0% 0.0% 0 0
Aluminum Foil/Containers 0.1% 0.1% 365 248 Gasoline/Kerosene 0.0% 0.0% 0 0
Other Aluminum 0.0% 0.0% 0 0 Motor Oil 0.0% 0.0% 0 0
Other Non-ferrous Metal 0.0% 0.0% 171 140 Antifreeze 0.0% 0.0% 0 0
Food Cans - Tinned 0.4% 0.3% 1,413 1,107 Other Vehicle Fluids 0.0% 0.0% 0 0
Food Cans - Coated 0.0% 0.0% 32 53 Oil Filters 0.1% 0.1% 380 543
White Goods 0.0% 0.0% 0 0 Explosives 0.0% 0.0% 0 0
Other Ferrous Metal 3.8% 1.5% 14,183 5,386 Medical Wastes 6.6% 5.4% 24,446 19,860
R/C Metal 2.9% 1.7% 10,715 6,289 Sharps 0.0% 0.0% 2 3
ORGANICS 12.6% 3.6% 46,670 13,536 Pharmaceuticals & Vitamins 0.0% 0.0% 56 57
Edible Food Waste- Vegetative 6.2% 2.4% 22,871 8,764 Other Cleaners/Chemicals 0.0% 0.0% 43 71
Inedible Food Waste- Vegetative 1.9% 0.8% 7,038 2,862 Personal Care Products 0.5% 0.3% 1,730 1,251
Edible Food Waste- Meats/Fats/Oils 1.7% 1.0% 6,148 3,686 Other Potentially Hazardous Wastes 0.0% 0.0% 28 44
Inedible Food Waste- Meats/Fats/Oils 0.4% 0.3% 1,453 1,259 RESIDUALS 2.5% 2.0% 9,185 7,240
Yard/Garden Waste- Leaves and Grass 2.0% 1.6% 7,459 5,938 Disposable Diapers 1.8% 1.9% 6,629 7,216
Yard/Garden Waste- Prunings 0.1% 0.2% 523 628 Ash 0.0% 0.0% 0 0
Animal Manure 0.2% 0.2% 892 821 Dust 0.0% 0.0% 0 0
Animal Carcasses & Offal 0.0% 0.0% 0 0 Fines/Sorting Residues 0.7% 0.3% 2,555 1,224
Food Processing Wastes 0.0% 0.0% 0 0 Sludges & Other Special Industrial Wastes 0.0% 0.0% 0 0
R/C Organics 0.1% 0.1% 287 212
Estimated Origin Specified Disposed Tons 100% 370,859
Sample Count 48
Confidence intervals calculated at the 90% confidence level. Percentages for material types may not
total 100% due to rounding.

2020-2021 Washington Statewide Waste Characterization Study
Draft Report
June 2021 | 77
Table 30: East WGA Residential Disposed Waste Sector, Detailed Composition, 2020-2021
Material
Est.
Percent + / - Est. Tons Tons + / - Material
Est.
Percent + / - Est. Tons Tons + / -
PAPER 18.5% 2.3% 62,032 7,812 WOOD DEBRIS 2.6% 1.5% 8,811 5,127
PAPER PACKAGING 10.5% 1.6% 35,025 5,514 Natural Wood 0.1% 0.1% 359 405
Newspaper Packaging 0.0% 0.0% 145 158 Treated Wood 0.4% 0.7% 1,365 2,201
Cardboard & Kraft Packaging 4.1% 1.0% 13,855 3,189 Painted Wood 1.3% 1.4% 4,512 4,593
Mixed/Low-grade Paper Packaging 2.7% 0.6% 9,051 1,893 Dimensional Lumber 0.2% 0.1% 573 501
Aseptic Containers 0.1% 0.1% 451 209 Engineered Wood 0.3% 0.3% 1,078 967
Gable Top Containers 0.3% 0.1% 930 265 Pallets & Crates 0.0% 0.0% 0 0
Other Polycoated Packaging 0.2% 0.1% 692 305 Other Untreated Wood 0.0% 0.0% 70 106
Compostable Paper Packaging 2.0% 0.4% 6,790 1,420 Wood By-products 0.0% 0.0% 109 115
R/C Paper Packaging 0.9% 0.4% 3,111 1,232 R/C Wood Debris 0.2% 0.2% 745 758
PAPER PRODUCTS 8.1% 1.2% 27,007 3,922 CONSTRUCTION MATERIALS 2.2% 1.3% 7,329 4,219
Newspaper Products 0.4% 0.2% 1,374 591 Plastic Lumber 0.0% 0.0% 0 0
Cardboard & Kraft Paper Products 0.0% 0.0% 0 0 Insulation 0.1% 0.1% 287 463
Magazines 0.3% 0.3% 1,038 1,039 Asphalt Paving 0.3% 0.4% 877 1,410
High-Grade Paper Products 0.2% 0.1% 643 333 Concrete 0.1% 0.2% 415 637
Other Groundwood Paper Products 0.0% 0.0% 0 0 Drywall 0.2% 0.3% 738 901
Mixed/Low-grade Paper Products 2.1% 0.5% 6,866 1,639 Carpet 0.1% 0.1% 224 358
Compostable Paper Products 4.9% 1.2% 16,559 3,852 Carpet Padding 0.0% 0.0% 20 32
R/C Paper Products 0.2% 0.1% 527 388 Soil, Rocks, & Sand 1.4% 1.2% 4,624 4,177
PLASTIC 16.4% 3.3% 55,039 10,937 Asphalt Roofing 0.0% 0.1% 109 175
PLASTIC PACKAGING 10.4% 1.3% 34,861 4,371 Plastic Floor Covering 0.0% 0.0% 0 0
#1 PETE Plastic Bottles 1.7% 0.4% 5,656 1,213 Ceramics & Brick 0.0% 0.0% 0 0
#1 PETE Plastic Non-bottles 0.7% 0.2% 2,371 788 R/C Construction Materials 0.0% 0.0% 35 41
#2 HDPE Plastic Natural Bottles 0.4% 0.1% 1,361 480 CONSUMER PRODUCTS 9.9% 3.4% 33,142 11,256
#2 HDPE Plastic Jars and Tubs 0.3% 0.2% 1,127 606 Televisions - LCD 0.8% 1.2% 2,614 4,171
#2 HDPE Plastic Colored Bottles 0.4% 0.2% 1,252 568 Televisions - CRT 1.1% 1.7% 3,593 5,777
#3 PVC Plastic Packaging 0.0% 0.0% 0 0 Television Peripherals 0.0% 0.0% 0 0
#4 LDPE Plastic Packaging 0.0% 0.0% 0 0 Computer Monitors - CRT 0.0% 0.0% 0 0
#5 PP Plastic Packaging 1.2% 0.3% 4,103 913 Computer Monitors - LCD 0.0% 0.0% 0 0
#6 PS Plastic Packaging 0.2% 0.0% 649 150 Computers 0.0% 0.0% 0 0
#7 Other/Unknown Plastic Packaging 0.5% 0.1% 1,641 324 Computer Peripherals 0.0% 0.0% 0 0
Expanded Polystyrene Packaging 0.5% 0.1% 1,833 471 Computer Printers 0.5% 0.6% 1,628 1,887
PLA Compostable Packaging 0.0% 0.0% 161 145 Audio Equipment 0.0% 0.0% 0 0
Plastic Merchandise Bags 0.8% 0.1% 2,713 461 Electronic Gaming Equipment 0.0% 0.0% 0 0
Packaging Film Plastic 3.3% 0.6% 11,171 1,858 Other Consumer Electronics 1.4% 1.3% 4,726 4,189
Transportation Packaging Film Plastic 0.2% 0.1% 511 289 Textiles- Organic 3.5% 0.8% 11,826 2,615
Flexible Plastic Packaging 0.1% 0.0% 311 130 Textiles- Synthetic/Mixed/Unknown 0.8% 0.5% 2,769 1,517
R/C Plastic Packaging 0.0% 0.0% 0 0 Shoes/Purses/Belts 0.3% 0.2% 870 611
PLASTIC PRODUCTS 6.0% 2.9% 20,177 9,650 Tires & Other Rubber 0.3% 0.2% 893 650
#1 PETE Plastic Products 0.0% 0.0% 46 64 Furniture 0.2% 0.3% 610 984
#2 HDPE Plastic Products: 0.0% 0.0% 0 0 Mattresses 0.0% 0.0% 0 0
#3 PVC Plastic Products 0.0% 0.0% 0 0 R/C Consumer Products 1.1% 1.5% 3,612 5,078
#4 LDPE Plastic Products 0.0% 0.0% 0 0 HAZARDOUS AND SPECIAL WASTES 0.9% 0.4% 3,117 1,442
#5 PP Plastic Products 0.0% 0.0% 0 0 Pesticides 0.0% 0.0% 0 0
#6 PS Plastic Products 0.0% 0.0% 163 125 HID/UV/Germicidal Lamps 0.0% 0.0% 0 0
#7 Other/Unknown Plastic Products 1.0% 0.4% 3,312 1,393 Compact Florescent Lamps 0.0% 0.0% 0 0
PLA Compostable Products 0.0% 0.0% 14 9 Florescent Tubes 0.0% 0.0% 0 0
Plastic Garbage Bags 1.6% 0.3% 5,241 865 Water-based Paint 0.0% 0.0% 0 0
Plastic Non-bag Film Products 0.3% 0.3% 999 1,001 Solvent-based Adhesives/Glues 0.0% 0.0% 0 0
Bulky Rigid Plastic Products 2.2% 2.5% 7,413 8,224 Water-based Adhesives/Glues 0.0% 0.0% 92 106
R/C Plastic Products 0.9% 0.8% 2,990 2,771 Oil-based Paint 0.0% 0.0% 0 0
GLASS 3.3% 0.8% 11,177 2,550 Lacquer/Varnish/Urethane Coatings/Stains 0.0% 0.0% 0 0
Clear Glass Containers 2.1% 0.5% 6,955 1,729 Field & Lawn Markings 0.0% 0.0% 0 0
Green Glass Containers 0.6% 0.2% 2,123 814 Primers/Sealings/Coatings 0.0% 0.0% 0 0
Brown/Other Colored Glass Containers 0.3% 0.2% 1,048 587 Water Repellents & Waterproofers 0.0% 0.0% 0 0
Plate Glass 0.1% 0.1% 267 429 Solvents 0.0% 0.0% 0 0
Non-glass Ceramics 0.2% 0.2% 643 565 Caustic Cleaners 0.0% 0.0% 0 0
R/C Glass 0.0% 0.0% 142 125 Dry-cell Batteries- Single Use 0.0% 0.0% 130 67
METAL 7.4% 2.8% 24,603 9,235 Dry-cell Batteries- Rechargeable 0.0% 0.0% 0 0
Aluminum Beverage Cans 0.8% 0.3% 2,647 891 Wet-cell Batteries 0.0% 0.0% 0 0
Aluminum Foil/Containers 0.3% 0.1% 1,142 195 Gasoline/Kerosene 0.0% 0.0% 0 0
Other Aluminum 0.0% 0.0% 79 126 Motor Oil 0.0% 0.0% 0 0
Other Non-ferrous Metal 0.1% 0.0% 277 156 Antifreeze 0.0% 0.0% 0 0
Food Cans - Tinned 0.8% 0.1% 2,571 496 Other Vehicle Fluids 0.0% 0.0% 0 0
Food Cans - Coated 0.0% 0.0% 158 93 Oil Filters 0.0% 0.0% 89 144
White Goods 1.3% 2.1% 4,450 7,171 Explosives 0.0% 0.0% 0 0
Other Ferrous Metal 2.2% 1.2% 7,301 3,941 Medical Wastes 0.6% 0.4% 1,956 1,434
R/C Metal 1.8% 1.0% 5,979 3,385 Sharps 0.0% 0.0% 3 5
ORGANICS 32.4% 4.7% 108,275 15,702 Pharmaceuticals & Vitamins 0.0% 0.0% 40 53
Edible Food Waste- Vegetative 11.5% 2.4% 38,554 7,992 Other Cleaners/Chemicals 0.0% 0.0% 46 74
Inedible Food Waste- Vegetative 5.3% 1.5% 17,867 5,092 Personal Care Products 0.2% 0.1% 669 320
Edible Food Waste- Meats/Fats/Oils 4.2% 1.8% 14,167 5,911 Other Potentially Hazardous Wastes 0.0% 0.0% 92 147
Inedible Food Waste- Meats/Fats/Oils 0.7% 0.4% 2,338 1,300 RESIDUALS 6.3% 1.5% 21,078 5,056
Yard/Garden Waste- Leaves and Grass 2.8% 1.6% 9,321 5,336 Disposable Diapers 2.2% 0.7% 7,496 2,260
Yard/Garden Waste- Prunings 1.0% 0.7% 3,260 2,229 Ash 0.4% 0.6% 1,279 2,057
Animal Manure 5.7% 2.8% 18,912 9,263 Dust 0.0% 0.0% 0 0
Animal Carcasses & Offal 0.4% 0.7% 1,394 2,249 Fines/Sorting Residues 3.7% 1.2% 12,304 4,003
Food Processing Wastes 0.0% 0.0% 0 0 Sludges & Other Special Industrial Wastes 0.0% 0.0% 0 0
R/C Organics 0.7% 0.3% 2,463 1,143
Estimated Origin Specified Disposed Tons 100% 334,603
Sample Count 24
Confidence intervals calculated at the 90% confidence level. Percentages for material types may not
total 100% due to rounding.

2020-2021 Washington Statewide Waste Characterization Study
Draft Report
June 2021 | 78
Table 31: East WGA Self-hauled Disposed Waste Sector, Detailed Composition, 2020-2021
Material
Est.
Percent + / - Est. Tons Tons + / - Material
Est.
Percent + / - Est. Tons Tons + / -
PAPER 9.3% 3.4% 12,958 4,803 WOOD DEBRIS 18.4% 5.7% 25,715 7,896
PAPER PACKAGING 5.7% 2.8% 7,939 3,887 Natural Wood 1.0% 1.7% 1,437 2,317
Newspaper Packaging 0.0% 0.0% 9 14 Treated Wood 0.9% 0.8% 1,213 1,097
Cardboard & Kraft Packaging 4.4% 2.5% 6,190 3,503 Painted Wood 8.8% 3.5% 12,283 4,928
Mixed/Low-grade Paper Packaging 0.5% 0.3% 720 425 Dimensional Lumber 2.3% 1.5% 3,191 2,146
Aseptic Containers 0.0% 0.0% 39 38 Engineered Wood 2.6% 1.5% 3,571 2,073
Gable Top Containers 0.1% 0.0% 79 62 Pallets & Crates 0.5% 0.8% 724 1,169
Other Polycoated Packaging 0.0% 0.0% 40 36 Other Untreated Wood 0.0% 0.0% 21 29
Compostable Paper Packaging 0.3% 0.2% 469 332 Wood By-products 0.3% 0.5% 446 725
R/C Paper Packaging 0.3% 0.3% 393 428 R/C Wood Debris 2.0% 1.1% 2,828 1,533
PAPER PRODUCTS 3.6% 1.6% 5,019 2,248 CONSTRUCTION MATERIALS 17.2% 7.0% 23,944 9,792
Newspaper Products 0.4% 0.5% 570 643 Plastic Lumber 0.3% 0.5% 461 749
Cardboard & Kraft Paper Products 0.0% 0.0% 0 0 Insulation 4.1% 3.2% 5,698 4,425
Magazines 0.1% 0.2% 144 222 Asphalt Paving 0.0% 0.0% 0 0
High-Grade Paper Products 0.1% 0.1% 90 107 Concrete 0.9% 1.4% 1,199 1,942
Other Groundwood Paper Products 0.0% 0.0% 17 28 Drywall 1.9% 1.9% 2,653 2,611
Mixed/Low-grade Paper Products 1.0% 0.5% 1,371 762 Carpet 2.5% 1.9% 3,482 2,690
Compostable Paper Products 1.6% 1.0% 2,184 1,458 Carpet Padding 2.2% 2.9% 3,042 4,022
R/C Paper Products 0.5% 0.5% 643 684 Soil, Rocks, & Sand 0.2% 0.3% 294 392
PLASTIC 9.8% 4.0% 13,676 5,573 Asphalt Roofing 4.8% 5.3% 6,668 7,445
PLASTIC PACKAGING 3.0% 1.2% 4,128 1,636 Plastic Floor Covering 0.0% 0.0% 0 0
#1 PETE Plastic Bottles 0.3% 0.3% 459 448 Ceramics & Brick 0.1% 0.1% 108 146
#1 PETE Plastic Non-bottles 0.1% 0.1% 155 93 R/C Construction Materials 0.2% 0.3% 339 472
#2 HDPE Plastic Natural Bottles 0.0% 0.0% 51 35 CONSUMER PRODUCTS 22.0% 5.7% 30,660 7,974
#2 HDPE Plastic Jars and Tubs 0.1% 0.1% 124 92 Televisions - LCD 0.0% 0.0% 0 0
#2 HDPE Plastic Colored Bottles 0.1% 0.1% 168 113 Televisions - CRT 0.5% 0.9% 741 1,200
#3 PVC Plastic Packaging 0.0% 0.0% 6 8 Television Peripherals 0.0% 0.0% 0 0
#4 LDPE Plastic Packaging 0.0% 0.0% 0 0 Computer Monitors - CRT 0.0% 0.0% 0 0
#5 PP Plastic Packaging 0.2% 0.1% 223 118 Computer Monitors - LCD 0.0% 0.0% 0 0
#6 PS Plastic Packaging 0.0% 0.0% 35 21 Computers 0.0% 0.0% 0 0
#7 Other/Unknown Plastic Packaging 0.1% 0.1% 190 109 Computer Peripherals 0.0% 0.0% 0 0
Expanded Polystyrene Packaging 0.4% 0.3% 578 435 Computer Printers 0.0% 0.0% 0 0
PLA Compostable Packaging 0.0% 0.0% 1 2 Audio Equipment 0.0% 0.0% 0 0
Plastic Merchandise Bags 0.1% 0.1% 184 104 Electronic Gaming Equipment 0.0% 0.0% 0 0
Packaging Film Plastic 0.7% 0.4% 938 544 Other Consumer Electronics 0.7% 0.7% 942 928
Transportation Packaging Film Plastic 0.6% 0.5% 823 732 Textiles- Organic 2.4% 1.3% 3,348 1,814
Flexible Plastic Packaging 0.1% 0.1% 117 98 Textiles- Synthetic/Mixed/Unknown 1.1% 0.7% 1,558 978
R/C Plastic Packaging 0.1% 0.1% 75 123 Shoes/Purses/Belts 0.8% 0.8% 1,059 1,164
PLASTIC PRODUCTS 6.8% 3.6% 9,548 5,030 Tires & Other Rubber 0.3% 0.2% 376 330
#1 PETE Plastic Products 0.0% 0.0% 0 0 Furniture 11.4% 5.7% 15,852 7,929
#2 HDPE Plastic Products: 0.0% 0.0% 0 0 Mattresses 3.7% 2.9% 5,177 3,996
#3 PVC Plastic Products 0.0% 0.0% 0 0 R/C Consumer Products 1.2% 1.7% 1,608 2,402
#4 LDPE Plastic Products 0.0% 0.0% 0 0 HAZARDOUS AND SPECIAL WASTES 0.7% 0.4% 946 565
#5 PP Plastic Products 0.0% 0.0% 0 0 Pesticides 0.1% 0.1% 76 124
#6 PS Plastic Products 0.0% 0.0% 10 16 HID/UV/Germicidal Lamps 0.0% 0.0% 0 0
#7 Other/Unknown Plastic Products 0.8% 0.4% 1,124 528 Compact Florescent Lamps 0.0% 0.0% 0 0
PLA Compostable Products 0.0% 0.0% 1 2 Florescent Tubes 0.0% 0.0% 9 14
Plastic Garbage Bags 0.6% 0.3% 897 370 Water-based Paint 0.2% 0.2% 229 344
Plastic Non-bag Film Products 1.5% 2.2% 2,133 3,026 Solvent-based Adhesives/Glues 0.0% 0.0% 0 0
Bulky Rigid Plastic Products 3.1% 2.1% 4,322 2,894 Water-based Adhesives/Glues 0.0% 0.0% 23 31
R/C Plastic Products 0.8% 0.7% 1,061 965 Oil-based Paint 0.0% 0.0% 0 0
GLASS 0.8% 0.4% 1,075 593 Lacquer/Varnish/Urethane Coatings/Stains 0.0% 0.0% 0 0
Clear Glass Containers 0.2% 0.1% 311 202 Field & Lawn Markings 0.0% 0.0% 0 0
Green Glass Containers 0.1% 0.1% 74 96 Primers/Sealings/Coatings 0.1% 0.1% 108 174
Brown/Other Colored Glass Containers 0.1% 0.1% 204 190 Water Repellents & Waterproofers 0.0% 0.0% 35 57
Plate Glass 0.1% 0.1% 74 106 Solvents 0.0% 0.0% 0 0
Non-glass Ceramics 0.1% 0.1% 86 124 Caustic Cleaners 0.0% 0.0% 0 0
R/C Glass 0.2% 0.3% 327 373 Dry-cell Batteries- Single Use 0.0% 0.0% 41 36
METAL 5.6% 1.8% 7,776 2,486 Dry-cell Batteries- Rechargeable 0.0% 0.0% 0 0
Aluminum Beverage Cans 0.1% 0.1% 145 152 Wet-cell Batteries 0.0% 0.0% 0 0
Aluminum Foil/Containers 0.1% 0.0% 91 64 Gasoline/Kerosene 0.0% 0.0% 0 0
Other Aluminum 0.0% 0.0% 8 12 Motor Oil 0.0% 0.0% 0 0
Other Non-ferrous Metal 0.1% 0.1% 94 96 Antifreeze 0.0% 0.0% 0 0
Food Cans - Tinned 0.2% 0.2% 327 262 Other Vehicle Fluids 0.0% 0.0% 0 0
Food Cans - Coated 0.0% 0.0% 34 47 Oil Filters 0.0% 0.0% 0 0
White Goods 1.4% 1.6% 1,953 2,166 Explosives 0.0% 0.0% 0 0
Other Ferrous Metal 2.1% 1.1% 2,952 1,575 Medical Wastes 0.1% 0.1% 88 104
R/C Metal 1.6% 0.6% 2,172 889 Sharps 0.0% 0.0% 2 3
ORGANICS 15.4% 7.2% 21,453 9,988 Pharmaceuticals & Vitamins 0.0% 0.0% 35 57
Edible Food Waste- Vegetative 2.9% 1.6% 3,993 2,239 Other Cleaners/Chemicals 0.0% 0.0% 0 0
Inedible Food Waste- Vegetative 2.0% 1.6% 2,808 2,215 Personal Care Products 0.2% 0.2% 278 289
Edible Food Waste- Meats/Fats/Oils 1.8% 1.7% 2,443 2,420 Other Potentially Hazardous Wastes 0.0% 0.0% 21 34
Inedible Food Waste- Meats/Fats/Oils 0.3% 0.4% 373 553 RESIDUALS 0.9% 0.5% 1,232 645
Yard/Garden Waste- Leaves and Grass 2.1% 2.3% 2,920 3,233 Disposable Diapers 0.3% 0.2% 387 347
Yard/Garden Waste- Prunings 0.1% 0.1% 165 187 Ash 0.0% 0.0% 0 0
Animal Manure 6.1% 6.5% 8,539 9,014 Dust 0.0% 0.0% 0 0
Animal Carcasses & Offal 0.0% 0.0% 35 57 Fines/Sorting Residues 0.6% 0.4% 845 505
Food Processing Wastes 0.0% 0.0% 0 0 Sludges & Other Special Industrial Wastes 0.0% 0.0% 0 0
R/C Organics 0.1% 0.1% 178 157
Estimated Origin Specified Disposed Tons 100% 139,435
Sample Count 32Confidence intervals calculated at the 90% confidence level. Percentages for material types may not
total 100% due to rounding.

2020-2021 Washington Statewide Waste Characterization Study
Final Report
August 2021 | 79
Northwest Waste Generation Area Composition Tables
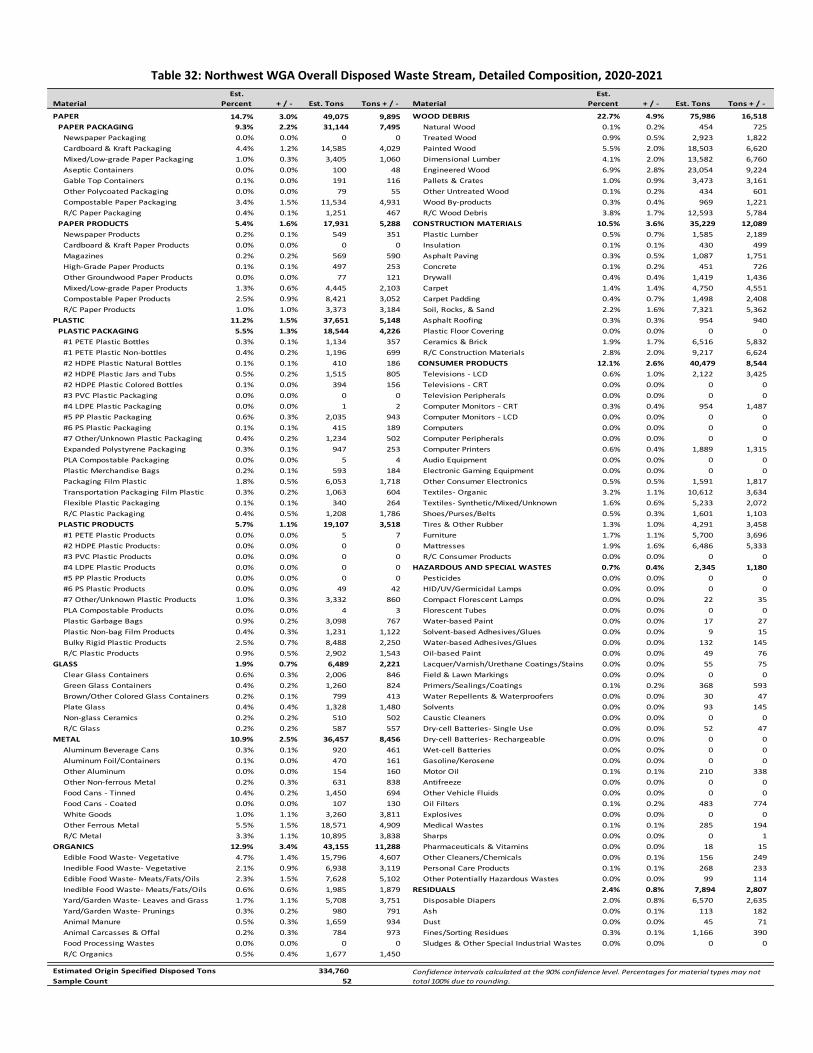
2020-2021 Washington Statewide Waste Characterization Study
Draft Report
June 2021 | 80
Table 32: Northwest WGA Overall Disposed Waste Stream, Detailed Composition, 2020-2021
Material
Est.
Percent + / - Est. Tons Tons + / - Material
Est.
Percent + / - Est. Tons Tons + / -
PAPER 14.7% 3.0% 49,075 9,895 WOOD DEBRIS 22.7% 4.9% 75,986 16,518
PAPER PACKAGING 9.3% 2.2% 31,144 7,495 Natural Wood 0.1% 0.2% 454 725
Newspaper Packaging 0.0% 0.0% 0 0 Treated Wood 0.9% 0.5% 2,923 1,822
Cardboard & Kraft Packaging 4.4% 1.2% 14,585 4,029 Painted Wood 5.5% 2.0% 18,503 6,620
Mixed/Low-grade Paper Packaging 1.0% 0.3% 3,405 1,060 Dimensional Lumber 4.1% 2.0% 13,582 6,760
Aseptic Containers 0.0% 0.0% 100 48 Engineered Wood 6.9% 2.8% 23,054 9,224
Gable Top Containers 0.1% 0.0% 191 116 Pallets & Crates 1.0% 0.9% 3,473 3,161
Other Polycoated Packaging 0.0% 0.0% 79 55 Other Untreated Wood 0.1% 0.2% 434 601
Compostable Paper Packaging 3.4% 1.5% 11,534 4,931 Wood By-products 0.3% 0.4% 969 1,221
R/C Paper Packaging 0.4% 0.1% 1,251 467 R/C Wood Debris 3.8% 1.7% 12,593 5,784
PAPER PRODUCTS 5.4% 1.6% 17,931 5,288 CONSTRUCTION MATERIALS 10.5% 3.6% 35,229 12,089
Newspaper Products 0.2% 0.1% 549 351 Plastic Lumber 0.5% 0.7% 1,585 2,189
Cardboard & Kraft Paper Products 0.0% 0.0% 0 0 Insulation 0.1% 0.1% 430 499
Magazines 0.2% 0.2% 569 590 Asphalt Paving 0.3% 0.5% 1,087 1,751
High-Grade Paper Products 0.1% 0.1% 497 253 Concrete 0.1% 0.2% 451 726
Other Groundwood Paper Products 0.0% 0.0% 77 121 Drywall 0.4% 0.4% 1,419 1,436
Mixed/Low-grade Paper Products 1.3% 0.6% 4,445 2,103 Carpet 1.4% 1.4% 4,750 4,551
Compostable Paper Products 2.5% 0.9% 8,421 3,052 Carpet Padding 0.4% 0.7% 1,498 2,408
R/C Paper Products 1.0% 1.0% 3,373 3,184 Soil, Rocks, & Sand 2.2% 1.6% 7,321 5,362
PLASTIC 11.2% 1.5% 37,651 5,148 Asphalt Roofing 0.3% 0.3% 954 940
PLASTIC PACKAGING 5.5% 1.3% 18,544 4,226 Plastic Floor Covering 0.0% 0.0% 0 0
#1 PETE Plastic Bottles 0.3% 0.1% 1,134 357 Ceramics & Brick 1.9% 1.7% 6,516 5,832
#1 PETE Plastic Non-bottles 0.4% 0.2% 1,196 699 R/C Construction Materials 2.8% 2.0% 9,217 6,624
#2 HDPE Plastic Natural Bottles 0.1% 0.1% 410 186 CONSUMER PRODUCTS 12.1% 2.6% 40,479 8,544
#2 HDPE Plastic Jars and Tubs 0.5% 0.2% 1,515 805 Televisions - LCD 0.6% 1.0% 2,122 3,425
#2 HDPE Plastic Colored Bottles 0.1% 0.0% 394 156 Televisions - CRT 0.0% 0.0% 0 0
#3 PVC Plastic Packaging 0.0% 0.0% 0 0 Television Peripherals 0.0% 0.0% 0 0
#4 LDPE Plastic Packaging 0.0% 0.0% 1 2 Computer Monitors - CRT 0.3% 0.4% 954 1,487
#5 PP Plastic Packaging 0.6% 0.3% 2,035 943 Computer Monitors - LCD 0.0% 0.0% 0 0
#6 PS Plastic Packaging 0.1% 0.1% 415 189 Computers 0.0% 0.0% 0 0
#7 Other/Unknown Plastic Packaging 0.4% 0.2% 1,234 502 Computer Peripherals 0.0% 0.0% 0 0
Expanded Polystyrene Packaging 0.3% 0.1% 947 253 Computer Printers 0.6% 0.4% 1,889 1,315
PLA Compostable Packaging 0.0% 0.0% 5 4 Audio Equipment 0.0% 0.0% 0 0
Plastic Merchandise Bags 0.2% 0.1% 593 184 Electronic Gaming Equipment 0.0% 0.0% 0 0
Packaging Film Plastic 1.8% 0.5% 6,053 1,718 Other Consumer Electronics 0.5% 0.5% 1,591 1,817
Transportation Packaging Film Plastic 0.3% 0.2% 1,063 604 Textiles- Organic 3.2% 1.1% 10,612 3,634
Flexible Plastic Packaging 0.1% 0.1% 340 264 Textiles- Synthetic/Mixed/Unknown 1.6% 0.6% 5,233 2,072
R/C Plastic Packaging 0.4% 0.5% 1,208 1,786 Shoes/Purses/Belts 0.5% 0.3% 1,601 1,103
PLASTIC PRODUCTS 5.7% 1.1% 19,107 3,518 Tires & Other Rubber 1.3% 1.0% 4,291 3,458
#1 PETE Plastic Products 0.0% 0.0% 5 7 Furniture 1.7% 1.1% 5,700 3,696
#2 HDPE Plastic Products: 0.0% 0.0% 0 0 Mattresses 1.9% 1.6% 6,486 5,333
#3 PVC Plastic Products 0.0% 0.0% 0 0 R/C Consumer Products 0.0% 0.0% 0 0
#4 LDPE Plastic Products 0.0% 0.0% 0 0 HAZARDOUS AND SPECIAL WASTES 0.7% 0.4% 2,345 1,180
#5 PP Plastic Products 0.0% 0.0% 0 0 Pesticides 0.0% 0.0% 0 0
#6 PS Plastic Products 0.0% 0.0% 49 42 HID/UV/Germicidal Lamps 0.0% 0.0% 0 0
#7 Other/Unknown Plastic Products 1.0% 0.3% 3,332 860 Compact Florescent Lamps 0.0% 0.0% 22 35
PLA Compostable Products 0.0% 0.0% 4 3 Florescent Tubes 0.0% 0.0% 0 0
Plastic Garbage Bags 0.9% 0.2% 3,098 767 Water-based Paint 0.0% 0.0% 17 27
Plastic Non-bag Film Products 0.4% 0.3% 1,231 1,122 Solvent-based Adhesives/Glues 0.0% 0.0% 9 15
Bulky Rigid Plastic Products 2.5% 0.7% 8,488 2,250 Water-based Adhesives/Glues 0.0% 0.0% 132 145
R/C Plastic Products 0.9% 0.5% 2,902 1,543 Oil-based Paint 0.0% 0.0% 49 76
GLASS 1.9% 0.7% 6,489 2,221 Lacquer/Varnish/Urethane Coatings/Stains 0.0% 0.0% 55 75
Clear Glass Containers 0.6% 0.3% 2,006 846 Field & Lawn Markings 0.0% 0.0% 0 0
Green Glass Containers 0.4% 0.2% 1,260 824 Primers/Sealings/Coatings 0.1% 0.2% 368 593
Brown/Other Colored Glass Containers 0.2% 0.1% 799 413 Water Repellents & Waterproofers 0.0% 0.0% 30 47
Plate Glass 0.4% 0.4% 1,328 1,480 Solvents 0.0% 0.0% 93 145
Non-glass Ceramics 0.2% 0.2% 510 502 Caustic Cleaners 0.0% 0.0% 0 0
R/C Glass 0.2% 0.2% 587 557 Dry-cell Batteries- Single Use 0.0% 0.0% 52 47
METAL 10.9% 2.5% 36,457 8,456 Dry-cell Batteries- Rechargeable 0.0% 0.0% 0 0
Aluminum Beverage Cans 0.3% 0.1% 920 461 Wet-cell Batteries 0.0% 0.0% 0 0
Aluminum Foil/Containers 0.1% 0.0% 470 161 Gasoline/Kerosene 0.0% 0.0% 0 0
Other Aluminum 0.0% 0.0% 154 160 Motor Oil 0.1% 0.1% 210 338
Other Non-ferrous Metal 0.2% 0.3% 631 838 Antifreeze 0.0% 0.0% 0 0
Food Cans - Tinned 0.4% 0.2% 1,450 694 Other Vehicle Fluids 0.0% 0.0% 0 0
Food Cans - Coated 0.0% 0.0% 107 130 Oil Filters 0.1% 0.2% 483 774
White Goods 1.0% 1.1% 3,260 3,811 Explosives 0.0% 0.0% 0 0
Other Ferrous Metal 5.5% 1.5% 18,571 4,909 Medical Wastes 0.1% 0.1% 285 194
R/C Metal 3.3% 1.1% 10,895 3,838 Sharps 0.0% 0.0% 0 1
ORGANICS 12.9% 3.4% 43,155 11,288 Pharmaceuticals & Vitamins 0.0% 0.0% 18 15
Edible Food Waste- Vegetative 4.7% 1.4% 15,796 4,607 Other Cleaners/Chemicals 0.0% 0.1% 156 249
Inedible Food Waste- Vegetative 2.1% 0.9% 6,938 3,119 Personal Care Products 0.1% 0.1% 268 233
Edible Food Waste- Meats/Fats/Oils 2.3% 1.5% 7,628 5,102 Other Potentially Hazardous Wastes 0.0% 0.0% 99 114
Inedible Food Waste- Meats/Fats/Oils 0.6% 0.6% 1,985 1,879 RESIDUALS 2.4% 0.8% 7,894 2,807
Yard/Garden Waste- Leaves and Grass 1.7% 1.1% 5,708 3,751 Disposable Diapers 2.0% 0.8% 6,570 2,635
Yard/Garden Waste- Prunings 0.3% 0.2% 980 791 Ash 0.0% 0.1% 113 182
Animal Manure 0.5% 0.3% 1,659 934 Dust 0.0% 0.0% 45 71
Animal Carcasses & Offal 0.2% 0.3% 784 973 Fines/Sorting Residues 0.3% 0.1% 1,166 390
Food Processing Wastes 0.0% 0.0% 0 0 Sludges & Other Special Industrial Wastes 0.0% 0.0% 0 0
R/C Organics 0.5% 0.4% 1,677 1,450
Estimated Origin Specified Disposed Tons 100% 334,760
Sample Count 52Confidence intervals calculated at the 90% confidence level. Percentages for material types may not
total 100% due to rounding.

2020-2021 Washington Statewide Waste Characterization Study
Draft Report
June 2021 | 81
Table 33: Northwest WGA Commercial Disposed Waste Sector, Detailed Composition, 2020-2021
Material
Est.
Percent + / - Est. Tons Tons + / - Material
Est.
Percent + / - Est. Tons Tons + / -
PAPER 18.5% 5.2% 29,559 8,251 WOOD DEBRIS 23.0% 8.1% 36,683 12,952
PAPER PACKAGING 13.7% 4.4% 21,825 7,033 Natural Wood 0.0% 0.0% 0 0
Newspaper Packaging 0.0% 0.0% 0 0 Treated Wood 0.2% 0.3% 293 472
Cardboard & Kraft Packaging 5.9% 2.1% 9,424 3,299 Painted Wood 3.6% 2.5% 5,784 3,969
Mixed/Low-grade Paper Packaging 1.3% 0.6% 2,006 964 Dimensional Lumber 5.8% 3.8% 9,219 6,053
Aseptic Containers 0.0% 0.0% 18 21 Engineered Wood 9.7% 4.5% 15,545 7,256
Gable Top Containers 0.0% 0.0% 15 18 Pallets & Crates 1.9% 1.9% 3,076 3,097
Other Polycoated Packaging 0.0% 0.0% 27 26 Other Untreated Wood 0.0% 0.0% 47 54
Compostable Paper Packaging 6.0% 3.0% 9,510 4,789 Wood By-products 0.0% 0.0% 44 71
R/C Paper Packaging 0.5% 0.3% 826 440 R/C Wood Debris 1.7% 1.5% 2,676 2,336
PAPER PRODUCTS 4.8% 1.7% 7,734 2,727 CONSTRUCTION MATERIALS 11.3% 5.2% 18,033 8,248
Newspaper Products 0.2% 0.2% 288 326 Plastic Lumber 0.9% 1.4% 1,396 2,169
Cardboard & Kraft Paper Products 0.0% 0.0% 0 0 Insulation 0.3% 0.3% 430 499
Magazines 0.2% 0.3% 283 433 Asphalt Paving 0.7% 1.1% 1,087 1,751
High-Grade Paper Products 0.1% 0.1% 172 92 Concrete 0.3% 0.5% 451 726
Other Groundwood Paper Products 0.0% 0.0% 0 0 Drywall 0.0% 0.0% 0 0
Mixed/Low-grade Paper Products 1.1% 0.9% 1,738 1,414 Carpet 1.2% 1.5% 1,982 2,319
Compostable Paper Products 2.6% 1.7% 4,134 2,710 Carpet Padding 0.9% 1.5% 1,498 2,408
R/C Paper Products 0.7% 0.6% 1,119 965 Soil, Rocks, & Sand 2.7% 1.9% 4,243 3,057
PLASTIC 12.5% 2.9% 19,900 4,603 Asphalt Roofing 0.3% 0.4% 513 661
PLASTIC PACKAGING 6.6% 2.2% 10,598 3,580 Plastic Floor Covering 0.0% 0.0% 0 0
#1 PETE Plastic Bottles 0.3% 0.1% 444 217 Ceramics & Brick 2.0% 3.2% 3,151 5,067
#1 PETE Plastic Non-bottles 0.5% 0.4% 767 684 R/C Construction Materials 2.1% 2.1% 3,281 3,382
#2 HDPE Plastic Natural Bottles 0.1% 0.1% 138 161 CONSUMER PRODUCTS 9.1% 3.8% 14,491 6,030
#2 HDPE Plastic Jars and Tubs 0.8% 0.5% 1,203 746 Televisions - LCD 1.3% 2.1% 2,122 3,425
#2 HDPE Plastic Colored Bottles 0.0% 0.0% 32 22 Televisions - CRT 0.0% 0.0% 0 0
#3 PVC Plastic Packaging 0.0% 0.0% 0 0 Television Peripherals 0.0% 0.0% 0 0
#4 LDPE Plastic Packaging 0.0% 0.0% 1 2 Computer Monitors - CRT 0.0% 0.0% 0 0
#5 PP Plastic Packaging 0.4% 0.3% 706 432 Computer Monitors - LCD 0.0% 0.0% 0 0
#6 PS Plastic Packaging 0.1% 0.1% 215 173 Computers 0.0% 0.0% 0 0
#7 Other/Unknown Plastic Packaging 0.5% 0.3% 843 486 Computer Peripherals 0.0% 0.0% 0 0
Expanded Polystyrene Packaging 0.2% 0.1% 282 138 Computer Printers 0.0% 0.0% 0 0
PLA Compostable Packaging 0.0% 0.0% 3 4 Audio Equipment 0.0% 0.0% 0 0
Plastic Merchandise Bags 0.1% 0.1% 157 98 Electronic Gaming Equipment 0.0% 0.0% 0 0
Packaging Film Plastic 2.2% 0.9% 3,517 1,468 Other Consumer Electronics 0.4% 0.6% 604 974
Transportation Packaging Film Plastic 0.6% 0.4% 956 599 Textiles- Organic 2.2% 1.3% 3,541 2,022
Flexible Plastic Packaging 0.1% 0.1% 138 217 Textiles- Synthetic/Mixed/Unknown 1.5% 1.0% 2,394 1,520
R/C Plastic Packaging 0.8% 1.1% 1,197 1,786 Shoes/Purses/Belts 0.3% 0.3% 441 442
PLASTIC PRODUCTS 5.8% 1.8% 9,302 2,886 Tires & Other Rubber 1.1% 1.1% 1,682 1,734
#1 PETE Plastic Products 0.0% 0.0% 0 0 Furniture 1.6% 1.3% 2,489 2,117
#2 HDPE Plastic Products: 0.0% 0.0% 0 0 Mattresses 0.8% 1.2% 1,217 1,956
#3 PVC Plastic Products 0.0% 0.0% 0 0 R/C Consumer Products 0.0% 0.0% 0 0
#4 LDPE Plastic Products 0.0% 0.0% 0 0 HAZARDOUS AND SPECIAL WASTES 0.9% 0.6% 1,401 1,031
#5 PP Plastic Products 0.0% 0.0% 0 0 Pesticides 0.0% 0.0% 0 0
#6 PS Plastic Products 0.0% 0.0% 38 40 HID/UV/Germicidal Lamps 0.0% 0.0% 0 0
#7 Other/Unknown Plastic Products 0.6% 0.2% 947 303 Compact Florescent Lamps 0.0% 0.0% 22 35
PLA Compostable Products 0.0% 0.0% 1 1 Florescent Tubes 0.0% 0.0% 0 0
Plastic Garbage Bags 1.0% 0.4% 1,641 608 Water-based Paint 0.0% 0.0% 0 0
Plastic Non-bag Film Products 0.0% 0.0% 0 0 Solvent-based Adhesives/Glues 0.0% 0.0% 0 0
Bulky Rigid Plastic Products 3.1% 1.2% 4,881 1,844 Water-based Adhesives/Glues 0.0% 0.0% 0 0
R/C Plastic Products 1.1% 0.9% 1,794 1,420 Oil-based Paint 0.0% 0.0% 0 0
GLASS 1.7% 1.1% 2,696 1,695 Lacquer/Varnish/Urethane Coatings/Stains 0.0% 0.0% 45 73
Clear Glass Containers 0.2% 0.2% 324 281 Field & Lawn Markings 0.0% 0.0% 0 0
Green Glass Containers 0.4% 0.5% 681 760 Primers/Sealings/Coatings 0.2% 0.4% 368 593
Brown/Other Colored Glass Containers 0.2% 0.2% 288 245 Water Repellents & Waterproofers 0.0% 0.0% 0 0
Plate Glass 0.8% 0.9% 1,302 1,480 Solvents 0.0% 0.0% 0 0
Non-glass Ceramics 0.0% 0.0% 19 30 Caustic Cleaners 0.0% 0.0% 0 0
R/C Glass 0.1% 0.1% 83 134 Dry-cell Batteries- Single Use 0.0% 0.0% 3 3
METAL 9.8% 3.0% 15,681 4,787 Dry-cell Batteries- Rechargeable 0.0% 0.0% 0 0
Aluminum Beverage Cans 0.2% 0.1% 289 145 Wet-cell Batteries 0.0% 0.0% 0 0
Aluminum Foil/Containers 0.1% 0.1% 180 110 Gasoline/Kerosene 0.0% 0.0% 0 0
Other Aluminum 0.0% 0.0% 0 0 Motor Oil 0.1% 0.2% 210 338
Other Non-ferrous Metal 0.0% 0.1% 64 101 Antifreeze 0.0% 0.0% 0 0
Food Cans - Tinned 0.5% 0.4% 768 636 Other Vehicle Fluids 0.0% 0.0% 0 0
Food Cans - Coated 0.0% 0.0% 0 0 Oil Filters 0.3% 0.5% 483 774
White Goods 0.0% 0.0% 0 0 Explosives 0.0% 0.0% 0 0
Other Ferrous Metal 5.5% 2.1% 8,712 3,354 Medical Wastes 0.1% 0.1% 133 171
R/C Metal 3.6% 1.3% 5,667 2,109 Sharps 0.0% 0.0% 0 0
ORGANICS 12.1% 5.6% 19,334 8,857 Pharmaceuticals & Vitamins 0.0% 0.0% 0 0
Edible Food Waste- Vegetative 3.4% 1.3% 5,470 2,138 Other Cleaners/Chemicals 0.0% 0.0% 0 0
Inedible Food Waste- Vegetative 1.5% 1.3% 2,316 2,149 Personal Care Products 0.0% 0.0% 39 36
Edible Food Waste- Meats/Fats/Oils 3.5% 3.1% 5,641 4,969 Other Potentially Hazardous Wastes 0.1% 0.1% 97 114
Inedible Food Waste- Meats/Fats/Oils 0.9% 1.2% 1,506 1,870 RESIDUALS 1.1% 0.6% 1,723 1,002
Yard/Garden Waste- Leaves and Grass 1.6% 1.7% 2,593 2,710 Disposable Diapers 0.6% 0.5% 1,012 812
Yard/Garden Waste- Prunings 0.1% 0.2% 217 351 Ash 0.1% 0.1% 113 182
Animal Manure 0.2% 0.2% 352 314 Dust 0.0% 0.0% 0 0
Animal Carcasses & Offal 0.1% 0.1% 99 158 Fines/Sorting Residues 0.4% 0.2% 598 267
Food Processing Wastes 0.0% 0.0% 0 0 Sludges & Other Special Industrial Wastes 0.0% 0.0% 0 0
R/C Organics 0.7% 0.9% 1,141 1,404
Estimated Origin Specified Disposed Tons 100% 159,500
Sample Count 24
Confidence intervals calculated at the 90% confidence level. Percentages for material types may not
total 100% due to rounding.
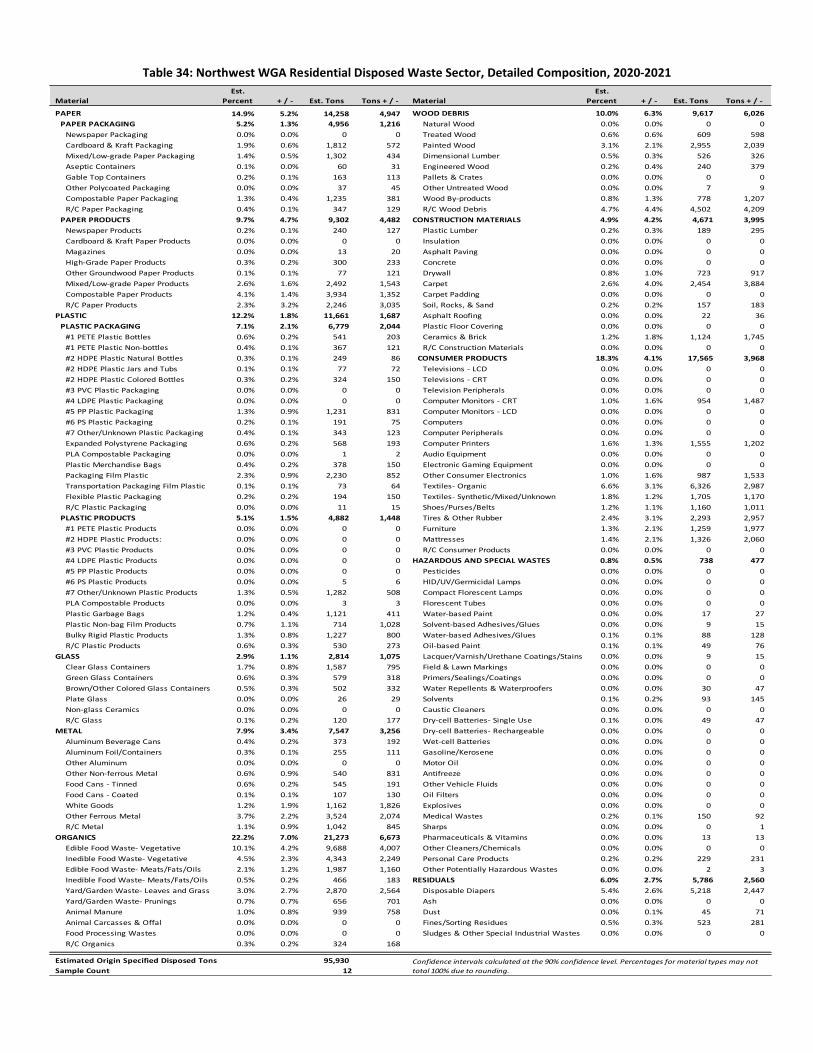
2020-2021 Washington Statewide Waste Characterization Study
Draft Report
June 2021 | 82
Table 34: Northwest WGA Residential Disposed Waste Sector, Detailed Composition, 2020-2021
Material
Est.
Percent + / - Est. Tons Tons + / - Material
Est.
Percent + / - Est. Tons Tons + / -
PAPER 14.9% 5.2% 14,258 4,947 WOOD DEBRIS 10.0% 6.3% 9,617 6,026
PAPER PACKAGING 5.2% 1.3% 4,956 1,216 Natural Wood 0.0% 0.0% 0 0
Newspaper Packaging 0.0% 0.0% 0 0 Treated Wood 0.6% 0.6% 609 598
Cardboard & Kraft Packaging 1.9% 0.6% 1,812 572 Painted Wood 3.1% 2.1% 2,955 2,039
Mixed/Low-grade Paper Packaging 1.4% 0.5% 1,302 434 Dimensional Lumber 0.5% 0.3% 526 326
Aseptic Containers 0.1% 0.0% 60 31 Engineered Wood 0.2% 0.4% 240 379
Gable Top Containers 0.2% 0.1% 163 113 Pallets & Crates 0.0% 0.0% 0 0
Other Polycoated Packaging 0.0% 0.0% 37 45 Other Untreated Wood 0.0% 0.0% 7 9
Compostable Paper Packaging 1.3% 0.4% 1,235 381 Wood By-products 0.8% 1.3% 778 1,207
R/C Paper Packaging 0.4% 0.1% 347 129 R/C Wood Debris 4.7% 4.4% 4,502 4,209
PAPER PRODUCTS 9.7% 4.7% 9,302 4,482 CONSTRUCTION MATERIALS 4.9% 4.2% 4,671 3,995
Newspaper Products 0.2% 0.1% 240 127 Plastic Lumber 0.2% 0.3% 189 295
Cardboard & Kraft Paper Products 0.0% 0.0% 0 0 Insulation 0.0% 0.0% 0 0
Magazines 0.0% 0.0% 13 20 Asphalt Paving 0.0% 0.0% 0 0
High-Grade Paper Products 0.3% 0.2% 300 233 Concrete 0.0% 0.0% 0 0
Other Groundwood Paper Products 0.1% 0.1% 77 121 Drywall 0.8% 1.0% 723 917
Mixed/Low-grade Paper Products 2.6% 1.6% 2,492 1,543 Carpet 2.6% 4.0% 2,454 3,884
Compostable Paper Products 4.1% 1.4% 3,934 1,352 Carpet Padding 0.0% 0.0% 0 0
R/C Paper Products 2.3% 3.2% 2,246 3,035 Soil, Rocks, & Sand 0.2% 0.2% 157 183
PLASTIC 12.2% 1.8% 11,661 1,687 Asphalt Roofing 0.0% 0.0% 22 36
PLASTIC PACKAGING 7.1% 2.1% 6,779 2,044 Plastic Floor Covering 0.0% 0.0% 0 0
#1 PETE Plastic Bottles 0.6% 0.2% 541 203 Ceramics & Brick 1.2% 1.8% 1,124 1,745
#1 PETE Plastic Non-bottles 0.4% 0.1% 367 121 R/C Construction Materials 0.0% 0.0% 0 0
#2 HDPE Plastic Natural Bottles 0.3% 0.1% 249 86 CONSUMER PRODUCTS 18.3% 4.1% 17,565 3,968
#2 HDPE Plastic Jars and Tubs 0.1% 0.1% 77 72 Televisions - LCD 0.0% 0.0% 0 0
#2 HDPE Plastic Colored Bottles 0.3% 0.2% 324 150 Televisions - CRT 0.0% 0.0% 0 0
#3 PVC Plastic Packaging 0.0% 0.0% 0 0 Television Peripherals 0.0% 0.0% 0 0
#4 LDPE Plastic Packaging 0.0% 0.0% 0 0 Computer Monitors - CRT 1.0% 1.6% 954 1,487
#5 PP Plastic Packaging 1.3% 0.9% 1,231 831 Computer Monitors - LCD 0.0% 0.0% 0 0
#6 PS Plastic Packaging 0.2% 0.1% 191 75 Computers 0.0% 0.0% 0 0
#7 Other/Unknown Plastic Packaging 0.4% 0.1% 343 123 Computer Peripherals 0.0% 0.0% 0 0
Expanded Polystyrene Packaging 0.6% 0.2% 568 193 Computer Printers 1.6% 1.3% 1,555 1,202
PLA Compostable Packaging 0.0% 0.0% 1 2 Audio Equipment 0.0% 0.0% 0 0
Plastic Merchandise Bags 0.4% 0.2% 378 150 Electronic Gaming Equipment 0.0% 0.0% 0 0
Packaging Film Plastic 2.3% 0.9% 2,230 852 Other Consumer Electronics 1.0% 1.6% 987 1,533
Transportation Packaging Film Plastic 0.1% 0.1% 73 64 Textiles- Organic 6.6% 3.1% 6,326 2,987
Flexible Plastic Packaging 0.2% 0.2% 194 150 Textiles- Synthetic/Mixed/Unknown 1.8% 1.2% 1,705 1,170
R/C Plastic Packaging 0.0% 0.0% 11 15 Shoes/Purses/Belts 1.2% 1.1% 1,160 1,011
PLASTIC PRODUCTS 5.1% 1.5% 4,882 1,448 Tires & Other Rubber 2.4% 3.1% 2,293 2,957
#1 PETE Plastic Products 0.0% 0.0% 0 0 Furniture 1.3% 2.1% 1,259 1,977
#2 HDPE Plastic Products: 0.0% 0.0% 0 0 Mattresses 1.4% 2.1% 1,326 2,060
#3 PVC Plastic Products 0.0% 0.0% 0 0 R/C Consumer Products 0.0% 0.0% 0 0
#4 LDPE Plastic Products 0.0% 0.0% 0 0 HAZARDOUS AND SPECIAL WASTES 0.8% 0.5% 738 477
#5 PP Plastic Products 0.0% 0.0% 0 0 Pesticides 0.0% 0.0% 0 0
#6 PS Plastic Products 0.0% 0.0% 5 6 HID/UV/Germicidal Lamps 0.0% 0.0% 0 0
#7 Other/Unknown Plastic Products 1.3% 0.5% 1,282 508 Compact Florescent Lamps 0.0% 0.0% 0 0
PLA Compostable Products 0.0% 0.0% 3 3 Florescent Tubes 0.0% 0.0% 0 0
Plastic Garbage Bags 1.2% 0.4% 1,121 411 Water-based Paint 0.0% 0.0% 17 27
Plastic Non-bag Film Products 0.7% 1.1% 714 1,028 Solvent-based Adhesives/Glues 0.0% 0.0% 9 15
Bulky Rigid Plastic Products 1.3% 0.8% 1,227 800 Water-based Adhesives/Glues 0.1% 0.1% 88 128
R/C Plastic Products 0.6% 0.3% 530 273 Oil-based Paint 0.1% 0.1% 49 76
GLASS 2.9% 1.1% 2,814 1,075 Lacquer/Varnish/Urethane Coatings/Stains 0.0% 0.0% 9 15
Clear Glass Containers 1.7% 0.8% 1,587 795 Field & Lawn Markings 0.0% 0.0% 0 0
Green Glass Containers 0.6% 0.3% 579 318 Primers/Sealings/Coatings 0.0% 0.0% 0 0
Brown/Other Colored Glass Containers 0.5% 0.3% 502 332 Water Repellents & Waterproofers 0.0% 0.0% 30 47
Plate Glass 0.0% 0.0% 26 29 Solvents 0.1% 0.2% 93 145
Non-glass Ceramics 0.0% 0.0% 0 0 Caustic Cleaners 0.0% 0.0% 0 0
R/C Glass 0.1% 0.2% 120 177 Dry-cell Batteries- Single Use 0.1% 0.0% 49 47
METAL 7.9% 3.4% 7,547 3,256 Dry-cell Batteries- Rechargeable 0.0% 0.0% 0 0
Aluminum Beverage Cans 0.4% 0.2% 373 192 Wet-cell Batteries 0.0% 0.0% 0 0
Aluminum Foil/Containers 0.3% 0.1% 255 111 Gasoline/Kerosene 0.0% 0.0% 0 0
Other Aluminum 0.0% 0.0% 0 0 Motor Oil 0.0% 0.0% 0 0
Other Non-ferrous Metal 0.6% 0.9% 540 831 Antifreeze 0.0% 0.0% 0 0
Food Cans - Tinned 0.6% 0.2% 545 191 Other Vehicle Fluids 0.0% 0.0% 0 0
Food Cans - Coated 0.1% 0.1% 107 130 Oil Filters 0.0% 0.0% 0 0
White Goods 1.2% 1.9% 1,162 1,826 Explosives 0.0% 0.0% 0 0
Other Ferrous Metal 3.7% 2.2% 3,524 2,074 Medical Wastes 0.2% 0.1% 150 92
R/C Metal 1.1% 0.9% 1,042 845 Sharps 0.0% 0.0% 0 1
ORGANICS 22.2% 7.0% 21,273 6,673 Pharmaceuticals & Vitamins 0.0% 0.0% 13 13
Edible Food Waste- Vegetative 10.1% 4.2% 9,688 4,007 Other Cleaners/Chemicals 0.0% 0.0% 0 0
Inedible Food Waste- Vegetative 4.5% 2.3% 4,343 2,249 Personal Care Products 0.2% 0.2% 229 231
Edible Food Waste- Meats/Fats/Oils 2.1% 1.2% 1,987 1,160 Other Potentially Hazardous Wastes 0.0% 0.0% 2 3
Inedible Food Waste- Meats/Fats/Oils 0.5% 0.2% 466 183 RESIDUALS 6.0% 2.7% 5,786 2,560
Yard/Garden Waste- Leaves and Grass 3.0% 2.7% 2,870 2,564 Disposable Diapers 5.4% 2.6% 5,218 2,447
Yard/Garden Waste- Prunings 0.7% 0.7% 656 701 Ash 0.0% 0.0% 0 0
Animal Manure 1.0% 0.8% 939 758 Dust 0.0% 0.1% 45 71
Animal Carcasses & Offal 0.0% 0.0% 0 0 Fines/Sorting Residues 0.5% 0.3% 523 281
Food Processing Wastes 0.0% 0.0% 0 0 Sludges & Other Special Industrial Wastes 0.0% 0.0% 0 0
R/C Organics 0.3% 0.2% 324 168
Estimated Origin Specified Disposed Tons 100% 95,930
Sample Count 12
Confidence intervals calculated at the 90% confidence level. Percentages for material types may not
total 100% due to rounding.

2020-2021 Washington Statewide Waste Characterization Study
Draft Report
June 2021 | 83
Table 35: Northwest WGA Self-hauled Disposed Waste Sector, Detailed Composition, 2020-2021
Material
Est.
Percent + / - Est. Tons Tons + / - Material
Est.
Percent + / - Est. Tons Tons + / -
PAPER 6.6% 2.9% 5,258 2,311 WOOD DEBRIS 37.4% 10.5% 29,686 8,294
PAPER PACKAGING 5.5% 2.9% 4,363 2,287 Natural Wood 0.6% 0.9% 454 725
Newspaper Packaging 0.0% 0.0% 0 0 Treated Wood 2.5% 2.1% 2,022 1,655
Cardboard & Kraft Packaging 4.2% 2.8% 3,349 2,241 Painted Wood 12.3% 6.2% 9,764 4,890
Mixed/Low-grade Paper Packaging 0.1% 0.1% 97 73 Dimensional Lumber 4.8% 3.8% 3,837 2,992
Aseptic Containers 0.0% 0.0% 22 31 Engineered Wood 9.2% 7.2% 7,270 5,682
Gable Top Containers 0.0% 0.0% 13 20 Pallets & Crates 0.5% 0.8% 397 633
Other Polycoated Packaging 0.0% 0.0% 15 18 Other Untreated Wood 0.5% 0.8% 380 598
Compostable Paper Packaging 1.0% 1.4% 790 1,110 Wood By-products 0.2% 0.2% 148 172
R/C Paper Packaging 0.1% 0.1% 79 88 R/C Wood Debris 6.8% 4.0% 5,416 3,207
PAPER PRODUCTS 1.1% 0.8% 895 667 CONSTRUCTION MATERIALS 15.8% 9.9% 12,525 7,884
Newspaper Products 0.0% 0.0% 22 26 Plastic Lumber 0.0% 0.0% 0 0
Cardboard & Kraft Paper Products 0.0% 0.0% 0 0 Insulation 0.0% 0.0% 0 0
Magazines 0.3% 0.5% 273 400 Asphalt Paving 0.0% 0.0% 0 0
High-Grade Paper Products 0.0% 0.0% 25 36 Concrete 0.0% 0.0% 0 0
Other Groundwood Paper Products 0.0% 0.0% 0 0 Drywall 0.9% 1.4% 696 1,106
Mixed/Low-grade Paper Products 0.3% 0.3% 214 203 Carpet 0.4% 0.6% 313 495
Compostable Paper Products 0.4% 0.5% 353 377 Carpet Padding 0.0% 0.0% 0 0
R/C Paper Products 0.0% 0.0% 8 8 Soil, Rocks, & Sand 3.7% 5.5% 2,921 4,401
PLASTIC 7.7% 2.0% 6,090 1,569 Asphalt Roofing 0.5% 0.8% 419 668
PLASTIC PACKAGING 1.5% 1.2% 1,166 932 Plastic Floor Covering 0.0% 0.0% 0 0
#1 PETE Plastic Bottles 0.2% 0.2% 149 197 Ceramics & Brick 2.8% 2.9% 2,241 2,299
#1 PETE Plastic Non-bottles 0.1% 0.1% 62 73 R/C Construction Materials 7.5% 7.2% 5,936 5,696
#2 HDPE Plastic Natural Bottles 0.0% 0.0% 23 37 CONSUMER PRODUCTS 10.6% 5.8% 8,422 4,571
#2 HDPE Plastic Jars and Tubs 0.3% 0.4% 235 292 Televisions - LCD 0.0% 0.0% 0 0
#2 HDPE Plastic Colored Bottles 0.0% 0.0% 38 37 Televisions - CRT 0.0% 0.0% 0 0
#3 PVC Plastic Packaging 0.0% 0.0% 0 0 Television Peripherals 0.0% 0.0% 0 0
#4 LDPE Plastic Packaging 0.0% 0.0% 0 0 Computer Monitors - CRT 0.0% 0.0% 0 0
#5 PP Plastic Packaging 0.1% 0.1% 99 106 Computer Monitors - LCD 0.0% 0.0% 0 0
#6 PS Plastic Packaging 0.0% 0.0% 9 11 Computers 0.0% 0.0% 0 0
#7 Other/Unknown Plastic Packaging 0.1% 0.0% 48 32 Computer Peripherals 0.0% 0.0% 0 0
Expanded Polystyrene Packaging 0.1% 0.1% 98 88 Computer Printers 0.4% 0.7% 334 534
PLA Compostable Packaging 0.0% 0.0% 1 1 Audio Equipment 0.0% 0.0% 0 0
Plastic Merchandise Bags 0.1% 0.1% 57 42 Electronic Gaming Equipment 0.0% 0.0% 0 0
Packaging Film Plastic 0.4% 0.3% 306 266 Other Consumer Electronics 0.0% 0.0% 0 0
Transportation Packaging Film Plastic 0.0% 0.0% 34 31 Textiles- Organic 0.9% 0.6% 745 444
Flexible Plastic Packaging 0.0% 0.0% 8 11 Textiles- Synthetic/Mixed/Unknown 1.4% 1.0% 1,134 783
R/C Plastic Packaging 0.0% 0.0% 0 0 Shoes/Purses/Belts 0.0% 0.0% 0 0
PLASTIC PRODUCTS 6.2% 1.8% 4,923 1,398 Tires & Other Rubber 0.4% 0.6% 315 456
#1 PETE Plastic Products 0.0% 0.0% 5 7 Furniture 2.5% 2.9% 1,952 2,295
#2 HDPE Plastic Products: 0.0% 0.0% 0 0 Mattresses 5.0% 5.7% 3,942 4,514
#3 PVC Plastic Products 0.0% 0.0% 0 0 R/C Consumer Products 0.0% 0.0% 0 0
#4 LDPE Plastic Products 0.0% 0.0% 0 0 HAZARDOUS AND SPECIAL WASTES 0.3% 0.4% 206 318
#5 PP Plastic Products 0.0% 0.0% 0 0 Pesticides 0.0% 0.0% 0 0
#6 PS Plastic Products 0.0% 0.0% 6 9 HID/UV/Germicidal Lamps 0.0% 0.0% 0 0
#7 Other/Unknown Plastic Products 1.4% 0.8% 1,103 625 Compact Florescent Lamps 0.0% 0.0% 0 0
PLA Compostable Products 0.0% 0.0% 0 0 Florescent Tubes 0.0% 0.0% 0 0
Plastic Garbage Bags 0.4% 0.3% 336 225 Water-based Paint 0.0% 0.0% 0 0
Plastic Non-bag Film Products 0.7% 0.6% 517 448 Solvent-based Adhesives/Glues 0.0% 0.0% 0 0
Bulky Rigid Plastic Products 3.0% 1.3% 2,379 1,011 Water-based Adhesives/Glues 0.1% 0.1% 44 69
R/C Plastic Products 0.7% 0.7% 577 537 Oil-based Paint 0.0% 0.0% 0 0
GLASS 1.2% 1.2% 979 951 Lacquer/Varnish/Urethane Coatings/Stains 0.0% 0.0% 0 0
Clear Glass Containers 0.1% 0.1% 95 68 Field & Lawn Markings 0.0% 0.0% 0 0
Green Glass Containers 0.0% 0.0% 0 0 Primers/Sealings/Coatings 0.0% 0.0% 0 0
Brown/Other Colored Glass Containers 0.0% 0.0% 9 15 Water Repellents & Waterproofers 0.0% 0.0% 0 0
Plate Glass 0.0% 0.0% 0 0 Solvents 0.0% 0.0% 0 0
Non-glass Ceramics 0.6% 0.6% 491 501 Caustic Cleaners 0.0% 0.0% 0 0
R/C Glass 0.5% 0.6% 384 511 Dry-cell Batteries- Single Use 0.0% 0.0% 0 0
METAL 16.7% 7.8% 13,229 6,164 Dry-cell Batteries- Rechargeable 0.0% 0.0% 0 0
Aluminum Beverage Cans 0.3% 0.5% 258 393 Wet-cell Batteries 0.0% 0.0% 0 0
Aluminum Foil/Containers 0.0% 0.0% 36 40 Gasoline/Kerosene 0.0% 0.0% 0 0
Other Aluminum 0.2% 0.2% 154 160 Motor Oil 0.0% 0.0% 0 0
Other Non-ferrous Metal 0.0% 0.1% 28 44 Antifreeze 0.0% 0.0% 0 0
Food Cans - Tinned 0.2% 0.3% 136 204 Other Vehicle Fluids 0.0% 0.0% 0 0
Food Cans - Coated 0.0% 0.0% 0 0 Oil Filters 0.0% 0.0% 0 0
White Goods 2.6% 4.2% 2,098 3,344 Explosives 0.0% 0.0% 0 0
Other Ferrous Metal 8.0% 3.7% 6,334 2,924 Medical Wastes 0.0% 0.0% 2 4
R/C Metal 5.3% 3.9% 4,185 3,093 Sharps 0.0% 0.0% 0 0
ORGANICS 3.2% 2.7% 2,548 2,111 Pharmaceuticals & Vitamins 0.0% 0.0% 5 7
Edible Food Waste- Vegetative 0.8% 1.0% 638 776 Other Cleaners/Chemicals 0.2% 0.3% 156 249
Inedible Food Waste- Vegetative 0.4% 0.3% 280 237 Personal Care Products 0.0% 0.0% 0 0
Edible Food Waste- Meats/Fats/Oils 0.0% 0.0% 0 0 Other Potentially Hazardous Wastes 0.0% 0.0% 0 0
Inedible Food Waste- Meats/Fats/Oils 0.0% 0.0% 13 20 RESIDUALS 0.5% 0.7% 385 565
Yard/Garden Waste- Leaves and Grass 0.3% 0.5% 245 390 Disposable Diapers 0.4% 0.7% 339 542
Yard/Garden Waste- Prunings 0.1% 0.1% 107 109 Ash 0.0% 0.0% 0 0
Animal Manure 0.5% 0.6% 368 447 Dust 0.0% 0.0% 0 0
Animal Carcasses & Offal 0.9% 1.2% 686 960 Fines/Sorting Residues 0.1% 0.1% 46 43
Food Processing Wastes 0.0% 0.0% 0 0 Sludges & Other Special Industrial Wastes 0.0% 0.0% 0 0
R/C Organics 0.3% 0.4% 212 323
Estimated Origin Specified Disposed Tons 100% 79,330
Sample Count 16Confidence intervals calculated at the 90% confidence level. Percentages for material types may not
total 100% due to rounding.

2020-2021 Washington Statewide Waste Characterization Study
Final Report
August 2021 | 84
Puget Sound Waste Generation Area Composition Tables

2020-2021 Washington Statewide Waste Characterization Study
Draft Report
June 2021 | 85
Table 36: Puget Sound WGA Overall Disposed Waste Stream, Detailed Composition, 2020-2021
Material
Est.
Percent + / - Est. Tons Tons + / - Material
Est.
Percent + / - Est. Tons Tons + / -
PAPER 15.1% 2.8% 424,457 78,886 WOOD DEBRIS 13.4% 4.5% 377,029 127,964
PAPER PACKAGING 8.7% 2.0% 244,709 55,561 Natural Wood 0.9% 1.1% 26,434 32,374
Newspaper Packaging 0.0% 0.0% 0 0 Treated Wood 0.5% 0.3% 14,679 9,210
Cardboard & Kraft Packaging 5.0% 1.6% 140,561 44,765 Painted Wood 5.9% 3.4% 166,913 95,801
Mixed/Low-grade Paper Packaging 1.1% 0.3% 30,678 8,175 Dimensional Lumber 1.2% 0.9% 33,845 24,773
Aseptic Containers 0.1% 0.0% 2,433 1,004 Engineered Wood 1.8% 1.0% 52,046 27,391
Gable Top Containers 0.1% 0.0% 2,649 1,245 Pallets & Crates 0.8% 0.7% 22,098 18,538
Other Polycoated Packaging 0.0% 0.0% 1,355 595 Other Untreated Wood 0.1% 0.1% 1,941 1,467
Compostable Paper Packaging 1.9% 0.9% 54,734 26,421 Wood By-products 0.0% 0.0% 38 51
R/C Paper Packaging 0.4% 0.2% 12,299 5,051 R/C Wood Debris 2.1% 1.3% 59,035 35,644
PAPER PRODUCTS 6.4% 1.4% 179,748 39,714 CONSTRUCTION MATERIALS 12.2% 5.0% 343,768 141,407
Newspaper Products 0.3% 0.2% 8,933 7,011 Plastic Lumber 1.0% 1.4% 27,485 39,987
Cardboard & Kraft Paper Products 0.0% 0.0% 0 0 Insulation 0.3% 0.3% 7,717 9,588
Magazines 0.1% 0.1% 3,912 3,524 Asphalt Paving 0.0% 0.0% 0 0
High-Grade Paper Products 0.2% 0.1% 5,723 3,458 Concrete 1.2% 1.2% 33,127 33,310
Other Groundwood Paper Products 0.0% 0.0% 0 0 Drywall 4.6% 3.9% 129,660 110,057
Mixed/Low-grade Paper Products 1.6% 0.6% 46,179 17,367 Carpet 0.9% 0.7% 26,534 20,246
Compostable Paper Products 3.4% 0.7% 95,951 20,608 Carpet Padding 0.1% 0.2% 4,011 4,364
R/C Paper Products 0.7% 0.4% 19,050 11,120 Soil, Rocks, & Sand 0.1% 0.1% 2,827 3,739
PLASTIC 11.7% 1.3% 328,658 37,053 Asphalt Roofing 2.7% 2.8% 75,686 77,912
PLASTIC PACKAGING 6.2% 1.0% 174,375 28,558 Plastic Floor Covering 0.0% 0.0% 0 0
#1 PETE Plastic Bottles 0.6% 0.2% 16,649 4,405 Ceramics & Brick 0.4% 0.3% 9,886 9,666
#1 PETE Plastic Non-bottles 0.3% 0.1% 9,257 1,584 R/C Construction Materials 1.0% 0.6% 26,836 17,163
#2 HDPE Plastic Natural Bottles 0.1% 0.0% 3,901 1,323 CONSUMER PRODUCTS 6.0% 2.2% 167,840 61,591
#2 HDPE Plastic Jars and Tubs 0.2% 0.1% 4,287 1,633 Televisions - LCD 0.0% 0.0% 0 0
#2 HDPE Plastic Colored Bottles 0.2% 0.1% 5,188 1,480 Televisions - CRT 0.0% 0.0% 0 0
#3 PVC Plastic Packaging 0.0% 0.0% 0 0 Television Peripherals 0.0% 0.0% 0 0
#4 LDPE Plastic Packaging 0.0% 0.0% 64 57 Computer Monitors - CRT 0.0% 0.0% 0 0
#5 PP Plastic Packaging 0.7% 0.1% 18,501 3,566 Computer Monitors - LCD 0.0% 0.0% 0 0
#6 PS Plastic Packaging 0.1% 0.0% 2,194 489 Computers 0.0% 0.0% 0 0
#7 Other/Unknown Plastic Packaging 0.4% 0.2% 11,487 4,443 Computer Peripherals 0.1% 0.1% 1,557 1,854
Expanded Polystyrene Packaging 0.5% 0.2% 14,609 4,521 Computer Printers 0.0% 0.0% 0 0
PLA Compostable Packaging 0.0% 0.0% 912 451 Audio Equipment 0.0% 0.0% 0 0
Plastic Merchandise Bags 0.5% 0.1% 13,244 3,950 Electronic Gaming Equipment 0.1% 0.1% 1,847 2,898
Packaging Film Plastic 2.2% 0.4% 61,918 11,239 Other Consumer Electronics 0.2% 0.3% 5,771 7,264
Transportation Packaging Film Plastic 0.3% 0.1% 8,227 3,975 Textiles- Organic 2.3% 1.2% 65,776 34,514
Flexible Plastic Packaging 0.1% 0.0% 2,946 1,212 Textiles- Synthetic/Mixed/Unknown 1.3% 0.5% 36,842 14,859
R/C Plastic Packaging 0.0% 0.0% 990 862 Shoes/Purses/Belts 0.3% 0.1% 8,020 4,040
PLASTIC PRODUCTS 5.5% 1.5% 154,284 42,427 Tires & Other Rubber 0.3% 0.3% 9,699 9,618
#1 PETE Plastic Products 0.0% 0.0% 0 0 Furniture 0.3% 0.4% 7,359 11,753
#2 HDPE Plastic Products: 0.0% 0.0% 65 103 Mattresses 1.1% 1.7% 30,969 47,396
#3 PVC Plastic Products 0.0% 0.0% 0 0 R/C Consumer Products 0.0% 0.0% 0 0
#4 LDPE Plastic Products 0.0% 0.0% 0 0 HAZARDOUS AND SPECIAL WASTES 1.4% 0.5% 38,736 15,384
#5 PP Plastic Products 0.0% 0.0% 0 0 Pesticides 0.0% 0.0% 0 0
#6 PS Plastic Products 0.0% 0.0% 202 131 HID/UV/Germicidal Lamps 0.0% 0.0% 0 0
#7 Other/Unknown Plastic Products 1.2% 0.4% 34,409 11,740 Compact Florescent Lamps 0.0% 0.0% 649 641
PLA Compostable Products 0.0% 0.0% 210 151 Florescent Tubes 0.0% 0.0% 0 0
Plastic Garbage Bags 1.3% 0.2% 35,232 7,043 Water-based Paint 0.1% 0.1% 2,453 3,664
Plastic Non-bag Film Products 0.2% 0.1% 4,791 3,446 Solvent-based Adhesives/Glues 0.0% 0.0% 293 257
Bulky Rigid Plastic Products 1.7% 1.1% 47,637 32,201 Water-based Adhesives/Glues 0.0% 0.0% 0 0
R/C Plastic Products 1.1% 0.6% 31,736 17,386 Oil-based Paint 0.2% 0.3% 5,487 8,185
GLASS 2.3% 0.8% 63,451 23,857 Lacquer/Varnish/Urethane Coatings/Stains 0.0% 0.0% 0 0
Clear Glass Containers 0.9% 0.3% 26,045 9,839 Field & Lawn Markings 0.0% 0.0% 0 0
Green Glass Containers 0.4% 0.3% 10,943 7,990 Primers/Sealings/Coatings 0.0% 0.0% 0 0
Brown/Other Colored Glass Containers 0.3% 0.2% 7,420 4,570 Water Repellents & Waterproofers 0.0% 0.0% 705 1,137
Plate Glass 0.1% 0.1% 1,883 2,801 Solvents 0.0% 0.0% 0 0
Non-glass Ceramics 0.2% 0.3% 5,887 7,150 Caustic Cleaners 0.0% 0.0% 413 632
R/C Glass 0.4% 0.3% 11,273 8,905 Dry-cell Batteries- Single Use 0.0% 0.0% 1,264 876
METAL 7.8% 2.2% 218,951 61,839 Dry-cell Batteries- Rechargeable 0.0% 0.0% 442 701
Aluminum Beverage Cans 0.3% 0.1% 8,181 2,513 Wet-cell Batteries 0.0% 0.0% 0 0
Aluminum Foil/Containers 0.2% 0.1% 5,472 1,806 Gasoline/Kerosene 0.0% 0.0% 0 0
Other Aluminum 0.1% 0.1% 1,671 1,977 Motor Oil 0.0% 0.0% 0 0
Other Non-ferrous Metal 0.3% 0.2% 9,725 6,200 Antifreeze 0.0% 0.0% 286 452
Food Cans - Tinned 0.3% 0.1% 8,485 2,161 Other Vehicle Fluids 0.0% 0.0% 0 0
Food Cans - Coated 0.0% 0.0% 52 52 Oil Filters 0.0% 0.0% 690 853
White Goods 0.0% 0.0% 0 0 Explosives 0.0% 0.0% 0 0
Other Ferrous Metal 3.6% 1.8% 101,545 49,622 Medical Wastes 0.4% 0.3% 10,099 9,720
R/C Metal 3.0% 1.1% 83,821 30,153 Sharps 0.0% 0.0% 128 186
ORGANICS 25.7% 5.9% 723,313 166,942 Pharmaceuticals & Vitamins 0.2% 0.2% 6,726 5,443
Edible Food Waste- Vegetative 5.5% 1.2% 153,636 32,419 Other Cleaners/Chemicals 0.0% 0.0% 780 1,252
Inedible Food Waste- Vegetative 6.0% 1.6% 169,443 44,304 Personal Care Products 0.3% 0.2% 8,019 5,997
Edible Food Waste- Meats/Fats/Oils 1.7% 0.6% 46,676 17,167 Other Potentially Hazardous Wastes 0.0% 0.0% 302 264
Inedible Food Waste- Meats/Fats/Oils 0.4% 0.2% 12,286 6,571 RESIDUALS 4.7% 2.2% 132,134 61,017
Yard/Garden Waste- Leaves and Grass 3.2% 2.9% 91,136 81,474 Disposable Diapers 3.8% 2.2% 107,514 61,250
Yard/Garden Waste- Prunings 1.5% 1.2% 42,601 35,083 Ash 0.0% 0.0% 0 0
Animal Manure 6.7% 3.0% 189,839 84,405 Dust 0.0% 0.0% 164 196
Animal Carcasses & Offal 0.0% 0.0% 0 0 Fines/Sorting Residues 0.9% 0.3% 24,456 9,624
Food Processing Wastes 0.0% 0.0% 0 0 Sludges & Other Special Industrial Wastes 0.0% 0.0% 0 0
R/C Organics 0.6% 0.3% 17,695 8,850
Estimated Origin Specified Disposed Tons 100% 2,818,338
Sample Count 52
Confidence intervals calculated at the 90% confidence level. Percentages for material types may not
total 100% due to rounding.

2020-2021 Washington Statewide Waste Characterization Study
Draft Report
June 2021 | 86
Table 37: Puget Sound WGA Commercial Disposed Waste Sector, Detailed Composition, 2020-2021
Material
Est.
Percent + / - Est. Tons Tons + / - Material
Est.
Percent + / - Est. Tons Tons + / -
PAPER 24.7% 4.6% 90,278 16,837 WOOD DEBRIS 10.0% 4.5% 36,712 16,615
PAPER PACKAGING 14.8% 4.6% 54,175 16,893 Natural Wood 0.0% 0.0% 0 0
Newspaper Packaging 0.0% 0.0% 0 0 Treated Wood 0.1% 0.2% 429 693
Cardboard & Kraft Packaging 8.4% 4.3% 30,650 15,691 Painted Wood 1.6% 1.5% 5,692 5,389
Mixed/Low-grade Paper Packaging 1.4% 0.2% 5,019 837 Dimensional Lumber 1.7% 1.4% 6,254 4,951
Aseptic Containers 0.1% 0.0% 274 152 Engineered Wood 1.9% 1.4% 7,003 4,987
Gable Top Containers 0.1% 0.0% 224 100 Pallets & Crates 1.3% 1.6% 4,890 5,918
Other Polycoated Packaging 0.0% 0.0% 153 91 Other Untreated Wood 0.0% 0.0% 59 54
Compostable Paper Packaging 4.0% 2.4% 14,559 8,677 Wood By-products 0.0% 0.0% 38 51
R/C Paper Packaging 0.9% 0.6% 3,296 2,203 R/C Wood Debris 3.4% 2.0% 12,347 7,344
PAPER PRODUCTS 9.9% 2.4% 36,103 8,745 CONSTRUCTION MATERIALS 7.7% 5.0% 28,104 18,353
Newspaper Products 0.3% 0.2% 980 725 Plastic Lumber 0.1% 0.2% 373 602
Cardboard & Kraft Paper Products 0.0% 0.0% 0 0 Insulation 0.1% 0.2% 432 585
Magazines 0.0% 0.0% 58 93 Asphalt Paving 0.0% 0.0% 0 0
High-Grade Paper Products 0.9% 0.9% 3,184 3,255 Concrete 1.0% 1.6% 3,592 5,770
Other Groundwood Paper Products 0.0% 0.0% 0 0 Drywall 2.6% 3.4% 9,396 12,371
Mixed/Low-grade Paper Products 1.6% 0.7% 5,873 2,689 Carpet 1.4% 1.7% 5,019 6,285
Compostable Paper Products 4.9% 1.3% 17,882 4,857 Carpet Padding 0.2% 0.2% 551 890
R/C Paper Products 2.2% 1.1% 8,126 4,039 Soil, Rocks, & Sand 0.1% 0.2% 527 849
PLASTIC 18.2% 3.7% 66,711 13,398 Asphalt Roofing 1.0% 1.5% 3,509 5,665
PLASTIC PACKAGING 12.3% 3.1% 44,973 11,316 Plastic Floor Covering 0.0% 0.0% 0 0
#1 PETE Plastic Bottles 0.6% 0.2% 2,134 606 Ceramics & Brick 0.5% 0.8% 1,849 2,887
#1 PETE Plastic Non-bottles 0.5% 0.1% 1,768 519 R/C Construction Materials 0.8% 1.3% 2,856 4,588
#2 HDPE Plastic Natural Bottles 0.3% 0.1% 1,249 476 CONSUMER PRODUCTS 6.5% 4.6% 23,822 16,998
#2 HDPE Plastic Jars and Tubs 0.5% 0.3% 1,852 1,007 Televisions - LCD 0.0% 0.0% 0 0
#2 HDPE Plastic Colored Bottles 0.2% 0.1% 782 266 Televisions - CRT 0.0% 0.0% 0 0
#3 PVC Plastic Packaging 0.0% 0.0% 0 0 Television Peripherals 0.0% 0.0% 0 0
#4 LDPE Plastic Packaging 0.0% 0.0% 3 6 Computer Monitors - CRT 0.0% 0.0% 0 0
#5 PP Plastic Packaging 1.0% 0.2% 3,718 882 Computer Monitors - LCD 0.0% 0.0% 0 0
#6 PS Plastic Packaging 0.1% 0.0% 340 123 Computers 0.0% 0.0% 0 0
#7 Other/Unknown Plastic Packaging 1.1% 1.1% 4,011 4,133 Computer Peripherals 0.1% 0.2% 436 704
Expanded Polystyrene Packaging 0.8% 0.4% 2,927 1,378 Computer Printers 0.0% 0.0% 0 0
PLA Compostable Packaging 0.0% 0.0% 104 97 Audio Equipment 0.0% 0.0% 0 0
Plastic Merchandise Bags 0.3% 0.1% 1,207 352 Electronic Gaming Equipment 0.0% 0.0% 0 0
Packaging Film Plastic 4.9% 1.5% 17,774 5,418 Other Consumer Electronics 0.0% 0.0% 0 0
Transportation Packaging Film Plastic 1.6% 1.0% 5,884 3,765 Textiles- Organic 1.5% 1.4% 5,508 5,174
Flexible Plastic Packaging 0.2% 0.3% 835 1,088 Textiles- Synthetic/Mixed/Unknown 2.5% 2.3% 9,298 8,324
R/C Plastic Packaging 0.1% 0.1% 386 529 Shoes/Purses/Belts 0.3% 0.3% 963 1,038
PLASTIC PRODUCTS 5.9% 1.6% 21,738 5,982 Tires & Other Rubber 0.1% 0.0% 258 135
#1 PETE Plastic Products 0.0% 0.0% 0 0 Furniture 2.0% 3.2% 7,359 11,753
#2 HDPE Plastic Products: 0.0% 0.0% 0 0 Mattresses 0.0% 0.0% 0 0
#3 PVC Plastic Products 0.0% 0.0% 0 0 R/C Consumer Products 0.0% 0.0% 0 0
#4 LDPE Plastic Products 0.0% 0.0% 0 0 HAZARDOUS AND SPECIAL WASTES 0.7% 0.3% 2,680 1,243
#5 PP Plastic Products 0.0% 0.0% 0 0 Pesticides 0.0% 0.0% 0 0
#6 PS Plastic Products 0.0% 0.0% 54 56 HID/UV/Germicidal Lamps 0.0% 0.0% 0 0
#7 Other/Unknown Plastic Products 0.7% 0.5% 2,597 1,704 Compact Florescent Lamps 0.0% 0.0% 0 0
PLA Compostable Products 0.0% 0.0% 16 13 Florescent Tubes 0.0% 0.0% 0 0
Plastic Garbage Bags 2.4% 0.6% 8,744 2,318 Water-based Paint 0.0% 0.0% 0 0
Plastic Non-bag Film Products 0.1% 0.2% 513 828 Solvent-based Adhesives/Glues 0.1% 0.1% 241 243
Bulky Rigid Plastic Products 2.2% 1.4% 8,119 5,284 Water-based Adhesives/Glues 0.0% 0.0% 0 0
R/C Plastic Products 0.5% 0.4% 1,694 1,472 Oil-based Paint 0.0% 0.0% 0 0
GLASS 2.1% 0.9% 7,833 3,362 Lacquer/Varnish/Urethane Coatings/Stains 0.0% 0.0% 0 0
Clear Glass Containers 0.5% 0.2% 1,925 842 Field & Lawn Markings 0.0% 0.0% 0 0
Green Glass Containers 0.3% 0.2% 1,064 677 Primers/Sealings/Coatings 0.0% 0.0% 0 0
Brown/Other Colored Glass Containers 0.5% 0.3% 1,821 1,211 Water Repellents & Waterproofers 0.2% 0.3% 705 1,137
Plate Glass 0.5% 0.8% 1,883 2,801 Solvents 0.0% 0.0% 0 0
Non-glass Ceramics 0.3% 0.4% 1,109 1,373 Caustic Cleaners 0.0% 0.0% 0 0
R/C Glass 0.0% 0.0% 31 51 Dry-cell Batteries- Single Use 0.0% 0.0% 24 34
METAL 4.9% 2.0% 18,048 7,223 Dry-cell Batteries- Rechargeable 0.0% 0.0% 0 0
Aluminum Beverage Cans 0.3% 0.1% 1,105 286 Wet-cell Batteries 0.0% 0.0% 0 0
Aluminum Foil/Containers 0.1% 0.0% 352 133 Gasoline/Kerosene 0.0% 0.0% 0 0
Other Aluminum 0.0% 0.0% 14 22 Motor Oil 0.0% 0.0% 0 0
Other Non-ferrous Metal 0.1% 0.1% 366 266 Antifreeze 0.0% 0.0% 0 0
Food Cans - Tinned 0.7% 0.5% 2,665 1,839 Other Vehicle Fluids 0.0% 0.0% 0 0
Food Cans - Coated 0.0% 0.0% 31 40 Oil Filters 0.1% 0.1% 195 314
White Goods 0.0% 0.0% 0 0 Explosives 0.0% 0.0% 0 0
Other Ferrous Metal 2.7% 1.7% 9,745 6,255 Medical Wastes 0.3% 0.1% 1,026 480
R/C Metal 1.0% 0.6% 3,770 2,148 Sharps 0.0% 0.0% 4 6
ORGANICS 23.6% 5.7% 86,444 20,772 Pharmaceuticals & Vitamins 0.0% 0.0% 28 45
Edible Food Waste- Vegetative 9.3% 2.5% 33,981 9,102 Other Cleaners/Chemicals 0.0% 0.0% 0 0
Inedible Food Waste- Vegetative 6.5% 3.2% 23,636 11,537 Personal Care Products 0.1% 0.1% 342 316
Edible Food Waste- Meats/Fats/Oils 4.1% 2.1% 15,154 7,548 Other Potentially Hazardous Wastes 0.0% 0.0% 115 130
Inedible Food Waste- Meats/Fats/Oils 1.4% 0.9% 5,134 3,402 RESIDUALS 1.5% 0.7% 5,601 2,728
Yard/Garden Waste- Leaves and Grass 0.8% 0.8% 2,836 3,049 Disposable Diapers 0.6% 0.4% 2,117 1,359
Yard/Garden Waste- Prunings 0.3% 0.3% 1,249 1,006 Ash 0.0% 0.0% 0 0
Animal Manure 0.9% 0.7% 3,394 2,450 Dust 0.0% 0.1% 164 196
Animal Carcasses & Offal 0.0% 0.0% 0 0 Fines/Sorting Residues 0.9% 0.5% 3,320 1,686
Food Processing Wastes 0.0% 0.0% 0 0 Sludges & Other Special Industrial Wastes 0.0% 0.0% 0 0
R/C Organics 0.3% 0.1% 1,060 543
Estimated Origin Specified Disposed Tons 100% 366,233
Sample Count 24Confidence intervals calculated at the 90% confidence level. Percentages for material types may not
total 100% due to rounding.

2020-2021 Washington Statewide Waste Characterization Study
Draft Report
June 2021 | 87
Table 38: Puget Sound WGA Residential Disposed Waste Sector, Detailed Composition, 2020-2021
Material
Est.
Percent + / - Est. Tons Tons + / - Material
Est.
Percent + / - Est. Tons Tons + / -
PAPER 15.6% 3.9% 236,604 58,314 WOOD DEBRIS 6.3% 5.5% 95,708 82,945
PAPER PACKAGING 8.0% 2.3% 120,996 35,496 Natural Wood 0.5% 0.7% 7,197 10,840
Newspaper Packaging 0.0% 0.0% 0 0 Treated Wood 0.3% 0.3% 4,690 3,881
Cardboard & Kraft Packaging 3.1% 1.2% 46,748 17,550 Painted Wood 4.3% 4.0% 64,356 61,206
Mixed/Low-grade Paper Packaging 1.4% 0.5% 21,796 7,765 Dimensional Lumber 0.0% 0.0% 354 560
Aseptic Containers 0.1% 0.1% 2,029 971 Engineered Wood 0.7% 0.9% 9,910 13,951
Gable Top Containers 0.1% 0.1% 2,165 1,168 Pallets & Crates 0.0% 0.0% 0 0
Other Polycoated Packaging 0.1% 0.0% 1,097 578 Other Untreated Wood 0.1% 0.1% 1,327 1,302
Compostable Paper Packaging 2.6% 1.6% 38,785 24,935 Wood By-products 0.0% 0.0% 0 0
R/C Paper Packaging 0.6% 0.3% 8,376 4,524 R/C Wood Debris 0.5% 0.5% 7,875 7,758
PAPER PRODUCTS 7.6% 2.3% 115,608 35,168 CONSTRUCTION MATERIALS 6.7% 6.6% 101,253 99,437
Newspaper Products 0.5% 0.5% 7,727 6,970 Plastic Lumber 0.1% 0.2% 2,242 3,431
Cardboard & Kraft Paper Products 0.0% 0.0% 0 0 Insulation 0.0% 0.0% 0 0
Magazines 0.2% 0.2% 3,126 3,398 Asphalt Paving 0.0% 0.0% 0 0
High-Grade Paper Products 0.1% 0.1% 2,006 1,111 Concrete 0.8% 1.1% 11,650 15,988
Other Groundwood Paper Products 0.0% 0.0% 0 0 Drywall 4.2% 6.5% 63,058 98,323
Mixed/Low-grade Paper Products 1.7% 0.8% 25,984 12,272 Carpet 1.0% 1.1% 15,337 16,919
Compostable Paper Products 4.8% 1.3% 72,526 19,319 Carpet Padding 0.0% 0.0% 0 0
R/C Paper Products 0.3% 0.2% 4,238 2,958 Soil, Rocks, & Sand 0.2% 0.2% 2,301 3,642
PLASTIC 12.4% 1.3% 186,800 19,928 Asphalt Roofing 0.0% 0.0% 0 0
PLASTIC PACKAGING 7.5% 1.7% 113,210 25,348 Plastic Floor Covering 0.0% 0.0% 0 0
#1 PETE Plastic Bottles 0.9% 0.3% 12,889 4,307 Ceramics & Brick 0.1% 0.1% 1,091 1,728
#1 PETE Plastic Non-bottles 0.4% 0.1% 6,607 1,419 R/C Construction Materials 0.4% 0.6% 5,574 8,325
#2 HDPE Plastic Natural Bottles 0.2% 0.1% 2,439 1,227 CONSUMER PRODUCTS 6.4% 3.2% 96,670 48,723
#2 HDPE Plastic Jars and Tubs 0.1% 0.1% 1,569 762 Televisions - LCD 0.0% 0.0% 0 0
#2 HDPE Plastic Colored Bottles 0.2% 0.1% 3,716 1,420 Televisions - CRT 0.0% 0.0% 0 0
#3 PVC Plastic Packaging 0.0% 0.0% 0 0 Television Peripherals 0.0% 0.0% 0 0
#4 LDPE Plastic Packaging 0.0% 0.0% 53 55 Computer Monitors - CRT 0.0% 0.0% 0 0
#5 PP Plastic Packaging 0.9% 0.2% 13,685 3,360 Computer Monitors - LCD 0.0% 0.0% 0 0
#6 PS Plastic Packaging 0.1% 0.0% 1,563 406 Computers 0.0% 0.0% 0 0
#7 Other/Unknown Plastic Packaging 0.4% 0.1% 6,126 1,497 Computer Peripherals 0.1% 0.1% 1,121 1,715
Expanded Polystyrene Packaging 0.7% 0.3% 10,264 4,204 Computer Printers 0.0% 0.0% 0 0
PLA Compostable Packaging 0.0% 0.0% 678 388 Audio Equipment 0.0% 0.0% 0 0
Plastic Merchandise Bags 0.8% 0.3% 11,473 3,918 Electronic Gaming Equipment 0.0% 0.0% 0 0
Packaging Film Plastic 2.5% 0.6% 38,460 9,165 Other Consumer Electronics 0.4% 0.5% 5,368 7,252
Transportation Packaging Film Plastic 0.1% 0.1% 1,445 889 Textiles- Organic 2.1% 1.0% 31,783 14,949
Flexible Plastic Packaging 0.1% 0.0% 1,976 525 Textiles- Synthetic/Mixed/Unknown 1.2% 0.8% 18,257 11,361
R/C Plastic Packaging 0.0% 0.0% 265 415 Shoes/Purses/Belts 0.2% 0.1% 3,480 2,172
PLASTIC PRODUCTS 4.9% 2.0% 73,591 30,894 Tires & Other Rubber 0.4% 0.5% 5,692 8,224
#1 PETE Plastic Products 0.0% 0.0% 0 0 Furniture 0.0% 0.0% 0 0
#2 HDPE Plastic Products: 0.0% 0.0% 0 0 Mattresses 2.0% 3.1% 30,969 47,396
#3 PVC Plastic Products 0.0% 0.0% 0 0 R/C Consumer Products 0.0% 0.0% 0 0
#4 LDPE Plastic Products 0.0% 0.0% 0 0 HAZARDOUS AND SPECIAL WASTES 1.4% 0.8% 21,510 12,348
#5 PP Plastic Products 0.0% 0.0% 0 0 Pesticides 0.0% 0.0% 0 0
#6 PS Plastic Products 0.0% 0.0% 147 118 HID/UV/Germicidal Lamps 0.0% 0.0% 0 0
#7 Other/Unknown Plastic Products 1.2% 0.6% 18,316 8,320 Compact Florescent Lamps 0.0% 0.0% 649 641
PLA Compostable Products 0.0% 0.0% 156 138 Florescent Tubes 0.0% 0.0% 0 0
Plastic Garbage Bags 1.5% 0.4% 23,094 6,526 Water-based Paint 0.0% 0.0% 177 280
Plastic Non-bag Film Products 0.1% 0.1% 767 1,209 Solvent-based Adhesives/Glues 0.0% 0.0% 0 0
Bulky Rigid Plastic Products 1.2% 1.9% 18,758 28,708 Water-based Adhesives/Glues 0.0% 0.0% 0 0
R/C Plastic Products 0.8% 0.4% 12,352 5,547 Oil-based Paint 0.3% 0.5% 5,161 8,169
GLASS 3.0% 1.5% 45,303 22,052 Lacquer/Varnish/Urethane Coatings/Stains 0.0% 0.0% 0 0
Clear Glass Containers 1.5% 0.6% 22,415 9,758 Field & Lawn Markings 0.0% 0.0% 0 0
Green Glass Containers 0.6% 0.5% 9,763 7,959 Primers/Sealings/Coatings 0.0% 0.0% 0 0
Brown/Other Colored Glass Containers 0.3% 0.3% 5,014 4,366 Water Repellents & Waterproofers 0.0% 0.0% 0 0
Plate Glass 0.0% 0.0% 0 0 Solvents 0.0% 0.0% 0 0
Non-glass Ceramics 0.3% 0.5% 4,778 7,017 Caustic Cleaners 0.0% 0.0% 413 632
R/C Glass 0.2% 0.1% 3,333 1,985 Dry-cell Batteries- Single Use 0.1% 0.0% 941 732
METAL 6.3% 2.8% 95,867 41,849 Dry-cell Batteries- Rechargeable 0.0% 0.0% 442 701
Aluminum Beverage Cans 0.4% 0.2% 6,775 2,487 Wet-cell Batteries 0.0% 0.0% 0 0
Aluminum Foil/Containers 0.3% 0.1% 4,808 1,785 Gasoline/Kerosene 0.0% 0.0% 0 0
Other Aluminum 0.1% 0.1% 1,475 1,956 Motor Oil 0.0% 0.0% 0 0
Other Non-ferrous Metal 0.2% 0.2% 3,362 2,803 Antifreeze 0.0% 0.0% 0 0
Food Cans - Tinned 0.4% 0.1% 5,456 1,088 Other Vehicle Fluids 0.0% 0.0% 0 0
Food Cans - Coated 0.0% 0.0% 21 33 Oil Filters 0.0% 0.0% 0 0
White Goods 0.0% 0.0% 0 0 Explosives 0.0% 0.0% 0 0
Other Ferrous Metal 3.1% 2.4% 46,483 36,771 Medical Wastes 0.6% 0.6% 8,878 9,707
R/C Metal 1.8% 0.9% 27,488 14,273 Sharps 0.0% 0.0% 124 186
ORGANICS 33.7% 9.1% 509,981 137,369 Pharmaceuticals & Vitamins 0.2% 0.3% 3,746 4,001
Edible Food Waste- Vegetative 6.2% 1.6% 94,499 24,172 Other Cleaners/Chemicals 0.0% 0.0% 0 0
Inedible Food Waste- Vegetative 8.2% 2.1% 124,553 31,629 Personal Care Products 0.1% 0.1% 796 907
Edible Food Waste- Meats/Fats/Oils 2.1% 1.0% 31,028 15,405 Other Potentially Hazardous Wastes 0.0% 0.0% 183 230
Inedible Food Waste- Meats/Fats/Oils 0.5% 0.4% 6,931 5,617 RESIDUALS 8.1% 4.0% 122,813 60,827
Yard/Garden Waste- Leaves and Grass 1.8% 2.2% 26,722 33,657 Disposable Diapers 6.8% 4.0% 103,524 61,193
Yard/Garden Waste- Prunings 1.6% 1.9% 24,716 28,727 Ash 0.0% 0.0% 0 0
Animal Manure 12.3% 5.6% 186,107 84,368 Dust 0.0% 0.0% 0 0
Animal Carcasses & Offal 0.0% 0.0% 0 0 Fines/Sorting Residues 1.3% 0.6% 19,289 9,027
Food Processing Wastes 0.0% 0.0% 0 0 Sludges & Other Special Industrial Wastes 0.0% 0.0% 0 0
R/C Organics 1.0% 0.6% 15,425 8,676
Estimated Origin Specified Disposed Tons 100% 1,512,509
Sample Count 12Confidence intervals calculated at the 90% confidence level. Percentages for material types may not
total 100% due to rounding.

2020-2021 Washington Statewide Waste Characterization Study
Draft Report
June 2021 | 88
Table 39: Puget Sound WGA Self-hauled Disposed Waste Sector, Detailed Composition, 2020-2021
Material
Est.
Percent + / - Est. Tons Tons + / - Material
Est.
Percent + / - Est. Tons Tons + / -
PAPER 10.4% 5.4% 97,575 50,388 WOOD DEBRIS 26.0% 10.2% 244,609 96,014
PAPER PACKAGING 7.4% 4.2% 69,538 39,265 Natural Wood 2.0% 3.2% 19,238 30,505
Newspaper Packaging 0.0% 0.0% 0 0 Treated Wood 1.0% 0.9% 9,560 8,324
Cardboard & Kraft Packaging 6.7% 4.1% 63,163 38,076 Painted Wood 10.3% 7.8% 96,865 73,503
Mixed/Low-grade Paper Packaging 0.4% 0.3% 3,863 2,414 Dimensional Lumber 2.9% 2.6% 27,237 24,267
Aseptic Containers 0.0% 0.0% 130 206 Engineered Wood 3.7% 2.5% 35,133 23,038
Gable Top Containers 0.0% 0.0% 260 417 Pallets & Crates 1.8% 1.9% 17,209 17,568
Other Polycoated Packaging 0.0% 0.0% 104 109 Other Untreated Wood 0.1% 0.1% 554 673
Compostable Paper Packaging 0.1% 0.1% 1,390 986 Wood By-products 0.0% 0.0% 0 0
R/C Paper Packaging 0.1% 0.0% 627 438 R/C Wood Debris 4.1% 3.6% 38,814 34,005
PAPER PRODUCTS 3.0% 1.7% 28,037 16,247 CONSTRUCTION MATERIALS 22.8% 10.5% 214,411 98,850
Newspaper Products 0.0% 0.0% 225 217 Plastic Lumber 2.6% 4.2% 24,870 39,835
Cardboard & Kraft Paper Products 0.0% 0.0% 0 0 Insulation 0.8% 1.0% 7,284 9,570
Magazines 0.1% 0.1% 728 929 Asphalt Paving 0.0% 0.0% 0 0
High-Grade Paper Products 0.1% 0.0% 533 360 Concrete 1.9% 3.0% 17,885 28,647
Other Groundwood Paper Products 0.0% 0.0% 0 0 Drywall 6.1% 5.1% 57,206 47,874
Mixed/Low-grade Paper Products 1.5% 1.3% 14,321 11,991 Carpet 0.7% 1.0% 6,178 9,173
Compostable Paper Products 0.6% 0.6% 5,544 5,280 Carpet Padding 0.4% 0.5% 3,460 4,272
R/C Paper Products 0.7% 1.1% 6,686 9,929 Soil, Rocks, & Sand 0.0% 0.0% 0 0
PLASTIC 8.0% 3.0% 75,147 28,218 Asphalt Roofing 7.7% 8.3% 72,177 77,706
PLASTIC PACKAGING 1.7% 0.7% 16,191 6,705 Plastic Floor Covering 0.0% 0.0% 0 0
#1 PETE Plastic Bottles 0.2% 0.1% 1,626 697 Ceramics & Brick 0.7% 1.0% 6,946 9,062
#1 PETE Plastic Non-bottles 0.1% 0.1% 882 476 R/C Construction Materials 2.0% 1.5% 18,405 14,291
#2 HDPE Plastic Natural Bottles 0.0% 0.0% 213 131 CONSUMER PRODUCTS 5.0% 3.6% 47,349 33,624
#2 HDPE Plastic Jars and Tubs 0.1% 0.1% 866 1,035 Televisions - LCD 0.0% 0.0% 0 0
#2 HDPE Plastic Colored Bottles 0.1% 0.0% 689 320 Televisions - CRT 0.0% 0.0% 0 0
#3 PVC Plastic Packaging 0.0% 0.0% 0 0 Television Peripherals 0.0% 0.0% 0 0
#4 LDPE Plastic Packaging 0.0% 0.0% 8 12 Computer Monitors - CRT 0.0% 0.0% 0 0
#5 PP Plastic Packaging 0.1% 0.1% 1,098 806 Computer Monitors - LCD 0.0% 0.0% 0 0
#6 PS Plastic Packaging 0.0% 0.0% 291 243 Computers 0.0% 0.0% 0 0
#7 Other/Unknown Plastic Packaging 0.1% 0.1% 1,350 649 Computer Peripherals 0.0% 0.0% 0 0
Expanded Polystyrene Packaging 0.2% 0.1% 1,418 934 Computer Printers 0.0% 0.0% 0 0
PLA Compostable Packaging 0.0% 0.0% 130 209 Audio Equipment 0.0% 0.0% 0 0
Plastic Merchandise Bags 0.1% 0.0% 565 359 Electronic Gaming Equipment 0.2% 0.3% 1,847 2,898
Packaging Film Plastic 0.6% 0.4% 5,684 3,603 Other Consumer Electronics 0.0% 0.0% 403 421
Transportation Packaging Film Plastic 0.1% 0.1% 897 915 Textiles- Organic 3.0% 3.3% 28,486 30,675
Flexible Plastic Packaging 0.0% 0.0% 135 96 Textiles- Synthetic/Mixed/Unknown 1.0% 0.5% 9,287 4,737
R/C Plastic Packaging 0.0% 0.1% 338 540 Shoes/Purses/Belts 0.4% 0.3% 3,577 3,245
PLASTIC PRODUCTS 6.3% 3.0% 58,955 28,457 Tires & Other Rubber 0.4% 0.5% 3,749 4,987
#1 PETE Plastic Products 0.0% 0.0% 0 0 Furniture 0.0% 0.0% 0 0
#2 HDPE Plastic Products: 0.0% 0.0% 65 103 Mattresses 0.0% 0.0% 0 0
#3 PVC Plastic Products 0.0% 0.0% 0 0 R/C Consumer Products 0.0% 0.0% 0 0
#4 LDPE Plastic Products 0.0% 0.0% 0 0 HAZARDOUS AND SPECIAL WASTES 1.5% 1.0% 14,546 9,091
#5 PP Plastic Products 0.0% 0.0% 0 0 Pesticides 0.0% 0.0% 0 0
#6 PS Plastic Products 0.0% 0.0% 0 0 HID/UV/Germicidal Lamps 0.0% 0.0% 0 0
#7 Other/Unknown Plastic Products 1.4% 0.9% 13,496 8,106 Compact Florescent Lamps 0.0% 0.0% 0 0
PLA Compostable Products 0.0% 0.0% 38 61 Florescent Tubes 0.0% 0.0% 0 0
Plastic Garbage Bags 0.4% 0.1% 3,395 1,280 Water-based Paint 0.2% 0.4% 2,276 3,653
Plastic Non-bag Film Products 0.4% 0.3% 3,512 3,118 Solvent-based Adhesives/Glues 0.0% 0.0% 52 83
Bulky Rigid Plastic Products 2.2% 1.4% 20,760 13,595 Water-based Adhesives/Glues 0.0% 0.0% 0 0
R/C Plastic Products 1.9% 1.7% 17,690 16,412 Oil-based Paint 0.0% 0.1% 325 510
GLASS 1.1% 0.9% 10,315 8,460 Lacquer/Varnish/Urethane Coatings/Stains 0.0% 0.0% 0 0
Clear Glass Containers 0.2% 0.1% 1,704 940 Field & Lawn Markings 0.0% 0.0% 0 0
Green Glass Containers 0.0% 0.0% 117 185 Primers/Sealings/Coatings 0.0% 0.0% 0 0
Brown/Other Colored Glass Containers 0.1% 0.1% 585 599 Water Repellents & Waterproofers 0.0% 0.0% 0 0
Plate Glass 0.0% 0.0% 0 0 Solvents 0.0% 0.0% 0 0
Non-glass Ceramics 0.0% 0.0% 0 0 Caustic Cleaners 0.0% 0.0% 0 0
R/C Glass 0.8% 0.9% 7,908 8,681 Dry-cell Batteries- Single Use 0.0% 0.1% 299 480
METAL 11.2% 4.8% 105,036 44,951 Dry-cell Batteries- Rechargeable 0.0% 0.0% 0 0
Aluminum Beverage Cans 0.0% 0.0% 302 214 Wet-cell Batteries 0.0% 0.0% 0 0
Aluminum Foil/Containers 0.0% 0.0% 312 244 Gasoline/Kerosene 0.0% 0.0% 0 0
Other Aluminum 0.0% 0.0% 182 286 Motor Oil 0.0% 0.0% 0 0
Other Non-ferrous Metal 0.6% 0.6% 5,996 5,523 Antifreeze 0.0% 0.0% 286 452
Food Cans - Tinned 0.0% 0.0% 364 325 Other Vehicle Fluids 0.0% 0.0% 0 0
Food Cans - Coated 0.0% 0.0% 0 0 Oil Filters 0.1% 0.1% 494 793
White Goods 0.0% 0.0% 0 0 Explosives 0.0% 0.0% 0 0
Other Ferrous Metal 4.8% 3.5% 45,317 32,728 Medical Wastes 0.0% 0.0% 195 131
R/C Metal 5.6% 2.8% 52,562 26,474 Sharps 0.0% 0.0% 0 0
ORGANICS 13.5% 9.9% 126,888 92,563 Pharmaceuticals & Vitamins 0.3% 0.4% 2,953 3,690
Edible Food Waste- Vegetative 2.7% 2.1% 25,156 19,591 Other Cleaners/Chemicals 0.1% 0.1% 780 1,252
Inedible Food Waste- Vegetative 2.3% 3.1% 21,254 28,798 Personal Care Products 0.7% 0.6% 6,881 5,920
Edible Food Waste- Meats/Fats/Oils 0.1% 0.1% 494 639 Other Potentially Hazardous Wastes 0.0% 0.0% 4 6
Inedible Food Waste- Meats/Fats/Oils 0.0% 0.0% 221 225 RESIDUALS 0.4% 0.4% 3,720 3,965
Yard/Garden Waste- Leaves and Grass 6.6% 7.9% 61,579 74,135 Disposable Diapers 0.2% 0.2% 1,873 2,289
Yard/Garden Waste- Prunings 1.8% 2.1% 16,636 20,115 Ash 0.0% 0.0% 0 0
Animal Manure 0.0% 0.1% 338 542 Dust 0.0% 0.0% 0 0
Animal Carcasses & Offal 0.0% 0.0% 0 0 Fines/Sorting Residues 0.2% 0.3% 1,847 2,879
Food Processing Wastes 0.0% 0.0% 0 0 Sludges & Other Special Industrial Wastes 0.0% 0.0% 0 0
R/C Organics 0.1% 0.2% 1,210 1,659
Estimated Origin Specified Disposed Tons 100% 939,596
Sample Count 16
Confidence intervals calculated at the 90% confidence level. Percentages for material types may not
total 100% due to rounding.

2020-2021 Washington Statewide Waste Characterization Study
Final Report
August 2021 | 89
Southwest Waste Generation Area Composition Tables

2020-2021 Washington Statewide Waste Characterization Study
Draft Report
June 2021 | 90
Table 40: Southwest WGA Overall Disposed Waste Sector, Detailed Composition, 2020-2021
Material
Est.
Percent + / - Est. Tons Tons + / - Material
Est.
Percent + / - Est. Tons Tons + / -
PAPER 18.5% 3.1% 92,721 15,428 WOOD DEBRIS 16.9% 3.1% 84,737 15,751
PAPER PACKAGING 10.1% 2.1% 50,451 10,276 Natural Wood 0.1% 0.1% 307 335
Newspaper Packaging 0.0% 0.0% 0 0 Treated Wood 0.3% 0.2% 1,672 1,065
Cardboard & Kraft Packaging 4.4% 0.9% 22,215 4,626 Painted Wood 4.9% 1.8% 24,611 8,925
Mixed/Low-grade Paper Packaging 2.8% 1.8% 14,139 8,841 Dimensional Lumber 3.3% 1.3% 16,546 6,352
Aseptic Containers 0.1% 0.0% 428 131 Engineered Wood 2.7% 1.0% 13,300 4,921
Gable Top Containers 0.1% 0.1% 642 264 Pallets & Crates 3.0% 1.7% 15,141 8,425
Other Polycoated Packaging 0.0% 0.0% 190 90 Other Untreated Wood 0.0% 0.0% 156 122
Compostable Paper Packaging 2.1% 0.7% 10,607 3,749 Wood By-products 0.8% 0.8% 3,805 3,779
R/C Paper Packaging 0.4% 0.1% 2,230 570 R/C Wood Debris 1.8% 0.8% 9,199 4,116
PAPER PRODUCTS 8.5% 2.1% 42,270 10,258 CONSTRUCTION MATERIALS 12.3% 3.4% 61,357 17,158
Newspaper Products 0.2% 0.1% 1,239 375 Plastic Lumber 0.0% 0.0% 90 77
Cardboard & Kraft Paper Products 1.1% 1.8% 5,738 9,155 Insulation 1.1% 1.8% 5,722 8,805
Magazines 0.1% 0.1% 716 435 Asphalt Paving 0.0% 0.0% 0 0
High-Grade Paper Products 0.2% 0.1% 1,136 545 Concrete 2.0% 1.3% 10,017 6,723
Other Groundwood Paper Products 0.0% 0.1% 209 342 Drywall 3.0% 1.9% 15,034 9,684
Mixed/Low-grade Paper Products 1.7% 0.5% 8,737 2,636 Carpet 1.0% 0.8% 5,052 3,759
Compostable Paper Products 3.7% 0.7% 18,591 3,482 Carpet Padding 0.4% 0.6% 1,890 2,850
R/C Paper Products 1.2% 0.8% 5,903 4,027 Soil, Rocks, & Sand 1.3% 0.9% 6,265 4,545
PLASTIC 16.1% 2.8% 80,705 14,188 Asphalt Roofing 0.6% 0.8% 2,968 4,120
PLASTIC PACKAGING 11.1% 2.6% 55,703 12,952 Plastic Floor Covering 0.0% 0.0% 0 0
#1 PETE Plastic Bottles 0.6% 0.1% 2,758 555 Ceramics & Brick 0.2% 0.2% 1,210 1,033
#1 PETE Plastic Non-bottles 0.4% 0.1% 2,046 397 R/C Construction Materials 2.6% 1.4% 13,108 6,902
#2 HDPE Plastic Natural Bottles 0.2% 0.1% 927 253 CONSUMER PRODUCTS 6.1% 1.5% 30,394 7,363
#2 HDPE Plastic Jars and Tubs 0.3% 0.2% 1,735 1,206 Televisions - LCD 0.2% 0.2% 879 1,028
#2 HDPE Plastic Colored Bottles 0.1% 0.0% 614 128 Televisions - CRT 0.0% 0.0% 0 0
#3 PVC Plastic Packaging 0.0% 0.0% 9 12 Television Peripherals 0.0% 0.0% 0 0
#4 LDPE Plastic Packaging 0.0% 0.0% 8 9 Computer Monitors - CRT 0.0% 0.0% 0 0
#5 PP Plastic Packaging 0.7% 0.1% 3,502 670 Computer Monitors - LCD 0.0% 0.0% 0 0
#6 PS Plastic Packaging 0.1% 0.0% 681 219 Computers 0.1% 0.1% 307 497
#7 Other/Unknown Plastic Packaging 2.4% 1.8% 11,899 9,099 Computer Peripherals 0.0% 0.0% 0 0
Expanded Polystyrene Packaging 0.9% 0.2% 4,516 1,199 Computer Printers 0.1% 0.2% 646 814
PLA Compostable Packaging 0.0% 0.0% 45 46 Audio Equipment 0.0% 0.0% 0 0
Plastic Merchandise Bags 0.3% 0.0% 1,730 219 Electronic Gaming Equipment 0.0% 0.0% 0 0
Packaging Film Plastic 2.4% 0.5% 12,227 2,693 Other Consumer Electronics 0.0% 0.0% 0 0
Transportation Packaging Film Plastic 1.2% 0.6% 5,758 3,094 Textiles- Organic 1.5% 0.4% 7,607 1,916
Flexible Plastic Packaging 0.1% 0.0% 342 87 Textiles- Synthetic/Mixed/Unknown 0.7% 0.3% 3,719 1,334
R/C Plastic Packaging 1.4% 1.6% 6,907 7,971 Shoes/Purses/Belts 0.1% 0.1% 509 316
PLASTIC PRODUCTS 5.0% 1.1% 25,002 5,500 Tires & Other Rubber 0.4% 0.5% 2,216 2,306
#1 PETE Plastic Products 0.0% 0.0% 0 0 Furniture 2.5% 1.2% 12,640 6,178
#2 HDPE Plastic Products: 0.0% 0.0% 54 88 Mattresses 0.4% 0.5% 1,870 2,385
#3 PVC Plastic Products 0.0% 0.0% 39 64 R/C Consumer Products 0.0% 0.0% 0 0
#4 LDPE Plastic Products 0.0% 0.0% 0 0 HAZARDOUS AND SPECIAL WASTES 0.8% 0.4% 4,013 2,072
#5 PP Plastic Products 0.0% 0.0% 49 49 Pesticides 0.0% 0.0% 1 2
#6 PS Plastic Products 0.0% 0.0% 103 47 HID/UV/Germicidal Lamps 0.0% 0.0% 0 0
#7 Other/Unknown Plastic Products 0.9% 0.3% 4,612 1,371 Compact Florescent Lamps 0.0% 0.0% 16 17
PLA Compostable Products 0.0% 0.0% 25 19 Florescent Tubes 0.0% 0.0% 0 0
Plastic Garbage Bags 1.2% 0.2% 5,949 1,155 Water-based Paint 0.3% 0.4% 1,311 1,933
Plastic Non-bag Film Products 0.9% 0.9% 4,574 4,730 Solvent-based Adhesives/Glues 0.0% 0.0% 0 0
Bulky Rigid Plastic Products 1.0% 0.4% 4,993 1,865 Water-based Adhesives/Glues 0.0% 0.0% 48 46
R/C Plastic Products 0.9% 0.5% 4,604 2,392 Oil-based Paint 0.0% 0.0% 0 0
GLASS 1.5% 0.5% 7,645 2,252 Lacquer/Varnish/Urethane Coatings/Stains 0.0% 0.0% 0 0
Clear Glass Containers 0.7% 0.2% 3,599 948 Field & Lawn Markings 0.0% 0.0% 0 0
Green Glass Containers 0.4% 0.2% 1,764 879 Primers/Sealings/Coatings 0.0% 0.0% 48 78
Brown/Other Colored Glass Containers 0.2% 0.1% 1,105 669 Water Repellents & Waterproofers 0.0% 0.0% 0 0
Plate Glass 0.0% 0.0% 158 164 Solvents 0.0% 0.0% 0 0
Non-glass Ceramics 0.1% 0.1% 611 534 Caustic Cleaners 0.0% 0.0% 69 64
R/C Glass 0.1% 0.1% 408 313 Dry-cell Batteries- Single Use 0.0% 0.0% 106 57
METAL 4.8% 1.1% 24,150 5,451 Dry-cell Batteries- Rechargeable 0.0% 0.0% 0 0
Aluminum Beverage Cans 0.4% 0.1% 1,908 608 Wet-cell Batteries 0.0% 0.0% 0 0
Aluminum Foil/Containers 0.2% 0.1% 890 301 Gasoline/Kerosene 0.0% 0.0% 42 68
Other Aluminum 0.1% 0.1% 611 303 Motor Oil 0.0% 0.0% 0 0
Other Non-ferrous Metal 0.1% 0.1% 617 385 Antifreeze 0.0% 0.0% 0 0
Food Cans - Tinned 0.4% 0.1% 1,971 440 Other Vehicle Fluids 0.0% 0.0% 0 0
Food Cans - Coated 0.0% 0.0% 201 153 Oil Filters 0.1% 0.1% 313 474
White Goods 0.2% 0.2% 1,051 1,166 Explosives 0.0% 0.0% 0 0
Other Ferrous Metal 2.0% 0.8% 10,042 4,103 Medical Wastes 0.2% 0.1% 1,155 737
R/C Metal 1.4% 0.6% 6,860 2,992 Sharps 0.0% 0.0% 10 10
ORGANICS 17.3% 2.8% 86,526 13,782 Pharmaceuticals & Vitamins 0.0% 0.0% 124 150
Edible Food Waste- Vegetative 6.0% 1.5% 29,909 7,443 Other Cleaners/Chemicals 0.0% 0.0% 69 113
Inedible Food Waste- Vegetative 3.4% 0.6% 17,032 3,247 Personal Care Products 0.1% 0.0% 314 142
Edible Food Waste- Meats/Fats/Oils 1.4% 0.6% 7,133 2,879 Other Potentially Hazardous Wastes 0.1% 0.1% 387 454
Inedible Food Waste- Meats/Fats/Oils 0.4% 0.3% 2,207 1,329 RESIDUALS 5.6% 2.3% 27,825 11,294
Yard/Garden Waste- Leaves and Grass 0.5% 0.4% 2,343 2,055 Disposable Diapers 2.6% 0.6% 12,990 3,107
Yard/Garden Waste- Prunings 0.7% 0.4% 3,302 2,247 Ash 0.0% 0.0% 0 0
Animal Manure 2.2% 0.6% 10,801 3,037 Dust 0.0% 0.0% 40 45
Animal Carcasses & Offal 0.0% 0.0% 0 0 Fines/Sorting Residues 1.0% 0.3% 5,081 1,262
Food Processing Wastes 2.4% 2.2% 11,854 11,169 Sludges & Other Special Industrial Wastes 1.9% 2.2% 9,714 11,004
R/C Organics 0.4% 0.2% 1,946 794
Estimated Origin Specified Disposed Tons 100% 500,073
Sample Count 104
Confidence intervals calculated at the 90% confidence level. Percentages for material types may not
total 100% due to rounding.

2020-2021 Washington Statewide Waste Characterization Study
Draft Report
June 2021 | 91
Table 41: Southwest WGA Commercial Disposed Waste Sector, Detailed Composition, 2020-2021
Material
Est.
Percent + / - Est. Tons Tons + / - Material
Est.
Percent + / - Est. Tons Tons + / -
PAPER 19.8% 5.5% 54,283 15,050 WOOD DEBRIS 18.1% 5.1% 49,462 13,935
PAPER PACKAGING 11.4% 3.7% 31,294 10,055 Natural Wood 0.1% 0.1% 165 257
Newspaper Packaging 0.0% 0.0% 0 0 Treated Wood 0.4% 0.3% 1,047 898
Cardboard & Kraft Packaging 5.2% 1.6% 14,355 4,264 Painted Wood 4.6% 2.9% 12,474 7,824
Mixed/Low-grade Paper Packaging 3.5% 3.2% 9,587 8,816 Dimensional Lumber 3.8% 1.9% 10,528 5,140
Aseptic Containers 0.0% 0.0% 85 67 Engineered Wood 2.3% 1.2% 6,297 3,322
Gable Top Containers 0.1% 0.1% 275 240 Pallets & Crates 4.6% 2.8% 12,558 7,733
Other Polycoated Packaging 0.0% 0.0% 26 43 Other Untreated Wood 0.0% 0.0% 0 0
Compostable Paper Packaging 2.2% 1.3% 6,031 3,636 Wood By-products 1.4% 1.4% 3,805 3,779
R/C Paper Packaging 0.3% 0.2% 936 446 R/C Wood Debris 0.9% 0.8% 2,588 2,255
PAPER PRODUCTS 8.4% 3.6% 22,989 9,952 CONSTRUCTION MATERIALS 17.5% 5.9% 47,904 16,156
Newspaper Products 0.0% 0.0% 119 92 Plastic Lumber 0.0% 0.0% 27 45
Cardboard & Kraft Paper Products 2.1% 3.3% 5,651 9,154 Insulation 2.0% 3.2% 5,532 8,802
Magazines 0.1% 0.1% 361 376 Asphalt Paving 0.0% 0.0% 0 0
High-Grade Paper Products 0.3% 0.2% 881 535 Concrete 3.5% 2.4% 9,583 6,686
Other Groundwood Paper Products 0.1% 0.1% 209 342 Drywall 5.3% 3.5% 14,523 9,655
Mixed/Low-grade Paper Products 1.6% 0.9% 4,484 2,417 Carpet 1.3% 1.3% 3,644 3,577
Compostable Paper Products 2.1% 1.1% 5,754 3,007 Carpet Padding 0.6% 1.0% 1,749 2,841
R/C Paper Products 2.0% 1.5% 5,529 4,024 Soil, Rocks, & Sand 0.7% 0.8% 1,790 2,306
PLASTIC 17.9% 5.1% 49,110 13,912 Asphalt Roofing 0.0% 0.0% 109 111
PLASTIC PACKAGING 12.8% 4.7% 35,158 12,822 Plastic Floor Covering 0.0% 0.0% 0 0
#1 PETE Plastic Bottles 0.3% 0.2% 852 419 Ceramics & Brick 0.3% 0.4% 865 978
#1 PETE Plastic Non-bottles 0.2% 0.1% 502 253 R/C Construction Materials 3.7% 2.3% 10,083 6,403
#2 HDPE Plastic Natural Bottles 0.1% 0.1% 305 211 CONSUMER PRODUCTS 2.7% 1.0% 7,510 2,782
#2 HDPE Plastic Jars and Tubs 0.2% 0.2% 650 421 Televisions - LCD 0.0% 0.0% 0 0
#2 HDPE Plastic Colored Bottles 0.0% 0.0% 101 63 Televisions - CRT 0.0% 0.0% 0 0
#3 PVC Plastic Packaging 0.0% 0.0% 0 0 Television Peripherals 0.0% 0.0% 0 0
#4 LDPE Plastic Packaging 0.0% 0.0% 3 3 Computer Monitors - CRT 0.0% 0.0% 0 0
#5 PP Plastic Packaging 0.3% 0.2% 804 428 Computer Monitors - LCD 0.0% 0.0% 0 0
#6 PS Plastic Packaging 0.1% 0.1% 287 200 Computers 0.0% 0.0% 0 0
#7 Other/Unknown Plastic Packaging 4.0% 3.3% 10,945 9,097 Computer Peripherals 0.0% 0.0% 0 0
Expanded Polystyrene Packaging 0.9% 0.4% 2,510 1,054 Computer Printers 0.2% 0.3% 466 760
PLA Compostable Packaging 0.0% 0.0% 33 45 Audio Equipment 0.0% 0.0% 0 0
Plastic Merchandise Bags 0.1% 0.0% 332 122 Electronic Gaming Equipment 0.0% 0.0% 0 0
Packaging Film Plastic 2.1% 0.9% 5,653 2,592 Other Consumer Electronics 0.0% 0.0% 0 0
Transportation Packaging Film Plastic 1.9% 1.1% 5,214 3,033 Textiles- Organic 1.4% 0.6% 3,697 1,580
Flexible Plastic Packaging 0.0% 0.0% 61 34 Textiles- Synthetic/Mixed/Unknown 0.6% 0.4% 1,553 1,040
R/C Plastic Packaging 2.5% 2.9% 6,906 7,971 Shoes/Purses/Belts 0.1% 0.1% 181 180
PLASTIC PRODUCTS 5.1% 1.8% 13,952 5,040 Tires & Other Rubber 0.6% 0.8% 1,613 2,224
#1 PETE Plastic Products 0.0% 0.0% 0 0 Furniture 0.0% 0.0% 0 0
#2 HDPE Plastic Products: 0.0% 0.0% 54 88 Mattresses 0.0% 0.0% 0 0
#3 PVC Plastic Products 0.0% 0.0% 39 64 R/C Consumer Products 0.0% 0.0% 0 0
#4 LDPE Plastic Products 0.0% 0.0% 0 0 HAZARDOUS AND SPECIAL WASTES 1.1% 0.8% 3,036 2,058
#5 PP Plastic Products 0.0% 0.0% 39 46 Pesticides 0.0% 0.0% 0 0
#6 PS Plastic Products 0.0% 0.0% 43 38 HID/UV/Germicidal Lamps 0.0% 0.0% 0 0
#7 Other/Unknown Plastic Products 1.0% 0.5% 2,611 1,288 Compact Florescent Lamps 0.0% 0.0% 4 6
PLA Compostable Products 0.0% 0.0% 18 17 Florescent Tubes 0.0% 0.0% 0 0
Plastic Garbage Bags 0.9% 0.4% 2,524 1,040 Water-based Paint 0.5% 0.7% 1,311 1,933
Plastic Non-bag Film Products 1.6% 1.7% 4,338 4,726 Solvent-based Adhesives/Glues 0.0% 0.0% 0 0
Bulky Rigid Plastic Products 0.5% 0.4% 1,370 1,087 Water-based Adhesives/Glues 0.0% 0.0% 8 13
R/C Plastic Products 1.1% 0.8% 2,917 2,223 Oil-based Paint 0.0% 0.0% 0 0
GLASS 1.1% 0.7% 3,052 2,023 Lacquer/Varnish/Urethane Coatings/Stains 0.0% 0.0% 0 0
Clear Glass Containers 0.5% 0.3% 1,322 793 Field & Lawn Markings 0.0% 0.0% 0 0
Green Glass Containers 0.3% 0.3% 924 785 Primers/Sealings/Coatings 0.0% 0.0% 0 0
Brown/Other Colored Glass Containers 0.3% 0.2% 697 637 Water Repellents & Waterproofers 0.0% 0.0% 0 0
Plate Glass 0.0% 0.0% 0 0 Solvents 0.0% 0.0% 0 0
Non-glass Ceramics 0.0% 0.0% 46 75 Caustic Cleaners 0.0% 0.0% 0 0
R/C Glass 0.0% 0.0% 63 57 Dry-cell Batteries- Single Use 0.0% 0.0% 23 27
METAL 4.4% 1.6% 12,168 4,479 Dry-cell Batteries- Rechargeable 0.0% 0.0% 0 0
Aluminum Beverage Cans 0.4% 0.2% 970 561 Wet-cell Batteries 0.0% 0.0% 0 0
Aluminum Foil/Containers 0.1% 0.1% 355 273 Gasoline/Kerosene 0.0% 0.0% 42 68
Other Aluminum 0.1% 0.1% 234 244 Motor Oil 0.0% 0.0% 0 0
Other Non-ferrous Metal 0.1% 0.1% 329 305 Antifreeze 0.0% 0.0% 0 0
Food Cans - Tinned 0.1% 0.1% 302 185 Other Vehicle Fluids 0.0% 0.0% 0 0
Food Cans - Coated 0.0% 0.0% 8 9 Oil Filters 0.1% 0.2% 292 473
White Goods 0.0% 0.0% 0 0 Explosives 0.0% 0.0% 0 0
Other Ferrous Metal 2.7% 1.4% 7,515 3,967 Medical Wastes 0.3% 0.3% 956 735
R/C Metal 0.9% 0.7% 2,456 1,836 Sharps 0.0% 0.0% 2 2
ORGANICS 12.8% 4.7% 35,096 12,990 Pharmaceuticals & Vitamins 0.0% 0.0% 5 9
Edible Food Waste- Vegetative 4.0% 2.5% 10,928 6,881 Other Cleaners/Chemicals 0.0% 0.0% 69 113
Inedible Food Waste- Vegetative 1.3% 0.8% 3,482 2,237 Personal Care Products 0.0% 0.0% 7 9
Edible Food Waste- Meats/Fats/Oils 1.1% 1.0% 3,136 2,672 Other Potentially Hazardous Wastes 0.1% 0.2% 317 451
Inedible Food Waste- Meats/Fats/Oils 0.5% 0.5% 1,294 1,299 RESIDUALS 4.4% 4.0% 12,147 10,966
Yard/Garden Waste- Leaves and Grass 0.3% 0.5% 937 1,244 Disposable Diapers 0.3% 0.3% 871 813
Yard/Garden Waste- Prunings 0.4% 0.3% 1,105 957 Ash 0.0% 0.0% 0 0
Animal Manure 0.7% 0.5% 1,970 1,392 Dust 0.0% 0.0% 0 0
Animal Carcasses & Offal 0.0% 0.0% 0 0 Fines/Sorting Residues 0.6% 0.2% 1,562 583
Food Processing Wastes 4.3% 4.1% 11,854 11,169 Sludges & Other Special Industrial Wastes 3.5% 4.0% 9,714 11,004
R/C Organics 0.1% 0.1% 390 313
Estimated Origin Specified Disposed Tons 100% 273,767
Sample Count 48Confidence intervals calculated at the 90% confidence level. Percentages for material types may not
total 100% due to rounding.

2020-2021 Washington Statewide Waste Characterization Study
Draft Report
June 2021 | 92
Table 42: Southwest WGA Residential Disposed Waste Sector, Detailed Composition, 2020-2021
Material
Est.
Percent + / - Est. Tons Tons + / - Material
Est.
Percent + / - Est. Tons Tons + / -
PAPER 23.3% 1.9% 32,663 2,687 WOOD DEBRIS 2.2% 1.0% 3,134 1,440
PAPER PACKAGING 10.8% 1.1% 15,208 1,547 Natural Wood 0.1% 0.2% 134 215
Newspaper Packaging 0.0% 0.0% 0 0 Treated Wood 0.1% 0.2% 175 271
Cardboard & Kraft Packaging 3.5% 0.9% 4,968 1,313 Painted Wood 1.0% 0.9% 1,464 1,234
Mixed/Low-grade Paper Packaging 3.0% 0.4% 4,152 610 Dimensional Lumber 0.3% 0.2% 483 314
Aseptic Containers 0.2% 0.1% 307 109 Engineered Wood 0.4% 0.3% 530 450
Gable Top Containers 0.2% 0.1% 345 106 Pallets & Crates 0.1% 0.2% 158 255
Other Polycoated Packaging 0.1% 0.1% 157 79 Other Untreated Wood 0.1% 0.1% 113 102
Compostable Paper Packaging 3.1% 0.6% 4,320 864 Wood By-products 0.0% 0.0% 0 0
R/C Paper Packaging 0.7% 0.1% 959 202 R/C Wood Debris 0.1% 0.0% 77 47
PAPER PRODUCTS 12.4% 1.5% 17,456 2,172 CONSTRUCTION MATERIALS 1.4% 0.9% 1,913 1,299
Newspaper Products 0.8% 0.3% 1,067 359 Plastic Lumber 0.0% 0.0% 0 0
Cardboard & Kraft Paper Products 0.1% 0.1% 84 136 Insulation 0.0% 0.0% 17 27
Magazines 0.2% 0.2% 317 216 Asphalt Paving 0.0% 0.0% 0 0
High-Grade Paper Products 0.1% 0.1% 198 82 Concrete 0.0% 0.0% 0 0
Other Groundwood Paper Products 0.0% 0.0% 0 0 Drywall 0.0% 0.0% 0 0
Mixed/Low-grade Paper Products 2.5% 0.6% 3,493 816 Carpet 0.4% 0.6% 551 887
Compostable Paper Products 8.6% 1.2% 11,999 1,627 Carpet Padding 0.1% 0.2% 140 227
R/C Paper Products 0.2% 0.1% 297 161 Soil, Rocks, & Sand 0.7% 0.7% 1,029 1,013
PLASTIC 17.2% 1.2% 24,177 1,644 Asphalt Roofing 0.0% 0.0% 0 0
PLASTIC PACKAGING 12.6% 0.9% 17,721 1,232 Plastic Floor Covering 0.0% 0.0% 0 0
#1 PETE Plastic Bottles 1.3% 0.2% 1,760 350 Ceramics & Brick 0.0% 0.1% 50 80
#1 PETE Plastic Non-bottles 1.0% 0.2% 1,407 290 R/C Construction Materials 0.1% 0.1% 127 204
#2 HDPE Plastic Natural Bottles 0.4% 0.1% 572 131 CONSUMER PRODUCTS 3.8% 1.0% 5,394 1,348
#2 HDPE Plastic Jars and Tubs 0.2% 0.1% 230 137 Televisions - LCD 0.2% 0.4% 343 551
#2 HDPE Plastic Colored Bottles 0.3% 0.1% 463 106 Televisions - CRT 0.0% 0.0% 0 0
#3 PVC Plastic Packaging 0.0% 0.0% 9 12 Television Peripherals 0.0% 0.0% 0 0
#4 LDPE Plastic Packaging 0.0% 0.0% 6 9 Computer Monitors - CRT 0.0% 0.0% 0 0
#5 PP Plastic Packaging 1.8% 0.4% 2,591 512 Computer Monitors - LCD 0.0% 0.0% 0 0
#6 PS Plastic Packaging 0.3% 0.1% 381 88 Computers 0.0% 0.0% 0 0
#7 Other/Unknown Plastic Packaging 0.6% 0.1% 898 210 Computer Peripherals 0.0% 0.0% 0 0
Expanded Polystyrene Packaging 1.1% 0.3% 1,502 440 Computer Printers 0.0% 0.0% 0 0
PLA Compostable Packaging 0.0% 0.0% 9 7 Audio Equipment 0.0% 0.0% 0 0
Plastic Merchandise Bags 0.9% 0.1% 1,330 178 Electronic Gaming Equipment 0.0% 0.0% 0 0
Packaging Film Plastic 4.4% 0.5% 6,240 697 Other Consumer Electronics 0.0% 0.0% 0 0
Transportation Packaging Film Plastic 0.0% 0.0% 64 37 Textiles- Organic 2.4% 0.7% 3,378 1,051
Flexible Plastic Packaging 0.2% 0.1% 258 77 Textiles- Synthetic/Mixed/Unknown 0.8% 0.4% 1,150 578
R/C Plastic Packaging 0.0% 0.0% 1 2 Shoes/Purses/Belts 0.2% 0.2% 291 257
PLASTIC PRODUCTS 4.6% 0.8% 6,455 1,099 Tires & Other Rubber 0.2% 0.1% 233 205
#1 PETE Plastic Products 0.0% 0.0% 0 0 Furniture 0.0% 0.0% 0 0
#2 HDPE Plastic Products: 0.0% 0.0% 0 0 Mattresses 0.0% 0.0% 0 0
#3 PVC Plastic Products 0.0% 0.0% 0 0 R/C Consumer Products 0.0% 0.0% 0 0
#4 LDPE Plastic Products 0.0% 0.0% 0 0 HAZARDOUS AND SPECIAL WASTES 0.6% 0.2% 870 236
#5 PP Plastic Products 0.0% 0.0% 0 0 Pesticides 0.0% 0.0% 1 2
#6 PS Plastic Products 0.0% 0.0% 55 25 HID/UV/Germicidal Lamps 0.0% 0.0% 0 0
#7 Other/Unknown Plastic Products 1.1% 0.3% 1,599 401 Compact Florescent Lamps 0.0% 0.0% 2 4
PLA Compostable Products 0.0% 0.0% 7 9 Florescent Tubes 0.0% 0.0% 0 0
Plastic Garbage Bags 2.3% 0.3% 3,186 480 Water-based Paint 0.0% 0.0% 0 0
Plastic Non-bag Film Products 0.1% 0.1% 182 170 Solvent-based Adhesives/Glues 0.0% 0.0% 0 0
Bulky Rigid Plastic Products 0.7% 0.6% 960 838 Water-based Adhesives/Glues 0.0% 0.0% 28 40
R/C Plastic Products 0.3% 0.1% 467 176 Oil-based Paint 0.0% 0.0% 0 0
GLASS 2.4% 0.6% 3,390 786 Lacquer/Varnish/Urethane Coatings/Stains 0.0% 0.0% 0 0
Clear Glass Containers 1.4% 0.3% 1,930 412 Field & Lawn Markings 0.0% 0.0% 0 0
Green Glass Containers 0.5% 0.3% 704 373 Primers/Sealings/Coatings 0.0% 0.1% 48 78
Brown/Other Colored Glass Containers 0.2% 0.1% 271 134 Water Repellents & Waterproofers 0.0% 0.0% 0 0
Plate Glass 0.0% 0.0% 0 0 Solvents 0.0% 0.0% 0 0
Non-glass Ceramics 0.3% 0.4% 408 516 Caustic Cleaners 0.0% 0.0% 54 59
R/C Glass 0.1% 0.1% 77 78 Dry-cell Batteries- Single Use 0.0% 0.0% 47 30
METAL 3.7% 0.5% 5,143 722 Dry-cell Batteries- Rechargeable 0.0% 0.0% 0 0
Aluminum Beverage Cans 0.5% 0.1% 769 198 Wet-cell Batteries 0.0% 0.0% 0 0
Aluminum Foil/Containers 0.3% 0.1% 467 114 Gasoline/Kerosene 0.0% 0.0% 0 0
Other Aluminum 0.0% 0.0% 37 41 Motor Oil 0.0% 0.0% 0 0
Other Non-ferrous Metal 0.1% 0.2% 198 222 Antifreeze 0.0% 0.0% 0 0
Food Cans - Tinned 1.1% 0.3% 1,612 397 Other Vehicle Fluids 0.0% 0.0% 0 0
Food Cans - Coated 0.1% 0.1% 193 152 Oil Filters 0.0% 0.0% 21 33
White Goods 0.0% 0.0% 0 0 Explosives 0.0% 0.0% 0 0
Other Ferrous Metal 0.8% 0.3% 1,117 410 Medical Wastes 0.1% 0.0% 192 47
R/C Metal 0.5% 0.3% 750 464 Sharps 0.0% 0.0% 8 10
ORGANICS 34.5% 2.9% 48,338 4,017 Pharmaceuticals & Vitamins 0.1% 0.1% 113 150
Edible Food Waste- Vegetative 13.0% 1.9% 18,267 2,721 Other Cleaners/Chemicals 0.0% 0.0% 0 0
Inedible Food Waste- Vegetative 8.8% 1.6% 12,372 2,182 Personal Care Products 0.2% 0.1% 290 139
Edible Food Waste- Meats/Fats/Oils 2.5% 0.7% 3,510 955 Other Potentially Hazardous Wastes 0.0% 0.0% 66 52
Inedible Food Waste- Meats/Fats/Oils 0.6% 0.2% 817 261 RESIDUALS 10.9% 1.9% 15,224 2,678
Yard/Garden Waste- Leaves and Grass 0.8% 1.2% 1,155 1,613 Disposable Diapers 8.5% 2.1% 11,964 2,994
Yard/Garden Waste- Prunings 1.5% 1.4% 2,147 2,033 Ash 0.0% 0.0% 0 0
Animal Manure 6.2% 1.9% 8,647 2,687 Dust 0.0% 0.0% 0 0
Animal Carcasses & Offal 0.0% 0.0% 0 0 Fines/Sorting Residues 2.3% 0.8% 3,259 1,102
Food Processing Wastes 0.0% 0.0% 0 0 Sludges & Other Special Industrial Wastes 0.0% 0.0% 0 0
R/C Organics 1.0% 0.5% 1,424 713
Estimated Origin Specified Disposed Tons 100% 140,246
Sample Count 24
Confidence intervals calculated at the 90% confidence level. Percentages for material types may not
total 100% due to rounding.

2020-2021 Washington Statewide Waste Characterization Study
Draft Report
June 2021 | 93
Table 43: Southwest WGA Self-hauled Disposed Waste Sector, Detailed Composition, 2020-2021
Material
Est.
Percent + / - Est. Tons Tons + / - Material
Est.
Percent + / - Est. Tons Tons + / -
PAPER 6.7% 2.4% 5,774 2,075 WOOD DEBRIS 37.3% 8.4% 32,141 7,199
PAPER PACKAGING 4.6% 1.7% 3,950 1,447 Natural Wood 0.0% 0.0% 9 14
Newspaper Packaging 0.0% 0.0% 0 0 Treated Wood 0.5% 0.6% 450 504
Cardboard & Kraft Packaging 3.4% 1.4% 2,892 1,222 Painted Wood 12.4% 4.8% 10,673 4,113
Mixed/Low-grade Paper Packaging 0.5% 0.3% 401 277 Dimensional Lumber 6.4% 4.3% 5,534 3,718
Aseptic Containers 0.0% 0.0% 36 29 Engineered Wood 7.5% 4.2% 6,473 3,602
Gable Top Containers 0.0% 0.0% 23 25 Pallets & Crates 2.8% 3.9% 2,425 3,334
Other Polycoated Packaging 0.0% 0.0% 7 11 Other Untreated Wood 0.1% 0.1% 43 66
Compostable Paper Packaging 0.3% 0.3% 257 297 Wood By-products 0.0% 0.0% 0 0
R/C Paper Packaging 0.4% 0.3% 334 291 R/C Wood Debris 7.6% 4.0% 6,533 3,443
PAPER PRODUCTS 2.1% 1.4% 1,825 1,216 CONSTRUCTION MATERIALS 13.4% 6.5% 11,540 5,629
Newspaper Products 0.1% 0.1% 53 58 Plastic Lumber 0.1% 0.1% 62 63
Cardboard & Kraft Paper Products 0.0% 0.0% 3 5 Insulation 0.2% 0.3% 174 230
Magazines 0.0% 0.0% 38 31 Asphalt Paving 0.0% 0.0% 0 0
High-Grade Paper Products 0.1% 0.1% 56 64 Concrete 0.5% 0.8% 435 705
Other Groundwood Paper Products 0.0% 0.0% 0 0 Drywall 0.6% 0.9% 512 748
Mixed/Low-grade Paper Products 0.9% 0.8% 760 664 Carpet 1.0% 0.9% 858 739
Compostable Paper Products 1.0% 0.8% 838 660 Carpet Padding 0.0% 0.0% 0 0
R/C Paper Products 0.1% 0.1% 77 67 Soil, Rocks, & Sand 4.0% 4.4% 3,446 3,784
PLASTIC 8.6% 2.6% 7,418 2,254 Asphalt Roofing 3.3% 4.8% 2,860 4,119
PLASTIC PACKAGING 3.3% 1.6% 2,825 1,357 Plastic Floor Covering 0.0% 0.0% 0 0
#1 PETE Plastic Bottles 0.2% 0.1% 146 100 Ceramics & Brick 0.3% 0.4% 295 321
#1 PETE Plastic Non-bottles 0.2% 0.1% 137 99 R/C Construction Materials 3.4% 3.0% 2,899 2,569
#2 HDPE Plastic Natural Bottles 0.1% 0.1% 51 49 CONSUMER PRODUCTS 20.3% 7.8% 17,490 6,683
#2 HDPE Plastic Jars and Tubs 1.0% 1.3% 856 1,121 Televisions - LCD 0.6% 1.0% 536 867
#2 HDPE Plastic Colored Bottles 0.1% 0.0% 50 34 Televisions - CRT 0.0% 0.0% 0 0
#3 PVC Plastic Packaging 0.0% 0.0% 0 0 Television Peripherals 0.0% 0.0% 0 0
#4 LDPE Plastic Packaging 0.0% 0.0% 0 0 Computer Monitors - CRT 0.0% 0.0% 0 0
#5 PP Plastic Packaging 0.1% 0.1% 107 65 Computer Monitors - LCD 0.0% 0.0% 0 0
#6 PS Plastic Packaging 0.0% 0.0% 13 7 Computers 0.4% 0.6% 307 497
#7 Other/Unknown Plastic Packaging 0.1% 0.0% 56 30 Computer Peripherals 0.0% 0.0% 0 0
Expanded Polystyrene Packaging 0.6% 0.4% 504 362 Computer Printers 0.2% 0.3% 180 292
PLA Compostable Packaging 0.0% 0.0% 3 4 Audio Equipment 0.0% 0.0% 0 0
Plastic Merchandise Bags 0.1% 0.0% 67 39 Electronic Gaming Equipment 0.0% 0.0% 0 0
Packaging Film Plastic 0.4% 0.2% 333 210 Other Consumer Electronics 0.0% 0.0% 0 0
Transportation Packaging Film Plastic 0.6% 0.7% 480 609 Textiles- Organic 0.6% 0.3% 532 259
Flexible Plastic Packaging 0.0% 0.0% 22 18 Textiles- Synthetic/Mixed/Unknown 1.2% 0.7% 1,017 602
R/C Plastic Packaging 0.0% 0.0% 0 0 Shoes/Purses/Belts 0.0% 0.0% 38 39
PLASTIC PRODUCTS 5.3% 2.2% 4,594 1,909 Tires & Other Rubber 0.4% 0.7% 370 574
#1 PETE Plastic Products 0.0% 0.0% 0 0 Furniture 14.7% 7.2% 12,640 6,178
#2 HDPE Plastic Products: 0.0% 0.0% 0 0 Mattresses 2.2% 2.8% 1,870 2,385
#3 PVC Plastic Products 0.0% 0.0% 0 0 R/C Consumer Products 0.0% 0.0% 0 0
#4 LDPE Plastic Products 0.0% 0.0% 0 0 HAZARDOUS AND SPECIAL WASTES 0.1% 0.1% 107 63
#5 PP Plastic Products 0.0% 0.0% 10 16 Pesticides 0.0% 0.0% 0 0
#6 PS Plastic Products 0.0% 0.0% 5 7 HID/UV/Germicidal Lamps 0.0% 0.0% 0 0
#7 Other/Unknown Plastic Products 0.5% 0.3% 403 245 Compact Florescent Lamps 0.0% 0.0% 9 15
PLA Compostable Products 0.0% 0.0% 1 1 Florescent Tubes 0.0% 0.0% 0 0
Plastic Garbage Bags 0.3% 0.2% 238 151 Water-based Paint 0.0% 0.0% 0 0
Plastic Non-bag Film Products 0.1% 0.1% 55 61 Solvent-based Adhesives/Glues 0.0% 0.0% 0 0
Bulky Rigid Plastic Products 3.1% 1.5% 2,663 1,263 Water-based Adhesives/Glues 0.0% 0.0% 12 20
R/C Plastic Products 1.4% 1.0% 1,219 867 Oil-based Paint 0.0% 0.0% 0 0
GLASS 1.4% 0.7% 1,203 599 Lacquer/Varnish/Urethane Coatings/Stains 0.0% 0.0% 0 0
Clear Glass Containers 0.4% 0.4% 346 316 Field & Lawn Markings 0.0% 0.0% 0 0
Green Glass Containers 0.2% 0.2% 136 133 Primers/Sealings/Coatings 0.0% 0.0% 0 0
Brown/Other Colored Glass Containers 0.2% 0.2% 137 153 Water Repellents & Waterproofers 0.0% 0.0% 0 0
Plate Glass 0.2% 0.2% 158 164 Solvents 0.0% 0.0% 0 0
Non-glass Ceramics 0.2% 0.1% 157 114 Caustic Cleaners 0.0% 0.0% 15 25
R/C Glass 0.3% 0.3% 268 297 Dry-cell Batteries- Single Use 0.0% 0.0% 36 40
METAL 7.9% 3.5% 6,839 3,022 Dry-cell Batteries- Rechargeable 0.0% 0.0% 0 0
Aluminum Beverage Cans 0.2% 0.1% 170 123 Wet-cell Batteries 0.0% 0.0% 0 0
Aluminum Foil/Containers 0.1% 0.1% 68 56 Gasoline/Kerosene 0.0% 0.0% 0 0
Other Aluminum 0.4% 0.2% 340 175 Motor Oil 0.0% 0.0% 0 0
Other Non-ferrous Metal 0.1% 0.1% 90 78 Antifreeze 0.0% 0.0% 0 0
Food Cans - Tinned 0.1% 0.0% 57 38 Other Vehicle Fluids 0.0% 0.0% 0 0
Food Cans - Coated 0.0% 0.0% 0 0 Oil Filters 0.0% 0.0% 0 0
White Goods 1.2% 1.4% 1,051 1,166 Explosives 0.0% 0.0% 0 0
Other Ferrous Metal 1.6% 1.1% 1,411 965 Medical Wastes 0.0% 0.0% 6 8
R/C Metal 4.2% 2.7% 3,654 2,317 Sharps 0.0% 0.0% 0 0
ORGANICS 3.6% 2.6% 3,092 2,254 Pharmaceuticals & Vitamins 0.0% 0.0% 6 5
Edible Food Waste- Vegetative 0.8% 0.9% 714 810 Other Cleaners/Chemicals 0.0% 0.0% 0 0
Inedible Food Waste- Vegetative 1.4% 1.0% 1,178 885 Personal Care Products 0.0% 0.0% 18 29
Edible Food Waste- Meats/Fats/Oils 0.6% 0.6% 487 489 Other Potentially Hazardous Wastes 0.0% 0.0% 4 4
Inedible Food Waste- Meats/Fats/Oils 0.1% 0.1% 97 101 RESIDUALS 0.5% 0.4% 454 341
Yard/Garden Waste- Leaves and Grass 0.3% 0.3% 251 267 Disposable Diapers 0.2% 0.2% 154 160
Yard/Garden Waste- Prunings 0.1% 0.1% 50 53 Ash 0.0% 0.0% 0 0
Animal Manure 0.2% 0.3% 183 252 Dust 0.0% 0.1% 40 45
Animal Carcasses & Offal 0.0% 0.0% 0 0 Fines/Sorting Residues 0.3% 0.2% 260 193
Food Processing Wastes 0.0% 0.0% 0 0 Sludges & Other Special Industrial Wastes 0.0% 0.0% 0 0
R/C Organics 0.2% 0.2% 132 155
Estimated Origin Specified Disposed Tons 100% 86,059
Sample Count 32Confidence intervals calculated at the 90% confidence level. Percentages for material types may not
total 100% due to rounding.

2020-2021 Washington Statewide Waste Characterization Study
Final Report
August 2021 | 94
West Waste Generation Area Composition Tables

2020-2021 Washington Statewide Waste Characterization Study
Draft Report
June 2021 | 95
Table 44: West WGA Overall Disposed Waste Stream, Detailed Composition, 2020-2021
Material
Est.
Percent + / - Est. Tons Tons + / - Material
Est.
Percent + / - Est. Tons Tons + / -
PAPER 17.9% 1.8% 33,348 3,371 WOOD DEBRIS 13.2% 3.0% 24,680 5,670
PAPER PACKAGING 9.5% 1.4% 17,726 2,550 Natural Wood 0.2% 0.1% 282 276
Newspaper Packaging 0.0% 0.0% 4 6 Treated Wood 1.4% 1.0% 2,682 1,883
Cardboard & Kraft Packaging 4.6% 1.2% 8,521 2,320 Painted Wood 3.5% 1.5% 6,500 2,706
Mixed/Low-grade Paper Packaging 1.5% 0.3% 2,791 497 Dimensional Lumber 2.3% 0.9% 4,282 1,671
Aseptic Containers 0.2% 0.1% 390 133 Engineered Wood 1.4% 0.7% 2,706 1,247
Gable Top Containers 0.3% 0.1% 478 144 Pallets & Crates 1.7% 1.2% 3,265 2,192
Other Polycoated Packaging 0.0% 0.0% 65 30 Other Untreated Wood 0.0% 0.0% 24 17
Compostable Paper Packaging 2.4% 0.6% 4,463 1,105 Wood By-products 1.7% 1.6% 3,171 2,925
R/C Paper Packaging 0.5% 0.1% 1,014 189 R/C Wood Debris 0.9% 0.4% 1,767 797
PAPER PRODUCTS 8.4% 1.1% 15,622 2,114 CONSTRUCTION MATERIALS 5.5% 2.1% 10,276 3,949
Newspaper Products 0.4% 0.3% 737 471 Plastic Lumber 0.0% 0.0% 10 11
Cardboard & Kraft Paper Products 0.0% 0.0% 0 0 Insulation 0.1% 0.1% 106 138
Magazines 0.3% 0.2% 581 352 Asphalt Paving 0.0% 0.0% 0 0
High-Grade Paper Products 0.3% 0.1% 564 240 Concrete 0.5% 0.5% 969 979
Other Groundwood Paper Products 0.0% 0.0% 13 22 Drywall 0.8% 1.2% 1,586 2,212
Mixed/Low-grade Paper Products 2.0% 0.5% 3,755 1,003 Carpet 1.2% 0.8% 2,284 1,466
Compostable Paper Products 4.5% 0.7% 8,443 1,258 Carpet Padding 0.3% 0.5% 609 872
R/C Paper Products 0.8% 0.3% 1,528 522 Soil, Rocks, & Sand 0.2% 0.1% 350 195
PLASTIC 15.5% 2.1% 28,933 3,842 Asphalt Roofing 1.0% 1.2% 1,952 2,185
PLASTIC PACKAGING 9.1% 1.2% 16,994 2,299 Plastic Floor Covering 0.2% 0.3% 294 475
#1 PETE Plastic Bottles 0.7% 0.1% 1,234 202 Ceramics & Brick 0.8% 0.6% 1,494 1,064
#1 PETE Plastic Non-bottles 0.6% 0.1% 1,155 205 R/C Construction Materials 0.3% 0.3% 619 485
#2 HDPE Plastic Natural Bottles 0.3% 0.1% 468 194 CONSUMER PRODUCTS 6.5% 1.5% 12,160 2,794
#2 HDPE Plastic Jars and Tubs 0.2% 0.1% 406 116 Televisions - LCD 0.0% 0.0% 0 0
#2 HDPE Plastic Colored Bottles 0.2% 0.1% 424 105 Televisions - CRT 0.0% 0.0% 0 0
#3 PVC Plastic Packaging 0.0% 0.0% 2 3 Television Peripherals 0.0% 0.0% 0 0
#4 LDPE Plastic Packaging 0.0% 0.0% 2 2 Computer Monitors - CRT 0.0% 0.0% 0 0
#5 PP Plastic Packaging 1.1% 0.2% 2,040 437 Computer Monitors - LCD 0.0% 0.0% 0 0
#6 PS Plastic Packaging 0.1% 0.0% 208 50 Computers 0.0% 0.0% 0 0
#7 Other/Unknown Plastic Packaging 0.5% 0.2% 890 293 Computer Peripherals 0.0% 0.0% 11 18
Expanded Polystyrene Packaging 0.4% 0.1% 830 162 Computer Printers 0.0% 0.0% 0 0
PLA Compostable Packaging 0.0% 0.0% 48 21 Audio Equipment 0.0% 0.0% 0 0
Plastic Merchandise Bags 0.4% 0.1% 729 128 Electronic Gaming Equipment 0.0% 0.0% 0 0
Packaging Film Plastic 3.1% 0.5% 5,756 977 Other Consumer Electronics 0.2% 0.2% 370 305
Transportation Packaging Film Plastic 1.3% 1.0% 2,457 1,948 Textiles- Organic 2.7% 0.8% 4,960 1,471
Flexible Plastic Packaging 0.1% 0.1% 265 99 Textiles- Synthetic/Mixed/Unknown 1.1% 0.4% 2,139 730
R/C Plastic Packaging 0.0% 0.0% 80 76 Shoes/Purses/Belts 0.2% 0.1% 346 163
PLASTIC PRODUCTS 6.4% 1.8% 11,939 3,384 Tires & Other Rubber 0.7% 0.5% 1,289 956
#1 PETE Plastic Products 0.0% 0.0% 7 9 Furniture 1.2% 1.0% 2,271 1,948
#2 HDPE Plastic Products: 0.0% 0.0% 0 0 Mattresses 0.4% 0.5% 774 883
#3 PVC Plastic Products 0.0% 0.0% 27 44 R/C Consumer Products 0.0% 0.0% 0 0
#4 LDPE Plastic Products 0.0% 0.0% 1 2 HAZARDOUS AND SPECIAL WASTES 2.5% 1.9% 4,632 3,474
#5 PP Plastic Products 0.0% 0.0% 15 10 Pesticides 0.0% 0.0% 13 20
#6 PS Plastic Products 0.0% 0.0% 81 30 HID/UV/Germicidal Lamps 0.0% 0.0% 6 7
#7 Other/Unknown Plastic Products 2.1% 1.6% 3,888 2,899 Compact Florescent Lamps 0.0% 0.0% 10 9
PLA Compostable Products 0.0% 0.0% 14 11 Florescent Tubes 0.0% 0.0% 0 0
Plastic Garbage Bags 1.7% 0.3% 3,105 494 Water-based Paint 0.1% 0.1% 168 133
Plastic Non-bag Film Products 1.0% 1.0% 1,846 1,781 Solvent-based Adhesives/Glues 0.0% 0.0% 0 0
Bulky Rigid Plastic Products 0.8% 0.3% 1,426 604 Water-based Adhesives/Glues 0.0% 0.0% 17 19
R/C Plastic Products 0.8% 0.3% 1,529 560 Oil-based Paint 0.0% 0.0% 0 0
GLASS 1.6% 0.4% 3,028 811 Lacquer/Varnish/Urethane Coatings/Stains 0.0% 0.0% 0 0
Clear Glass Containers 0.7% 0.2% 1,297 379 Field & Lawn Markings 0.0% 0.0% 0 0
Green Glass Containers 0.1% 0.1% 233 106 Primers/Sealings/Coatings 0.0% 0.0% 23 37
Brown/Other Colored Glass Containers 0.4% 0.2% 691 330 Water Repellents & Waterproofers 0.0% 0.0% 0 0
Plate Glass 0.0% 0.1% 92 106 Solvents 0.0% 0.0% 0 0
Non-glass Ceramics 0.2% 0.2% 430 291 Caustic Cleaners 0.0% 0.0% 42 63
R/C Glass 0.2% 0.1% 285 196 Dry-cell Batteries- Single Use 0.0% 0.0% 54 31
METAL 6.9% 1.9% 12,944 3,496 Dry-cell Batteries- Rechargeable 0.0% 0.0% 0 0
Aluminum Beverage Cans 0.4% 0.1% 724 175 Wet-cell Batteries 0.0% 0.0% 0 0
Aluminum Foil/Containers 0.2% 0.1% 431 106 Gasoline/Kerosene 0.0% 0.0% 0 0
Other Aluminum 0.1% 0.2% 268 371 Motor Oil 0.0% 0.0% 47 77
Other Non-ferrous Metal 0.2% 0.1% 308 189 Antifreeze 0.0% 0.0% 0 0
Food Cans - Tinned 0.5% 0.1% 968 221 Other Vehicle Fluids 0.0% 0.0% 0 0
Food Cans - Coated 0.0% 0.0% 33 22 Oil Filters 0.0% 0.0% 53 57
White Goods 0.3% 0.4% 648 801 Explosives 0.0% 0.0% 0 0
Other Ferrous Metal 2.3% 0.7% 4,284 1,256 Medical Wastes 2.0% 1.9% 3,747 3,469
R/C Metal 2.8% 1.4% 5,281 2,568 Sharps 0.0% 0.0% 12 17
ORGANICS 25.2% 3.1% 47,022 5,714 Pharmaceuticals & Vitamins 0.0% 0.0% 75 60
Edible Food Waste- Vegetative 8.3% 1.6% 15,407 2,932 Other Cleaners/Chemicals 0.0% 0.0% 26 42
Inedible Food Waste- Vegetative 4.5% 0.7% 8,327 1,358 Personal Care Products 0.1% 0.1% 212 195
Edible Food Waste- Meats/Fats/Oils 3.4% 1.5% 6,389 2,878 Other Potentially Hazardous Wastes 0.1% 0.1% 127 107
Inedible Food Waste- Meats/Fats/Oils 0.3% 0.1% 509 131 RESIDUALS 5.1% 1.6% 9,602 2,894
Yard/Garden Waste- Leaves and Grass 1.8% 0.8% 3,415 1,475 Disposable Diapers 4.1% 1.5% 7,625 2,843
Yard/Garden Waste- Prunings 2.6% 1.8% 4,893 3,281 Ash 0.1% 0.1% 96 156
Animal Manure 4.1% 1.5% 7,667 2,781 Dust 0.0% 0.0% 21 24
Animal Carcasses & Offal 0.0% 0.0% 1 1 Fines/Sorting Residues 1.0% 0.3% 1,860 532
Food Processing Wastes 0.0% 0.0% 0 0 Sludges & Other Special Industrial Wastes 0.0% 0.0% 0 0
R/C Organics 0.2% 0.1% 414 125
Estimated Origin Specified Disposed Tons 100% 186,626
Sample Count 104Confidence intervals calculated at the 90% confidence level. Percentages for material types may not
total 100% due to rounding.

2020-2021 Washington Statewide Waste Characterization Study
Draft Report
June 2021 | 96
Table 45: West WGA Commercial Disposed Waste Sector, Detailed Composition, 2020-2021
Material
Est.
Percent + / - Est. Tons Tons + / - Material
Est.
Percent + / - Est. Tons Tons + / -
PAPER 21.5% 3.3% 18,822 2,869 WOOD DEBRIS 10.9% 4.8% 9,527 4,216
PAPER PACKAGING 12.8% 2.5% 11,175 2,192 Natural Wood 0.1% 0.1% 54 86
Newspaper Packaging 0.0% 0.0% 0 0 Treated Wood 0.6% 0.6% 503 545
Cardboard & Kraft Packaging 6.5% 2.4% 5,704 2,067 Painted Wood 1.4% 1.4% 1,224 1,263
Mixed/Low-grade Paper Packaging 1.7% 0.5% 1,486 396 Dimensional Lumber 1.8% 1.5% 1,540 1,316
Aseptic Containers 0.1% 0.1% 126 54 Engineered Wood 1.5% 1.1% 1,323 1,003
Gable Top Containers 0.2% 0.1% 176 81 Pallets & Crates 2.5% 1.9% 2,162 1,640
Other Polycoated Packaging 0.0% 0.0% 16 12 Other Untreated Wood 0.0% 0.0% 10 8
Compostable Paper Packaging 3.7% 1.2% 3,211 1,086 Wood By-products 2.8% 3.2% 2,465 2,822
R/C Paper Packaging 0.5% 0.2% 456 145 R/C Wood Debris 0.3% 0.2% 246 161
PAPER PRODUCTS 8.7% 2.0% 7,647 1,736 CONSTRUCTION MATERIALS 2.4% 2.5% 2,064 2,153
Newspaper Products 0.2% 0.1% 162 84 Plastic Lumber 0.0% 0.0% 10 11
Cardboard & Kraft Paper Products 0.0% 0.0% 0 0 Insulation 0.0% 0.0% 0 0
Magazines 0.4% 0.3% 313 285 Asphalt Paving 0.0% 0.0% 0 0
High-Grade Paper Products 0.4% 0.3% 390 226 Concrete 0.0% 0.0% 24 39
Other Groundwood Paper Products 0.0% 0.0% 13 22 Drywall 0.2% 0.3% 187 300
Mixed/Low-grade Paper Products 1.8% 0.8% 1,578 740 Carpet 0.9% 1.0% 762 875
Compostable Paper Products 4.8% 1.3% 4,173 1,138 Carpet Padding 0.6% 1.0% 533 866
R/C Paper Products 1.2% 0.5% 1,018 451 Soil, Rocks, & Sand 0.1% 0.1% 119 101
PLASTIC 17.6% 3.8% 15,377 3,311 Asphalt Roofing 0.0% 0.0% 12 19
PLASTIC PACKAGING 11.0% 2.5% 9,593 2,146 Plastic Floor Covering 0.0% 0.0% 0 0
#1 PETE Plastic Bottles 0.7% 0.2% 585 166 Ceramics & Brick 0.1% 0.1% 75 92
#1 PETE Plastic Non-bottles 0.6% 0.2% 488 160 R/C Construction Materials 0.4% 0.5% 340 438
#2 HDPE Plastic Natural Bottles 0.2% 0.1% 211 74 CONSUMER PRODUCTS 3.8% 1.5% 3,346 1,323
#2 HDPE Plastic Jars and Tubs 0.3% 0.1% 227 87 Televisions - LCD 0.0% 0.0% 0 0
#2 HDPE Plastic Colored Bottles 0.2% 0.1% 179 55 Televisions - CRT 0.0% 0.0% 0 0
#3 PVC Plastic Packaging 0.0% 0.0% 2 3 Television Peripherals 0.0% 0.0% 0 0
#4 LDPE Plastic Packaging 0.0% 0.0% 1 2 Computer Monitors - CRT 0.0% 0.0% 0 0
#5 PP Plastic Packaging 1.4% 0.5% 1,192 410 Computer Monitors - LCD 0.0% 0.0% 0 0
#6 PS Plastic Packaging 0.1% 0.0% 112 42 Computers 0.0% 0.0% 0 0
#7 Other/Unknown Plastic Packaging 0.6% 0.3% 496 285 Computer Peripherals 0.0% 0.0% 0 0
Expanded Polystyrene Packaging 0.4% 0.1% 317 98 Computer Printers 0.0% 0.0% 0 0
PLA Compostable Packaging 0.0% 0.0% 34 18 Audio Equipment 0.0% 0.0% 0 0
Plastic Merchandise Bags 0.3% 0.1% 268 91 Electronic Gaming Equipment 0.0% 0.0% 0 0
Packaging Film Plastic 3.5% 1.0% 3,063 906 Other Consumer Electronics 0.0% 0.0% 4 6
Transportation Packaging Film Plastic 2.5% 2.2% 2,221 1,944 Textiles- Organic 1.3% 0.5% 1,101 478
Flexible Plastic Packaging 0.2% 0.1% 136 92 Textiles- Synthetic/Mixed/Unknown 0.9% 0.5% 812 474
R/C Plastic Packaging 0.1% 0.1% 60 69 Shoes/Purses/Belts 0.1% 0.1% 61 72
PLASTIC PRODUCTS 6.6% 3.3% 5,783 2,878 Tires & Other Rubber 1.1% 1.1% 981 931
#1 PETE Plastic Products 0.0% 0.0% 5 9 Furniture 0.4% 0.6% 388 492
#2 HDPE Plastic Products: 0.0% 0.0% 0 0 Mattresses 0.0% 0.0% 0 0
#3 PVC Plastic Products 0.0% 0.0% 0 0 R/C Consumer Products 0.0% 0.0% 0 0
#4 LDPE Plastic Products 0.0% 0.0% 1 2 HAZARDOUS AND SPECIAL WASTES 4.6% 4.0% 3,986 3,461
#5 PP Plastic Products 0.0% 0.0% 5 5 Pesticides 0.0% 0.0% 0 0
#6 PS Plastic Products 0.1% 0.0% 55 24 HID/UV/Germicidal Lamps 0.0% 0.0% 4 6
#7 Other/Unknown Plastic Products 3.0% 3.3% 2,637 2,861 Compact Florescent Lamps 0.0% 0.0% 3 5
PLA Compostable Products 0.0% 0.0% 10 8 Florescent Tubes 0.0% 0.0% 0 0
Plastic Garbage Bags 1.6% 0.4% 1,389 365 Water-based Paint 0.1% 0.1% 61 83
Plastic Non-bag Film Products 0.7% 0.7% 655 632 Solvent-based Adhesives/Glues 0.0% 0.0% 0 0
Bulky Rigid Plastic Products 0.8% 0.6% 719 500 Water-based Adhesives/Glues 0.0% 0.0% 0 0
R/C Plastic Products 0.4% 0.3% 308 295 Oil-based Paint 0.0% 0.0% 0 0
GLASS 1.3% 0.6% 1,171 512 Lacquer/Varnish/Urethane Coatings/Stains 0.0% 0.0% 0 0
Clear Glass Containers 0.5% 0.2% 439 216 Field & Lawn Markings 0.0% 0.0% 0 0
Green Glass Containers 0.2% 0.1% 150 82 Primers/Sealings/Coatings 0.0% 0.0% 0 0
Brown/Other Colored Glass Containers 0.4% 0.3% 352 236 Water Repellents & Waterproofers 0.0% 0.0% 0 0
Plate Glass 0.0% 0.0% 17 27 Solvents 0.0% 0.0% 0 0
Non-glass Ceramics 0.1% 0.1% 110 110 Caustic Cleaners 0.0% 0.0% 2 4
R/C Glass 0.1% 0.2% 103 138 Dry-cell Batteries- Single Use 0.0% 0.0% 22 15
METAL 6.5% 3.0% 5,646 2,597 Dry-cell Batteries- Rechargeable 0.0% 0.0% 0 0
Aluminum Beverage Cans 0.5% 0.2% 423 153 Wet-cell Batteries 0.0% 0.0% 0 0
Aluminum Foil/Containers 0.2% 0.1% 136 54 Gasoline/Kerosene 0.0% 0.0% 0 0
Other Aluminum 0.3% 0.4% 229 370 Motor Oil 0.1% 0.1% 47 77
Other Non-ferrous Metal 0.1% 0.0% 59 40 Antifreeze 0.0% 0.0% 0 0
Food Cans - Tinned 0.5% 0.2% 398 194 Other Vehicle Fluids 0.0% 0.0% 0 0
Food Cans - Coated 0.0% 0.0% 0 0 Oil Filters 0.1% 0.1% 53 57
White Goods 0.0% 0.0% 0 0 Explosives 0.0% 0.0% 0 0
Other Ferrous Metal 2.2% 1.1% 1,966 968 Medical Wastes 4.2% 4.0% 3,641 3,469
R/C Metal 2.8% 1.8% 2,436 1,575 Sharps 0.0% 0.0% 1 2
ORGANICS 26.9% 5.3% 23,505 4,671 Pharmaceuticals & Vitamins 0.0% 0.0% 3 5
Edible Food Waste- Vegetative 10.3% 3.0% 8,975 2,630 Other Cleaners/Chemicals 0.0% 0.0% 0 0
Inedible Food Waste- Vegetative 3.1% 0.9% 2,704 816 Personal Care Products 0.1% 0.2% 110 166
Edible Food Waste- Meats/Fats/Oils 5.3% 3.2% 4,656 2,831 Other Potentially Hazardous Wastes 0.0% 0.0% 37 31
Inedible Food Waste- Meats/Fats/Oils 0.1% 0.1% 112 47 RESIDUALS 4.6% 3.1% 4,066 2,698
Yard/Garden Waste- Leaves and Grass 1.1% 0.8% 996 711 Disposable Diapers 3.7% 3.0% 3,224 2,662
Yard/Garden Waste- Prunings 4.9% 3.7% 4,298 3,244 Ash 0.1% 0.2% 96 156
Animal Manure 1.8% 1.4% 1,544 1,223 Dust 0.0% 0.0% 0 0
Animal Carcasses & Offal 0.0% 0.0% 1 1 Fines/Sorting Residues 0.9% 0.5% 746 417
Food Processing Wastes 0.0% 0.0% 0 0 Sludges & Other Special Industrial Wastes 0.0% 0.0% 0 0
R/C Organics 0.2% 0.1% 219 114
Estimated Origin Specified Disposed Tons 100% 87,508
Sample Count 48
Confidence intervals calculated at the 90% confidence level. Percentages for material types may not
total 100% due to rounding.

2020-2021 Washington Statewide Waste Characterization Study
Draft Report
June 2021 | 97
Table 46: West WGA Residential Disposed Waste Sector, Detailed Composition, 2020-2021
Material
Est.
Percent + / - Est. Tons Tons + / - Material
Est.
Percent + / - Est. Tons Tons + / -
PAPER 20.3% 2.5% 11,878 1,463 WOOD DEBRIS 1.8% 0.9% 1,046 501
PAPER PACKAGING 8.1% 1.6% 4,766 946 Natural Wood 0.2% 0.4% 133 214
Newspaper Packaging 0.0% 0.0% 4 6 Treated Wood 0.0% 0.1% 28 31
Cardboard & Kraft Packaging 2.5% 1.0% 1,481 587 Painted Wood 0.2% 0.3% 126 171
Mixed/Low-grade Paper Packaging 2.0% 0.5% 1,162 288 Dimensional Lumber 0.2% 0.2% 91 117
Aseptic Containers 0.4% 0.2% 263 122 Engineered Wood 0.4% 0.4% 208 229
Gable Top Containers 0.5% 0.2% 278 117 Pallets & Crates 0.1% 0.2% 79 127
Other Polycoated Packaging 0.1% 0.0% 33 15 Other Untreated Wood 0.0% 0.0% 8 10
Compostable Paper Packaging 1.9% 0.3% 1,116 183 Wood By-products 0.0% 0.0% 7 10
R/C Paper Packaging 0.7% 0.2% 428 91 R/C Wood Debris 0.6% 0.4% 366 258
PAPER PRODUCTS 12.1% 2.0% 7,113 1,167 CONSTRUCTION MATERIALS 0.6% 0.4% 363 230
Newspaper Products 0.9% 0.8% 551 464 Plastic Lumber 0.0% 0.0% 0 0
Cardboard & Kraft Paper Products 0.0% 0.0% 0 0 Insulation 0.0% 0.0% 6 9
Magazines 0.4% 0.3% 247 203 Asphalt Paving 0.0% 0.0% 0 0
High-Grade Paper Products 0.3% 0.1% 166 79 Concrete 0.0% 0.0% 0 0
Other Groundwood Paper Products 0.0% 0.0% 0 0 Drywall 0.0% 0.0% 5 7
Mixed/Low-grade Paper Products 3.5% 1.1% 2,045 673 Carpet 0.3% 0.4% 190 223
Compostable Paper Products 6.7% 0.9% 3,899 501 Carpet Padding 0.1% 0.2% 76 99
R/C Paper Products 0.4% 0.3% 205 184 Soil, Rocks, & Sand 0.0% 0.0% 17 28
PLASTIC 16.6% 1.7% 9,719 1,002 Asphalt Roofing 0.0% 0.1% 24 39
PLASTIC PACKAGING 10.7% 1.1% 6,269 657 Plastic Floor Covering 0.0% 0.0% 0 0
#1 PETE Plastic Bottles 1.0% 0.2% 585 108 Ceramics & Brick 0.0% 0.0% 2 4
#1 PETE Plastic Non-bottles 1.0% 0.2% 600 125 R/C Construction Materials 0.1% 0.1% 43 59
#2 HDPE Plastic Natural Bottles 0.2% 0.1% 139 68 CONSUMER PRODUCTS 6.5% 2.3% 3,803 1,351
#2 HDPE Plastic Jars and Tubs 0.2% 0.1% 105 59 Televisions - LCD 0.0% 0.0% 0 0
#2 HDPE Plastic Colored Bottles 0.4% 0.2% 216 88 Televisions - CRT 0.0% 0.0% 0 0
#3 PVC Plastic Packaging 0.0% 0.0% 0 0 Television Peripherals 0.0% 0.0% 0 0
#4 LDPE Plastic Packaging 0.0% 0.0% 1 1 Computer Monitors - CRT 0.0% 0.0% 0 0
#5 PP Plastic Packaging 1.3% 0.2% 756 141 Computer Monitors - LCD 0.0% 0.0% 0 0
#6 PS Plastic Packaging 0.2% 0.0% 89 27 Computers 0.0% 0.0% 0 0
#7 Other/Unknown Plastic Packaging 0.6% 0.1% 354 68 Computer Peripherals 0.0% 0.0% 0 0
Expanded Polystyrene Packaging 0.5% 0.1% 309 71 Computer Printers 0.0% 0.0% 0 0
PLA Compostable Packaging 0.0% 0.0% 13 10 Audio Equipment 0.0% 0.0% 0 0
Plastic Merchandise Bags 0.7% 0.1% 411 85 Electronic Gaming Equipment 0.0% 0.0% 0 0
Packaging Film Plastic 4.0% 0.5% 2,362 312 Other Consumer Electronics 0.2% 0.3% 113 182
Transportation Packaging Film Plastic 0.3% 0.2% 195 122 Textiles- Organic 4.7% 2.1% 2,761 1,234
Flexible Plastic Packaging 0.2% 0.1% 114 34 Textiles- Synthetic/Mixed/Unknown 0.9% 0.6% 521 353
R/C Plastic Packaging 0.0% 0.1% 20 32 Shoes/Purses/Belts 0.3% 0.2% 201 123
PLASTIC PRODUCTS 5.9% 1.2% 3,450 697 Tires & Other Rubber 0.4% 0.3% 209 156
#1 PETE Plastic Products 0.0% 0.0% 0 0 Furniture 0.0% 0.0% 0 0
#2 HDPE Plastic Products: 0.0% 0.0% 0 0 Mattresses 0.0% 0.0% 0 0
#3 PVC Plastic Products 0.0% 0.0% 0 0 R/C Consumer Products 0.0% 0.0% 0 0
#4 LDPE Plastic Products 0.0% 0.0% 0 0 HAZARDOUS AND SPECIAL WASTES 0.8% 0.4% 487 249
#5 PP Plastic Products 0.0% 0.0% 8 8 Pesticides 0.0% 0.0% 13 20
#6 PS Plastic Products 0.0% 0.0% 23 19 HID/UV/Germicidal Lamps 0.0% 0.0% 0 0
#7 Other/Unknown Plastic Products 1.8% 0.8% 1,069 462 Compact Florescent Lamps 0.0% 0.0% 0 0
PLA Compostable Products 0.0% 0.0% 5 7 Florescent Tubes 0.0% 0.0% 0 0
Plastic Garbage Bags 2.6% 0.5% 1,527 314 Water-based Paint 0.1% 0.1% 58 81
Plastic Non-bag Film Products 0.0% 0.0% 8 13 Solvent-based Adhesives/Glues 0.0% 0.0% 0 0
Bulky Rigid Plastic Products 0.2% 0.2% 112 130 Water-based Adhesives/Glues 0.0% 0.0% 17 19
R/C Plastic Products 1.2% 0.6% 698 348 Oil-based Paint 0.0% 0.0% 0 0
GLASS 2.5% 1.0% 1,471 580 Lacquer/Varnish/Urethane Coatings/Stains 0.0% 0.0% 0 0
Clear Glass Containers 1.2% 0.5% 705 296 Field & Lawn Markings 0.0% 0.0% 0 0
Green Glass Containers 0.1% 0.1% 83 68 Primers/Sealings/Coatings 0.0% 0.1% 23 37
Brown/Other Colored Glass Containers 0.5% 0.4% 309 229 Water Repellents & Waterproofers 0.0% 0.0% 0 0
Plate Glass 0.0% 0.0% 8 13 Solvents 0.0% 0.0% 0 0
Non-glass Ceramics 0.4% 0.4% 220 233 Caustic Cleaners 0.1% 0.1% 39 63
R/C Glass 0.2% 0.2% 146 136 Dry-cell Batteries- Single Use 0.0% 0.0% 28 27
METAL 5.7% 1.3% 3,354 735 Dry-cell Batteries- Rechargeable 0.0% 0.0% 0 0
Aluminum Beverage Cans 0.4% 0.1% 241 69 Wet-cell Batteries 0.0% 0.0% 0 0
Aluminum Foil/Containers 0.5% 0.2% 269 90 Gasoline/Kerosene 0.0% 0.0% 0 0
Other Aluminum 0.0% 0.0% 7 11 Motor Oil 0.0% 0.0% 0 0
Other Non-ferrous Metal 0.2% 0.3% 138 150 Antifreeze 0.0% 0.0% 0 0
Food Cans - Tinned 0.8% 0.2% 494 92 Other Vehicle Fluids 0.0% 0.0% 0 0
Food Cans - Coated 0.1% 0.0% 33 22 Oil Filters 0.0% 0.0% 0 0
White Goods 0.0% 0.0% 0 0 Explosives 0.0% 0.0% 0 0
Other Ferrous Metal 1.9% 0.7% 1,127 421 Medical Wastes 0.2% 0.1% 93 45
R/C Metal 1.8% 0.6% 1,045 380 Sharps 0.0% 0.0% 11 17
ORGANICS 36.6% 5.3% 21,481 3,100 Pharmaceuticals & Vitamins 0.1% 0.1% 71 60
Edible Food Waste- Vegetative 9.2% 1.7% 5,414 999 Other Cleaners/Chemicals 0.0% 0.1% 26 42
Inedible Food Waste- Vegetative 8.9% 1.8% 5,227 1,051 Personal Care Products 0.1% 0.0% 40 26
Edible Food Waste- Meats/Fats/Oils 2.7% 0.9% 1,582 509 Other Potentially Hazardous Wastes 0.1% 0.2% 69 101
Inedible Food Waste- Meats/Fats/Oils 0.6% 0.2% 363 116 RESIDUALS 8.5% 1.6% 5,010 958
Yard/Garden Waste- Leaves and Grass 3.9% 2.2% 2,264 1,278 Disposable Diapers 6.8% 1.6% 3,969 918
Yard/Garden Waste- Prunings 0.8% 0.8% 464 470 Ash 0.0% 0.0% 0 0
Animal Manure 10.2% 4.3% 6,005 2,494 Dust 0.0% 0.0% 21 24
Animal Carcasses & Offal 0.0% 0.0% 0 0 Fines/Sorting Residues 1.7% 0.6% 1,020 327
Food Processing Wastes 0.0% 0.0% 0 0 Sludges & Other Special Industrial Wastes 0.0% 0.0% 0 0
R/C Organics 0.3% 0.1% 162 46
Estimated Origin Specified Disposed Tons 100% 58,613
Sample Count 24Confidence intervals calculated at the 90% confidence level. Percentages for material types may not
total 100% due to rounding.

2020-2021 Washington Statewide Waste Characterization Study
Draft Report
June 2021 | 98
Table 47: West WGA Self-hauled Disposed Waste Sector, Detailed Composition, 2020-2021
Material
Est.
Percent + / - Est. Tons Tons + / - Material
Est.
Percent + / - Est. Tons Tons + / -
PAPER 6.5% 2.5% 2,648 994 WOOD DEBRIS 34.8% 9.3% 14,107 3,758
PAPER PACKAGING 4.4% 2.2% 1,786 897 Natural Wood 0.2% 0.4% 96 152
Newspaper Packaging 0.0% 0.0% 0 0 Treated Wood 5.3% 4.4% 2,151 1,802
Cardboard & Kraft Packaging 3.3% 2.2% 1,336 875 Painted Wood 12.7% 5.9% 5,149 2,388
Mixed/Low-grade Paper Packaging 0.4% 0.2% 143 84 Dimensional Lumber 6.5% 2.5% 2,651 1,024
Aseptic Containers 0.0% 0.0% 1 2 Engineered Wood 2.9% 1.7% 1,175 704
Gable Top Containers 0.1% 0.0% 24 18 Pallets & Crates 2.5% 3.6% 1,024 1,449
Other Polycoated Packaging 0.0% 0.1% 15 22 Other Untreated Wood 0.0% 0.0% 7 11
Compostable Paper Packaging 0.3% 0.2% 135 84 Wood By-products 1.7% 1.9% 700 771
R/C Paper Packaging 0.3% 0.2% 130 80 R/C Wood Debris 2.9% 1.8% 1,156 737
PAPER PRODUCTS 2.1% 0.8% 862 304 CONSTRUCTION MATERIALS 19.4% 8.2% 7,850 3,302
Newspaper Products 0.1% 0.0% 24 16 Plastic Lumber 0.0% 0.0% 0 0
Cardboard & Kraft Paper Products 0.0% 0.0% 0 0 Insulation 0.2% 0.3% 101 138
Magazines 0.1% 0.1% 22 32 Asphalt Paving 0.0% 0.0% 0 0
High-Grade Paper Products 0.0% 0.0% 8 10 Concrete 2.3% 2.4% 945 978
Other Groundwood Paper Products 0.0% 0.0% 0 0 Drywall 3.4% 5.4% 1,394 2,191
Mixed/Low-grade Paper Products 0.3% 0.2% 133 71 Carpet 3.3% 2.9% 1,332 1,156
Compostable Paper Products 0.9% 0.5% 371 188 Carpet Padding 0.0% 0.0% 0 0
R/C Paper Products 0.8% 0.5% 305 189 Soil, Rocks, & Sand 0.5% 0.4% 214 165
PLASTIC 9.5% 4.1% 3,837 1,672 Asphalt Roofing 4.7% 5.4% 1,917 2,184
PLASTIC PACKAGING 2.8% 1.2% 1,132 498 Plastic Floor Covering 0.7% 1.2% 294 475
#1 PETE Plastic Bottles 0.2% 0.1% 64 38 Ceramics & Brick 3.5% 2.6% 1,417 1,060
#1 PETE Plastic Non-bottles 0.2% 0.1% 67 32 R/C Construction Materials 0.6% 0.5% 236 199
#2 HDPE Plastic Natural Bottles 0.3% 0.4% 118 166 CONSUMER PRODUCTS 12.4% 5.1% 5,011 2,057
#2 HDPE Plastic Jars and Tubs 0.2% 0.1% 74 49 Televisions - LCD 0.0% 0.0% 0 0
#2 HDPE Plastic Colored Bottles 0.1% 0.0% 29 16 Televisions - CRT 0.0% 0.0% 0 0
#3 PVC Plastic Packaging 0.0% 0.0% 0 0 Television Peripherals 0.0% 0.0% 0 0
#4 LDPE Plastic Packaging 0.0% 0.0% 0 0 Computer Monitors - CRT 0.0% 0.0% 0 0
#5 PP Plastic Packaging 0.2% 0.1% 91 51 Computer Monitors - LCD 0.0% 0.0% 0 0
#6 PS Plastic Packaging 0.0% 0.0% 6 4 Computers 0.0% 0.0% 0 0
#7 Other/Unknown Plastic Packaging 0.1% 0.0% 40 19 Computer Peripherals 0.0% 0.0% 11 18
Expanded Polystyrene Packaging 0.5% 0.3% 205 107 Computer Printers 0.0% 0.0% 0 0
PLA Compostable Packaging 0.0% 0.0% 0 0 Audio Equipment 0.0% 0.0% 0 0
Plastic Merchandise Bags 0.1% 0.1% 50 32 Electronic Gaming Equipment 0.0% 0.0% 0 0
Packaging Film Plastic 0.8% 0.5% 331 188 Other Consumer Electronics 0.6% 0.6% 253 245
Transportation Packaging Film Plastic 0.1% 0.1% 41 37 Textiles- Organic 2.7% 1.6% 1,099 642
Flexible Plastic Packaging 0.0% 0.0% 15 8 Textiles- Synthetic/Mixed/Unknown 2.0% 1.1% 806 429
R/C Plastic Packaging 0.0% 0.0% 0 0 Shoes/Purses/Belts 0.2% 0.2% 85 79
PLASTIC PRODUCTS 6.7% 4.0% 2,705 1,637 Tires & Other Rubber 0.2% 0.4% 100 147
#1 PETE Plastic Products 0.0% 0.0% 2 2 Furniture 4.6% 4.7% 1,883 1,885
#2 HDPE Plastic Products: 0.0% 0.0% 0 0 Mattresses 1.9% 2.2% 774 883
#3 PVC Plastic Products 0.1% 0.1% 27 44 R/C Consumer Products 0.0% 0.0% 0 0
#4 LDPE Plastic Products 0.0% 0.0% 0 0 HAZARDOUS AND SPECIAL WASTES 0.4% 0.4% 159 162
#5 PP Plastic Products 0.0% 0.0% 2 2 Pesticides 0.0% 0.0% 0 0
#6 PS Plastic Products 0.0% 0.0% 2 2 HID/UV/Germicidal Lamps 0.0% 0.0% 2 4
#7 Other/Unknown Plastic Products 0.5% 0.2% 183 80 Compact Florescent Lamps 0.0% 0.0% 7 7
PLA Compostable Products 0.0% 0.0% 0 0 Florescent Tubes 0.0% 0.0% 0 0
Plastic Garbage Bags 0.5% 0.3% 189 113 Water-based Paint 0.1% 0.2% 49 65
Plastic Non-bag Film Products 2.9% 4.1% 1,183 1,665 Solvent-based Adhesives/Glues 0.0% 0.0% 0 0
Bulky Rigid Plastic Products 1.5% 0.8% 595 314 Water-based Adhesives/Glues 0.0% 0.0% 0 0
R/C Plastic Products 1.3% 0.8% 523 325 Oil-based Paint 0.0% 0.0% 0 0
GLASS 1.0% 0.6% 386 243 Lacquer/Varnish/Urethane Coatings/Stains 0.0% 0.0% 0 0
Clear Glass Containers 0.4% 0.2% 153 97 Field & Lawn Markings 0.0% 0.0% 0 0
Green Glass Containers 0.0% 0.0% 0 0 Primers/Sealings/Coatings 0.0% 0.0% 0 0
Brown/Other Colored Glass Containers 0.1% 0.1% 30 21 Water Repellents & Waterproofers 0.0% 0.0% 0 0
Plate Glass 0.2% 0.3% 67 102 Solvents 0.0% 0.0% 0 0
Non-glass Ceramics 0.2% 0.3% 100 135 Caustic Cleaners 0.0% 0.0% 0 0
R/C Glass 0.1% 0.1% 37 27 Dry-cell Batteries- Single Use 0.0% 0.0% 4 5
METAL 9.7% 5.5% 3,945 2,222 Dry-cell Batteries- Rechargeable 0.0% 0.0% 0 0
Aluminum Beverage Cans 0.1% 0.1% 60 48 Wet-cell Batteries 0.0% 0.0% 0 0
Aluminum Foil/Containers 0.1% 0.0% 26 19 Gasoline/Kerosene 0.0% 0.0% 0 0
Other Aluminum 0.1% 0.1% 32 35 Motor Oil 0.0% 0.0% 0 0
Other Non-ferrous Metal 0.3% 0.3% 111 108 Antifreeze 0.0% 0.0% 0 0
Food Cans - Tinned 0.2% 0.1% 76 53 Other Vehicle Fluids 0.0% 0.0% 0 0
Food Cans - Coated 0.0% 0.0% 0 0 Oil Filters 0.0% 0.0% 0 0
White Goods 1.6% 2.0% 648 801 Explosives 0.0% 0.0% 0 0
Other Ferrous Metal 2.9% 1.7% 1,191 681 Medical Wastes 0.0% 0.0% 13 10
R/C Metal 4.4% 4.9% 1,800 1,992 Sharps 0.0% 0.0% 0 0
ORGANICS 5.0% 2.7% 2,036 1,102 Pharmaceuticals & Vitamins 0.0% 0.0% 1 1
Edible Food Waste- Vegetative 2.5% 2.0% 1,018 824 Other Cleaners/Chemicals 0.0% 0.0% 0 0
Inedible Food Waste- Vegetative 1.0% 0.7% 396 272 Personal Care Products 0.2% 0.2% 62 99
Edible Food Waste- Meats/Fats/Oils 0.4% 0.3% 151 113 Other Potentially Hazardous Wastes 0.1% 0.0% 21 16
Inedible Food Waste- Meats/Fats/Oils 0.1% 0.1% 34 37 RESIDUALS 1.3% 1.0% 526 420
Yard/Garden Waste- Leaves and Grass 0.4% 0.5% 155 199 Disposable Diapers 1.1% 1.0% 432 394
Yard/Garden Waste- Prunings 0.3% 0.3% 131 142 Ash 0.0% 0.0% 0 0
Animal Manure 0.3% 0.3% 118 116 Dust 0.0% 0.0% 0 0
Animal Carcasses & Offal 0.0% 0.0% 0 0 Fines/Sorting Residues 0.2% 0.1% 95 52
Food Processing Wastes 0.0% 0.0% 0 0 Sludges & Other Special Industrial Wastes 0.0% 0.0% 0 0
R/C Organics 0.1% 0.1% 34 23
Estimated Origin Specified Disposed Tons 100% 40,505
Sample Count 32Confidence intervals calculated at the 90% confidence level. Percentages for material types may not
total 100% due to rounding.

2020-2021 Washington Statewide Waste Characterization Study
Final Report
August 2021 | 99
Appendix D: Supplemental Composition Results
This section presents waste composition results for the supplemental statewide analysis. The supplemental
analysis generated statewide findings that incorporated recent studies conducted by Pierce County, King
County, and the Cities of Bellingham and Seattle with data collected in the 2020-2021 statewide study.
Statewide data are presented for the state overall and for each waste sector (commercial, residential, and
self-hauled) in three ways:
1. A bar chart presents an overview of waste composition by material class.
2. A table shows the ten most prevalent material types, by weight.
3. A detailed table lists the full composition and quantity results for the 19 material types. Because each
study used a different list of material types for sorting—and none of the four used the same list as the
2020-2021 statewide study—the list of 143 original material types was merged into a list of 19 materials
compatible with all studies.
The supplemental analysis combines data from the following studies with the 2020-2021 statewide study:
2019 King County Waste Characterization Study (excludes Seattle)
2020-2021 City of Seattle Waste Characterization Study
2020 City of Bellingham Waste Characterization Study
2015-2016 Pierce County Waste Characterization Study (excludes Tacoma)
To combine the existing composition data from the studies listed above with data collected in the statewide
sampled counties, Cascadia merged, or “rolled-up,” five different material lists. Each study originally used a
unique list of materials and grouped individual materials differently, so many materials had to be merged
into broader categories.
The first column of Table 5 shows merged material types. The remaining columns show the relationships
between the material list used in the supplemental analysis list (19 material types total), the material lists
used in the statewide study (143 materials), and the material lists used in the supplemental studies.
For example, the level of detail for the food waste material types—five material types in the statewide and
Pierce County studies, four in the City of Seattle study, seven in the King County study, and a single category
for the City of Bellingham—found in the five studies vary enough that the detailed material types had to be
merged until a comparison between studies was possible. In this example, the only level of detail contained
in all five studies was food waste.

2020-2021 Washington Statewide Waste Characterization Study
Draft Report
October 2016 | 100
Table 48: Supplemental Statewide Results - Five-study Material Type Translation
Supplemental Analysis
(rolled-up)Statewide Study 2020-2021 City of Bellingham 2019 Pierce County 2015-2016 City of Seattle 2020-2021 King County 2020
Paper
1 NewspaperNewspaper Packaging Newspaper Newspaper Newspaper
Old Newspaper
(ONP)
Newspaper Products
2Cardboard and Mixed
Recyclable Paper
Cardboard
Packaging
and Kraft Cardboard Cardboard & Kraft Paper Pla in OCC/Kraft Paper
Low-Grade
Recyclable Paper
Cardboard
Products
and Kraft Paper Recyclable Paper Mixed Recyclable Paper High-Grade Paper
Mixed/Low-grade
Packaging
Paper Paperboard Grocery/Shopping Bags
Pla in Corrugated
Cardboard
(OCC/Kraft Bags)
High-grade Paper Products Magazine/Catalogs Paper Packaging
Mixed/Low-grade
Products
Paper Cartons & Coated
PaperboardPaper Products
MagazinesOther
Contai
Polycoated
ners
Other Groundwood Paper
Products
Other Polycoated Packaging
3Compostable Food-
Soiled Paper Products
Compostable
Packaging
Paper Compostable
Products
Food-Soi led Contaminated Paper Waxed OCC
Waxed Corrugated
Cardboard
Compostable
Products
Paper Compostable/Soi led
Paper Products
Other
Paper
Compostable
Compostable Single-Use Single-use Food
Food Service Paper Service
Packaging Compostable Paper
4 Other Paper
Gable Top Containers Non-Recyclable Paper Other
Paper
Non-Recyclable Shredded Paper Other Paper
Aseptic Containers Aseptic Packages Mixed/Other Paper
R/C Paper Products
Non-Compostable Single-
Use Food Service Paper
Packaging
R/C Paper Packaging Aseptic Containers
Gable Top Containers

2020-2021 Washington Statewide Waste Characterization Study
Draft Report
October 2016 | 101
Supplemental Analysis
(rolled-up)Statewide Study 2020-2021 City of Bellingham 2019 Pierce County 2015-2016 City of Seattle 2020-2021 King County 2020
#1 PETE Plastic BottlesRecyclable Plastic
Containers Pop & Water Bottles #1 PET Bottles and Jars PET Bottles
#2 HDPE Plastic Colored
BottlesBulky and Rigid Plastic Al l Other Bottles & Jugs
#2 HDPE Natura l Bottles
and Jars
Other PET
Containers
#2 HDPE Plastic Natura l
Bottles
Compatible Plastic
Containers
#2 HDPE Colored Bottles
and JarsHDPE Bottles
#1 PETE Plastic non-bottles #5 PP Bottles and JarsOther HDPE
Containers
#2 HDPE Plastic Jars and
Tubs
Other Plastic Bottles and
Jars#3 Packaging*
#3 PVC Plastic Packaging#1 PET Non-Bottle
Packaging#4 Packaging*
#4 LDPE Plastic Packaging#2 HDPE Non-Bottle
Packaging#5 Packaging*
#5 PP Plastic Packaging #5 Non-Bottle Packaging Other #6 Packaging*
#6 PS Plastic PackagingLarge Durable Plastic
Products (>2 ga l lons)
Other Non-
Compostable/Non-
PLA #7 Packaging*
#7 Other/Unknown Plastic
Packaging
Non-Compostable Single-
Use Food Service Plastic
Packaging
Other Plastic
Packaging
Bulky Rigid Plastic ProductsOther Non-Bottle
Packaging
Plastic Garbage Bags Fi lm Plastic Plastic Shopping Bags Garbage BagsRecyclable Plastic
Bags
Plastic Merchandise Bags Plastic Fi lm Other Fi lm
Non-industria l
Packaging Fi lm
Plastic
Plastic Non-bag Fi lm
ProductsStretch Wrap
Industria l Packaging
Fi lm Plastic
Flexible Plastic PackagingOther Clean Polyethylene
Fi lm
Plastic Garbage
Bags
Packaging Fi lm Plastic Takeout and Retai l Bags Plastic Fi lm Products
Transportation Packaging
Fi lm PlasticPlastic Pouches
Compostable Plastic Bags
6
Plastic
Plastics Containers &
Other Non-film
Recyclable Plastic
Film Plastic
5

2020-2021 Washington Statewide Waste Characterization Study
Draft Report
October 2016 | 102
Supplemental Analysis
(rolled-up)Statewide Study 2020-2021 City of Bellingham 2019 Pierce County 2015-2016 City of Seattle 2020-2021 King County 2020
#1 PETE Plastic Products Non-Recyclable Plastic Styrofoam Plastic Mai lersCompostable
Plastics
#2 HDPE Plastic Products Non-Compatible Plastics Plastic/Other Materia ls
Expanded
Polystyrene Single
Serve Food
Packaging
#3 PVC Plastic Products
Compostable Single-Use
Food Service Plastic
Utens i l s
Other Expanded
Polystyrene
Packaging
#4 LDPE Plastic Products
Compostable Single-Use
Food Service Plastic
Packaging
Expanded
Polystyrene Products
#5 PP Plastic Products
Non-Compostable Single-
Use Food Service Plastic
Utens i l s
Single Res in Plastic
Products
#6 PS Plastic ProductsSmal l Durable Plastic
Products (<2 ga l lons , >2”)
Mixed Res in Plastic
Products
#7 Other/Unknown Plastic
Products
Expanded Polystyrene
Food-Grade
Plastic and Other
Materia ls
R/C Plastic PackagingExpanded Polystyrene Non-
Food Grade
R/C Plastic ProductsRigid Polystyrene Foam
Insulation
Expanded Polystyrene
Packaging
PLA Compostable Products
PLA Compostable Packaging
Clear Glass Containers Recyclable Glass Clear Glass Containers Clear Beverage GlassClear Glass
Containers
Green Glass Containers Brown Glass Containers Green Beverage GlassGreen Glass
Containers
Brown/Other Colored Glass
ContainersGreen Glass Containers Brown Beverage Glass
Brown Glass
Containers
Container Glass
Glass Containers
Other Plastic
Plastic
Glass
7
8

2020-2021 Washington Statewide Waste Characterization Study
Draft Report
October 2016 | 103
Supplemental Analysis
(rolled-up)Statewide Study 2020-2021 City of Bellingham 2019 Pierce County 2015-2016 City of Seattle 2020-2021 King County 2020
Plate Glass Non-Recyclable Glass Other Glass Other Glass Other Glass
R/C GlassFluorescent Light Tubes &
CompactsMixed Cul let
Ki tchenware/Cerami
cs
Compact Florescent Lamps CeramicsCompact
Fluorescent Bulbs
Florescent Tubes
Fluorescent Tubes and
Compact Fluorescent
Lights (CFL)
Other Fluorescent
Bulbs and Tubes
Non-glass Ceramics
Aluminum Beverage Cans Recyclable Metal Steel Food and Beverage
CansAluminum Cans Aluminum Cans
Food Cans - Coated Scrap Metal Aluminum Cans Steel Food Cans Tinned Food Cans
Food Cans - Tinned Aerosol Cans Empty Aerosol Cans Other Aluminum
Other Ferrous Metal Other Ferrous MetalsAluminum
Foi l/Conta inersOther Ferrous
Other Non-ferrous MetalOther Non-Ferrous
MetalsOther Ferrous Other Non-Ferrous
Aluminum Foi l/Conta iners Other Aluminum Mixed Metals
Other Aluminum Other Nonferrous
Food Process ing Wastes Food Scraps
Food Waste:
Edible/Program
Compatible
Edible Food Scraps –
Packaged
Fruits and
Vegetables , Edible*
Edible Food Waste -
Meats/Fats/Oi ls
Food Waste: Edible/Non-
Compatible
Edible Food Scraps – Non-
Packaged
Fruits and
Vegetables , Non-
edible*
Edible Food Waste -
Vegetative
Food Waste:
Inedible/CompatibleNon-Edible Food Scraps
Homegrown Frui ts
and Vegetables*
Inedible Food Waste -
Meats/Fats/Oi ls
Food Waste:
Inedible/Non-
Compatible
Fats , Oi ls , and Grease Meat, Edible*
Inedible Food Waste -
VegetativeK-Cups Meat, Non-edible*
Mixed/Other Food
Waste, Edible*
Mixed/Other Food
Waste, Non-edible*
Metal
Other Glass
Metal
Glass
9
10
11 Food Waste
Organics

2020-2021 Washington Statewide Waste Characterization Study
Draft Report
October 2016 | 104
Supplemental Analysis
(rolled-up)Statewide Study 2020-2021 City of Bellingham 2019 Pierce County 2015-2016 City of Seattle 2020-2021 King County 2020
Yard/Garden Waste -
Leaves and GrassYard Debris Yard Waste Leaves and Grass Stumps
Yard/Garden Waste -
PruningsLand Clearing Debris Prunings Large Prunings
Natura l Wood Yard Wastes
R/C Wood DebrisConstruction and
Demol i tion Debris Gypsum Wal lboard Pal lets and Crates Carpet Padding
Wood By-products Concrete Other Untreated Wood
Dimens ional
Lumber/Engineered
Wood
Dimens ional Lumber Insulation New Painted Wood Treated Wood
Engineered Wood Carpet Old Painted Wood Contaminated Wood
Other Untreated Wood Untreated Lumber Creosote-Treated WoodRoofing and Siding
Wood
Pal lets and Crates Treated Wood Waste Other Treated Wood Carpet
Painted Wood Asphalt Roofing Contaminated Wood Gypsum Wal lboard
Treated Wood Pal lets New Gypsum Scrap
Construction/Demol
i tion Waste (except
wood)
Asphalt Roofing Other Construction Debris Demo Gypsum Scrap Asphalt Shingles
Drywal l Asphalt Carpet
Carpet Felt Carpet Pad
Carpet Padding Fiberglass Insulation
Asphalt PavingRock, Concrete, Brick, And
Other Aggregates
Ceramics and Brick Asphaltic Roofing
Concrete Other Construction Debris
Insulation Clean Dimens ion Lumber
Plastic Floor Covering Clean Engineered Wood
Plastic Lumber
R/C Construction Materia ls
12 Yard Waste
Construction Materials
Organics
Construction Materials
13

2020-2021 Washington Statewide Waste Characterization Study
Draft Report
October 2016 | 105
Supplemental Analysis
(rolled-up)Statewide Study 2020-2021 City of Bellingham 2019 Pierce County 2015-2016 City of Seattle 2020-2021 King County 2020
Televis ion Periphera lsElectronics and Smal l
Appl iances E-Cycle Products Smal l Appl iances
Smal l Household
Appl iances
Televis ions - CRT Al l Other E-WasteElectronics accepted
through E-Cycle WA
Audio/Visual
Equipment
Televis ions - LCD Smal l Appl iancesElectronics not accepted
through E-Cycle WA
Printers/Copiers/Fax
Machines
Audio EquipmentCentra l Process ing
Units (CPUs)
Computer Monitors - CRTComputer
Periphera ls
Computer Monitors - LCD
CRT Computer
Monitors and
Televis ions
Computer Periphera ls
Other Computer
Monitors and
Televis ions
Computer Printers Laptops
Computers Cel l Phones
Electronic Gaming
EquipmentTablets
Other Consumer Electronics Other Electronics
15 Diapers Disposable Diapers Diapers Diapers Disposable Diapers Disposable Diapers
Shoes , Purses , and Belts Texti les and Shoes Texti les and Leather Texti lesTexti les : Clothes &
Other Recyclables
Texti les - Organic Mixed Texti les Other Texti les
Texti les - Synthetic, Mixed,
or Unknown
17 Vehicle Batteries Wet-cel l Batteries Lead Batteries Car Batteries Wet-Cel l Batteries Vehicle Batteries
E-Waste
Textiles and Shoes
Consumer Products
14
16

2020-2021 Washington Statewide Waste Characterization Study
Draft Report
October 2016 | 106
Supplemental Analysis
(rolled-up)Statewide Study 2020-2021 City of Bellingham 2019 Pierce County 2015-2016 City of Seattle 2020-2021 King County 2020
Motor Oi l Used Motor Oi l Pa ints/Adhes ives Liquid Latex Pa ints Used Oi l
Gasol ine/KeroseneOther Hazardous / Specia l
Waste Cleaners
Oi l -Based Paints Accepted
by Pa intCareLatex Pa int
Anti freeze Pesticides/Herbicides Medica l Wastes Oi l -Based Paint
Oi l Fi l tersVehicle & Equipment
Fluids
Non-Caustic
Cleaners/Chemica ls
Solvents and
Thinners
Oi l -based Paint Gasol inePharmaceutica ls and
MedicationsAdhes ives and Glue
Solvents Explos ivesVitamins and
Supplements
Cleaners and
Corros ives
Solvent-based
Adhes ives/GluesMedica l Waste
Other Potentia l ly Harmful
Wastes
Pesticides and
Herbicides
Water-based
Adhes ives/GluesMedicine Oi l Fi l ters
Gasol ine and Fuel
Oi l
Pesticides Other Hazardous Wastes LED LightingAnti freeze/Brake
Fluid
Caustic Cleaners Animal By-Products Medica l Waste
Other Cleaners/Chemica ls Personal Care/CosmeticsPharmaceutica ls
and Vitamins
Explos ivesOther Hazardous
Waste
HID, UV, and Germicida l
LampsAnimal Carcasses
Lacquer, Varnish, Urethane
Coatings , and Sta ins
Other Potentia l ly
Hazardous Wastes
Other Vehicle Fluids
Personal Care Products
Primers , Sea l ings , and
Coatings
Water-based Paint
Water Repel lents and
Waterproofers
Medica l Wastes
Pharmaceutica ls and
Vitamins
Sharps
Sludges and Other Specia l
Industria l Wastes
Animal Carcasses and Offa l
18Other Hazardous /
Special Waste
Other Materials

2020-2021 Washington Statewide Waste Characterization Study
Draft Report
October 2016 | 107
Supplemental Analysis
(rolled-up)Statewide Study 2020-2021 City of Bellingham 2019 Pierce County 2015-2016 City of Seattle 2020-2021 King County 2020
Dry-cel l Batteries -
RechargeableRechargeable Batteries Alka l ine Batteries Other Dry-Cel l Batteries Animal Feces
Dry-cel l Batteries - Single
UseOther Materia l Other Batteries Rechargeable Batteries Other Mixed Metals
Animal Manure Non-Recyclable Metal Al l Other Waste Mixed Metals/Materia lsCompressed Gas
Cyl inders
R/C Metal Cords and Hol iday Lights Other Organic WastePersonal Protective
Equipment (PPE)
Other
Compostables*
Field and Lawn Markings Large Appl iancesOther Compostable
Organics
Household
Batteries
White Goods Tires Rubber ProductsFoam Rubber and
Padding
Tires Other Rubber Mattresses/Box Springs Tires Other Wood
Furniture Furniture/Bulky Furniture Furniture
Mattresses
Liquids : Any l iquid that
cannot be identi fied by
the container
Mattresses Mattresses
Ash Fines Sand/Soi l/DirtMiscel laneous
Organics
Dust Nondistinct Fines Rubber Products
Fines/Sorting Res idues Miscel laneous Organics Tires
Soi l , Rocks , and Sand Miscel laneous InorganicsMiscel laneous
Inorganics
R/C Consumer Products Ash
R/C Organics Non-dis tinct Fines
Other Material19
Other Materials

2020-2021 Washington Statewide Waste Characterization Study
Final Report
August 2021 | 108
Supplemental Statewide Results—Overall Disposed Waste Stream
This section characterizes the overall disposed MSW stream for the entire state of Washington by combining
all three of the sectors, all six WGAs considered in this study, and supplemental data from four other city and
county studies. Characterization results are presented for the 19 material types that resulted from the
process of combining material lists from these five analyses.
OVERVIEW BY MATERIAL CLASS
Composition estimates by material class for the overall statewide disposed waste stream are illustrated in
Figure 28. The largest material classes in the overall waste stream are Paper (18.8%), Other Materials
(18.8%), and Construction Materials (18.5%) which together account for over one half (56.1%) of the waste
stream by weight, followed by Organics (16.9%) and Plastic (14.8%).
Figure 28: Supplemental Statewide Results—Overall Statewide Disposed Waste Stream, Composition by Material Class, 2020-2021
TEN MOST PREVALENT MATERIALS
When combined, the ten most prevalent material types in the overall waste stream account for most of the
waste stream (84.6%), as shown in Table 49. Construction and demolition debris (18.5%), food waste (13.1%),
and other material (13.0%) are the most prevalent material types, together accounting for nearly half of the
overall waste stream.

2020-2021 Washington Statewide Waste Characterization Study
Final Report
August 2021 | 109
Table 49: Supplemental Statewide Results—Overall Statewide Disposed Waste Stream, Ten Most Prevalent Material Types, 2020-2021
DETAILED COMPOSITION
The composition percentages by weight, based on the supplemental analysis, for each material type in
Washington’s overall disposed waste stream are listed in Table 50.
Material Est. Percent Est. Tons
Construction and Demolition Debris 18.5% 975,406
Food Waste 13.1% 693,080
Other Material 13.0% 683,408
Cardboard & Mixed Recyclable Paper 10.3% 542,122
Film Plastic 6.2% 326,578
Compostable Food-Soiled Paper Products 6.1% 321,612
Plastic Containers & Other Non-fi lm Recyclable Plastic 4.6% 240,981
Textiles and Shoes 4.5% 237,567
Metal 4.3% 226,933
Other Plastic 4.1% 215,516
Total for Top Materials 84.6% 4,463,203
Percentages for material types may not total 100% due to rounding.

2020-2021 Washington Statewide Waste Characterization Study
Final Report
August 2021 | 110
Table 50: Supplemental Statewide Results—Overall Statewide Disposed Waste Stream, Detailed Composition, 2020-2021
Material Est. Percent + / - Est. Tons Tons + / -
PAPER 18.8% 0.7% 989,908 36,925
Newspaper 0.4% 0.0% 23,340 2,445
Cardboard & Mixed Recyclable Paper 10.3% 0.5% 542,122 26,619
Compostable Food-Soiled Paper Products 6.1% 0.3% 321,612 17,970
Other Paper 1.9% 0.3% 102,834 17,004
PLASTIC 14.8% 0.6% 783,074 31,615
Plastic Containers & Other Non-fi lm Recyclable Plastic 4.6% 0.4% 240,981 19,906
Film Plastic 6.2% 0.3% 326,578 16,881
Other Plastic 4.1% 0.3% 215,516 15,536
GLASS 2.3% 0.2% 122,364 12,669
Glass Containers 1.6% 0.1% 83,996 7,655
Other Glass 0.7% 0.2% 38,368 10,122
METAL 4.3% 0.3% 226,933 17,421
Metal 4.3% 0.3% 226,933 17,421
ORGANICS 16.9% 0.8% 894,081 40,254
Food Waste 13.1% 0.7% 693,080 35,794
Yard Waste 3.8% 0.4% 201,001 21,098
CONSTRUCTION MATERIALS 18.5% 1.3% 975,406 66,871
Construction and Demolition Debris 18.5% 1.3% 975,406 66,871
CONSUMER PRODUCTS 5.5% 0.4% 291,990 20,248
E-Waste 1.0% 0.2% 54,422 12,103
Textiles and Shoes 4.5% 0.3% 237,567 16,237
OTHER MATERIALS 18.8% 1.0% 991,759 50,963
Diapers 3.5% 0.2% 183,667 13,131
Vehicle Batteries 0.0% 0.0% 2,464 1,847
Other Hazardous / Special Waste 2.3% 0.5% 122,220 26,719
Other Material 13.0% 0.8% 683,408 43,142
Estimated Total* 100% 5,275,515
Sample Count 1372* There are 42 tons with an unspecified origin that are not included in the detailed composition estimate calculations. The
actual statewide disposal total is 5,275,558 tons.
Confidence intervals calculated at the 90% confidence level. Percentages for material types may not total 100% due to
rounding.

2020-2021 Washington Statewide Waste Characterization Study
Final Report
August 2021 | 111
Supplemental Statewide Results—Commercial Waste
This section characterizes the MSW disposed by the commercial sector from the entire state of Washington
by combining data from all six WGAs considered in this study and supplemental data from four other city and
county studies. Characterization results are presented for the 19 material types that resulted from the
process of combining material lists from these five studies.
OVERVIEW BY MATERIAL CLASS
Composition estimates by material class for the statewide commercial disposed waste sector are illustrated
in Figure 29. The largest material class in this waste sector is Paper (23.1%), followed by Construction
Materials (19.6%), Plastic (16.8%), and Organics (16.3%).
Figure 29: Supplemental Statewide Results—Statewide Commercial Disposed Waste Sector, Composition by Material Class, 2020-2021

2020-2021 Washington Statewide Waste Characterization Study
Final Report
August 2021 | 112
TEN MOST PREVALENT MATERIALS
The ten most prevalent material types in the commercial waste sector, as shown in Table 51, account for
most (86.9%) of the commercial waste stream by weight. Construction and demolition debris (19.6%), food
waste (14.3%), and cardboard & mixed recyclable paper (12.3%) are the most prevalent material types in the
commercial waste sector.
Table 51: Supplemental Statewide Results—Statewide Commercial Disposed Waste Sector, Ten Most Prevalent Material Types, 2020-2021
DETAILED COMPOSITION
The composition percentages by weight, based on the supplemental analysis, for each material type in
Washington’s commercial disposed waste sector are listed in Table 52.
Material Est. Percent Est. Tons
Construction and Demolition Debris 19.6% 423,250
Food Waste 14.3% 308,725
Cardboard & Mixed Recyclable Paper 12.3% 266,389
Other Material 8.3% 179,983
Compostable Food-Soiled Paper Products 7.6% 164,259
Film Plastic 7.5% 161,791
Plastic Containers & Other Non-fi lm Recyclable Plastic 4.9% 105,815
Other Plastic 4.4% 94,902
Metal 4.4% 94,116
Textiles and Shoes 3.6% 77,582
Total for Top Materials 86.9% 1,876,811
Percentages for material types may not total 100% due to rounding.

2020-2021 Washington Statewide Waste Characterization Study
Final Report
August 2021 | 113
Table 52: Supplemental Statewide Results—Statewide Commercial Disposed Waste Sector, Detailed Composition, 2020-2021
Material Est. Percent + / - Est. Tons Tons + / -
PAPER 23.1% 1.5% 499,851 32,331
Newspaper 0.2% 0.1% 4,299 1,223
Cardboard & Mixed Recyclable Paper 12.3% 1.0% 266,389 22,532
Compostable Food-Soiled Paper Products 7.6% 0.7% 164,259 15,715
Other Paper 3.0% 0.8% 64,904 16,597
PLASTIC 16.8% 1.2% 362,508 25,875
Plastic Containers & Other Non-fi lm Recyclable Plastic 4.9% 0.8% 105,815 16,422
Film Plastic 7.5% 0.7% 161,791 14,582
Other Plastic 4.4% 0.6% 94,902 12,575
GLASS 2.0% 0.5% 42,916 10,235
Glass Containers 1.2% 0.3% 26,515 6,016
Other Glass 0.8% 0.4% 16,401 8,374
METAL 4.4% 0.5% 94,116 11,754
Metal 4.4% 0.5% 94,116 11,754
ORGANICS 16.3% 1.5% 352,620 32,656
Food Waste 14.3% 1.4% 308,725 30,847
Yard Waste 2.0% 0.6% 43,895 12,223
CONSTRUCTION MATERIALS 19.6% 2.4% 423,250 52,113
Construction and Demolition Debris 19.6% 2.4% 423,250 52,113
CONSUMER PRODUCTS 4.1% 0.6% 88,388 13,747
E-Waste 0.5% 0.2% 10,805 4,705
Textiles and Shoes 3.6% 0.6% 77,582 12,310
OTHER MATERIALS 13.7% 1.6% 296,826 35,134
Diapers 2.0% 0.5% 44,249 10,096
Vehicle Batteries 0.0% 0.0% 73 117
Other Hazardous / Special Waste 3.4% 1.2% 72,520 26,140
Other Material 8.3% 1.1% 179,983 22,790
Estimated Total 100% 2,160,474
Sample Count 441Confidence intervals calculated at the 90% confidence level. Percentages for material types may not total 100% due to
rounding.

2020-2021 Washington Statewide Waste Characterization Study
Final Report
August 2021 | 114
Supplemental Statewide Results—Residential Waste
This section characterizes the MSW disposed by the residential sector from the entire state of Washington by
combining data from all six WGAs considered in this study and supplemental data from four other city and
county studies. Characterization results are presented for the 19 material types that resulted from the
process of combining material lists from these five studies.
OVERVIEW BY MATERIAL CLASS
Composition estimates by material class for the statewide residential disposed waste sector are shown in
Figure 30. The largest material class in this waste sector is Organics, which account for approximately one
quarter (23.6%) of the waste sector by weight, followed by Other Materials (21.9%) and Paper (20.3%).
Figure 30: Supplemental Statewide Results—Statewide Residential Disposed Waste Sector, Composition by Material Class, 2020-2021

2020-2021 Washington Statewide Waste Characterization Study
Final Report
August 2021 | 115
TEN MOST PREVALENT MATERIALS
In total, 83.9 percent of residential waste is composed of the ten most prevalent material types shown in
Table 53. Food waste is the most prevalent material type in the residential disposed waste sector, making up
17.6 percent of the waste stream. Other material (12.8%), cardboard & mixed recyclable paper (10.6%), and
compostable food-soiled paper products (7.3%) are the next most prevalent material types.
Table 53: Supplemental Statewide Results—Statewide Residential Disposed Waste Sector, Ten Most Prevalent Material Types, 2020-2021
DETAILED COMPOSITION
The composition percentages by weight, based on the supplemental analysis, for each material type in
Washington’s residential disposed waste sector are listed in Table 54.
Material Est. Percent Est. Tons
Food Waste 17.6% 341,925
Other Material 12.8% 248,455
Cardboard & Mixed Recyclable Paper 10.6% 205,244
Compostable Food-Soiled Paper Products 7.3% 142,650
Diapers 6.9% 134,128
Film Plastic 6.6% 127,954
Textiles and Shoes 6.4% 124,948
Yard Waste 6.0% 115,642
Plastic Containers & Other Non-fi lm Recyclable Plastic 5.4% 104,042
Construction and Demolition Debris 4.4% 85,250
Total for Top Materials 83.9% 1,630,239
Percentages for material types may not total 100% due to rounding.

2020-2021 Washington Statewide Waste Characterization Study
Final Report
August 2021 | 116
Table 54: Supplemental Statewide Results—Statewide Residential Disposed Waste Sector, Detailed Composition, 2020-2021
Material Est. Percent + / - Est. Tons Tons + / -
PAPER 20.3% 0.6% 394,867 12,052
Newspaper 0.9% 0.1% 17,359 1,946
Cardboard & Mixed Recyclable Paper 10.6% 0.4% 205,244 8,297
Compostable Food-Soiled Paper Products 7.3% 0.4% 142,650 7,904
Other Paper 1.5% 0.1% 29,613 2,853
PLASTIC 15.7% 0.6% 305,933 12,565
Plastic Containers & Other Non-fi lm Recyclable Plastic 5.4% 0.5% 104,042 9,690
Film Plastic 6.6% 0.2% 127,954 4,612
Other Plastic 3.8% 0.2% 73,937 4,327
GLASS 3.0% 0.2% 58,397 4,318
Glass Containers 2.6% 0.2% 49,569 3,971
Other Glass 0.5% 0.1% 8,828 1,489
METAL 3.4% 0.3% 65,586 5,766
Metal 3.4% 0.3% 65,586 5,766
ORGANICS 23.6% 0.9% 457,568 16,520
Food Waste 17.6% 0.8% 341,925 14,835
Yard Waste 6.0% 0.5% 115,642 10,639
CONSTRUCTION MATERIALS 4.4% 0.6% 85,250 12,269
Construction and Demolition Debris 4.4% 0.6% 85,250 12,269
CONSUMER PRODUCTS 7.7% 0.6% 149,943 12,085
E-Waste 1.3% 0.5% 24,995 9,894
Textiles and Shoes 6.4% 0.4% 124,948 8,298
OTHER MATERIALS 21.9% 1.0% 425,293 19,455
Diapers 6.9% 0.4% 134,128 8,059
Vehicle Batteries 0.1% 0.1% 1,609 1,674
Other Hazardous / Special Waste 2.1% 0.2% 41,101 4,777
Other Material 12.8% 1.0% 248,455 18,710
Estimated Total 100% 1,942,837
Sample Count 602Confidence intervals calculated at the 90% confidence level. Percentages for material types may not total 100% due to
rounding.

2020-2021 Washington Statewide Waste Characterization Study
Final Report
August 2021 | 117
Supplemental Statewide Results—Self-hauled Waste
This section characterizes the MSW disposed by the self-hauled sector from the entire state of Washington
by combining data from all six WGAs considered in this study and supplemental data from four other city and
county studies. Characterization results are presented for the 19 material types that resulted from the
process of combining material lists from these five studies.
OVERVIEW BY MATERIAL CLASS
Composition estimates by material class for statewide self-hauled disposed waste are illustrated in Figure 31.
The largest material class in this waste sector is Construction Materials, which accounts for nearly 40 percent
of the waste sector by weight, followed by Other Materials (23.0%).
Figure 31: Supplemental Statewide Results—Statewide Self-hauled Disposed Waste Sector, Composition by Material Class, 2020-2021

2020-2021 Washington Statewide Waste Characterization Study
Final Report
August 2021 | 118
TEN MOST PREVALENT MATERIALS
When combined, the ten most prevalent material types in the self-hauled disposed waste sector account for
nearly all (93.3%) of the waste sector, as shown in Table 55. Construction and demolition debris accounts for
over one third of the self-hauled sector (39.8%), followed by other material (21.8%).
Table 55: Supplemental Statewide Results—Statewide Self-hauled Disposed Waste Sector, Ten Most Prevalent Material Types, 2020-2021
DETAILED COMPOSITION
The composition percentages by weight, based on the supplemental analysis, for each material type in
Washington’s self-hauled disposed waste sector are listed in Table 56.
Material Est. Percent Est. Tons
Construction and Demolition Debris 39.8% 466,906
Other Material 21.8% 254,970
Cardboard & Mixed Recyclable Paper 6.0% 70,489
Metal 5.7% 67,231
Other Plastic 4.0% 46,677
Food Waste 3.6% 42,429
Yard Waste 3.5% 41,464
Film Plastic 3.1% 36,832
Textiles and Shoes 3.0% 35,038
Plastic Containers & Other Non-fi lm Recyclable Plastic 2.7% 31,124
Total for Top Materials 93.3% 1,093,160
Percentages for material types may not total 100% due to rounding.

2020-2021 Washington Statewide Waste Characterization Study
Final Report
August 2021 | 119
Table 56: Supplemental Statewide Results—Statewide Self-hauled Disposed Waste Sector, Detailed Composition, 2020-2021
Material Est. Percent + / - Est. Tons Tons + / -
PAPER 8.1% 1.1% 95,191 13,150
Newspaper 0.1% 0.1% 1,681 833
Cardboard & Mixed Recyclable Paper 6.0% 1.0% 70,489 11,491
Compostable Food-Soiled Paper Products 1.3% 0.3% 14,704 3,672
Other Paper 0.7% 0.2% 8,317 2,355
PLASTIC 9.8% 1.1% 114,633 13,118
Plastic Containers & Other Non-fi lm Recyclable Plastic 2.7% 0.5% 31,124 5,717
Film Plastic 3.1% 0.6% 36,832 7,146
Other Plastic 4.0% 0.7% 46,677 8,033
GLASS 1.8% 0.5% 21,051 6,091
Glass Containers 0.7% 0.2% 7,912 2,577
Other Glass 1.1% 0.5% 13,139 5,487
METAL 5.7% 1.0% 67,231 11,493
Metal 5.7% 1.0% 67,231 11,493
ORGANICS 7.2% 1.4% 83,893 16,766
Food Waste 3.6% 0.9% 42,429 10,470
Yard Waste 3.5% 1.2% 41,464 13,511
CONSTRUCTION MATERIALS 39.8% 3.4% 466,906 40,069
Construction and Demolition Debris 39.8% 3.4% 466,906 40,069
CONSUMER PRODUCTS 4.6% 0.7% 53,659 8,659
E-Waste 1.6% 0.4% 18,621 5,145
Textiles and Shoes 3.0% 0.6% 35,038 6,577
OTHER MATERIALS 23.0% 2.7% 269,640 31,374
Diapers 0.5% 0.2% 5,290 2,357
Vehicle Batteries 0.1% 0.1% 782 770
Other Hazardous / Special Waste 0.7% 0.2% 8,599 2,789
Other Material 21.8% 2.7% 254,970 31,492
Estimated Total 100% 1,172,204
Sample Count 329Confidence intervals calculated at the 90% confidence level. Percentages for material types may not total 100% due to
rounding.